Submitted:
12 June 2023
Posted:
13 June 2023
You are already at the latest version
Abstract
Keywords:
1. Introduction
2. Materials and Methods
3. Results
3.1. Microstructure
3.2. Tensile properties
3.3. Impact toughness
4. Discussion
4.1. Primary martensite and retained austenite characteristics
4.2. Relationship between tensile and microstructural properties
4.3. Relationship between Impact toughness and microstructural properties
4.3.1. Ev at 25 °C (Upper shelf Ev)
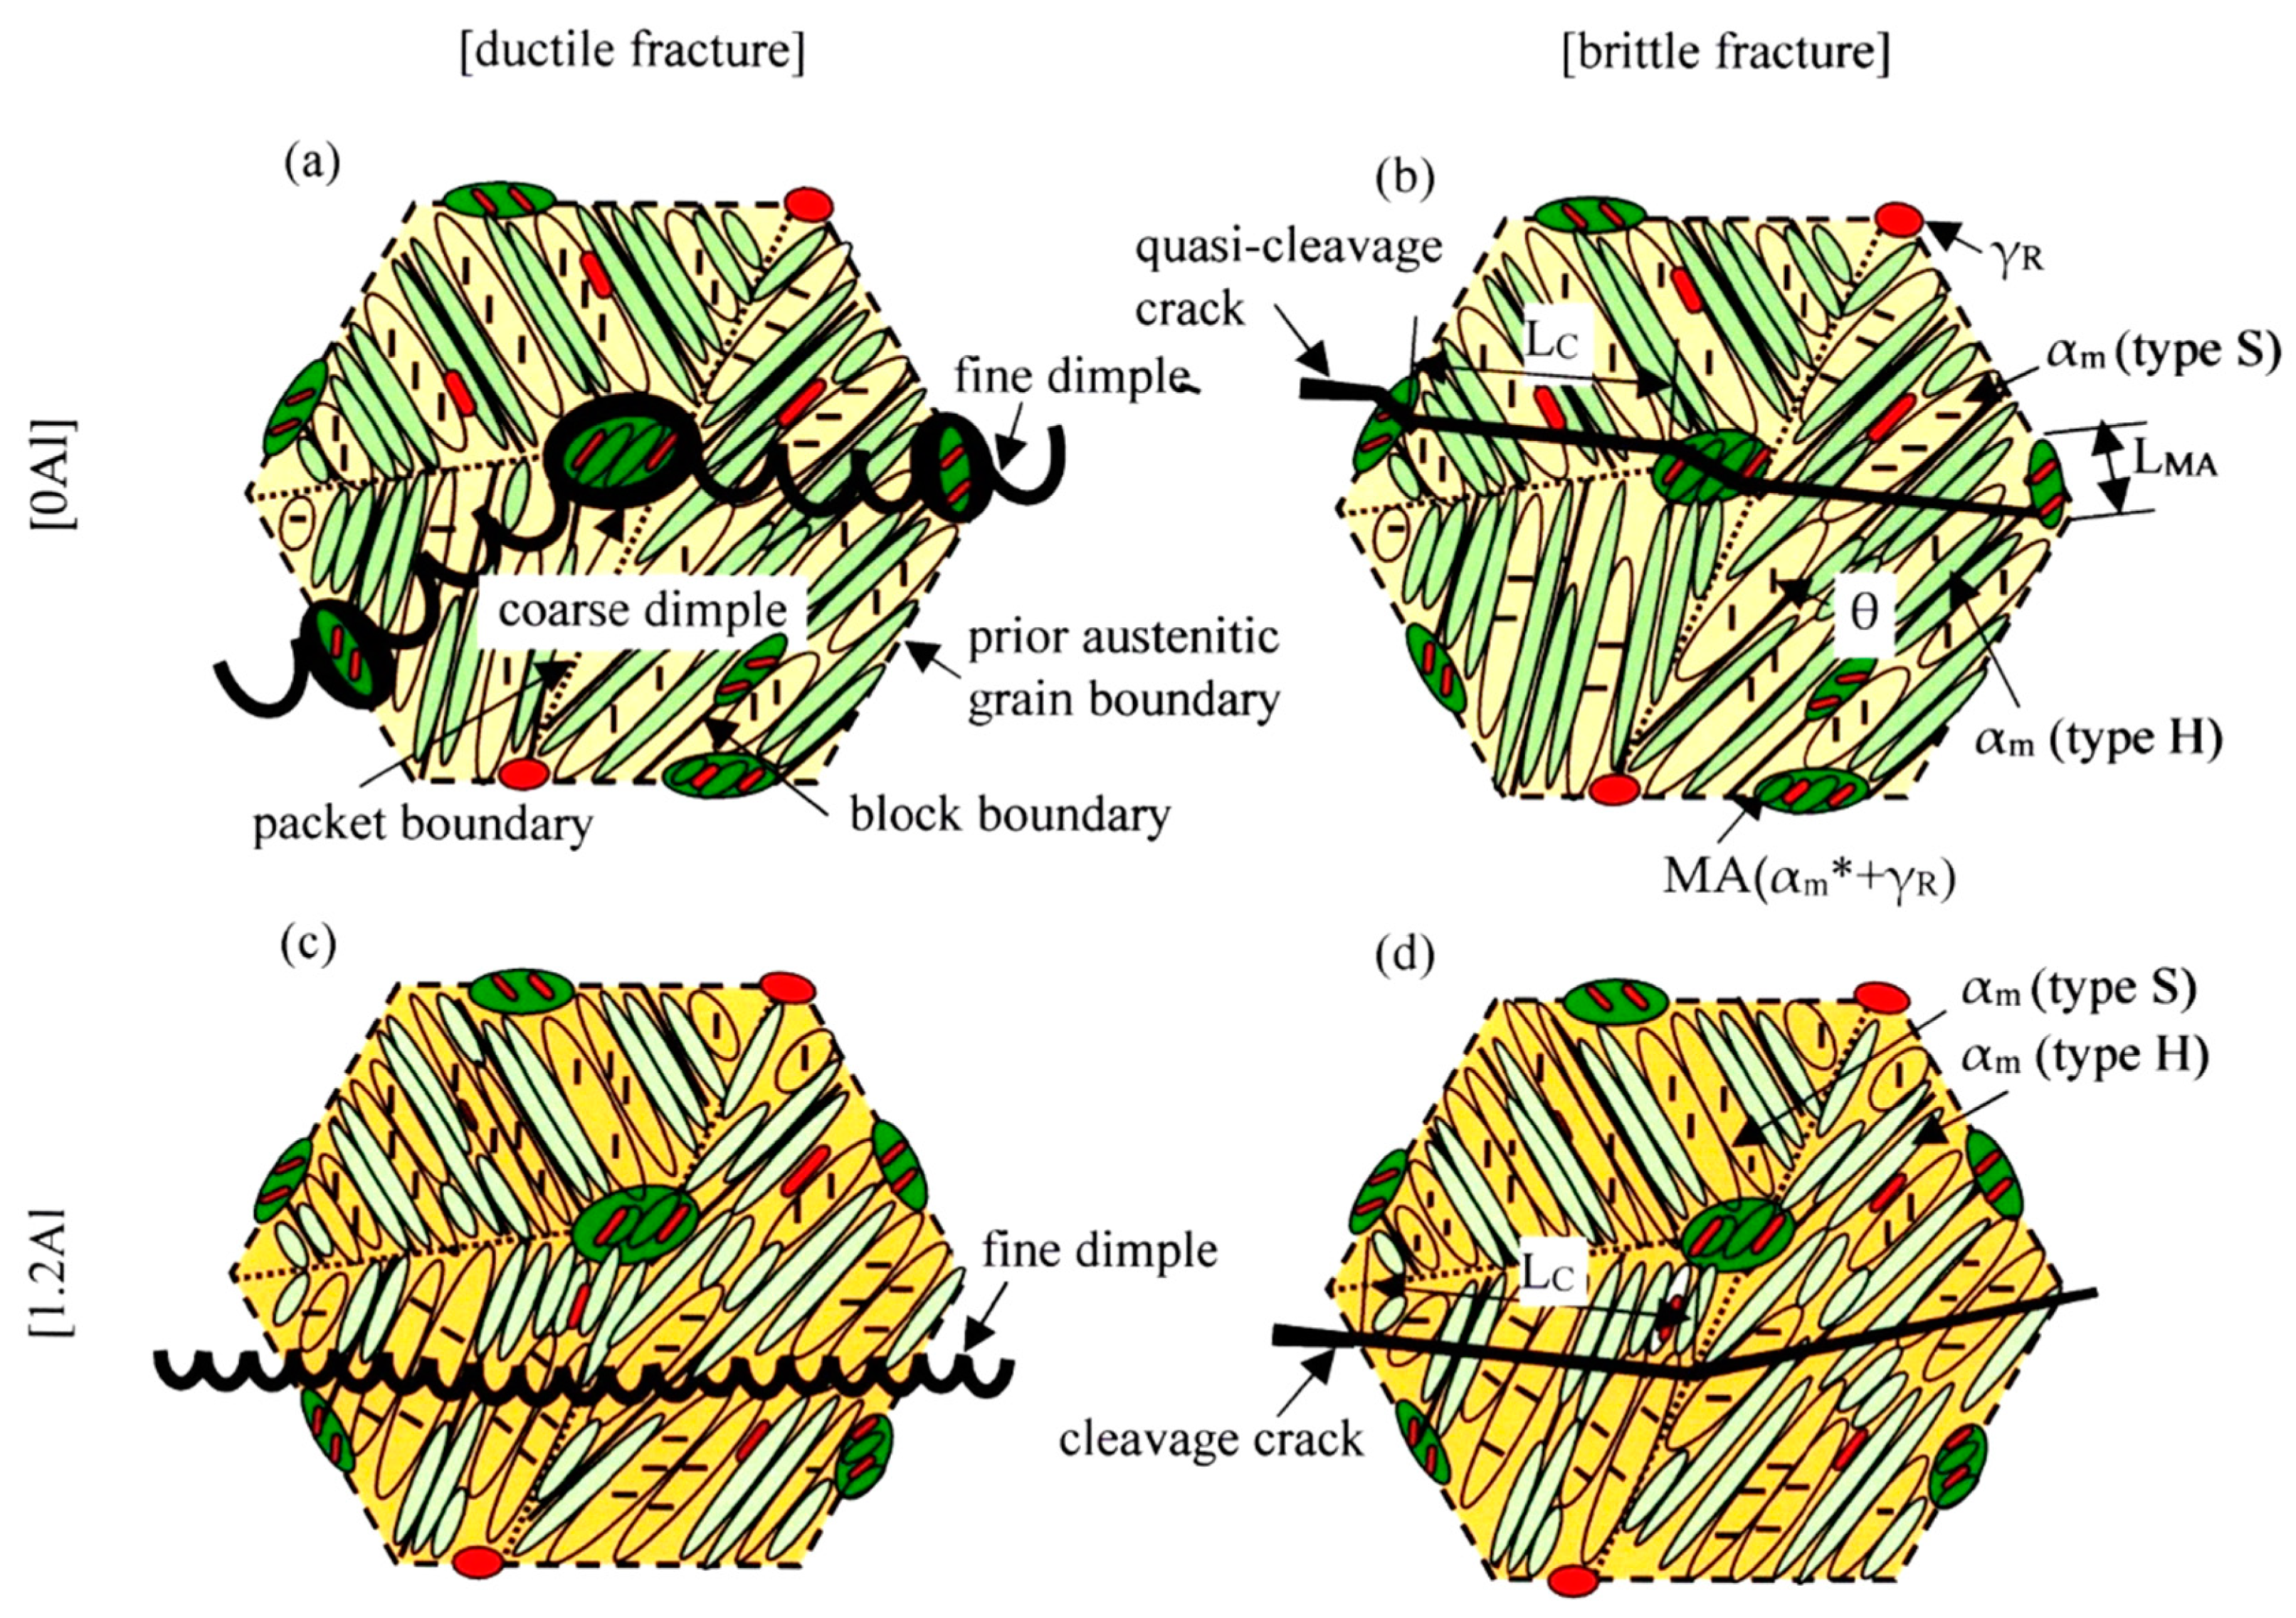
- The volume fraction and size of the MA phase were nearly the same as those of the 0Al TM steel (Table 2, Figures 3a and 3b).
- The primary martensite was softened in comparison with that of 0Al TM steel. The volume fraction of the primary type S martensite increased compared to the 0Al TM steel, with a decrease in the primary type H martensite fraction (Figures 3e to 3h).
- The secondary martensite was also softened in comparison with that of 0Al TM steel (Figures 3g and 3h).
4.3.2. DBTT
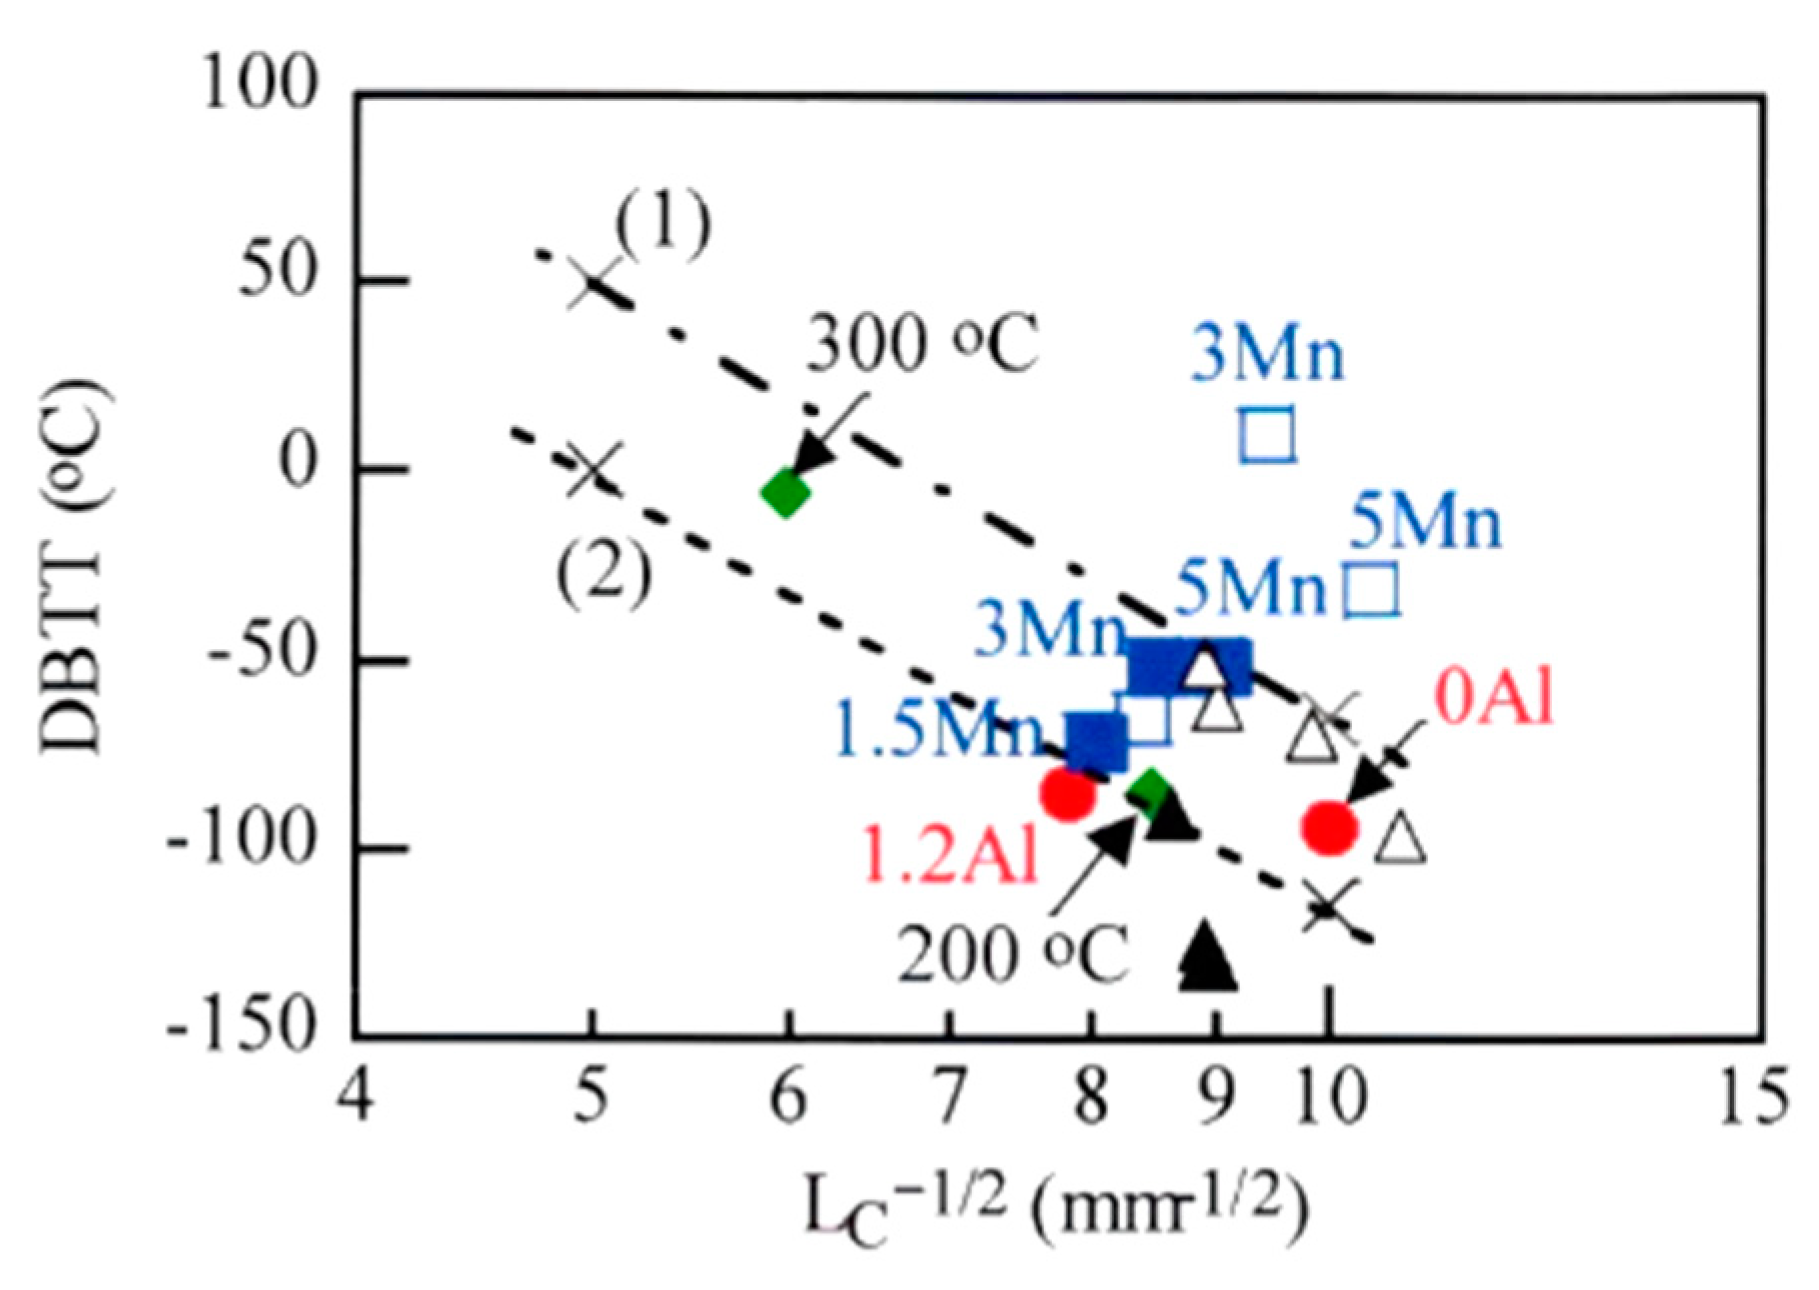
 − ln LC−1/2.
5. Conclusions
- (1)
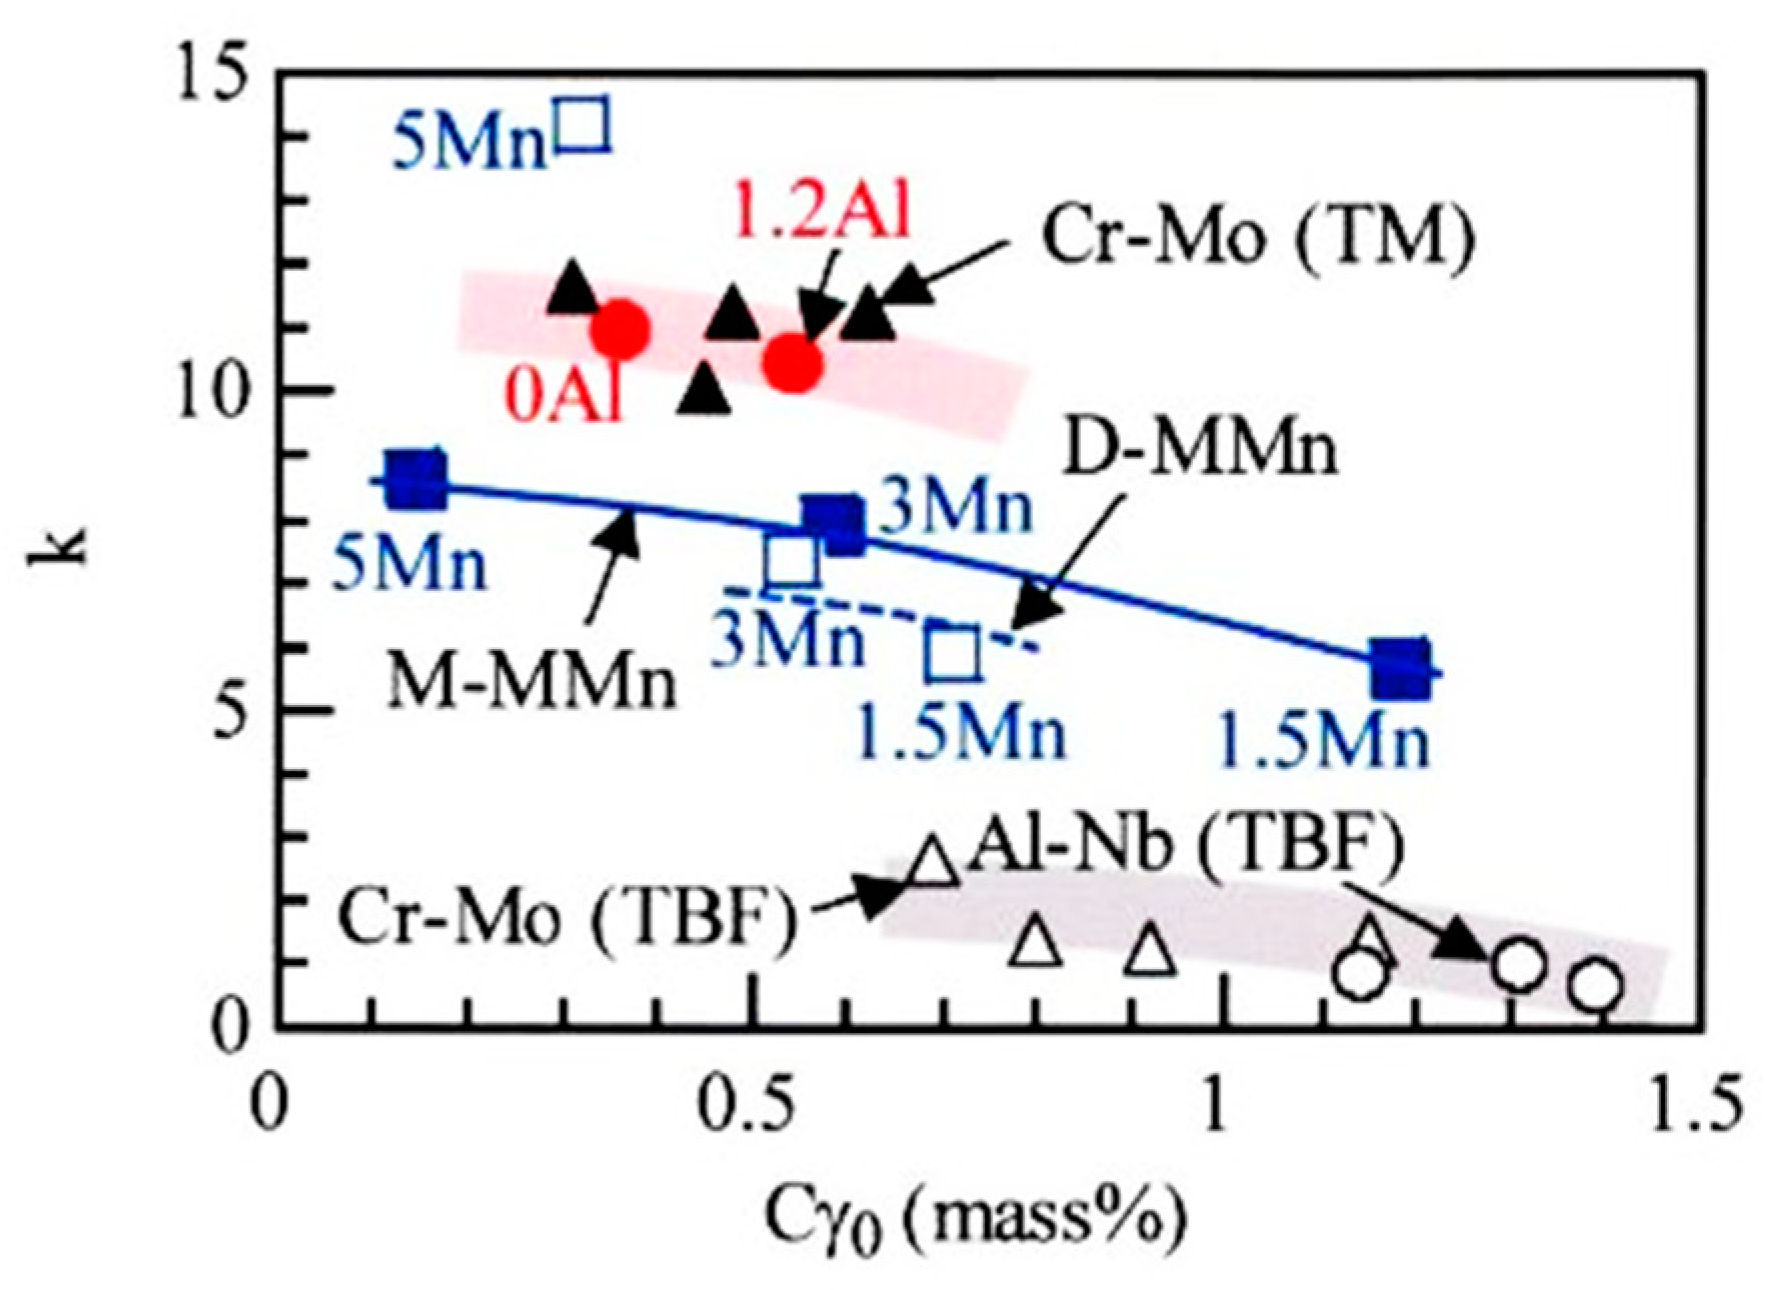
- The partial replacement of Si by Al decreased the retained austenite fraction and increased the austenite’s mechanical stability. The primary martensite was softened by the partial replacement, although the primary type S martensite fraction was increased with a decrease in the primary type H martensite fraction. The partial replacement hardly changed the volume fractions of the MA phase and carbide.
- (2)
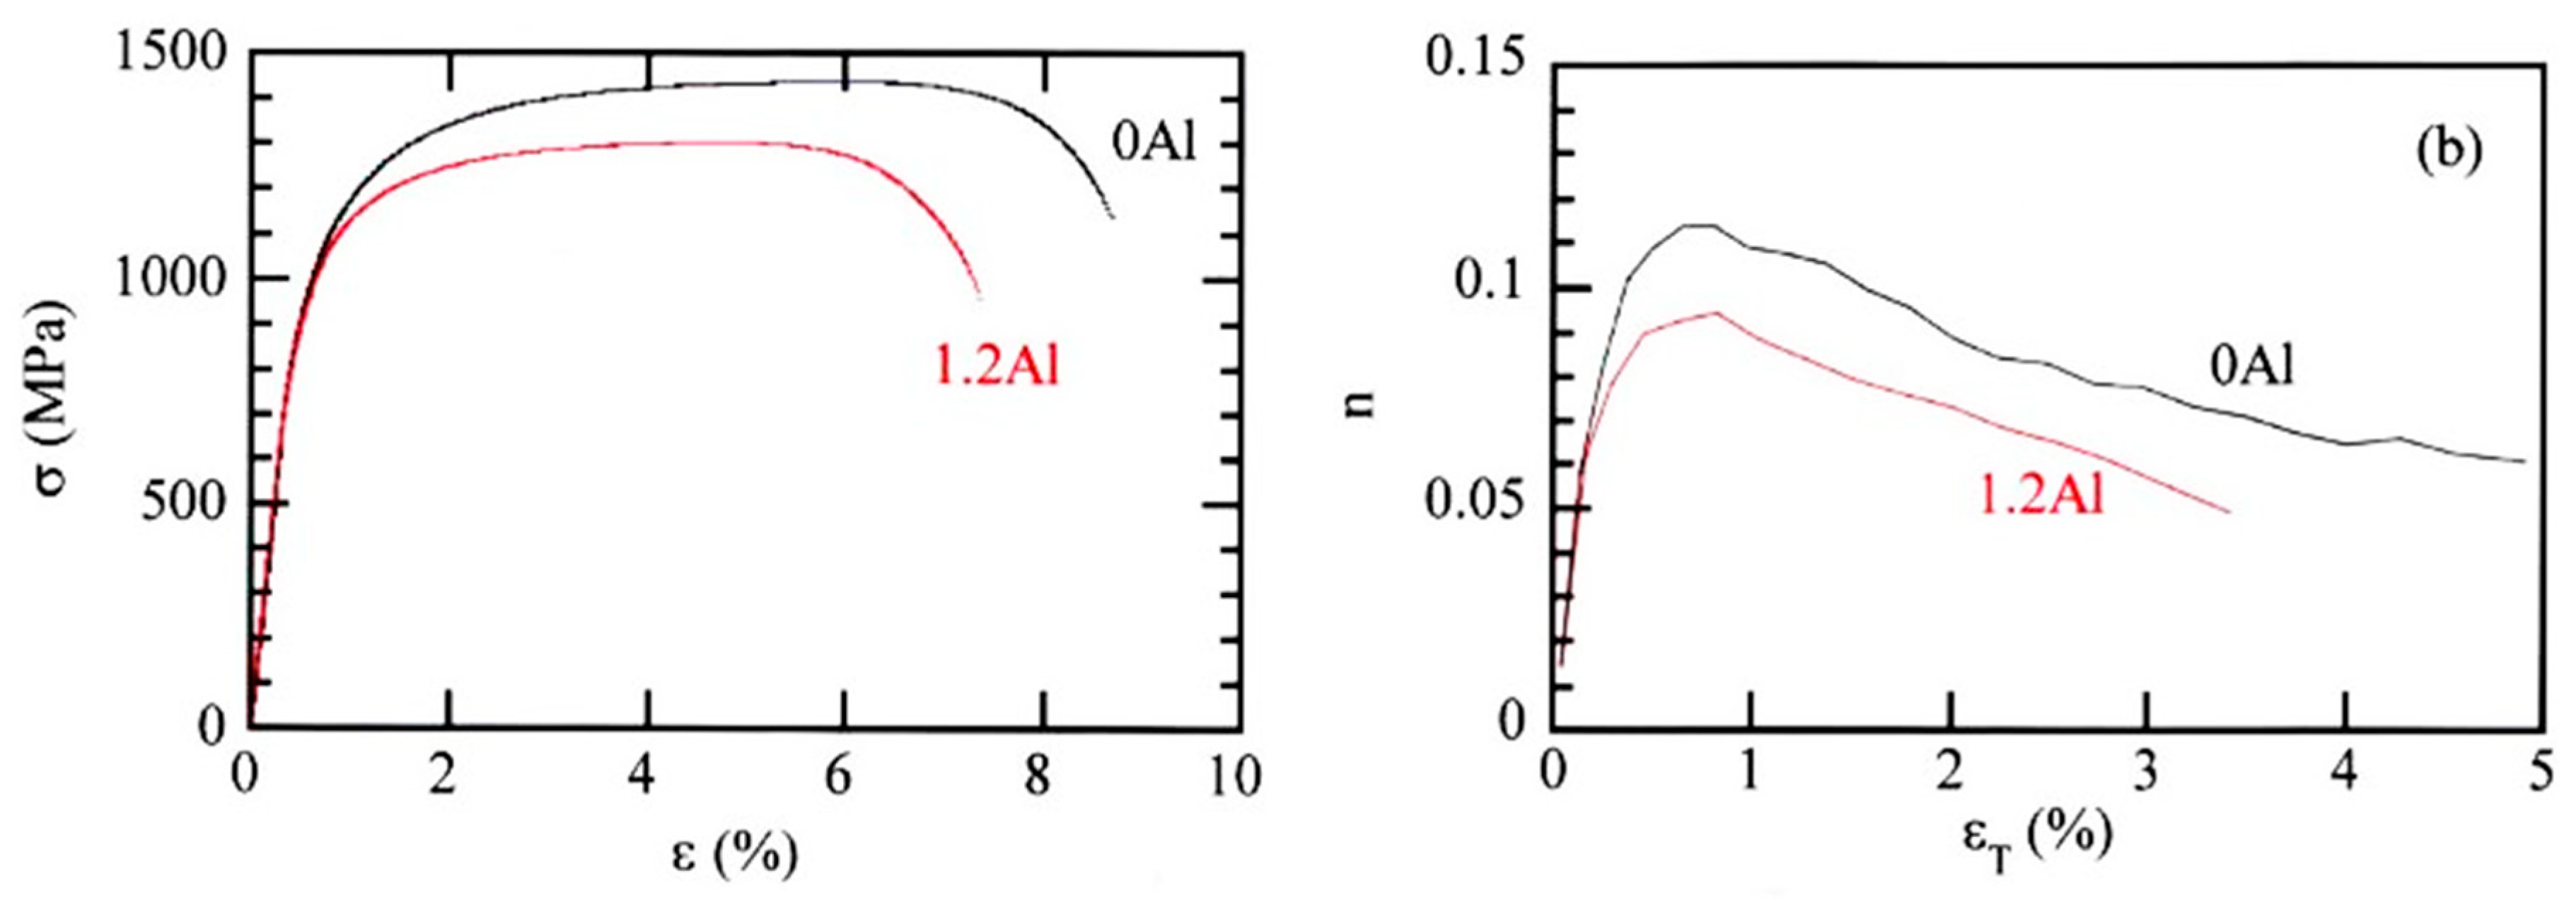
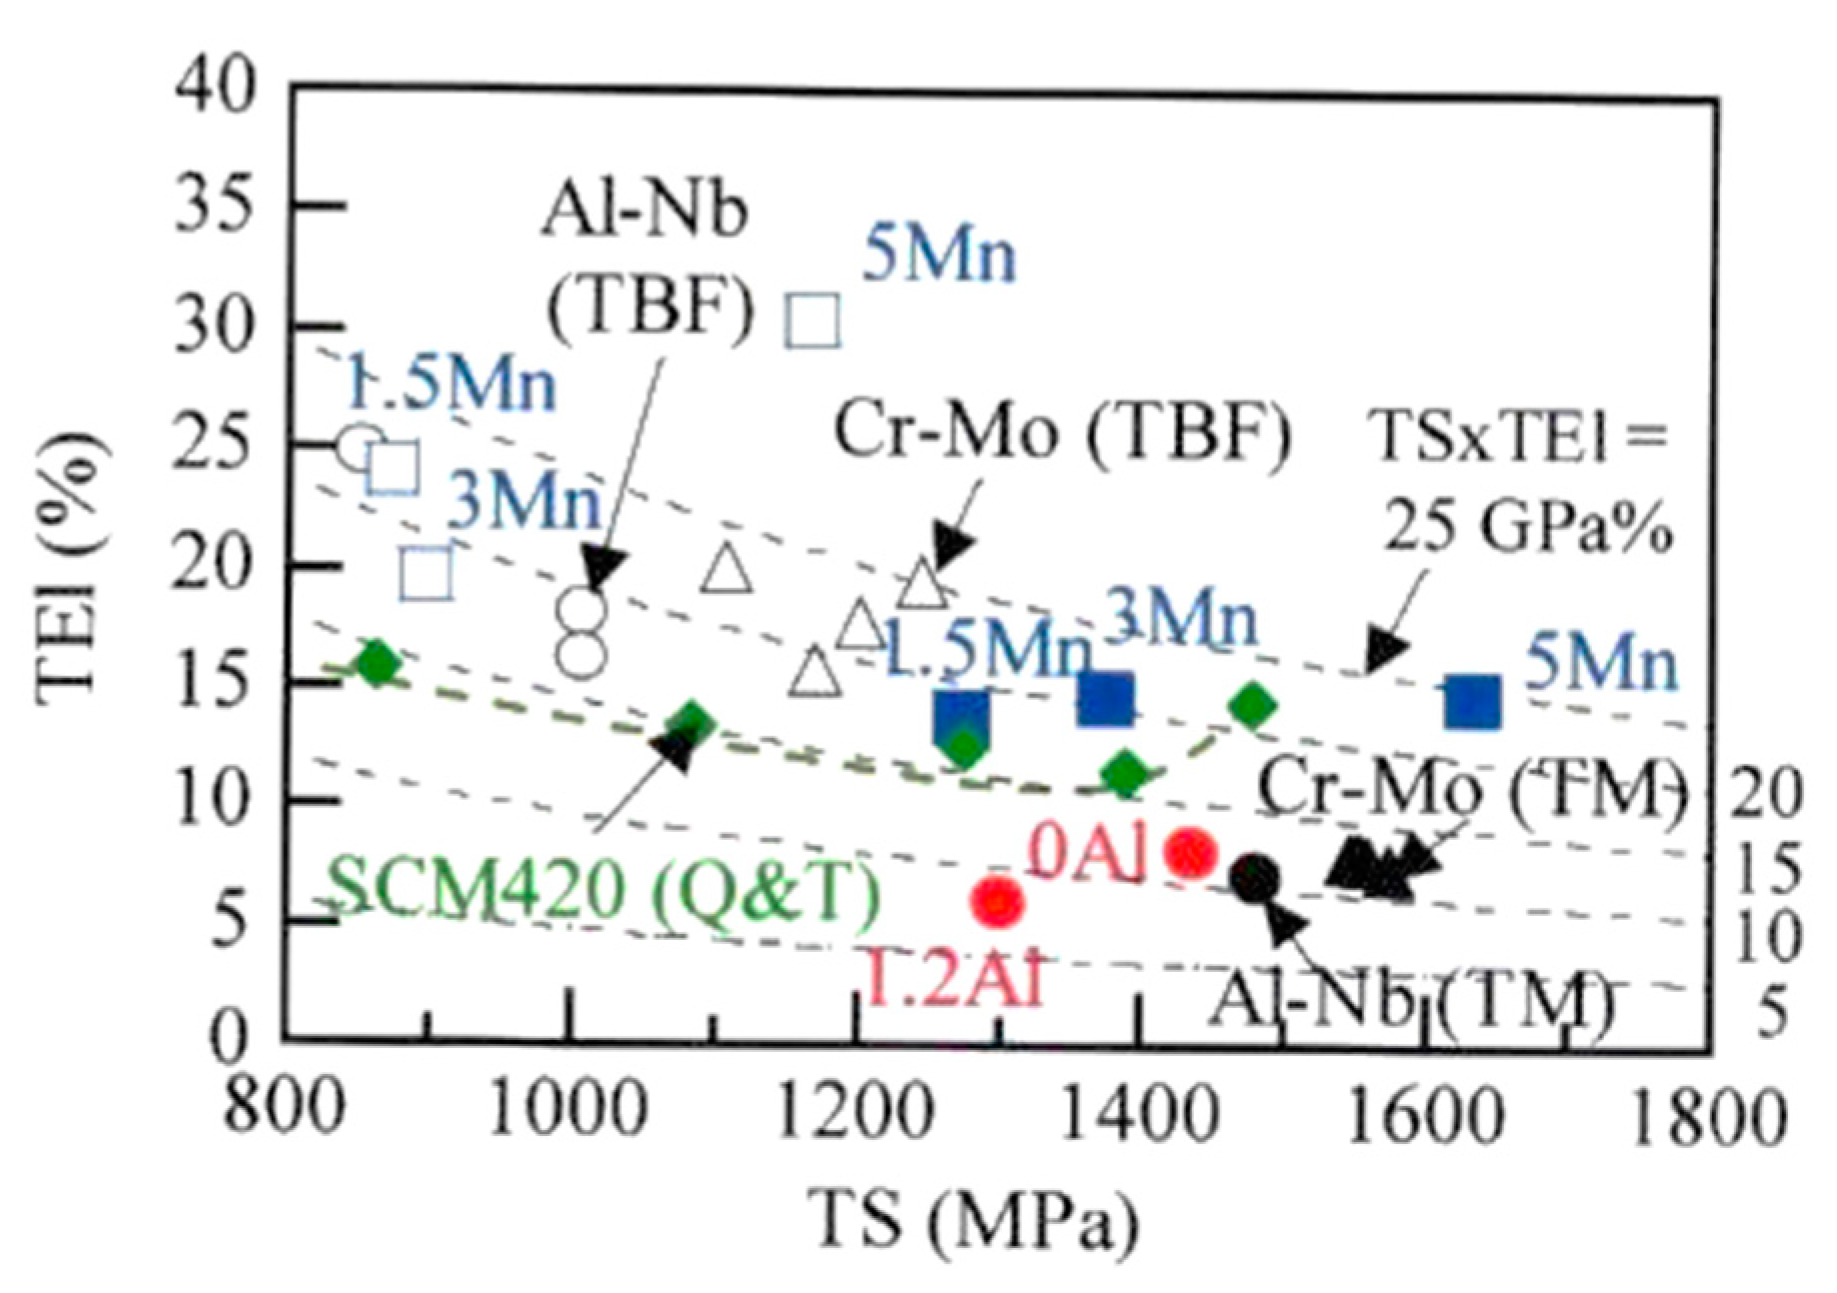
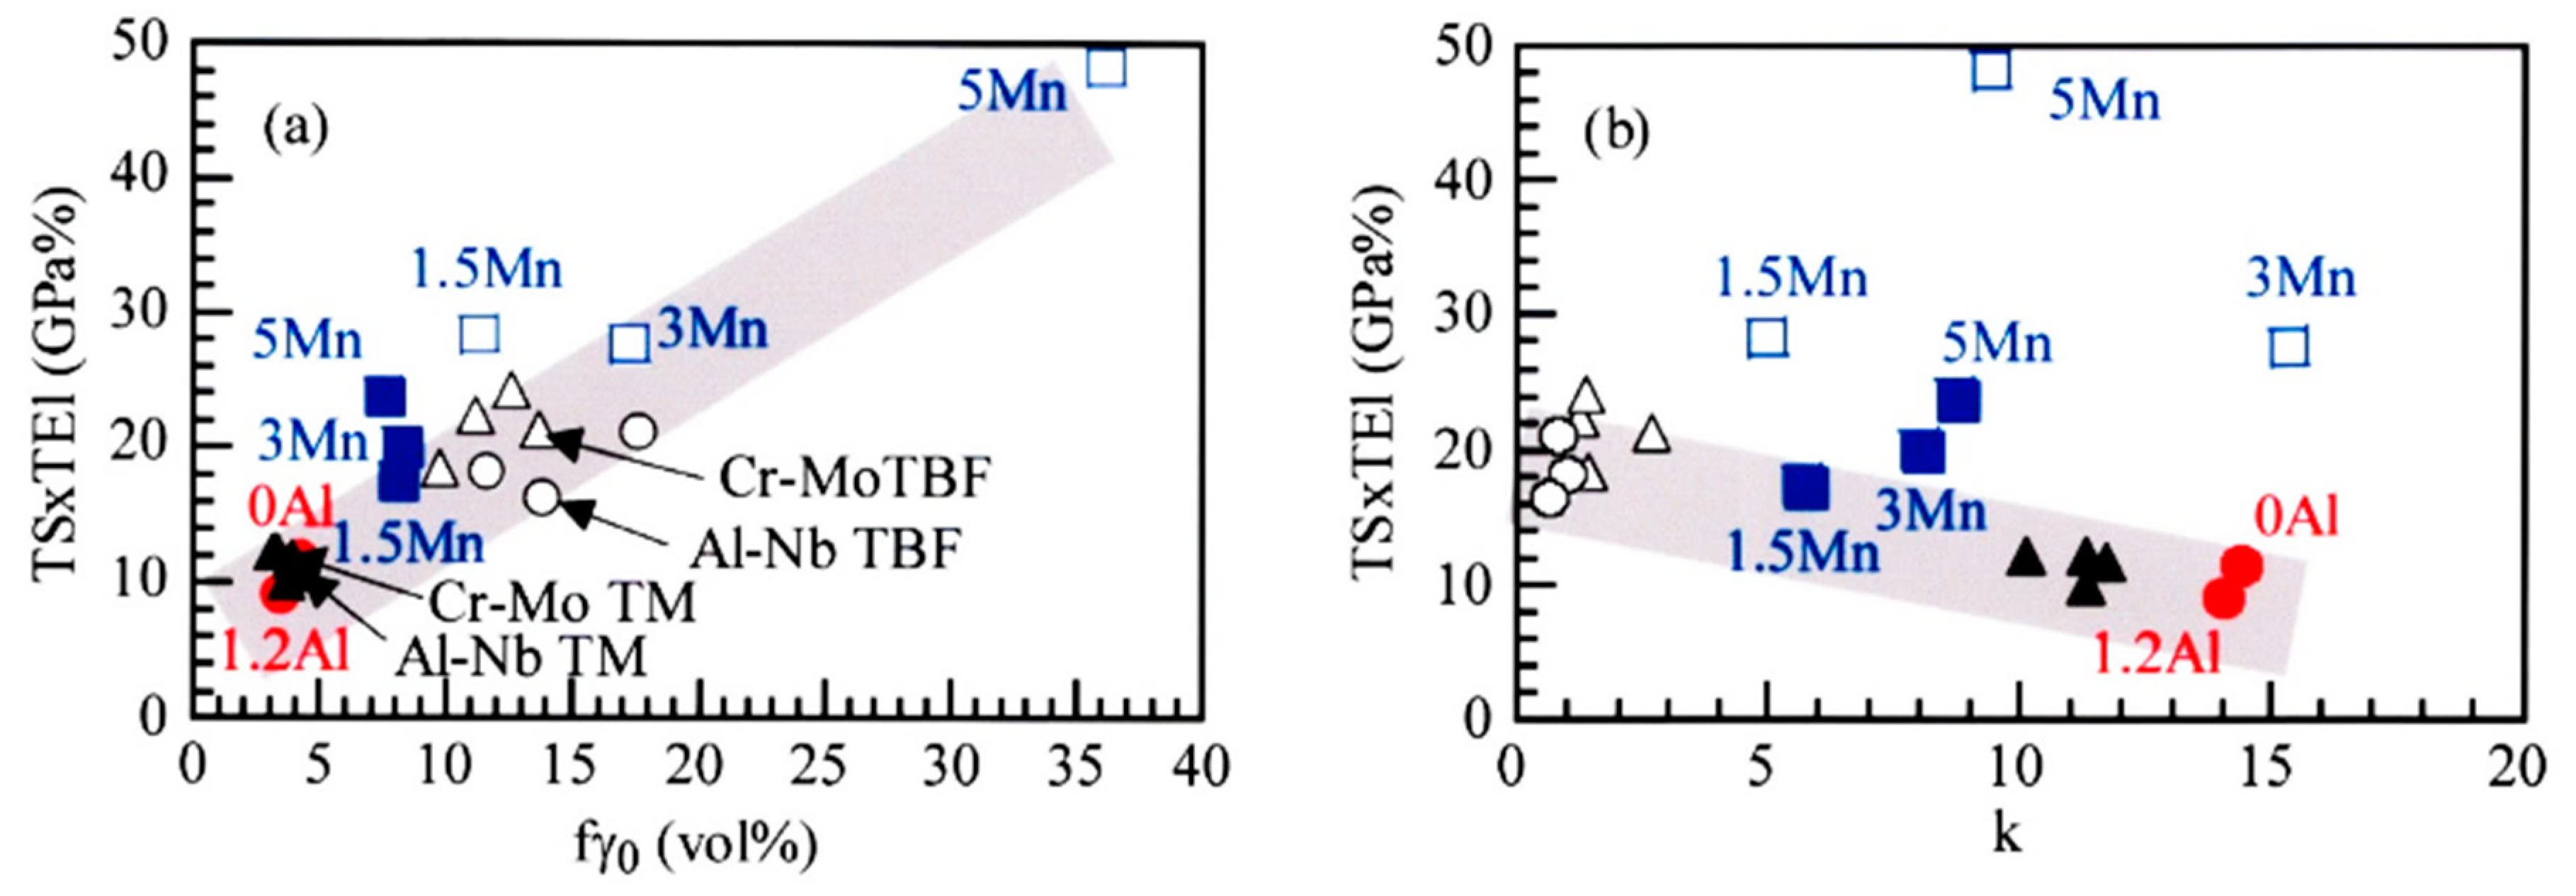
- The partial replacement of Si by Al decreased the YS, TS, UEl, TEl, and TS×TEl. This was mainly associated with the reduced solid-solute hardening of the primary martensite, although the TRIP effect of a small amount of stabilized retained austenite slightly contributed.
- (3)
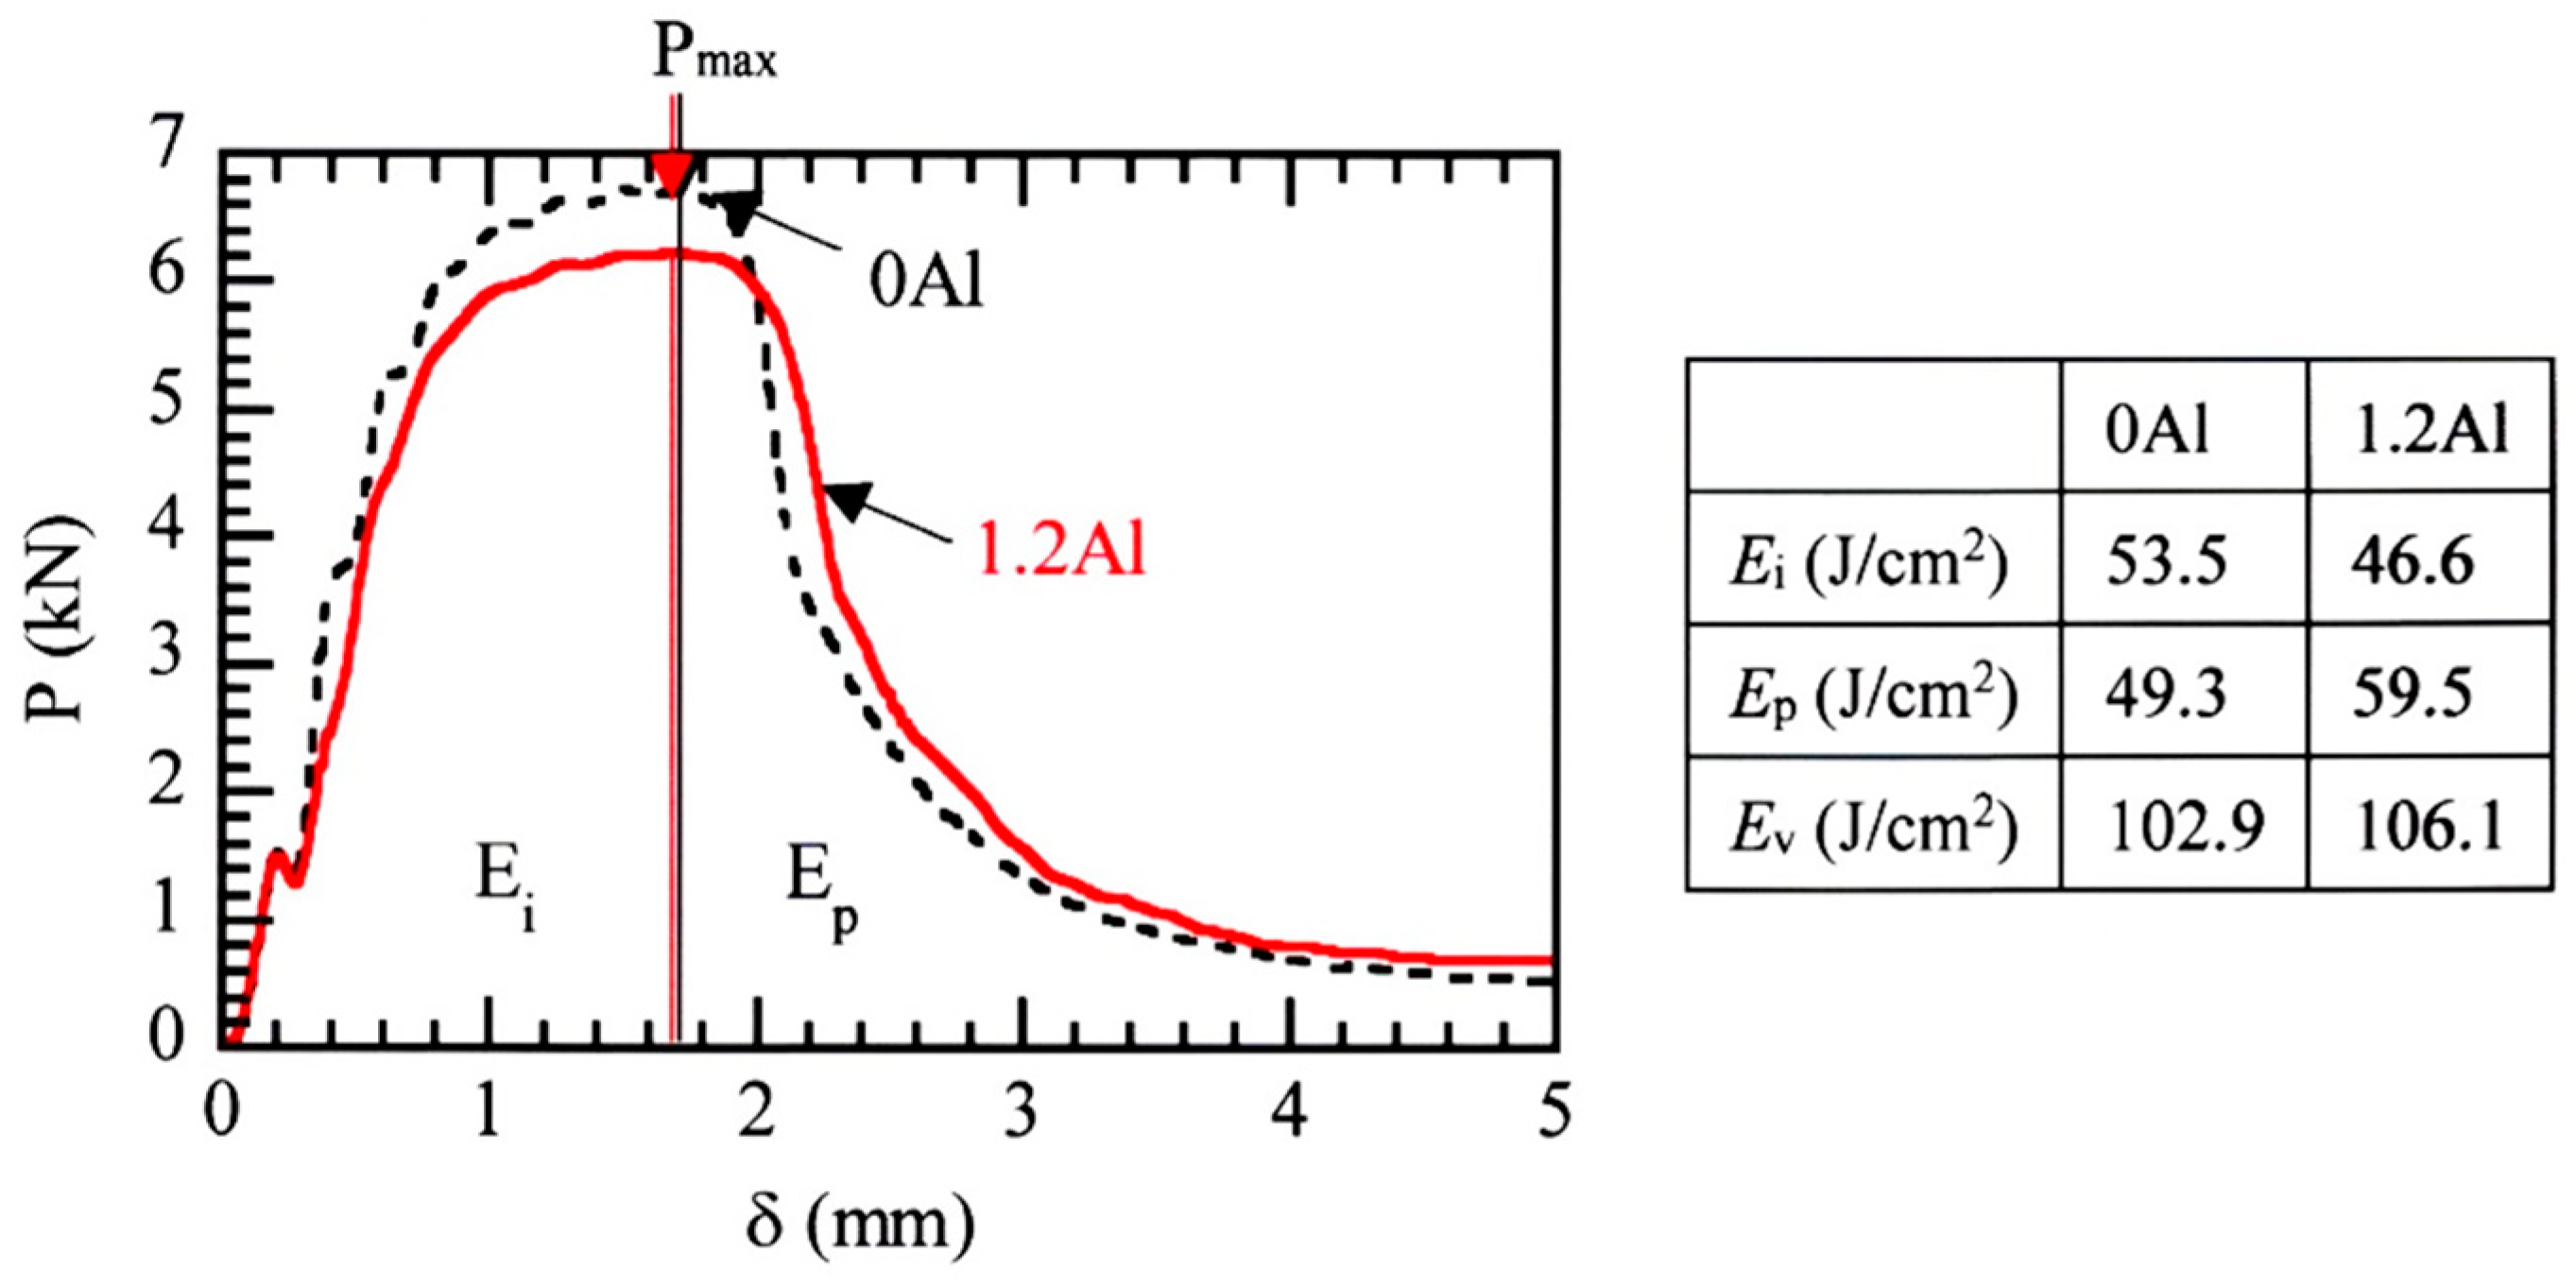
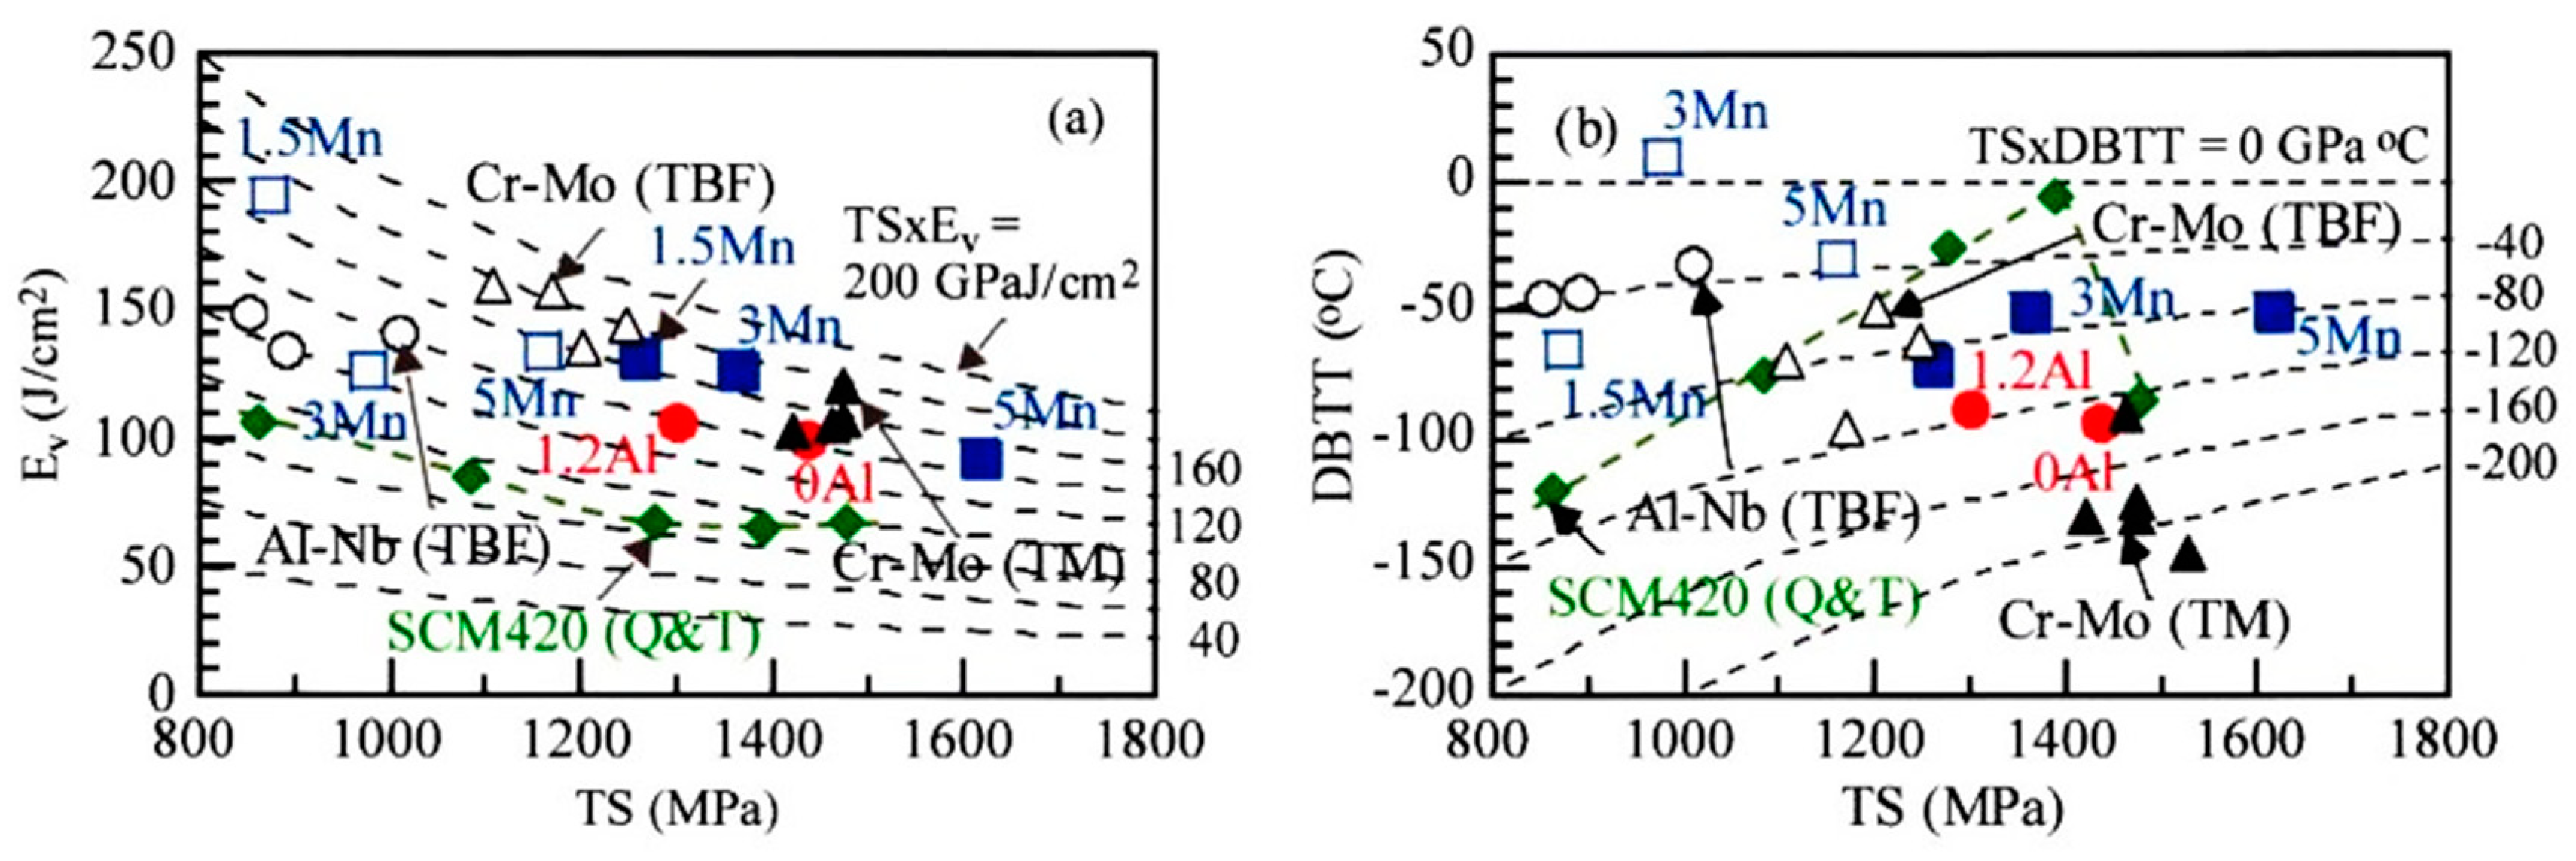
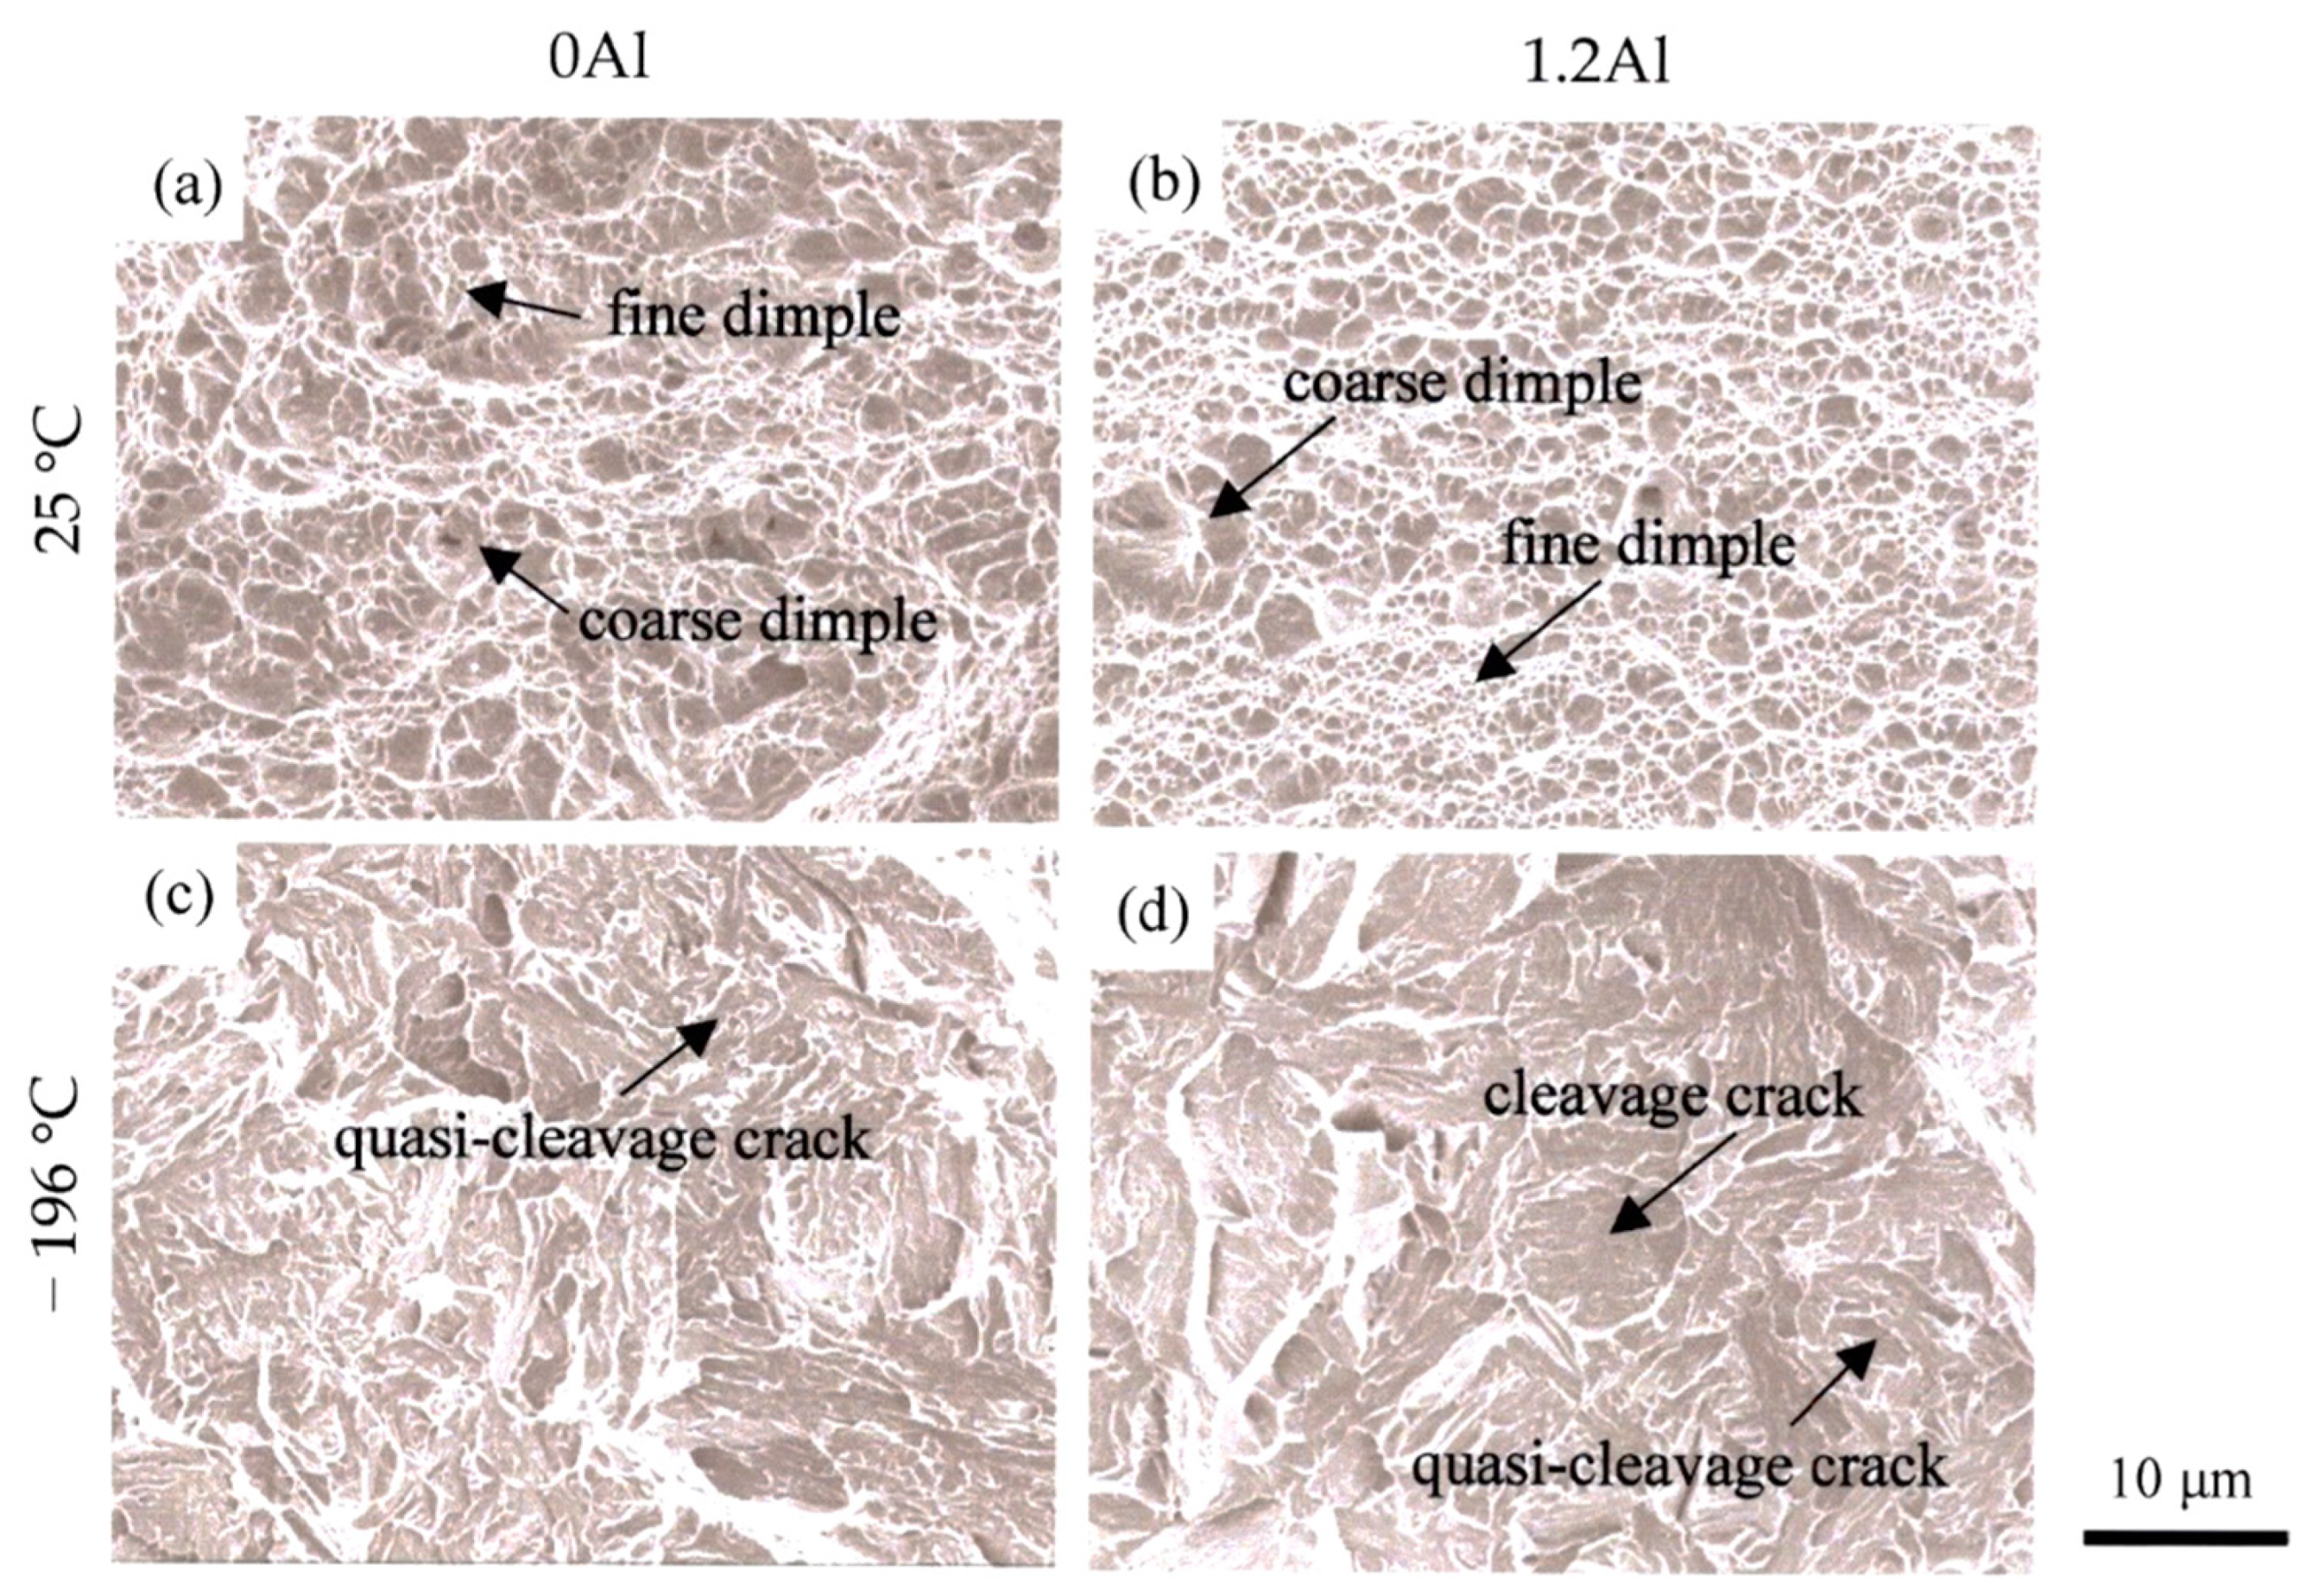
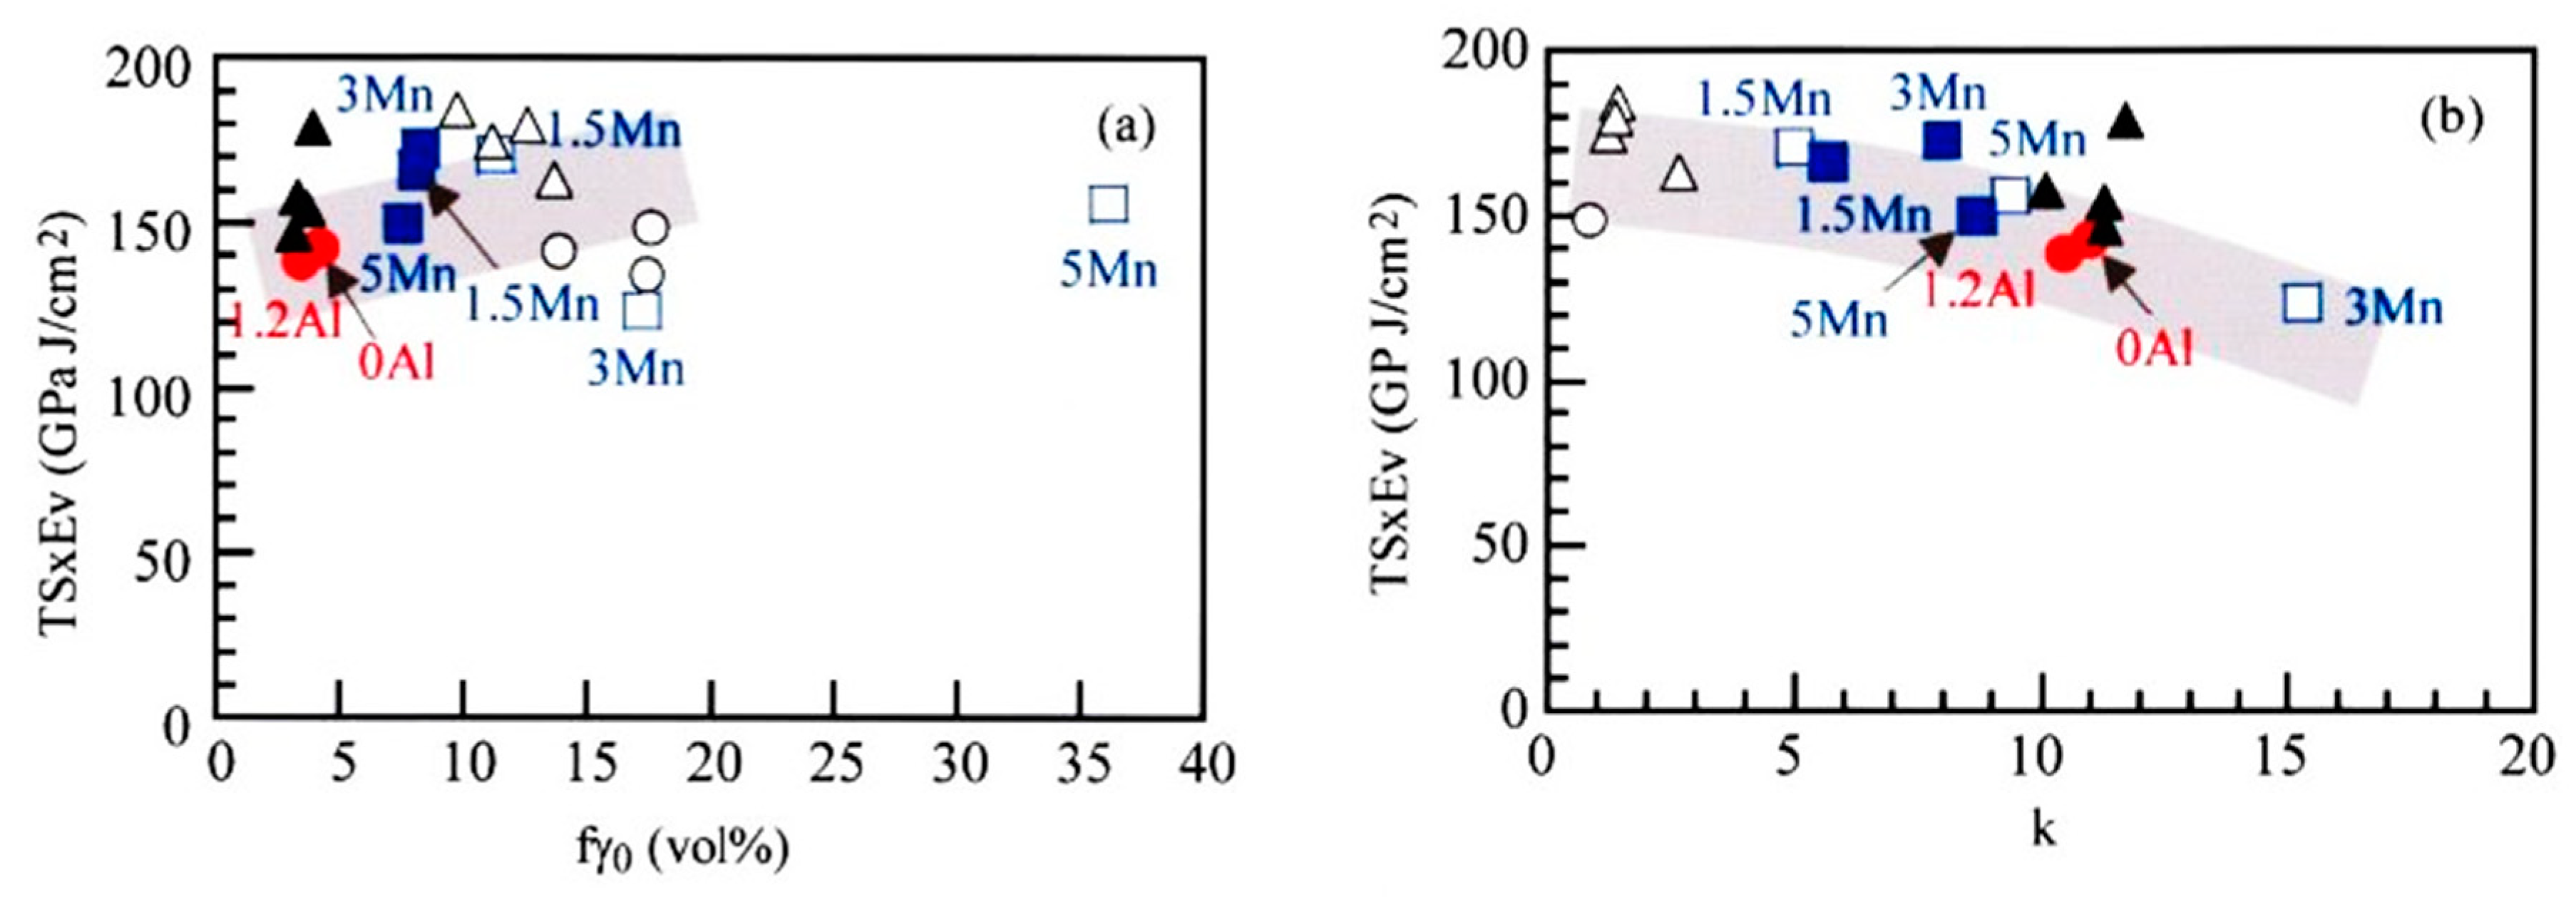
- The partial replacement of Si by Al slightly increased the Ev at 25 °C or upper shelf Ev, although it hardly changed the TS×Ev. The increased Ev was mainly caused by high crack/void propagation energy due to the softened primary martensite and a small contribution of the stabilized retained austenite, with the decreased crack/void initiation energy. In this case, the MA phase hardly took part in the dimple fracture, differing from the 0Al TM steel.
- (4)
- The partial replacement of Si by Al marginally raised the DBTT. The raised DBTT of the 1.2Al TM steel may be mainly caused by the increased LC due to the existence of cleavage fracture resulting from the softened primary martensite and crack pathways avoiding the MA phase.
Author Contributions
Funding
Institutional Review Board Statement
Informed Consent Statement
Data Availability Statement
Conflicts of Interest
Nomenclature
| AHSS | advanced high-strength steel | TRIP | transformation-induced plasticity |
| TBF | TRIP-aided bainitic ferrite | Q&P | quenching and partitioning |
| CFB | carbide-free bainite | TM | TRIP-aided martensite |
| D-MMn | duplex type medium Mn | L-MMn | laminate type medium Mn |
| Q&P-MMn | Q&P type medium Mn | M-MMn | martensite type medium Mn |
| TPF | TRIP-aided polygonal ferrite | TAM | TRIP-aided annealed martensite |
| IT | isothermal transformation | Ac3 | austenite-finish temperature |
| Ac1 | austenite-start temperature | Ms | martensite-start temperature |
| Mf | martensite-finish temperature | T0 | critical temperature |
| TIT | IT temperature | TT | tempering temperature |
| γR | retained austenite | αm | primary martensite |
| αm* | secondary martensite | MA | complex phase of αm* and γR |
| θ | carbide | fγ0 | initial volume fraction of γR |
| fγ | The volume fraction of γR | fαm | primary martensite fraction |
| fMA | MA phase fraction | fθ | carbide fraction |
| d | prior austenitic grain size | Cγ0 | initial carbon concentration of γR |
| Cγ | carbon concentration of γR | εT | plastic strain |
| σ | engineering stress | ε | engineering strain |
| k | strain-induced transformation factor | σ | flow stress of steel |
| σM | flow stress of matrix | Δσh | strain hardening increment |
| Δσi | long-range internal stress | Δσt | transformation hardening |
| Δσf | forest dislocation hardening | ν | Poisson’s ratio |
| μ | shear modulus | f | volume fraction of the second phase |
| εpu | eigenstrain | Δfαm | strain-induced martensite fraction |
| ζ | material constant | b | Burgers vector |
| r | particle radius of second phase | YS | yield stress |
| TS | tensile strength | UEl | uniform elongation |
| TEl | total elongation | RA | reduction of area |
| HV | Vickers hardness | n | strain hardening exponent |
| Ev | Charpy impact absolute energy or value (= Ei + Ep) | PBFS | percent of the brittle fracture surface |
| Ei | crack/void initiation energy or value | Ep | crack/void propagation energy or value |
| P | impact load | Pmax | maximum impact load |
| δ | Impact displacement | DBTT | 50% shear fracture ductile-to-brittle transition temperature |
| Lc | unit crack path of quasi-cleavage or cleavage fracture | LMA | size of MA phase |
References
- Rana, R.; Singh, S.B. Automotive Steels – Design, Metallurgy, Processing and Applications. Woodhead Publishing, Cambridge, UK, 2016, 1−469.
- Bleck, W.; Guo, X.; Ma, Y. The TRIP effect and its application in cold formable sheet steels. Steel Res. Int. 2017, 88, 1700218. [Google Scholar] [CrossRef]
- Soleimani, M. : Kalhor, A.; Mirzadeh, H. Transformation-induced plasticity (TRIP) in advanced steels: A review. Mater. Sci. Eng. A 2020, 795, 140023. [Google Scholar] [CrossRef]
- Sugimoto, K. Effects of partial replacement of Si by Al on cold formability in two groups of low-carbon third-generation advanced high-strength steel sheet: A review. Metals 2022, 12, 2069. [Google Scholar] [CrossRef]
- Sugimoto, K.; Kobayashi, J.; Ina, D. Toughness of advanced ultra high-strength TRIP-aided steels with good hardenability. In Proceedings of International Conference on Advanced Steels 2010 (ICAS 2010), Auto Sheet Steels, Ed. by Weng, Y.; Dong, H.; Gan, Y. Beijing, Metallurgical Industry Press, Guilin, China, 25 September 2010; FR004.
- Hojo, T.; Kajiyama, T.; Sugimoto, K. Impact properties of C-Si-Mn-Al and C-Si-Mn-Al-Nb ultra high-strength low alloy TRIP-aided bainitic ferrite steels. Proceedings of Asia Steel 2009, S7-09. Busan, Korea, 24 May 2009. [Google Scholar]
- Somani, M.C.; Porter, D.A.; Karjalainen, L.P.; Suikkanen, P.P. Misra, R.D.K. Process design for tough ductile martensitic steels through direct quenching and partitioning. Mater. Today. 2015, 2S, S631–S634. [Google Scholar]
- Gao, G.; Zhang, H.; Gui, X.; Luo, P.; Tan, Z.; Bai, B. Enhanced ductility and toughness in an ultrahigh-strength Mn-Si-Cr-C steel: The great potential of ultrafine filmy retained austenite. Acta Mater. 2014, 76, 425–433. [Google Scholar] [CrossRef]
- Paravicini Bagliani, E.; Santofimia, M.J.; Zhao, L.; Sietsma, J.; Anelli, E. Microstructure, tensile and toughness properties after quenching and partitioning treatments of a medium-carbon steel. Mater. Sci. Eng. A 2013, 559, 486–495. [Google Scholar] [CrossRef]
- Gao, G.; An, B.; Zhang, H.; Guo, H.; Gui, X.; Bai, B. Concurrent enhancement of ductility and toughness in an ultrahigh strength lean alloy steel treated by bainite-based quenching-partitioning-tempering process. Mater. Sci. Eng. A 2017, 702, 104–112. [Google Scholar] [CrossRef]
- Yang, K.; Li, Y.; Hong, Z.; Du, S.; Ma, T.; Liu, S.; Jin, X. The dominating role of austenite stability and martensite transformation mechanism on the toughness and ductile-to-brittle-transition temperature of a quenched and partitioned steel. Mater. Sci. Eng. A 2021, 820, 141517. [Google Scholar] [CrossRef]
- Keul, C.; Wirths, V.; Bleck, W. New bainitic steel for forgings. Arch. Civ. Mech. Eng. 2012, 12, 119–125. [Google Scholar] [CrossRef]
- Buchmayr, B. Critical assessment 22: Bainitic forging steels. Mater. Sci. Technol. 2016, 32, 517–522. [Google Scholar] [CrossRef]
- Xia, S.; Zhang, F.; Yang, Z. Microstructure and mechanical properties of 18Mn3Si2CrMo steel subjected to austempering at different temperatures below Ms. Mater. Sci. Eng. A 2018, 724, 103–111. [Google Scholar] [CrossRef]
- Qian, L.; Li, Z.; Wang, T.; Li, D.; Zhang, F.; Meng, J. Roles of pre-formed martensite in below-Ms bainite formation, microstructure, strain partitioning and impact absorption energies of low-carbon bainitic steel. J. Mater. Sci. Technol. 2022, 96, 69–84. [Google Scholar] [CrossRef]
- Chen, S.; Hu, J.; Zhang, X.; Dong, H.; Cao, W. High ductility and toughness of a micro-duplex medium-Mn steel in a large temperature range from -196 °C to 200 °C. J. Iron Steel Res. Int. 2015, 22, 1126–1130. [Google Scholar] [CrossRef]
- Tanino, H.; Horita, M.; Sugimoto, K. Impact toughness of 0.2 pct-1.5 pct-(1.5 to 5) pct Mn transformation-induced plasticity-aided steels with an annealed martensite matrix. Metall. Mater. Trans. A 2016, 47A, 2073–2080. [Google Scholar] [CrossRef]
- Chen, J.; Lv, M.; Tang, S.; Liu, Z.; Wang, G. Coupled toughness of a low carbon medium manganese heavy steel plate investigated by electron back-scattered diffraction (EBSD). Mater. Lett. 2016, 17, 203–206. [Google Scholar] [CrossRef]
- Zou, Y.; Xu, Y.; Hu, Z.; Chen, S.; Han, D.; Misra, R.D.K.; Wang, G. High strength-toughness combination of a low-carbon medium-manganese steel plate with laminated microstructure and retained austenite. Mater. Sci. Eng. A 2017, 707, 270–279. [Google Scholar] [CrossRef]
- Tonizzo, Q.; Mazière, M.; Perilade, A.; Gourgues-Lorenzon, A.F. Effect of austenite stability on the micromechanisms and ductile-to-brittle transition in a medium-Mn, ultra-fine-grained steel for automotive applications. J. Mater. Sci. 2020, 5, 9245–9257. [Google Scholar] [CrossRef]
- Dutta, A.; Park, T.; Nam, J.; Lee, S.; Hwang, B.; Choi, W.; Sandlöbes, S.; Ponge, D.; Han, J. Enhancement of the tensile properties and impact toughness of a medium-Mn steel through the homogeneous microstrain distribution. Mater. Charact. 2021, 174, 110992. [Google Scholar] [CrossRef]
- Sugimoto, K.; Tanino, H. Influence of cooling process routes after intercritical annealing on impact toughness of duplex type medium Mn steel. Metals 2021, 11, 1143. [Google Scholar] [CrossRef]
- Cao, W.; Zhang, M.; Huang, C.; Xiao, S.; Dong, H.; Weng, Y. Ultrahigh Charpy impact toughness (~450J) achieved in high strength ferrite/martensite laminated steels. Sci. Reports 2017, 7, 41459. [Google Scholar] [CrossRef] [PubMed]
- Sugimoto, K.; Tanino, H.; Kobayashi, J. Impact toughness of medium-Mn transformation-induced plasticity-aided steels. Steel Res. Int. 2015, 86, 1151–1160. [Google Scholar] [CrossRef]
- Wallner, M.; Steineder, K.; Schneider, R.; Commenda, C.; Sommitsch, C. Effect of galvannealing on the microstructure and mechanical properties of a Si and Al alloyed medium-Mn quenching and partitioning steels. Mater. Sci. Eng. A 2022, 841, 143067. [Google Scholar] [CrossRef]
- Kobayashi, J.; Ina, D.; Nakajima, Y.; Sugimoto, K. Effects of microalloying on the impact toughness of ultrahigh-strength TRIP-aided martensitic steel. Metall. Mater. Trans. A 2013, 44A, 5006–5017. [Google Scholar] [CrossRef]
- Sugimoto, K. Recent progress of low and medium carbon advanced martensitic steels. Metals 2021, 11, 652. [Google Scholar] [CrossRef]
- Wang, K.; Hu, F.; Zhou, S.; Isayev, O.; Yershov, S.; Zhang, Z.; Wu, K. Ultrahigh impact toughness achieved in high strength bainitic ferrite/retained austenite lamellar steels below-Mf temperature. Mater. Lett. 2022, 324, 132517. [Google Scholar] [CrossRef]
- Chen, H.; Zhao, L.; Lu, S.; Lin, Z.; Wen, T.; Chen, Z. Process and perspective of ultra-high-strength martensitic steels for automobile. Metals 2022, 12, 2184. [Google Scholar] [CrossRef]
- Gramlich, A.; Emmrich, R.; Bleck, W. Austenite reversion tempering-annealing of 4 wt.% manganese steels for automotive forging application. In Proceedings of the 4th International Conference on Medium and High Mn Steels, Aachen, Germany, 1–3 April 2019; pp. 283–286. [Google Scholar]
- Maeda, T.; Okuhata, S.; Matsuda, K.; Masumura, T.; Tsuchiyama, T.; Shirahata, H.; Kawamoto, Y.; Fujioka, M.; Uemori, R. Toughening mechanism in 5%Mn and 10%Mn martensitic steels treated by thermo-mechanical control process. Mater. Sci. Eng. A 2021, 812, 141058. [Google Scholar] [CrossRef]
- Sugimoto, K.; Hojo, T.; Srivastava, A.K. Low and medium carbon advanced high-strength forging steels for automotive applications. Metals 2019, 9, 1263. [Google Scholar] [CrossRef]
- Sugimoto, K.; Srivastava, A.K. Microstructure and mechanical properties of a TRIP-aided martensitic steel. Metallogr. Microstruct. Anal. 2015, 4, 344–354. [Google Scholar] [CrossRef]
- Zackay, V.F.; Parker, E.R.; Fahr, D.; Bush, R. The enhancement of ductility in high-strength steels, Trans. Am. Soc. Met., 1967, 60, 252–259. [Google Scholar]
- De Moor, E.; Speer, J.G.; Matlock, D.K. Effect of retained austenite on tensile behavior of AHSS revisited. In Proceedings of the Materials Science & Technology Conference and Exhibition 2011 (MS&T’11), Columbus, Ohio, USA, 16−20 October 2011; pp. 568–579. [Google Scholar]
- Tian, J.; Xu, G.; Zhou, M.; Hu, H.; Wan, X. The effects of Cr and Al addition on transformation and properties in low-carbon bainitic steels. Metals 2017, 7, 40. [Google Scholar] [CrossRef]
- Kang, S.; De Moor, E.; Speer, J.G. Retained austenite stabilization through solute partitioning during intercritical annealing in C-, Mn-, Al-, Si-, and Cr-alloyed steels. Metall. Mater. Trans. A 2015, 46A, 1005–1011. [Google Scholar] [CrossRef]
- Kaar, S.; Krizan, D.; Schneider, R.; Sommitsch, C. On competing and austenite stabilizer: Advanced model for exact microstructural prediction in Q&P steels with elevated Mn-content. Materialia 2022, 26, 101584. [Google Scholar]
- Tamura, I. Strength of Steels. Nikkan Kogyo Shinbun Ltd. Tokyo, Japan, 1969, pp. 51-54.
- Chen, H.; Era, H.; Shimizu, M. Effect of phosphorus on the formation of retained austenite and mechanical properties in S-containing low-carbon steel sheet. Metall. Trans. A 1989, 20A, 437–445. [Google Scholar] [CrossRef]
- Bleck, W.; Frehn, A.; Ohlert, J. Niobium in dual phase and TRIP steels. In International Symposium on Niobium, TMS, Warrendale, Pennsylvania, 2001; pp. 727–752.
- Sugimoto, K.; Mukherjee, M. Chapter 8 TRIP aided and complex phase steels. In Automotive Steels – Design, Metallurgy, Processing and Applications. Ed. by Rana R.; Singh, S.B., Woodhead Publishing, Cambridge, UK, 2016; pp. 217-257.
- Approaches to microstructural design of TRIP and TRIP-aided cold rolled high strength steels, In Advanced High Strength Sheet Steels for Automotive Applications (AHSSS) Proceedings, Winter Park, Colorado, USA, 6-9 June 2004; pp. 39−50. 9 June.
- Bleck, W.; Guo, X.; Ma, Y. The TRIP effect and its application in cold formable sheet steels. Steel Res. Int. 2017, 88, 1700218. [Google Scholar] [CrossRef]
- Chen, H.C.; Era, H.; Shimizu, M. Effect of phosphorus on the formation of retained austenite and mechanical properties in Si-containing low-carbon steel sheet. Metall. Trans. A 1989, 20A, 437–444. [Google Scholar] [CrossRef]
- Imai, N.; Komatsubara, N.; Kunishige, K. Effects of alloying elements and microstructure on the stability of retained austenite. CAMP-ISIJ 1995, 8, 76–80. [Google Scholar]
- Sugimoto, K.; Murata, M.; Muramatsu, T.; Mukai, Y. Formability of C-Si-Mn-Al-Nb-Mo ultra high-strength TRIP-aided sheet steels. ISIJ Int. 2007, 47, 1357–1362. [Google Scholar] [CrossRef]
- Tian, J.; Xu, G.; Zhou, M.; Hu, H.; Xue, Z. Effects of Al addition on bainite transformation and properties of high-strength carbide-free bainitic steels. J. Iron Steel Res. Int. 2019, 26, 846–855. [Google Scholar] [CrossRef]
- Eres-Castellanos, A.; Caballero, F.G.; Garcia-Mateo, C. Stress or strain induced martensitic and bainitic transformations during ausforming process. Acta Mater. 2020, 189, 60–72. [Google Scholar] [CrossRef]
- Kaar, S.; Krizan, D.; Schneider, R.; Sommitsch, C. Impact of Si and Al on microstructural evolution and mechanical properties of lean medium Mn quenching and partitioning steel. Steel Res. Int. 2020, 91, 2000181. [Google Scholar] [CrossRef]
- Kobayashi, J.; Nakashima, Y.; Sugimoto, K.; Itoh, G. Formabilities of C-Si-Al-Mn transformation-induced plasticity-aided martensitic sheet steel. Mater. Sci. Forum 2016, 838-839, 546–551. [Google Scholar] [CrossRef]
- Maruyama, H. X-ray measurement of retained austenite. Jpn. Soc. Heat Treat. 1977, 17, 198–204. [Google Scholar]
- Dyson, D.J.; Holmes, B. Effect of alloying additions on the lattice parameter of austenite. J. Iron Steel Inst. 1970, 208, 469–474. [Google Scholar]
- Pham, D.V.; Kobayashi, J.; Sugimoto, K. Effects of microalloying on stretch-flangeability of TRIP-aided martensitic sheet steel. ISIJ Int. 2014, 54, 1943–1951. [Google Scholar] [CrossRef]
- Dai, Z. : Yang, Z.; Zhang, C.; Chen, H. Incomplete carbon partitioning during quenching and partitioning of Fe-C-Mn-Si steels: Modeling and experimental validations. Acta Mater. 2020, 200, 597–607. [Google Scholar] [CrossRef]
- Sugimoto, K.; Yu, B.; Mukai, Y.; Ikeda, S. Microstructure and formability of aluminum bearing TRIP-aided steels with annealed martensite matrix. ISIJ Int. 2005, 45, 1194–1200. [Google Scholar] [CrossRef]
- Sugimoto, K.; Murata, M.; Mukai, Y. Stretch-flangeability of C-Mn-Si-Al-Nb high-strength TRIP-aided cold rolled sheet steel. In Advanced High Strength Sheet Steels for Automotive Applications (AHSS 2008) Proceedings, Orland, Florida, USA, 16-18 Jun 2008; pp. 57−67.
- Sugimoto, K.; Kobayashi, J.; Pham, D.V. Advanced ultrahigh-strength TRIP-aided martensitic sheet steels for automotive applications. In Proceedings on the International Symposium on the New Developments in Advanced High Strength Sheet Steels (AIST 2013), Vail, Colorado, USA, ; pp. 175−184. 23–27 June.
- Allen, N.P. In Iron and Its Dilute Solid Solution. Ed. by Spencer, C.W.; Werner, F.E. New York, USA, Willey Interscience, 1963; pp. 271−308.
- Kinoshita, N.; Mura, T. Elastic fields of inclusions in anisotropic media. Phys. Status Solidi A 1971, 5, 759–768. [Google Scholar] [CrossRef]
- Kunitake, T.; Terasaki, F.; Ohmori, Y. The relation between the alloying elements and the mechanical properties of low-carbon low-alloy bainite. Tetsu Hagane 1972, 58, 1977–1892. [Google Scholar]
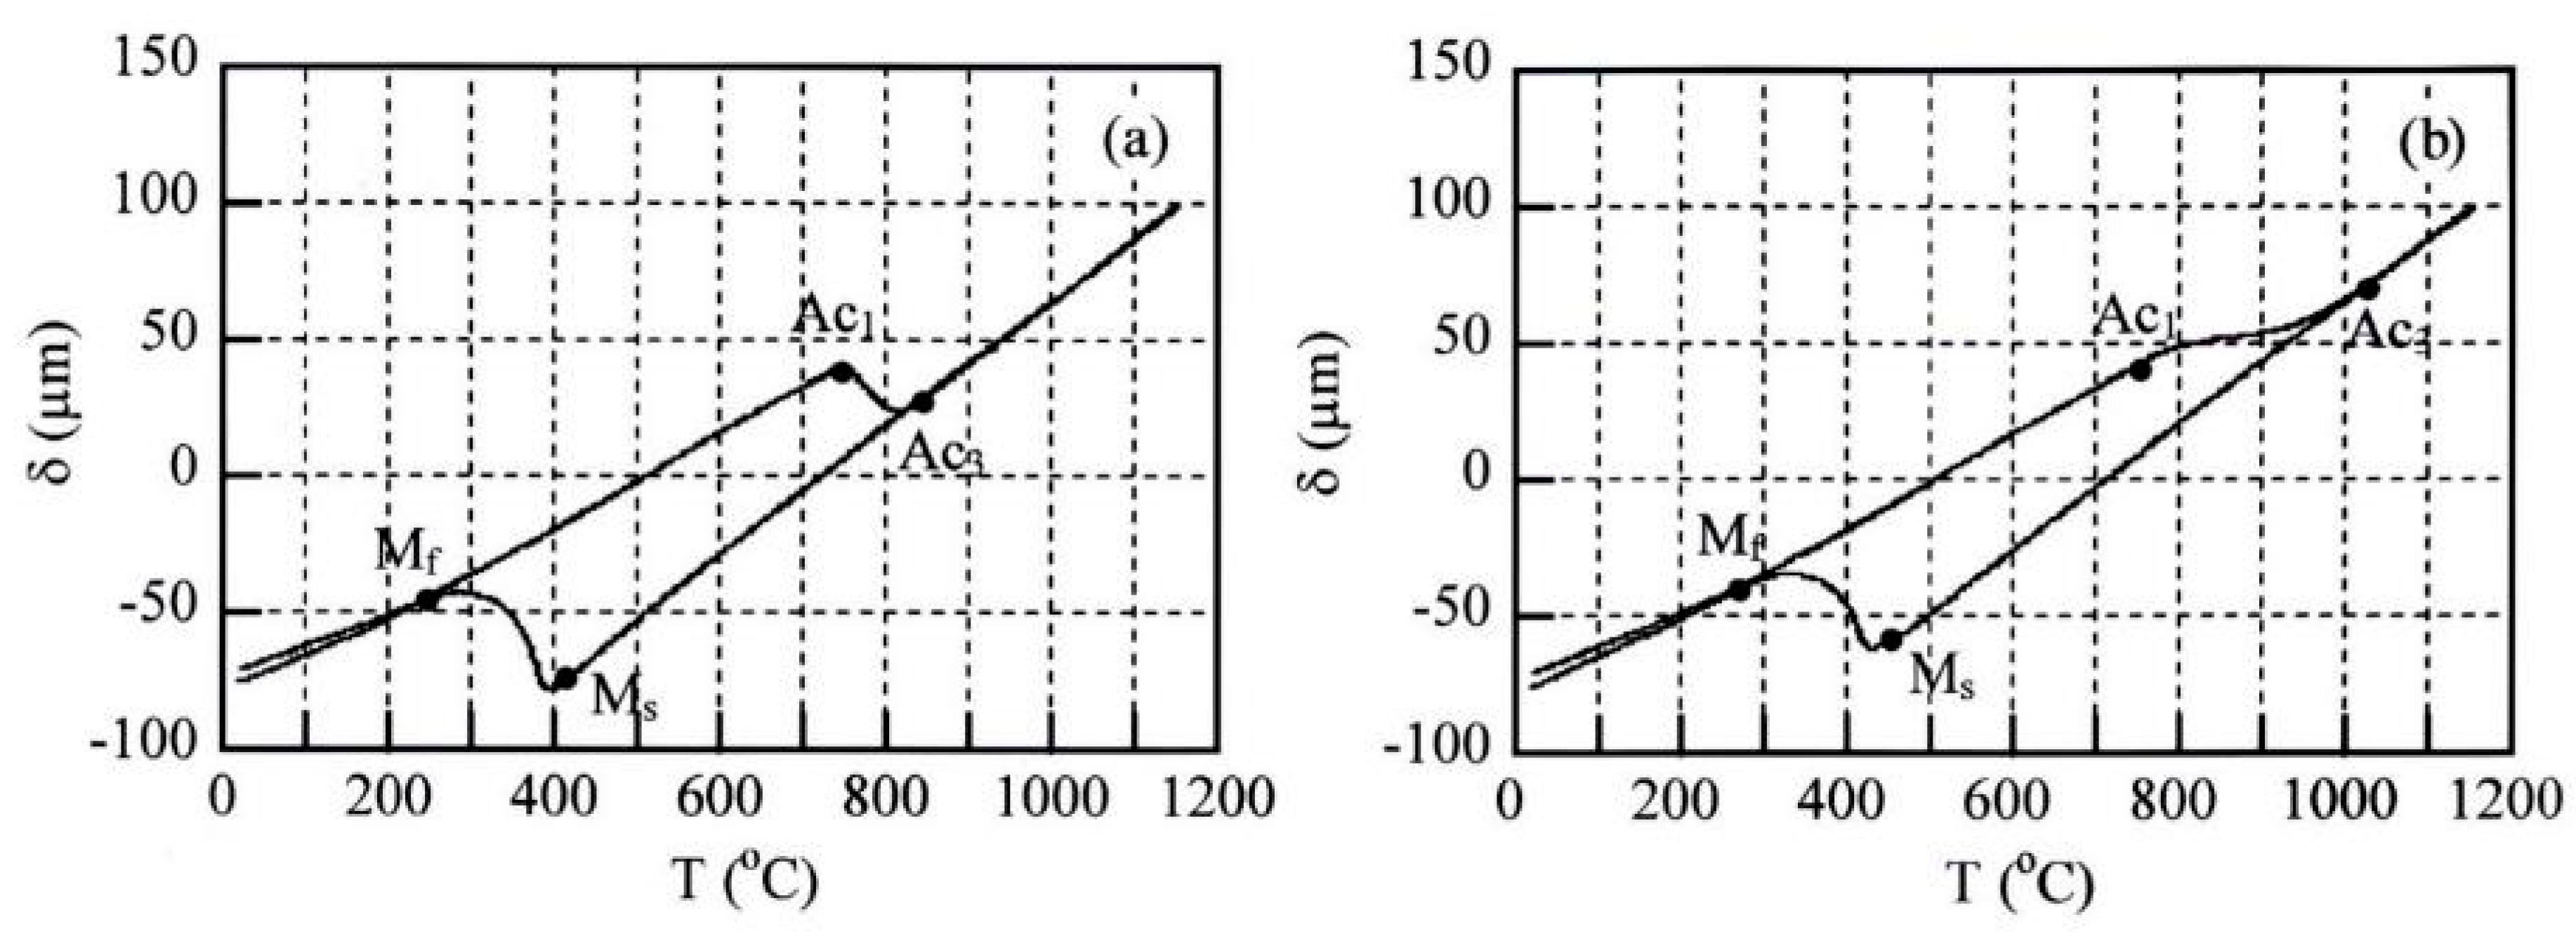
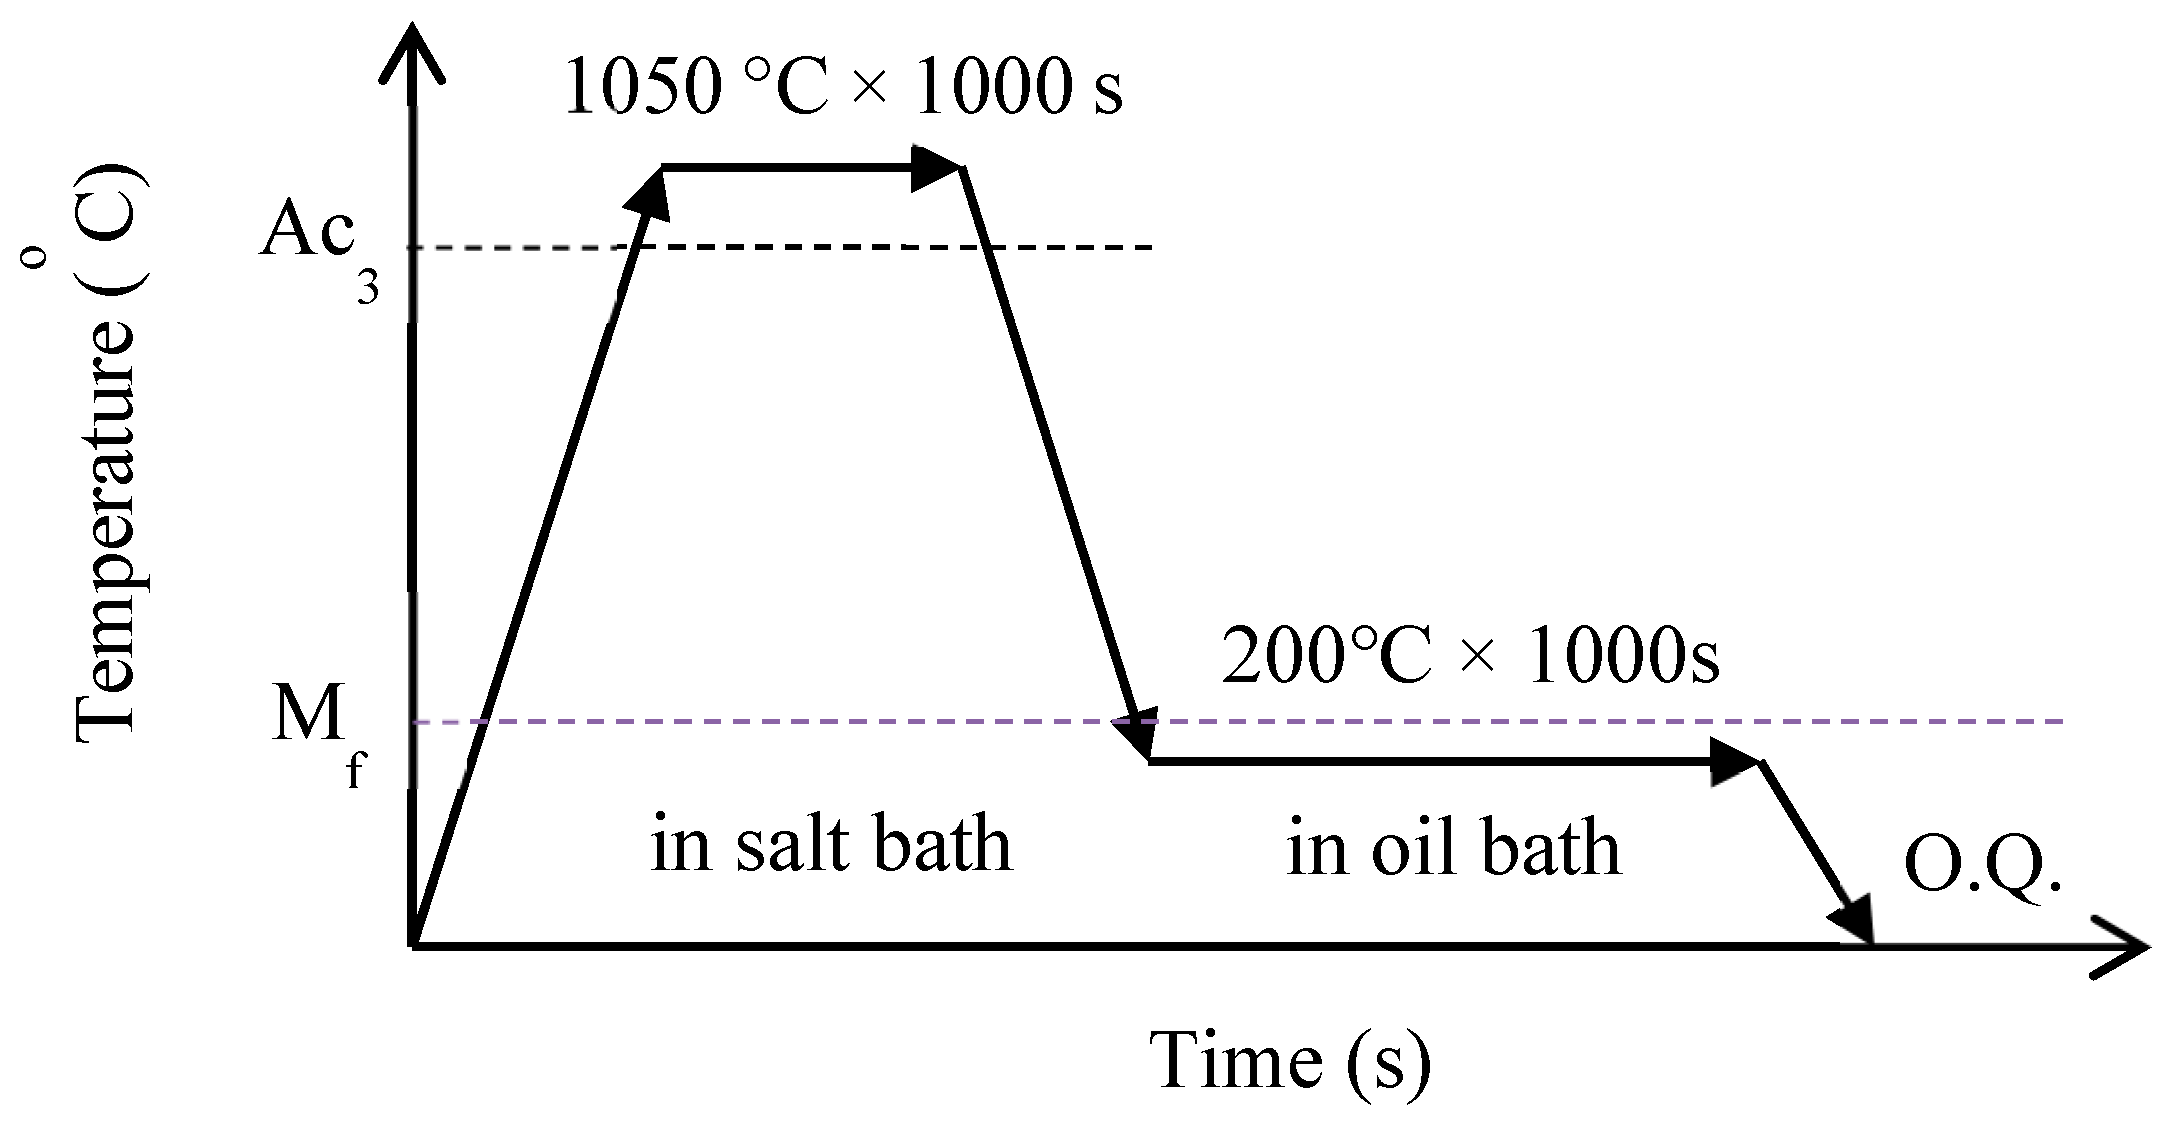
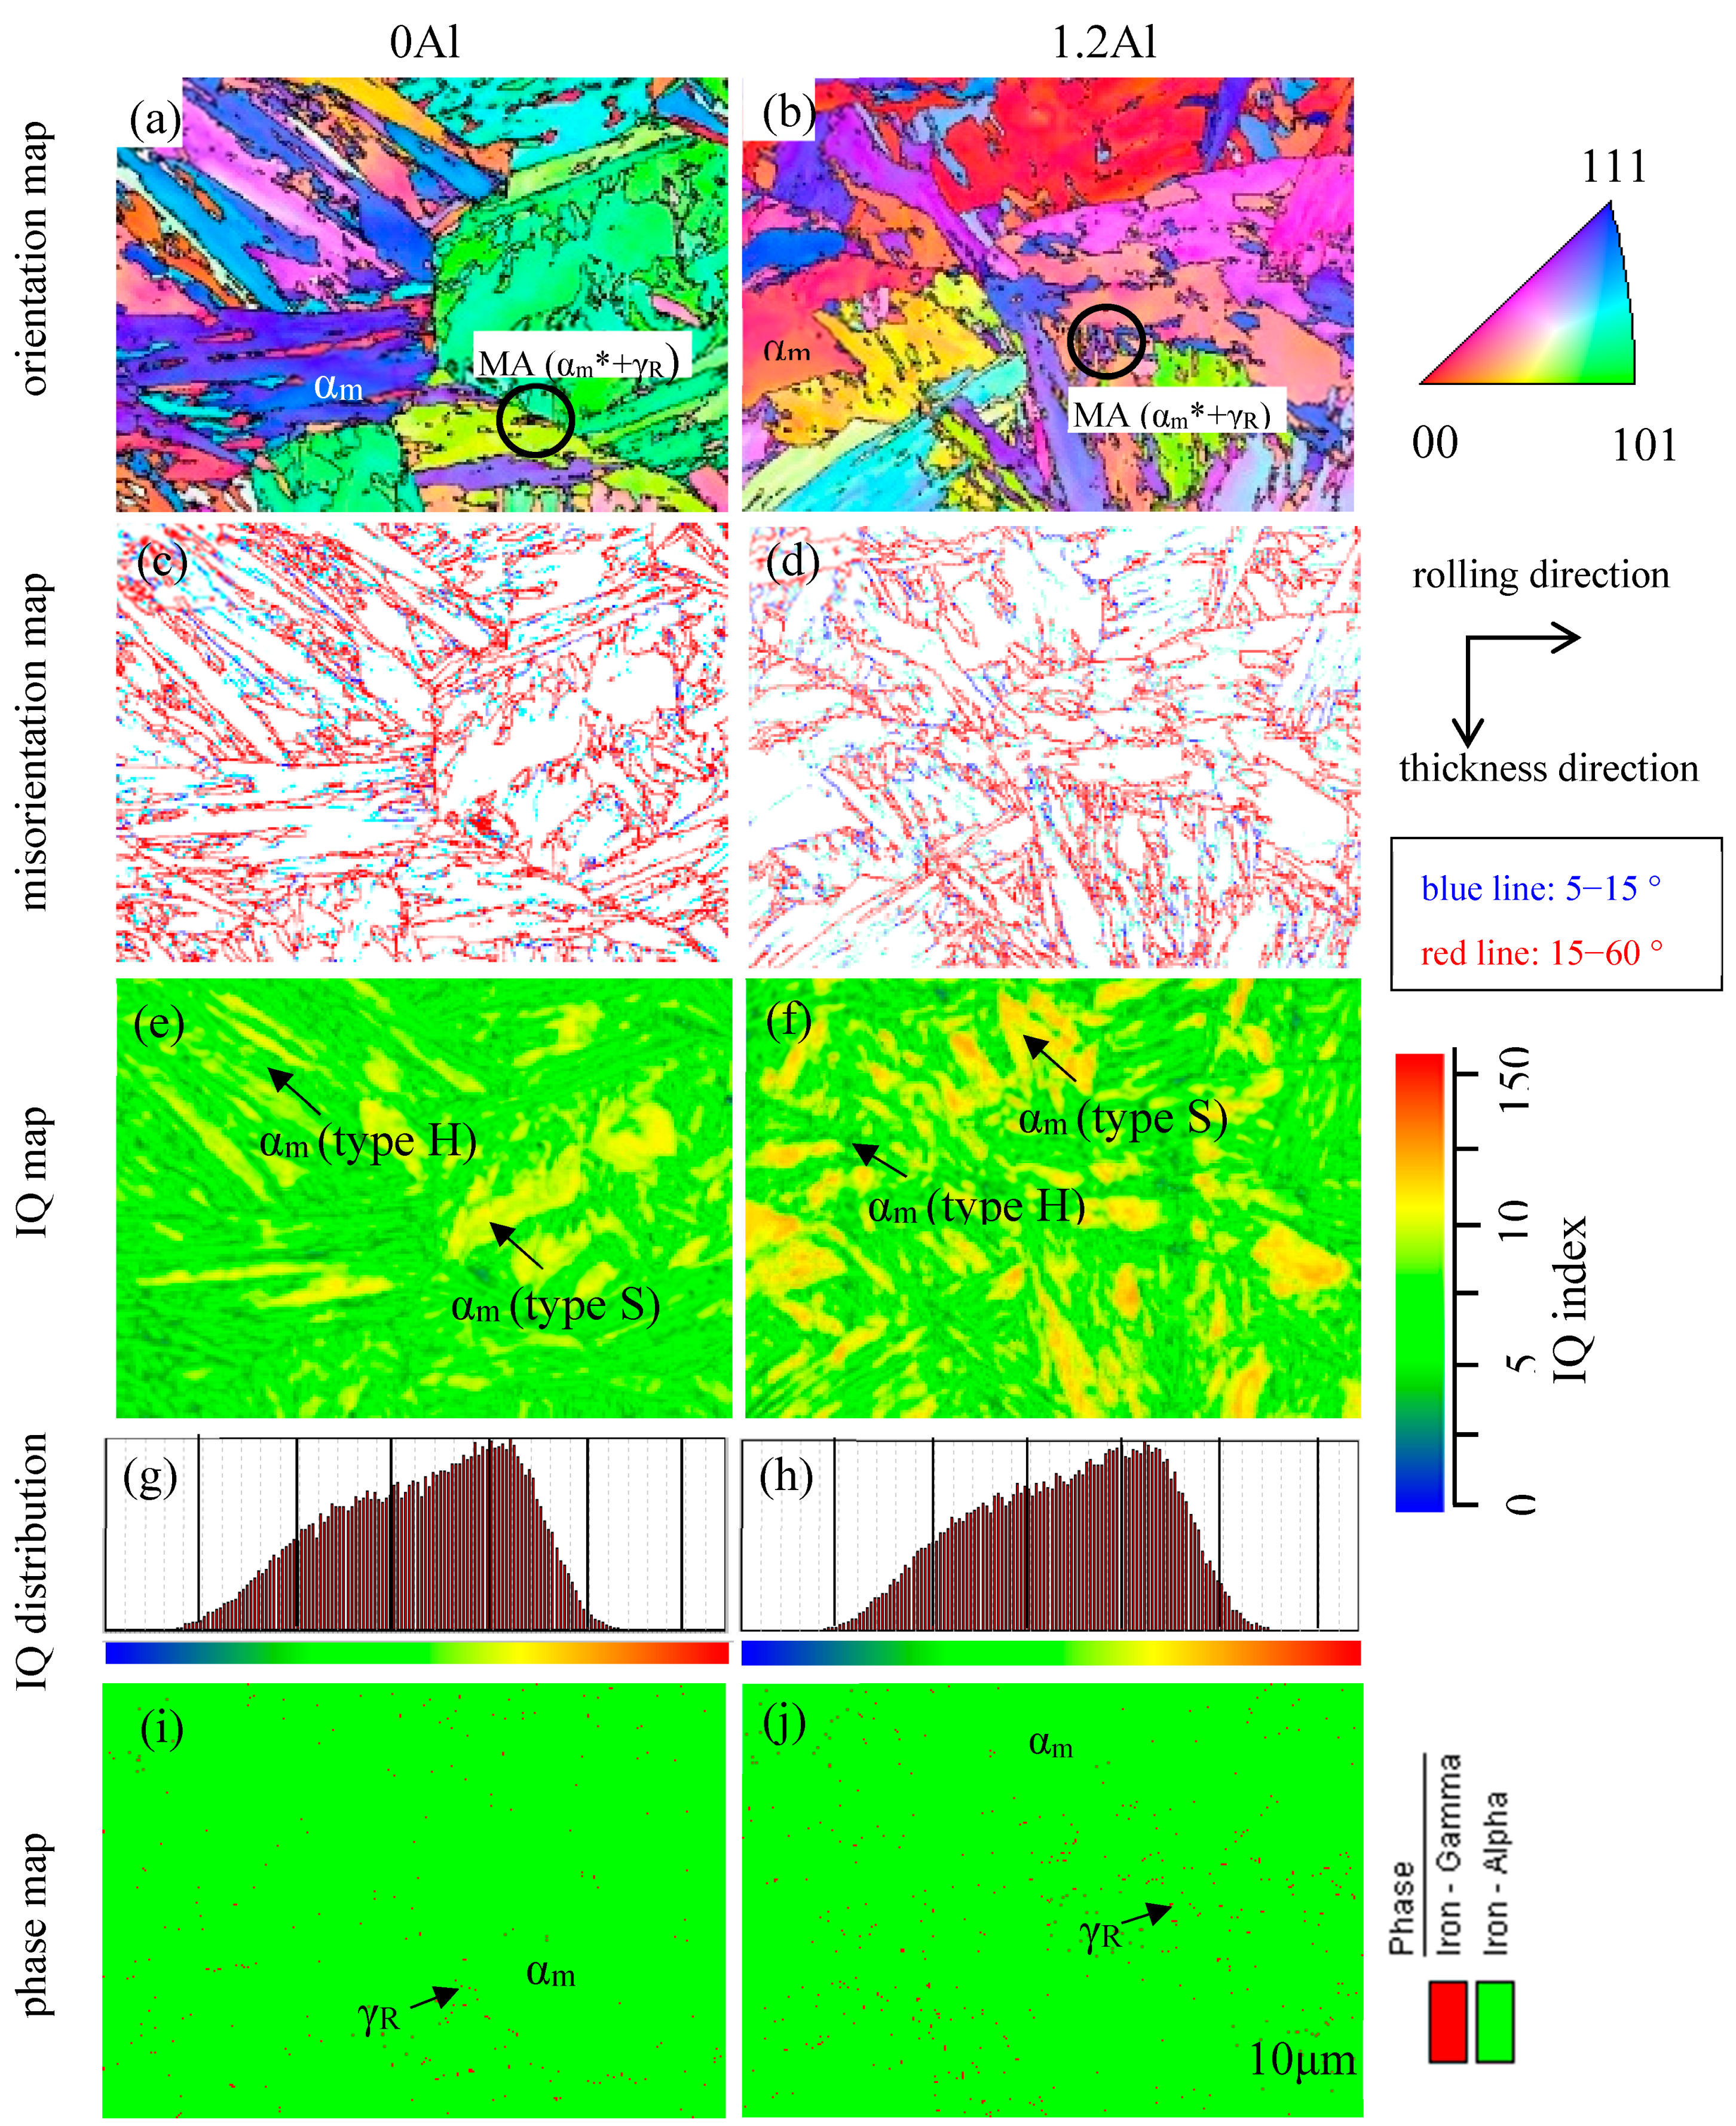
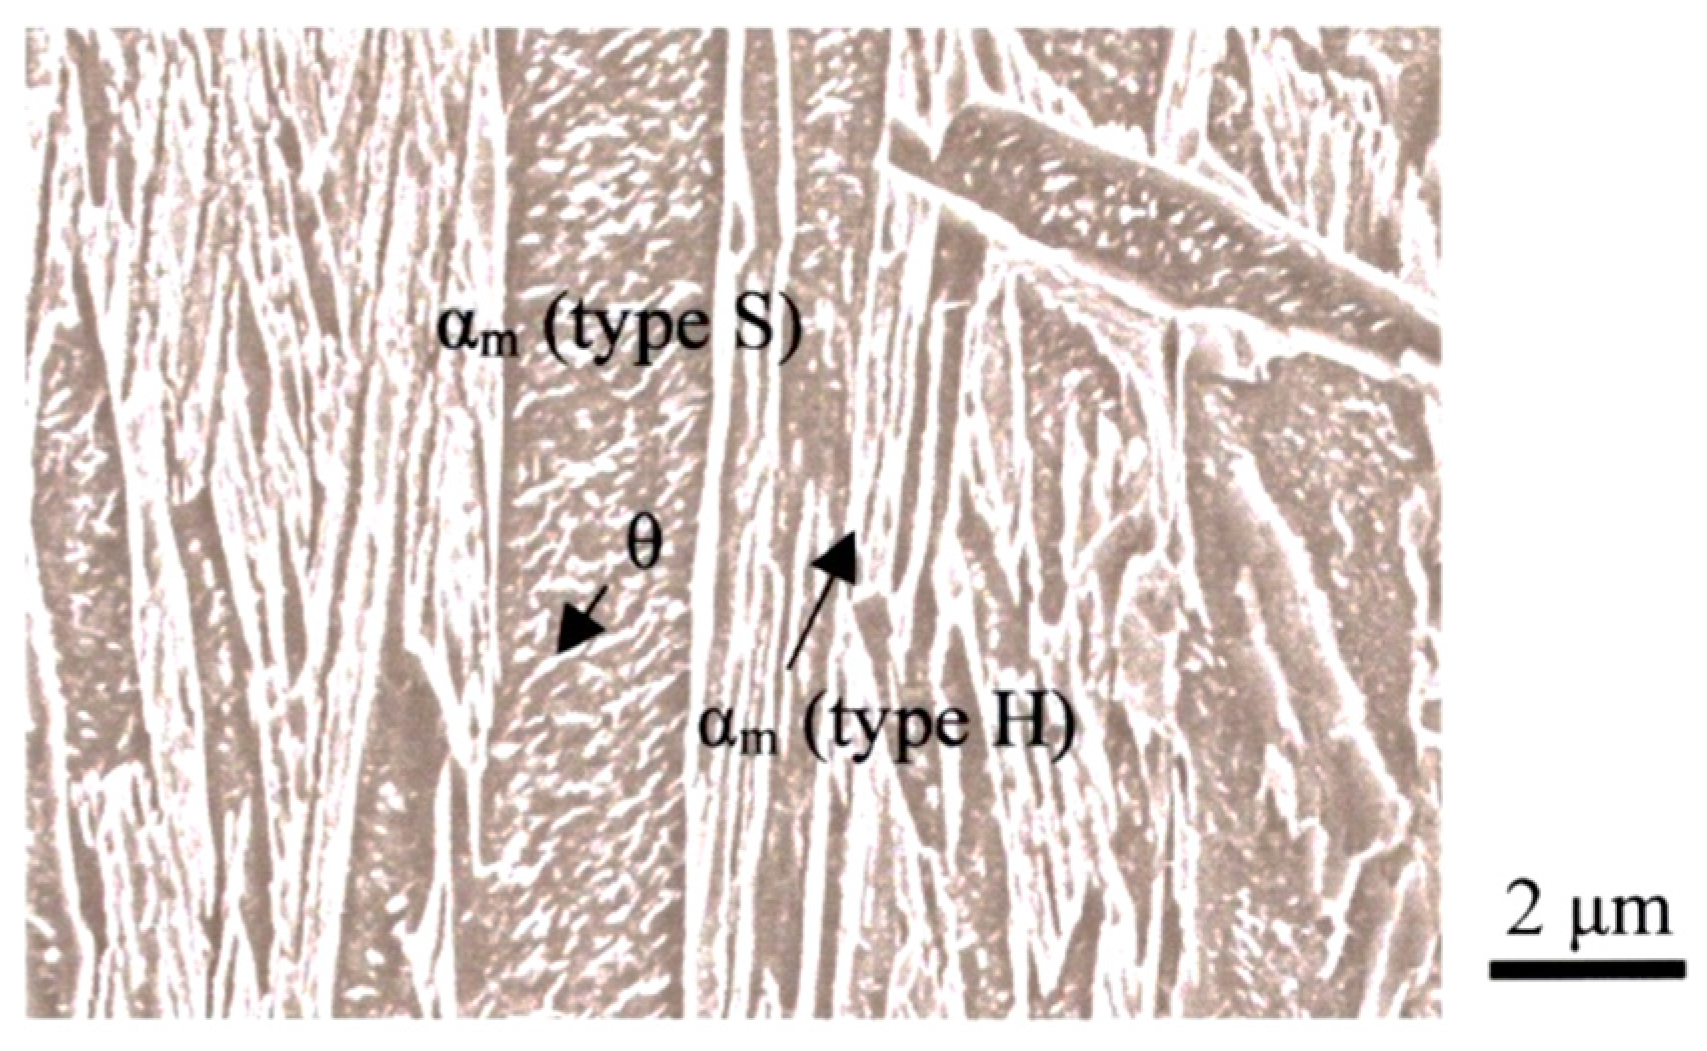

| Steel | C | Si | Mn | Cr | Mo | Al | Nb | Ti | B | N | Ac3 | Ac1 | Ms | Mf | ||
|---|---|---|---|---|---|---|---|---|---|---|---|---|---|---|---|---|
| Si-Al | 0Al | TM | 0.21 | 1.50 | 1.24 | 0.20 | - | 0.022 | - | 0.003 | 0.0028 | 0.0019 | 841 | 734 | 411 | 242 |
| 1.2Al | 0.20 | 0.20 | 1.24 | 0.20 | - | 1.220 | - | 0.005 | 0.0026 | 0.0014 | 1023 | 763 | 454 | 275 | ||
| Cr-Mo | 0Cr | TM & TBF | 0.20 | 1.50 | 1.51 | 0 | 0 | 0.044 | 0.05 | - | - | 0.0013 | - | - | 409 | 289 |
| 0.5Cr | 0.21 | 1.49 | 1.50 | 0.50 | 0 | 0.040 | 0.05 | - | - | 0.0012 | - | - | 408 | 292 | ||
| 1.0Cr | 0.20 | 1.49 | 1.50 | 1.00 | 0 | 0.040 | 0.05 | - | - | 0.0012 | - | - | 406 | 261 | ||
| 0.2Mo | 0.18 | 1.48 | 1.49 | 1.02 | 0.20 | 0.043 | 0.05 | - | - | 0.0010 | - | - | 392 | 258 | ||
| Al-Nb | 0Al | TM & TBF | 0.19 | 1.54 | 1.51 | - | - | 0.04 | 0 | - | - | 0.0017 | - | - | 424 | - |
| 0.5Al | 0.20 | 0.99 | 1.51 | - | - | 0.49 | 0 | - | - | 0.0022 | - | - | 434 | - | ||
| 0.5Al-0.05Nb | 0.20 | 0.99 | 1.48 | - | - | 0.48 | 0.05 | - | - | 0.0008 | - | - | 434 | - | ||
| MMn | 1.5Mn | D- & M-type | 0.20 | 1.49 | 1.50 | - | - | 0.035 | - | - | - | 0.0038 | 847 | 719 | 420 | 300 |
| 3Mn | 0.20 | 1.52 | 2.98 | - | - | 0.037 | - | - | - | 0.0034 | 797 | 689 | 363 | 220 | ||
| 5Mn | 0.21 | 1.50 | 4.94 | - | - | 0.031 | - | - | - | 0.0020 | 741 | 657 | 282 | 150 | ||
| SCM420 | Q&T | 0.21 | 0.21 | 0.77 | 1.02 | 0.18 | - | - | - | - | - | - | - | - | - | |
| steel | fγ0 | Cγ0 | fγ0× Cγ0 | k | fMA | fθ | d |
|---|---|---|---|---|---|---|---|
| 0Al | 4.3 | 0.36 | 0.015 | 11.0 | 14.4 | 0.96 | 32.4 |
| 1.2Al | 3.5 | 0.54 | 0.019 | 10.5 | 14.0 | 1.06 | 32.2 |
| steel | HV | YS | TS | UEl | TEl | RA | Ev | DBTT | LC |
|---|---|---|---|---|---|---|---|---|---|
| 0Al | 473 | 1008 | 1435 | 5.2 | 8.1 | 53.0 | 102.9 | − 94 | 10.0 |
| 1.2Al | 428 | 985 | 1300 | 4.1 | 7.0 | 59.9 | 106.1 | − 85 | 16.4 |
Disclaimer/Publisher’s Note: The statements, opinions and data contained in all publications are solely those of the individual author(s) and contributor(s) and not of MDPI and/or the editor(s). MDPI and/or the editor(s) disclaim responsibility for any injury to people or property resulting from any ideas, methods, instructions or products referred to in the content. |
© 2023 by the authors. Licensee MDPI, Basel, Switzerland. This article is an open access article distributed under the terms and conditions of the Creative Commons Attribution (CC BY) license (http://creativecommons.org/licenses/by/4.0/).


