Submitted:
12 June 2023
Posted:
13 June 2023
You are already at the latest version
Abstract
Keywords:
1. Introduction
2. Materials and Methods
2.1. Materials
2.2. Preparation of nickel cobalt carbonate hydroxide (NiCoCH) and iron nickel cobalt carbonate hydroxide (FexNi1–x)CoCH-(y) precursors
2.3. Preparation of iron nickel cobalt sulfides, selenide, and sulfoselenide
2.4. Material characterization
2.5. Electrochemical measurements
3. Result and Discussion
3.1. Synthesis and analysis
3.3. Oxygen evolution reaction performance
4. Conclusions
Supplementary Materials
Author Contributions
Funding
Institutional Review Board Statement
Informed Consent Statement
Data Availability Statement
Acknowledgments
Conflicts of Interest
Sample Availability
References
- Conti, J.; Holtberg, P.; Diefenderfer, J.; LaRose, A.; Turnure, J.T.; Westfall, L. International Energy Outlook 2016 With Projections to 2040; 2016; p. DOE/EIA--0484(2016), 1296780.
- Wu, D.; Kusada, K.; Yoshioka, S.; Yamamoto, T.; Toriyama, T.; Matsumura, S.; Chen, Y.; Seo, O.; Kim, J.; Song, C.; et al. Efficient Overall Water Splitting in Acid with Anisotropic Metal Nanosheets. Nat. Commun. 2021, 12, 1145. [Google Scholar] [CrossRef]
- Huang, W.; Zhang, J.; Liu, D.; Xu, W.; Wang, Y.; Yao, J.; Tan, H.T.; Dinh, K.N.; Wu, C.; Kuang, M.; et al. Tuning the Electronic Structures of Multimetal Oxide Nanoplates to Realize Favorable Adsorption Energies of Oxygenated Intermediates. ACS Nano 2020, 14, 17640–17651. [Google Scholar] [CrossRef]
- Jiao, Y.; Zheng, Y.; Jaroniec, M.; Qiao, S.Z. Design of Electrocatalysts for Oxygen- and Hydrogen-Involving Energy Conversion Reactions. Chem. Soc. Rev. 2015, 44, 2060–2086. [Google Scholar] [CrossRef]
- Du, P.; Eisenberg, R. Catalysts Made of Earth-Abundant Elements (Co, Ni, Fe) for Water Splitting: Recent Progress and Future Challenges. Energy Environ. Sci. 2012, 5, 6012. [Google Scholar] [CrossRef]
- Yu, Y.; Li, P.; Wang, X.; Gao, W.; Shen, Z.; Zhu, Y.; Yang, S.; Song, W.; Ding, K. Vanadium Nanobelts Coated Nickel Foam 3D Bifunctional Electrode with Excellent Catalytic Activity and Stability for Water Electrolysis. Nanoscale 2016, 8, 10731–10738. [Google Scholar] [CrossRef] [PubMed]
- Sondermann, L.; Jiang, W.; Shviro, M.; Spieß, A.; Woschko, D.; Rademacher, L.; Janiak, C. Nickel-Based Metal-Organic Frameworks as Electrocatalysts for the Oxygen Evolution Reaction (OER). Molecules 2022, 27, 1241. [Google Scholar] [CrossRef] [PubMed]
- Öztürk, S.; Moon, G.; Spieß, A.; Budiyanto, E.; Roitsch, S.; Tüysüz, H.; Janiak, C. A Highly-Efficient Oxygen Evolution Electrocatalyst Derived from a Metal-Organic Framework and Ketjenblack Carbon Material. ChemPlusChem 2021, 86, 1106–1115. [Google Scholar] [CrossRef] [PubMed]
- Wei, C.; Rao, R.R.; Peng, J.; Huang, B.; Stephens, I.E.L.; Risch, M.; Xu, Z.J.; Shao-Horn, Y. Recommended Practices and Benchmark Activity for Hydrogen and Oxygen Electrocatalysis in Water Splitting and Fuel Cells. Adv. Mater. 2019, 31, 1806296. [Google Scholar] [CrossRef] [PubMed]
- Kong, D.; Cha, J.J.; Wang, H.; Lee, H.R.; Cui, Y. First-Row Transition Metal Dichalcogenide Catalysts for Hydrogen Evolution Reaction. Energy Environ. Sci. 2013, 6, 3553. [Google Scholar] [CrossRef]
- Qu, M.; Jiang, Y.; Yang, M.; Liu, S.; Guo, Q.; Shen, W.; Li, M.; He, R. Regulating Electron Density of NiFe-P Nanosheets Electrocatalysts by a Trifle of Ru for High-Efficient Overall Water Splitting. Appl. Catal. B 2020, 263, 118324. [Google Scholar] [CrossRef]
- Jiang, F.; Choy, W.C.H.; Li, X.; Zhang, D.; Cheng, J. Post-Treatment-Free Solution-Processed Non-Stoichiometric NiOx Nanoparticles for Efficient Hole-Transport Layers of Organic Optoelectronic Devices. Adv. Mater. 2015, 27, 2930–2937. [Google Scholar] [CrossRef] [PubMed]
- Chen, Z.; Deng, W.; Li, D.; Gai, Y.; Xie, W.; Hu, X.; Han, S.; Xu, N.; Qiao, S.; Yu, J.; et al. Construction of CoNiSSe-g-C3N4 Nanosheets with High Exposed Conductive Interface for Boosting Oxygen Evolution Reaction. J. Alloys Compd. 2021, 887, 161346. [Google Scholar] [CrossRef]
- Wang, N.; Cao, Z.; Kong, X.; Liang, J.; Zhang, Q.; Zheng, L.; Wei, C.; Chen, X.; Zhao, Y.; Cavallo, L.; et al. Activity Enhancement via Borate Incorporation into a NiFe (Oxy)Hydroxide Catalyst for Electrocatalytic Oxygen Evolution. J. Mater. Chem. A 2018, 6, 16959–16964. [Google Scholar] [CrossRef]
- Zhang, X.; Liang, Y. Nickel Hydr(Oxy)Oxide Nanoparticles on Metallic MoS2 Nanosheets: A Synergistic Electrocatalyst for Hydrogen Evolution Reaction. Adv. Sci. 2018, 5, 1700644. [Google Scholar] [CrossRef] [PubMed]
- Subbaraman, R.; Tripkovic, D.; Chang, K.-C.; Strmcnik, D.; Paulikas, A.P.; Hirunsit, P.; Chan, M.; Greeley, J.; Stamenkovic, V.; Markovic, N.M. Trends in Activity for the Water Electrolyser Reactions on 3d M(Ni,Co,Fe,Mn) Hydr(Oxy)Oxide Catalysts. Nat. Mater 2012, 11, 550–557. [Google Scholar] [CrossRef] [PubMed]
- Denny, S.R.; Tackett, B.M.; Tian, D.; Sasaki, K.; Chen, J.G. Exploring Electrocatalytic Stability and Activity of Unmodified and Platinum-Modified Tungsten and Niobium Nitrides. Int. J. Hydrog. Energy 2020, 45, 22883–22892. [Google Scholar] [CrossRef]
- Wang, C.; Chen, W.; Yuan, D.; Qian, S.; Cai, D.; Jiang, J.; Zhang, S. Tailoring the Nanostructure and Electronic Configuration of Metal Phosphides for Efficient Electrocatalytic Oxygen Evolution Reactions. Nano Energy 2020, 69, 104453. [Google Scholar] [CrossRef]
- Fu, G.; Lee, J.-M. Ternary Metal Sulfides for Electrocatalytic Energy Conversion. J. Mater. Chem. A 2019, 7, 9386–9405. [Google Scholar] [CrossRef]
- Chen, H.; Jiang, J.; Zhang, L.; Wan, H.; Qi, T.; Xia, D. Highly Conductive NiCo2S4 Urchin-like Nanostructures for High-Rate Pseudocapacitors. Nanoscale 2013, 5, 8879–8883. [Google Scholar] [CrossRef]
- Shen, L.; Yu, L.; Wu, H.B.; Yu, X.-Y.; Zhang, X.; Lou, X.W. Formation of Nickel Cobalt Sulfide Ball-in-Ball Hollow Spheres with Enhanced Electrochemical Pseudocapacitive Properties. Nat. Commun 2015, 6, 6694. [Google Scholar] [CrossRef]
- Kulkarni, P.; Nataraj, S.K.; Balakrishna, R.G.; Nagaraju, D.H.; Reddy, M.V. Nanostructured Binary and Ternary Metal Sulfides: Synthesis Methods and Their Application in Energy Conversion and Storage Devices. J. Mater. Chem. A 2017, 5, 22040–22094. [Google Scholar] [CrossRef]
- Liu, W.; Zhang, J.; Bai, Z.; Jiang, G.; Li, M.; Feng, K.; Yang, L.; Ding, Y.; Yu, T.; Chen, Z.; et al. Controllable Urchin-Like NiCo2S4 Microsphere Synergized with Sulfur-Doped Graphene as Bifunctional Catalyst for Superior Rechargeable Zn-Air Battery. Adv. Funct. Mater. 2018, 28, 1706675. [Google Scholar] [CrossRef]
- Zhu, W.; Ren, M.; Hu, N.; Zhang, W.; Luo, Z.; Wang, R.; Wang, J.; Huang, L.; Suo, Y.; Wang, J. Traditional NiCo2S4 Phase with Porous Nanosheets Array Topology on Carbon Cloth: A Flexible, Versatile and Fabulous Electrocatalyst for Overall Water and Urea Electrolysis. ACS. Sustain. Chem. Eng. 2018, 6, 5011–5020. [Google Scholar] [CrossRef]
- Feng, X.; Jiao, Q.; Liu, T.; Li, Q.; Yin, M.; Zhao, Y.; Li, H.; Feng, C.; Zhou, W. Facile Synthesis of Co9S8 Hollow Spheres as a High-Performance Electrocatalyst for the Oxygen Evolution Reaction. ACS Sustain. Chem. Eng. 2018, 6, 1863–1871. [Google Scholar] [CrossRef]
- Chauhan, M.; Reddy, K.P.; Gopinath, C.S.; Deka, S. Copper Cobalt Sulfide Nanosheets Realizing a Promising Electrocatalytic Oxygen Evolution Reaction. ACS Catal. 2017, 7, 5871–5879. [Google Scholar] [CrossRef]
- Li, X.; Kou, Z.; Xi, S.; Zang, W.; Yang, T.; Zhang, L.; Wang, J. Porous NiCo2S4/FeOOH Nanowire Arrays with Rich Sulfide/Hydroxide Interfaces Enable High OER Activity. Nano Energy 2020, 78, 105230. [Google Scholar] [CrossRef]
- Xu, X.; Liu, X.; Zhong, W.; Zhang, L.; Liu, G.; Du, Y. Nanostructured NiCo2S4@NiCo2O4-Reduced Graphene Oxide as an Efficient Hydrogen Evolution Electrocatalyst in Alkaline Electrolyte. J. Colloid Interface Sci. 2021, 601, 570–580. [Google Scholar] [CrossRef]
- Li, H.; Chen, L.; Jin, P.; Li, Y.; Pang, J.; Hou, J.; Peng, S.; Wang, G.; Shi, Y. NiCo2S4 Microspheres Grown on N, S Co-Doped Reduced Graphene Oxide as an Efficient Bifunctional Electrocatalyst for Overall Water Splitting in Alkaline and Neutral PH. Nano Res. 2022, 15, 950–958. [Google Scholar] [CrossRef]
- Liu, Q.; Jin, J.; Zhang, J. NiCo2S4@graphene as a Bifunctional Electrocatalyst for Oxygen Reduction and Evolution Reactions. ACS Appl. Mater. Interfaces 2013, 5, 5002–5008. [Google Scholar] [CrossRef]
- Fereja, S.L.; Li, P.; Zhang, Z.; Guo, J.; Fang, Z.; Li, Z.; Chen, W. Construction of NiCo2S4/Fe2O3 Hybrid Nanostructure as a Highly Efficient Electrocatalyst for the Oxygen Evolution Reaction. Electrochim. Acta 2022, 405, 139793. [Google Scholar] [CrossRef]
- Liu, J.; Wang, J.; Zhang, B.; Ruan, Y.; Lv, L.; Ji, X.; Xu, K.; Miao, L.; Jiang, J. Hierarchical NiCo2S4@NiFe LDH Heterostructures Supported on Nickel Foam for Enhanced Overall-Water-Splitting Activity. ACS Appl. Mater. Interfaces 2017, 9, 15364–15372. [Google Scholar] [CrossRef]
- Huang, Y.; Ge, S.; Chen, X.; Xiang, Z.; Zhang, X.; Zhang, R.; Cui, Y. Hierarchical FeCo2S4@FeNi2S4 Core/Shell Nanostructures on Ni Foam for High-Performance Supercapacitors. Chem. Eur. J. 2019, 25, 14117–14122. [Google Scholar] [CrossRef]
- Govindasamy, M.; Shanthi, S.; Elaiyappillai, E.; Wang, S.-F.; Johnson, P.M.; Ikeda, H.; Hayakawa, Y.; Ponnusamy, S.; Muthamizhchelvan, C. Fabrication of Hierarchical NiCo2S4@CoS2 Nanostructures on Highly Conductive Flexible Carbon Cloth Substrate as a Hybrid Electrode Material for Supercapacitors with Enhanced Electrochemical Performance. Electrochim. Acta 2019, 293, 328–337. [Google Scholar] [CrossRef]
- Yu, X.; Xu, S.; Liu, X.; Cheng, X.; Du, Y.; Wu, Q. Mn-Doped NiCo2S4 Nanosheet Array as an Efficient and Durable Electrocatalyst for Oxygen Evolution Reaction. J. Alloys Compd. 2021, 878, 160388. [Google Scholar] [CrossRef]
- Lai, F.; Feng, J.; Heil, T.; Tian, Z.; Schmidt, J.; Wang, G.-C.; Oschatz, M. Partially Delocalized Charge in Fe-Doped NiCo2S4 Nanosheet–Mesoporous Carbon-Composites for High-Voltage Supercapacitors. J. Mater. Chem. A 2019, 7, 19342–19347. [Google Scholar] [CrossRef]
- Wu, Y.; Liu, X.; Han, D.; Song, X.; Shi, L.; Song, Y.; Niu, S.; Xie, Y.; Cai, J.; Wu, S.; et al. Electron Density Modulation of NiCo2S4 Nanowires by Nitrogen Incorporation for Highly Efficient Hydrogen Evolution Catalysis. Nat. Commun 2018, 9, 1425. [Google Scholar] [CrossRef]
- Min, K.; Yoo, R.; Kim, S.; Kim, H.; Shim, S.E.; Lim, D.; Baeck, S.-H. Facile Synthesis of P-Doped NiCo2S4 Nanoneedles Supported on Ni Foam as Highly Efficient Electrocatalysts for Alkaline Oxygen Evolution Reaction. Electrochim. Acta 2021, 396, 139236. [Google Scholar] [CrossRef]
- Liang, T.; Lenus, S.; Liu, Y.; Chen, Y.; Sakthivel, T.; Chen, F.; Ma, F.; Dai, Z. Interface and M3+/M2+ Valence Dual-Engineering on Nickel Cobalt Sulfoselenide/Black Phosphorus Heterostructure for Efficient Water Splitting Electrocatalysis. Energy Environ. Mater. 2023, 6. [Google Scholar] [CrossRef]
- Gong, Q.; Cheng, L.; Liu, C.; Zhang, M.; Feng, Q.; Ye, H.; Zeng, M.; Xie, L.; Liu, Z.; Li, Y. Ultrathin MoS2(1– x)Se2x Alloy Nanoflakes For Electrocatalytic Hydrogen Evolution Reaction. ACS Catal. 2015, 5, 2213–2219. [Google Scholar] [CrossRef]
- Zhou, Y.; Wang, Y.; Zhao, H.; Su, J.; Zhang, H.; Wang, Y. Investigation of Anion Doping Effect to Boost Overall Water Splitting. J. Catal. 2020, 381, 84–95. [Google Scholar] [CrossRef]
- Liu, R.; Xu, S.; Shao, X.; Wen, Y.; Shi, X.; Huang, L.; Hong, M.; Hu, J.; Yang, Z. Defect-Engineered NiCo-S Composite as a Bifunctional Electrode for High-Performance Supercapacitor and Electrocatalysis. ACS Appl. Mater. Interfaces 2021, 13, 47717–47727. [Google Scholar] [CrossRef]
- Tang, F.; Guo, S.; Sun, Y.; Lin, X.; Qiu, J.; Cao, A. Facile Synthesis of Fe-Doped CoO Nanotubes as High-Efficient Electrocatalysts for Oxygen Evolution Reaction. Small Struct. 2022, 3, 2100211. [Google Scholar] [CrossRef]
- Deng, W.; Xie, W.; Li, D.; Gai, Y.; Chen, Z.; Yu, J.; Yang, R.; Bao, X.; Jiang, F. Controllable Tuning of Polymetallic Co-Ni-Ru-S-Se Ultrathin Nanosheets to Boost Electrocatalytic Oxygen Evolution. NPG Asia Mater. 2022, 14, 25. [Google Scholar] [CrossRef]
- Cai, D.; Wang, D.; Wang, C.; Liu, B.; Wang, L.; Liu, Y.; Li, Q.; Wang, T. Construction of Desirable NiCo2S4 Nanotube Arrays on Nickel Foam Substrate for Pseudocapacitors with Enhanced Performance. Electrochim. Acta 2015, 151, 35–41. [Google Scholar] [CrossRef]
- Song, Y.; Wang, Z.; Yan, Y.; Zhao, W.; Bakenov, Z. NiCo2S4 Nanoparticles Embedded in Nitrogen-Doped Carbon Nanotubes Networks as Effective Sulfur Carriers for Advanced Lithium–Sulfur Batteries. Microporous Mesoporous Mater. 2021, 316, 110924. [Google Scholar] [CrossRef]
- Huang, Z.; He, W.; Shen, H.; Han, G.; Wang, H.; Su, P.; Song, J.; Yang, Y. NiCo2S4 Microflowers as Peroxidase Mimic: A Multi-Functional Platform for Colorimetric Detection of Glucose and Evaluation of Antioxidant Behavior. Talanta 2021, 230, 122337. [Google Scholar] [CrossRef]
- Tang, J.; Huang, W.; Lv, X.; Shi, Q. Improved Chemical Precipitation Prepared Rapidly NiCo2S4 with High Specific Capacitance for Supercapacitors. Nanotechnology 2021, 32, 085604. [Google Scholar] [CrossRef]
- Guo, Z.; Diao, Y.; Han, X.; Liu, Z.; Ni, Y.; Zhang, L. Mesoporous NiCo2Se4 Tube as an Efficient Electrode Material with Enhanced Performance for Asymmetric Supercapacitor Applications. CrystEngComm 2021, 23, 2099–2112. [Google Scholar] [CrossRef]
- Cai, P.; Huang, J.; Chen, J.; Wen, Z. Oxygen-Containing Amorphous Cobalt Sulfide Porous Nanocubes as High-Activity Electrocatalysts for the Oxygen Evolution Reaction in an Alkaline/Neutral Medium. Angew. Chem. 2017, 129, 4936–4939. [Google Scholar] [CrossRef]
- Chen, N.; Du, Y.-X.; Zhang, G.; Lu, W.-T.; Cao, F.-F. Amorphous Nickel Sulfoselenide for Efficient Electrochemical Urea-Assisted Hydrogen Production in Alkaline Media. Nano Energy 2021, 81, 105605. [Google Scholar] [CrossRef]
- Meng, A.; Yuan, X.; Shen, T.; Zhao, J.; Song, G.; Lin, Y.; Li, Z. Amorphous Nickel Sulfide Nanoparticles Anchored on N-Doped Graphene Nanotubes with Superior Properties for High-Performance Supercapacitors and Efficient Oxygen Evolution Reaction. Nanoscale 2020, 12, 4655–4666. [Google Scholar] [CrossRef]
- Wang, H.-Y.; Hsu, Y.-Y.; Chen, R.; Chan, T.-S.; Chen, H.M.; Liu, B. Ni3+ -Induced Formation of Active NiOOH on the Spinel Ni-Co Oxide Surface for Efficient Oxygen Evolution Reaction. Adv. Energy Mater. 2015, 5, 1500091. [Google Scholar] [CrossRef]
- Wang, Q.; Shang, L.; Shi, R.; Zhang, X.; Zhao, Y.; Waterhouse, G.I.N.; Wu, L.-Z.; Tung, C.-H.; Zhang, T. NiFe Layered Double Hydroxide Nanoparticles on Co,N-Codoped Carbon Nanoframes as Efficient Bifunctional Catalysts for Rechargeable Zinc-Air Batteries. Adv. Energy Mater. 2017, 7, 1700467. [Google Scholar] [CrossRef]
- Biesinger, M.C.; Payne, B.P.; Grosvenor, A.P.; Lau, L.W.M.; Gerson, A.R.; Smart, R.St.C. Resolving Surface Chemical States in XPS Analysis of First Row Transition Metals, Oxides and Hydroxides: Cr, Mn, Fe, Co and Ni. Appl. Surf. Sci. 2011, 257, 2717–2730. [Google Scholar] [CrossRef]
- Yamashita, T.; Hayes, P. Analysis of XPS Spectra of Fe2+ and Fe3+ Ions in Oxide Materials. Appl. Surf. Sci. 2008, 254, 2441–2449. [Google Scholar] [CrossRef]
- Yin, L.I.; Yellin, E.; Adler, I. X-Ray Excited LMM Auger Spectra of Copper, Nickel, and Iron. J. Appl. Phys. 1971, 42, 3595–3600. [Google Scholar] [CrossRef]
- He, Y.; Liu, X.; Chen, G.; Pan, J.; Yan, A.; Li, A.; Lu, X.; Tang, D.; Zhang, N.; Qiu, T.; et al. Synthesis of Co(II)-Fe(III) Hydroxide Nanocones with Mixed Octahedral/Tetrahedral Coordination toward Efficient Electrocatalysis. Chem. Mater. 2020, 32, 4232–4240. [Google Scholar] [CrossRef]
- Li, J.; Cui, H.; Du, X.; Zhang, X. The Controlled Synthesis of Nitrogen and Iron Co-Doped Ni3S2@NiP2 Heterostructures for the Oxygen Evolution Reaction and Urea Oxidation Reaction. Dalton Trans. 2022, 51, 2444–2451. [Google Scholar] [CrossRef]
- Huang, H.; Ning, S.; Xie, Y.; He, Z.; Teng, J.; Chen, Z.; Fan, Y.; Shi, J.; Barboiu, M.; Wang, D.; et al. Synergistic Modulation of Electronic Interaction to Enhance Intrinsic Activity and Conductivity of Fe–Co–Ni Hydroxide Nanotube for Highly Efficient Oxygen Evolution Electrocatalyst. Small 2023, 2302272. [Google Scholar] [CrossRef] [PubMed]
- Yang, L.; Qin, H.; Dong, Z.; Wang, T.; Wang, G.; Jiao, L. Metallic S-CoTe with Surface Reconstruction Activated by Electrochemical Oxidation for Oxygen Evolution Catalysis. Small 2021, 17, 2102027. [Google Scholar] [CrossRef] [PubMed]
- Shinagawa, T.; Garcia-Esparza, A.T.; Takanabe, K. Insight on Tafel Slopes from a Microkinetic Analysis of Aqueous Electrocatalysis for Energy Conversion. Sci Rep 2015, 5, 13801. [Google Scholar] [CrossRef] [PubMed]
- Li, G.; Anderson, L.; Chen, Y.; Pan, M.; Abel Chuang, P.-Y. New Insights into Evaluating Catalyst Activity and Stability for Oxygen Evolution Reactions in Alkaline Media. Sustain. Energy Fuels. 2018, 2, 237–251. [Google Scholar] [CrossRef]
- Anantharaj, S.; Sugime, H.; Noda, S. Why Shouldn’t Double-Layer Capacitance (Cdl) Be Always Trusted to Justify Faradaic Electrocatalytic Activity Differences? J. Electroanal. Chem. 2021, 903, 115842. [Google Scholar] [CrossRef]
- Shang, X.; Chen, W.; Jiang, Z.-J.; Song, C.; Jiang, Z. In Situ Growth of SeOx Films on the Surface of Ni–Fe–Selenide Nanosheets as Highly Active and Stable Electrocatalysts for the Oxygen Evolution Reaction. Mater. Adv. 2022, 3, 2546–2557. [Google Scholar] [CrossRef]
- Anantharaj, S.; Kundu, S.; Noda, S. “The Fe Effect”: A Review Unveiling the Critical Roles of Fe in Enhancing OER Activity of Ni and Co Based Catalysts. Nano Energy 2021, 80, 105514. [Google Scholar] [CrossRef]
- Kuai, C.; Xi, C.; Hu, A.; Zhang, Y.; Xu, Z.; Nordlund, D.; Sun, C.-J.; Cadigan, C.A.; Richards, R.M.; Li, L.; et al. Revealing the Dynamics and Roles of Iron Incorporation in Nickel Hydroxide Water Oxidation Catalysts. J. Am. Chem. Soc. 2021, 143, 18519–18526. [Google Scholar] [CrossRef] [PubMed]
- Trotochaud, L.; Young, S.L.; Ranney, J.K.; Boettcher, S.W. Nickel–Iron Oxyhydroxide Oxygen-Evolution Electrocatalysts: The Role of Intentional and Incidental Iron Incorporation. J. Am. Chem. Soc. 2014, 136, 6744–6753. [Google Scholar] [CrossRef] [PubMed]
- Yang, M.; Lu, W.; Jin, R.; Liu, X.-C.; Song, S.; Xing, Y. Superior Oxygen Evolution Reaction Performance of Co3O4/NiCo2O4 /Ni Foam Composite with Hierarchical Structure. ACS Sustain. Chem. Eng. 2019, 14, 12214–12221. [Google Scholar] [CrossRef]
- Chuah, X.-F.; Hsieh, C.-T.; Huang, C.-L.; Senthil Raja, D.; Lin, H.-W.; Lu, S.-Y. In-Situ Grown, Passivator-Modulated Anodization Derived Synergistically Well-Mixed Ni–Fe Oxides from Ni Foam as High-Performance Oxygen Evolution Reaction Electrocatalyst. ACS Appl. Energy Mater. 2019, 2, 743–753. [Google Scholar] [CrossRef]
- Duan, J.-J.; Zhang, R.-L.; Feng, J.-J.; Zhang, L.; Zhang, Q.-L.; Wang, A.-J. Facile Synthesis of Nanoflower-like Phosphorus-Doped Ni3S2/CoFe2O4 Arrays on Nickel Foam as a Superior Electrocatalyst for Efficient Oxygen Evolution Reaction. J. Colloid Interface Sci. 2021, 581, 774–782. [Google Scholar] [CrossRef]
- Xue, Z.; Wang, Y.; Yang, M.; Wang, T.; Zhu, H.; Rui, Y.; Wu, S.; An, W. In-Situ Construction of Electrodeposited Polyaniline/Nickel-Iron Oxyhydroxide Stabilized on Nickel Foam for Efficient Oxygen Evolution Reaction at High Current Densities. International Int. J. Hydrog. 2022, 47, 34025–34035. [Google Scholar] [CrossRef]
- Zhao, T.; Wang, Y.; Chen, X.; Li, Y.; Su, Z.; Zhao, C. Vertical Growth of Porous Perovskite Nanoarrays on Nickel Foam for Efficient Oxygen Evolution Reaction. ACS Sustain. Chem. Eng. 2020, 8, 4863–4870. [Google Scholar] [CrossRef]
- Gao, W.; Ma, F.; Wang, C.; Wen, D. Ce Dopant Significantly Promotes the Catalytic Activity of Ni Foam-Supported Ni3S2 Electrocatalyst for Alkaline Oxygen Evolution Reaction. J. Power Sources 2020, 450, 227654. [Google Scholar] [CrossRef]
- Kim, D.Y.; Lee, H.; Choi, S.R.; Choi, S.; An, W.Y.; Cho, H.-S.; Choi, M.; Park, J.-Y. Synthesis of Hierarchically Porous Ni Foam-Supported Heazlewoodite Ni3S2 Nanorod Electrocatalysts for Highly Efficient Oxygen Evolution Reaction. J. Alloys Compd. 2022, 914, 165305. [Google Scholar] [CrossRef]
- Tao, K.; Gong, Y.; Zhou, Q.; Lin, J. Nickel Sulfide Wrapped by Porous Cobalt Molybdate Nanosheet Arrays Grown on Ni Foam for Oxygen Evolution Reaction and Supercapacitor. Electrochim. Acta 2018, 286, 65–76. [Google Scholar] [CrossRef]
- Sun, Z.; Yuan, M.; Lin, L.; Yang, H.; Li, H.; Sun, G.; Yang, X.; Ma, S. Needle Grass-like Cobalt Hydrogen Phosphate on Ni Foam as an Effective and Stable Electrocatalyst for the Oxygen Evolution Reaction. Chem. Commun. 2019, 55, 9729–9732. [Google Scholar] [CrossRef]
- Li, X.; Han, G.-Q.; Liu, Y.-R.; Dong, B.; Hu, W.-H.; Shang, X.; Chai, Y.-M.; Liu, C.-G. NiSe@NiOOH Core–Shell Hyacinth-like Nanostructures on Nickel Foam Synthesized by in Situ Electrochemical Oxidation as an Efficient Electrocatalyst for the Oxygen Evolution Reaction. ACS Appl. Mater. Interfaces 2016, 8, 20057–20066. [Google Scholar] [CrossRef]
- Zhang, Y.; Guo, P.; Niu, S.; Wu, J.; Wang, W.; Song, B.; Wang, X.; Jiang, Z.; Xu, P. Magnetic Field Enhanced Electrocatalytic Oxygen Evolution of NiFe-LDH/Co3O4 P-n Heterojunction Supported on Nickel Foam. Small Methods 2022, 6, 2200084. [Google Scholar] [CrossRef]
- Lv, Y.; Duan, S.; Zhu, Y.; Yin, P.; Wang, R. Enhanced OER Performances of Au@NiCo2S4 Core-Shell Heterostructure. Nanomater. 2020, 10, 611. [Google Scholar] [CrossRef]
- Feng, X.; Jiao, Q.; Chen, W.; Dang, Y.; Dai, Z.; Suib, S.L.; Zhang, J.; Zhao, Y.; Li, H.; Feng, C. Cactus-like NiCo2S4@NiFe LDH Hollow Spheres as an Effective Oxygen Bifunctional Electrocatalyst in Alkaline Solution. Appl. Catal. B. 2021, 286, 119869. [Google Scholar] [CrossRef]
- He, B.; Song, J.-J.; Li, X.-Y.; Xu, C.-Y.; Li, Y.-B.; Tang, Y.-W.; Hao, Q.-L.; Liu, H.-K.; Su, Z. A Nitrogen-Doped NiCo2S4/CoO Hollow Multi-Layered Heterostructure Microsphere for Efficient Oxygen Evolution in Zn–Air Batteries. Nanoscale 2021, 13, 810–818. [Google Scholar] [CrossRef] [PubMed]
- Zheng, L.; Wang, S.; Wang, Y.; Zhao, Z.; Yang, P.; Song, J.; Shi, X.; Zheng, H. Cooperative Effect of Bimetallic MOF-Derived CoNi(OH)2@NiCo2S4 Nanocomposite Electrocatalysts with Boosted Oxygen Evolution Activity. Nanotechnology 2022, 33, 265701. [Google Scholar] [CrossRef] [PubMed]
- Mohamed, S.G.; Hussain, I.; Shim, J.-J. One-Step Synthesis of Hollow C-NiCo2S4 Nanostructures for High-Performance Supercapacitor Electrodes. Nanoscale 2018, 10, 6620–6628. [Google Scholar] [CrossRef]
- Pu, J.; Cui, F.; Chu, S.; Wang, T.; Sheng, E.; Wang, Z. Preparation and Electrochemical Characterization of Hollow Hexagonal NiCo2S4 Nanoplates as Pseudocapacitor Materials. ACS Sustain. Chem. Eng. 2014, 2, 809–815. [Google Scholar] [CrossRef]
- Zou, J.; Xie, D.; Zhao, F.; Wu, H.; Niu, Y.; Li, Z.; Zou, Q.; Deng, F.; Zhang, Q.; Zeng, X. Microwave Rapid Synthesis of Nickel Cobalt Sulfides/CNTs Composites as Superior Cycling Ability Electrode Materials for Supercapacitors. J. Mater. Sci. 2021, 56, 1561–1576. [Google Scholar] [CrossRef]
- Bao, Y.; Zhang, W.; Yun, T.; Dai, J.; Li, G.; Mao, W.; Guan, M.; Zhuang, Y. The Application of Transition Metal Sulfide Ni3S4/CNFs in Rechargeable Ni–Zn Batteries. New J. Chem. 2021, 45, 22491–22496. [Google Scholar] [CrossRef]
- Kung, C.-W.; Chen, H.-W.; Lin, C.-Y.; Huang, K.-C.; Vittal, R.; Ho, K.-C. CoS Acicular Nanorod Arrays for the Counter Electrode of an Efficient Dye-Sensitized Solar Cell. ACS Nano 2012, 6, 7016–7025. [Google Scholar] [CrossRef] [PubMed]
- Khani, H.; Wipf, D.O. Iron Oxide Nanosheets and Pulse-Electrodeposited Ni–Co–S Nanoflake Arrays for High-Performance Charge Storage. ACS Appl. Mater. Interfaces 2017, 9, 6967–6978. [Google Scholar] [CrossRef]
- Matoba, M.; Anzai, S.; Fujimori, A. Thermal Expansion, Thermoelectric Power, and XPS Studyof the Nonmetal-Metal Transition in Ni1- xS1- y Sey. J. Phys. Soc. Jpn. 1991, 60, 4230–4244. [Google Scholar] [CrossRef]
- Shi, Z.-T.; Kang, W.; Xu, J.; Sun, L.-L.; Wu, C.; Wang, L.; Yu, Y.-Q.; Yu, D.Y.W.; Zhang, W.; Lee, C.-S. In Situ Carbon-Doped Mo(Se0.85S0.15)2 Hierarchical Nanotubes as Stable Anodes for High-Performance Sodium-Ion Batteries. Small 2015, 11, 5667–5674. [Google Scholar] [CrossRef]
- Danilson, M.; Altosaar, M.; Kauk, M.; Katerski, A.; Krustok, J.; Raudoja, J. XPS Study of CZTSSe Monograin Powders. Thin Solid Films 2011, 519, 7407–7411. [Google Scholar] [CrossRef]
- Zou, X.; Wu, Y.; Liu, Y.; Liu, D.; Li, W.; Gu, L.; Liu, H.; Wang, P.; Sun, L.; Zhang, Y. In Situ Generation of Bifunctional, Efficient Fe-Based Catalysts from Mackinawite Iron Sulfide for Water Splitting. Chem 2018, 4, 1139–1152. [Google Scholar] [CrossRef]
- Sahoo, M.K.; Samantara, A.K.; Behera, J.N. In Situ Transformed Cobalt Metal–Organic Framework Electrocatalysts for the Electrochemical Oxygen Evolution Reaction. Inorg. Chem. 2020, 59, 12252–12262. [Google Scholar] [CrossRef]
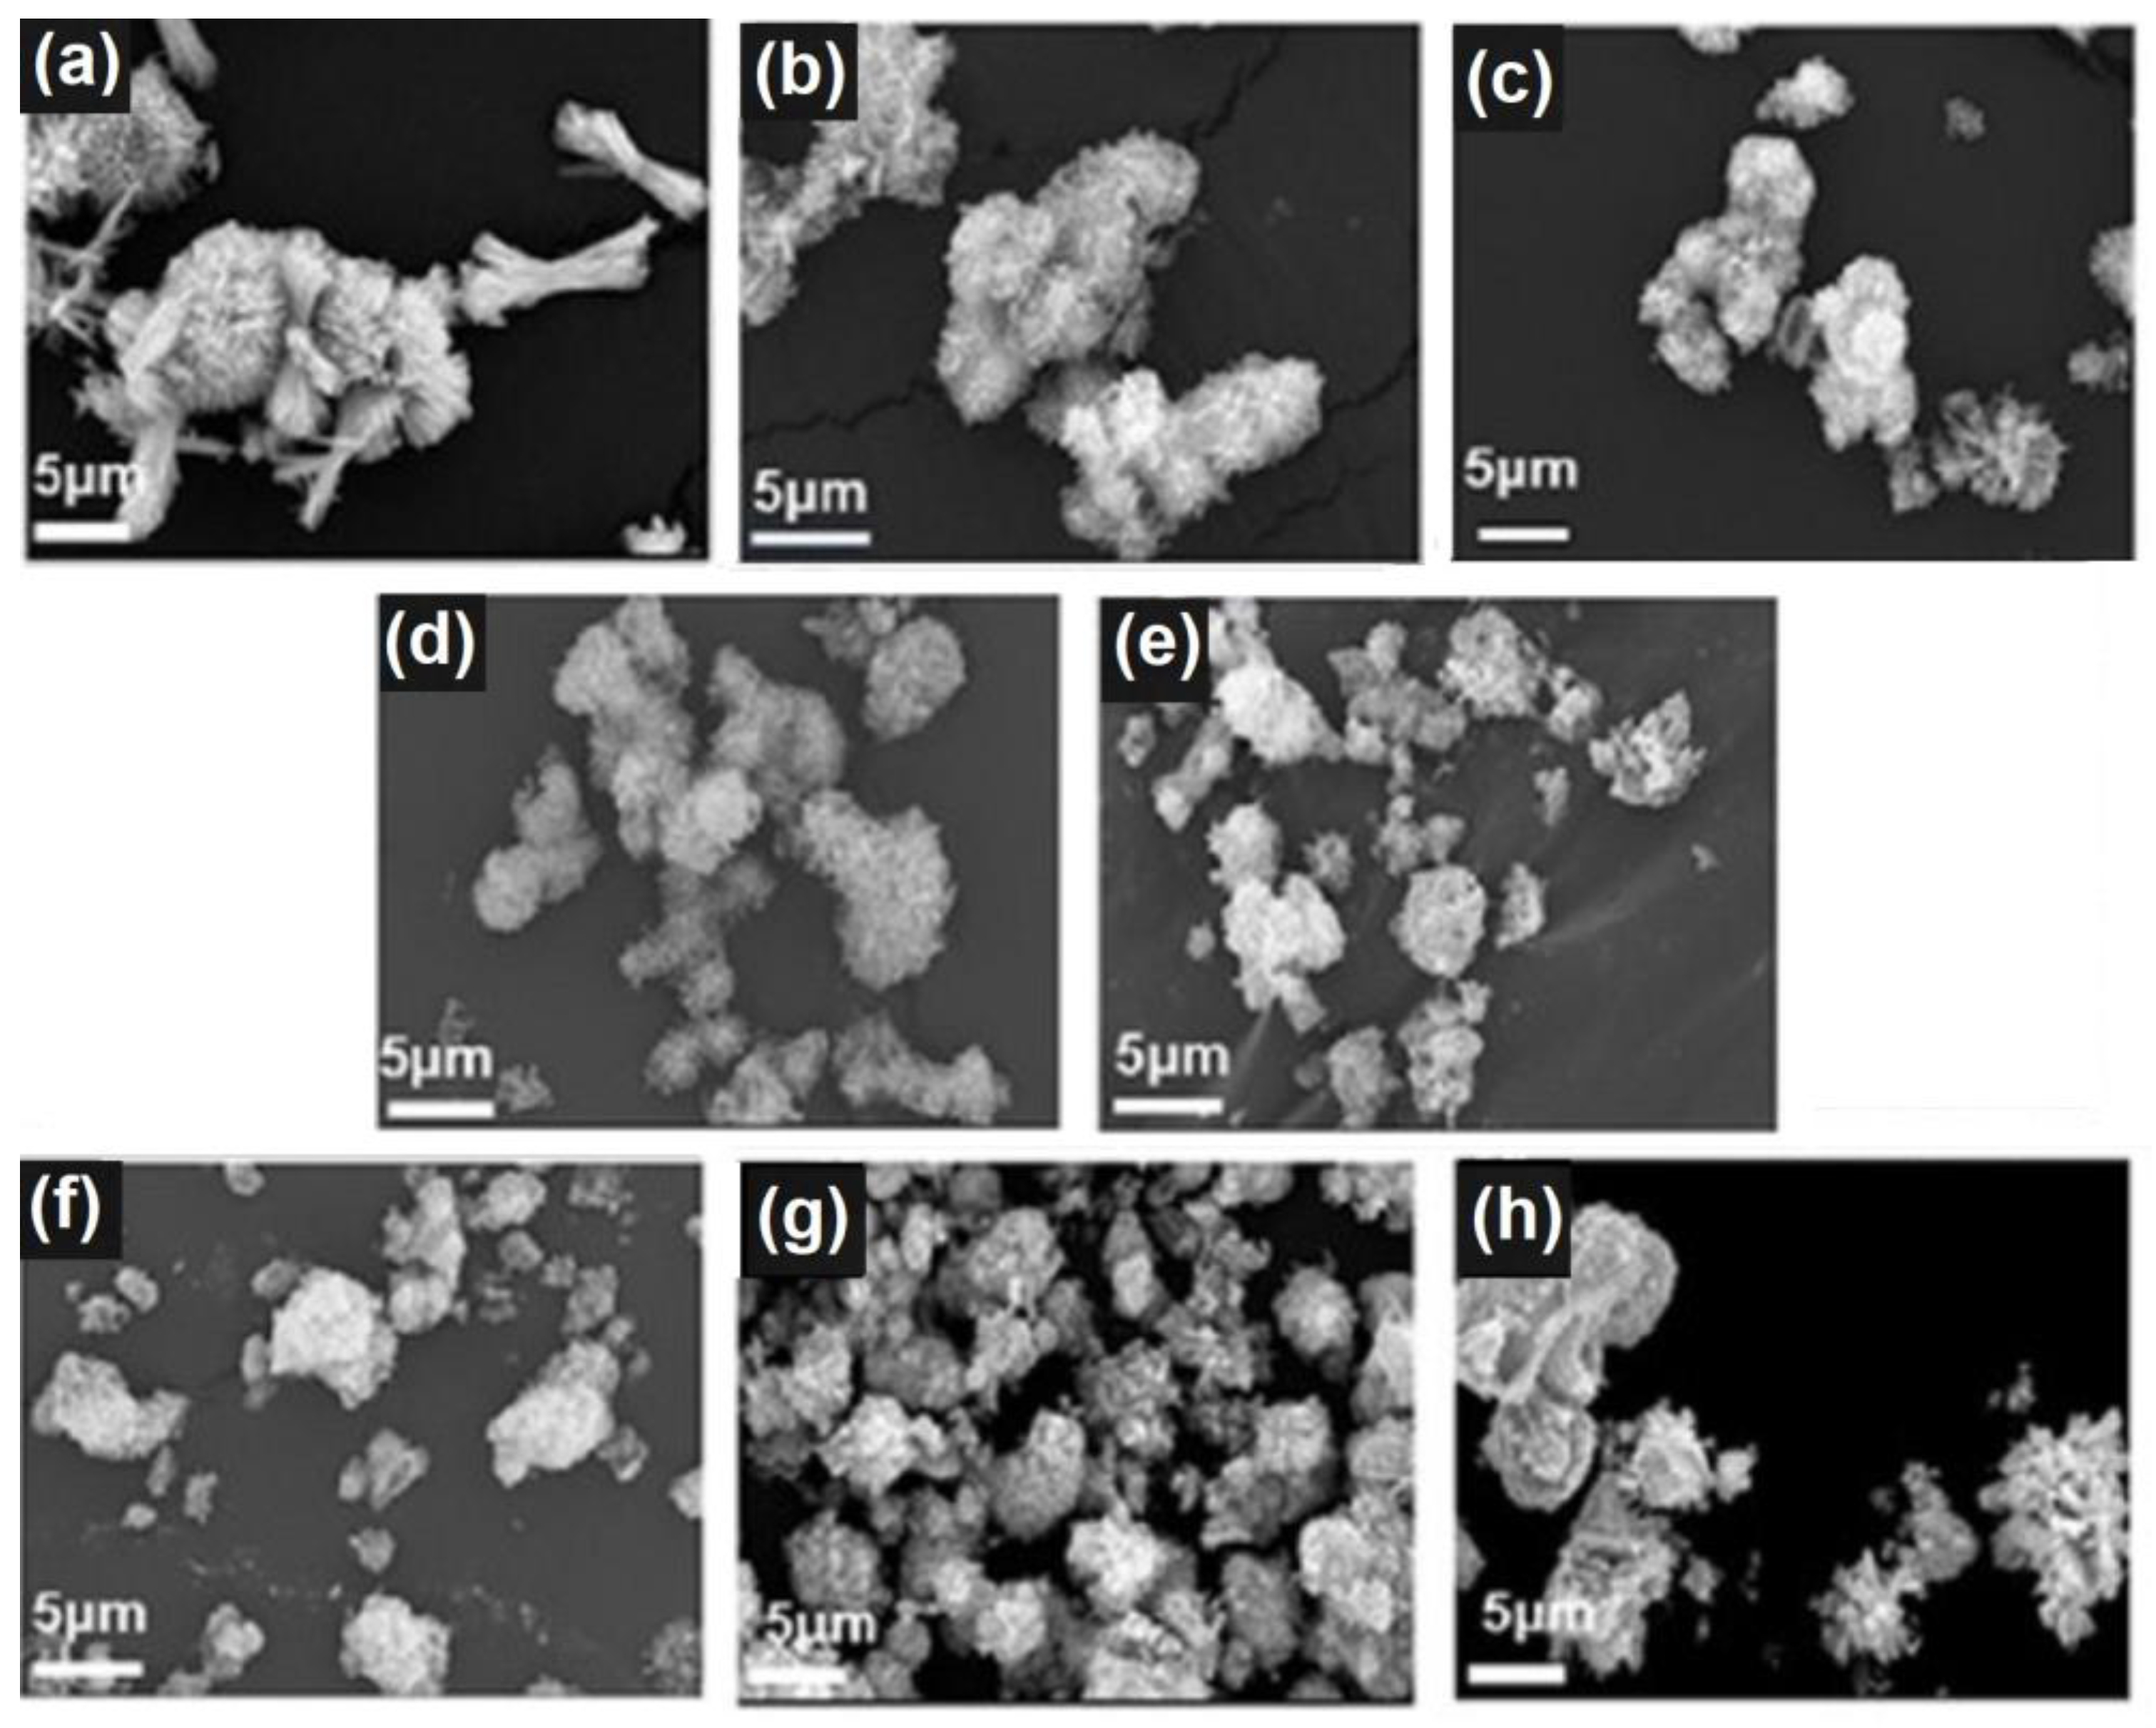
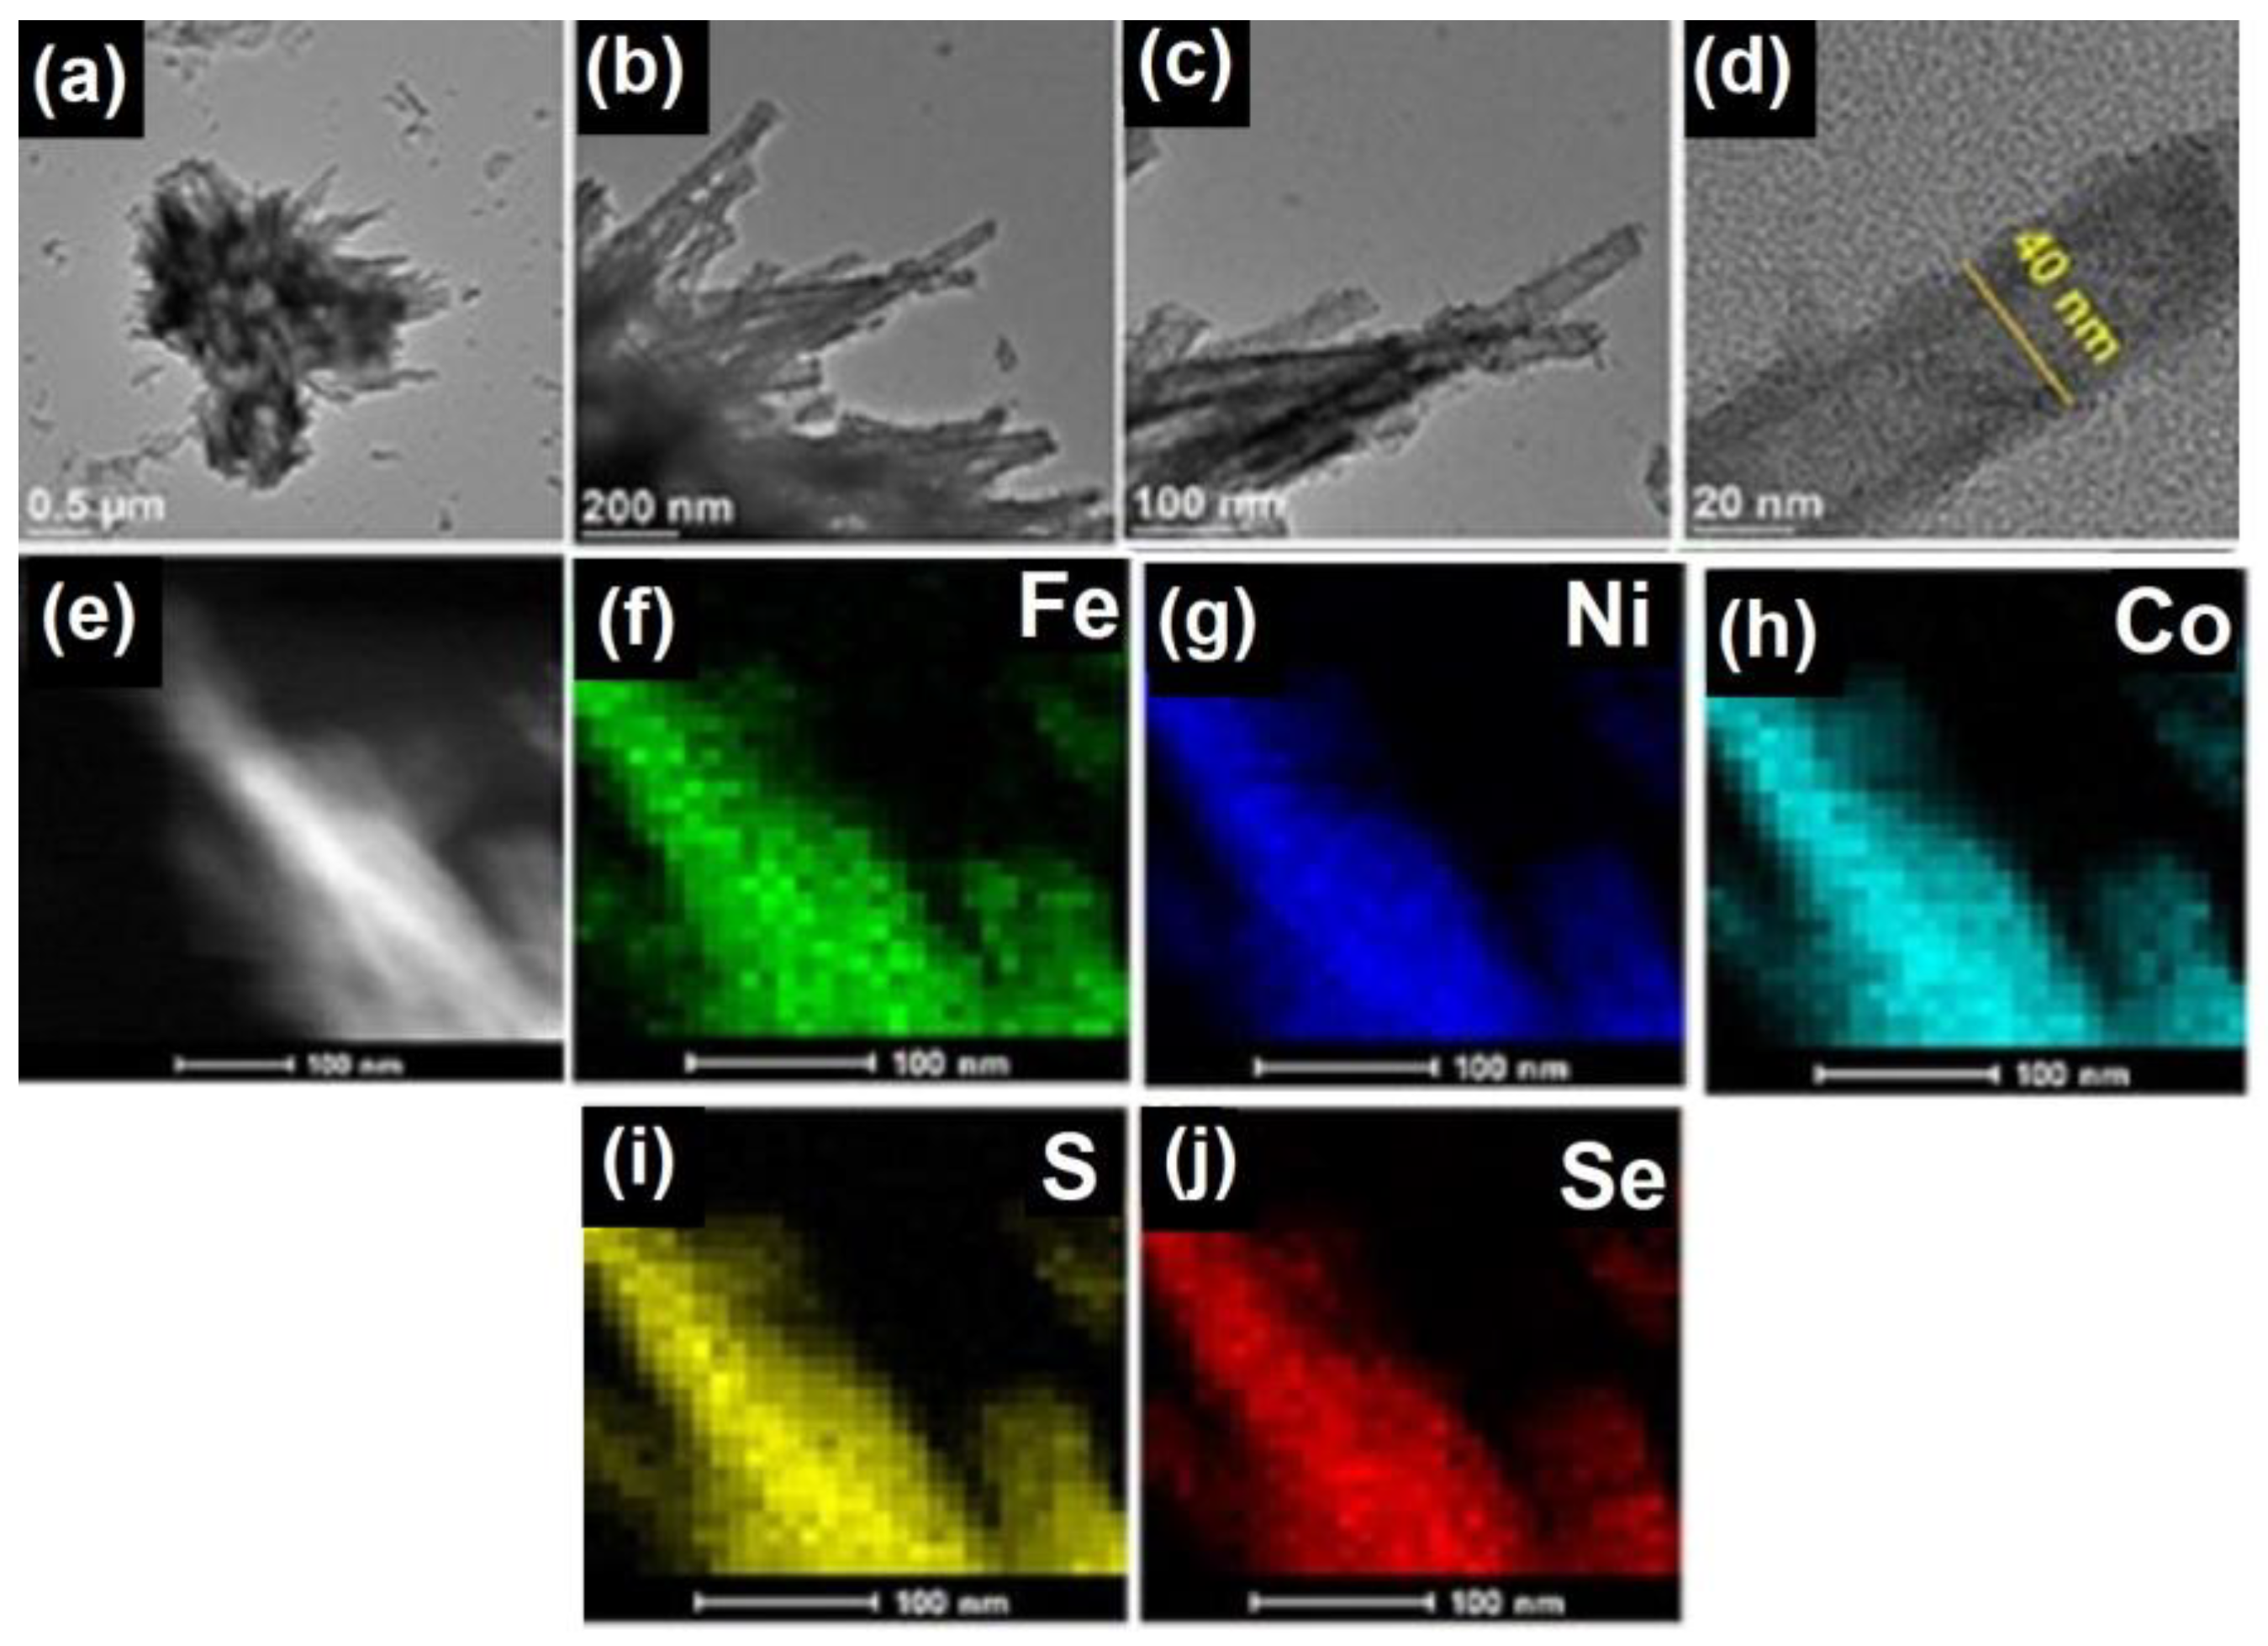
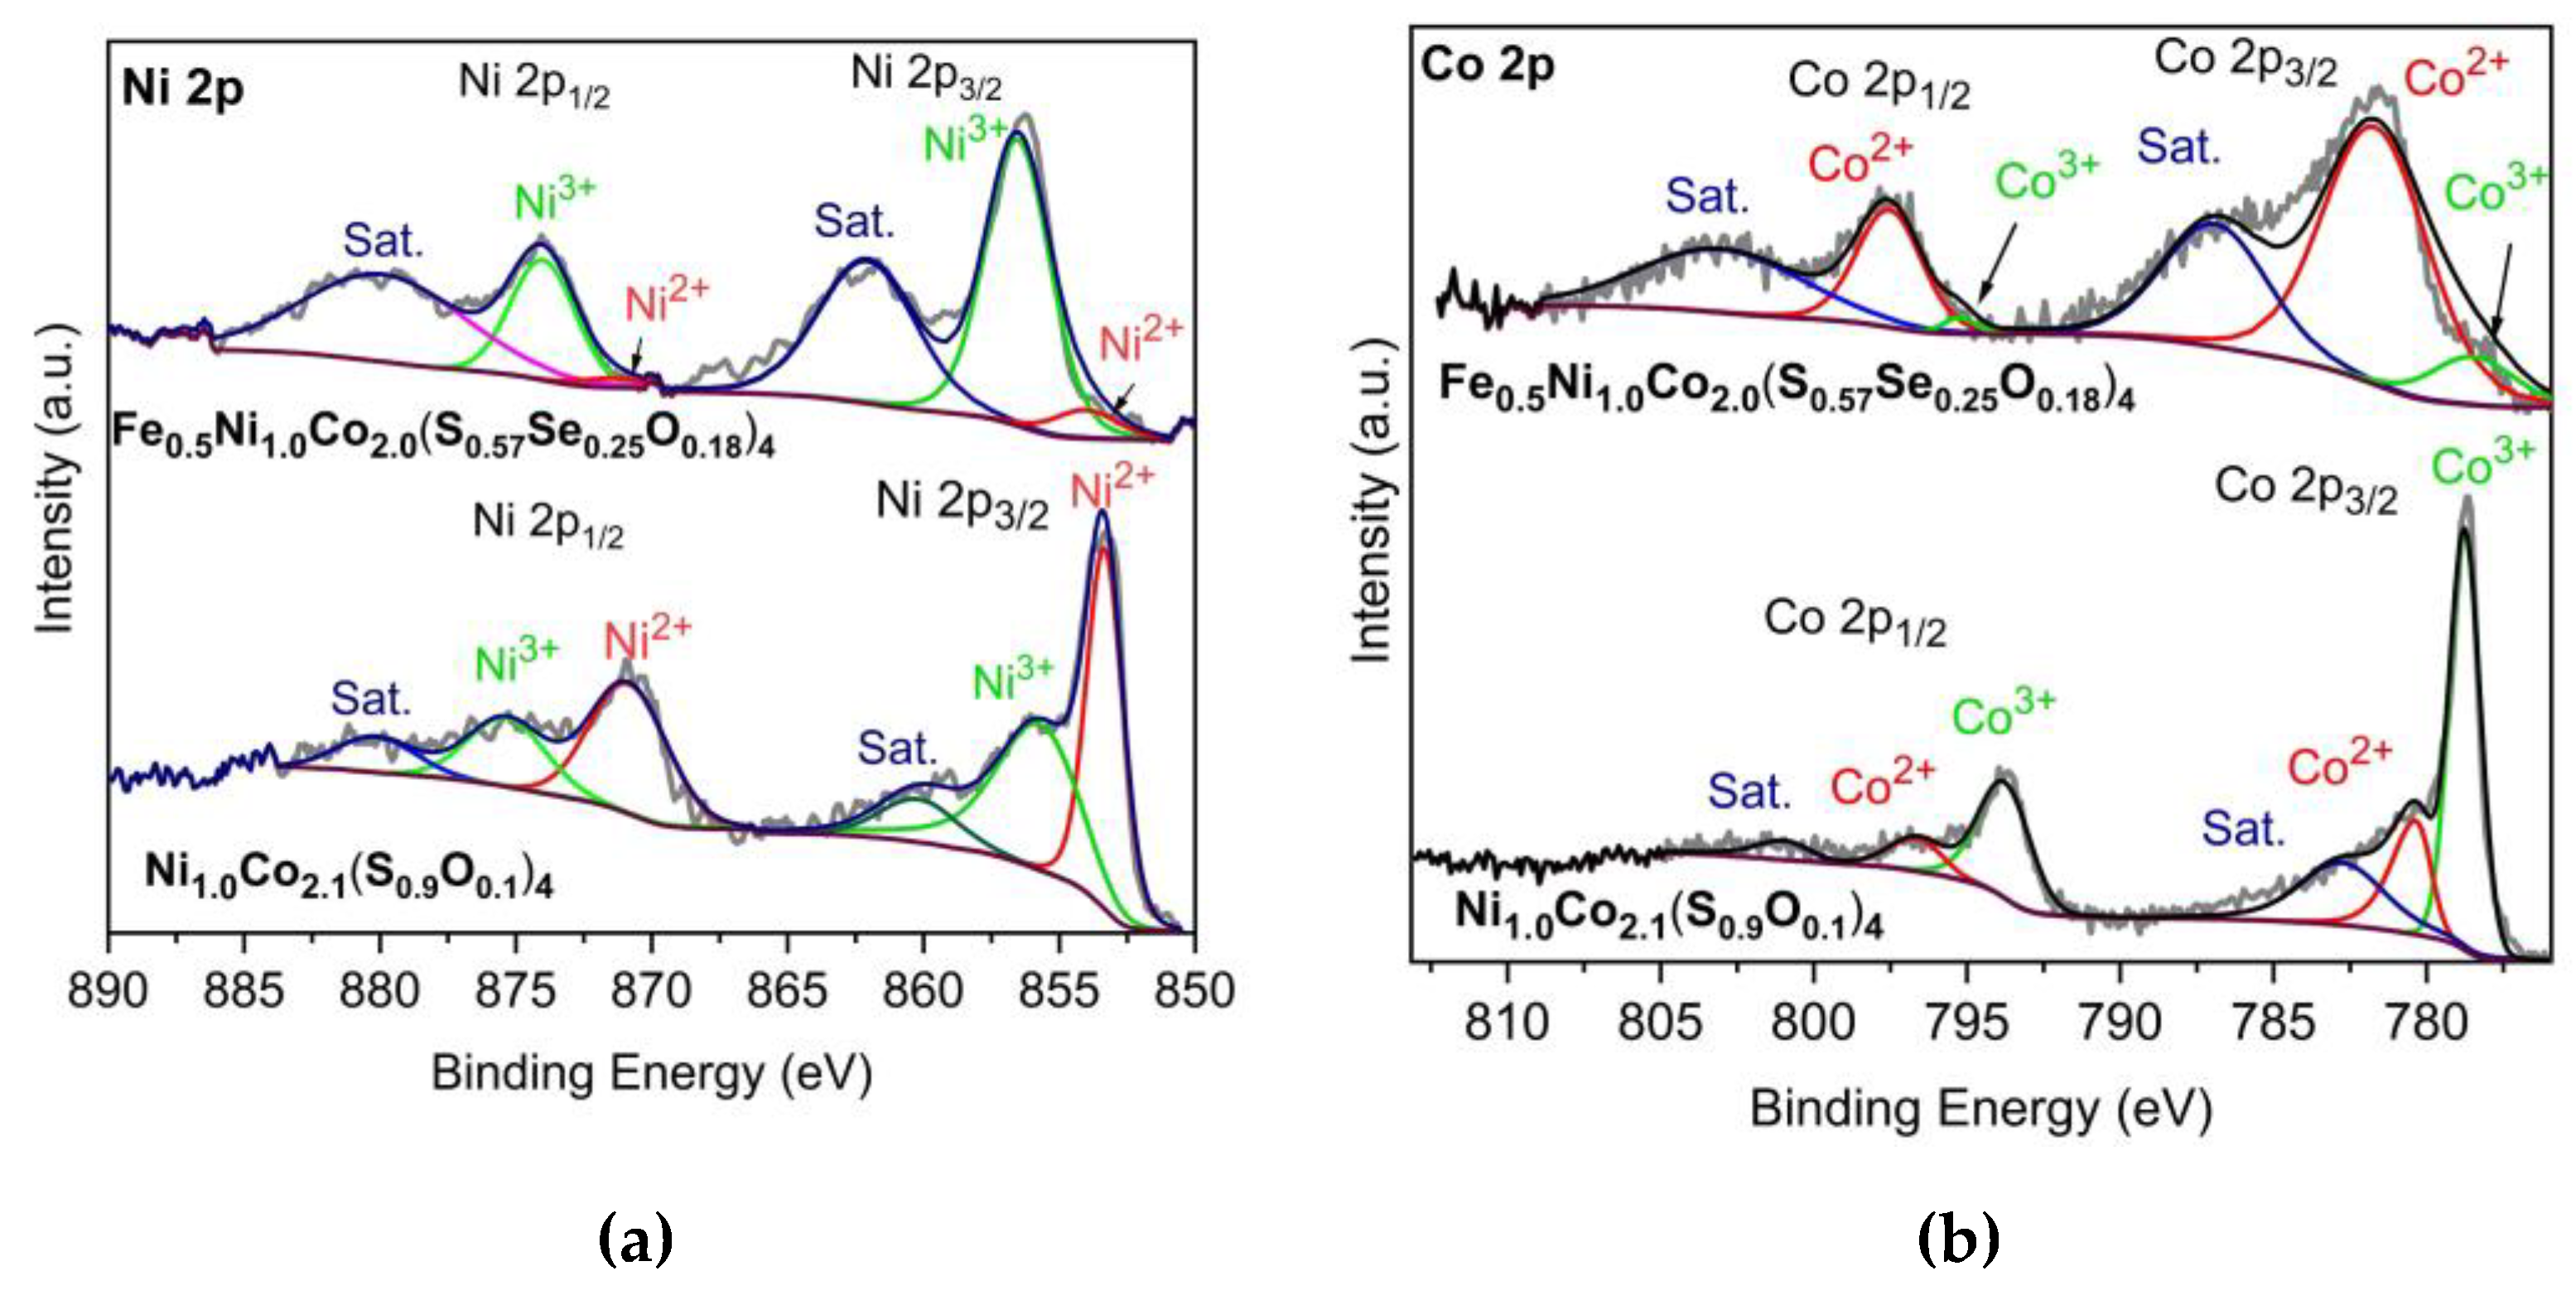
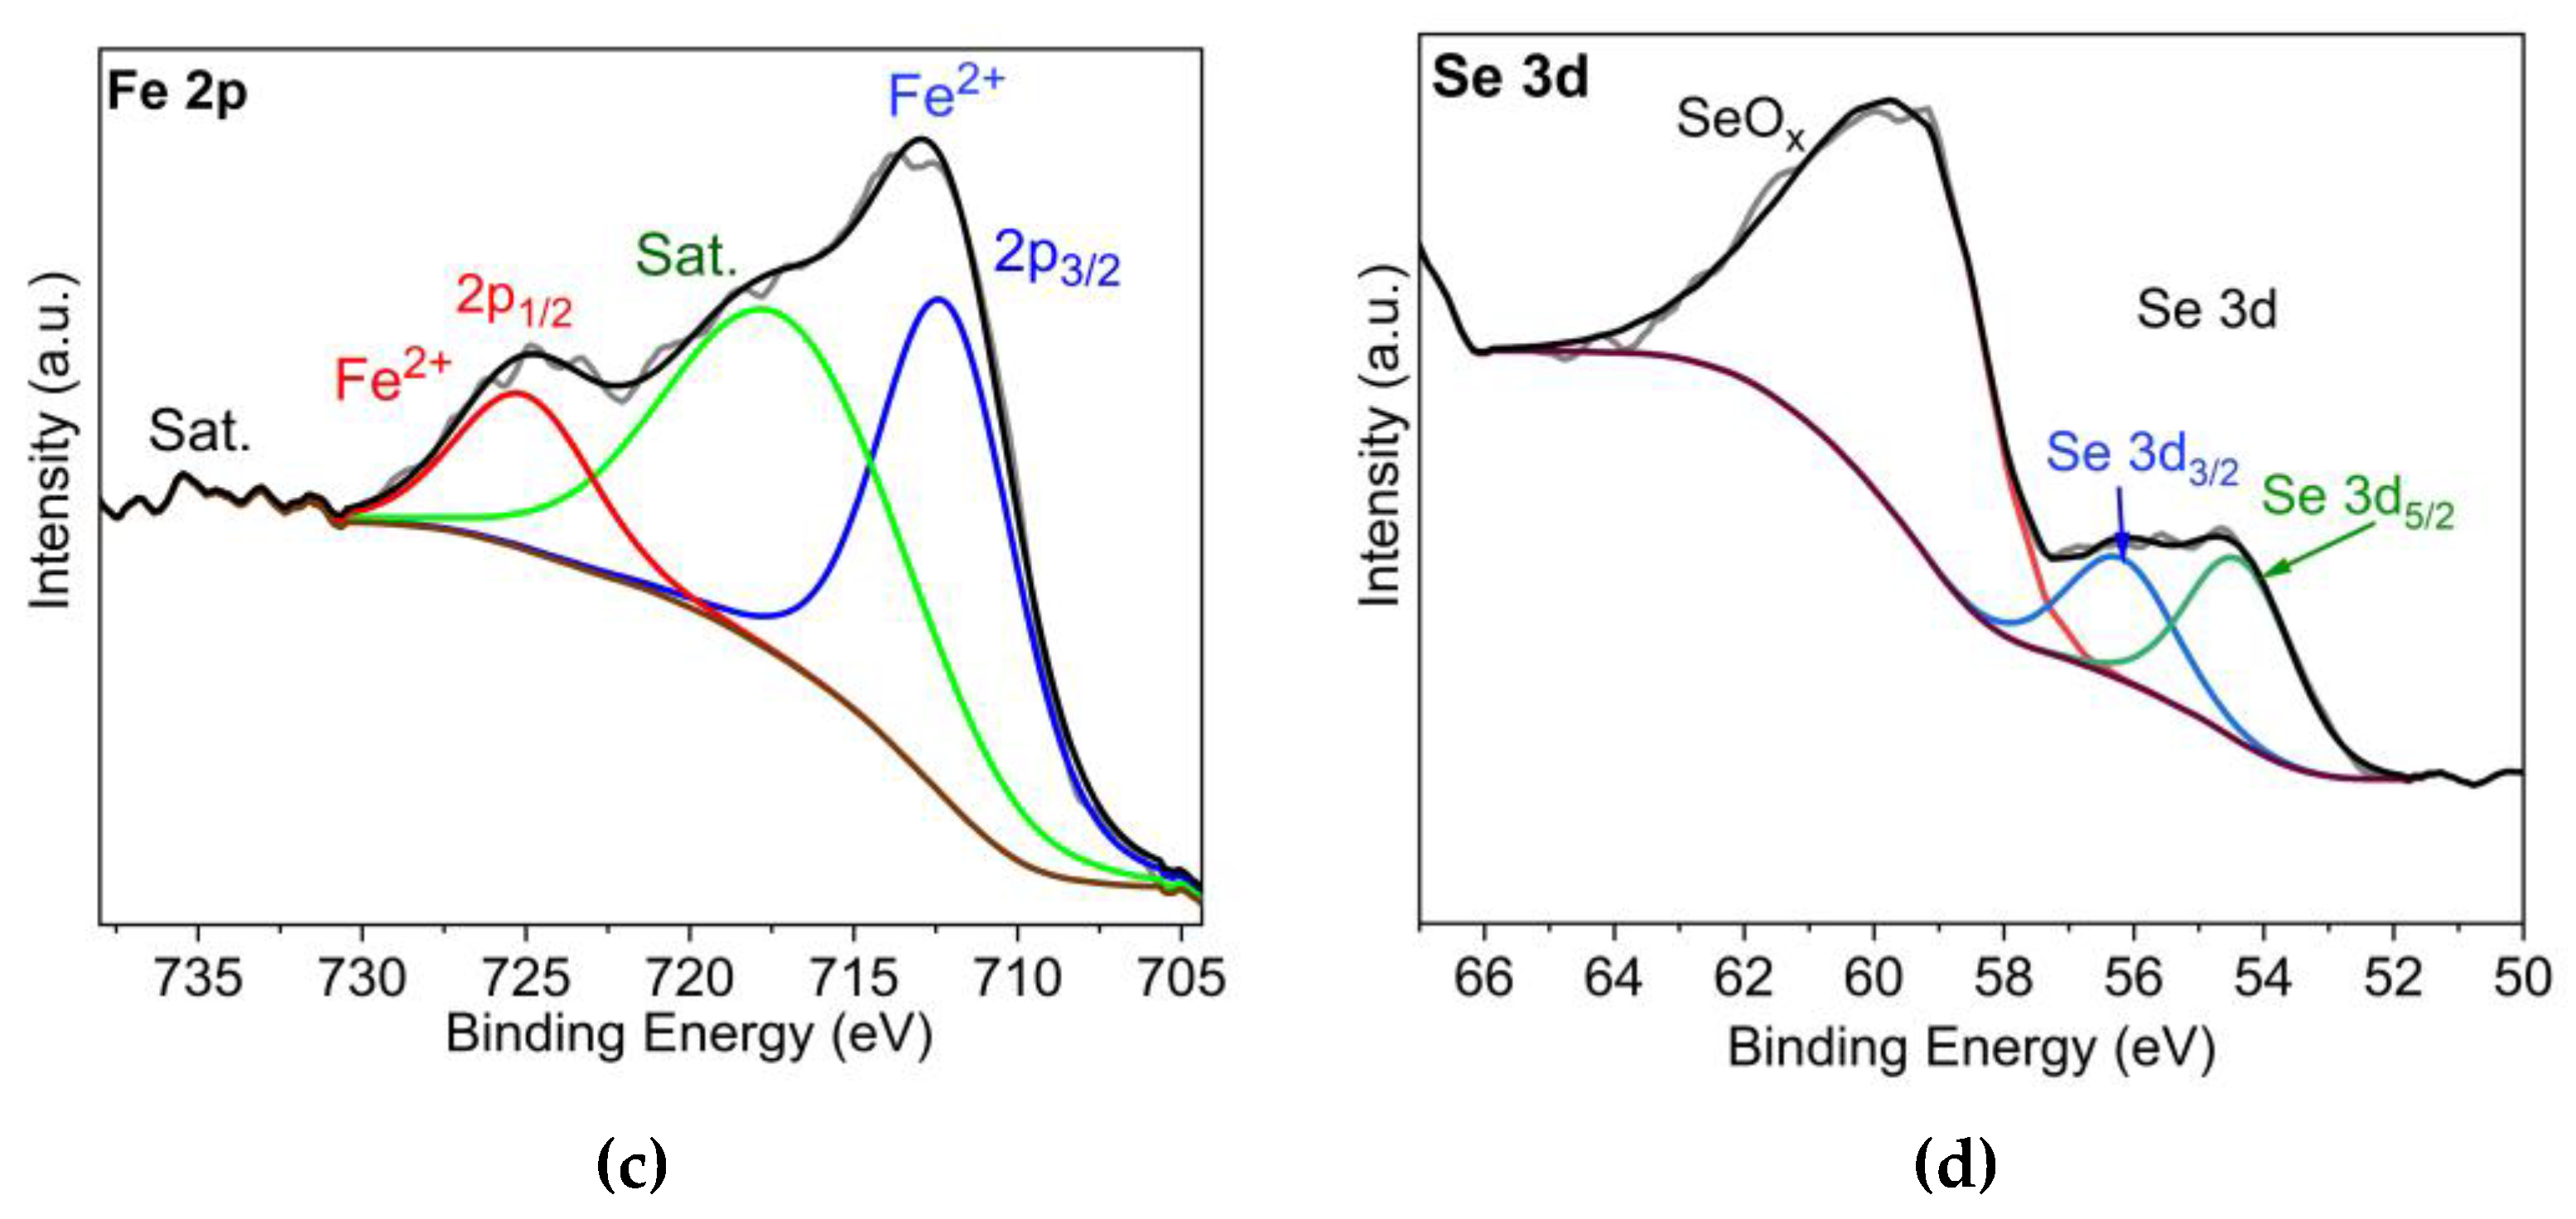
| Sample | At% a) | Ni/Co a) | At% b) | Position (eV) | M2+/M3+ | ||
| Ni1.0Co2.1(S0.9O0.1)4 c) | Ni | 6.90 | ½ | Ni2+ | 35.6 | 853.3 | 2.59 |
| Ni3+ | 13.7 | 856.0 | |||||
| Co | 13.90 | Co2+ | 17.0 | 780.3 | 0.37 | ||
| Co3+ | 45.9 | 778.7 | |||||
| Fe/Ni/Co | |||||||
| Fe0.5Ni1.0Co2.0(S0.57Se0.25O0.18)4 d) | Fe | 2.30 | 1.0/2.5/4.1 | ||||
| Ni | 5.70 | Ni2+ | 3.3 | 854.5 | 0.10 | ||
| Ni3+ | 32.9 | 856.5 | |||||
| Co | 9.40 | Co2+ | 46.7 | 781.9 | 6.65 | ||
| Co3+ | 7.0 | 779.1 | |||||
| Sample | Overpotential (mV) | Tafel slope (mV dec–1) | Charge transfer resistant Rct (Ω) |
|---|---|---|---|
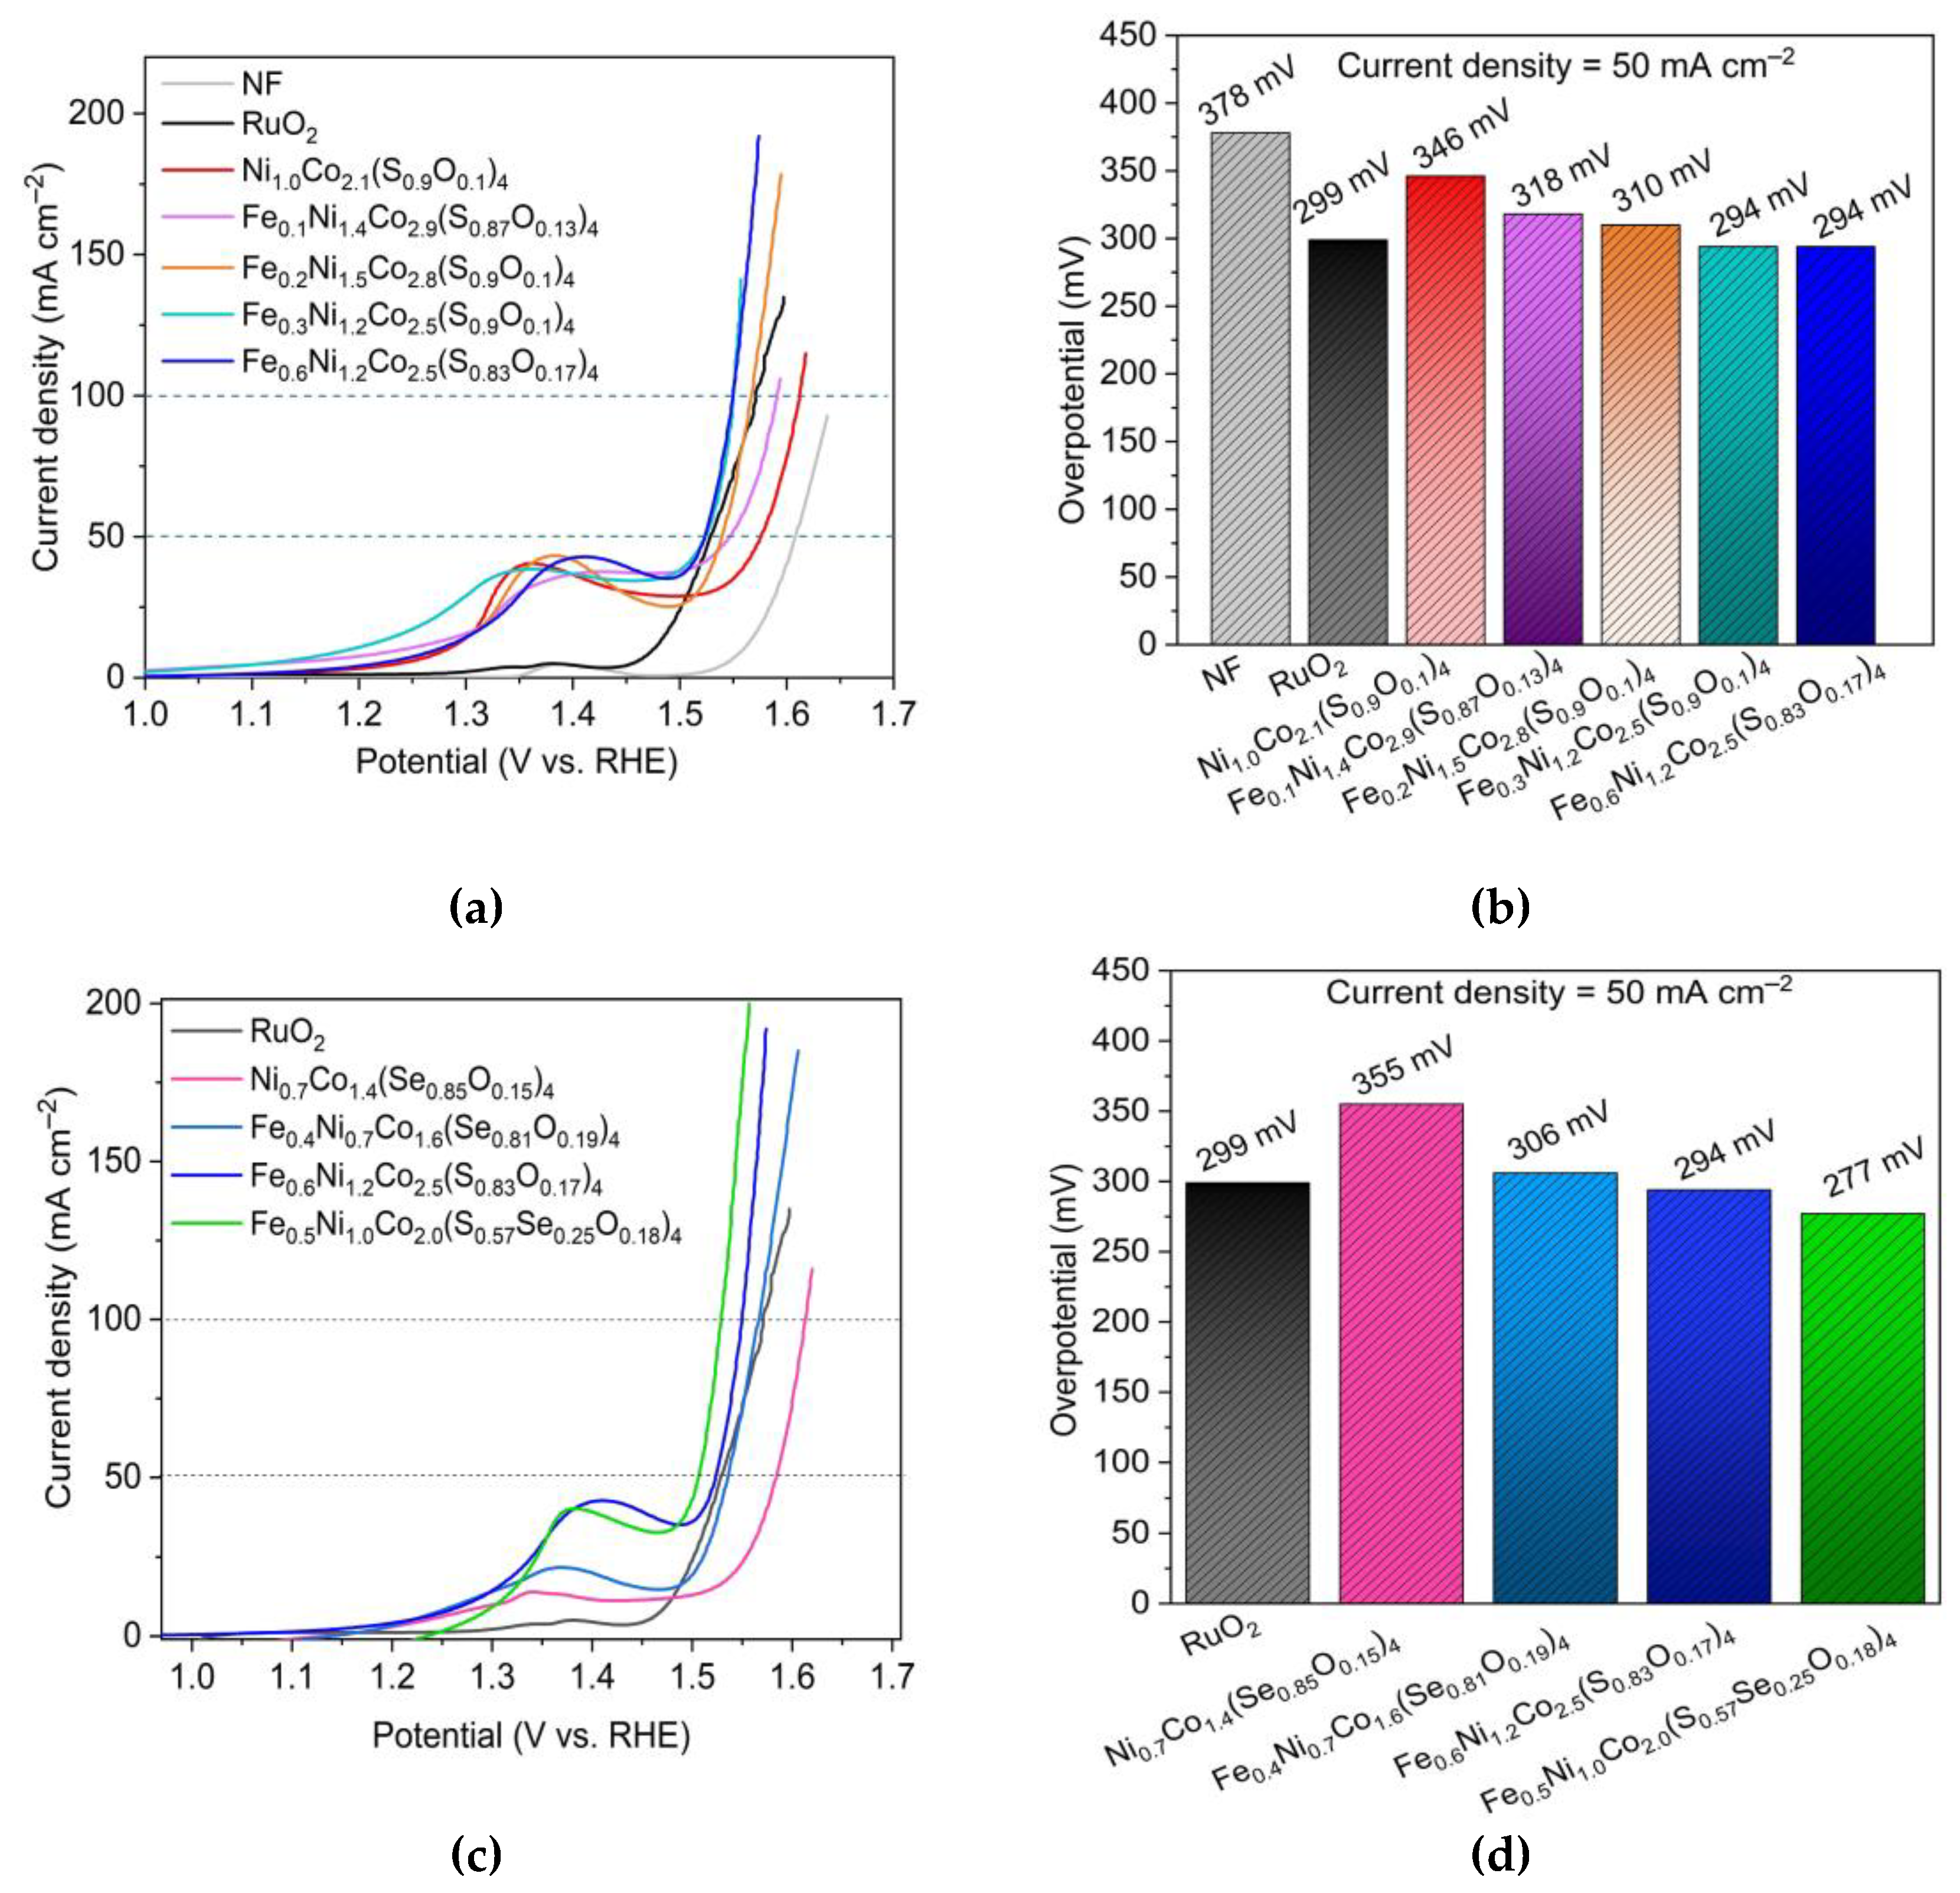
| Ni1.0Co2.1(S0.9O0.1)4 | 346 | 132 | 1.8 |
| Ni0.7Co1.4(Se0.85O0.15) | 355 | 135 | 1.7 |
| Fe0.6Ni1.2Co2.5(S0.83O0.17)4 | 294 | 87 | 2.2 |
| Fe0.4Ni0.7Co1.6(Se0.81O0.19)4 | 306 | 84 | 1.4 |
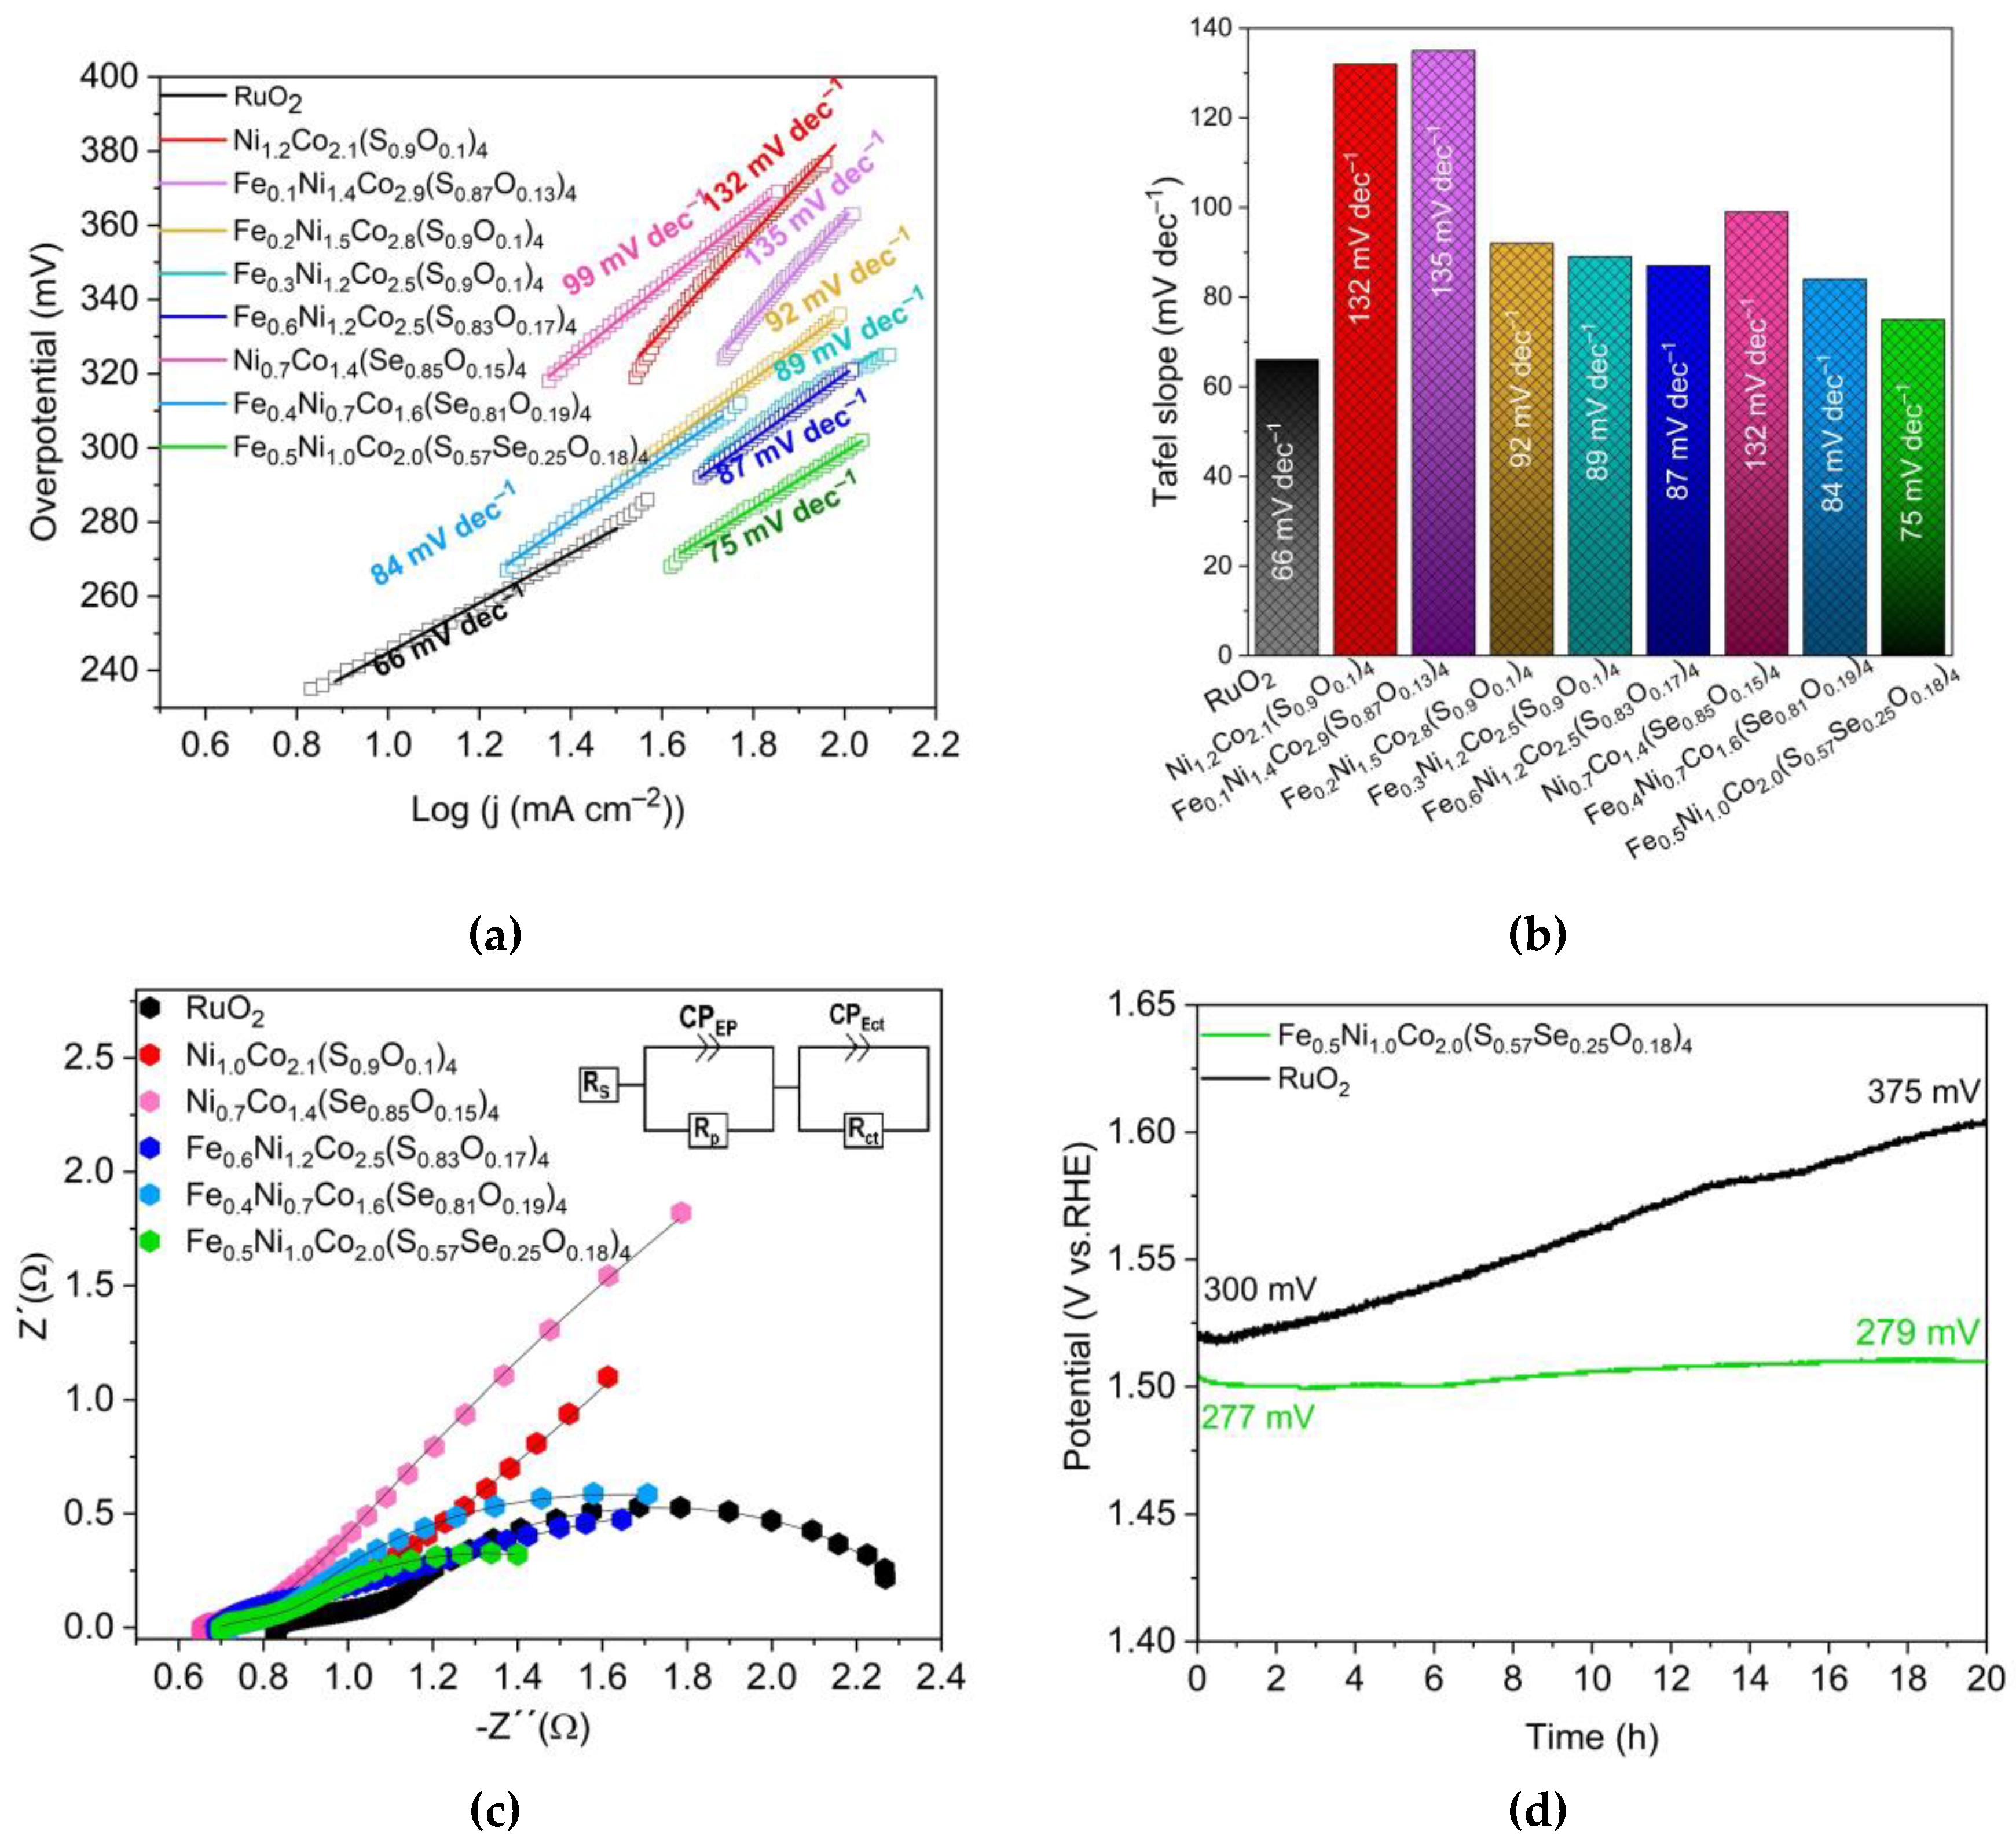
| Fe0.5Ni1.0Co2.0(S0.57Se0.25O0.18)4 | 277 | 75 | 0.8 |
| (FexNi1–x)CoCH-(1.0) | 330 | 98 | 2.5 |
| RuO2 | 299 | 66 | 1.2 |
| Catalyst | Overpotential (mV) | Current density (mA cm–2) | Electrode substratea) | Ref. |
|---|---|---|---|---|
| Fe0.5Ni1.0Co2.0(S0.57Se0.25O0.18)4 | 277 | 50 | NF | This work |
| Co3O4/NiCo2O4 | 407 | 50 | NF | [69] |
| NiO/α-Fe2O3 | 244 | 50 | NF | [70] |
| P-Ni3S2/CoFe2O4 | 254 | 50 | NF | [71] |
| PANIb)/NiFe–OH | 260 | 50 | NF | [72] |
| LaCoO3 | 420 | 50 | NF | [73] |
| Ce-doped Ni3S2 | 257 | 50 | NF | [74] |
| Porous Ni3S2 | 291 | 50 | NF | [75] |
| (Co1.2MoO4.21·3H2O)/Ni3S2 | 290 | 50 | NF | [76] |
| CoHPO4·H2O | 350 | 50 | NF | [77] |
| NiSe@NiOOH | 300 | 50 | NF | [78] |
| P-containing NiCo2S4 | 300 | 50 | NF | [38] |
| NiFe-LDHc)/Co3O4 | 274 | 50 | NF | [79] |
Disclaimer/Publisher’s Note: The statements, opinions and data contained in all publications are solely those of the individual author(s) and contributor(s) and not of MDPI and/or the editor(s). MDPI and/or the editor(s) disclaim responsibility for any injury to people or property resulting from any ideas, methods, instructions or products referred to in the content. |
© 2023 by the authors. Licensee MDPI, Basel, Switzerland. This article is an open access article distributed under the terms and conditions of the Creative Commons Attribution (CC BY) license (http://creativecommons.org/licenses/by/4.0/).


