Preprint
Article

Spatial Analysis of Influence Factors Associated With Liver Fluke (Opisthorchis viverrini) Infection in Small Sub-Watershed Using GWR Modeling

Altmetrics

Downloads

216

Views

110

Comments

0

Submitted:

12 June 2023

Posted:

14 June 2023

You are already at the latest version

Alerts
Abstract
Infection of liver flukes (Opisthorchis viverrini) is partly due to their suitability for habitats in sub-basin areas, which causes the intermediate host to remain in the watershed system in all seasons. Spatial monitoring of fluke infection at the small -basin analysis scale is important because this can enable analysis at the level of the spatial factors involved and influencing infections. A geographic weighted regression model was developed to analyze the spatial characteristics of liver fluke infection, aiming to 1. analyze the spatial factors associated with human liver fluke infection according to sub-basin boundaries and 2. generate an alternative model for enhancing the effectiveness of preventive public health management to reduce the risk of liver fluke infection in humans. The number of infected persons was obtained from local authorities and converted into a percentage of infected people and generated as raster data with a heat map so that the data were continuous and defined as dependent variables. The independent set consisted of nine variables, both vector and raster data, that correlated the location with the village location of an infected person. The results showed that the variables X5stream, X7ndmi, and X9savi were statistically significantly correlated to the percentage of infected people, with the t-stat and p-value being (-2.068, 1.875, and -2.661) and (0.048, 0.034, and 0.021), respectively. The GWR model was able to increase accuracy more than the comparable models such as OLS, in all tests of the four alternative models, with an accuracy increase in R2 of 7.69% (0.576 to 0.624). This study confirms that the development of spatial models with GWR models can screen for factors associated with liver fluke infection at the level of small spatial units such as sub-basins.
Keywords: 
Subject: Public Health and Healthcare  -   Public, Environmental and Occupational Health

1. Introduction

Severe liver fluke infections have been detected in Ponna Kaeo district, Sakon Nakhon province, Thailand [1]. The liver fluke, scientifically named Opisthorchis viverrini, causes cholangiocarcinoma (CCA) [2,3,4]. The prevalence of liver flukes and bile duct cancer cases have been reported to be the highest in Thailand, according to causes of liver fluke infection [5]. It is caused by eating raw fish contaminated with contagious larvae, as well as the popular consumption of raw or semi-cooked and semi-raw fish. Fluke infections from fish products such as fermented fish have also been reported [6]. Every year, more than 1,000 new cases of CCA are identified in Sakon Nakhon Hospital. This incidence has not decreased over the past decade despite the fact that the major risk factors for O. viverrini infection are known [7,8]. Another study reported that the incidence of CCA in four major regions of Thailand (Sakon Nakhon, Phrae, Roi-Et, and Nong Bua Lamphu) has not been identified [8,9,10,11]. Those with high severity of O. viverrini infection (>6000 eggs/g. feces) were 14.1 times more likely (odds) to develop CCA than people who were not infected [12]. The proportion of humans who have been infected with O. viverrini that has developed into CCA is about 10%, causing serious health emergencies throughout the region [13,14]. The O. viverrini infection can produce bile duct, liver, and connective tissue inflammation, resulting in the development of CCA [4,15]. The five-year survival rate of intrahepatic, distal extrahepatic, and hilar CCA patients undergoing surgery was 22–44%, 27–37%, and 11–41%, respectively [15].
Due to the geographical features of the area, there is a subdistrict boundary with the largest natural water contact zone in the northeast, namely Nong Han. The physical nature of the swamp is a large natural water source, full of water throughout the year, as it is a waterfront source from several streams, making it an important food source for the community. The livelihood of people living in the watershed derives from finding fish, which is an important source of protein, and there is a consumption culture that is familiar with the taste of raw fish [1,4], fascinated by the sweet taste of fresh, sour, spicy, hot fish with herbs cooked in meals. Fish is therefore a regular food for every meal of villagers who live near the river basin. According to preliminary screening results from 2019 to 2021 [2], a small number of people contracted liver fluke. In addition, studies conducted on the prevalence of liver fluke infection in fish (contagious larvae) showed that Sakon Nakhon province had an infection area of 33.33% [13], and a 2016–2017 study of the density of contact larvae in fish showed a density of 10–20 metacircaria per kilogram of fish [12]. As a result, liver fluke outbreaks are still present in Sakon Nakhon province, where the liver fluke's eggs are transfused with feces, potentially contaminating soil, water bodies, and causing recurrent infections and an endless cycle of infection.
The application of geographic information system (GIS) knowledge as an analytical tool is particularly useful because of the spatial analysis of liver fluke infections with remote sensing information systems. Remote sensing (RS) obtained from satellite imagery can provide in-depth analysis of the likelihood of liver flukes and their distribution [14], such as the standardized vegetation index, soil moisture index, soil cover index [16], and other indices that may be associated with the habitation of liver fluke intermediates. Many studies have applied spatial statistics to analyze spatial correlation factors to liver fluke infection [17], such as studies [18,19] that analyzed a large area, resulting in discrepancies and incoherence in raster data. Based on the findings of [20,21,22], GWR (geographic weighted regression) models were constructed in small area unit systems in hydrological factor analysis, resulting in high R2 values in all other models.
However, since there are many indices that are to be constructed as independent variables, in order to accurately analyze them, the principles of geostatistics [23], the GWR modeling method of local operations in particular, requires the creation of sub-spatial units [20], such as sub-basins, defined from the flow boundary of the sub-basin to the modeling control boundary. This makes GWR models effective in predicting and analyzing spatial relationships well [24]. To build spatial models for analyzing relationships in small areas such as sub-basin levels [25], there is a need to use appropriate models and design sub-area units to suit the distribution of data and dependent and independent variables. The application of only OLS models in independent multivariate analysis often provides low accuracy, since there are many independent factors that create a lot of variability for the model. However, in this study, GWR modeling was used to analyze the relationship between a set of independent variables and the percentage of infections before OV. Past research on spatial modeling has not used the application of GWR models and sub-spatial unit boundaries in small watershed systems to track liver fluke infections. This is performed to screen for independent variables that are involved in spatial infections, and then GWR modeling is carried out, which can be accurately modeled using a small set of independent variables that are related to actual variables.
Therefore, if it can be demonstrated that the spatial characteristics in the distribution of each parasite are important to any subspace unit at the sub-basin level, then the sub-basin level can be properly managed for protection [26]. For example, breaking the cycle of intermediary hosts such as mollusks can prevent future illnesses and result in healthy communities. The community is strengthened, and the burden of medical care can be reduced.

2. Materials and Methods

2.1. The Study Area

Phon Na Kaeo is a district in Sakon Nakhon province; in the north, it borders Kusumal district; in the east, it borders Pla Pak district (Nakhon Phanom province); in the south, it borders Wangyang district (Nakhon Phanom province), Khok Si Suphan district, and Mueang Sakon Nakhon district; and in the west, it borders Mueang Sakon Nakhon district. Its geographical coordinates are 17o13’18’’N, 104o17’24’’E, as shown in Figure 1.
There are 5 subdistricts: Ban Phon, Na Kaeo, Nadong Wattana, Ban Khae, and Chiang Shi. The Phon Na Kaeo district’s area of Sakon Nakhon province is located in the east of the Songkram watershed, adjacent to Nakhon Phanom province and adjacent to Nong Harn marsh, which is a large natural water source. There is an exchange of Mekong fish and fish habitat in the area at a distance of about 40 kilometers from the Mekong River, resulting in the travel of many Mekong/tributary fish in the Phon Na Kaeo district, and the potential for fish to increase the number of liver fluke infections.

2.2. Datasets and Analyses

Liver fluke and cholangiocarcinoma have long been a public health problem in Thailand, and at present, at least 20,000 people in the northeast die from cholangiocarcinoma each year [27,28]. Currently, there are 6–8 million people infected with liver fluke, so screening people for liver fluke infection to eradicate the parasites is very important to reduce the risk of cholangiocarcinoma [29].
The data on people infected with liver fluke in this research were obtained from the Sakon Nakhon Provincial Public Health Office (SKKO) [30] https://skko.moph.go.th/dward/web/index.php?module=skko. Stool examination is a standard screening method that has been in practice for a long time. For example, intensive examination of parasite eggs in feces using the modified Kato–Katz technique, which has been an effective method in the past when there were prevalent parasite outbreaks. Moreover, stool examination is a standard method that has been in practice for a long time. Stool specimens were examined for O. viverrini eggs within hours of collection using the modified Kato–Katz technique [31]. The result of infection showed that most people were infected in Phon Na Kaeo district, Sakon Nakhon province. In the range of 18–80 years, the prevalence of infection tends to increase. Other testing methods include the FECT (formalin-ethyl acetate concentration technique) and the enzyme-linked immunosorbent assay (ELISA) [32], which are more effective than stool testing. It also provides quantitative results that correlate with the density of the parasite and can be used for post-drug assessment to determine the rate of reinfection or new infection [26,31,32]. However, in this study, such methods were not used, since they require a high budget. However, the secondary data obtained from SKKO of the number of people infected with liver fluke measured using the modified Kato–Katz method is reliable because it is an appropriate method for measuring many people.
The data on modified Kato–Katz fluke infection showed that most people were infected in Phon Na Kaeo district, Sakon Nakhon province. In the range of 30–40 years, the prevalence of infection tended to increase. As for the density of infection in patients, it was found to be similar to the prevalence, i.e., the density of liver fluke infection was highest among those infected in the province. Sakon Nakhon has a range of 20–30 years old, as shown in Table 1.
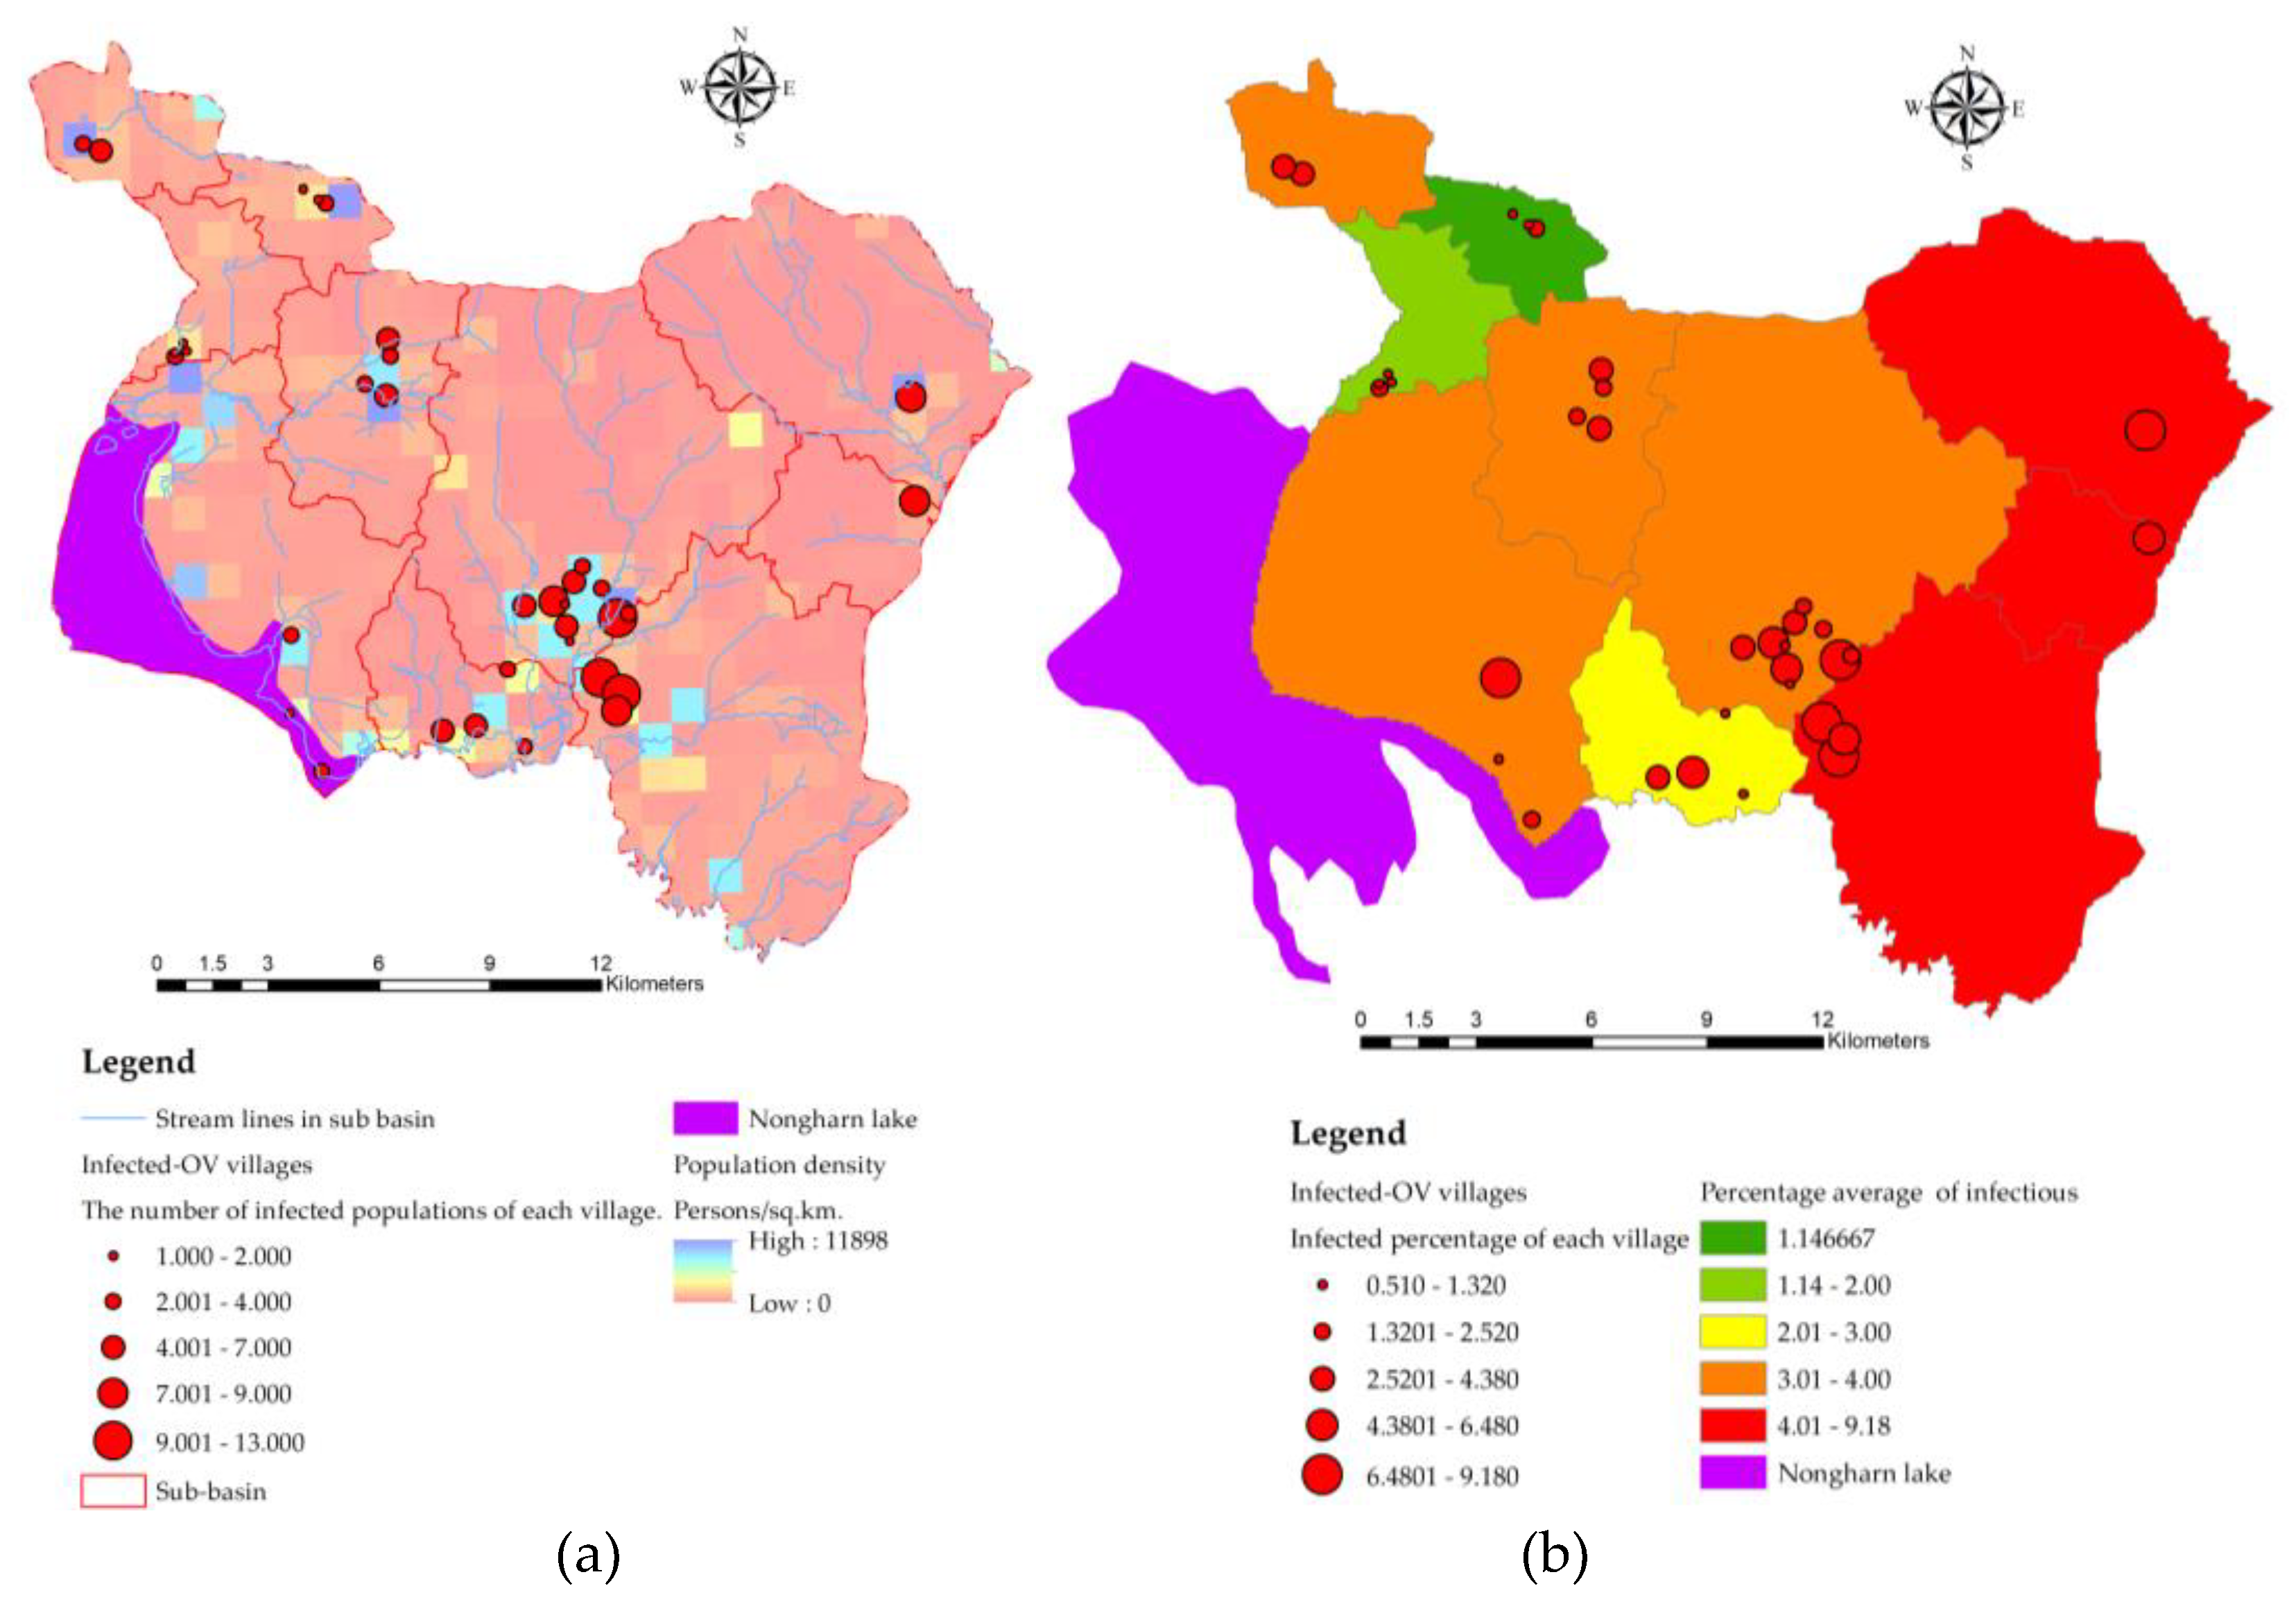
In 2019–2021, 12,063 cases were detected at the national level of stool testing and fell to the 8th Health District Office (Region, (R8)) [33] https://r8way.moph.go.th/r8way/index. Of the 2,832 cases, 599 were found in Sakon Nakhon province, with the highest number of liver fluke infections in neighboring provinces in the interconnected river basin system Nakhon Phanom and Bueng Kan [34]. The summary of reported cases detected as a percentage is shown in Figure 2. Sakon Nakhon province has the largest freshwater supply in the northeast and is a water source that breeds animals during the rainy season [2]. Phon Na Kaeo has the highest average infection rate in Sakon Nakhon province, which is why the provincial health authorities must keep an eye on the situation. In this study, data on the number of people infected with liver fluke in Phon Na Kaeo district were used. The distribution of the percentage of infected persons to the population density is shown in Figure 3(a) and shows the percentage of infected persons according to the sub-basin boundary, where the percentage index of infections in 2019–2021 is 0.510–9.180 percent, which is developed as a dependent variable in the GWR model and linked to other independent data layers by means of geographic information system, namely the spatial join method, as shown in Figure 3(b).

2.3. Independent variable modeling

The independent variable set consists of 9 factors, namely X1 (index of land use types), X2 (index of soil drainage properties), X3 (the distance index from the road network , X4 (distance index from surface water sources), X5 (distance index from the flow) accumulation lines), X6 (index of average surface temperature), X7 (average surface moisture index), X8 (average normalize difference vegetation index), and X9 (average soil-adjusted vegetation index). Each factor is calculated to determine the average division per sub-basin area, and in addition, factors 6 to 9 calculated from the remote sensing index are the average of the Landsat 8 OLI image range from January to April of 2019–2021, which is a picture of the dry season, allowing for analysis of the area where the host medium survives whilst waiting for the rainy season to arrive, as shown in the mathematical model for calculating each factor as Equations 1 to 9 as follows:
X 1 = W L j L j A k
where X 1 is index of land use types suitable for intermediary host housing. W L j = any type i land use weight value where i = (1 = built-up), (2 = forest), (3 = miscellaneous), (4 = paddy field), (5 = rice paddies in irrigated areas and water body). L j = area of land use category j unit (sq.m.). A K = size of sub-basin area at any k unit (sq.m.).
X 2 = W j S j A k
where X 2 is the index of soil drainage properties suitable for the habitation of the intermediate host. S j = area size of drainage properties of any type j soil. W j = weight value of drainage of any type j soil.
X 3 = ∑ i = 1 n ∑ j = 1 m D R i B j A k
where X 3 is the distance index from the road network used to analyze the suitability of the intermediary host from water trapped by the road network. D R i is the distance from the road line out to any distance K (meters), where k starts from 500 m, 1,000 m, 1,500 m, 2,000 m, and more. B j is the buffer distance at any k distance where K starts from 500 m, 1,000 m, 1,500 m, 2,000 m, and over.
X 4 = ∑ i = 1 n ∑ j = 1 m D W i B j A k
where X 4 is the distance index from surface water sources used to analyze the suitability of the medium host from embedding to the soil surface when moisture still accumulates in the dry season. D W i is the distance from any surface water source i that goes out at any distance k, where k starts from 500 m, 1,000 m, 1,500 m, 2,000 m, and over.
X 5 = ∑ i = 1 n ∑ j = 1 m D S i B j A k
where X 5 is the distance index from the accumulated flow line of water used to analyze the suitability of the medium host regarding waterlogging and moisture accumulation in the dry season. D S i is the distance from any of the accumulated flow lines of water at any distance k where k starts from 500 m, 1,000 m, 1,500 m, 2,000 m, and over.
X 6 = ∑ i = 1 n T i A i k A k
where X 6 is the index of average surface temperature in any sub-basin used to analyze the suitability of the medium host from subsurface embedding to sub-basin. T i any grid temperature value in degrees Celsius. A i k is the total area of temperature at i degrees Celsius within the sub-basin boundary at k.
X 7 = ∑ i = 1 n N D M I i A i k A k
where X 7 is the average surface moisture index in any sub-basin used to analyze the suitability of host media from subsurface embedding in the sub-basin. N D M I i is any grid surface moisture value. A i k is the total area of surface moisture at i that is within the sub-basin boundary at k.
X 8 = ∑ i = 1 n N D V I i A i k A k
where X 8 is the average vegetation index in any sub-basin used to analyze the suitability of the medium host from subsurface embedding to sub-basin. N D V I i is any grid-normalized difference vegetation index value. A i k is the total area of vegetation index at i within the sub-basin boundary at k.
X 9 = ∑ i = 1 n S A V I i A i k A k
where X 9 is the vegetation index for adjusting the average soil in any sub-basin to analyze the suitability of the medium host from subsurface embedding in the sub-basin. S A V I i is the i-any grid soil adjusted vegetation index value. A i k is the total area of soil-adjusted vegetation index at i within the sub-basin boundary at k.

2.4. GWR Modeling

Surface moisture factors and surface cover indicator indicators analyzed using satellite images are represented by calculations of independent variables from X6 to X9. A GWR modeling study was used for analyzing spatial correlations to liver fluke infection (OV) from remote sensing data of sub-basin-level prototype areas. The research algorithm is divided into 3 stages: 1) Data collection and manipulation to collect and manage data for use in analyzing the relationship of liver flukes to watershed areas in sub-basins. Starting with the preparation of Landsat 8 OLI satellite imagery data used in the study, January–April 2019, 2020, and 2021, the dry season of each year is when mollusks are embedded in moist soils waiting for rain to come during the rainy season. A total of 12 satellite imagery data (4 images per year, 3 years) were taken to average the image points and used to calculate the indices (X6) temperature index, (X7) NDMI, (X8) NDVI, and (X9) SAVI for use as independent variables in the GWR model. 2) Independent variable screening and 3) alternative modeling. A detailed display of the steps can be shown as follows.
(1) Field surveys and GWR modeling for analyzing the relationship between liver flukes and spatial factors, including the normalized difference vegetation index (NDVI), which is a value that indicates the proportion of vegetation covering the surface by taking the near-infrared wave range (NIR) and the red wave range reflected from the surface to calculate the reflection difference, making the NDVI value between -1 and 1 if the plant does not have green leaves, which returns a similar value of 0, while the value 0 means no vegetation if there is a density of plants with green leaves equal to 1. The other index group is the soil reflection value. In this study, the SAVI (soil-adjusted vegetation index) refers to the ratio between the difference between the amount of energy reflection during the near-infrared wave (NIR) and the amount of energy reflection in the red light wave range to the sum of the amount of energy reflected during the near-infrared wave (NIR) and the energy reflection coefficient of the soil, and the SAVI refers to the vegetation index calculated from two times the sum of the near-infrared waves (NIR) plus one minus the square root. Taking the difference between doubling the near-infrared wave (NIR) plus one all squared and eight times the near-infrared wave (NIR) minus the total red wave divided by two, the two indices range from negative to maximum to 1, where the index values that are suitable for the habitation of the liver fluke medium host are approximately -0.2 to 0.2 of the SAVI index. The following is an explanation of the workflow of the GWR model, as shown in Figure 4.
(2) The GWR model uses the principle of estimating the coefficients of the equation with the same squared method as the conventional linear GWR model, but the creation of a variable dataset is a geostatistical statistic that can generate a dataset from a smaller sample but retain a Z value that is similar to the original Z value. The area that seems to be the ideal area for shellfish implantation is the buffer area away from the accumulated flow line of water [20]. The variable data according to the data are generated as points of the village location where the OV data were surveyed; the independent variable group 1 (spatial variables) were represented as variable X5 (distance index from the flow accumulation lines); the mean of the line length, the level 3 to 3 water flow level, is a variable that shows the likelihood of embedding the host's intermediary of liver flukes along two sides of the stream by 500–2,000 meters. GWR creates a local regression equation for each feature in the dataset. When values for a cluster of spatial descriptive variables are available, problems with local multicollinearity are more likely. The conditional number (COND) field in the output feature class indicates when the result is unstable due to local multicollinearity.
(3) GWR modeling the relationship between liver fluke, other types of parasites, and spatial factors uses a local model of spatial statistics, i.e., a model created specifically for each sub-basin, which allows for predicting liver fluke and other types of parasites and analyzing relationships more accurately than traditional models such as the global model, and multiple regression method.
GWR is a geo-weighted regression model. The model serves to determine the coefficient of the relationship between the independent and dependent variables using the distance reciprocal weighting method, which differs in results from the original method (OLS), where GWR obtains a model to predict every unit area with a difference in coefficients [9,21,22]. GWR modeling must create a data layer based on this research, namely the percentage of liver fluke infection of the sub-basin region to be analyzed from 5-meter DEM data, the import of independent variables consisting of index variables generated from the wavelength correlation of satellite images in mathematical functions, and other spatial factors such as distance from water bodies and roads.
The GWR model uses sub-spatial statistics to find the relationship between independent and dependent variables and analyzes a polylinear regression equation to estimate the regression coefficient at each linear regression point or survey point, as shown in Equation 10 [25].
Y i = β 0 u i v i + β 1 u i v i x 1 + β 2 u i v i x 2 . . . . + β k u i v i x k + ε i
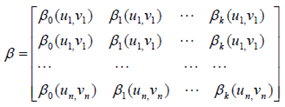
where u i v i are the orthogonal coordinates at each linear regression point. β k u i v i is the regression coefficient estimated at each linear regression point. At each linear regression point, the regression coefficient (β) of each independent variable (X) is estimated as a matrix of n×(k +1). Therefore, there is a regression coefficient at each linear regression point, as shown in Equation 11.
Preprints 76364 i001
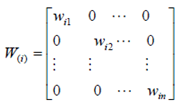
Weighting at each linear regression point (i) is in the form of a diagonal matrix to perform weighting (Wi) at each linear regression point (i), where the oblique matrix is n× n, as shown in Equation 12.
Preprints 76364 i002
The GWR model is an analysis of multiple linear regression equations at each linear regression point that must be weighted to focus on the data. The regression coefficient is then estimated, as shown in Equation 13.
β ( i ) = ( X T W ( i ) X ) − 1 X T W ( i ) y
The expected outcome is a set of independent variables that illustrates the relationship between independent variables and dependent variables obtained using geographically weighted analysis of polylinear regression equations with the difference in independent variables affecting dependent variables in each sub-region (spatial nit). Therefore, if it is possible to analyze the spatial characteristics of the distribution of each type of parasite, the agency or organization can know the areas where the analysis results are used to correctly manage the parasite infection prevention system [35]. Preventing future illnesses can help communities stay healthy and reduce the burden of medical expenses.

3. Results

3.1. Spatial Unit Design

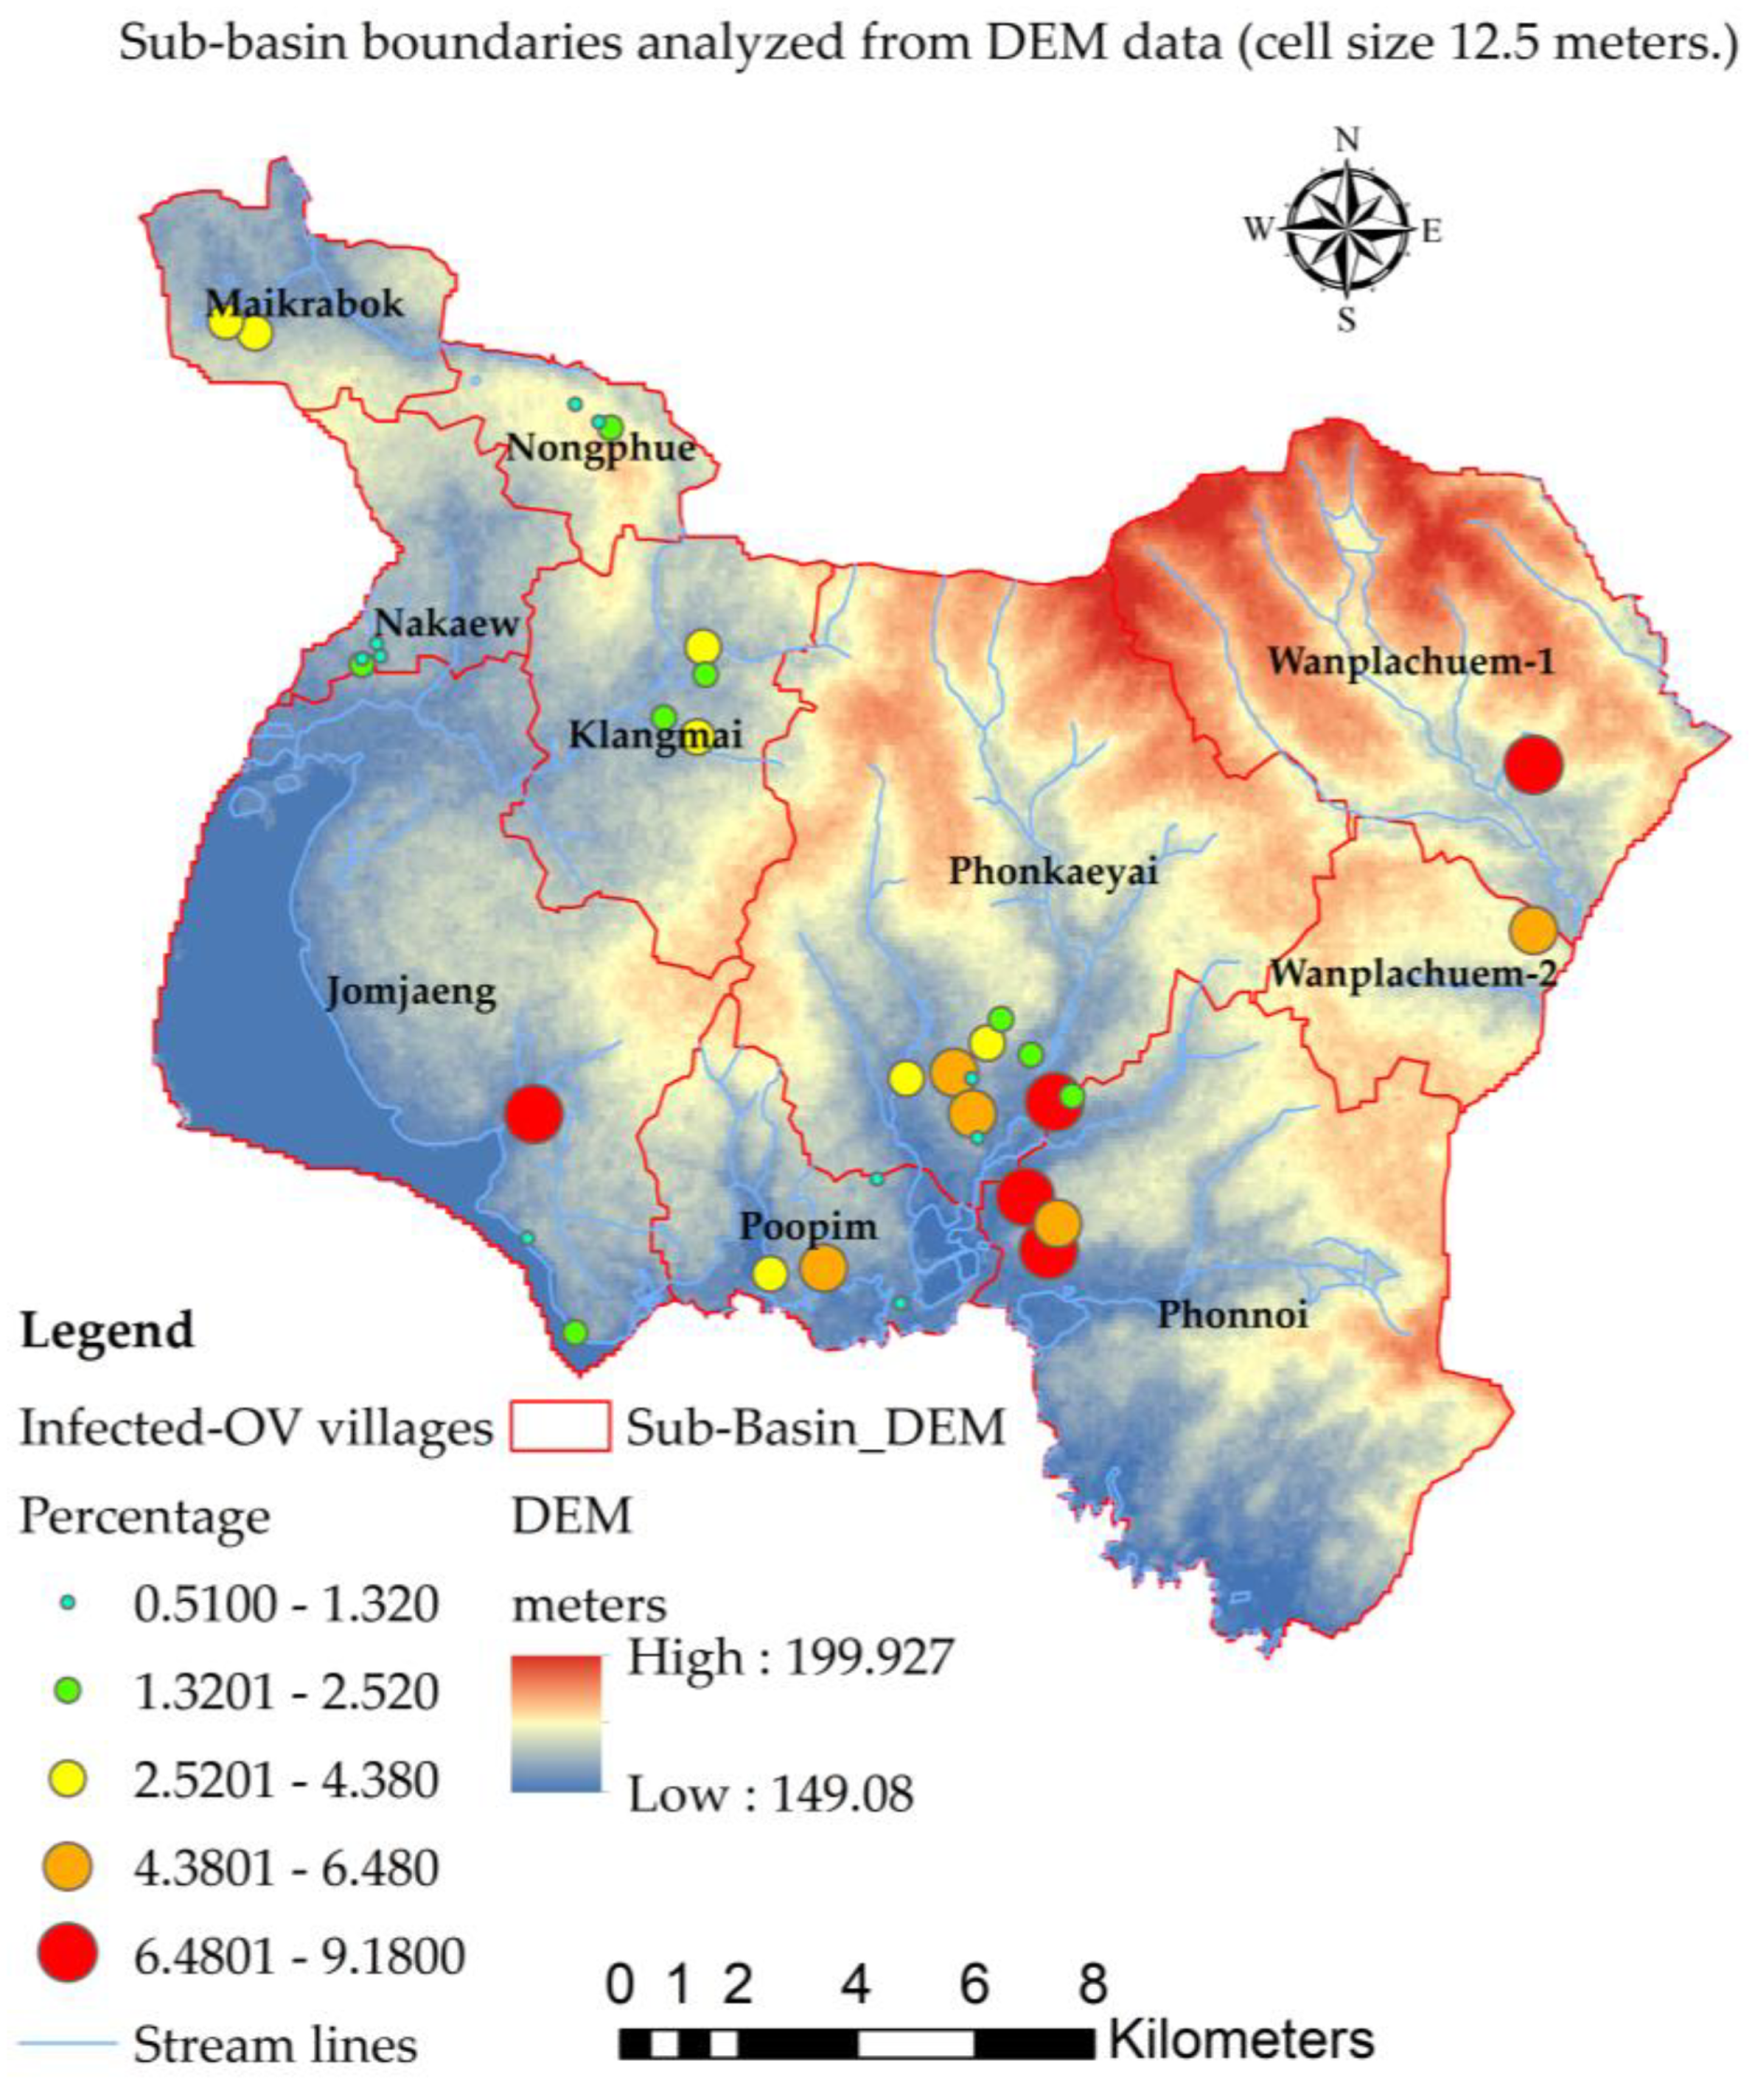
Spatial subspace unit boundaries need to be created to define the amount of data. In this study, using digital elevation model (DEM) data with a cell size of 12.5 meters to generate sub-basin layer data, the results of the analysis were obtained from 10 sub-basin boundaries, sub-basins distributed according to the flow sequence level (3 to 6) from upstream to downstream at the marshes shown in Figure 5, and other descriptive information of the sub-basin, such as its size. The perimeter length and average height of unit area are shown in Table 2. The DEM dataset was readjusted for spatial height using the fill and sink function, which is a hydrological analysis method that uses GIS processes to process the altitude data as realistically as possible and enable continuous water flow analysis.
The highest spatial height mean was 180.397 meters at the river basin named Wanplachuem-1, followed by the Wanplachuem-2 and Phonkaeyai basins. They have values of 174.412 and 172.894 meters, respectively, with the upper basin of Phon Na Kaeo district being considered a basin of this height. However, even though it is in the upper basin, there is a high percentage of people infected with OV in these areas. Due to the multiple seasons, flooding causes surface water to flood up to the upper basin, making it possible for intermediate host mollusks and carp groups to move to feed in these areas.
Regarding the watershed with the highest risk of infection, when analyzed using DEM data, it was found that the Jomjaeng, Poopim, and Phonnoi basins had lower average height than other basins, and when looking at the percentage of infected persons, the percentage of infected persons was higher than 6.48 percent, as well as other species found in the river basin in this area, have a very high risk of having liver fluke eggs. The case percentage data shown as points is converted into raster data with a heat map command to use this raster data to find the average of the percentage infected and link it with other independent variable data using raster image, as shown in Figure 6. The display of the case percentage data shows the continuity of the number of infected people, so that the average calculation is equal for all sub-basins, but it will vary depending on the large and small values of the points used to calculate the raster. In this case, the Z value is the percentage of infected people in the village position. The radius of creating a raster map using a heatmap is from 2 km,4 km, and 6 km so that raster data can be connected to all subtleties. Green areas show sparse percentages of infected people, and red areas show density and high chance of encountering infected people. The GWR model requires a continuity value of raster data, where the creation of heatmaps of infected people enables consistent analysis of positional data and other raster of independent variables and can generate trend graphs.

3.2. Distribution of Independent Variables

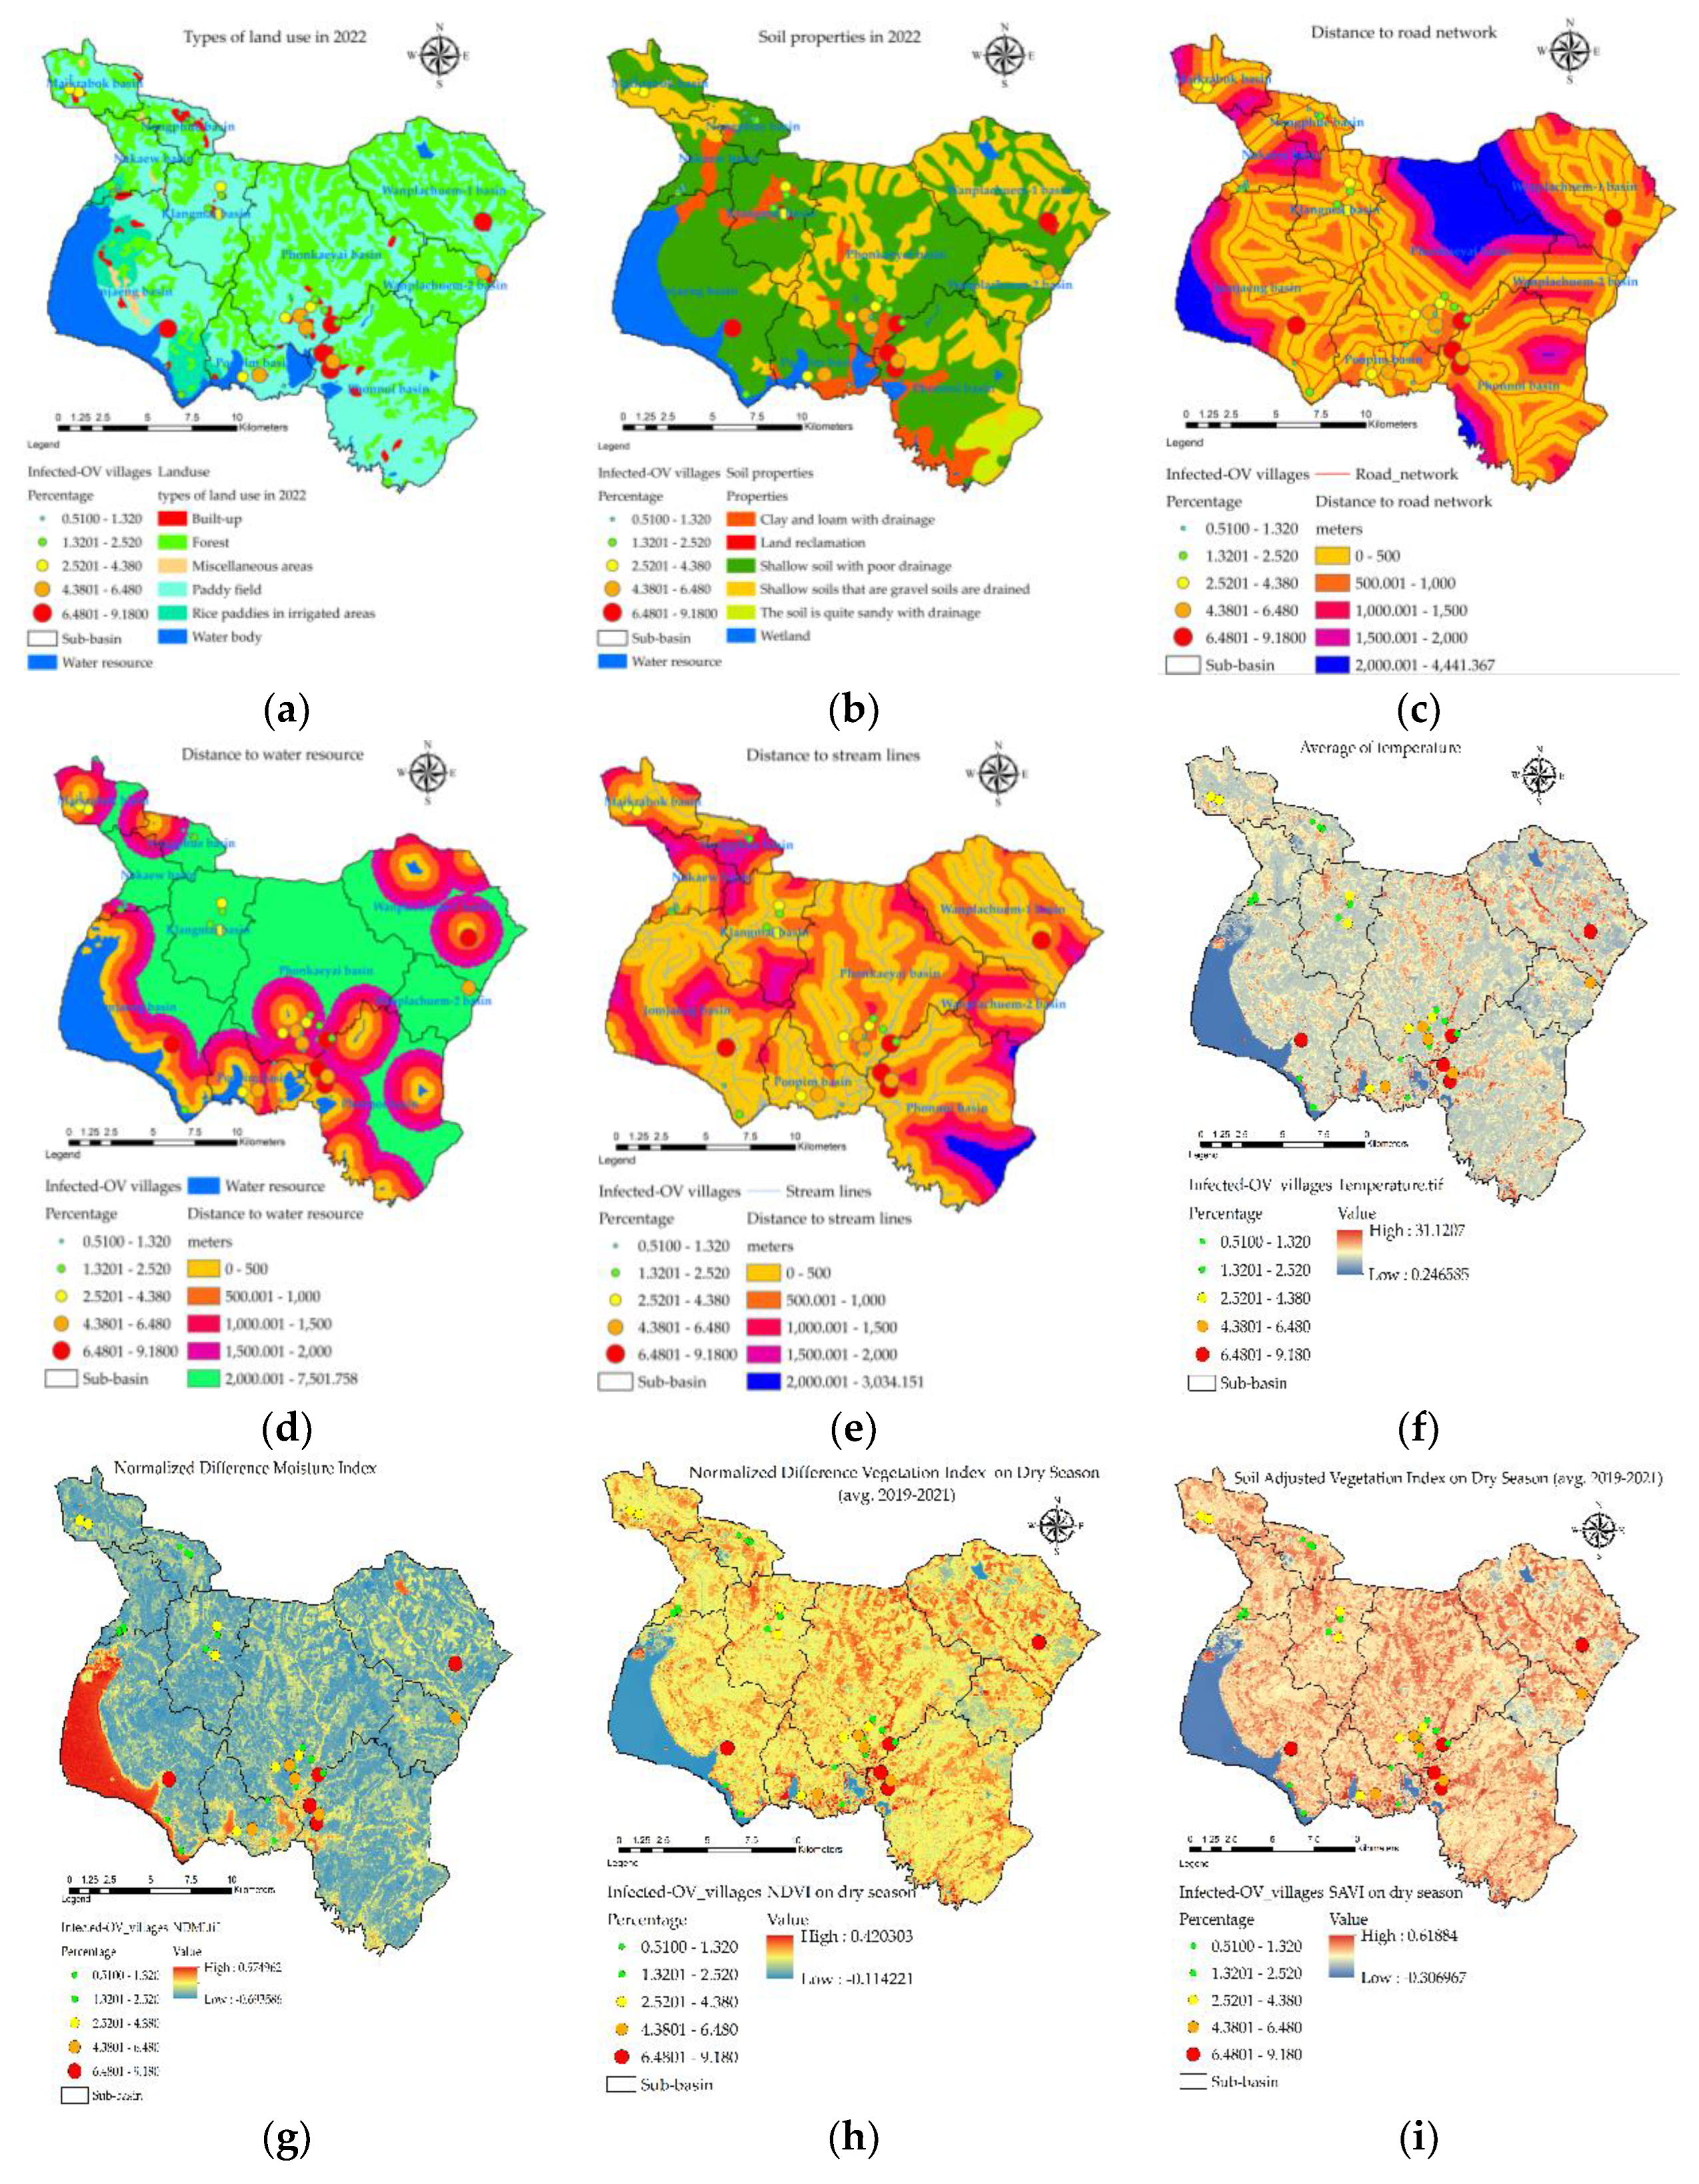
The values of the indexes of the nine independent variables used to create mathematical models from Equations 1 to 9 are shown as descriptive data values, as shown in Table 3, and the results of analysis are shown in Figure 7. An important step in the GIS process used in the creation of multi-raster and vector, all methods of spatial data interpolation were used in the preparation of independent variable sets with ArcGIS pro version 2.90. The percentage of cases was very high in the Wanplachuem-1, Phonnoi, and Wanplachuem-2 sub-basins, with values of 9.18, 7.84, and 6.489 respectively. The areas of the three watersheds are adjacent to each other and connected by an outlet. When observing the values of almost all indices of the river basin, Wanplachuem-2 is more valuable than other basins because the value of the index is divided by the size of the smaller basin area more than the other basins. Spatial units of the sub-basin with similar island index values of the X1 index for Jomjaeng, Phonnoi, and Phonkaeyai are 14.773, 17.688, and 14.279, respectively. The island values of X2 for Wanplachuem-2, Klangmai, and Nakaew are 24.128, 24.577, and 29.858, respectively. The island groups of X3, X4, and X5 are in the same basin: Jomjaeng, Phonnoi, Phonkaeyai, Wanplachuem-1. The groups of remote-sensing indices are not very different, but they need to be analyzed together with other factors in GWR modeling and screened for duplication of factors again using correlation analysis. Different groups of factor index values require data standardization using mathematical models. Standardizing data to a comparable range allows GWR models to increase the accuracy of build and fit models better than using raw data directly to import models.
The results of the raster map data of the X1 variant were distributed within a buffer distance of up to 500 meters, distributed over most areas of all sub-basins, and the results were similar to the X3 index values, but there was a difference in the upper basin areas with low index values due to the lack of road networks. The X4 and X5 index map values showed high scores scattered mainly in the lower basin and low values scattered in the upper areas because the lower ones are close to large freshwater marshes. The X6 index shows the distribution of the intermediate index mainly on the map, Figure 7(f) shows yellow with a flat surface temperature in the range of 26–28 degrees Celsius, while high-temperature areas are shown in red and are mostly structures such as road and village structures. The X7 index shows the distribution of high-level indices that are suitable habitat substrate host areas, mainly areas near water bodies with index values greater than 0.6 or more. The X8 and X9 indices are similarly distributed because they are made of vegetation index, but the X9 index adds a constant value to make the vegetation value more reflective, both of which can be used interchangeably. To ensure modeling, consistency results can be observed from correlation, and the red area of both indices indicates that they are suitable areas similar to the X7 index.

3.3. Selected the Influence Factors Associated with Spatial Liver Fluke (Opisthorchis viverrini) Infection

Independent variable redundancy needs to be reduced in the number of variables so that GWR models can still create models that maintain R2 values at acceptable levels [36]. Spatial correlation analysis was the method used to screen for independent variables [37] in this study. The group of independent variables is classified into two groups: variables generated from vector data solving factors X1 to X5, which are characterized by points, polylines, and polygons. Importing this type of datum that is analyzed together with other variables does not require first generating raster data and assigning score values to different data ranges to measurable standards. The factors X6 to X9 are already raster data, but they were calculated in the form of mathematical models to standardize the data so that they could be correlated with the previous set of variables. Table 4 shows that factors X3 to X5 are negatively correlated with the percentage of people infected with OV, which suggests that the longer the distance away from that set of factors, the lower the chance of catching the fluke, but in contrast, the closer the distance is, the greater the risk of infection if fish is consumed within the nearby radius. Factors X1 and X2 show that the poorer the drainage, the greater the risk of infection because the soil can retain moisture better than well-drained soil, and the more agricultural and agricultural land use near irrigation canals, the more moisture the soil surface has to use than other types of land. When analyzing the correlation of vector factors, factor X5 can represent factors X1 to X4 because it correlates with the percentage of infected people—0.226. The factors X1 and X4 are 0.985, 0.838, 0.984, and 0.612, respectively.
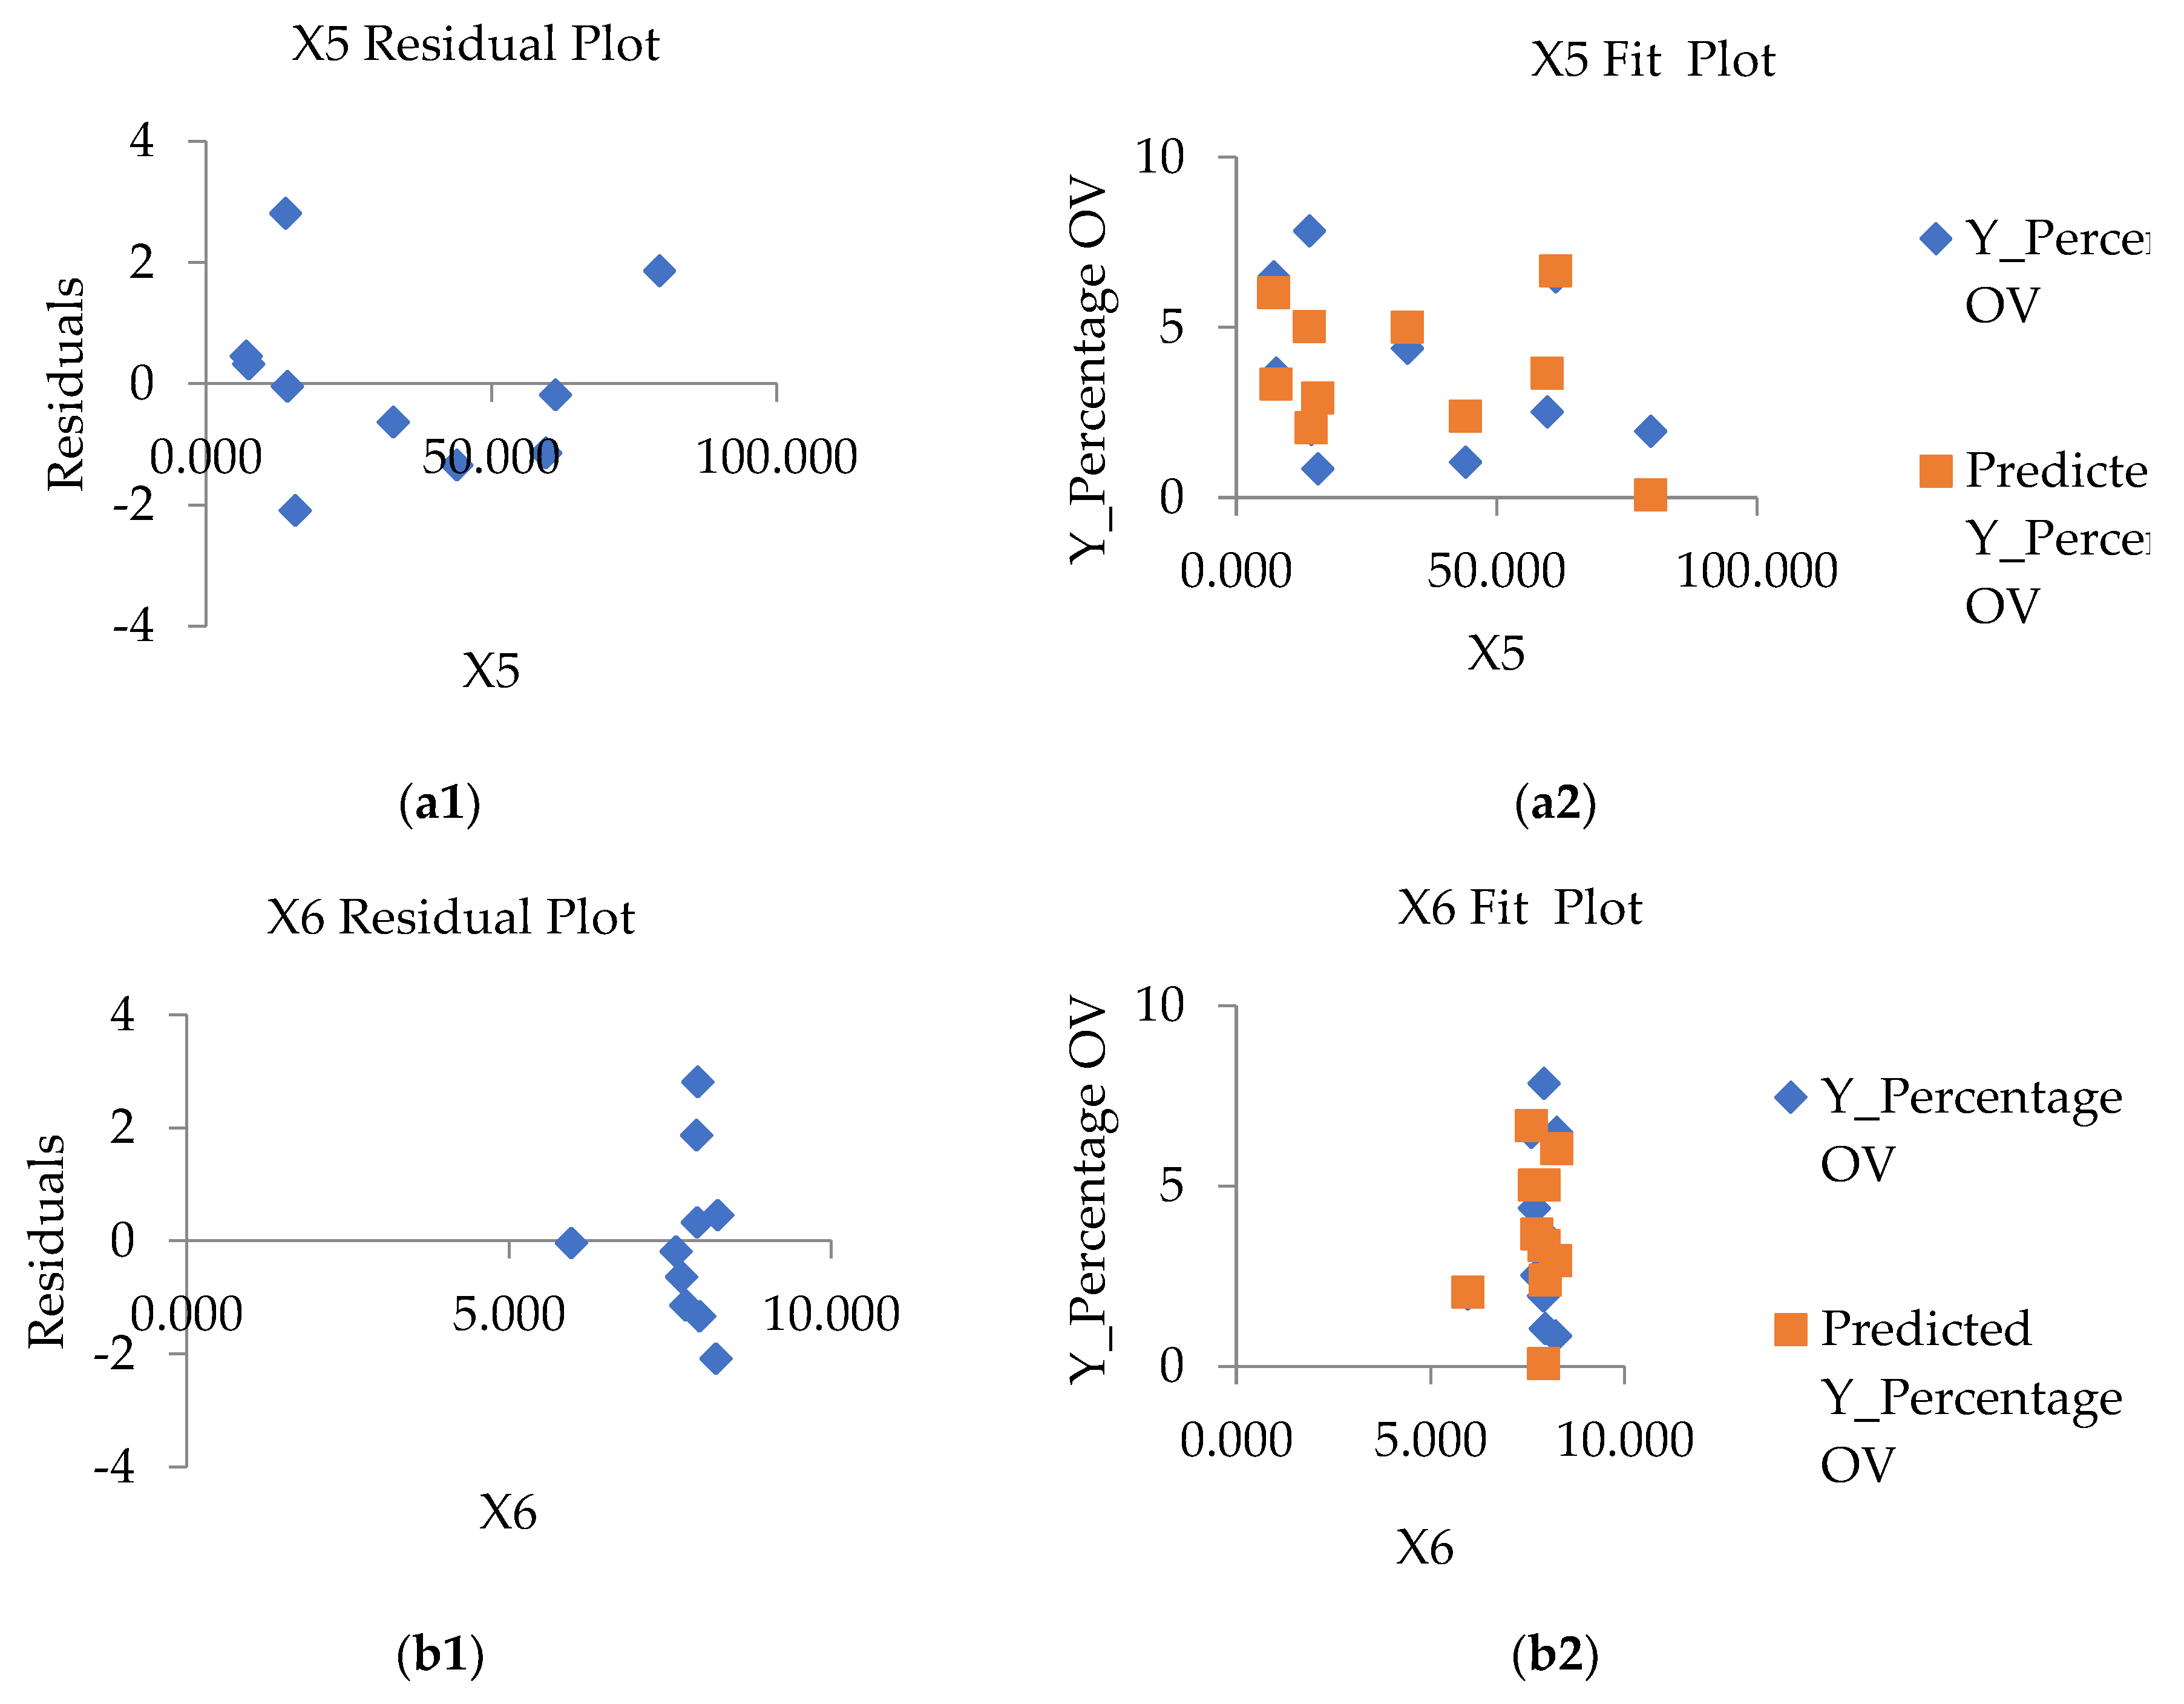
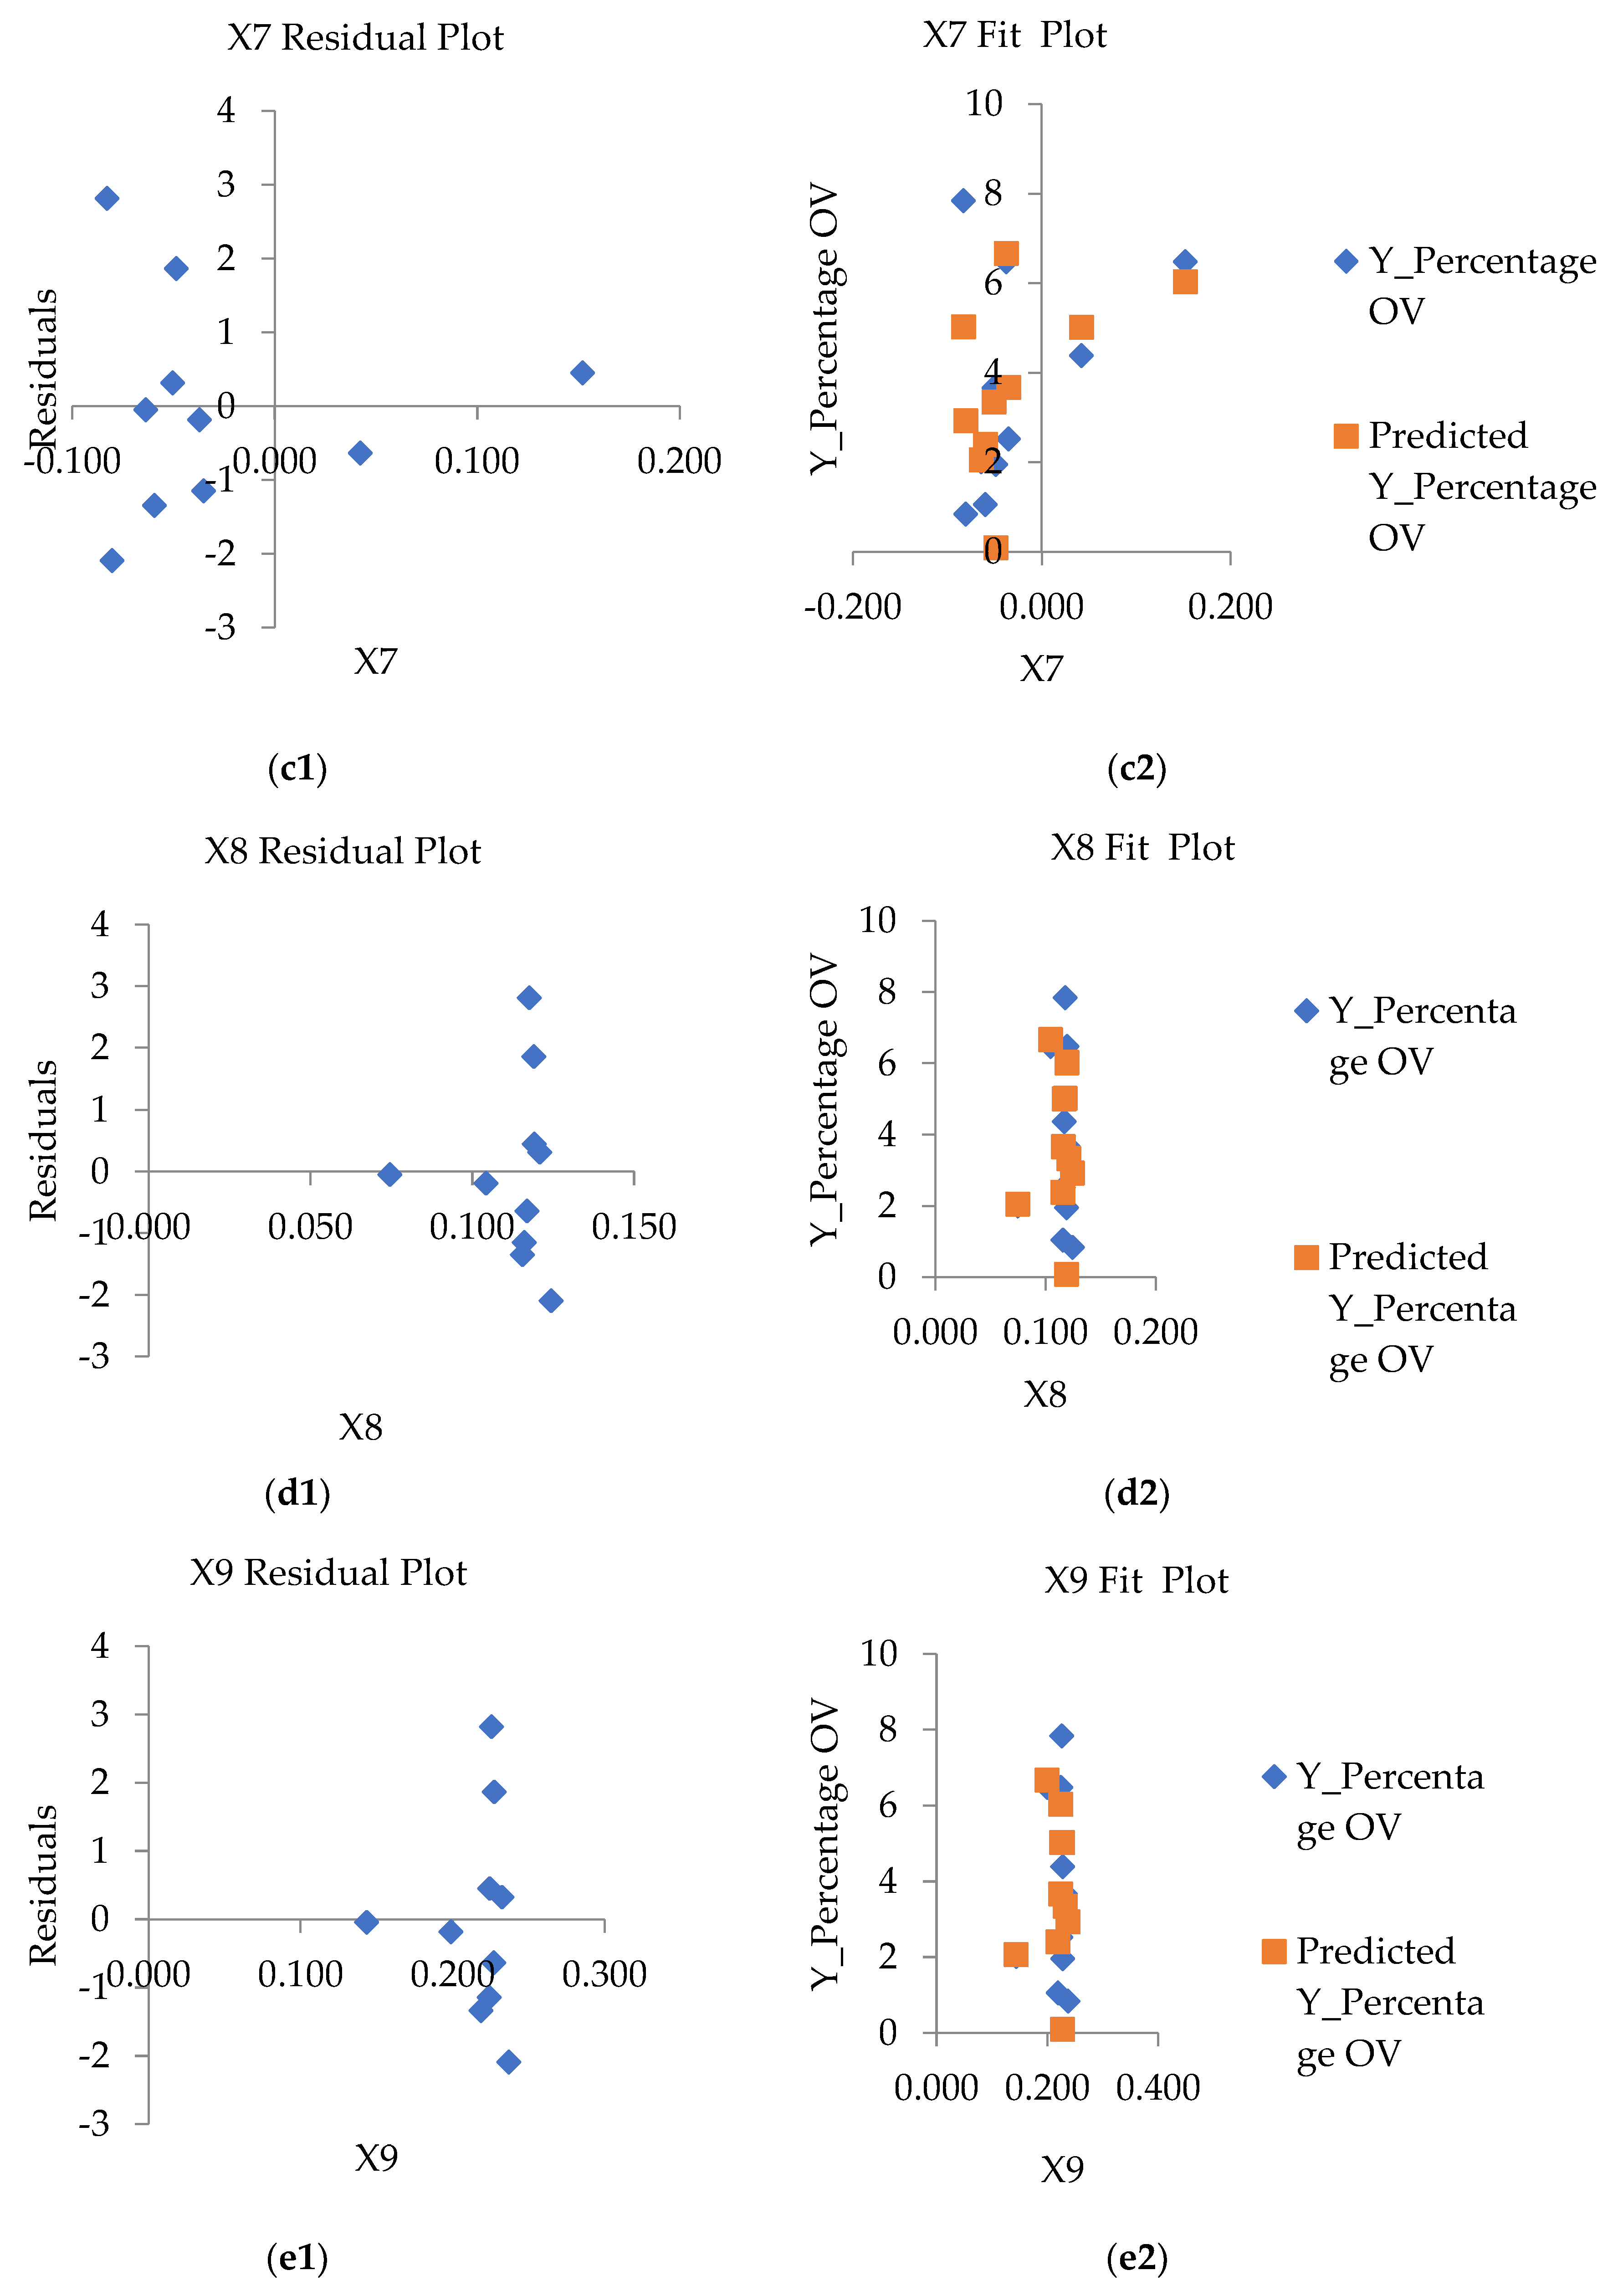
In addition to screening the variables that were used to create the GWR model, namely the set of independent variables X5 to X9, this set of variables was used to create correlation graphs to analyze the regression of the model. To determine the properties of regression patterns, two methods of residual plot graph analysis were used. The first is residual plots, which is a plot of values. Residuals are estimates of Y (% of OV)-fitted values, and should be randomly distributed when observations occur. The second method is to plot the normal probability plots of the error coupled with the expected value. If the plot is shaped close to a straight line, the discrepancy has a normal distribution. The X5 variable set demonstrates the normal distribution of data compared to the variables according to the section. The variables X6 to X9 have a vertical distribution of the dataset, which translates into a narrow range of index values that can predict the percentage of infections over a wide range, as shown in Figure 8.

3.4. Optimal GWR Model for Predicted With Liver Fluke (Opisthorchis viverrini) Infection

Comparing multiple alternative models increases the chance of selecting the right model to predict [38,39]. Spatial factor correlation simulation is the use of an independent group of variables as an alternative to GWR modeling to visualize trends of tolerances at the small area unit level. The set of independent variables imported into GWR models was selected using correlation analysis, and the variables X5 to X9 were selected, simulated, and displayed, as shown in Table 5. An appropriate GWR model to predict the percentage of infected people can be observed from the analysis results; R2 is high. The variable is significant at a high level (i.e., t-statistics are very high or p-value is very low) [40,41]. The results of the models in the table compared the precision between GWR and OLS (ordinary least square) models to visualize the difference in the accuracy of the models [42].
The alternative model proposes four alternative models: Y%ov1, Y%ov2, Y%ov3, and Y%ov4, as shown in Table 5. The results of GWR model 1 (Y%ov1) imported two independent variables, X8ndvi and X9savi, to test whether they were expected to be positive per percentage of infected people. Results of Monte Carlo test table for spatial non-stationarity [18,20], and R2 values are compared to OLS models. The model shows positive coefficients on the scales of 1.525 and 6.021, respectively, and t-stat values of 0.918 and 2.152, and p-values of 0.236 and 0.135, indicating that both factors have not yet correlated significantly with the percentage of infected people. Additionally, the model displays the R2 value of the GWR model that is higher than the 0.463 level of the OLS model rather than 0.445. Both factors show an acceptable level of relationship with R2 and therefore need to be tested in the second alternative model.
The 2nd GWR model (Y%ov2) shows the correlation coefficient of factors X7ndmi and X8ndvi positively, but the X9savi factor begins to show negative results indicating that the more areas of separation between vegetation covers, the lower the percentage of infected people. The X9savi factor showed statistical significance with a t-stat (-2.336) greater than the other two factors and a p-value (0.038) of less than 0.05, which made it possible to find a tendency that the mid-range and less-than-peak soil correction index factors increased the chance of a percentage of people infected with liver fluke. Alternative models 3 and 4 incorporated the X5stream factor into the model, resulting in an increase in R2 accuracy to 0.624 and 0.646. The coefficients of X5stream and X9savi reveal a t-stat and p-value that are more significant than other variables and show a negative trend together. An optimal GWR model for predicting case percentage was model 3 (Y%ov3) because it can provide a confidence level greater than 62% and there are still not too many independent variables that can cause prediction results to be inaccurate even if model 4 (Y%ov4) has a higher R2 value, but it may cause duplication of the independent variable set and coincidence resulting in higher R2 trade.
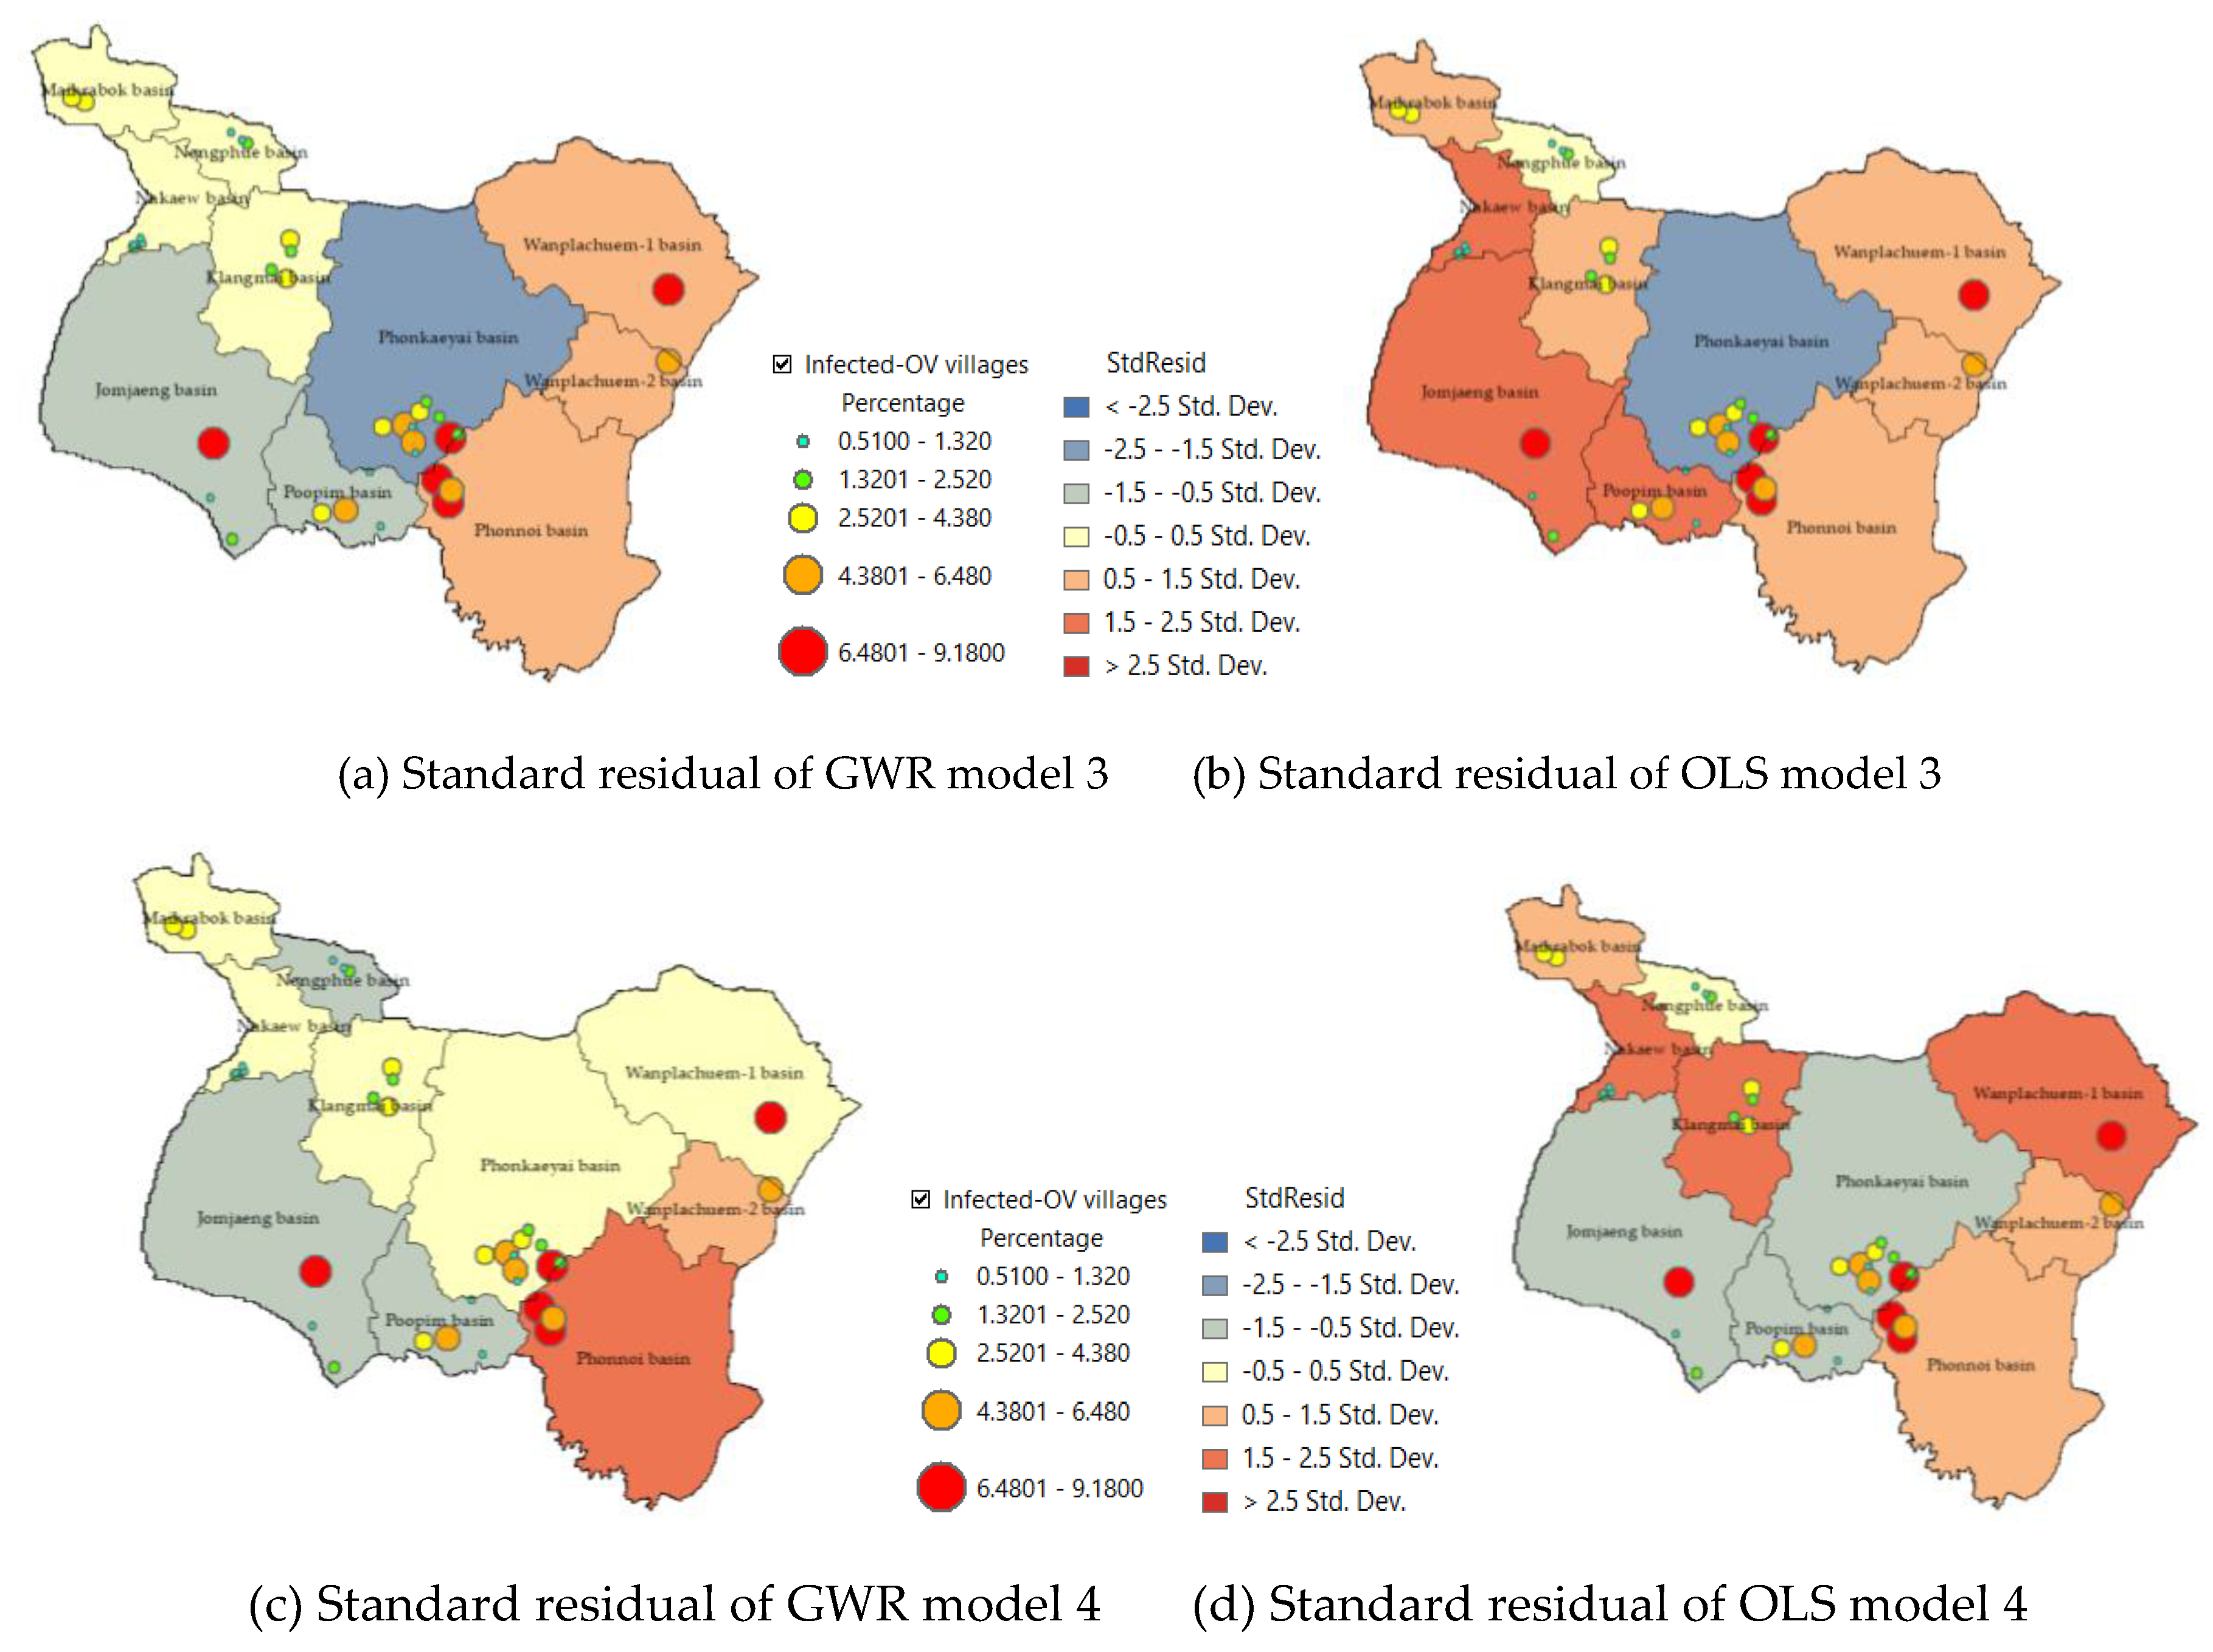
The standard residual index (SR) was used to determine the prediction accuracy of a model as an index used to verify the accuracy of a model by displaying the standard value in intervals of 0.5 [20,25], as shown in Figure 9. Sub-basin units with SR values ranging from -0.5 to 0.5 are sub-basin areas where GWR models can predict accurately and have lower tolerances than other areas. Sub-basins Maikrabok, Nongphue, Nakaew, and Klangmai that show the range of -0.5 to 0.5 are shown in yellow in GWR model3 and have a tolerance 3 units lower than OLS models. It is also confirmed by the SR results obtained from GWR model 4 (Y%ov4) that the deviation area has the same direction and can reduce the number of units of the discrepancy area even more, namely the sub-basin areas named Wanplachuem-1 and Phonkaeyai, respectively. The results of this SR index analysis were used to design a policy for reducing the suitability of embedding the medium host in moist soils.

4. Discussion

4.1. Redundancy of Independent Variable Sets

A group of vector-type independent variables from X3(road), X4(water), and X5(stream) were redundant and automatically correlated spatially. This approach to analyzing this group of data measures the distance away from the vector data and is then generated using the Euclidean distance function and determines the score range according to the distance of infection risk, making this set of variables redundant. Before applying the three independent variables to the model, only the representative factor X5(stream) must be selected, but different from the X1(land use) and X2(soil) sets that are different types of datasets, which determine the scoring values of each type differently according to the relationship to infection. The raster variable set created from satellite imagery indices is also redundant in some indices, such as the X6(Temp), X8(ndvi), and X9(savi) variables. When the model is imported, it does not increase accuracy, and when observed using correlation, it is automatically correlated, while the X7(ndmi) factor can also create a trend for the model. The best modeling result is therefore the use of independent variables consisting of X5(stream), X7(ndmi), and X9(savi). Although the results were lower than the bulk inputs in model 4, the results of R2 and t-stat and p-value statistics were sufficient to confirm the selection of models and an appropriate set of independent variables to predict liver fluke cases in small basin systems. Mathematical modeling for adapting independent variable data to measurable standards is very important in creating GWR models, which are models that provide precision results based on the division of unit areas to suit the distribution of dependent variables.

4.2. Model Capabilities and Development Approaches in Other Areas

The GWR model uses the Gaussian model, which uses the method of determining the boundary distance away from the location where an infected person is found, generating raster data, as well as analyzing trends in data changes, which provides a way to increase the number of cells in the data and can graph the trend of independent variables more efficiently than other models [38,39]. Ensuring continuity of the surface of the data is an advantage of the GWR model's optimization approach. In addition, the model screens independent variables that significantly correlate fluke infection with t-stat and p-value indices to make the model compact and can control the number of factors and reduce redundancy. Important in applying the GWR model for predicting the percentage of fluke infections in a small area, it is necessary to create spatial units from the actual correlation formed of an independent set of variables. In this study, independent input of variables was recommended by the Sakon Nakhon Provincial Public Health Office, a local agency that has been studying liver fluke infection for a long time, but the agency wanted to know the in-depth relationship of spatial variables so that it could be used for policy formulation and spatial analysis to reduce the percentage of infected people.

4.3. Guidelines for Applying The Model to Provincial Public Health Policy

Guidelines for the prevention and control of liver fluke and bile duct cancer of the Sakon Nakhon Provincial Public Health Office are also included [30,33]: Organizing sanitation systems, managing sewage to break the parasite cycle; teaching and learning in schools and encouraging health literacy; screening for liver fluke in people aged 15 years and over; bile duct cancer screening in people aged 40 years and over with a history of risk and undergone ultrasound; systematic management of referral of suspected cholangiocarcinoma to diagnosis and treatment; safe food and a parasite-free fish campaign; and having a system for receiving and referring patients from hospitals to communities and reporting their performance through the reporting system of the Ministry of Public Health or the Isan Cohort database [18]. An examination of prevention and control practices revealed that this spatial model study approach can be used to support sanitation and sewage management policies to break the parasite cycle [2]. In addition, by continuously collecting data on the number of infected people, it is possible to analyze trends using the GWR model of infected people.

5. Conclusions

A GWR model was developed in this study to track liver fluke infection. This spatial statistical model is suitable for analysis at the local process level, and the results were compared to confirm that it is more accurate and more appropriate than OLS models in studies [20,21]. However, to make full use of the model, the spatial unit data layer should first be designed to separate the variables accordingly and independently [43,44,45]. Often, GWR models provide low coefficients of decision because subarea unit assignments are not suitable. In this study, it could be used as a prototype of a method for analyzing spatial relationships with liver fluke infections by creating sub-basin units with continuous adjacent boundaries. Local fluke case data should be continuously collected so that a curve can be created between the percentage of infected people and an independent set of variables. The factors used in this study are only prototypes of GWR model testing; in more advanced studies, spatial survey factors such as soil moisture in the field where mollusks are found should be used. Mathematical modeling is used to adjust database measures so that they can be measured together as an alternative approach to optimizing the prediction of the model [22]. Finally, the results of this study can guide the creation of spatial models at the scale of small watersheds to track spatial infections of liver fluke in other areas with similar watershed characteristics.

Author Contributions

Conceptualization, B.P. and P.L.; methodology, B.P.; validation, T.B., P.K., A.W., and E.L.; formal analysis, S.B.; data collection, A.A., K.B., and B.P.; writing—original draft preparation, P.L.; writing—review and editing, P.L and D.S.; supervision, P.L.; project administration, B.P and P.L. All the authors have read and agreed to the published version of the manuscript.

Funding

This research project was financially supported by Mahasarakham University in 2023 for spatial analysis and GIS laboratory usage. This work was supported by the Fundamental Fund FY 2022 granted by the Thailand Science Research and Innovation and funding through Sakon Nakhon Rajabhat University for analysis of the percentage of people infected with liver fluke.

Institutional Review Board Statement

Not applicable.

Informed Consent Statement

Patient consent was waived due to using aggregated data for secondary data analysis.

Data Availability Statement

The data are available upon request. The copyright of ArcGIS pro 2.9 is subscription ID: 6875220XXX, customer number: 389XXX, customer name: Mahasarakham University. The datasets used and/or analyzed during the current study are available from the corresponding author upon reasonable request.

Acknowledgments

This research was supported by the Ponna Kaeo District Public Health Office. Sakon Nakhon province has integrated cooperation in knowledge development for the prevention and resolution of liver fluke and bile duct cancer health problems for the community. Thanks to the anonymous reviewers for their valuable feedback on the manuscript.

Conflicts of Interest

The authors declare no conflict of interest.

References

  1. Geadkaew-Krenc, A.; Krenc, D.; Thanongsaksrikul, J.; Grams, R.; Phadungsil, W.; Glab-ampai, K.; Chantree, P.; Martviset, P. Production and Immunological Characterization of ScFv Specific to Epitope of Opisthorchis Viverrini Rhophilin-Associated Tail Protein 1-like (OvROPN1L). Trop. Med. Infect. Dis. 2023, 8, 160. [Google Scholar] [CrossRef] [PubMed]
  2. Perakanya, P.; Ungcharoen, R.; Worrabannakorn, S.; Ongarj, P.; Artchayasawat, A.; Boonmars, T.; Boueroy, P. Prevalence and Risk Factors of Opisthorchis Viverrini Infection in Sakon Nakhon Province, Thailand. Trop. Med. Infect. Dis. 2022, 7, 6–8. [Google Scholar] [CrossRef] [PubMed]
  3. Sadaow, L.; Rodpai, R.; Janwan, P.; Boonroumkaew, P.; Sanpool, O.; Thanchomnang, T.; Yamasaki, H.; Ittiprasert, W.; Mann, V.H.; Brindley, P.J.; et al. An Innovative Test for the Rapid Detection of Specific IgG Antibodies in Human Whole-Blood for the Diagnosis of Opisthorchis Viverrini Infection. Trop. Med. Infect. Dis. 2022, 7. [Google Scholar] [CrossRef]
  4. Boonjaraspinyo, S.; Boonmars, T.; Ekobol, N.; Artchayasawat, A.; Sriraj, P.; Aukkanimart, R.; Pumhirunroj, B.; Sripan, P.; Songsri, J.; Juasook, A.; et al. Prevalence and Associated Risk Factors of Intestinal Parasitic Infections: A Population-Based Study in Phra Lap Sub-District, Mueang Khon Kaen District, Khon Kaen Province, Northeastern Thailand. Trop. Med. Infect. Dis. 2023, 8. [Google Scholar] [CrossRef]
  5. Sripa, B.; Bethony, J.M.; Sithithaworn, P.; Kaewkes, S.; Mairiang, E.; Loukas, A.; Mulvenna, J.; Laha, T.; Hotez, P.J.; Brindley, P.J. Opisthorchiasis and Opisthorchis-Associated Cholangiocarcinoma in Thailand and Laos. Acta Trop. 2011, 120 Suppl, S158–S168. [Google Scholar] [CrossRef]
  6. Prasongwatana, J.; Laummaunwai, P.; Boonmars, T.; Pinlaor, S. Viable Metacercariae of Opisthorchis Viverrini in Northeastern Thai Cyprinid Fish Dishes--as Part of a Rational Program for Control of O. Viverrini-Associated Cholangiocarcinoma. Parasitol. Res. 2013, 112, 1323–1327. [Google Scholar] [CrossRef]
  7. Sripa, B.; Kaewkes, S.; Sithithaworn, P.; Mairiang, E.; Laha, T.; Smout, M.; Pairojkul, C.; Bhudhisawasdi, V.; Tesana, S.; Thinkamrop, B.; et al. Liver Fluke Induces Cholangiocarcinoma. PLOS Med. 2007, 4, e201. [Google Scholar] [CrossRef]
  8. Sripa, B.; Brindley, P.J.; Mulvenna, J.; Laha, T.; Smout, M.J.; Mairiang, E.; Bethony, J.M.; Loukas, A. The Tumorigenic Liver Fluke Opisthorchis Viverrini–Multiple Pathways to Cancer. Trends Parasitol. 2012, 28, 395–407. [Google Scholar] [CrossRef]
  9. Sripa, B.; Tangkawattana, S.; Laha, T.; Kaewkes, S.; Mallory, F.F.; Smith, J.F.; Wilcox, B.A. Toward Integrated Opisthorchiasis Control in Northeast Thailand: The Lawa Project. Acta Trop. 2015, 141, 361–367. [Google Scholar] [CrossRef]
  10. Haswell-elkins, M.R.; SAtarug, S.; Elkins, D.B. Opisthorchis Viverrini Infection in Northeast Thailand and Its Relationship to Cholangiocarcinoma. J. Gastroenterol. Hepatol. 1992, 7, 538–548. [Google Scholar] [CrossRef] [PubMed]
  11. Mairiang, E.; Elkins, D.B.; Mairiang, P.; Chaiyakum, J.; Chamadol, N.; Loapaiboon, V.; Posri, S.; Sithithaworn, P.; Haswell-elkins, M. Relationship between Intensity of Opisthorchis Viverrini Infection and Hepatobiliary Disease Detected by Ultrasonography. J. Gastroenterol. Hepatol. 1992, 7, 17–21. [Google Scholar] [CrossRef]
  12. Pumhirunroj, B.; Aukkanimart, R. Liver Fluke-Infected Cyprinoid Fish in Northeastern Thailand (2016-2017). Southeast Asian J. Trop. Med. Public Health 2017, 51, 1–7. [Google Scholar]
  13. Pinlaor, S.; Onsurathum, S.; Boonmars, T.; Pinlaor, P.; Hongsrichan, N.; Chaidee, A.; Haonon, O.; Limviroj, W.; Tesana, S.; Kaewkes, S.; et al. Distribution and Abundance of Opisthorchis Viverrini Metacercariae in Cyprinid Fish in Northeastern Thailand. Korean J. Parasitol. 2013, 51, 703–710. [Google Scholar] [CrossRef]
  14. Suwannatrai, A.T.; Thinkhamrop, K.; Clements, A.C.A.; Kelly, M.; Suwannatrai, K.; Thinkhamrop, B.; Khuntikeo, N.; Gray, D.J.; Wangdi, K. Bayesian Spatial Analysis of Cholangiocarcinoma in Northeast Thailand. Sci. Rep. 2019, 9, 1–10. [Google Scholar] [CrossRef]
  15. Hasegawa, S.; Ikai, I.; Fujii, H.; Hatano, E.; Shimahara, Y. Surgical Resection of Hilar Cholangiocarcinoma: Analysis of Survival and Postoperative Complications. World J. Surg. 2007, 31, 1258–1265. [Google Scholar] [CrossRef]
  16. Thinkhamrop, K.; Suwannatrai, A.T.; Chamadol, N.; Khuntikeo, N.; Thinkhamrop, B.; Sarakarn, P.; Gray, D.J.; Wangdi, K.; Clements, A.C.A.; Kelly, M. Spatial Analysis of Hepatobiliary Abnormalities in a Population at High-Risk of Cholangiocarcinoma in Thailand. Sci. Rep. 2020, 10, 16855. [Google Scholar] [CrossRef]
  17. Pratumchart, K.; Suwannatrai, K.; Sereewong, C.; Thinkhamrop, K.; Chaiyos, J.; Boonmars, T.; Suwannatrai, A.T. Ecological Niche Model Based on Maximum Entropy for Mapping Distribution of Bithynia Siamensis Goniomphalos, First Intermediate Host Snail of Opisthorchis Viverrini in Thailand. Acta Trop. 2019, 193, 183–191. [Google Scholar] [CrossRef]
  18. Suwannatrai, A.T.; Thinkhamrop, K.; Clements, A.C.A.; Kelly, M.; Suwannatrai, K.; Thinkhamrop, B.; Khuntikeo, N.; Gray, D.J.; Wangdi, K. Bayesian Spatial Analysis of Cholangiocarcinoma in Northeast Thailand. Sci. Rep. 2019, 9, 14263. [Google Scholar] [CrossRef]
  19. Martviset, P.; Phadungsil, W.; Na-Bangchang, K.; Sungkhabut, W.; Panupornpong, T.; Prathaphan, P.; Torungkitmangmi, N.; Chaimon, S.; Wangboon, C.; Jamklang, M.; et al. Current Prevalence and Geographic Distribution of Helminth Infections in the Parasitic Endemic Areas of Rural Northeastern Thailand. BMC Public Health 2023, 23, 448. [Google Scholar] [CrossRef]
  20. Littidej, P.; Buasri, N. Built-up Growth Impacts on Digital Elevation Model and Flood Risk Susceptibility Prediction in Muaeng District, Nakhon Ratchasima (Thailand). Water (Switzerland) 2019, 11. [Google Scholar] [CrossRef]
  21. Littidej, P.; Uttha, T.; Pumhirunroj, B. Spatial Predictive Modeling of the Burning of Sugarcane Plots in Northeast Thailand with Selection of Factor Sets Using a GWR Model and Machine Learning Based on an ANN-CA. Symmetry (Basel). 2022, 14. [Google Scholar] [CrossRef]
  22. Prasertsri, N.; Littidej, P. Spatial Environmental Modeling for Wildfire Progression Accelerating Extent Analysis Using Geo-Informatics. Polish J. Environ. Stud. 2020, 29, 3249–3261. [Google Scholar] [CrossRef]
  23. Lu, B.; Charlton, M.; Fotheringham, A.S. Geographically Weighted Regression Using a Non-Euclidean Distance Metric with a Study on London House Price Data. Procedia Environ. Sci. 2011, 7, 92–97. [Google Scholar] [CrossRef]
  24. Lu, B.; Charlton, M.; Harris, P.; Fotheringham, A.S. Geographically Weighted Regression with a Non-Euclidean Distance Metric: A Case Study Using Hedonic House Price Data. Int. J. Geogr. Inf. Sci. 2014, 28, 660–681. [Google Scholar] [CrossRef]
  25. Fotheringham, A.; Charlton, M. Geographically Geographically Weighted Weighted Regression Regression A Stewart Fotheringham. 2014.
  26. Suwannahitatorn, P.; Webster, J.; Riley, S.; Mungthin, M.; Donnelly, C.A. Uncooked Fish Consumption among Those at Risk of Opisthorchis Viverrini Infection in Central Thailand. PLoS One 2019, 14, e0211540. [Google Scholar] [CrossRef]
  27. Sripa, B.; Kaewkes, S.; Intapan, P.M.; Maleewong, W.; Brindley, P.J. Chapter 11 - Food-Borne Trematodiases in Southeast Asia: Epidemiology, Pathology, Clinical Manifestation and Control. In Important Helminth Infections in Southeast Asia: Diversity and Potential for Control and Elimination, Part A; Zhou, X.-N., Bergquist, R., Olveda, R., Utzinger, J.B.T.-A. in P., Eds.; Academic Press, 2010; Vol. 72, pp. 305–350 ISBN 0065-308X.
  28. Qian, M.-B.; Utzinger, J.; Keiser, J.; Zhou, X.-N. Clonorchiasis. Lancet 2016, 387, 800–810. [Google Scholar] [CrossRef]
  29. Brindley, P.J.; Bachini, M.; Ilyas, S.I.; Khan, S.A.; Loukas, A.; Sirica, A.E.; Teh, B.T.; Wongkham, S.; Gores, G.J. Cholangiocarcinoma. Nat. Rev. Dis. Prim. 2021, 7. [Google Scholar] [CrossRef]
  30. Sakon Nakhon Provincial Public Health Office (SKKO). Annual Report 2023. 2023. Available online: https://skko.moph.go.th/dward/web/index.php?module=skko (accessed on 1 June 2022).
  31. Dao, T.T.H.; Van Bui, T.; Abatih, E.N.; Gabriël, S.; Nguyen, T.T.G.; Huynh, Q.H.; Van Nguyen, C.; Dorny, P. Opisthorchis Viverrini Infections and Associated Risk Factors in a Lowland Area of Binh Dinh Province, Central Vietnam. Acta Trop. 2016, 157, 151–157. [Google Scholar] [CrossRef]
  32. Ruantip, S.; Eamudomkarn, C.; Kopolrat, K.Y.; Sithithaworn, J.; Laha, T.; Sithithaworn, P. Analysis of Daily Variation for 3 and for 30 Days of Parasite-Specific IgG in Urine for Diagnosis of Strongyloidiasis by Enzyme-Linked Immunosorbent Assay. Acta Trop. 2021, 218, 105896. [Google Scholar] [CrossRef]
  33. The 8th Health District Office (Region, (R8)) Annual Report 2021. 2021. Available online: https://r8way.moph.go.th/r8way/index (accessed on 3 June 2022).
  34. Honjo, S.; Srivatanakul, P.; Sriplung, H.; Kikukawa, H.; Hanai, S.; Uchida, K.; Todoroki, T.; Jedpiyawongse, A.; Kittiwatanachot, P.; Sripa, B.; et al. Genetic and Environmental Determinants of Risk for Cholangiocarcinoma via Opisthorchis Viverrini in a Densely Infested Area in Nakhon Phanom, Northeast Thailand. Int. J. Cancer 2005, 117, 854–860. [Google Scholar] [CrossRef]
  35. Zhao, T.-T.; Feng, Y.-J.; Doanh, P.N.; Sayasone, S.; Khieu, V.; Nithikathkul, C.; Qian, M.-B.; Hao, Y.-T.; Lai, Y.-S. Model-Based Spatial-Temporal Mapping of Opisthorchiasis in Endemic Countries of Southeast Asia. Elife 2021, 10, e59755. [Google Scholar] [CrossRef]
  36. Forrer, A.; Sayasone, S.; Vounatsou, P.; Vonghachack, Y.; Bouakhasith, D.; Vogt, S.; Glaser, R.; Utzinger, J.; Akkhavong, K.; Odermatt, P. Spatial Distribution of, and Risk Factors for, Opisthorchis Viverrini Infection in Southern Lao PDR. PLoS Negl. Trop. Dis. 2012, 6, e1481. [Google Scholar] [CrossRef] [PubMed]
  37. Xia, J.; Jiang, S.; Peng, H.-J. Association between Liver Fluke Infection and Hepatobiliary Pathological Changes: A Systematic Review and Meta-Analysis. PLoS One 2015, 10, e0132673. [Google Scholar] [CrossRef] [PubMed]
  38. Brunton, L.A.; Alexander, N.; Wint, W.; Ashton, A.; Broughan, J.M. Using Geographically Weighted Regression to Explore the Spatially Heterogeneous Spread of Bovine Tuberculosis in England and Wales. Stoch. Environ. Res. Risk Assess. 2017, 31, 339–352. [Google Scholar] [CrossRef]
  39. Rujirakul, R.; Ueng-arporn, N.; Kaewpitoon, S.; Loyd, R.J.; Kaewthani, S.; Kaewpitoon, N. GIS-Based Spatial Statistical Analysis of Risk Areas for Liver Flukes in Surin Province of Thailand. Asian Pac. J. Cancer Prev. 2015, 16, 2323–2326. [Google Scholar] [CrossRef]
  40. Brunsdon, C.; Fotheringham, S.; Charlton, M. Geographically Weighted Regression-Modelling Spatial Non-Stationarity. J. R. Stat. Soc. Ser. D (The Stat. 1998, 47, 431–443. [Google Scholar]
  41. Comber, A.; Brunsdon, C.; Charlton, M.; Dong, G.; Harris, R.; Lu, B.; Lü, Y.; Murakami, D.; Nakaya, T.; Wang, Y.; et al. A Route Map for Successful Applications of Geographically Weighted Regression. 2023, 155–178. [CrossRef]
  42. Lu, B.; Hu, Y.; Murakami, D.; Brunsdon, C.; Comber, A.; Charlton, M.; Harris, P. High-Performance Solutions of Geographically Weighted Regression in R. Geo-spatial Inf. Sci. 2022, 25, 536–549. [Google Scholar] [CrossRef]
  43. Leong, Y.Y.; Yue, J.C. A Modification to Geographically Weighted Regression. Int. J. Health Geogr. 2017, 1–18. [Google Scholar] [CrossRef]
  44. Isazade, V.; Qasimi, A.B.; Dong, P.; Kaplan, G.; Isazade, E. Integration of Moran’s I, Geographically Weighted Regression (GWR), and Ordinary Least Square (OLS) Models in Spatiotemporal Modeling of COVID-19 Outbreak in Qom and Mazandaran Provinces, Iran. Model. Earth Syst. Environ. 2023. [Google Scholar] [CrossRef]
  45. Düzgün, H.S.; Kemeç, S. Spatial and Geographically Weighted Regression BT - Encyclopedia of GIS, Shekhar, S., Xiong, H., Eds.; Springer US: Boston, MA, 2008; ISBN 978-0-387-35973-1.
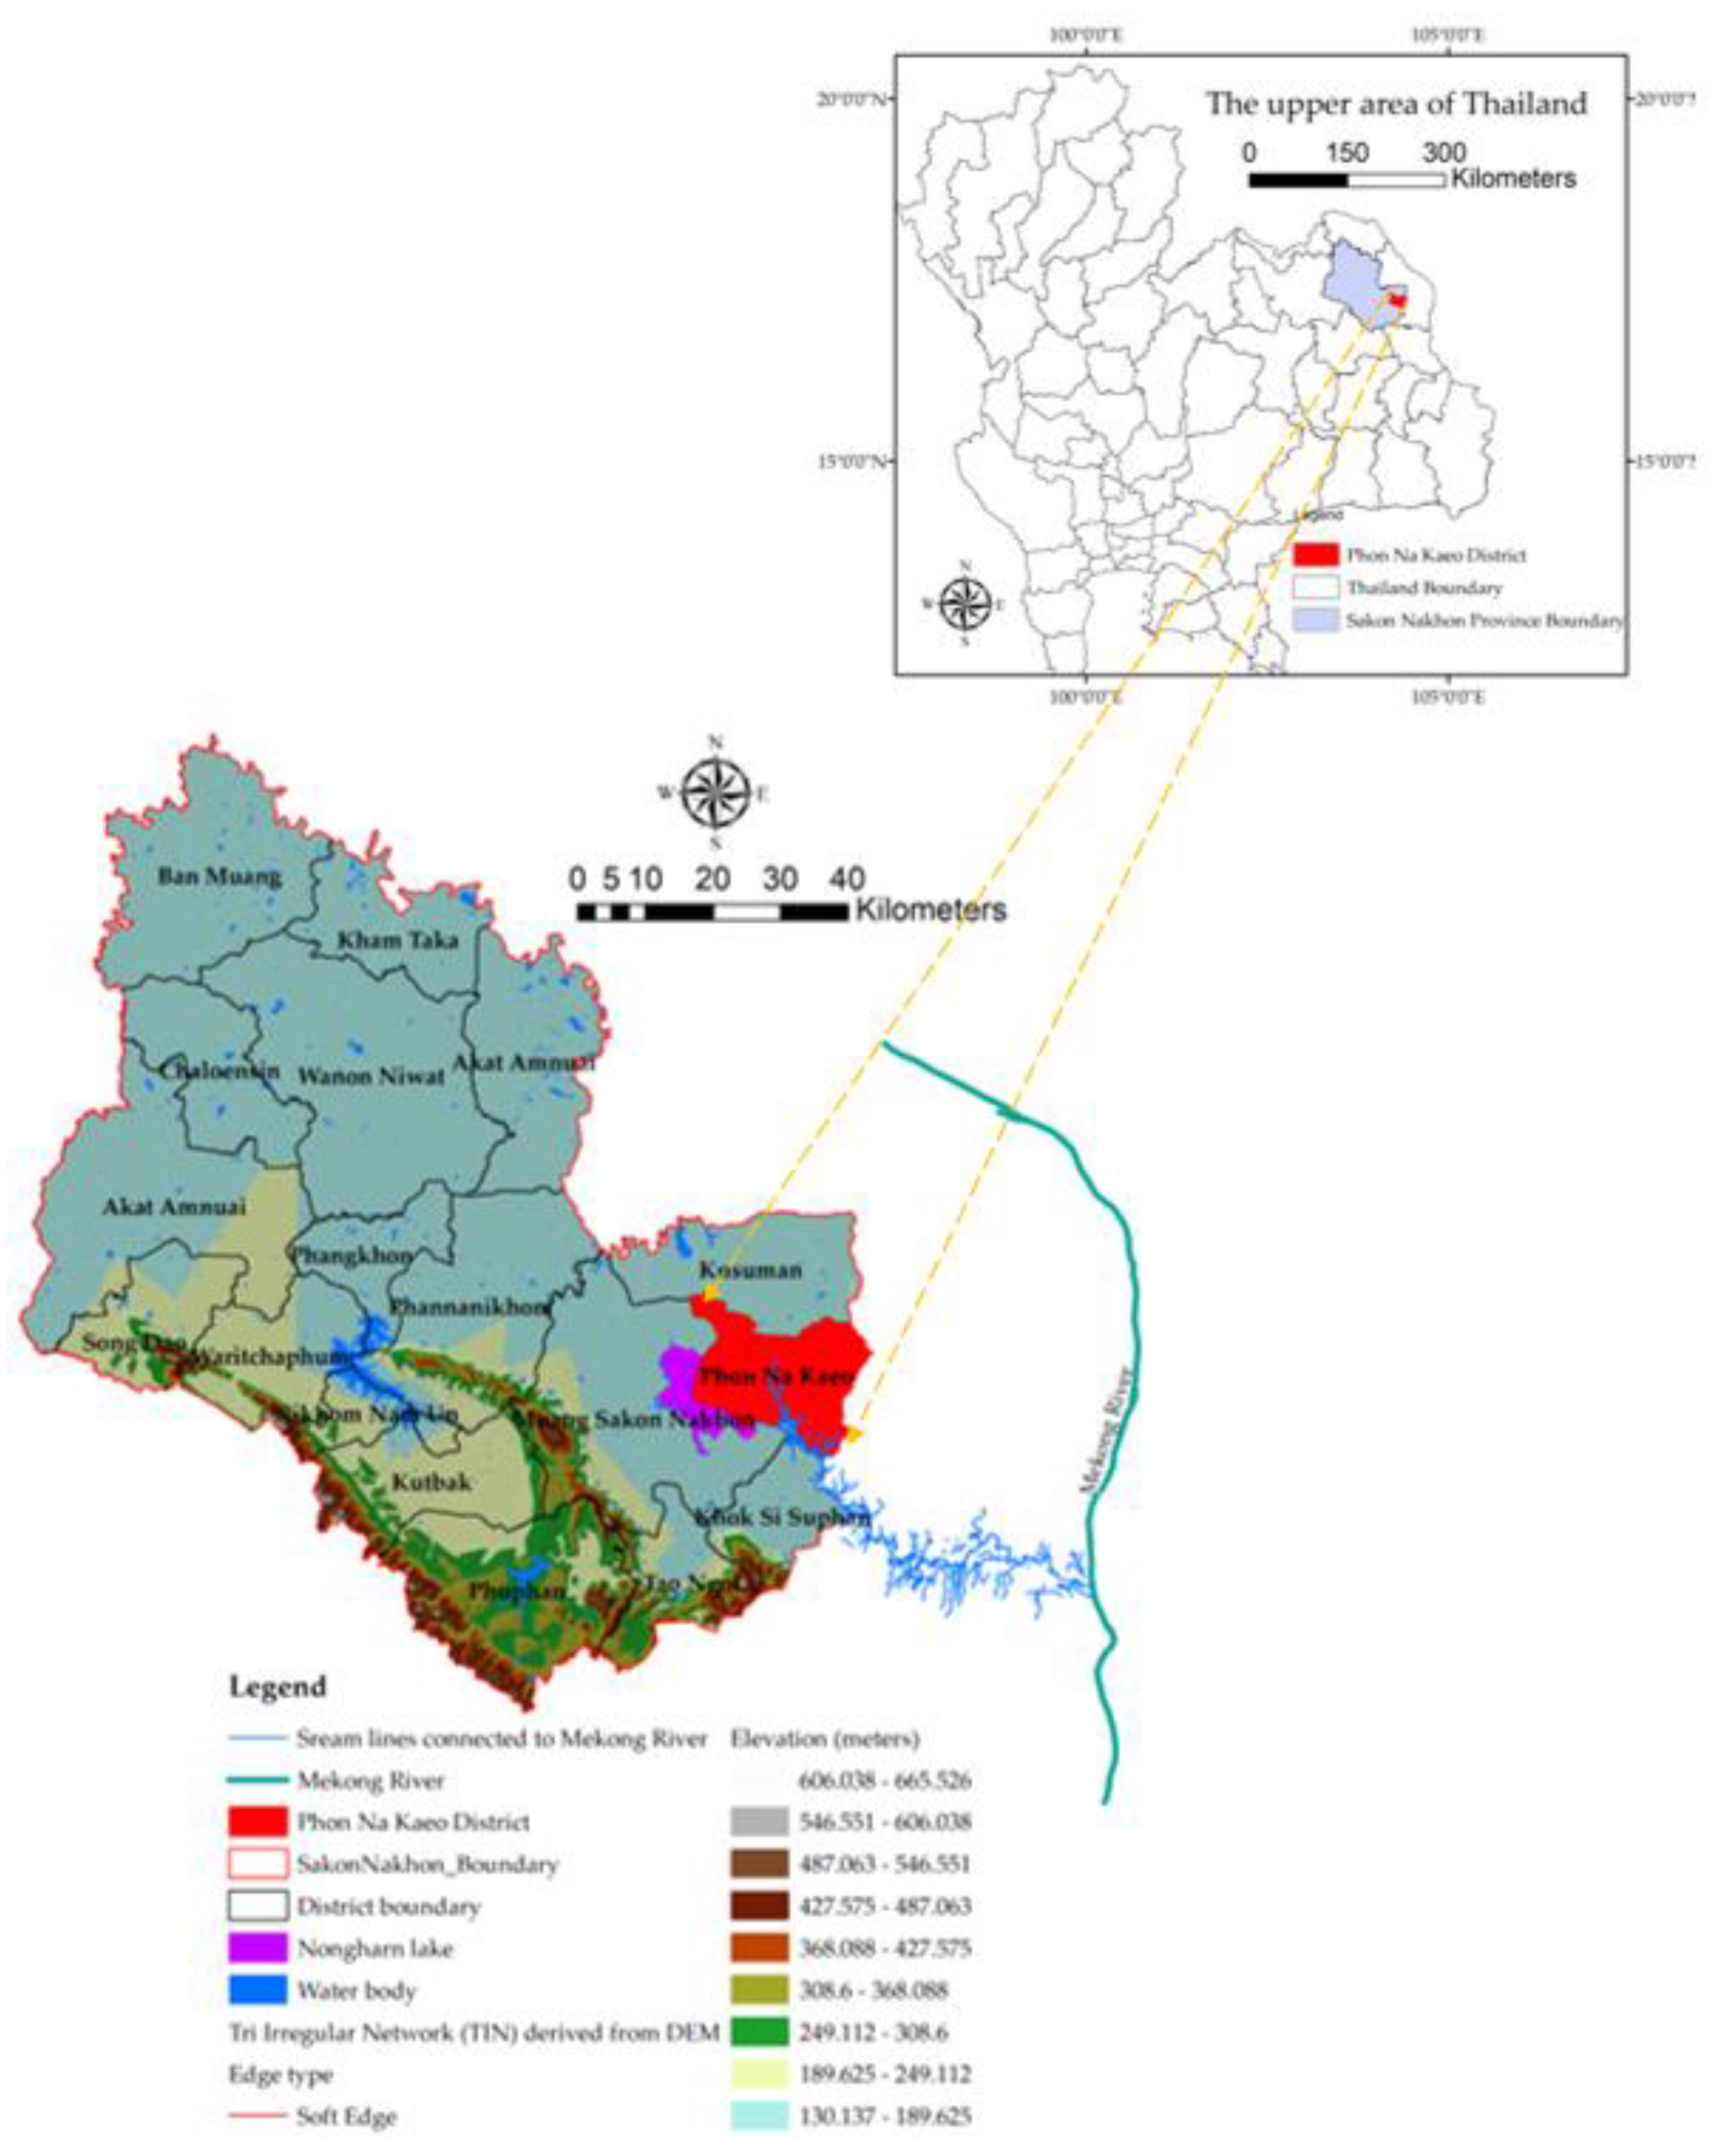
Figure 1. The boundaries of the study area show the proximity of freshwater bodies that are fish habitats to the Mekong River.
Preprints 76364 g001
Figure 2. Percentage of people infected with liver fluke during 2019–2021 of the 8th Regional Health Province (R8) near the Mekong River (adapted from R8, [33]).
Preprints 76364 g002
Figure 3. (a) A number of infected populations of each village with population density (persons/sq.km.). (b) Infected percentage of each village and percentage average of infectious in each sub-basin.
Preprints 76364 g003
Figure 4. The framework of GWR modeling finds the relationship of liver fluke occurrence to spatial factors and spatial GWR modeling with the sub-basin.
Preprints 76364 g004
Figure 5. Sub-basin boundary map obtained from analysis of DEM data.
Preprints 76364 g005
Figure 6. Raster mapping radius using a heatmap: (a) radius 2 km, (b) radius 4 km, and (c) radius 6 km.
Preprints 76364 g006
Figure 7. Map of independent variable indexes X1 through X9 generated using mathematical models, where (a) is X1 (index of land use types), (b) is X2 (index of soil drainage properties), (c) is X3 (the distance index from the road network , (d) is X4 (distance index from surface water sources), (e) is X5 (distance index from the flow accumulation lines), (f) is X6 (index of average surface temperature), (g) is X7 (average surface moisture index), (h) is X8 (average normalize difference vegetation index), and (i) is X9 (average soil-adjusted vegetation index).
Preprints 76364 g007
Figure 8. Residual plot and fit plot graphs of variable correlation X5 (a1), (a2); X6 (b1), (b2); X7 (c1), (c2); X8 (d1), (d2); and X9 (e1), (e2) selected from correlation analysis.
Preprints 76364 g008aPreprints 76364 g008b
Figure 9. Comparison of standard residual of models 3 (Y%ov3) and 4 (Y%ov4) of GWR and OLS alternative models.
Preprints 76364 g009
Table 1. Comparison of number of people with cholangiocarcinoma in 2019/2020 [30].
Provinces Number of people with Number of people with
cholangiocarcinoma in 2019 cholangiocarcinoma in 2020
Nongkhai 22 37
Buengkarn 8 7
Loei 54 84
Nakhon Phanom 7 10
Udon Thani 50 88
Nongbualumphu 19 12
Sakon Nakhon 161 130
Table 2. Descriptive accompanying data of sub-basins for use in independent variable modeling.
Sub-basin name Areas (sq.km.) Perimeters (km.) Average of DEM (meters)
Jomjaeng 66.183 46.434 160.445
Poopim 18.432 23.986 161.624
Phonnoi 64.081 46.779 166.147
Phonkaeyai 72.794 43.279 172.894
Wanplachuem-1 51.264 36.087 180.397
Wanplachuem-2 16.071 20.354 174.412
Klangmai 27.738 28.053 167.640
Nakaew 12.708 24.316 164.155
Nongphue 10.040 18.698 170.894
Maikrabok 14.259 19.312 163.884
Table 3. The number, percentage of liver fluke infections, and the mean of independent variables used to model spatial correlation analysis with GWR models.
Sub-basin Y(% of OV) X1(lu) X2(soil) X3(road) X4(water) X5(stream) X6(temp) X7(ndmi) X8(ndvi) X9(savi)
Jomjaeng 2.01 14.773 9.144 14.755 7.361 14.293 5.966 -0.064 0.075 0.143
Poopim 1.05 49.947 33.838 47.748 29.494 43.984 7.954 -0.060 0.115 0.218
Phonnoi 7.84 17.688 6.252 15.376 6.922 13.931 7.925 -0.083 0.118 0.225
Phonkaeyai 0.84 14.279 11.576 14.489 6.149 15.661 8.210 -0.081 0.124 0.237
Wanplachuem-1 9.18 20.042 8.565 19.993 5.129 7.122 8.241 0.152 0.119 0.224
Wanplachuem-2 6.48 60.884 24.128 64.132 14.349 61.311 7.593 -0.037 0.104 0.199
Klangmai 4.38 37.048 24.577 37.011 5.862 32.838 7.677 0.042 0.117 0.227
Nakaew 2.52 60.758 29.858 74.811 40.229 59.603 7.740 -0.035 0.116 0.224
Nongphue 1.95 80.795 34.581 90.847 18.963 79.482 7.909 -0.049 0.119 0.227
Maikrabok 3.66 5.235 19.740 4.753 15.510 7.539 7.920 -0.050 0.121 0.232
Table 4. The correlation between independent variables (X1 to X9) and dependent variables (OV infection percentages) for analysis of GWR-modelled variable groups.
Y(% of OV) X1(lu) X2(soil) X3(road) X4(water) X5(stream) X6(Temp) X7(ndmi) X8(ndvi) X9(savi)
Y(% of OV) 1.000 - - - - - - - - -
X1(land use) -0.167 1.000 - - - - - - -
X2(soil) -0.437 0.826 1.000 - - - - - - -
X3(road) -0.189 0.992 0.813 1.000 - - - - - -
X4(water) -0.402 0.599 0.739 0.635 1.000 - - - - -
X5(stream) -0.226 0.985 0.838 0.984 0.612 1.000 - - - -
X6(temp) 0.173 0.116 0.184 0.106 0.109 0.067 1.000 - - -
X7(ndmi) 0.395 0.060 -0.143 -0.061 -0.258 -0.193 0.243 1.000 - -
X8(ndvi) 0.082 0.092 0.227 0.095 0.134 0.062 0.969 0.171 1.000 -
X9(savi) 0.079 0.097 0.242 0.103 0.144 0.074 0.950 0.150 0.997 1.000
Table 5. GWR alternative modeling results.
GWR models Independent
Variables
coefficients t-Stat p-Valuea
GWR
R2
GWR
R2
OLS
Y%ov1=0.475+1.525(X8ndvi)+
6.021(X9savi)
Intercept 0.475 4.573*** 0.000*** 0.463 0.445
X8ndvi 1.525 0.918 n/s 0.236 n/s
X9savi 6.021 2.152 n/s 0.135 n/s
Y%ov2=4.528+1.125(X7ndmi)+
3.116(X8ndvi)-9.852(X9savi)
Intercept 4.528 1.975*** 0.000*** 0.521 0.483
X7ndmi 1.125 0.799 n/s 1.154 n/s
X8ndvi 3.116 0.890 n/s 2.021 n/s
X9savi -9.852 -2.326*** 0.038***
Y%ov3=62.042-5.047(X5stream)+
4.246 (X7ndmi)-9.874(X9savi)
Intercept 62.042 3.031*** 0.000*** 0.624 0.576
X5stream -5.047 -2.068*** 0.048***
X7ndmi 4.246 1.875 *** 0.034 ***
X9savi -9.874 -2.661*** 0.021***
Y%ov4=59.410.039(X5stream)+21.21(X6temp)+7.23(X7ndmi)-3752.16(X8ndvi+1503.27(X9savi) Intercept 59.410 0.999*** 0.000*** 0.646 0.591
X5stream -0.0390 -3.561*** 0.041***
X6temp 21.210 0.774 n/s 1.243 n/s
X7ndmi 7.230 0.550 n/s 0.764 n/s
X8ndvi 1503.270 0.678 n/s 0.689 n/s
X9savi -2752.160 -2.156*** 0.037***
*** = significant at 5% level. n/s = not significant. Results of Monte Carlo test for spatial non-stationarity.
Disclaimer/Publisher’s Note: The statements, opinions and data contained in all publications are solely those of the individual author(s) and contributor(s) and not of MDPI and/or the editor(s). MDPI and/or the editor(s) disclaim responsibility for any injury to people or property resulting from any ideas, methods, instructions or products referred to in the content.
Copyright: This open access article is published under a Creative Commons CC BY 4.0 license, which permit the free download, distribution, and reuse, provided that the author and preprint are cited in any reuse.
Prerpints.org logo

Preprints.org is a free preprint server supported by MDPI in Basel, Switzerland.

Subscribe

© 2024 MDPI (Basel, Switzerland) unless otherwise stated