1. Introduction
Radon is a noble and naturally radioactive gas having three isotopes: 222Rn (radon), 220Rn (thoron), and 219Rn (actinon). Radon derives from the 238U decay series, and has a half-life of 3.8 days, while thoron derives from the 232Th decay series and has a relatively short half-life (55s). Actinon is part of the decay series of 235U and has such a short half-life (4s) that is ignored in geochemical exploration.
222Rn is considered one of the main sources of environmental natural radioactivity [
1,
2] considering that this gas is created during the radioactive alpha decay of radium (
226Ra) present in rock and soil. Being an inert gas, radon is ubiquitous in indoor and outdoor air. Further, due to its solubility, radon can be present in groundwaters and springs, meaning that drinking waters can be enriched of this gas. The natural
222Rn concentrations depend on many factors among which uranium mineralization in the soil [
3] and chemical water parameters (pH, temperature and salinity) that can produce seasonal variations of diluted radon [
4]. Further, the presence of fractures and/or faults in the soil can favor the radon upward motion from bedrocks and buried deposits containing uranium [
5].
222Rn can easily accumulate in indoor air through cracks in walls and other openings via gaseous diffusion from beneath the ground and through dissolved radon contents of groundwater used indoors [
6]. Therefore, it is very important to know the levels of radon in soil gas, indoor and in waters to keep safe people from an excessive exposure to radon risking lung cancer.
In terms of radiation protection aspects, indoor
220Rn level can derive from soil, building materials containing
232Th, distance from walls or floor source [
7] and for these reason, it is difficult to estimate. It is also difficult to measure because of its short half-life that barely allows to measure emitting alpha particles. On the contrary, soil gas
220Rn, precisely for its short half-life, can provide significant information on the source of the radon gas.
For this reason,
220Rn measurements were performed in order to evaluate the superficial fracturing (beside the known faults) that allows a diffusive radon migration. The present study pointed at estimating the radon concentration in soil gas, indoor and drinking water in an area characterized by natural radioactivity due to both local volcanic outcrops emitting radon and the tuffs used as building materials. Our primary goal was to raise public awareness of the both radon presence and the following gas exposure risk [
8] as the hazard of this gas is often ignored by territory administrators.
2. Geological overview
The studied area belongs to the Italian Tyrrhenian margin characterized by continental crust with less than 25 km thickness, high heat flows and large volcanic provinces. Since Upper Pliocene, extensional tectonics have formed a system of NW-SE trending basins that area filled by thick sequences of Messinian to Early Pleistocene clastic marine deposits. Potassic to ultra-potassic effusive activity associated with this crustal thinning formed the volcanic districts of the Roman Comagmatic Province, including the Sabatini Mountains [
9], the Tolfa-Cerveteri-Manziana volcanic complex (TVC) [
10] and the Vico volcanic deposits. The studied area belongs to the TVC, and it is located 45 km north of Rome. The TVC consists of a series of volcanic products (among which, Tufi stratificati varicolori di Sacrofano e Tufi rossi a scorie nere [
11]) which forms a NW-SE trending hoisted structure. In the southern part of tuff outcrop, over a volcanic rock plateau of about 100 hectares, there is an important Italian archeological site consisting in a unique and exceptional proof of the ancient Etruscan civilization, just few kilometers far from Rome. There are necropolis rich of Etruscan frescos that faithfully reproduce the daily lives of the disappeared culture. The Necropolis of Banditaccia, an UNESCO World Heritage since 2004 is by far the finest example of Etruscan funerary architecture and large parts of this necropolis were dug in the tuff bedrock, either as subterranean grave chambers (hypogea) or as tumuli [
12].
3. 222Rn and 220Rn Radiological Risk
The breathing of radon/thoron and their progeny is an important factor which provides around 50% of the natural background radiation dose to the humankind [
13,
14]. According to several epidemiological studies, radon is known as the second origin of lung cancer after smoking [
15]. Through the process of breathing, radon progeny adheres to bronchial epithelium and exposes it to the hazardous irradiations [
16]. Even cellular DNA can be damaged by the alpha particles emitted from radon and progeny [
17]. The distribution of radon progeny and the breathing rate influence the trachea-bronchial tract [
18] where the activity concentration is deposited and affect the lung dose.
Since radon is very soluble (fifteen times more than helium or neon), it is possible to find high concentrations of this gas in waters that circulated through rocks and deposits rich of radium [
19] and that can transport dissolved radon up to the surface. Therefore, dissolved radon in water can enter into dwellings by means of showers, laundry and drinkable waters [
14]. Keeping in view the harmful effects of this gas on human health, it is necessary to quantify the radiological hazard of radon from the different and potential sources: soils, waters and indoor. Since radon is colorless, tasteless and odorless, there is a general undervalue of long-term effects of exposure. Furthermore, even when people are informed about the possibility that their dwellings can have dangerous radon levels and relative health effects, it is unlikely that appropriate remedies are adopted [
20].
4. Materials and Methods
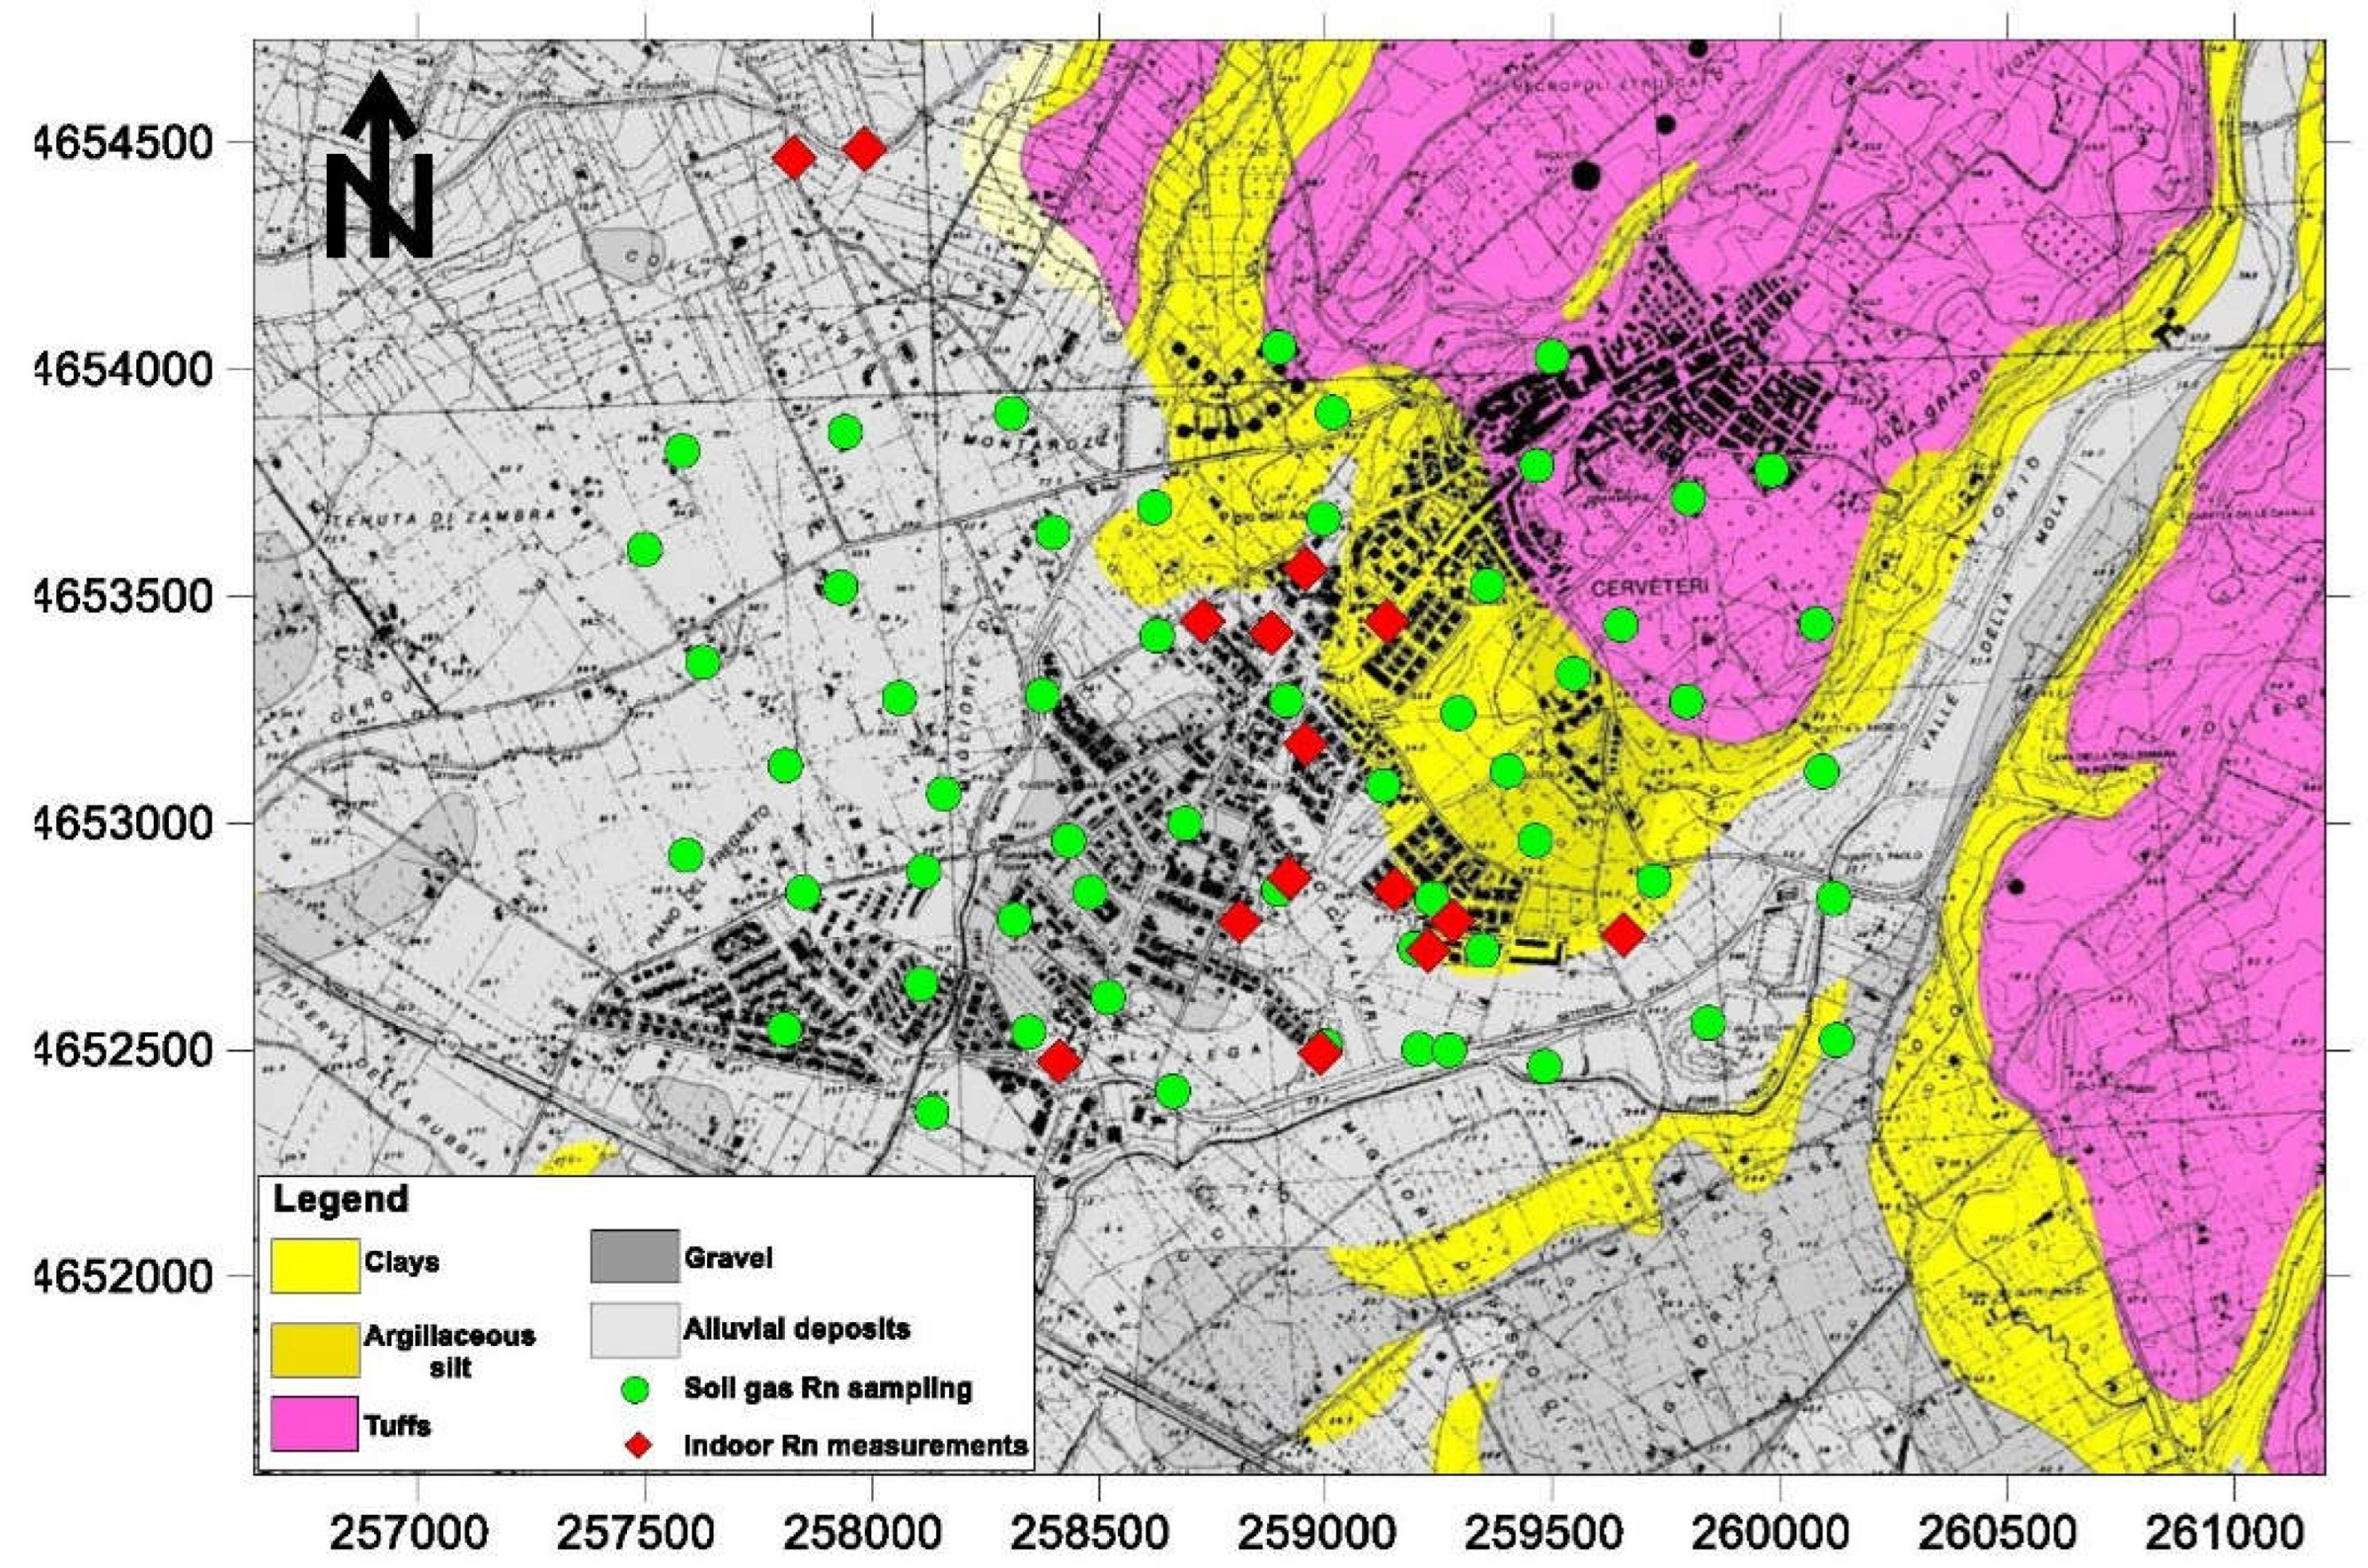
During summer 2017, detailed field surveys were carried out at Cerveteri (Rome, Central Italy), which included the indoor, in-water and in-soil
222Rn measurements (
Figure 1).
Detailed radon-gas surveys were carried out during the dry season (from June to September 2017), consisting of 65 measurements of radon activity, within an area of about 3km
2, with a sampling density of about 20 samples/km
2. Soil-gas radon (
222Rn) concentrations were measured with a portable RAD7 Durridge® certified alpha spectrometer. Radon values were obtained after 15 min (time necessary for Po and Rn nuclei equilibrium, that is about 5 times the half-life of
218Po) pumping the gas from a steel probe inserted at depth of at least 0.50 m into the soil. Calibration and linearity of the employed RAD7s was verified by using a radon chamber [
21].
Measurements of indoor radon concentrations were performed in selected private and public dwellings using activated charcoal canisters. This passive method consists of putting the canister on the floor of a room for 48 h, keeping windows and doors shut in order to simulate the worst environmental conditions for air circulation. Afterwards, the canisters are removed and counted by a γ-ray spectrometer in the laboratory.
In order to measure dissolved
222Rn concentrations, water was collected in a bottle equipped with a watertight cap provided with an expansion chamber and inserted in a closed circuit with a pump and an activated charcoal collector (ACC). The air stripped from water and aspirated from the expansion chamber is then adsorbed into the ACC [
22]. Collectors were analyzed by gamma-spectrometry using a NaI(Tl) scintillator at the laboratory.
5. Results
5.1. Soil gas 222Rn and 220Rn
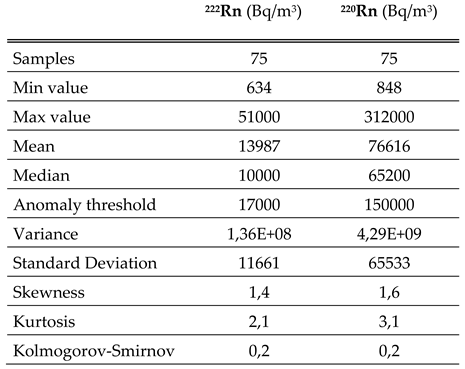
Descriptive statistics of
222Rn soil gas results from the Cerveteri area are reported in
Table 1. In an area of about 5 square kilometers, a total of 75
220Rn and
220Rn measurements were performed. Radon values range from 634 to 51000 Bq/m
3, mean (13987 Bq/m
3) and median (10000 Bq/m
3) values are quite similar as well as the standard deviation (S.D., 11661) indicating that the distribution of this gas is slightly skewed. Values of Skewness (1,35) and Kurtosis (2,13) confirm the almost normal univariate distribution. In the framework of environmental studies, the identification of high anomalous values (outliers) play a crucial role in the creation and interpretation of contour maps. The normal probability plot (NPP) is a valid statistical approach to display and investigate data variability and skewed distributions. This method can distinguish different, often overlapping, populations (i.e. background, anomalous values and outliers) and provides a more objective approach to statistical anomaly threshold estimation [
23].
It requires estimating straight line segments (highlighting gaps or inflection points) of a probability curve and then selecting threshold values at the abscissa line.
Figure 2a shows the normal probability plot for radon values where we can distinguish some outliers (>49000 Bq/m
3) and three sample populations separated by two threshold points: (i) background values up to 5000 Bq/m
3; (ii) radon values ranging from 5200 to 15000 Bq/m
3 characteristic of a population at equilibrium with the
226Ra content of the local volcanic rocks [
24]; (iii) weak anomalies (> 15500 Bq/m
3). The statistical threshold between normal and anomalous values has been identified at 25000 Bq/m
3. According to Keller et al. [
25] high soil gas concentrations can produce indoor concentration above the 2013/59 Euratom Directive limit (300 Bq/m
3) [
26]. Only few samples of our data set have values greater than the Euratom limit and they are located at tuff outcrop where there is the Banditaccia necropolis. Descriptive statistics of
220Rn soil gas results from the Cerveteri area are reported in
Table 1. Thoron values range from 848 to 312000 Bq/m
3. The mean (76616 Bq/m
3) and median (65200 Bq/m
3) values are almost identical as well as the standard deviation (S.D., 65533) indicating that the distribution of this gas is slightly skewed. Values of Skewness (1,6) and Kurtosis (3,1) confirm the almost normal univariate distribution. The presence of outliers (high anomalous values) were individuated by mean of the NPP graph (
Figure 2b) where we can distinguish three sample populations separated by two threshold values: (i) background values up to 70000 Bq/m
3; (ii) weak anomalous values ranging from 70000 to 150000 Bq/m
3; (iii) anomalies (> 150000 Bq/m
3). The anomaly threshold is at 155000 Bq/m
3.
5.2. Indoor 222Rn
A total of 24 charcoal canisters were arranged on the floor of different private locations where a room was dedicated to indoor radon measurements.
Table 2 shows results of indoor radon measurements and values range from 35 to 1144 Bq/m
3. The canisters were placed in seven cellars, seven basements, five ground floors and five first floors.
Figure 3 shows a comparison of indoor radon values from the four monitored levels. The box plots show the median (the line at the center of the box), minimum and maximum values (extreme values), outliers, lower and upper quartile that outlines the box. This graphical representation of data, provides a brief and concise summary of values variability as shown by median values estimated for the different levels: basements shows the highest values, as was predictable.
5.2. Dissolved 222Rn in water
Dissolved radon in water can be a serious problem, in the frame of radiation dose, when groundwater is used for public services (e.g., food and domestic uses, sanitary fittings, private wells). Therefore, radon degassing from water should not underestimate. Unfortunately, during the study period, only two private wells were investigated both with very low radon concentrations, that is <100 Bq/l (radon reference level of drinking water according to Euratom, 2014). However, these low values are comparable with results of a previous study accomplished by Cinti et al. [
27] in the peri-Tyrrhenian sector of central Italy where there are sedimentary rock aquifers that generally have low dissolved Rn values (median value 6.9 Bq/l) probably due to low levels of U and Ra within the sedimentary deposits.
6. Discussion
Variogram modeling of radon data have been used to quantitatively assess the spatial continuity of values. Experimental variogram enables the comprehension of the geometry and continuity of one variable, and can give significant information on numerical model estimations. Variogram models estimate the experimental data, geological interpretation, and analogue information [
28].
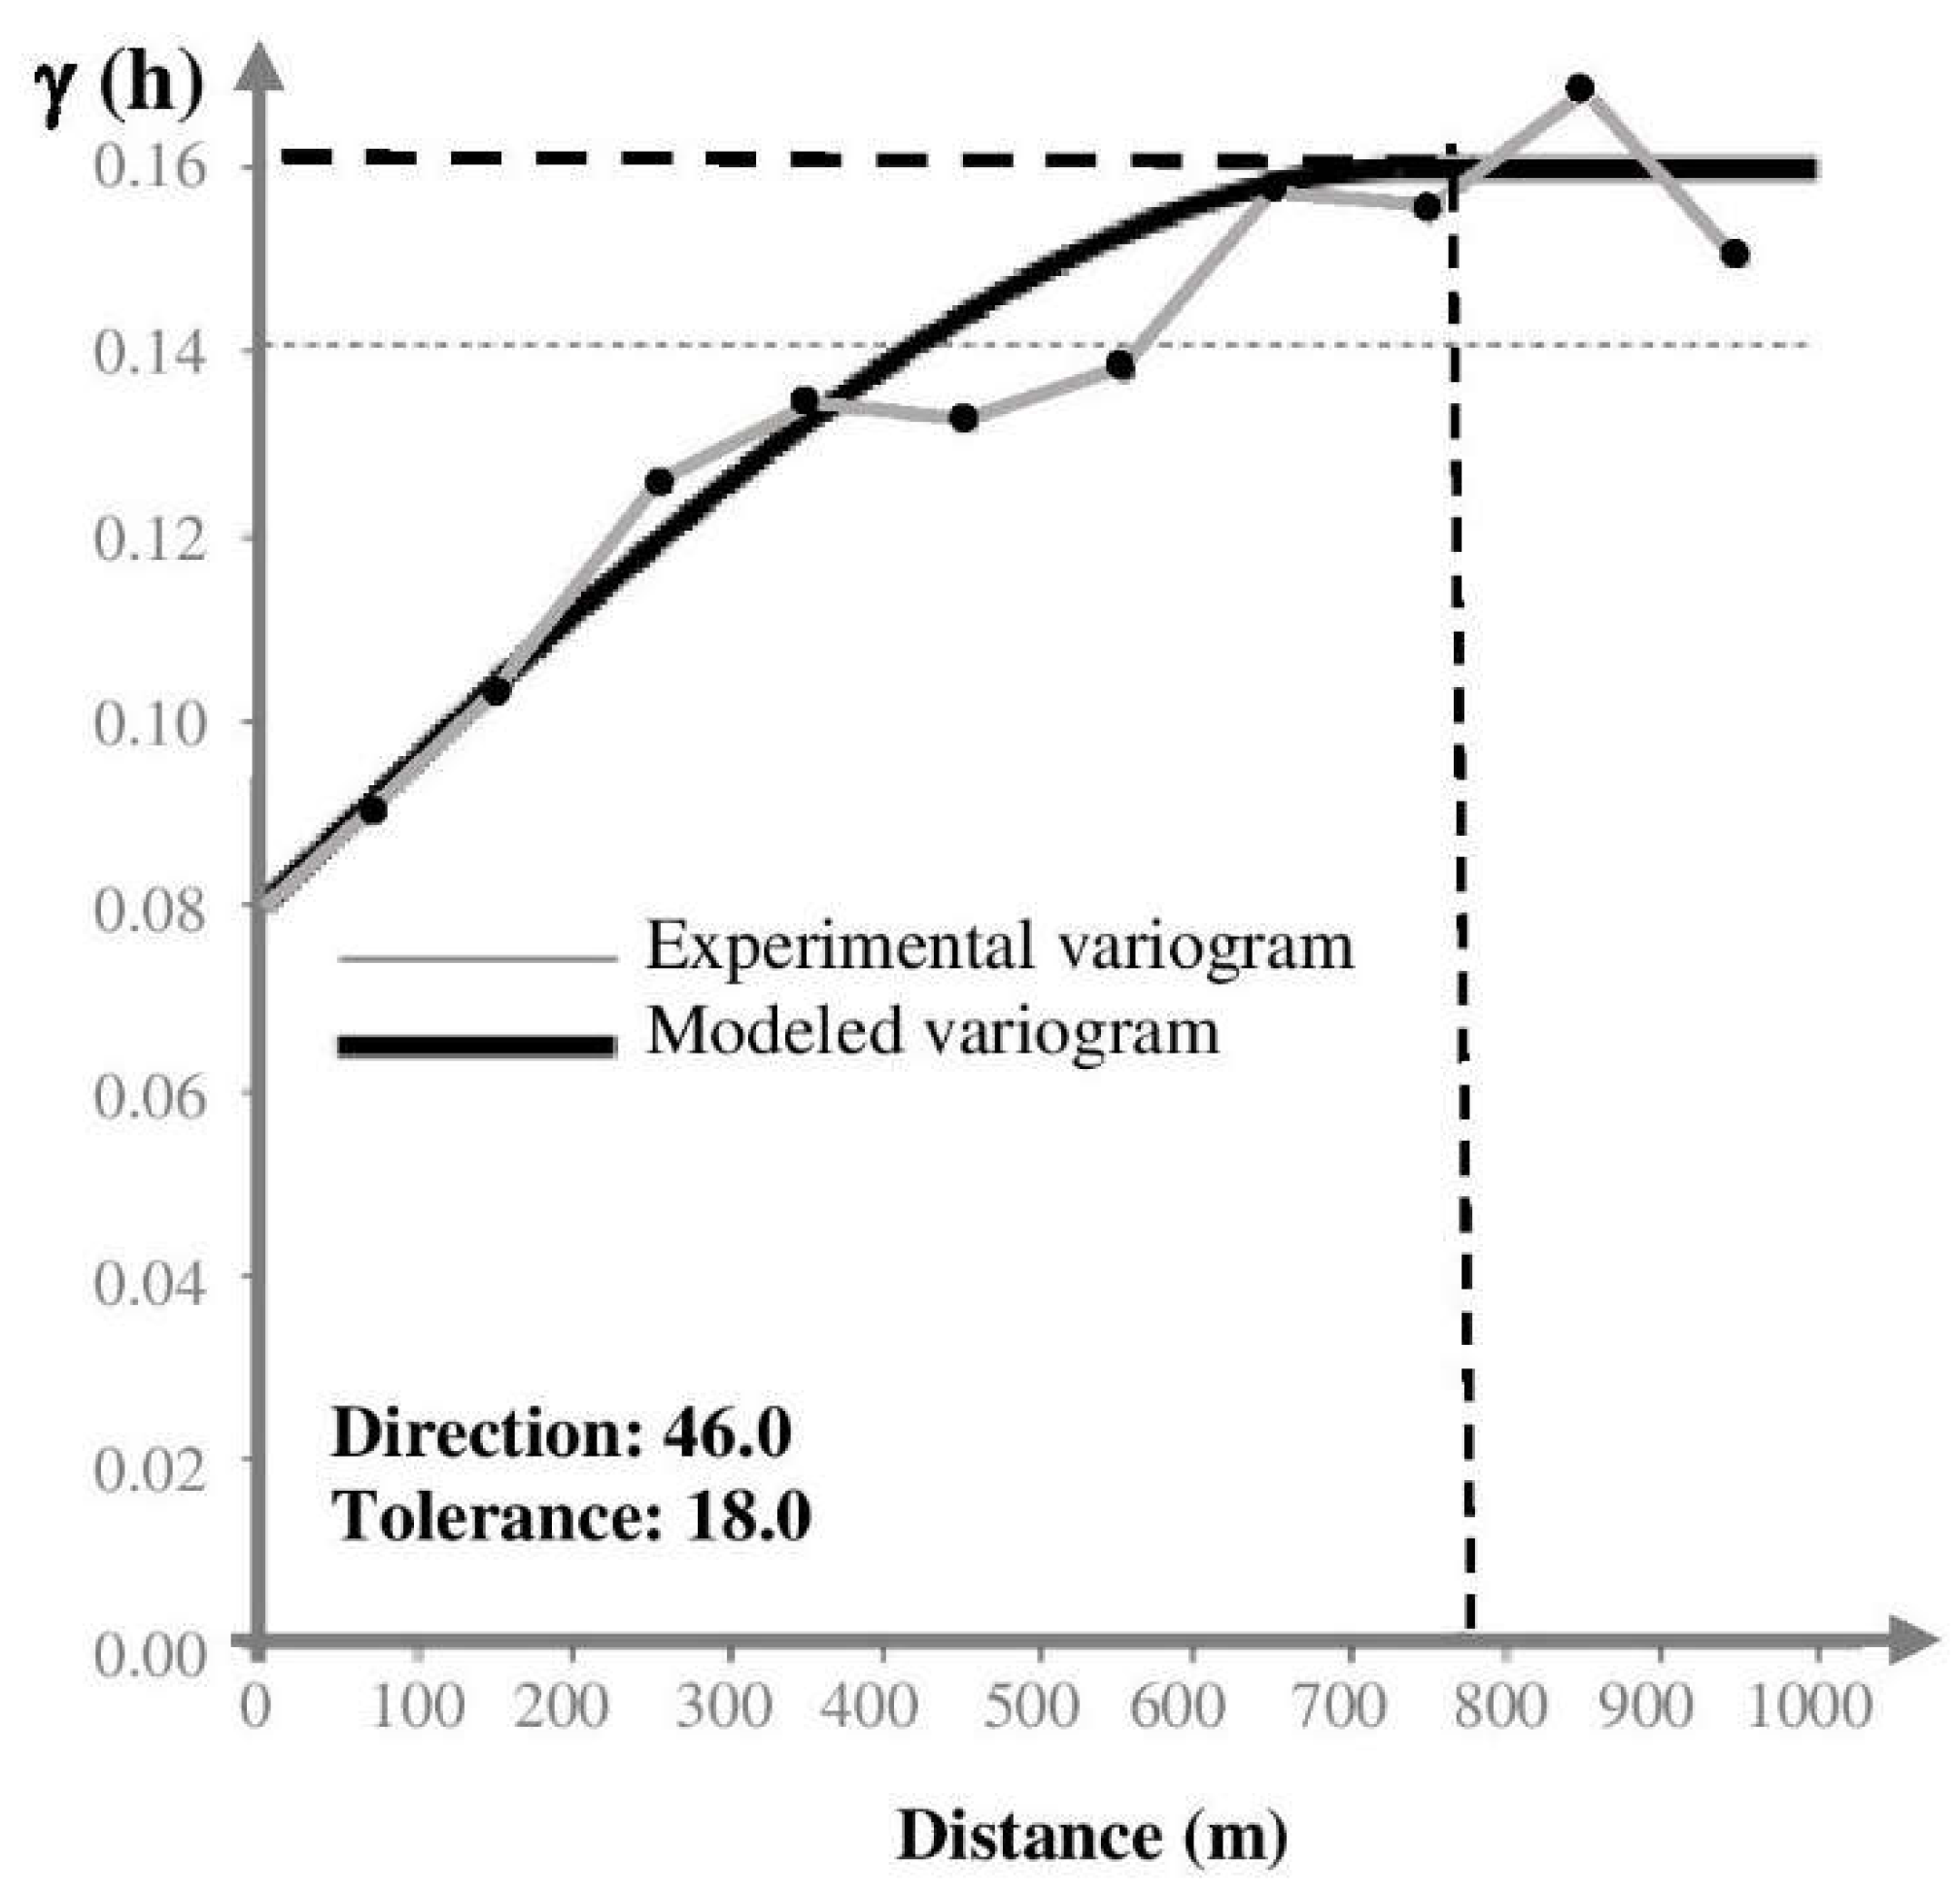
Figure 4 shows the experimental variogram and the relative radon fitting model determined along the axes of anisotropy (45°) and an angular tolerance of 22°.
The appropriate model is spherical function (Sph) where sample pairs are autocorrelated up to the distance of 700 m after that the variogram gets to the asymptotic threshold value of 0.16 γ. The nugget variance, representing the threshold value, is at the 0.08 γ value. The variogram model and the calculated values are fundamental in the kriging algorithm to yield the best evaluation of radon concentration contour map especially in areas without sampling.
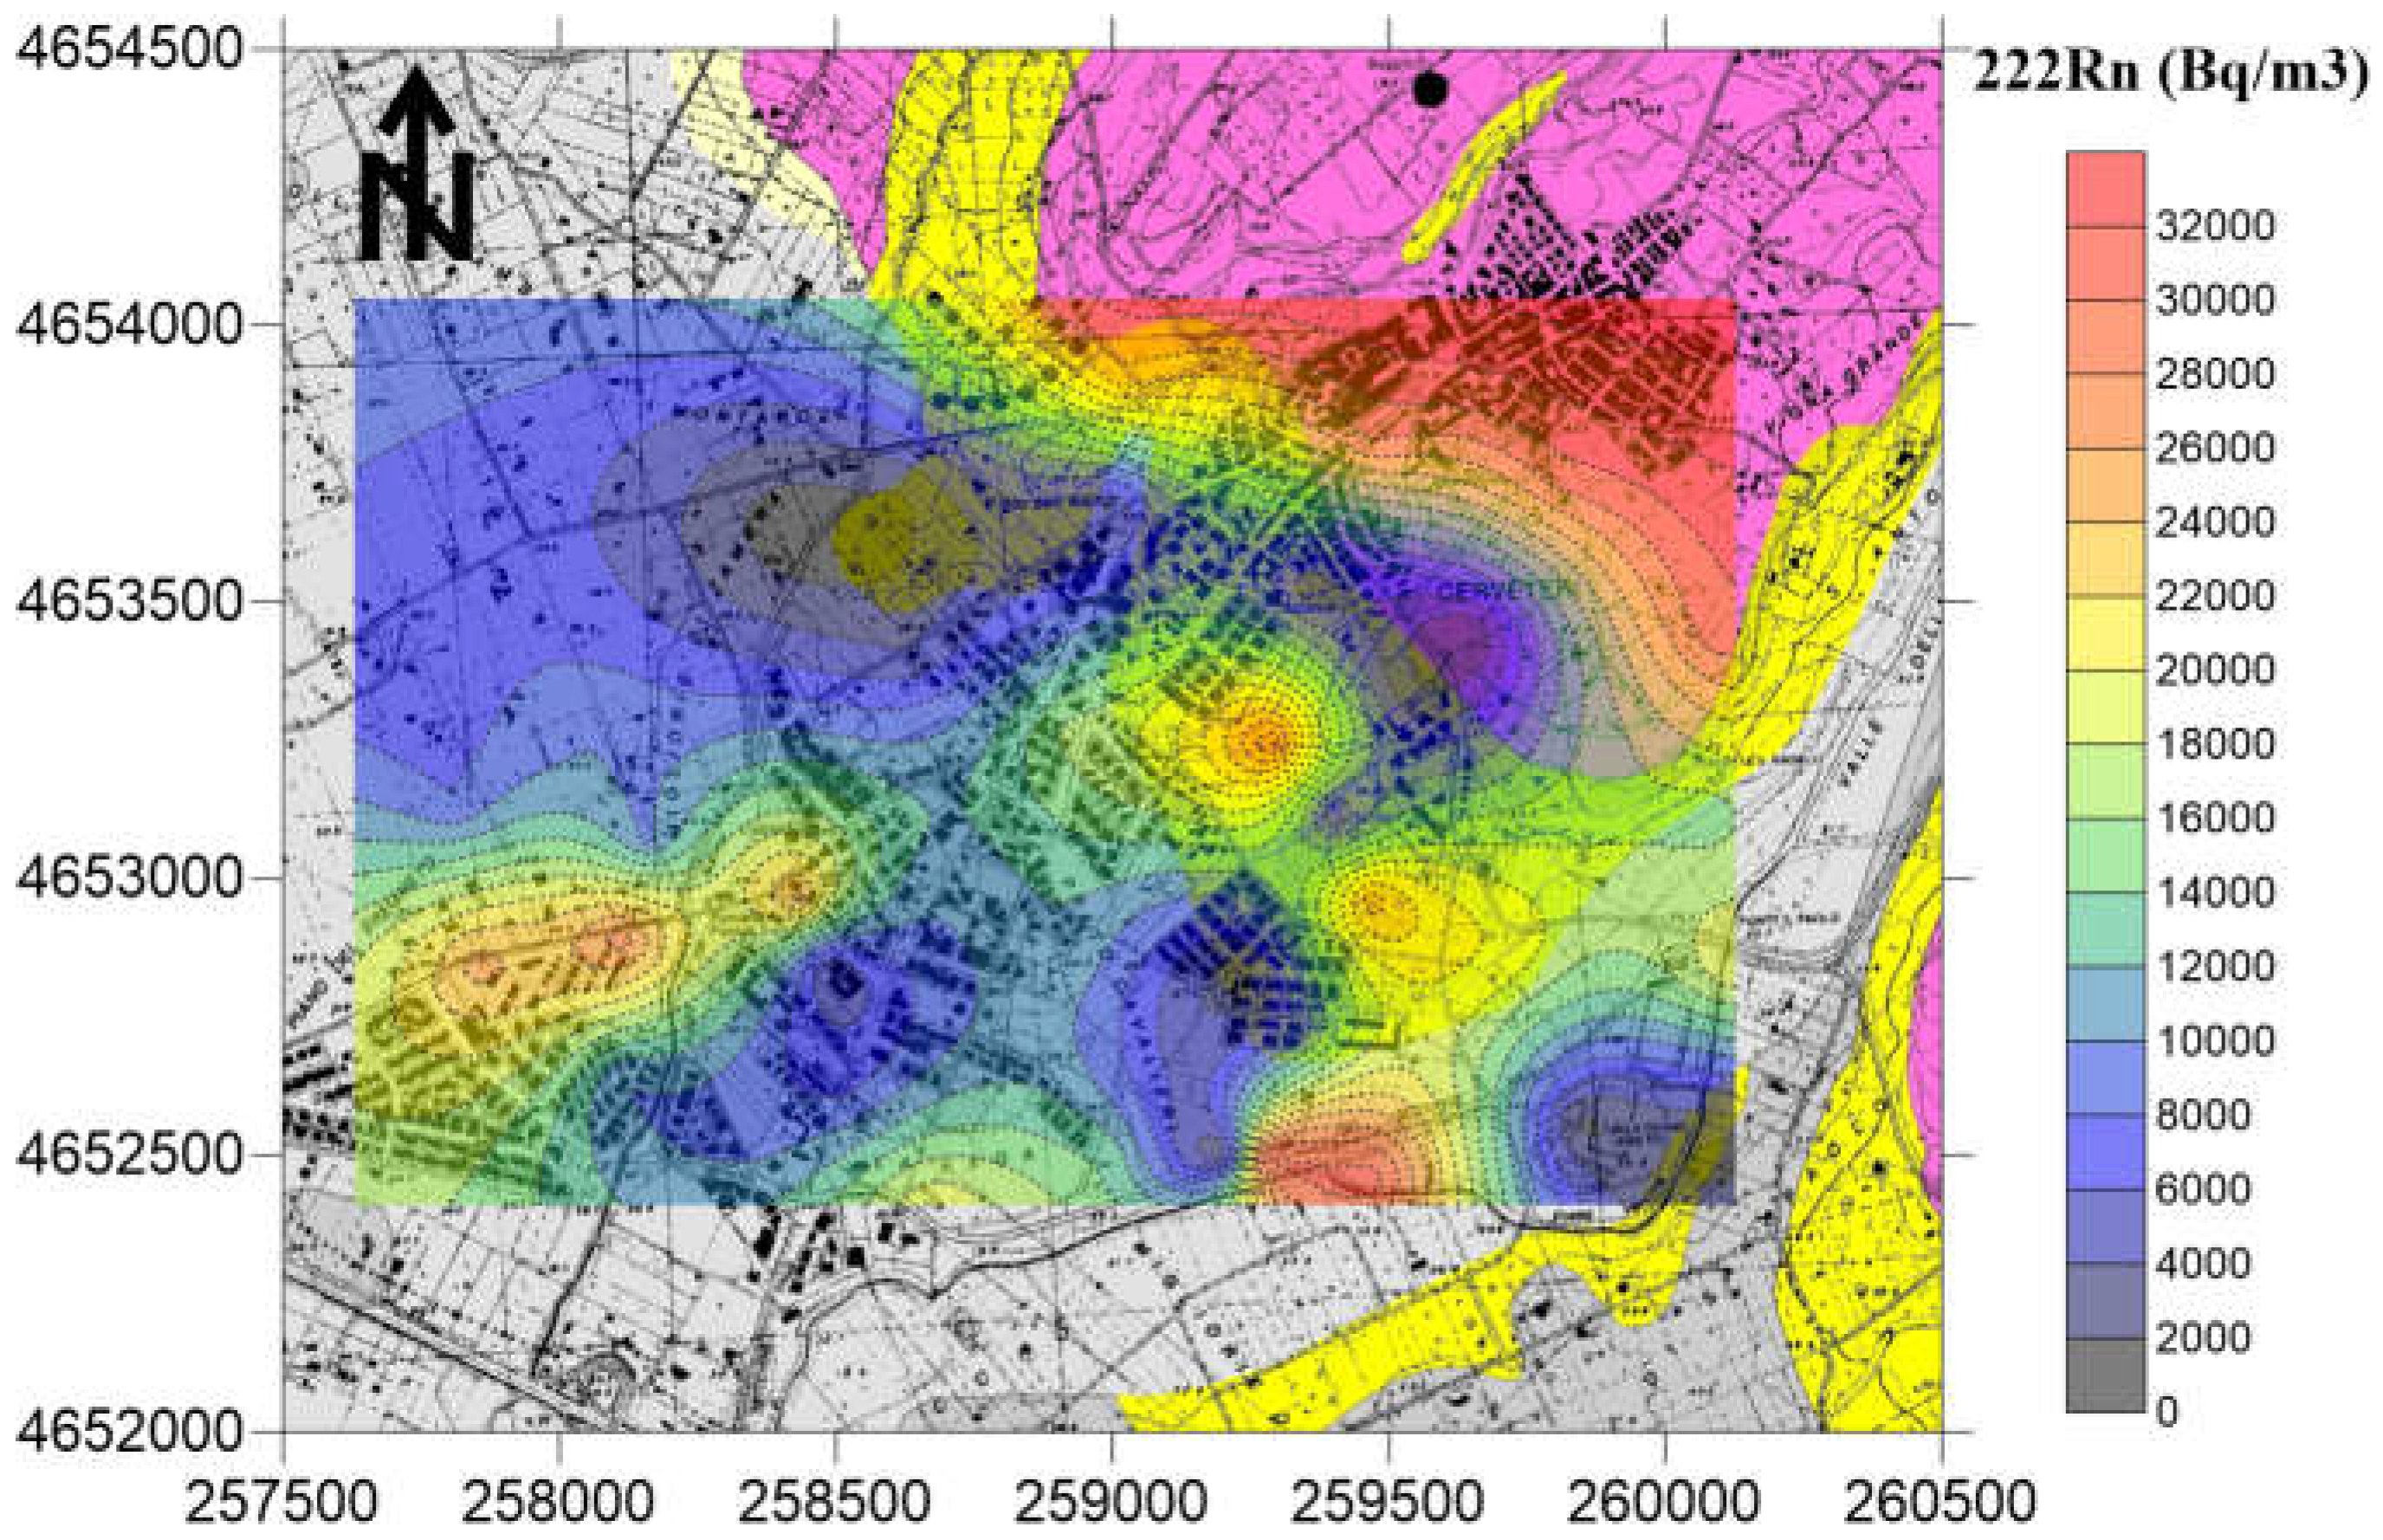
Figure 5 shows the distribution of radon soil gas concentrations that are very variable in the investigated area. The mean activity of the radon is about 14000 Bq/m
3, a value that is considered not harmful for human health. The maximum anisotropy orientation (NW-SW) is parallel to the tuff outcrop where the Banditaccia necropolis is located. Other spot anomalies (values >25000 Bq/m
3) are found in the south-eastern sector of the investigated area where small tuff outcrops or Etruscan ruins are present. Furthermore, an elongated anomaly is found in the south-western sector that, apparently, is not interested by either known faults or tuff outcrops. According to Torelli [
29], there are several necropolis (behind the well-known Banditaccia) in the investigated area, many of them are underground (hypogeal). This would explain the anomalous values in the southern sector of the studied area although more detailed investigation (e.g. geoelectrical surveys) would be requested to confirm or not the association radon- underground necropolis.
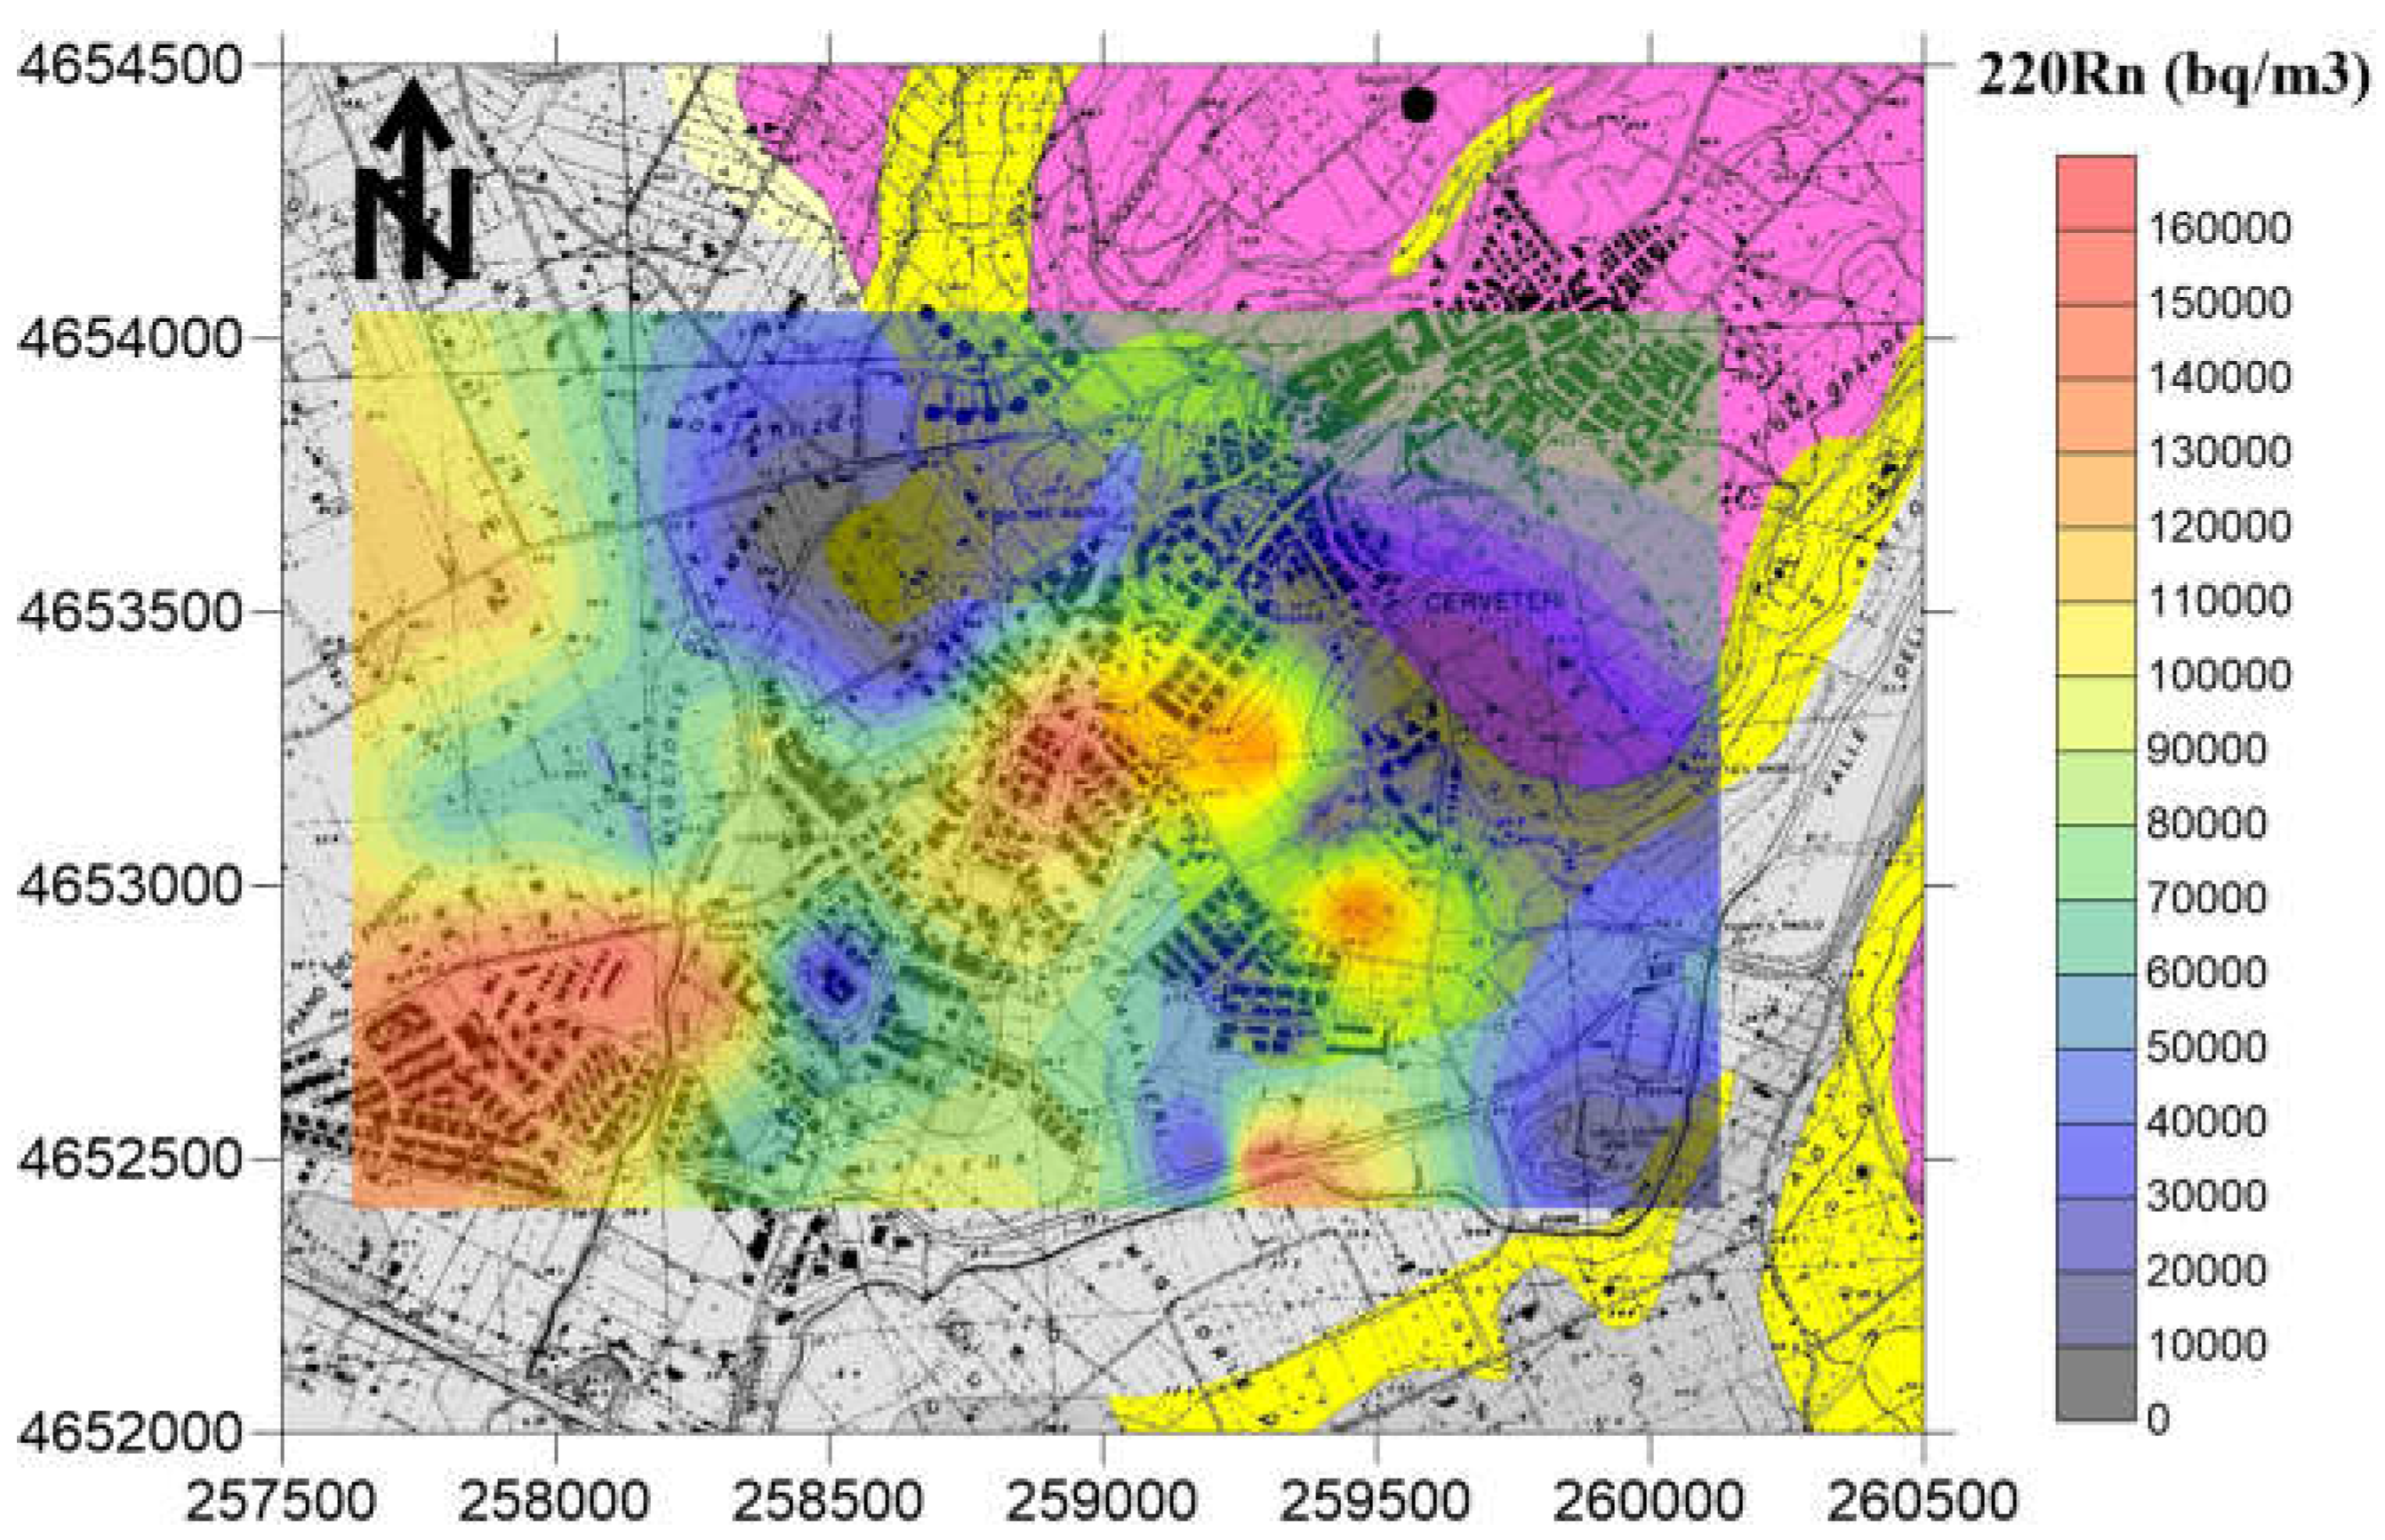
The distribution of soil gas
220Rn shows (
Figure 6) the maximum anisotropy orientation (NE-SW) orthogonally to the tuff outcrop. Other spot anomalies (values >90000 Bq/m
3) are found in the south-eastern sector of the investigated area in correspondence of
222Rn anomalies and where small tuff outcrops or Etruscan ruins are present.
The
220Rn short half-life (55 s) is adequately long-lived to suggest the primary source (U or Th) of radon anomaly. Therefore, the presence of mineralization close to the surface, can cause high
220Rn levels due to the rapid transport of this gas. Calculation of
220Rn/
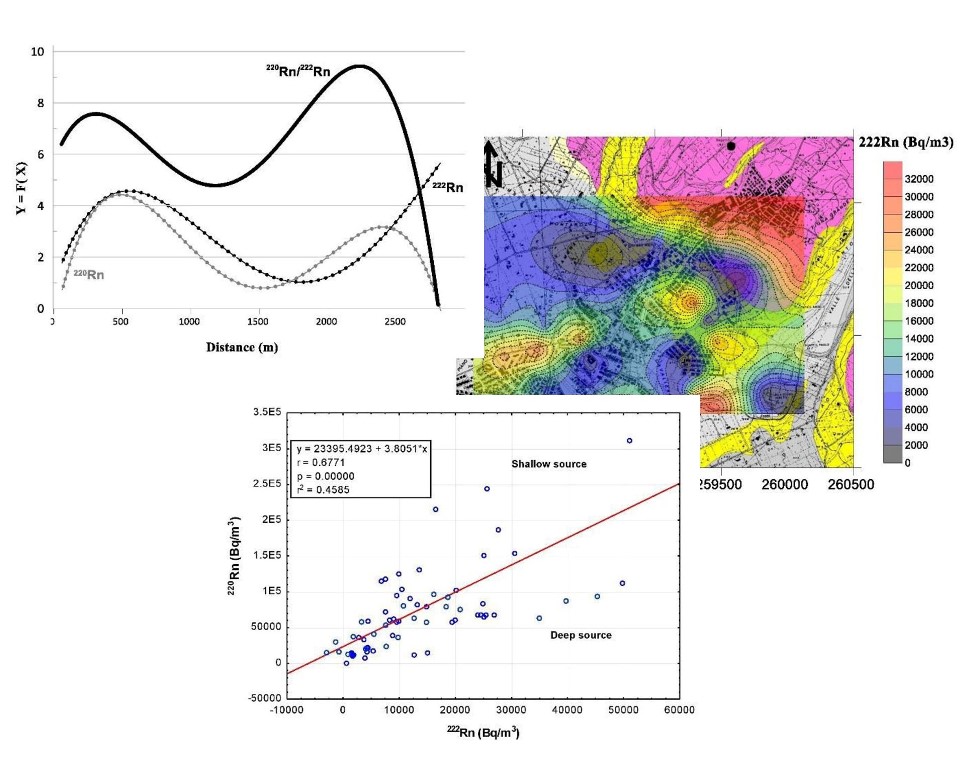
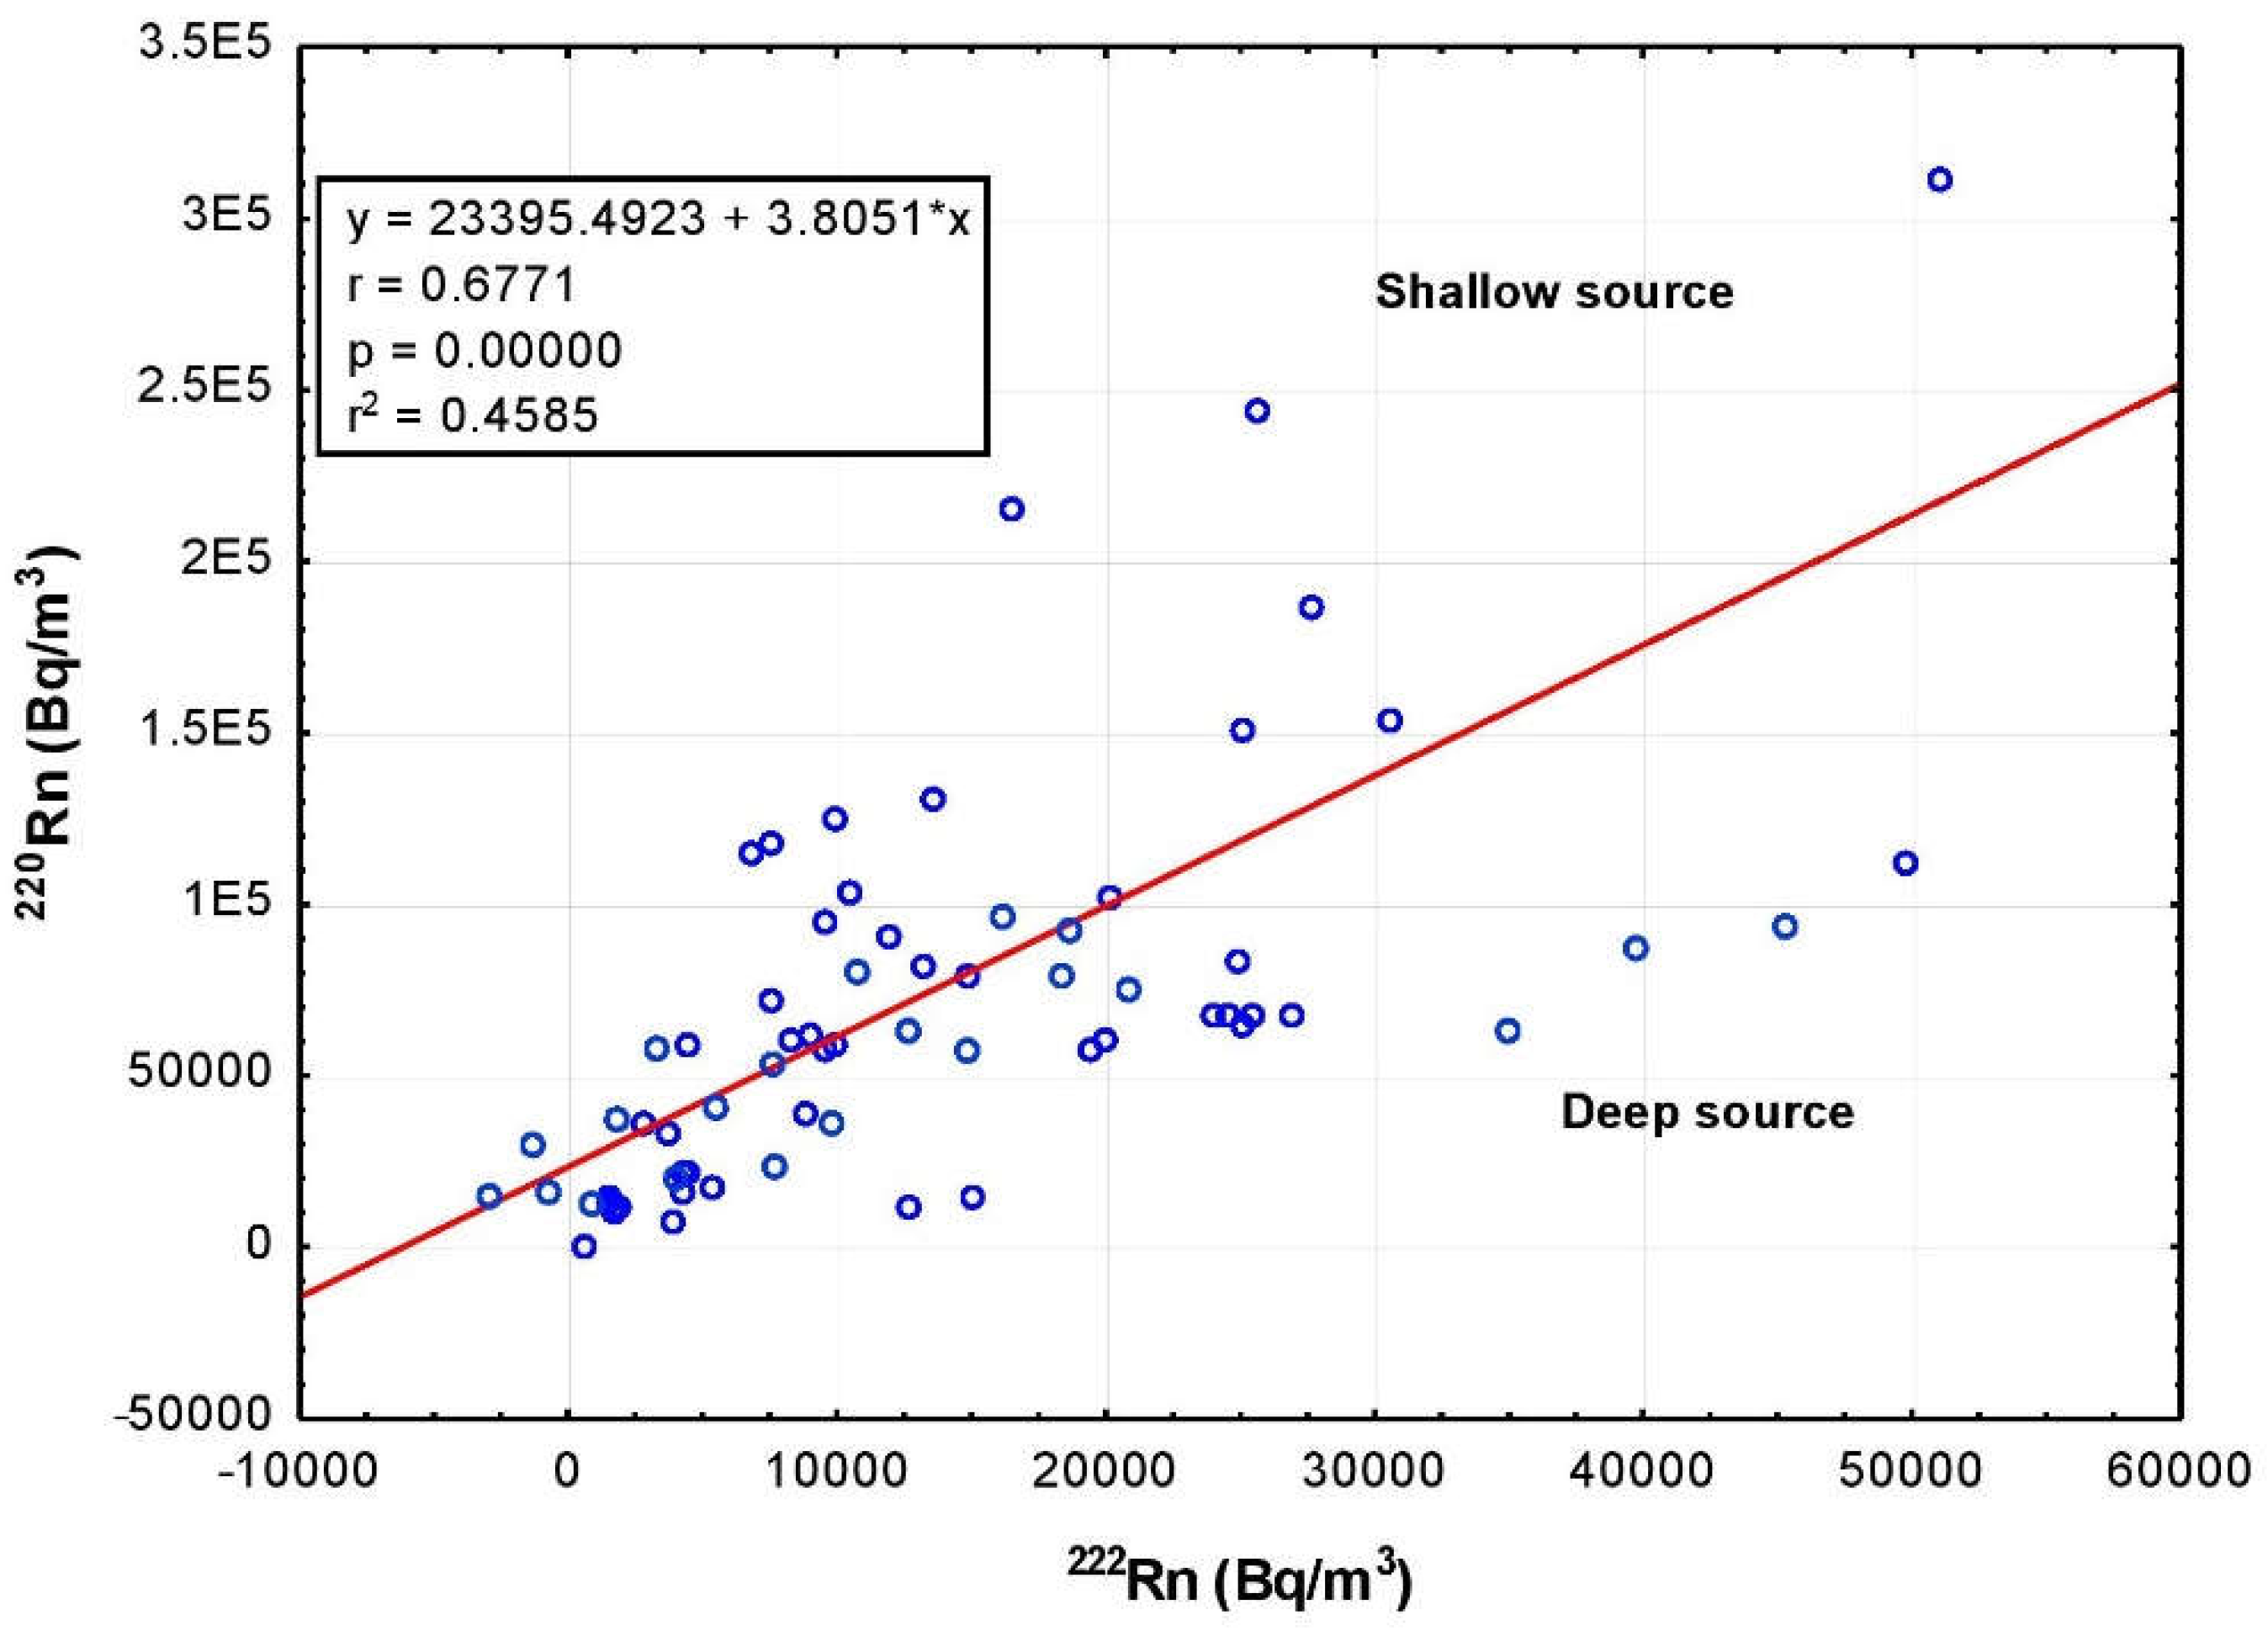
222Rn activity ratio permits to investigate the actual permeability of the gas origin. A good correlation was observed between the achieved radon and thoron activities (
Figure 7), indicating a mixing of deep and shallow gas sources [
30]. According to Yang [
31], for those smaller thoron peaks without a significant high radon concentration, a closer and shallower gas source is needed to explain the high
220Rn/
222Rn trend and the presence of low concentrations is presumably due to micro-fractures in the soil.
This small amount of gas may not increase the radon concentration clearly due to its original relative high background level. In contrast, it will significantly enhance the thoron concentration and produce a visible peak in the spectrum. This denotes that thoron variations are more responsive than radon to shallower system of blind local fracturing. A high
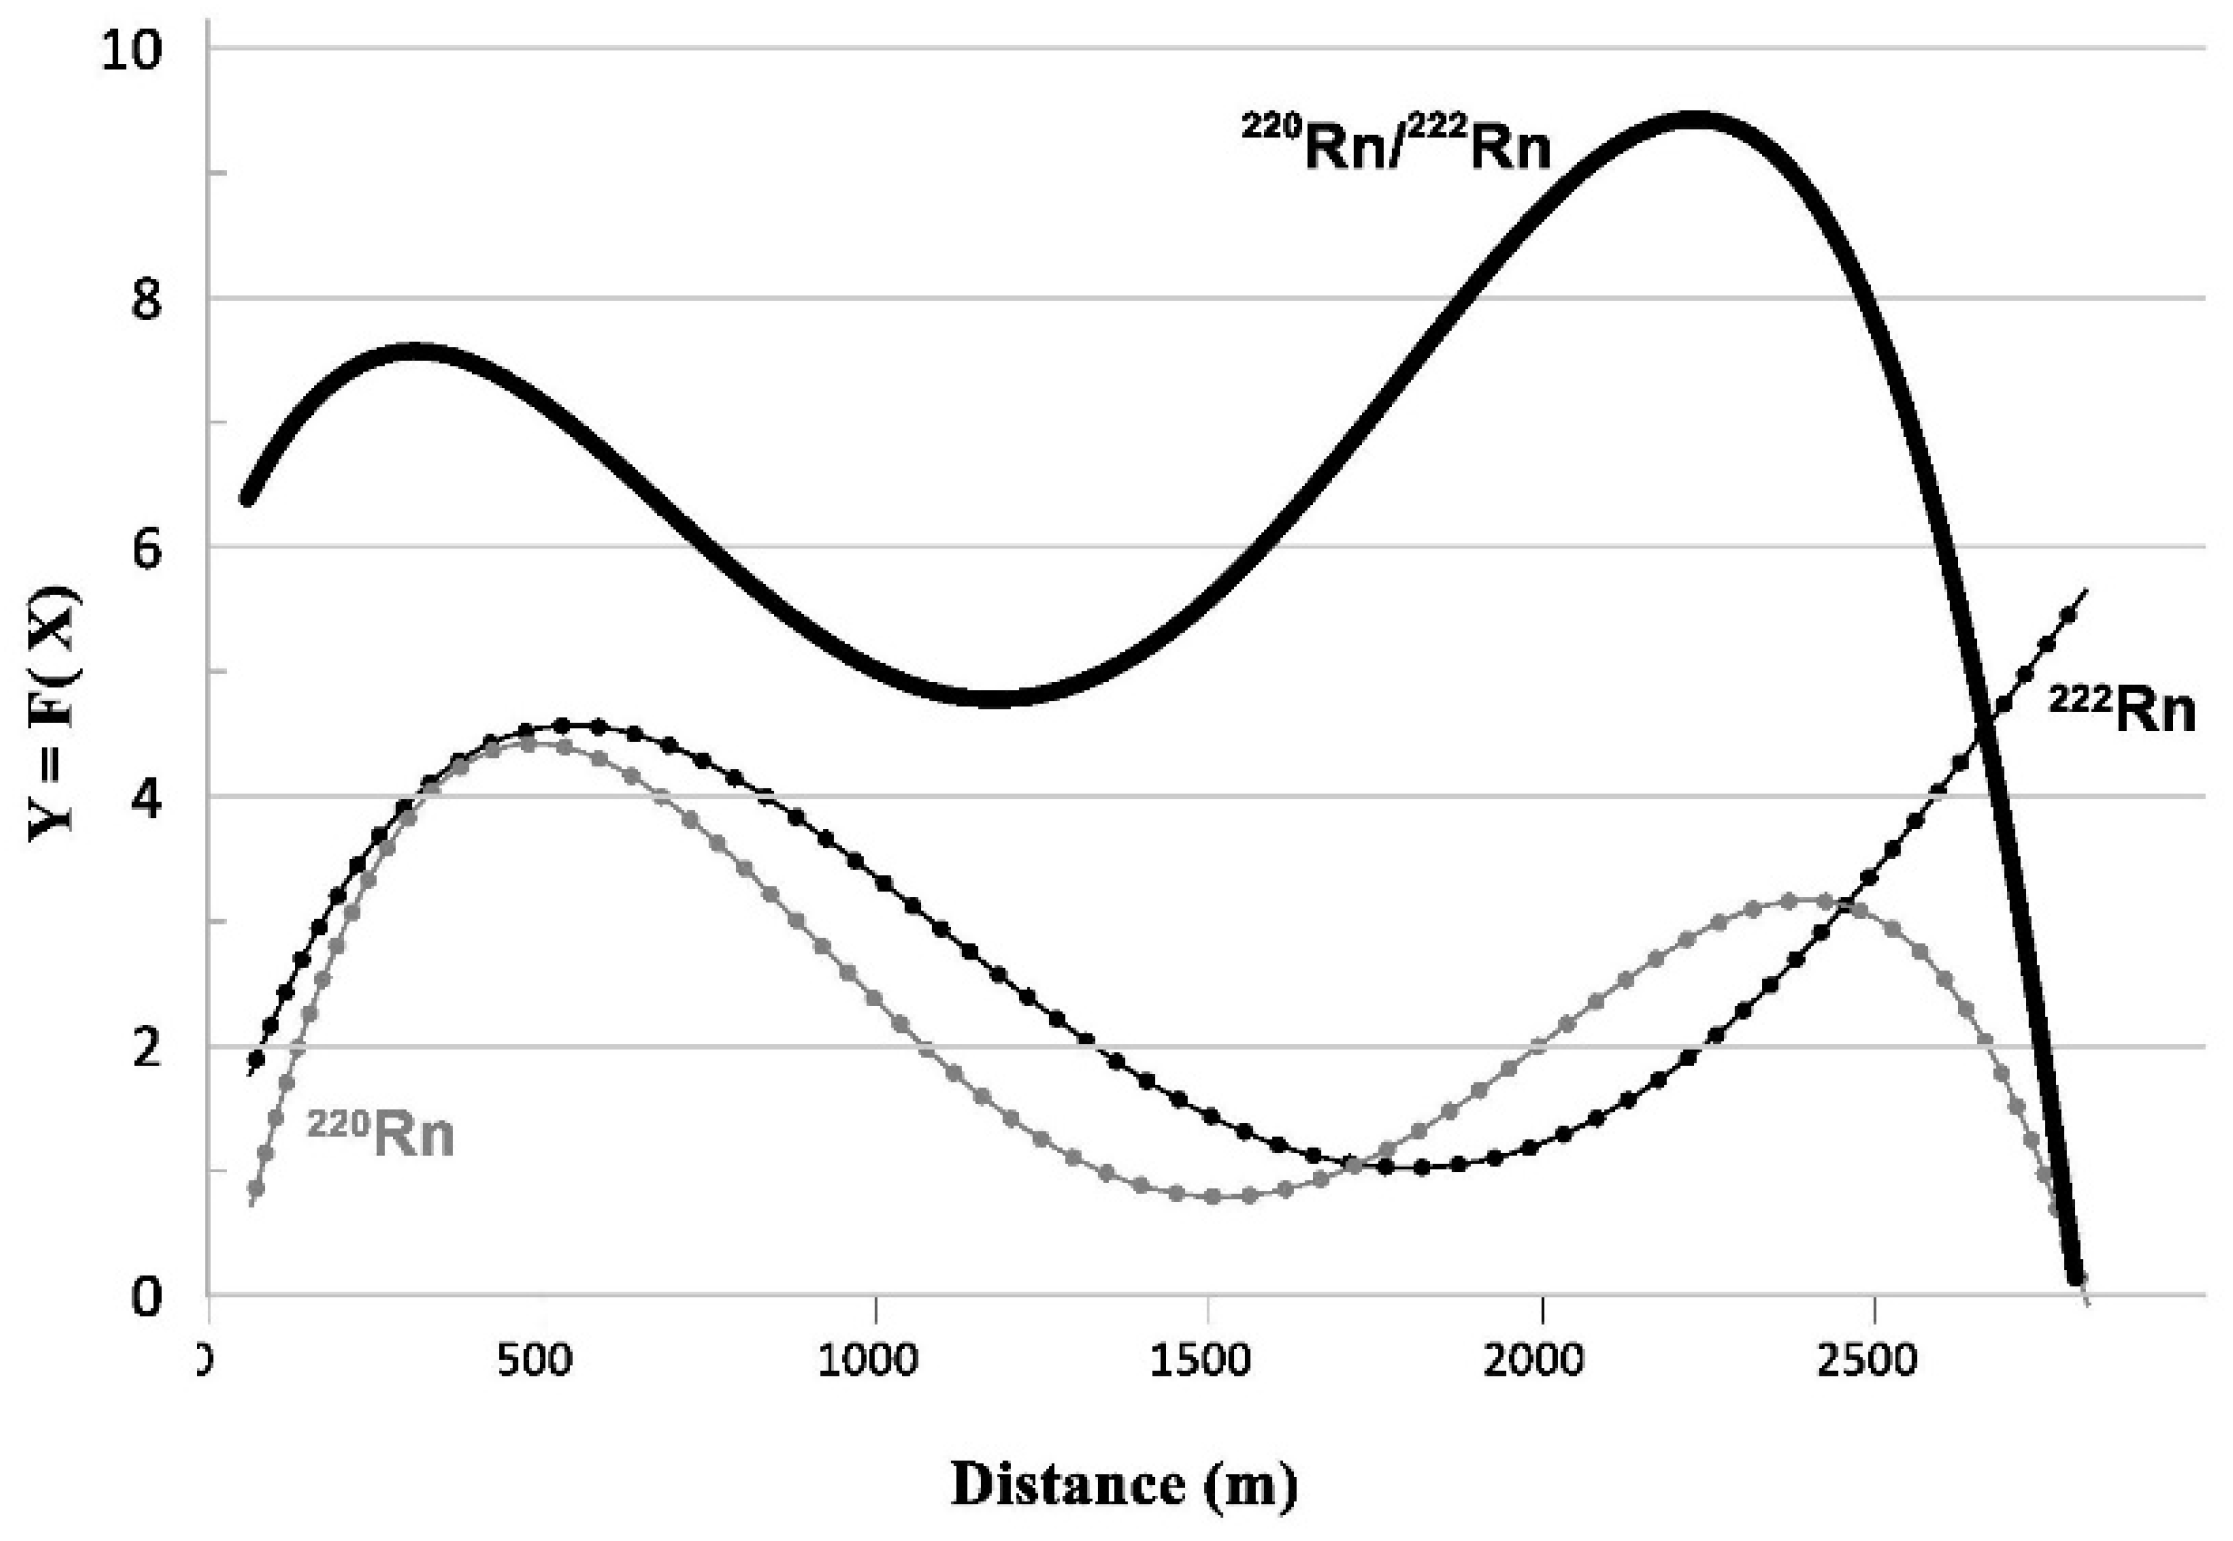
220Rn/
222Rn activity ratio implies high ground permeability, and is usually related to a high total flux next to structural discontinuities. The 3
rd order polynomial regression of
220Rn/
222Rn activity ratios are plotted against the distance from a reference point in
Figure 8. The high activity ratio found both in the north-western and in the central part of the investigated area suggest the presence of discontinuities (faults/fractures as well as hypogeal necropolis) not visible at the surface.
Many studies [
32,
33,
34] suggest a linear correlation between indoor radon and soil gas radon. However, a first comparison between soil gas and indoor radon concentrations at the study area shows no correlation between high indoor levels and soil gas anomalous zones. Radon soil gas anomalous values are strictly correlated with both tuff outcrops and necropolis whereas investigated houses were on argillaceous and alluvial deposits that, notoriously, can act as a very good isolation and sealing material due to its ability to immobilize water and other substances over geological ages, as demonstrated, for instance, by clay-capped hydrocarbon reservoirs all over the world [
35]. The cause of high indoor radon levels may be attributable to construction features of the houses and used materials: according to Righi and Bruzzi [
36], central Italy is characterized by volcanic rocks (i.e. tuffs) used as building materials and that are natural sources of radioactive emissions. Therefore, the natural radioactivity in tuff bricks play an important role in indoor radon accumulation that should be individuated for hazard estimation and land use planning. Results of indoor radon measurements would confirm that dwellings built over volcanic tuffs can go through harmful radon gas accumulation. An exception is for results from the 1
st floor level: only two samples have values < 100 Bq/m
3 whilst the rest is > 160 Bq/m
3 with a sample reaching 222 Bq/m
3. These high values are however below the radon threshold admitted for indoor radon exposure (<300 Bq/m
3) by the 2013/59 Euratom Directive [
36]. All indoor measurements were performed in winter during which, notoriously, maximum values of radon concentration are observed. This is because the windows of the houses are usually closed during winter causing scarce aeration in the rooms. Furthermore, winter variations of barometric pressure can have a positive effect on radon concentrations: an increase of barometric pressure causes an increase of radon concentration, especially if accompanied by windstorms and rain [
37].
7. Conclusions
The multiple and simultaneous investigations accomplished for this work, turned out to be the better approach for accurate identifications of radon natural radioactivity in terms of potential health risk due to exposure of this lethal gas.
A detailed radon survey (in soil, in-door and in waters) was conducted in the Cerveteri area (50 km north of Rome, Central Italy), within a densely populated area, to find out the radon source and the main causes influencing the distribution of this gas. The contour maps of both 222Rn and 220Rn soil gas distribution were elaborated using variogram models in the kriging algorithm. In particular, the study of radon distribution highlighted a NW-SE anisotropy pattern that is correlated to the limit of tuff outcrops, naturally producing radon. Lithology, therefore, is the main cause of the 222Rn distribution in soil but other causes (e.g., the presence of necropolis) were locally invoked to explain the radon variation.
Exposure to indoor radon can involve danger to human health and achieved results demonstrated that the risk is consistent for cellars/basements and, to a lesser extent, first floors of the dwellings situated within areas characterized by high Rn values. Actually, this gas accumulates in ground contact and poorly ventilated places. The missed correlation between 222Rn soil and indoor gas has pointed out the importance of building materials, often the main reason of indoor radon at the study area.
As a whole, the obtained results showed that the presence of degassing soils and the building materials strongly contribute to the indoor Rn distribution that should be individuated for hazard estimation and land use planning. It is firmly recommended that local authorities and citizens should be informed about the potential health risk of this toxic gas, its origin, characteristics and spatial distribution. Since highest indoor radon values are below the radon threshold admitted for indoor radon exposure (<300 Bq/m3) by the 2013/59 Euratom Directive, it is to be hoped to evaluate seasonal variations to calculate annual effective dose equivalent. Meanwhile, a more ventilated entry areas and presence of air-conditioning with a regulated interchange of air would facilitate the radon escape from “contaminated” houses.
Author Contributions
N.V. performed sampling surveys and laboratory analysis, data organization, statistical and graphical elaboration. A.G. contributed to the data acquisition. G.G. performed water and indoor radon analysis. All authors contributed to manuscript revision, read and approved the submitted version.
Funding
This research received no external funding.
Data Availability Statement
The data cannot be made publicly available upon publication because they contain sensitive personal information. The data that support the findings of this study are available upon reasonable request from the authors.
Conflicts of Interest
The authors declare no conflict of interest.
References
- Darby, S.; Hill, D.; Doll, R. Radon: a likely carcinogen at all exposures. Annals of Oncology, 2001, 12(10), 1341-1351. [CrossRef]
- Oh, S. S.; Koh, S.; Kang, H.; Lee; J. Radon exposure and lung cancer: risk in nonsmokers among cohort studies. Annals of Occupational and Environ. Medicine; 2016, 28(1), 1-6. [CrossRef]
- Jönsson; G.; Baixeras, C.; Devantier, R.; Enge, W.; Font, L.L.; Freyer, et al. Soil radon levels measured with SSNTD’s and the soil radium content. Radiat Meas, 1999, 31(1), 291–294. [CrossRef]
- Cinelli, G.; Tositti, L.; Capaccioni, B.; Brattich, E.; Mostacci, D. Soil gas radon assessment and development of a radon risk map in Bolsena, Central Italy. Environ Geochem Health, 2015, 37, 305–319. [CrossRef]
- Pfanz, H.; Yüce, G.; Gulbay, A.H.; Gokgoz, A. Deadly CO2 gases in the Plutonium of Hierapolis (Denizli, Turkey). Archaeol Anthrop, 2018, Sci. https ://doi.org/10.1007/s1252 0-018-0599-5.
- Ajiboye, Y.; Isinkaye, M. O.; Khanderkar, M. U. Spatial distribution mapping and radiological hazard assessment of groundwater and soil gas radon in Ekiti State, Southwest Nigeria. Environ. Earth Sc., 2018, 77(14), 1-15.
- Zhuo, W.; Lida, T.; Morizumi, S. Simulation of the concentration levels and distributions of indoor radon and thoron, Rad. Prot. Dosim., 2001, 93, 357-368.
- Voltattorni, N. Il radon e la radioattività ambientale: risultati del progetto di Alternanza Scuola-Lavoro “Misure dell’attività del gas radon nei suoli e nelle acque nel territorio di Cerveteri (Roma, Italia centrale)”. Misc. INGV, 2019, 47. ISSN 2039-6651. https://www.earth-prints.org/handle/2122/13269.
- Bertagnini, A.; De Rita, D.; Landi, P. Mafic inclusions in the silica-rich rocks of the Tolfa-Ceriti-Manziana volcanic district (Tuscan Province, Central Italy): chemistry and mineralogy. Mineralogy and Petrology, 1995, 54(3-4), 261-276. [CrossRef]
- Pinarelli, L. Geochemical and isotopic (Sr, Pb) evidence of crust-mantle interaction in acidic melts—The Tolfa-Cerveteri-Manziana volcanic complex (central Italy): A case history. Chemical geology, 1991, 92(1-3), 177-195.
- Compagnoni, B.; Giardini, G.; Jacobacci, A.; Malatesta, A.; Molinari Paganelli, V.; Valletta, M. Note illustrative del F° 373 Cerveteri, 1986, Servizio Geologico D’Italia – Istituto Poligrafico e Zecca dello Stato, Roma.
- Alfeld, M.; Baraldi, C.; Gamberini, M. C.; Walter, P. Investigation of the pigment use in the Tomb of the Reliefs and other tombs in the Etruscan Banditaccia Necropolis. X-Ray Spectrometry, 2019, 48(4), 262-273. [CrossRef]
- Singla, A. K.; Kansal, S.; Rani, S.; Mehra, R. Radiological risk assessment due to attached/unattached fractions of radon and thoron progeny in Hanumangarh district, Rajasthan. J. of Radioanalytic. and Nucl. Chem., 2021, 330(3), 1473-1483. [CrossRef]
- UNSCEAR. Sources and effects of ionizing radiation. United Nations Scientific Committee on the Effects of Atomic Radiation, 2000, Report to the General Assembly, with scientific annexes. New York: United Nations.
- World Health Organization (2009). WHO handbook on indoor radon: a public health perspective. 2009, World Health Organization.
- Chauhan, R. P.; Kumar, A.; Chauhan, N.; Joshi, M.; Aggarwal, P.; Sahoo, B. K. Ventilation effect on indoor radon–thoron levels in dwellings and correlation with soil exhalation rates. Indoor and Built Environment, 2016, 25(1), 203-212. [CrossRef]
- Kansal, S.; Mehra, R.; Singh, N. P. (2012). Life time fatality risk assessment due to variation of indoor radon concentration in dwellings in western Haryana, India. Applied Radiation and Isotopes, 2012, 70(7), 1110-1112.
- Cavallo, A. The radon equilibrium factor and comparative dosimetry in homes and mines. Radiat. Prot. Dosim., 2000, 92(4), 295–298. [CrossRef]
- Fatima, I.; Zaidi, J. H.; Arif, M.; Tahir, S. N. A. Measurement of natural radioactivity in bottled drinking water in Pakistan and consequent dose estimates. Radiation Protection Dosimetry, 2007, 123(2), 234-240. [CrossRef]
- Hevey, D. Radon risk and remediation: A psychological perspective. Frontiers in public health, 2017, 5, 63. [CrossRef]
- Galli, G.; Cannelli, V.; Nardi, A.; Piersanti, A. Implementing soil radon detectors for long term continuous monitoring. Applied Radiation and I.sotopes, 2019, 153, 108813. [CrossRef]
- Galli, G.; Guadoni, C.; Mancini, C. Radon grab sampling in water by means of radon transfer in activated charcoal collector. Il nuovo cimento, 1999, 22(3-4), 583-588.
- Sinclair, A. J. A fundamental approach to threshold estimation in exploration geochemistry: probability plots revisited. J. of Geochem. Expl., 1991, 41(1-2), 1-22. [CrossRef]
- Przylibski, T. A. (2004). Concentration of 226Ra in rocks of the southern part of Lower Silesia (SW Poland). J. of Environ. Radioact, 2004, 75(2), 171-191. [CrossRef]
- Keller, G.; Hoffmann, B.; Feigenspan, T. H. Radon permeability and radon exhalation of building materials. Science of the total environment, 2001, 272(1-3), 85-89. [CrossRef]
- Euroatom. Council Directive 2013/59/Euratom European Council, 2014. Off. J. Eur. Union, 2014, 57(L13), 1–73.
- Cinti, D.; Vaselli, O.; Poncia, P. P.; Brusca, L.; Grassa, F.; Procesi, M.; Tassi, F. Anomalous concentrations of arsenic, fluoride and radon in volcanic-sedimentary aquifers from central Italy: Quality indexes for management of the water resource. Environ. Pollut., 2019, 253, 525-537. [CrossRef]
- Gringarten, E., and Deutsch, C.V. (2001). Teacher's aide variogram interpretation and modeling. Mathematical Geology, 33(4), 507-534.
- Torelli, M. (2021). The History. In “Caere” (pp. 5-14). University of Texas Press.
- Padilla, G. D., Hernández, P. A., Padrón, E., Barrancos, J., Pérez, N. M., Melián, G., et al. (2013). Soil gas radon emissions and volcanic activity at El Hierro (Canary Islands): The 2011-2012 submarine eruption. Geochemistry, Geophysics, Geosystems, 14(2), 432-447. [CrossRef]
- Yang, T. F., Walia, V., Chyi, L. L., Fu, C. C., Chen, C. H., Liu, et al. (2005), Variations of soil radon and thoron concentrations in a fault zone and prospective earthquakes in SW Taiwan, Radiat. Meas., 40, 496–502. [CrossRef]
- Friedmann, H., Baumgartner, A., Bernreiter, M., Gräser, J., Gruber, V., Kabrt, F., et al. (2017). Indoor radon, geogenic radon surrogates and geology–Investigations on their correlation. Journal of environmental radioactivity, 166, 382-389.
- Adelikhah, M., Shahrokhi, A., Imani, M., Chalupnik, S., Kovács, T. (2021). Radiological assessment of indoor radon and thoron concentrations and indoor radon map of dwellings in Mashhad, Iran. International Journal of Environmental Research and Public Health, 18(1), 141. [CrossRef]
- Djeufack, L. B., Kendjou, L. T., Bineng, G. S., Modibo, O. B., Abba, H. Y., Saïdou, Zhukovsky, M. (2022). Study of correlation between radon (222Rn) gas in soil and indoor radon with dose assessment in the bauxite bearing area of Fongo-Tongo, Western Cameroon. International Journal of Environmental Analytical Chemistry, 1-21.
- Voltattorni, N., Lombardi, S., Rizzo, S. (2010). 222Rn and CO2 soil–gas geochemical characterization of thermally altered clays at Orciatico (Tuscany, Central Italy). Applied Geochemistry, 25(8), 1248-1256.
- Righi, S., and Bruzzi, L. (2006). Natural radioactivity and radon exhalation in building materials used in Italian dwellings. Journal of environmental radioactivity, 88(2), 158-170. [CrossRef]
- Mentes, G., and Eper-Pápai, I. (2015). Investigation of temperature and barometric pressure variation effects on radon concentration in the Sopronbánfalva Geodynamic Observatory, Hungary. Journal of Environmental Radioactivity, 149, 64-72. [CrossRef]
Figure 1.
Geological sketch map of the Cerveteri (Rome, Central Italy) study area and radon investigations. Soil gas 222Rn and 220Rn, indoor radon and dissolved radon in water are represented by green, red and blue symbols respectively.
Figure 1.
Geological sketch map of the Cerveteri (Rome, Central Italy) study area and radon investigations. Soil gas 222Rn and 220Rn, indoor radon and dissolved radon in water are represented by green, red and blue symbols respectively.
Figure 2.
Normal probability plots of 222Rn (a) and 220Rn (b). Both plots show some outliers (222Rn values >49000 Bq/m3, 220Rn values > 300000 Bq/m3) and different populations (i.e. background, anomalous values) along the probability curve.
Figure 2.
Normal probability plots of 222Rn (a) and 220Rn (b). Both plots show some outliers (222Rn values >49000 Bq/m3, 220Rn values > 300000 Bq/m3) and different populations (i.e. background, anomalous values) along the probability curve.
Figure 3.
The box plots show a comparison of indoor radon values from the four monitored levels (cellars, basements, ground floors and first floors). The whiskers, at the end of each box indicate the extreme values (minimum and maximum), the box is defined by the lower and upper quartiles, and the line in the center of the box is the median.
Figure 4.
Experimental variogram and the relative fitting model for radon data. The fitted model is spherical function for which at distance greater than 700 m, sample pairs will no longer be autocorrelated and thus the variogram reaches the asymptotic threshold value of 0.16 γ.
Figure 4.
Experimental variogram and the relative fitting model for radon data. The fitted model is spherical function for which at distance greater than 700 m, sample pairs will no longer be autocorrelated and thus the variogram reaches the asymptotic threshold value of 0.16 γ.
Figure 5.
222Rn soil gas concentration distribution. The maximum anisotropy orientation (NW-SW) is parallel to the tuff outcrop where the Banditaccia necropolis is located. Other spot anomalies (values >25000 Bq/m3) are found in the south-eastern sector of the investigated area in correspondence of small tuff outcrops or Etruscan ruins.
Figure 6.
220Rn soil gas concentration distribution. The maximum anisotropy orientation (NE-SW) is orthogonal to the tuff outcrop. Other spot anomalies (values >90000 Bq/m3) are found in the south-eastern sector of the investigated area in correspondence of 222Rn anomalies and where small tuff outcrops or Etruscan ruins are present.
Figure 7.
Correlation between 222Rn and 220Rn activity. The graph shows a good correlation between the measured radon and thoron concentrations indicating a mixing of deep and shallow gas sources.
Figure 7.
Correlation between 222Rn and 220Rn activity. The graph shows a good correlation between the measured radon and thoron concentrations indicating a mixing of deep and shallow gas sources.
Figure 8.
The 3rd order polynomial regression of 220Rn/222Rn activity ratios are plotted against the distance from a reference point. The high activity ratio found both in the north-western and in the central part of the investigated area suggest the presence of discontinuities (faults/fractures as well as hypogeal necropolis) not visible at the surface.
Table 1.
Descriptive statistics of 222Rn and 220Rn soil gas results from the studied Cerveteri area.
Table 1.
Descriptive statistics of 222Rn and 220Rn soil gas results from the studied Cerveteri area.
Table 2.
Descriptive statistics of indoor radon results from the studied Cerveteri area.
Table 2.
Descriptive statistics of indoor radon results from the studied Cerveteri area.
| Indoor Rn (Bq/m3) |
N |
Min |
Max |
Median |
LQ |
UQ |
St. Dev. |
| Cellar |
7 |
44,8 |
303,9 |
149 |
100,7 |
227 |
89,1 |
| 1st floor |
5 |
34,5 |
222 |
163,5 |
78,5 |
202 |
76,8 |
| Ground floor |
5 |
42,5 |
197,1 |
80 |
49,6 |
141,5 |
63,2 |
| Basement |
7 |
49,2 |
1144 |
248 |
78,3 |
341 |
379,7 |
|
Disclaimer/Publisher’s Note: The statements, opinions and data contained in all publications are solely those of the individual author(s) and contributor(s) and not of MDPI and/or the editor(s). MDPI and/or the editor(s) disclaim responsibility for any injury to people or property resulting from any ideas, methods, instructions or products referred to in the content. |
© 2023 by the authors. Licensee MDPI, Basel, Switzerland. This article is an open access article distributed under the terms and conditions of the Creative Commons Attribution (CC BY) license (http://creativecommons.org/licenses/by/4.0/).
