Submitted:
13 June 2023
Posted:
14 June 2023
You are already at the latest version
Abstract
Keywords:
1. Introduction
2. Materials and Methods
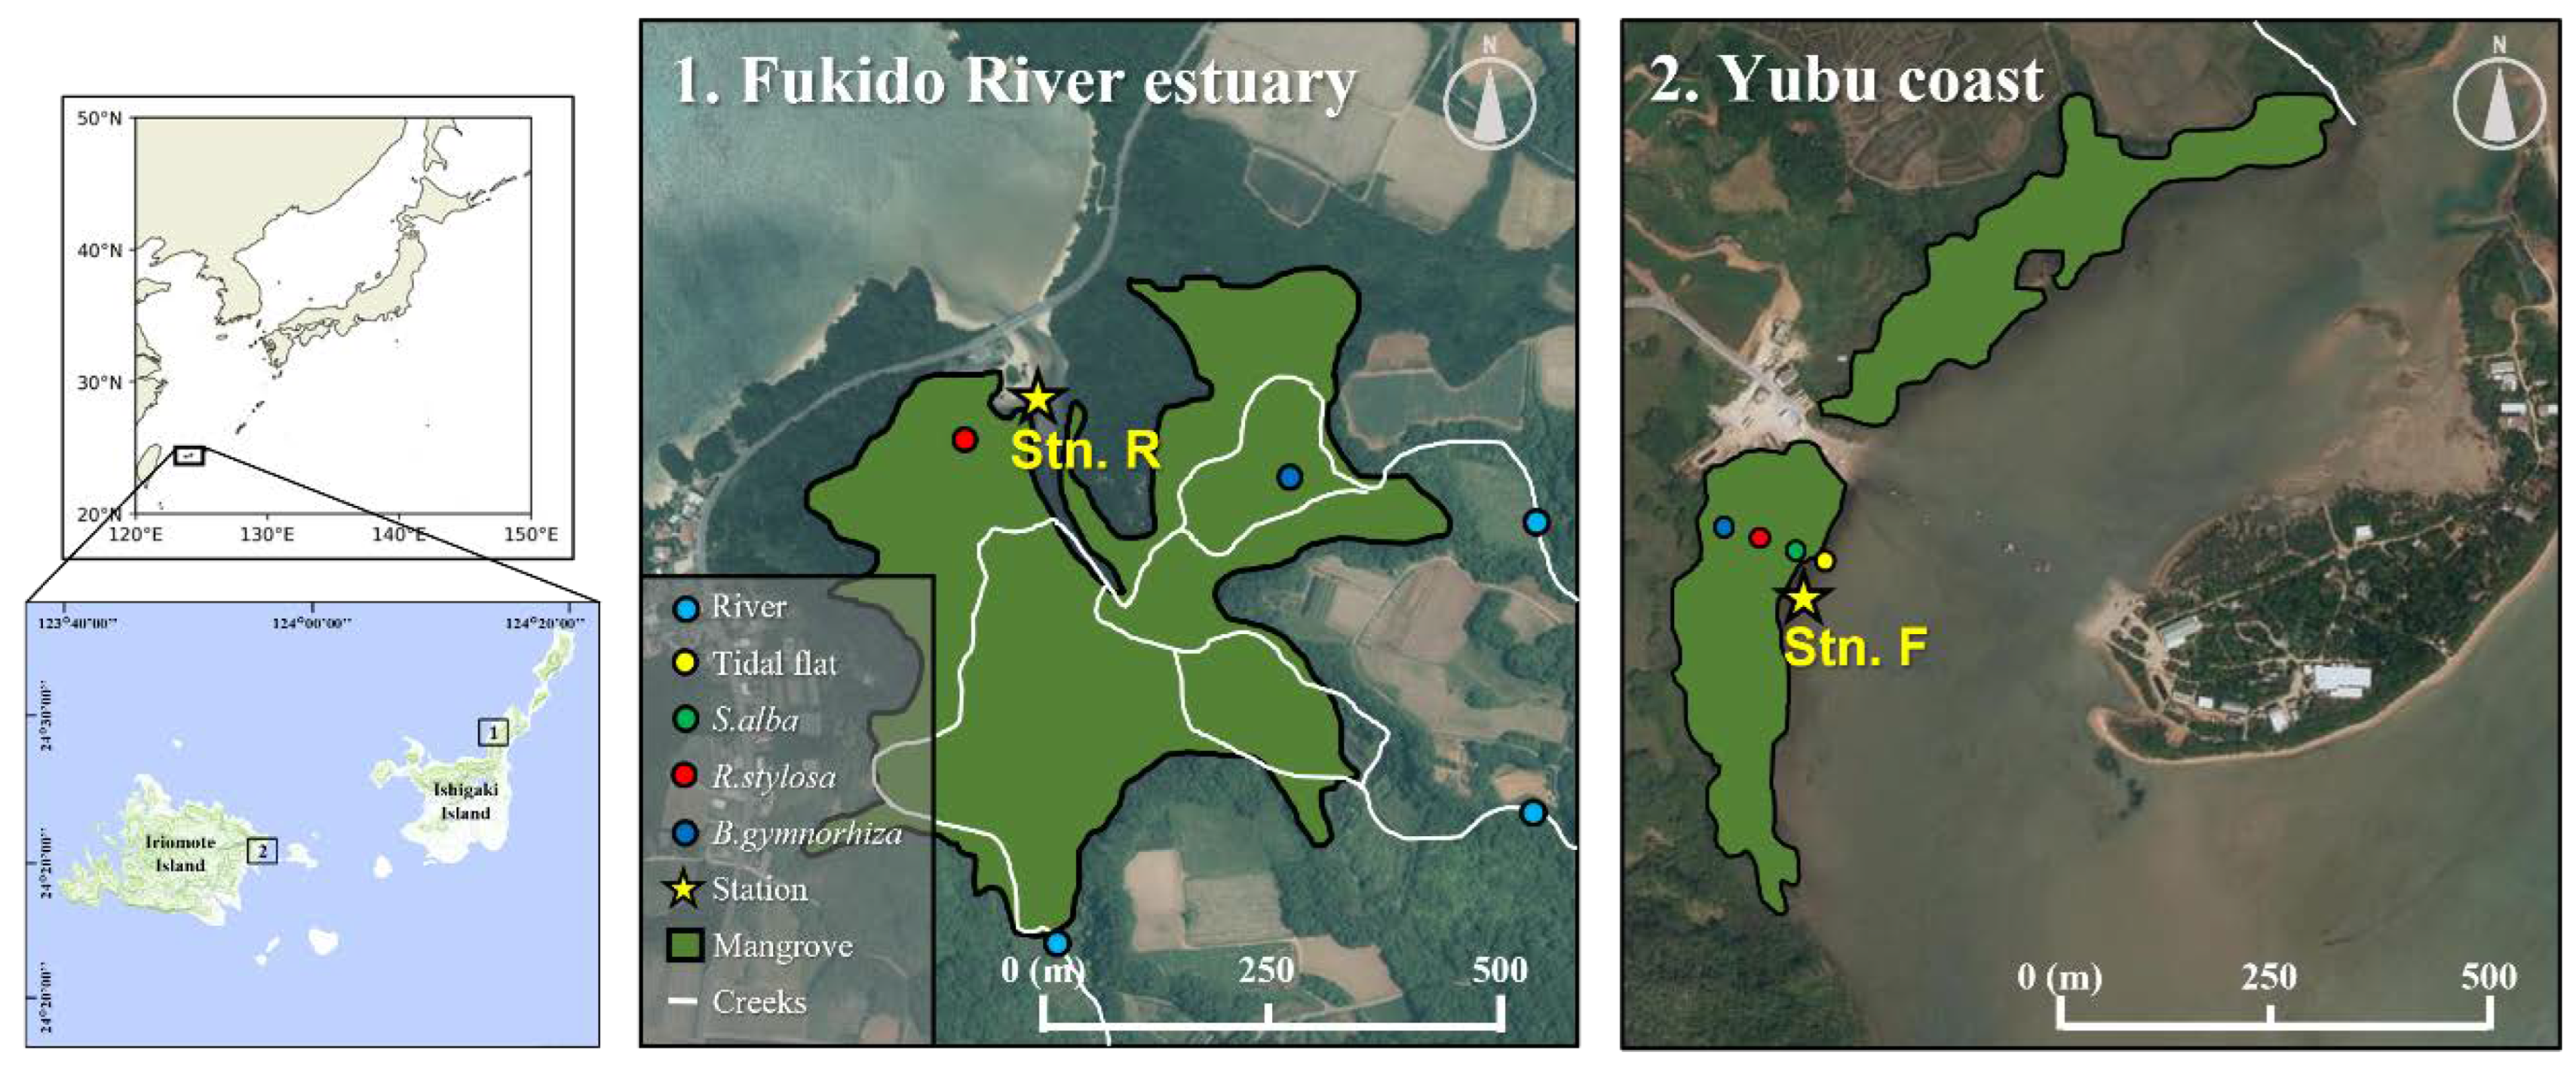
2.1. Field sites
2.2. Field surveys
2.3. Analytical Protocol
2.4. Data Analysis
| Sample | Sand (%) | Silt (%) | Clay (%) | Texture | Color (dry) | SOC (%) | TN (%) | C/N | Ignition loss (%) |
|---|---|---|---|---|---|---|---|---|---|
| Fukido River estuary (A riverine mangrove). RSH is 16 ± 2 cm from MSL. | |||||||||
| R.stylosa | 69.3 | 15.3 | 15.4 | SCL | 7.5 YR 3/1 | 6.0 | 0.3 | 26.8 | 13.8 |
| B.gymnorhiza* | 69.8 | 14.9 | 15.3 | SCL | 2.5 YR 4/2 | 3.1 | 0.1 | 30.2 | N.D. |
| Yubu coast (A fringe mangrove). RSH is 34 ± 3 cm from MSL. | |||||||||
| Tidal flat | 93.9 | 3.9 | 2.2 | S | 5 Y 6/2 | 1.1 | 0.04 | 21.5 | 4.1 |
| S.alba | 86.9 | 8.6 | 4.5 | LS | 5 Y 5/2 | 1.7 | 0.1 | 21.0 | 7.1 |
| R.stylosa | 71.4 | 19.3 | 9.3 | SL | 2.5 YR 3/1 | 4.8 | 0.1 | 41.7 | 25.5 |
| B.gymnorhiza | 89.1 | 8.0 | 2.9 | LS | 10 YR 4/1 | 2.7 | 0.1 | 40.0 | 8.0 |
|
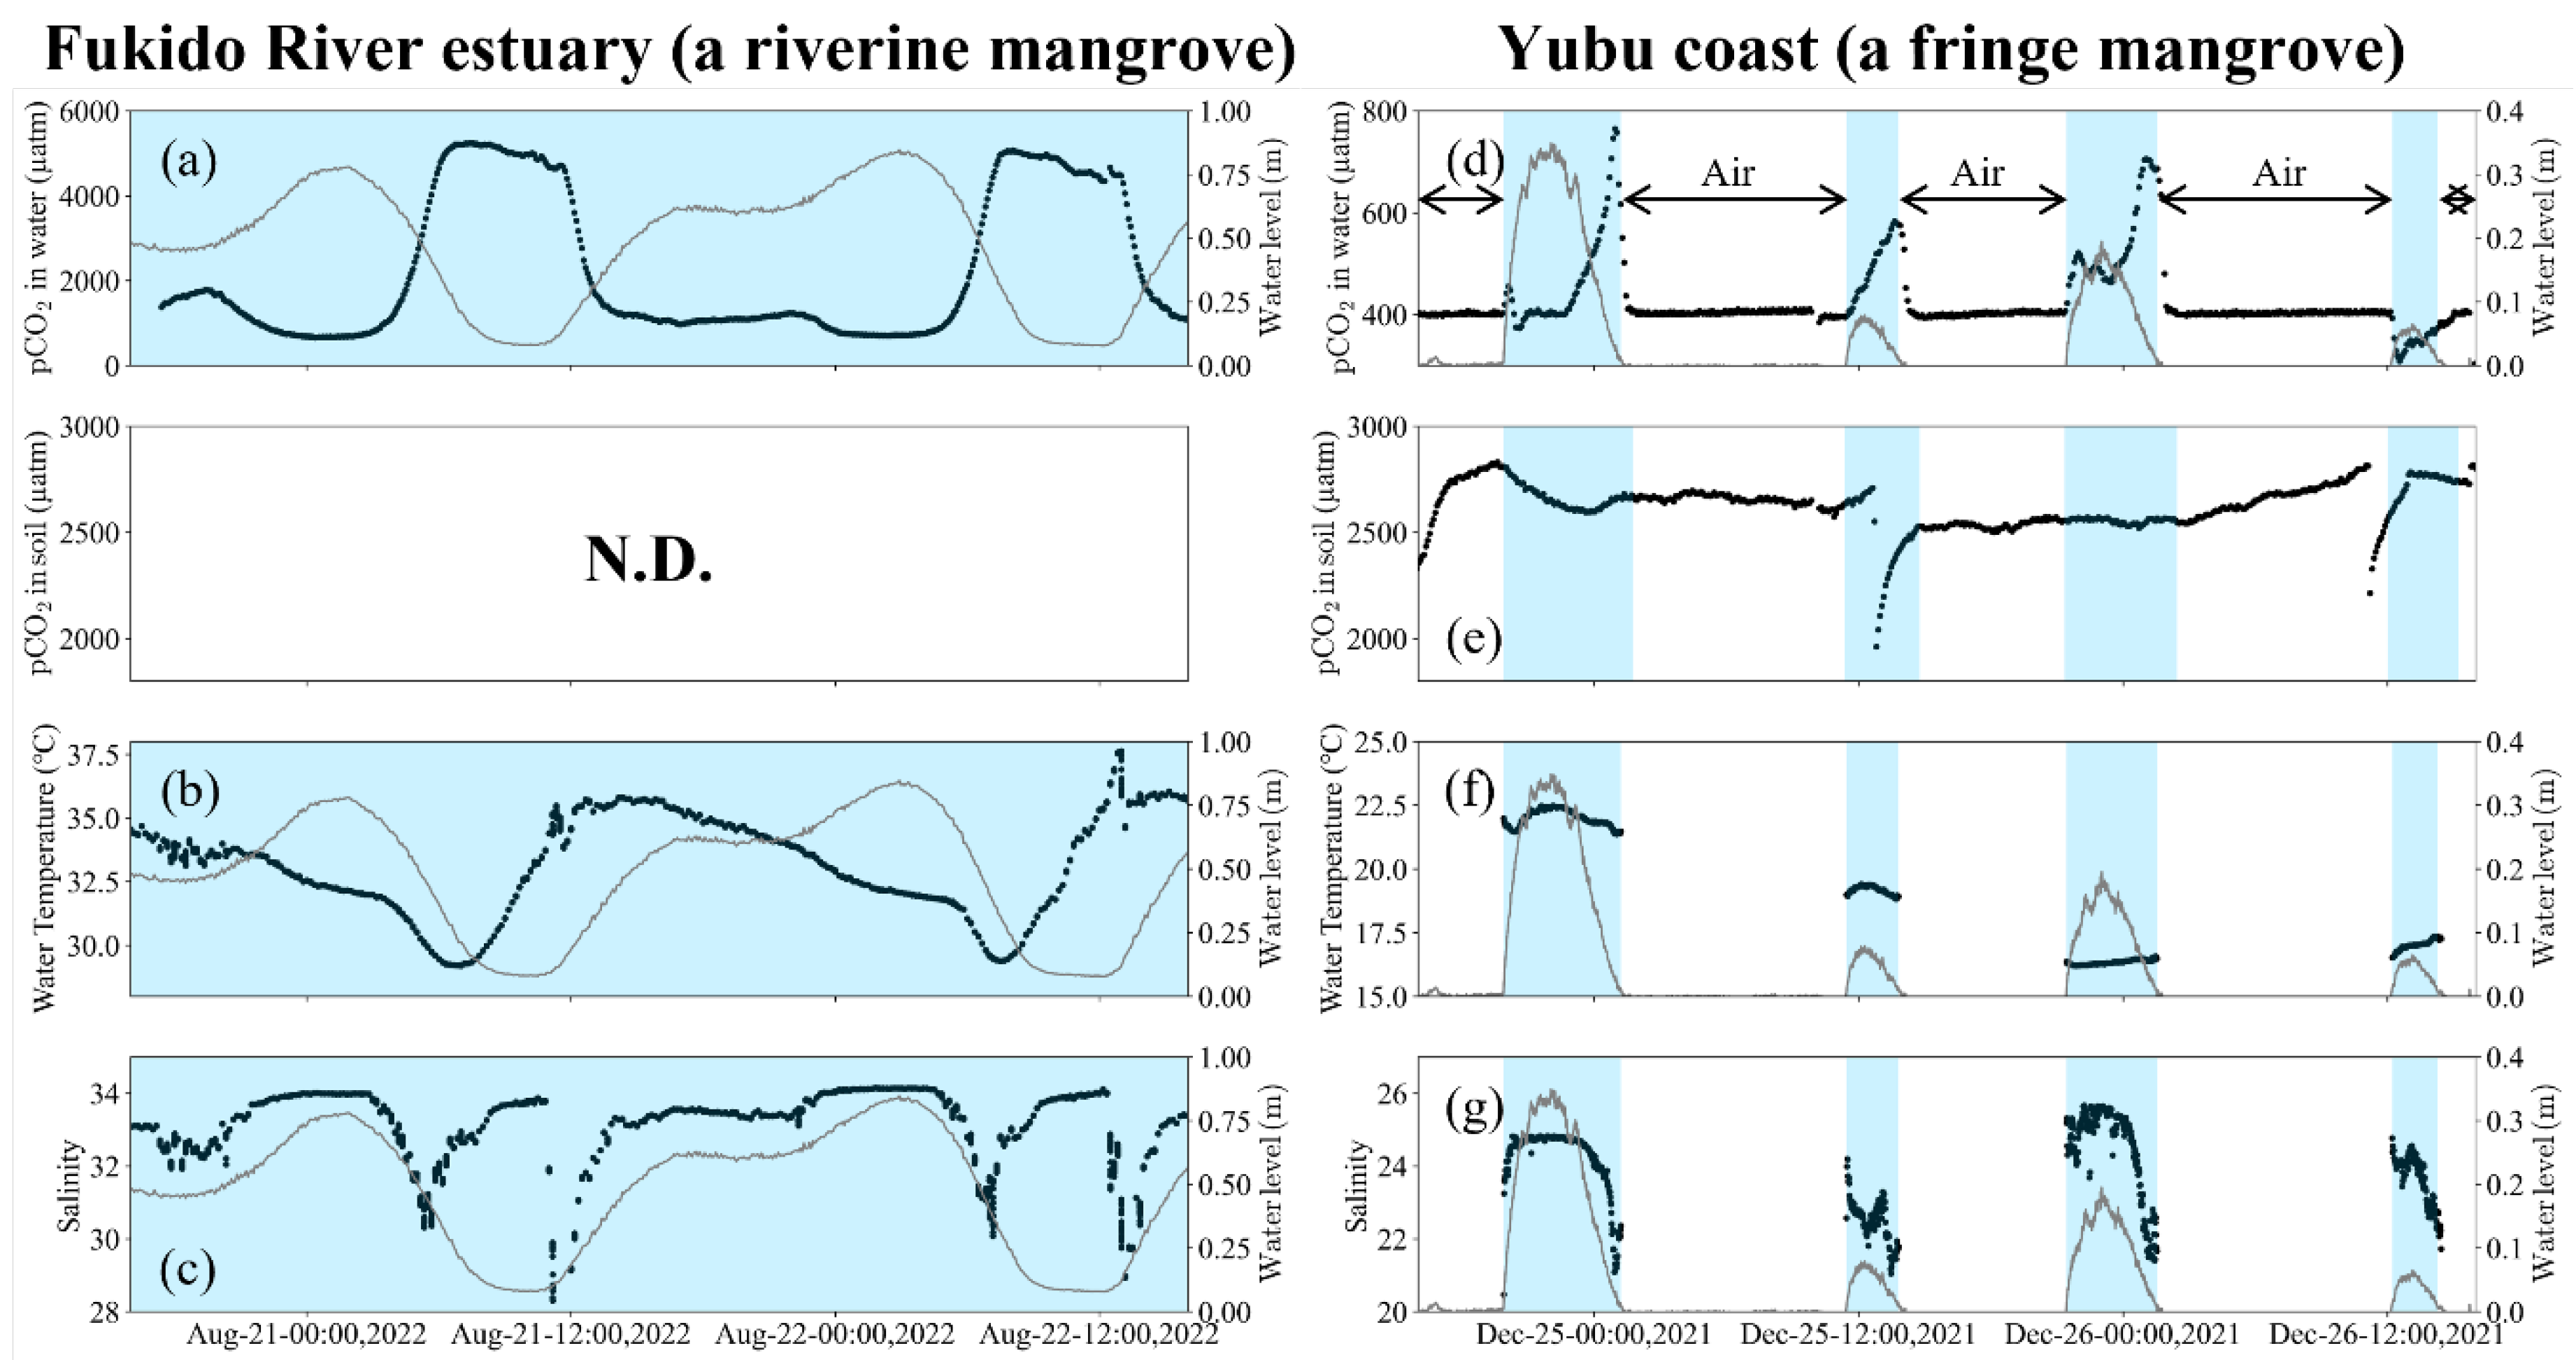
pCO2 in water (µatm) |
pCO2 in soil (µatm) |
Water Temperature (°C) |
Salinity | DO (%) | pHT | TA (µM) | DIC (µM) | |
|---|---|---|---|---|---|---|---|---|
| Fukido River estuary (A riverine mangrove) |
2229 ± 1678 (657 – 5242) |
N.D. | 32.3 ± 2.0 (28.9 – 35.7) |
33.0 ± 1.4 (29.2 – 34.1) |
80.5 ± 31.5 (30.7 – 126.0) |
7.772 ± 0.304 (7.226 – 8.115) |
2504 ± 358 (2169 – 3333) |
2365 ± 478 (1847 – 3289) |
| Yubu coast (A fringe mangrove) |
479 ± 103 (309 – 765) |
2624 ± 110 (1960 – 2831) |
19.1 ± 2.5 (16.2 – 22.5) |
23.9 ± 1.2 (20.5 – 25.7) |
102.9 ± 4.3 (91.2 – 108.9) |
7.921 ± 0.098 (7.752 – 8.082) |
2827 ± 182 (2490 – 3162) |
2601 ± 214 (2207 – 2977) |
3. Results
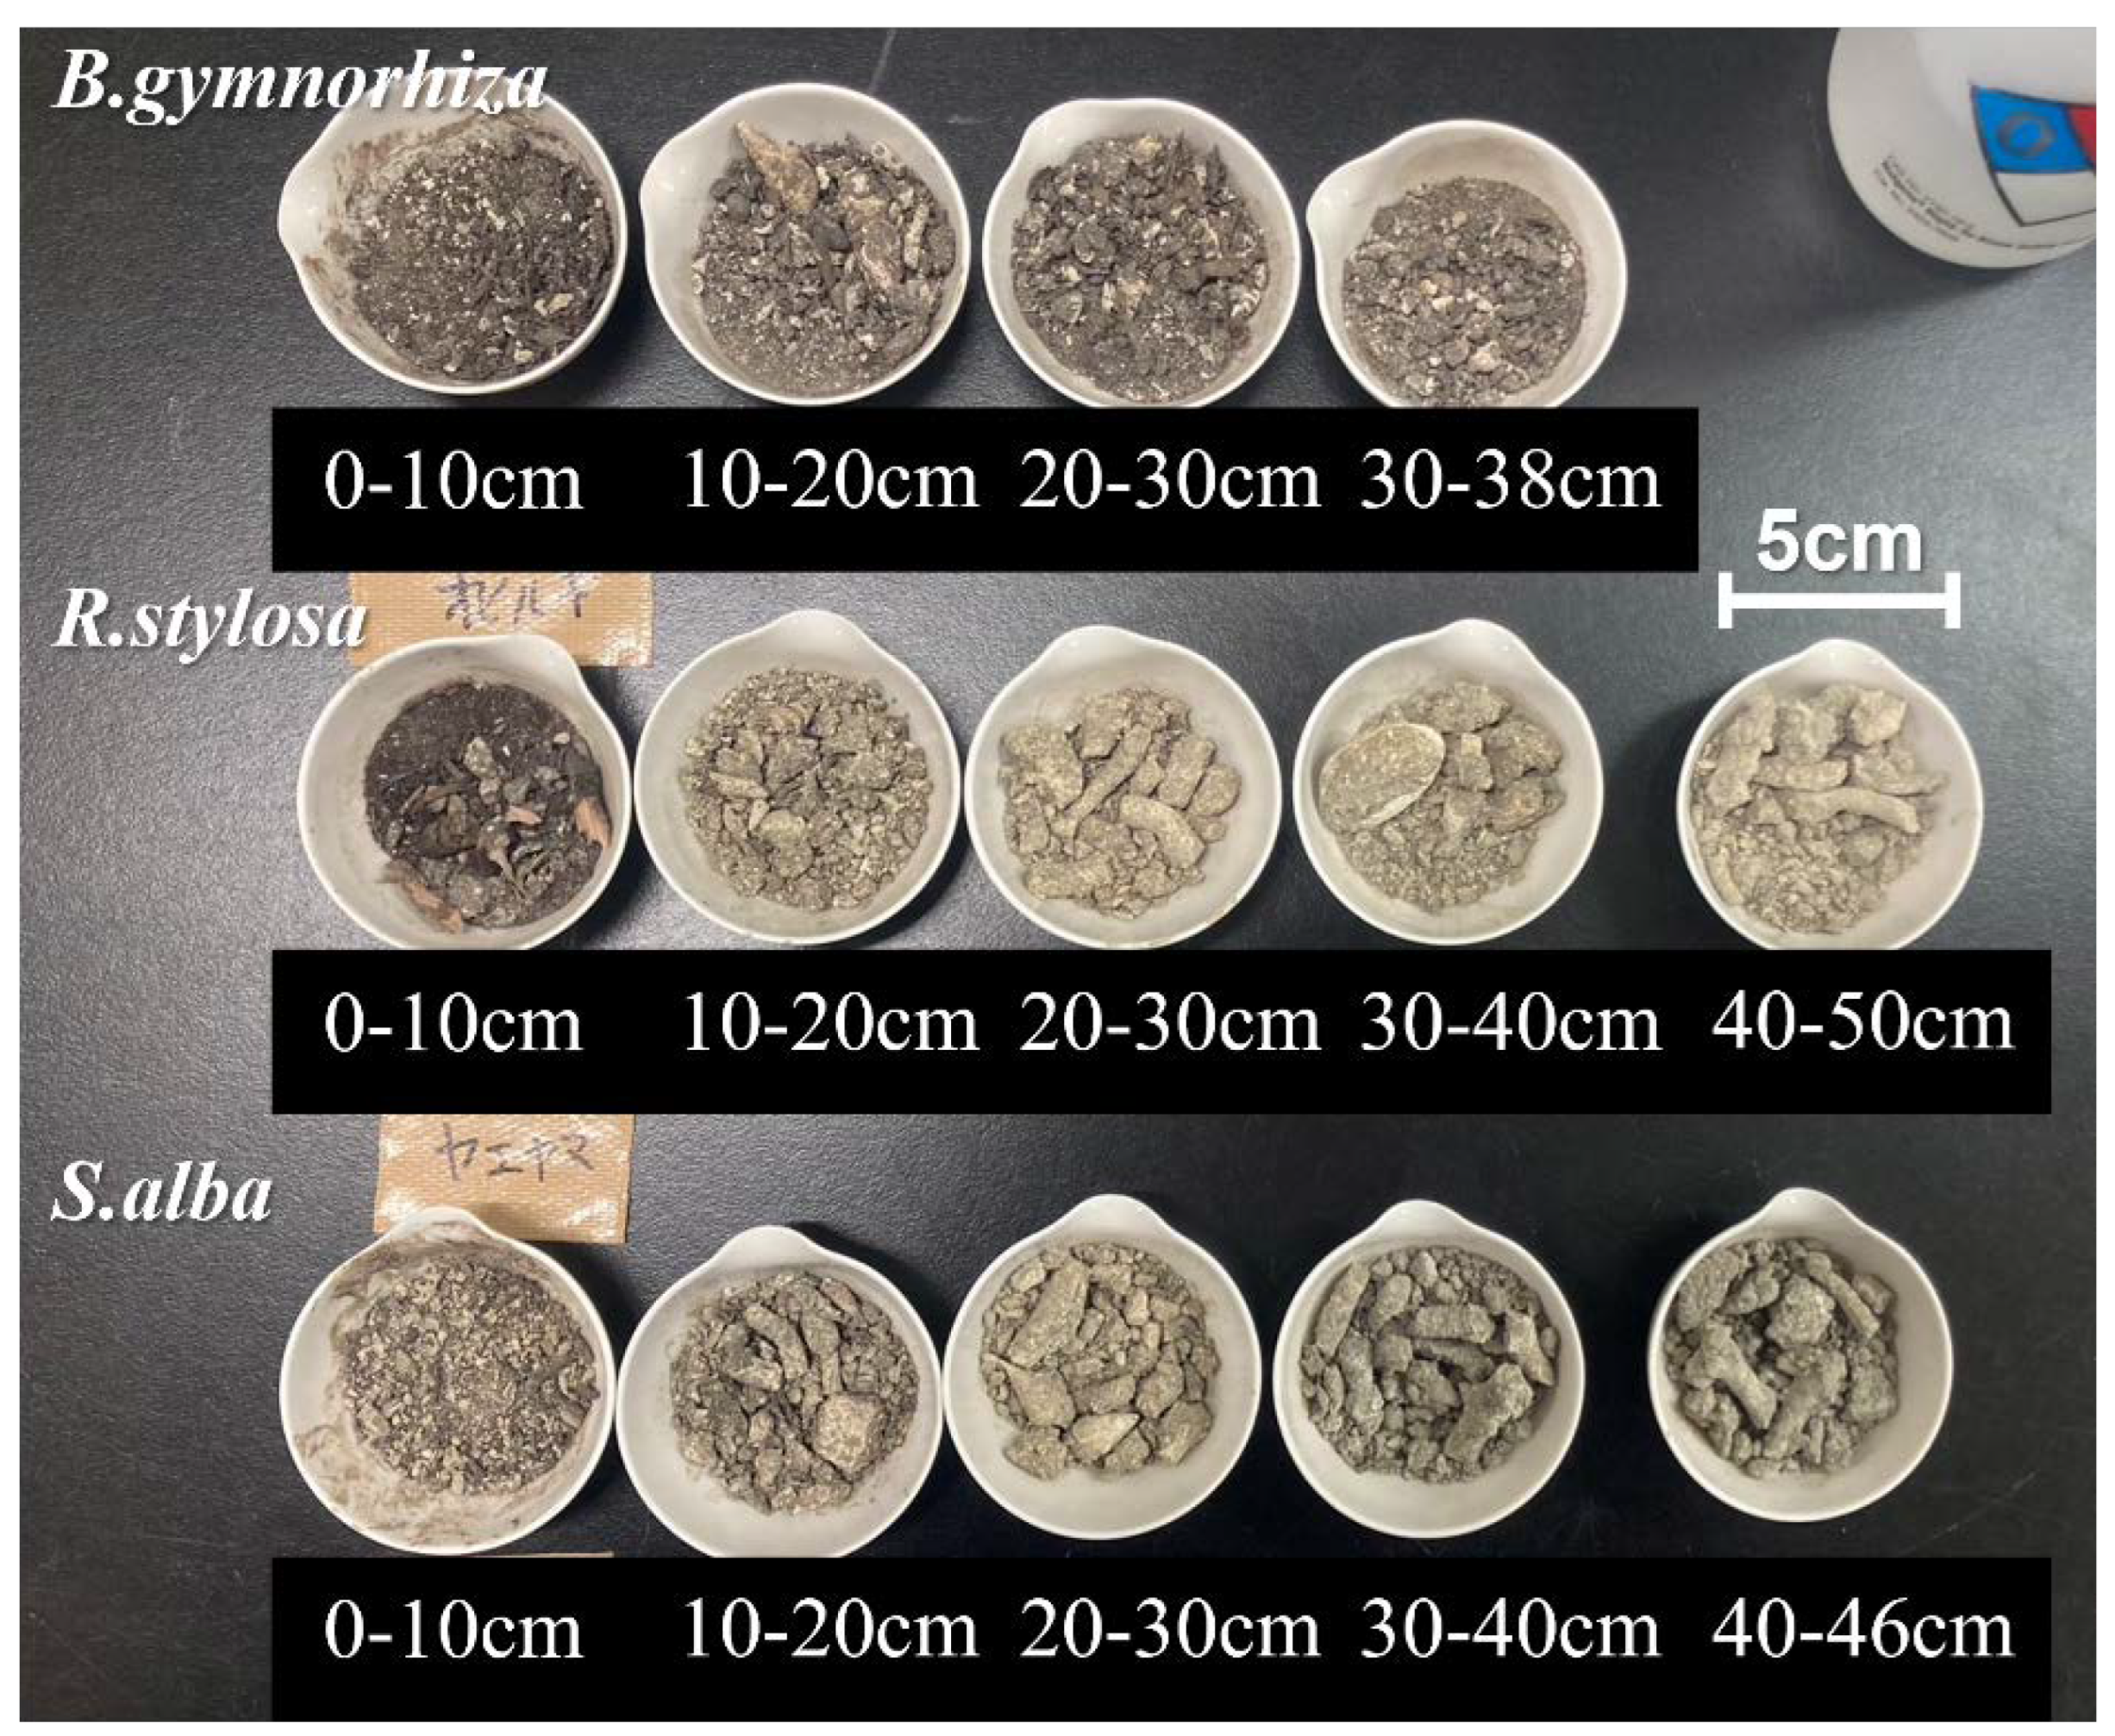
3.1. Physicochemical properties of surface mangrove soils
3.2. pCO2 and water quality change in front of each mangrove forest
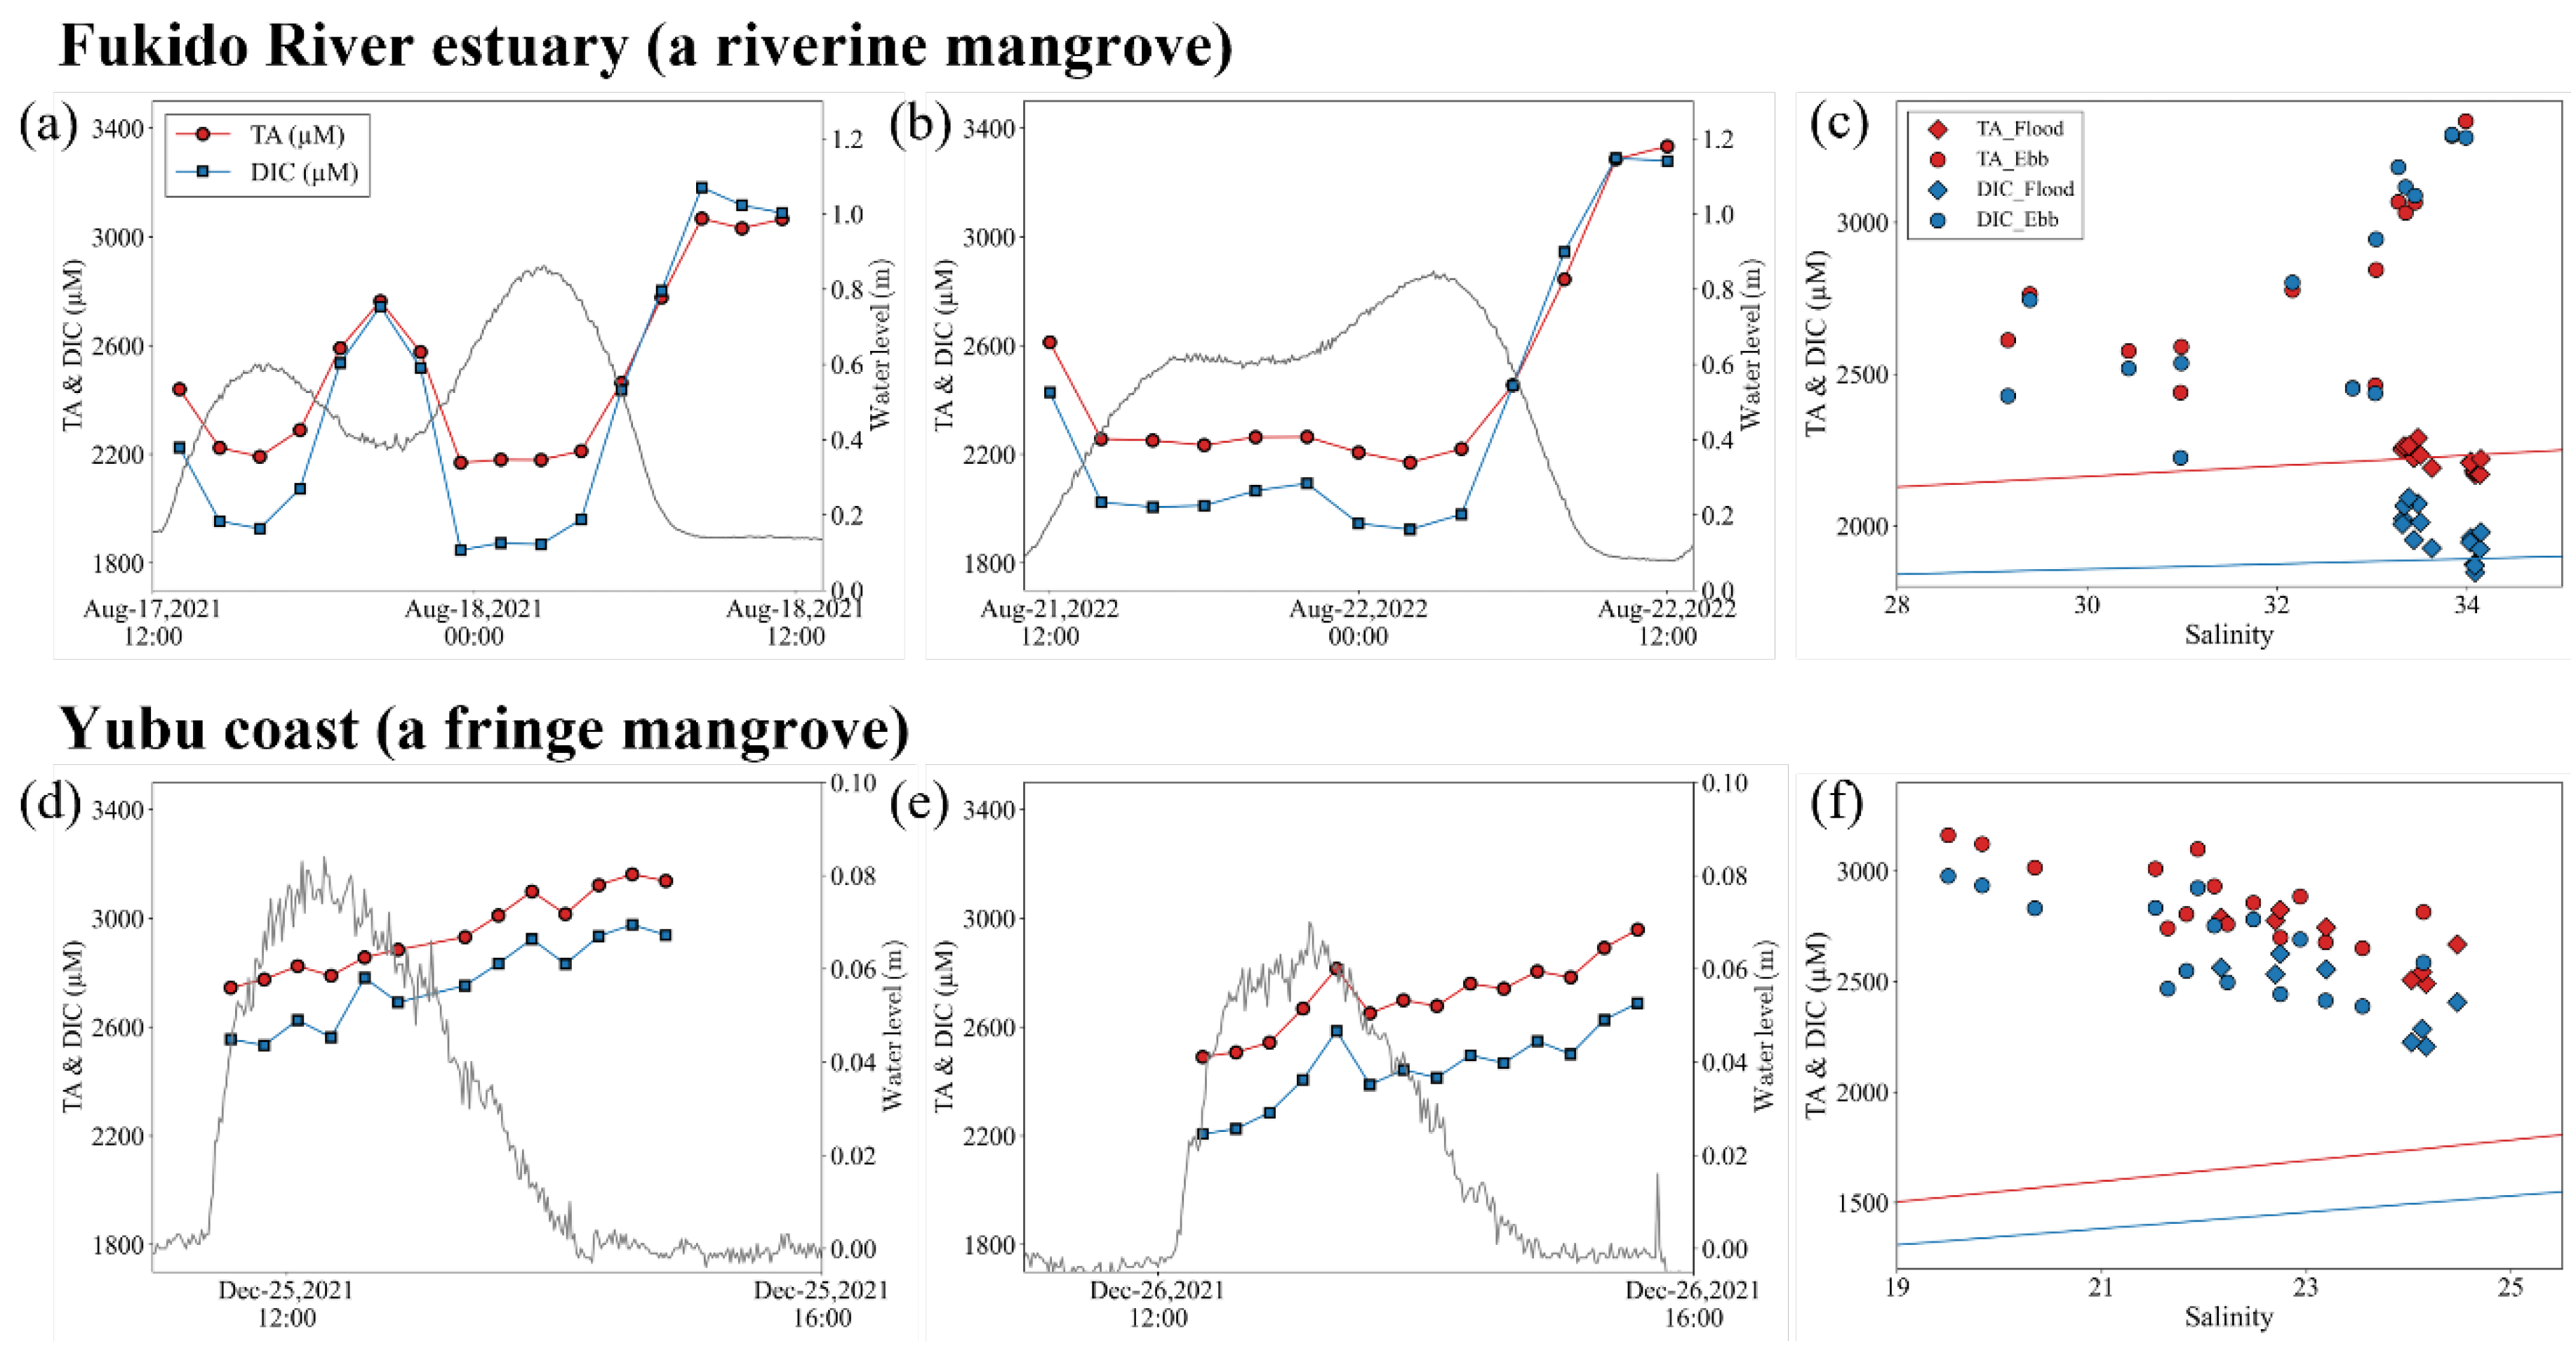
3.3. Carbonate parameters dynamics over several tidal cycles
4. Discussion
4.1. Effect of solubility on pCO2 dynamics
4.2. Different impact of the geomorphic settings on pCO2 dynamics
4.3. Geochemical impact on carbonate chemistry parameters
Author Contributions
Funding
Institutional Review Board Statement
Data Availability Statement
Acknowledgments
Conflicts of Interest
References
- Nellemann, C.; Corcoran, E. Blue Carbon: The Role of Healthy Oceans in Binding Carbon : A Rapid Response Assessment; UNEP/Earthprint, 2009.
- Howard, J.; Sutton-Grier, A.; Herr, D.; Kleypas, J.; Landis, E.; Mcleod, E.; Pidgeon, E.; Simpson, S. Clarifying the Role of Coastal and Marine Systems in Climate Mitigation. Front. Ecol. Environ. 2017, 15, 42–50. [Google Scholar] [CrossRef]
- Duarte, C.M.; Middelburg, J.J.; Caraco, N. Major Role of Marine Vegetation on the Oceanic Carbon Cycle. Biogeosciences 2005, 2, 1–8. [Google Scholar] [CrossRef]
- Duarte, C.M.; Losada, I.J.; Hendriks, I.E.; Mazarrasa, I.; Marbà, N. The Role of Coastal Plant Communities for Climate Change Mitigation and Adaptation. Nat. Clim. Chang. 2013, 3, 961–968. [Google Scholar] [CrossRef]
- Stieglitz, T.C.; Clark, J.F.; Hancock, G.J. The Mangrove Pump: The Tidal Flushing of Animal Burrows in a Tropical Mangrove Forest Determined from Radionuclide Budgets. Geochim. Cosmochim. Acta 2013, 102, 12–22. [Google Scholar] [CrossRef]
- Chen, X.; Santos, I.R.; Call, M.; Reithmaier, G.M.S.; Maher, D.; Holloway, C.; Wadnerkar, P.D.; Gómez-Álvarez, P.; Sanders, C.J.; Li, L. The Mangrove CO2 Pump: Tidally Driven Pore-water Exchange. Limnol. Oceanogr. 2021, 66, 1563–1577. [Google Scholar] [CrossRef]
- Borges, A.V. Atmospheric CO2flux from Mangrove Surrounding Waters. Geophys. Res. Lett. 2003, 30. [Google Scholar] [CrossRef]
- Maher, D.T.; Santos, I.R.; Golsby-Smith, L.; Gleeson, J.; Eyre, B.D. Groundwater-Derived Dissolved Inorganic and Organic Carbon Exports from a Mangrove Tidal Creek: The Missing Mangrove Carbon Sink? Limnol. Oceanogr. 2013, 58, 475–488. [Google Scholar] [CrossRef]
- Call, M.; Maher, D.T.; Santos, I.R.; Ruiz-Halpern, S.; Mangion, P.; Sanders, C.J.; Erler, D.V.; Oakes, J.M.; Rosentreter, J.; Murray, R.; et al. Spatial and Temporal Variability of Carbon Dioxide and Methane Fluxes over Semi-Diurnal and Spring–Neap–Spring Timescales in a Mangrove Creek. Geochim. Cosmochim. Acta 2015, 150, 211–225. [Google Scholar] [CrossRef]
- Call, M.; Santos, I.R.; Dittmar, T.; de Rezende, C.E.; Asp, N.E.; Maher, D.T. High Pore-Water Derived CO2 and CH4 Emissions from a Macro-Tidal Mangrove Creek in the Amazon Region. Geochim. Cosmochim. Acta 2019, 247, 106–120. [Google Scholar] [CrossRef]
- Maher, D.T.; Call, M.; Santos, I.R.; Sanders, C.J. Beyond Burial: Lateral Exchange Is a Significant Atmospheric Carbon Sink in Mangrove Forests. Biol. Lett. 2018, 14. [Google Scholar] [CrossRef] [PubMed]
- Santos, I.R.; Burdige, D.J.; Jennerjahn, T.C.; Bouillon, S.; Cabral, A.; Serrano, O.; Wernberg, T.; Filbee-Dexter, K.; Guimond, J.A.; Tamborski, J.J. The Renaissance of Odum’s Outwelling Hypothesis in “Blue Carbon” Science. Estuar. Coast. Shelf Sci. 2021, 255, 107361. [Google Scholar] [CrossRef]
- Woodroffe, C. Mangrove Sediments and Geomorphology. Trop. Mangrove Ecosyst. 1992, 41, 7–41. [Google Scholar]
- Twilley, R.R.; Rivera-Monroy, V.H. Ecogeomorphic Models of Nutrient Biogeochemistry for Mangrove Wetlands. Coast. Wetl. Integr. Ecosyst. Approach 2009, 1, 641–684. [Google Scholar]
- Woodroffe, C.D.; Rogers, K.; McKee, K.L.; Lovelock, C.E.; Mendelssohn, I.A.; Saintilan, N. Mangrove Sedimentation and Response to Relative Sea-Level Rise. Ann. Rev. Mar. Sci. 2016, 8, 243–266. [Google Scholar] [CrossRef] [PubMed]
- Worthington, T.A.; Zu Ermgassen, P.S.E.; Friess, D.A.; Krauss, K.W.; Lovelock, C.E.; Thorley, J.; Tingey, R.; Woodroffe, C.D.; Bunting, P.; Cormier, N.; et al. A Global Biophysical Typology of Mangroves and Its Relevance for Ecosystem Structure and Deforestation. Sci. Rep. 2020, 10, 14652. [Google Scholar] [CrossRef] [PubMed]
- Ewel, K.; Twilley, R.; Ong, J. Different Kinds of Mangrove Forests Provide Different Goods and Services. Global Ecol. Biogeogr. Lett. 1998, 7, 83–94. [Google Scholar] [CrossRef]
- Ray, R.; Miyajima, T.; Watanabe, A.; Yoshikai, M.; Ferrera, C.M.; Orizar, I.; Nakamura, T.; San Diego-McGlone, M.L.; Herrera, E.C.; Nadaoka, K. Dissolved and Particulate Carbon Export from a Tropical Mangrove-dominated Riverine System. Limnol. Oceanogr. 2021, 66, 3944–3962. [Google Scholar] [CrossRef]
- Chen, X.; Zhang, F.; Lao, Y.; Wang, X.; Du, J.; Santos, I.R. Submarine Groundwater Discharge-Derived Carbon Fluxes in Mangroves: An Important Component of Blue Carbon Budgets? J. Geophys. Res. C Oceans 2018, 123, 6962–6979. [Google Scholar] [CrossRef]
- Sippo, J.Z.; Maher, D.T.; Tait, D.R.; Holloway, C.; Santos, I.R. Are Mangroves Drivers or Buffers of Coastal Acidification? Insights from Alkalinity and Dissolved Inorganic Carbon Export Estimates across a Latitudinal Transect. Global Biogeochem. Cycles 2016, 30, 753–766. [Google Scholar] [CrossRef]
- Taillardat, P.; Willemsen, P.; Marchand, C.; Friess, D.A.; Widory, D.; Baudron, P.; Truong, V.V.; Nguyễn, T.-N.; Ziegler, A.D. Assessing the Contribution of Porewater Discharge in Carbon Export and CO2 Evasion in a Mangrove Tidal Creek (Can Gio, Vietnam). J. Hydrol. 2018, 563, 303–318. [Google Scholar] [CrossRef]
- Sippo, J.Z.; Maher, D.T.; Schulz, K.G.; Sanders, C.J.; McMahon, A.; Tucker, J.; Santos, I.R. Carbon Outwelling across the Shelf Following a Massive Mangrove Dieback in Australia: Insights from Radium Isotopes. Geochim. Cosmochim. Acta 2019, 253, 142–158. [Google Scholar] [CrossRef]
- Sanders, C.J.; Smoak, J.M.; Naidu, A.S.; Sanders, L.M.; Patchineelam, S.R. Organic Carbon Burial in a Mangrove Forest, Margin and Intertidal Mud Flat. Estuar. Coast. Shelf Sci. 2010, 90, 168–172. [Google Scholar] [CrossRef]
- Otani, S.; Endo, T. CO2 Flux in Tidal Flats and Salt Marshes. In Blue Carbon in Shallow Coastal Ecosystems: Carbon Dynamics, Policy, and Implementation; Kuwae, T., Hori, M., Eds.; Springer Singapore: Singapore, 2019. [Google Scholar] [CrossRef]
- Tokoro, T.; Kuwae, T. Air-Water CO2 and Water-Sediment O2 Exchanges over a Tidal Flat in Tokyo Bay. Front. Mar. Sci. 2022, 9. [Google Scholar] [CrossRef]
- Polsenaere, P.; Lamaud, E.; Lafon, V.; Bonnefond, J.-M.; Bretel, P.; Delille, B.; Deborde, J.; Loustau, D.; Abril, G. Spatial and Temporal CO 2 Exchanges Measured by Eddy Covariance over a Temperate Intertidal Flat and Their Relationships to Net Ecosystem Production. Biogeosciences 2012, 9, 249–268. [Google Scholar] [CrossRef]
- Zemmelink, H.J.; Slagter, H.A.; van Slooten, C.; Snoek, J.; Heusinkveld, B.; Elbers, J.; Bink, N.J.; Klaassen, W.; Philippart, C.J.M.; de Baar, H.J.W. Primary Production and Eddy Correlation Measurements of CO2exchange over an Intertidal Estuary. Geophys. Res. Lett. 2009, 36. [Google Scholar] [CrossRef]
- Reckhardt, A.; Beck, M.; Seidel, M.; Riedel, T.; Wehrmann, A.; Bartholomä, A.; Schnetger, B.; Dittmar, T.; Brumsack, H.-J. Carbon, Nutrient and Trace Metal Cycling in Sandy Sediments: A Comparison of High-Energy Beaches and Backbarrier Tidal Flats. Estuar. Coast. Shelf Sci. 2015, 159, 1–14. [Google Scholar] [CrossRef]
- Brasse, S.; Reimer, A.; Seifert, R.; Michaelis, W. The Influence of Intertidal Mudflats on the Dissolved Inorganic Carbon and Total Alkalinity Distribution in the German Bight, Southeastern North Sea. J. Sea Res. 1999, 42, 93–103. [Google Scholar] [CrossRef]
- Kida, M.; Tanabe, M.; Tomotsune, M.; Yoshitake, S.; Kinjo, K.; Ohtsuka, T.; Fujitake, N. Changes in Dissolved Organic Matter Composition and Dynamics in a Subtropical Mangrove River Driven by Rainfall. Estuar. Coast. Shelf Sci. 2019, 223, 6–17. [Google Scholar] [CrossRef]
- Terada, K. Rainfall Induced Water and Nutrient Fluxes at a Mangrove Estuary. Mar. Environ. Res. 2022, 179, 105674. [Google Scholar] [CrossRef]
- Spalding, M. World Atlas of Mangroves. Routledge, 2010. [Google Scholar]
- Ohtsuka, T.; Tomotsune, M.; Suchewaboripont, V.; Iimura, Y.; Kida, M.; Yoshitake, S.; Kondo, M.; Kinjo, K. Stand Dynamics and Aboveground Net Primary Productivity of a Mature Subtropical Mangrove Forest on Ishigaki Island, South-Western Japan. Reg. Stud. Mar. Sci. 2019, 27, 100516. [Google Scholar] [CrossRef]
- Fujimoto, K.; Hasada, K.; Taniguchi, S.; Furukawa, K.; Ono, K.; Watanabe, S. Progressing influences of sea-level rise to mangrove forests on Iriomote Island, southwestern Japan. Annual Meeting of the Association of Japanese Geographers, Autumn 2018. [CrossRef]
- Endo, T.; Tanaka, T.; Otani, S.; Fujita, T.; Yamoch, S. Validity Verification of Measurement Method of Carbon Dioxide Concentration in Water using Water-resistant Breathable Tube. J. Jpn. Soc. Civ. Eng. Ser. B2 (Coast. Eng.) 2013, 69, I_1251-I_1255. [CrossRef]
- Dickson, A.G.; Sabine, C.L.; Christian, J.R. Guide to Best Practices for Ocean CO2 Measurements. North Pacific Marine Science Organization, 2007. [Google Scholar]
- Weiss, R.F. Carbon Dioxide in Water and Seawater: The Solubility of a Non-Ideal Gas. Mar. Chem. 1974, 2, 203–215. [Google Scholar] [CrossRef]
- Friis, K.; Körtzinger, A.; Wallace, D.W.R. The Salinity Normalization of Marine Inorganic Carbon Chemistry Data. Geophys. Res. Lett. 2003, 30. [Google Scholar] [CrossRef]
- Akhand, A.; Chanda, A.; Watanabe, K.; Das, S.; Tokoro, T.; Chakraborty, K.; Hazra, S.; Kuwae, T. Low CO2 Evasion Rate from the Mangrove-Surrounding Waters of the Sundarbans. Biogeochemistry 2021, 153, 95–114. [Google Scholar] [CrossRef]
- Akhand, A.; Watanabe, K.; Chanda, A.; Tokoro, T.; Chakraborty, K.; Moki, H.; Tanaya, T.; Ghosh, J.; Kuwae, T. Lateral Carbon Fluxes and CO2 Evasion from a Subtropical Mangrove-Seagrass-Coral Continuum. Sci. Total Environ. 2021, 752, 142190. [Google Scholar] [CrossRef]
- Kida, M.; Kondo, M.; Tomotsune, M.; Kinjo, K.; Ohtsuka, T.; Fujitake, N. Molecular Composition and Decomposition Stages of Organic Matter in a Mangrove Mineral Soil with Time. Estuar. Coast. Shelf Sci. 2019, 231, 106478. [Google Scholar] [CrossRef]
- Chen, C.T.A.; Liu, C.T.; Pai, S.C. Variations in Oxygen, Nutrient and Carbonate Fluxes of the Kuroshio Current. Lamer 1995, 33, 161–176. [Google Scholar]
- Chou, W.-C.; Sheu, D.D.; Chen, C.T.A.; Wen, L.-S.; Yang, Y.; Wei, C.-L. Transport of the South China Sea Subsurface Water Outflow and Its Influence on Carbon Chemistry of Kuroshio Waters off Southeastern Taiwan. J. Geophys. Res. 2007, 112, C12. [Google Scholar] [CrossRef]
- Keppler, L.; Landschützer, P.; Gruber, N.; Lauvset, S.K.; Stemmler, I. Seasonal Carbon Dynamics in the Near-global Ocean. Global Biogeochem. Cycles 2020, 34. [Google Scholar] [CrossRef]
- Gregor, L.; Gruber, N. OceanSODA-ETHZ: A Global Gridded Data Set of the Surface Ocean Carbonate System for Seasonal to Decadal Studies of Ocean Acidification. Earth Syst. Sci. Data 2021, 13, 777–808. [Google Scholar] [CrossRef]
- Humphreys, M.P.; Lewis, E.R.; Sharp, J.D.; Pierrot, D. PyCO2SYS v1. 8: Marine Carbonate System Calculations in Python. Geosci. Model Dev. 2022, 15, 15–43. [Google Scholar] [CrossRef]
- Ono, K.; Fujimoto, K.; Hirata, Y.; Tabuchi, R.; Taniguchi, S.; Furukawa, K.; Watanabe, S.; Suwa, R.; Lihpai, S. Estimation of Total Fine Root Production Using Continuous Inflow Methods in Tropical Mangrove Forest on Pohnpei Island, Micronesia: Fine Root Necromass Accumulation Is a Substantial Contributor to Blue Carbon Stocks. Ecol. Res. 2022, 37, 33–52. [Google Scholar] [CrossRef]
- Ohtsuka, T.; Onishi, T.; Yoshitake, S.; Tomotsune, M.; Kida, M.; Iimura, Y.; Kondo, M.; Suchewaboripont, V.; Cao, R.; Kinjo, K.; et al. Lateral Export of Dissolved Inorganic and Organic Carbon from a Small Mangrove Estuary with Tidal Fluctuation. For. Trees Livelihoods 2020, 11, 1041. [Google Scholar] [CrossRef]
- Krumins, V.; Gehlen, M.; Arndt, S.; van Cappellen, P.; Regnier, P. Dissolved Inorganic Carbon and Alkalinity Fluxes from Coastal Marine Sediments: Model Estimates for Different Shelf Environments and Sensitivity to Global Change. Biogeosci. Discuss. 2012, 9, 8475–8539. [Google Scholar] [CrossRef]
- Alongi, D.M.; Pfitzner, J.; Trott, L.A.; Tirendi, F.; Dixon, P.; Klumpp, D.W. Rapid Sediment Accumulation and Microbial Mineralization in Forests of the Mangrove Kandelia Candel in the Jiulongjiang Estuary, China. Estuar. Coast. Shelf Sci. 2005, 63, 605–618. [Google Scholar] [CrossRef]
- Kristensen, E. Carbon Balance in Mangrove Sediments: The Driving Processes and Their Controls. Greenh. Gas Carbon Balances Mangrove Coast. Ecosyst. Gendai Tosho 2007, 61–78. [Google Scholar]
- Ho, D.T.; Ferrón, S.; Engel, V.C.; Anderson, W.T.; Swart, P.K.; Price, R.M.; Barbero, L. Dissolved Carbon Biogeochemistry and Export in Mangrove-Dominated Rivers of the Florida Everglades. Biogeosciences 2017, 14, 2543–2559. [Google Scholar] [CrossRef]
- Volta, C.; Ho, D.T.; Maher, D.T.; Wanninkhof, R.; Friederich, G.; Del Castillo, C.; Dulai, H. Seasonal Variations in Dissolved Carbon Inventory and Fluxes in a Mangrove-dominated Estuary. Global Biogeochem. Cycles 2020, 34. [Google Scholar] [CrossRef]
- Saderne, V.; Fusi, M.; Thomson, T.; Dunne, A.; Mahmud, F.; Roth, F.; Carvalho, S.; Duarte, C.M. Total Alkalinity Production in a Mangrove Ecosystem Reveals an Overlooked Blue Carbon Component. Limnol. Oceanogr. Lett. 2021, 6, 61–67. [Google Scholar] [CrossRef]
Disclaimer/Publisher’s Note: The statements, opinions and data contained in all publications are solely those of the individual author(s) and contributor(s) and not of MDPI and/or the editor(s). MDPI and/or the editor(s) disclaim responsibility for any injury to people or property resulting from any ideas, methods, instructions or products referred to in the content. |
© 2023 by the authors. Licensee MDPI, Basel, Switzerland. This article is an open access article distributed under the terms and conditions of the Creative Commons Attribution (CC BY) license (http://creativecommons.org/licenses/by/4.0/).


