Submitted:
13 June 2023
Posted:
14 June 2023
You are already at the latest version
Abstract
Keywords:
1. Introduction
2. Materials and Methods
2.1. Computational Details
3. Results and Discussion
3.1. Structure of the Compound
3.2. Electronic and Spectral Properties
3.3. Molecular Orbitals Surfaces (HOMO LUMO) Analysis and UV-Vis Spectra
3.4. FT-IR Vibrational Analysis
3.5. NMR Analysis
4. Conclusions
Supplementary Materials
Data Availability
Acknowledgments
Conflicts of Interest
References
- Pansuriya P.B.; Maguire G.E.M..; Friedrich H.B. Structural Characterization and Thermal Properties of the Anti-malarial Drug: Lumefantrine. S.Afr. J. Chem 2019, 72: 253-262. https://doi.org/10.17159/0379-4350/2019/v72a33. [CrossRef]
- World Health Organization (WHO). World Malaria Report. 2020.
- Gaur D.; Chitnis C.; Chauhan V. Advances in Malaria Research. The Wiley-IUBMB Series on Biochemistry and Molecular Biology. Wiley-Blackwell, 1st edition. 2016. https://doi.org/10.1002/9781118493816. [CrossRef]
- Shah S. The Fever, How Malaria has ruled humankind for 500,000 years-Penguin Books, 2018. https://doi.org/10.1590/1413-81232020256.20542019. [CrossRef]
- Hehre W. J. SPARTAN’14 Wavefunction Inc. Irvine CA, USA 2014.
- Hehre W. J. SPARTAN’14: Tutorial and User’s Guide. Irvine CA USA, Wavefunction, Inc. 2014.
- Kunduracioglu A. A Novel Pyrazolium Salt with Phthalimide Functional Groups Synthesis Spectroscopic (NMR&FT-IR) and Computational Analysis, Fresenius Environmental Bulletin., 2021 30(068): pages 7551-7560.
- Kunduracioglu A. 2-thienylboronic Acid: A DFT Study For the Spectral, Structural and Molecular Orbital Analysis. El-Cezerî Journal of Science and Engineering., 2021 8(1): 397-409. https://doi.org/10.31202/ecjse.825888. [CrossRef]
- Dhandapani A.; Manivarman S.; Subashchandrabose S.; Saleem H. Molecular structure and vibrational analysis on (E)‒1‒(3‒methyl‒2,6‒diphenyl piperidine‒4‒ylidene) semicarbazide. J. Mol. Struct., 2014 1058: 41‒50 DOI: https://doi.org/10.1016/j.molstruc.2013.09.052. [CrossRef]
- Karakaş‒Sarıkaya E.; Dereli Ö. Study on Molecular Structure and Vibrational Spectra of 5,7‒Dimethoxycoumarin Using DFT: A Combined Experimental and Quantum Chemical Approach. Opt. Spectrosc., 2014 117(2): 240‒249. https://doi.org/10.1134/s0030400x14070108. [CrossRef]
- Dereli Ö.; Erdoğdu Y.; Güllüoğlu M.T., Study on molecular structure and vibrational spectra of (triphenylphosphoranylidene) acetaldehyde using DFT: A combined experimental and quantum chemical approach. J. Mol. Struct., 2012 1012: 105‒112. https://doi.org/10.1016/j.molstruc.2011.12.040. [CrossRef]
- Sarıkaya E.K.; Dereli Ö.; Erdoğdu Y.; Güllüoğlu M. T. Molecular structure and vibrational spectra of 7‒Ethoxycoumarin by density functional method. J. Mol. Struct. 2013, 1049: 220‒226. https://doi.org/10.1016/j.molstruc.2013.06.026. [CrossRef]
- Becke A.D. Density-functional thermochemistry. III.The role of exact exchange, J. Chem. Phys., 1993 98: 5648-5652. https://doi.org/10.1063/1.464913. [CrossRef]
- Lee C.; Yang W.; Parr R.G., Development of the Colle-Salvetti correlation-energy formula into a functional of the electron density, Phys. Rev. B Condens. Matter., 1998 37: 785-799. https://doi.org/10.1103/physrevb.37.785. [CrossRef]
- Kemer-Kotan G.; Yuksek H. Experimental (FT-IR, NMR) and Theoretical (B3PW91, B3LYP, HF) Analyses of 2-(3-Ethyl-4,5-Dihydro-1H-1,2,4-Triazole-5-on-4-yl)-azomethine)-Benzoic Acid, Caucasian Journal of Science, 2019 6 (1): 64-75.
- Turhan-Irak Z.; Beytur M. 4-Benzilidenamino-4,5-dihidro-1H-1,2,4-triazol-5-on Türevlerinin Antioksidan Aktivitelerinin Teorik Olarak İncelenmesi [Theoretical Study on The Investigation of Antioxidant Properties of Some 4-Benzylidenamino-4,5-dihydro-1H-1,2,4-triazol-5-one Derivatives] Iğdır Üniversitesi Fen Bilimleri Enstitüsü Dergisi, 2019 9(1): 512-521.
- Jensen F. Introduction to Computational Chemistry. 2016 Chichester: Wiley.
- Peter K., Vollhardt C., Schore N. E., Organic chemistry: Structure and function. 6th ed. 2011 Freeman&Comp. NY-US... https://doi.org/10.1007/978-1-319-19197-9. [CrossRef]
- Şahin Z.S.; Kaya-Kantar G.; Şaşmaz S.; Büyükgüngör O. Synthesis, molecular structure, spectroscopic analysis, thermodynamic parameters and molecular modeling studies of (2-methoxyphenyl)oxalate, J. Mol. Struct., 2015 1087:104-112. https://doi.org/10.1016/j.molstruc.2015.01.039. [CrossRef]
- Pearson R.G. Chemical hardness and density functional theory, Chem. Sci. J., 2005 117(5): 369-377. https://doi.org/10.1007/bf02708340. [CrossRef]
- Silverstein R.M.; Webster F.X.; Kiemle D.J. Spectrometric Identification of Organic Compounds. 7th Ed. 2005 John Wiley Sons INC.. https://doi.org/10.1002/ange.19650771675. [CrossRef]
- Ramachandran K.I.; Deepa G.; Namboori K. Computational Chemistry and Molecular Modeling: Principles and Applications. 2008 Springer-Verlag Heidelberg. Berlin:.. https://doi.org/10.1007/978-3-540-77304-7. [CrossRef]
- Lu G.P.; Voigtritter K.R.; Cai C.; Lipshutz B.H., Ligand effects on the stereochemical outcome of Suzuki-Miyaura couplings. J. Org. Chem., 2012 77(8): 3700-3703.. https://doi.org/10.1021/jo300437t. [CrossRef]
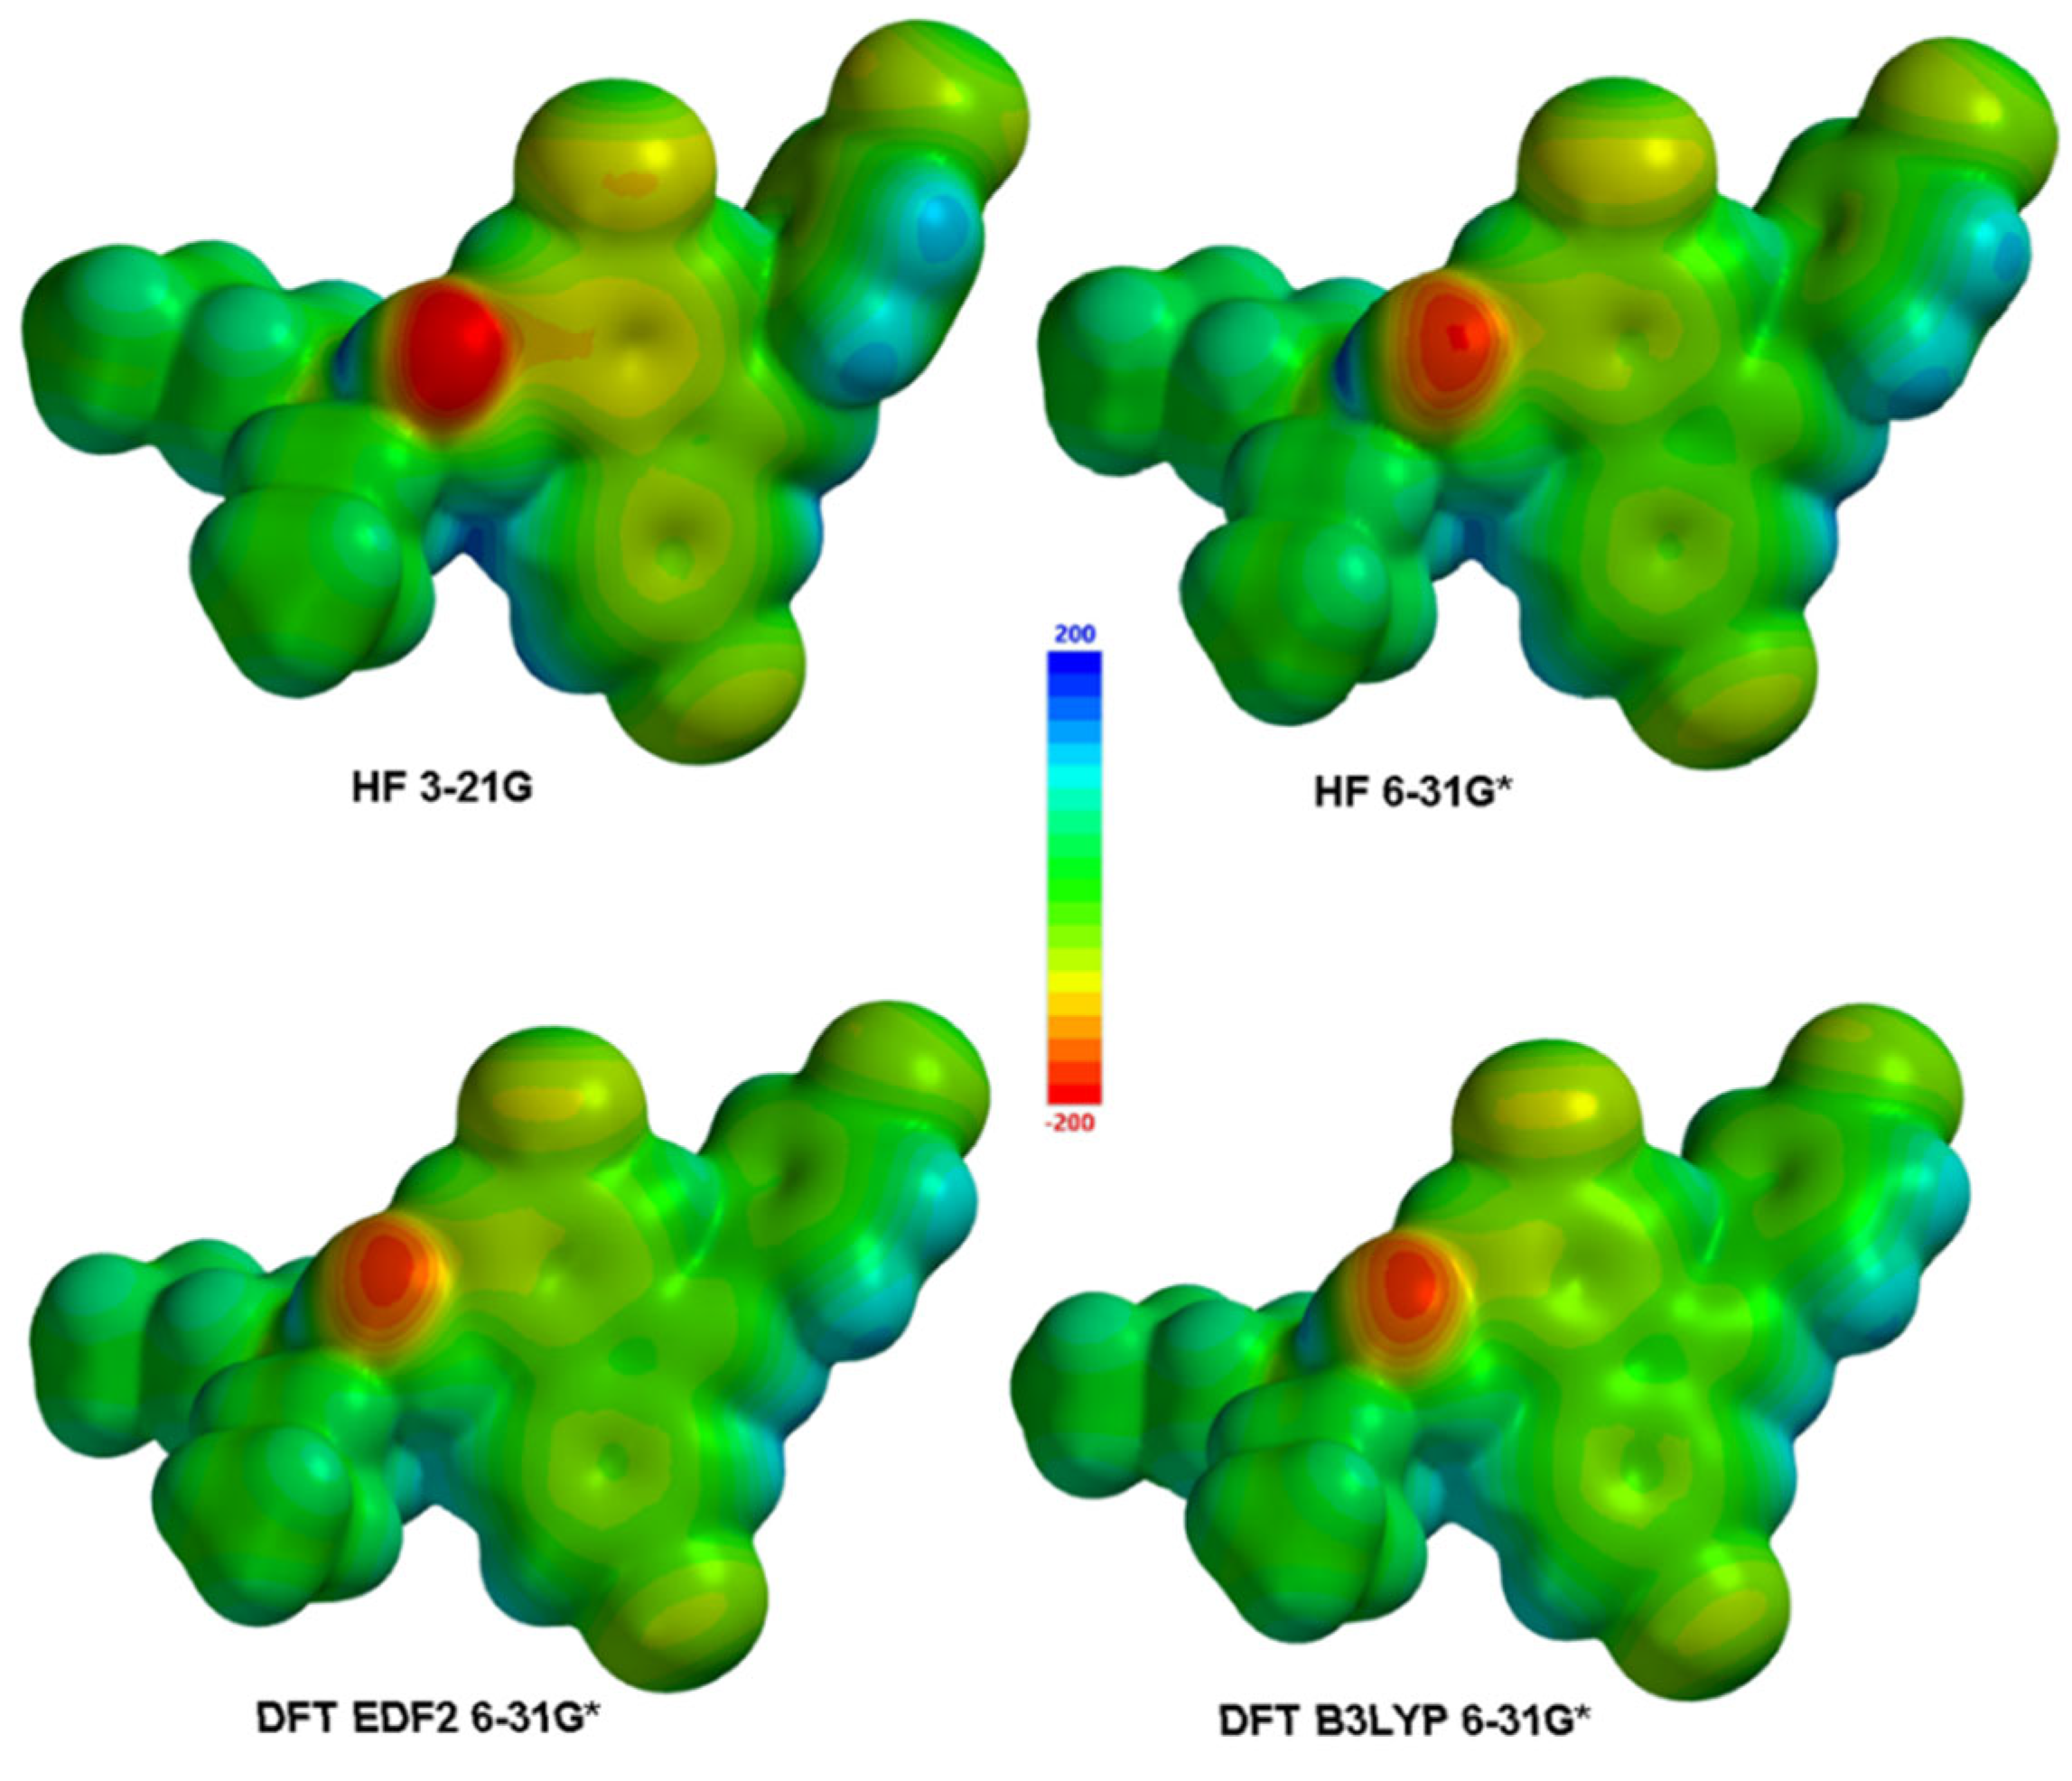
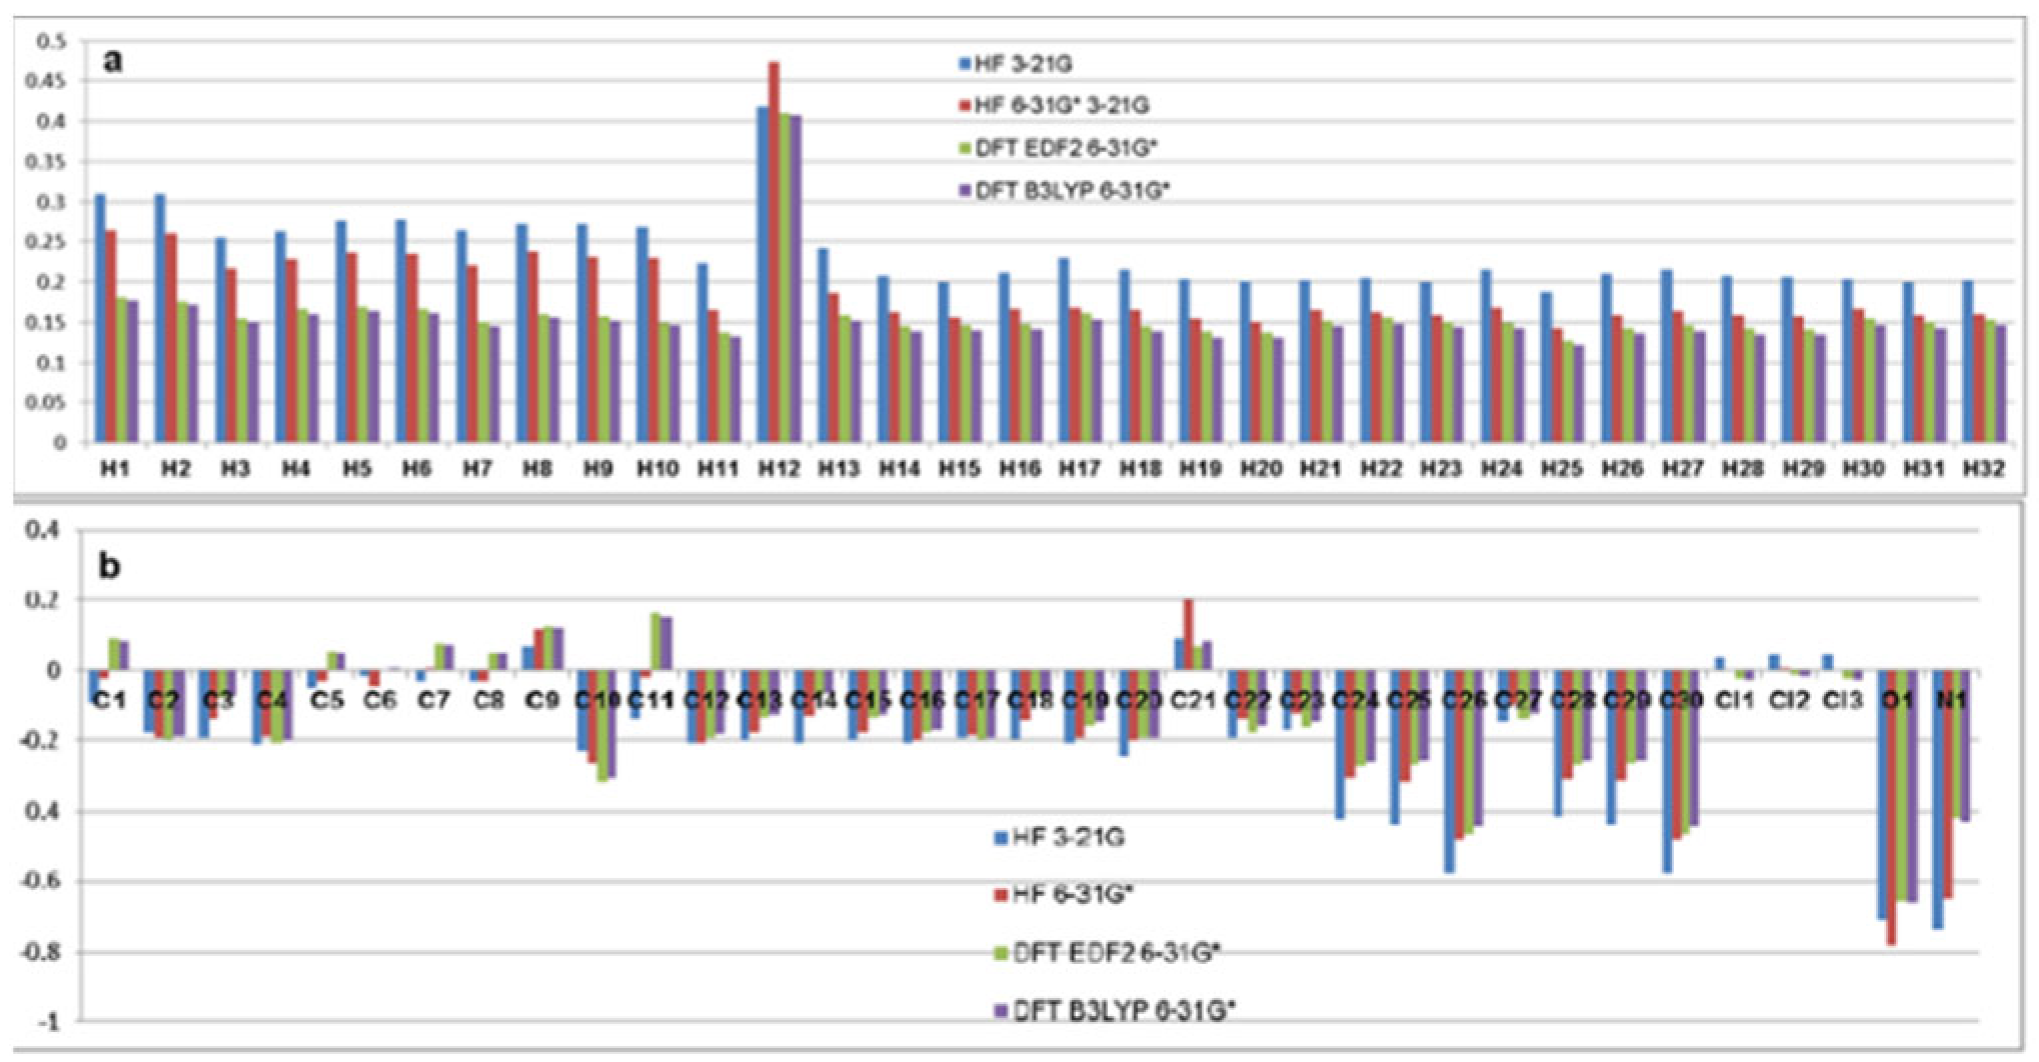
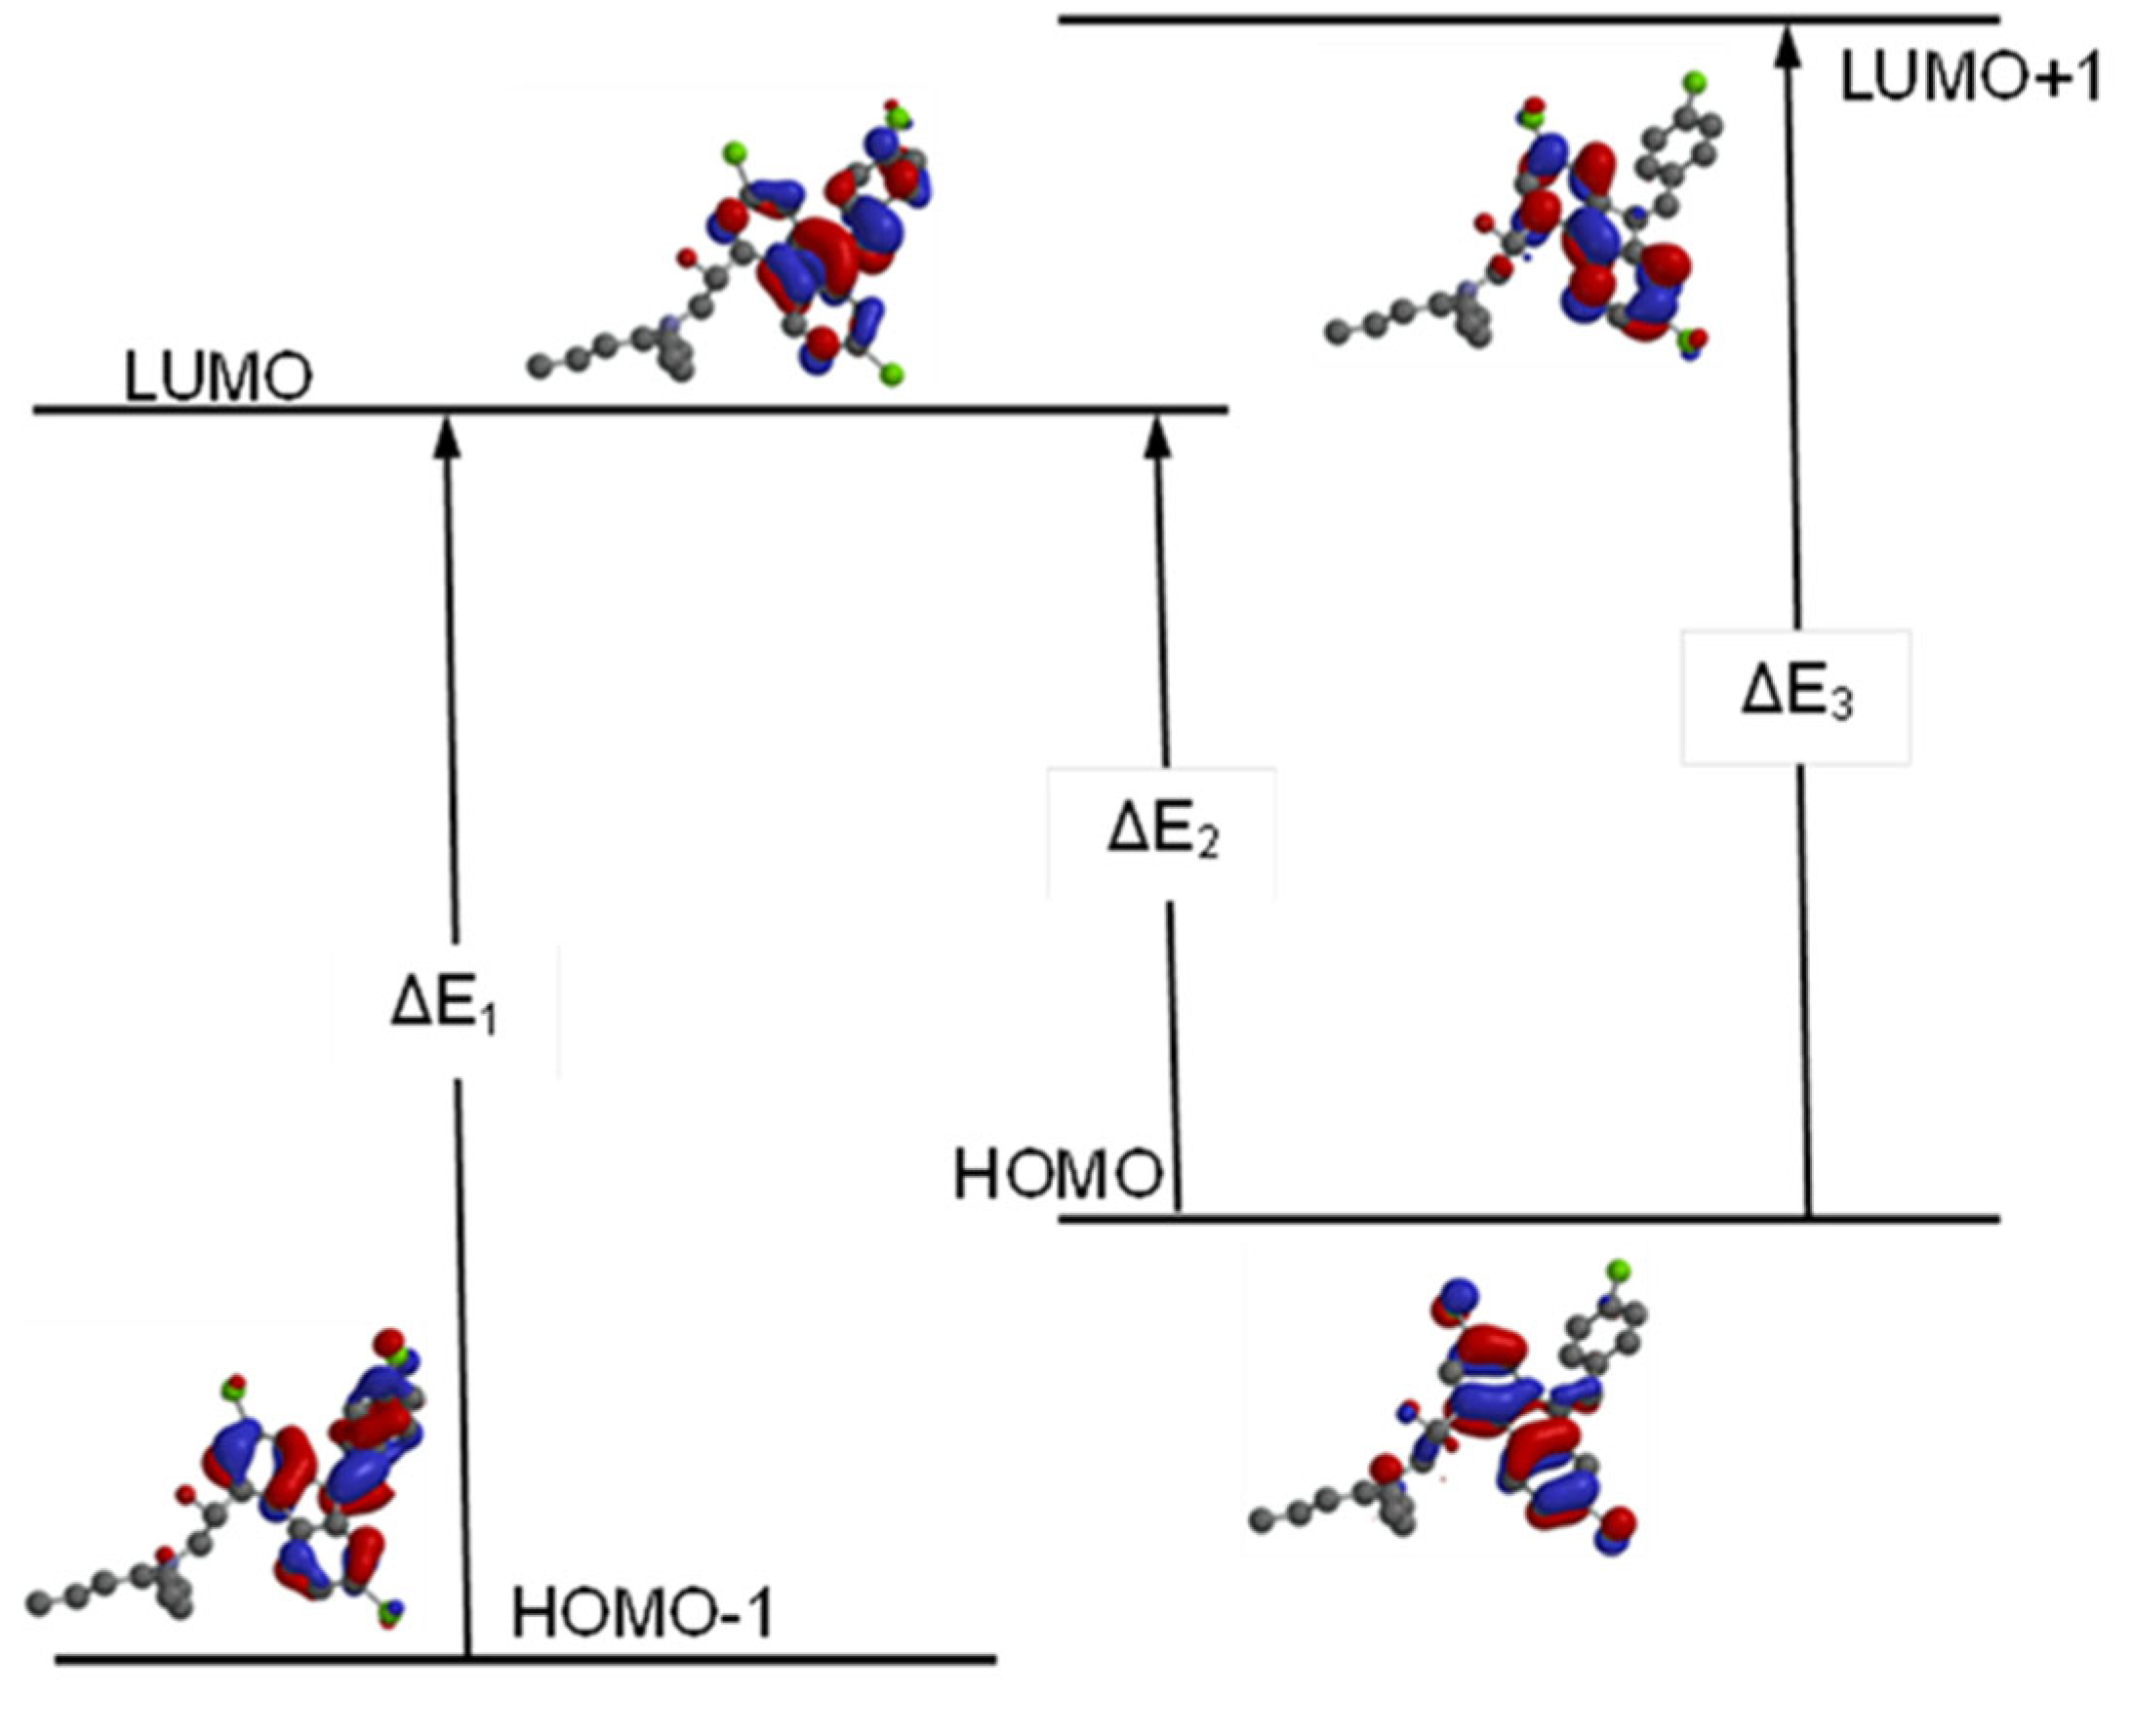
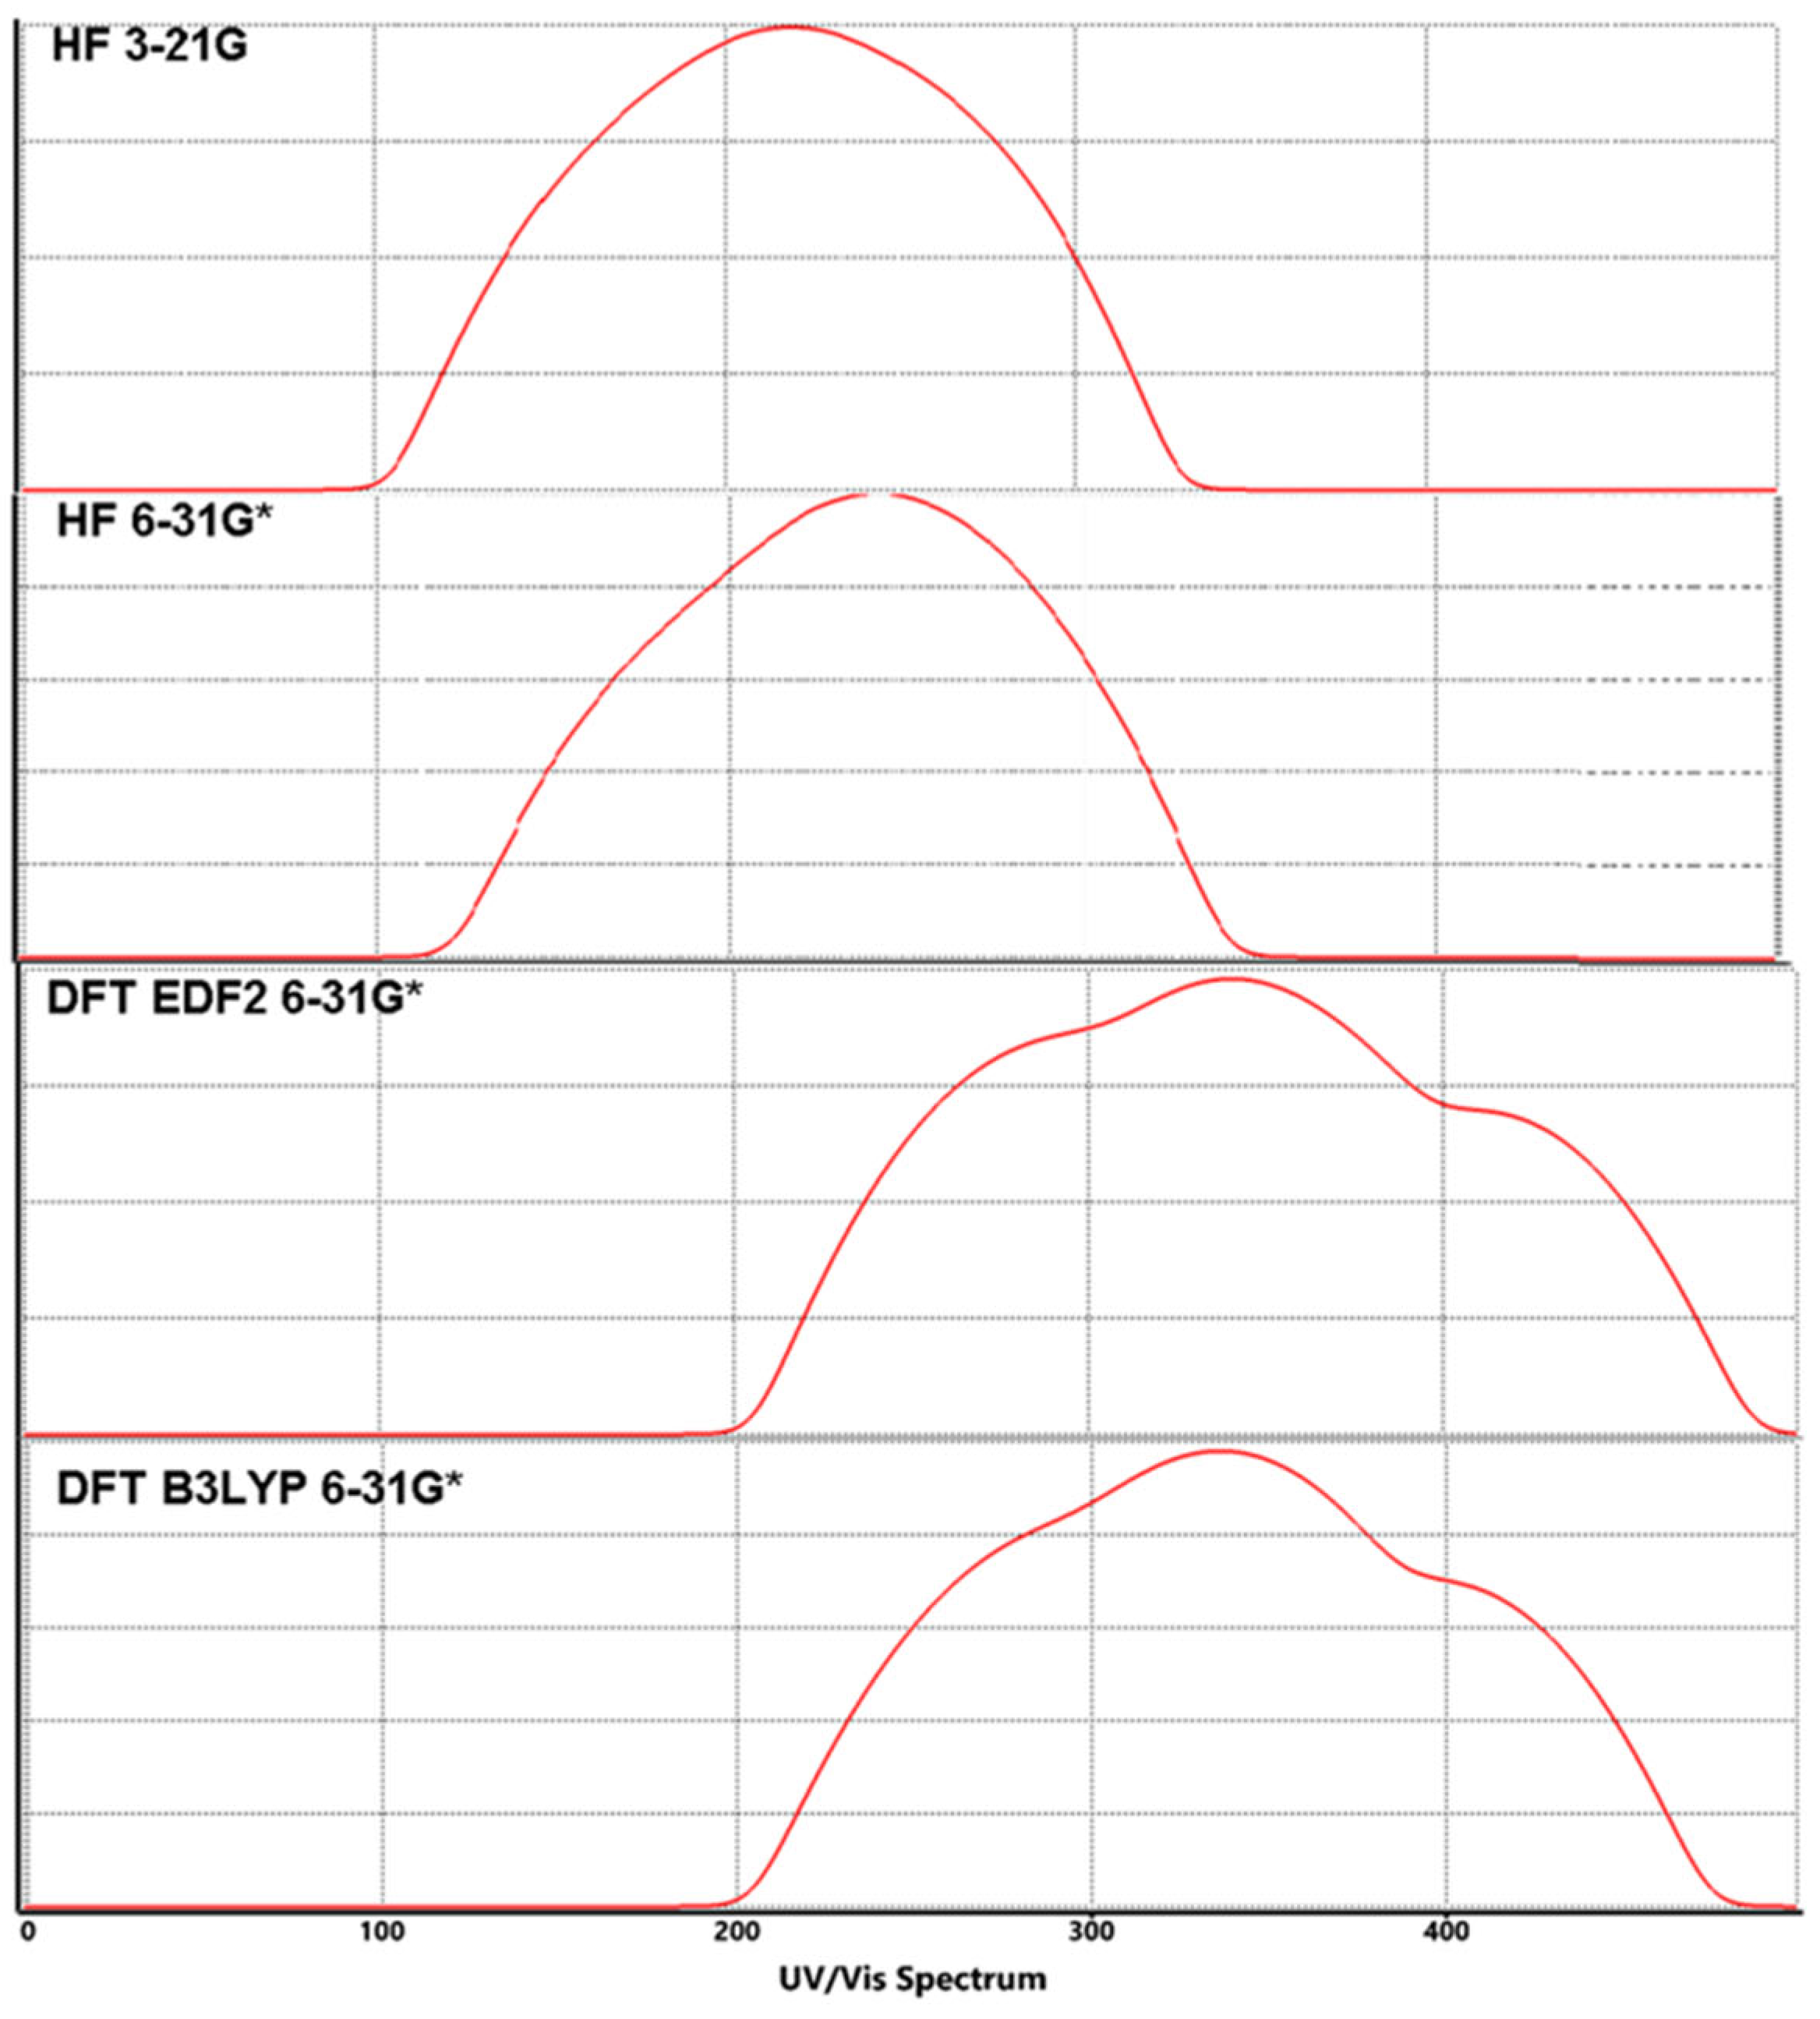
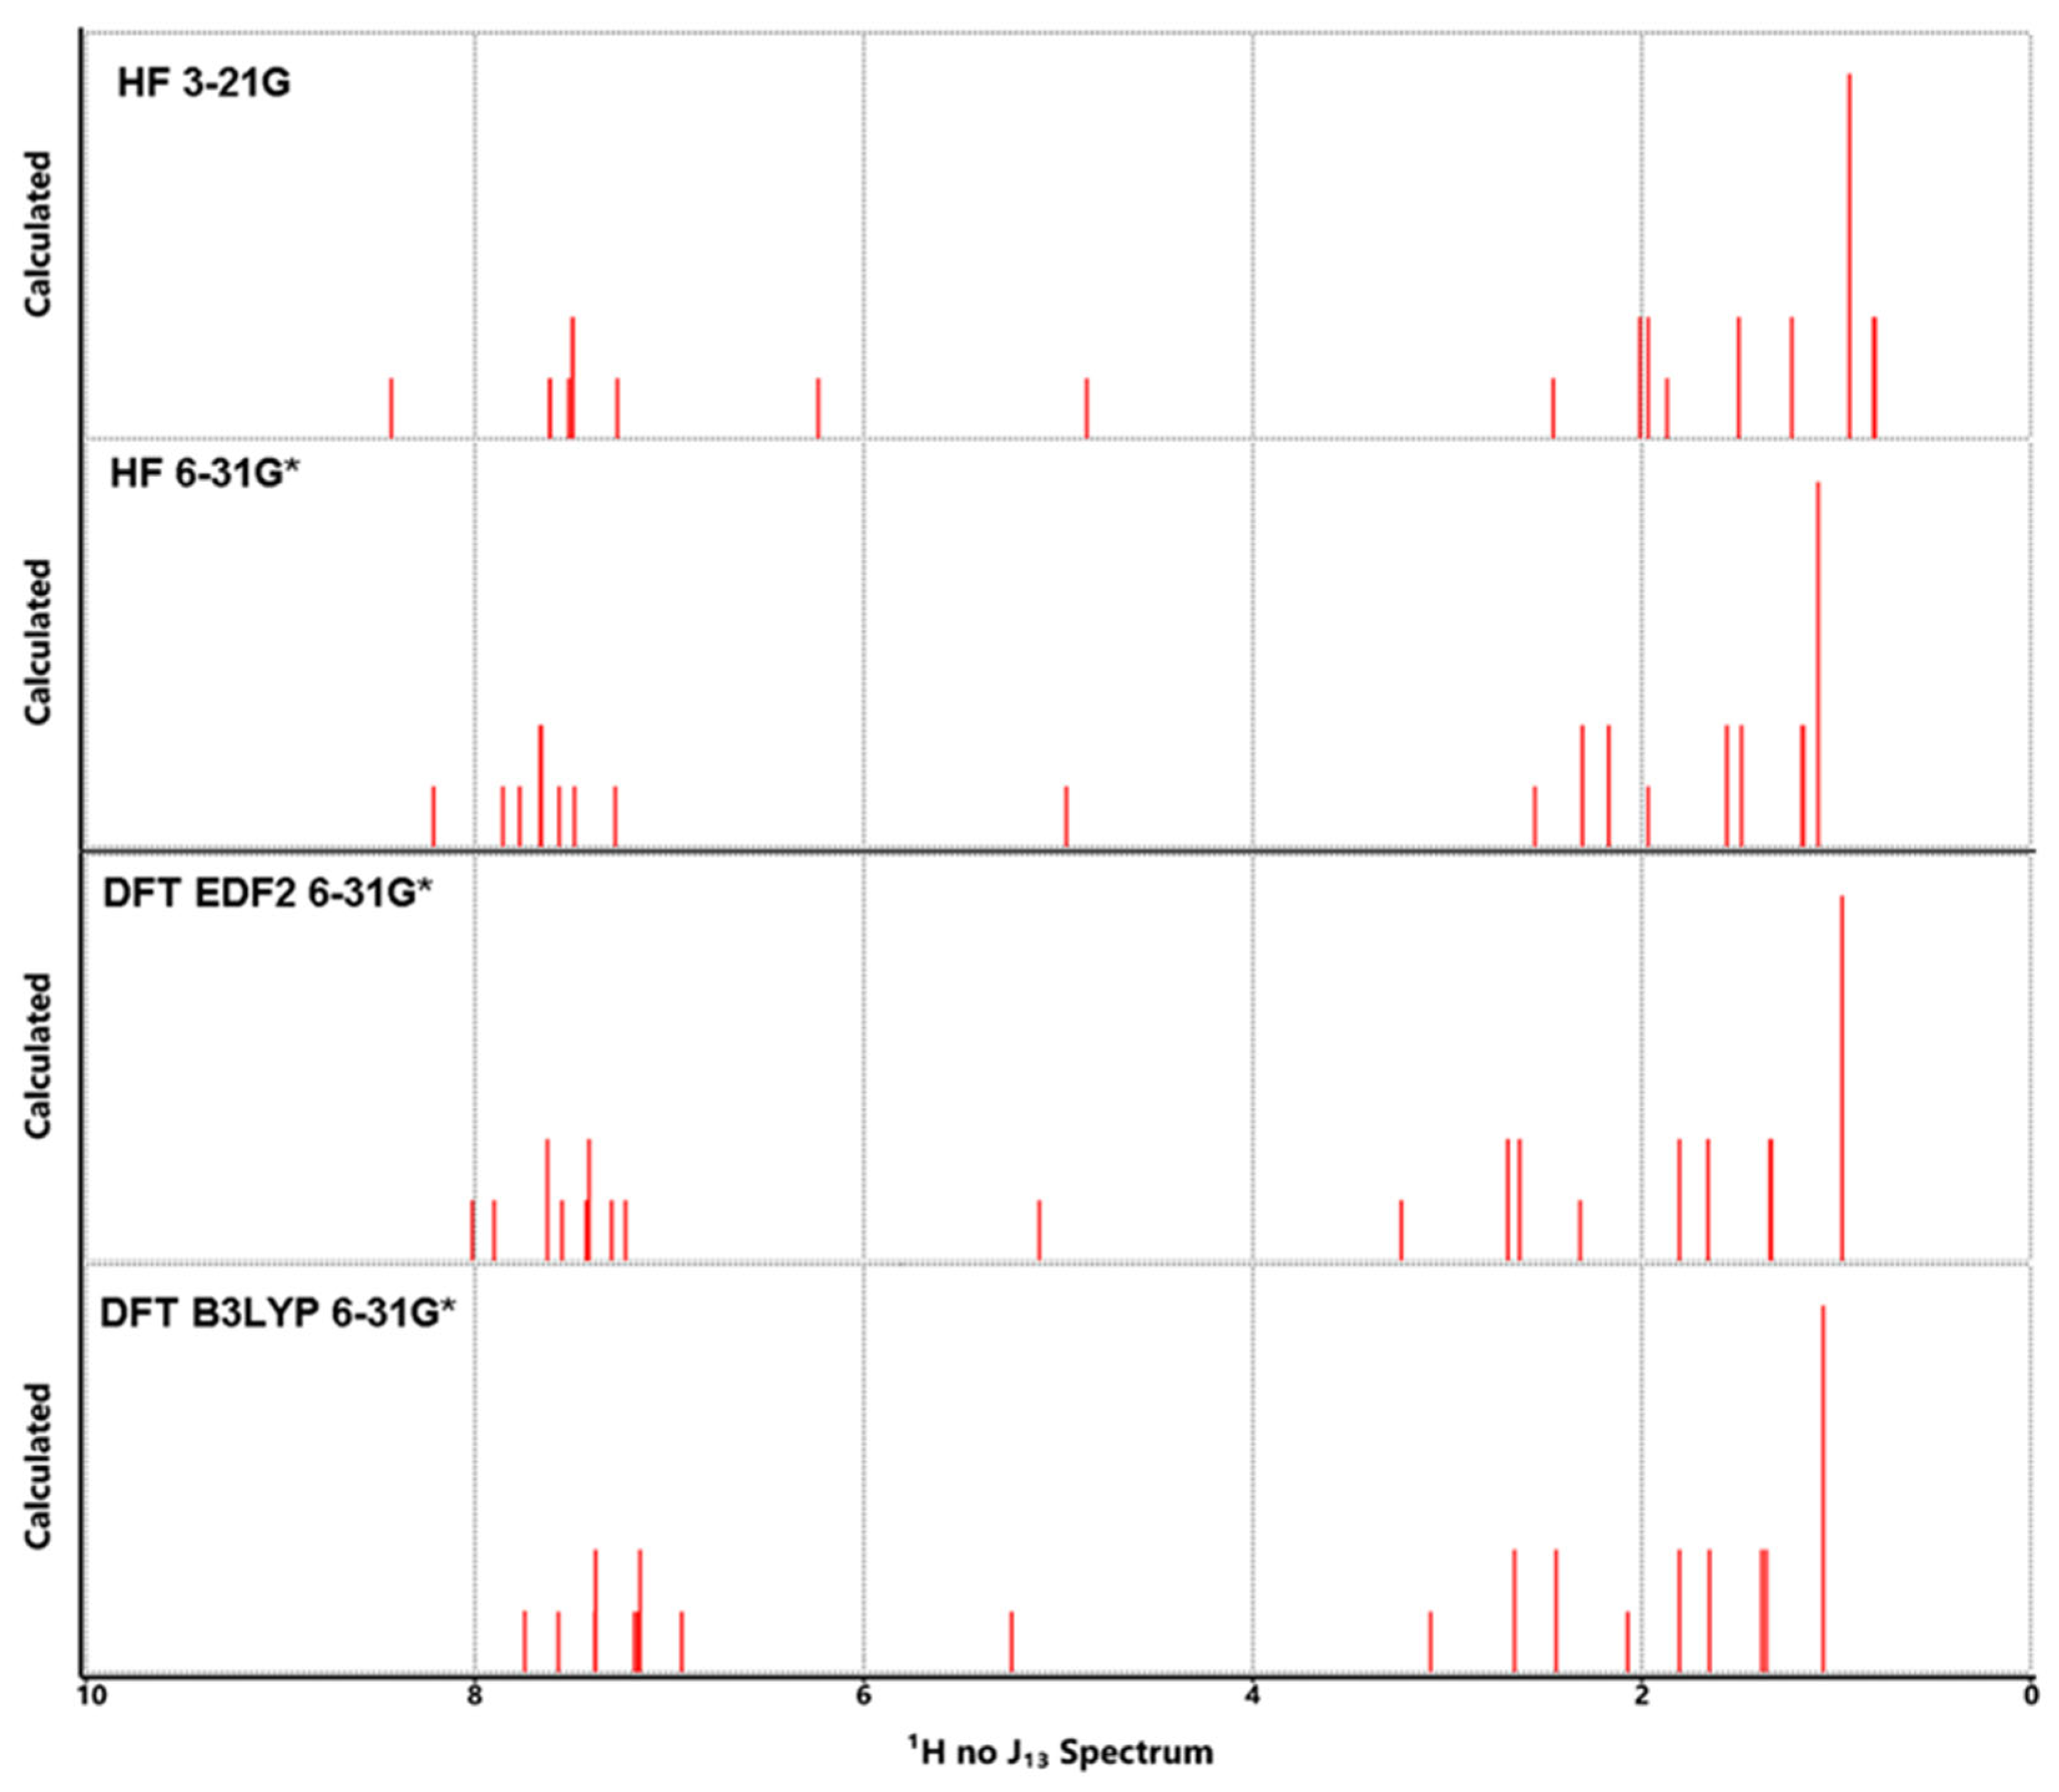
| Atom | HF | DFT EDF2 | DFT B3LYP | Atom | HF | DFT EDF2 | DFT B3LYP | ||
|---|---|---|---|---|---|---|---|---|---|
| 3-21G | 6-31G* | 6-31G* | 6-31G* | 3-21G | 6-31G* | 6-31G* | 6-31G* | ||
| C1 | -0.087 | -0.019 | 0.093 | 0.083 | H1 | 0.310 | 0.265 | 0.181 | 0.177 |
| C2 | -0.178 | -0.195 | -0.199 | -0.190 | H2 | 0.310 | 0.261 | 0.176 | 0.172 |
| C3 | -0.194 | -0.142 | -0.075 | -0.071 | H3 | 0.255 | 0.217 | 0.154 | 0.151 |
| C4 | -0.209 | -0.190 | -0.208 | -0.202 | H4 | 0.263 | 0.229 | 0.167 | 0.160 |
| C5 | -0.047 | -0.029 | 0.054 | 0.051 | H5 | 0.276 | 0.236 | 0.169 | 0.164 |
| C6 | -0.012 | -0.044 | -0.001 | 0.001 | H6 | 0.277 | 0.235 | 0.166 | 0.161 |
| C7 | -0.030 | 0.006 | 0.075 | 0.072 | H7 | 0.264 | 0.221 | 0.150 | 0.145 |
| C8 | -0.031 | -0.031 | 0.051 | 0.051 | H8 | 0.273 | 0.238 | 0.160 | 0.156 |
| C9 | 0.067 | 0.121 | 0.126 | 0.124 | H9 | 0.273 | 0.231 | 0.157 | 0.152 |
| C10 | -0.226 | -0.266 | -0.319 | -0.307 | H10 | 0.268 | 0.230 | 0.149 | 0.147 |
| C11 | -0.142 | -0.014 | 0.166 | 0.154 | H11 | 0.223 | 0.165 | 0.137 | 0.132 |
| C12 | -0.206 | -0.208 | -0.192 | -0.182 | H12 | 0.418 | 0.474 | 0.410 | 0.408 |
| C13 | -0.203 | -0.177 | -0.136 | -0.130 | H13 | 0.242 | 0.186 | 0.159 | 0.152 |
| C14 | -0.207 | -0.135 | -0.066 | -0.064 | H14 | 0.208 | 0.162 | 0.145 | 0.138 |
| C15 | -0.203 | -0.179 | -0.138 | -0.131 | H15 | 0.200 | 0.156 | 0.146 | 0.140 |
| C16 | -0.207 | -0.202 | -0.180 | -0.172 | H16 | 0.211 | 0.167 | 0.148 | 0.141 |
| C17 | -0.197 | -0.184 | -0.201 | -0.194 | H17 | 0.230 | 0.168 | 0.161 | 0.153 |
| C18 | -0.199 | -0.145 | -0.072 | -0.070 | H18 | 0.215 | 0.165 | 0.145 | 0.139 |
| C19 | -0.206 | -0.196 | -0.158 | -0.149 | H19 | 0.203 | 0.155 | 0.138 | 0.131 |
| C20 | -0.245 | -0.203 | -0.195 | -0.193 | H20 | 0.201 | 0.151 | 0.137 | 0.130 |
| C21 | 0.092 | 0.200 | 0.068 | 0.085 | H21 | 0.202 | 0.165 | 0.152 | 0.145 |
| C22 | -0.194 | -0.140 | -0.180 | -0.161 | H22 | 0.205 | 0.162 | 0.156 | 0.148 |
| C23 | -0.173 | -0.124 | -0.166 | -0.148 | H23 | 0.200 | 0.159 | 0.151 | 0.144 |
| C24 | -0.423 | -0.307 | -0.273 | -0.260 | H24 | 0.216 | 0.168 | 0.149 | 0.142 |
| C25 | -0.436 | -0.316 | -0.268 | -0.255 | H25 | 0.188 | 0.142 | 0.127 | 0.121 |
| C26 | -0.580 | -0.479 | -0.463 | -0.442 | H26 | 0.210 | 0.158 | 0.142 | 0.136 |
| C27 | -0.148 | -0.096 | -0.140 | -0.123 | H27 | 0.215 | 0.164 | 0.146 | 0.139 |
| C28 | -0.416 | -0.311 | -0.270 | -0.256 | H28 | 0.208 | 0.158 | 0.143 | 0.135 |
| C29 | -0.434 | -0.314 | -0.267 | -0.254 | H29 | 0.206 | 0.157 | 0.141 | 0.134 |
| C30 | -0.581 | -0.479 | -0.464 | -0.442 | H30 | 0.204 | 0.166 | 0.154 | 0.146 |
| Cl1 | 0.038 | -0.002 | -0.021 | -0.026 | H31 | 0.199 | 0.158 | 0.150 | 0.143 |
| Cl2 | 0.044 | 0.003 | -0.008 | -0.013 | H32 | 0.202 | 0.160 | 0.153 | 0.146 |
| Cl3 | 0.042 | 0.000 | -0.020 | -0.025 | |||||
| O1 | -0.708 | -0.783 | -0.656 | -0.659 | |||||
| N1 | -0.737 | -0.650 | -0.417 | -0.430 | |||||
| MOs | HF | DFT | Average | ||
|---|---|---|---|---|---|
| 321G | 6-31G* | EDF2 6-31G* |
B3LYP 6-31G* |
||
| LUMO{+1} | 2.5 | 2.4 | -1.2 | -1.1 | 0.7 |
| LUMO | 1.6 | 1.5 | -2.3 | -2.2 | -0.4 |
| HOMO | -8.3 | -8.1 | -5.8 | -5.9 | -7.0 |
| HOMO{-1} | -8.7 | -8.3 | -5.9 | -6.0 | -7.2 |
| HOMO{-2} | -9.4 | -9.4 | -6.1 | -6.3 | -7.8 |
| HOMO{-3} | -9.6 | -9.5 | -6.9 | -7.0 | -8.3 |
| HOMO{-4} | -9.9 | -9.7 | -7.2 | -7.3 | -8.5 |
| HOMO{-5} | -10.0 | -10.0 | -7.2 | -7.4 | -8.7 |
| HOMO{-6} | -10.4 | -10.2 | -7.3 | -7.4 | -8.8 |
| HOMO{-7} | -11.6 | -11.6 | -7.3 | -7.5 | -9.5 |
| HOMO{-8} | -12.1 | -12.1 | -8.2 | -8.4 | -10.2 |
| HOMO{-9} | -12.2 | -12.2 | -8.4 | -8.5 | -10.3 |
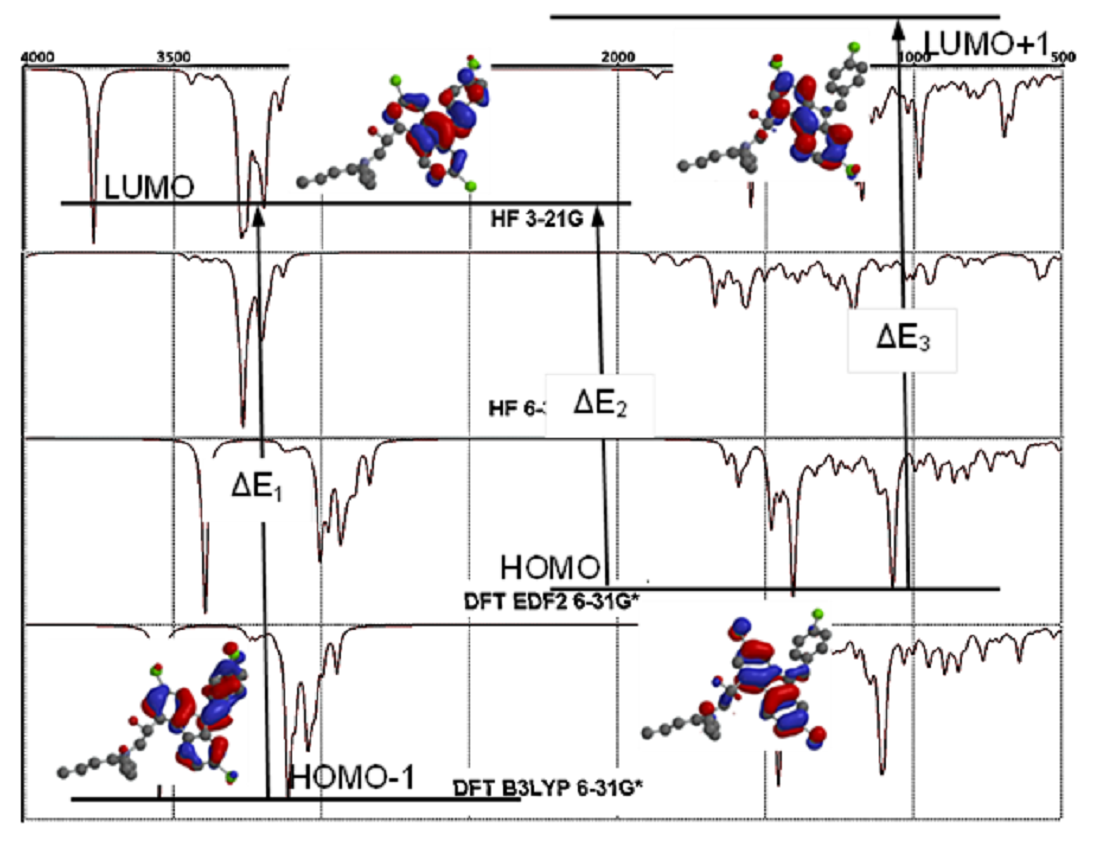
| Method & Basis Set |
HOMO-1 | HOMO | LUMO | LUMO+1 | Energy Diff. (ΔE) | λmax | |||||
|---|---|---|---|---|---|---|---|---|---|---|---|
| ΔE1 | ΔE2 | ΔE3 | Calculated (Vac.) | ||||||||
| HF | 3-21G | -8.7 | -8.3 | 1.6 | 2.5 | 10.3 | 9.9 | 10.8 | 120.47 | 125.34 | 114.89 |
| 6-31G* | -8.3 | -8.1 | 1.5 | 2.4 | 9.8 | 9.6 | 10.5 | 126.61 | 129.25 | 118.17 | |
| DFT | EDF2 6-31G* |
-5.9 | -5.8 | -2.3 | -1.2 | 3.6 | 3.5 | 4.6 | 344.67 | 354.52 | 269.74 |
| B3LYP 6-31G* |
-6.0 | -5.9 | -2.2 | -1.1 | 3.8 | 3.7 | 4.8 | 326.53 | 335.36 | 258.50 | |
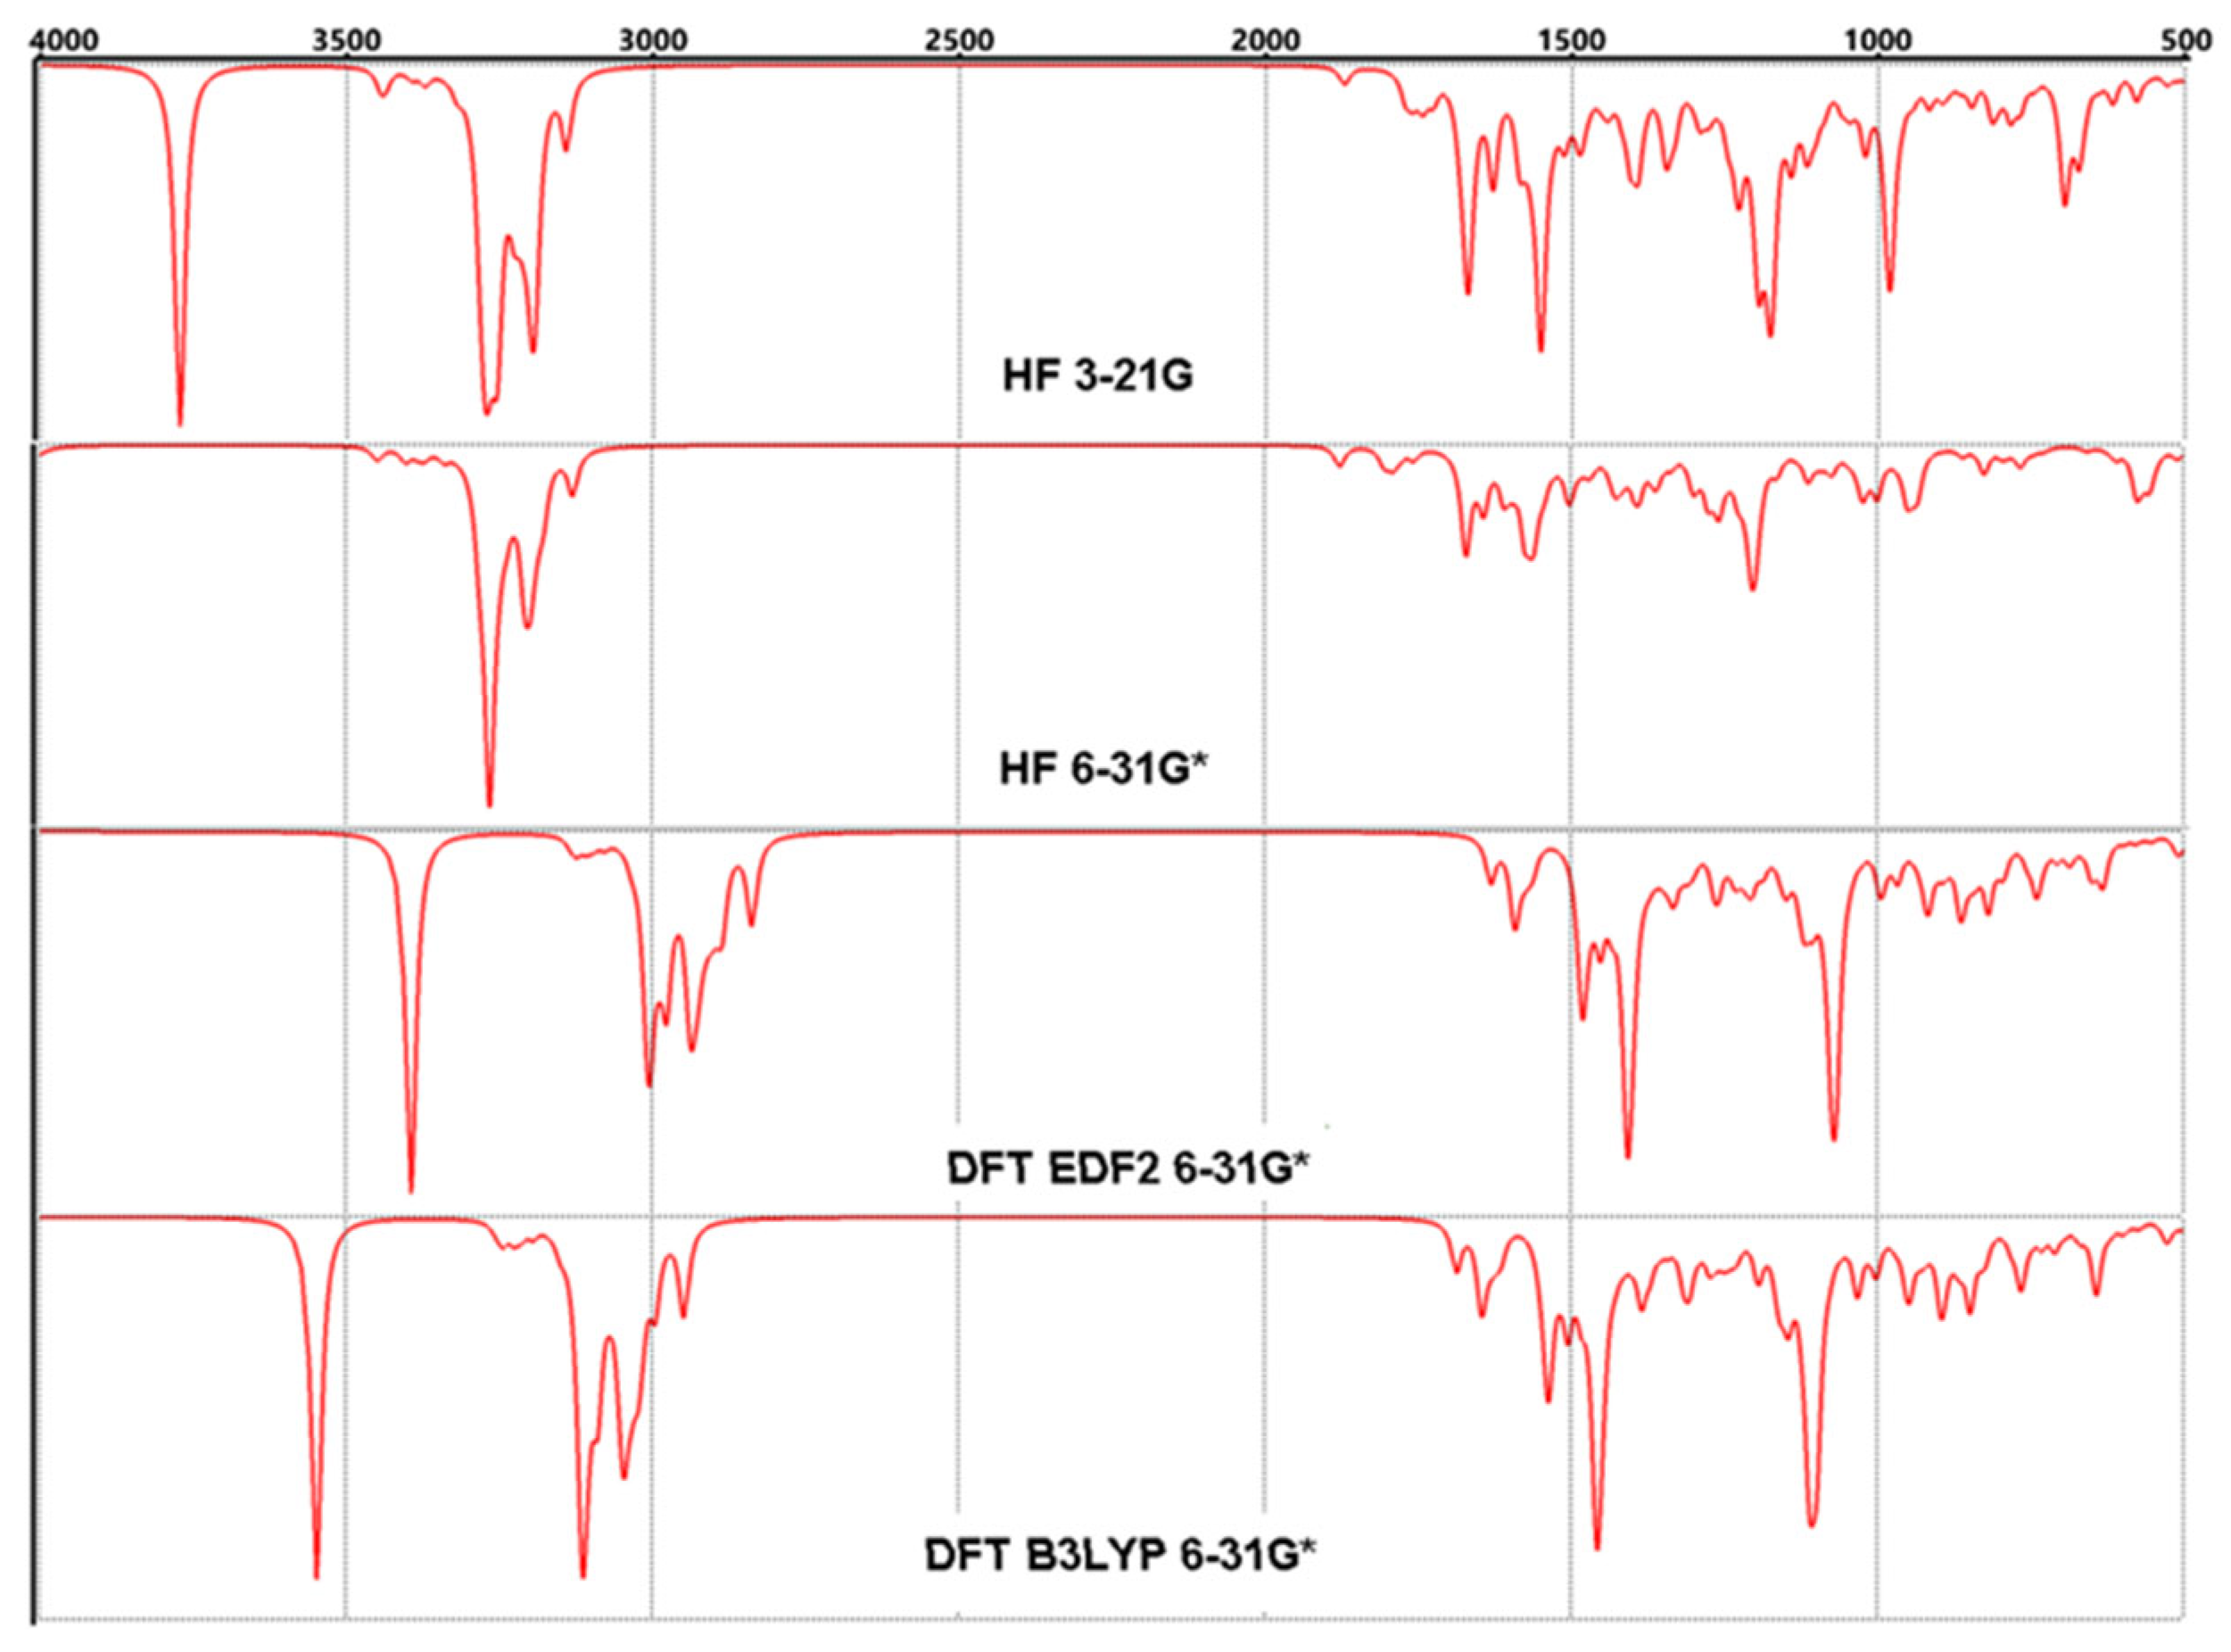
| 321G | 6-31G* | EDF2 631G* |
B3LYP 631G* |
321G | 6-31G* | EDF2 631G* |
B3LYP 631G* |
||
|---|---|---|---|---|---|---|---|---|---|
| 1 | 493 | 490 | 456 | 456 | 11 | 1434 | 1439 | 1333 | 1331 |
| 2 | 616 | 588 | 560 | 558 | 12 | 1494 | 1507 | 1396 | 1392 |
| 3 | 663 | 630 | 596 | 595 | 13 | 1607 | 1582 | 1470 | 1474 |
| 4 | 700 | 670 | 607 | 621 | 14 | 1678 | 1710 | 1570 | 1561 |
| 5 | 783 | 767 | 731 | 732 | 15 | 1801 | 1806 | 1631 | 1622 |
| 6 | 983 | 974 | 886 | 882 | 16 | 3023 | 3010 | 2837 | 2836 |
| 7 | 1296 | 1304 | 1230 | 1226 | 17 | 3088 | 3083 | 2929 | 2926 |
| 8 | 1179 | 1180 | 1100 | 1098 | 18 | 3142 | 3141 | 3003 | 2994 |
| 9 | 1296 | 1304 | 1230 | 1226 | 19 | 3313 | 3316 | 3131 | 3130 |
| 10 | 1352 | 1344 | 1259 | 1261 | 20 | 3629 | 3884 | 3393 | 3124 |
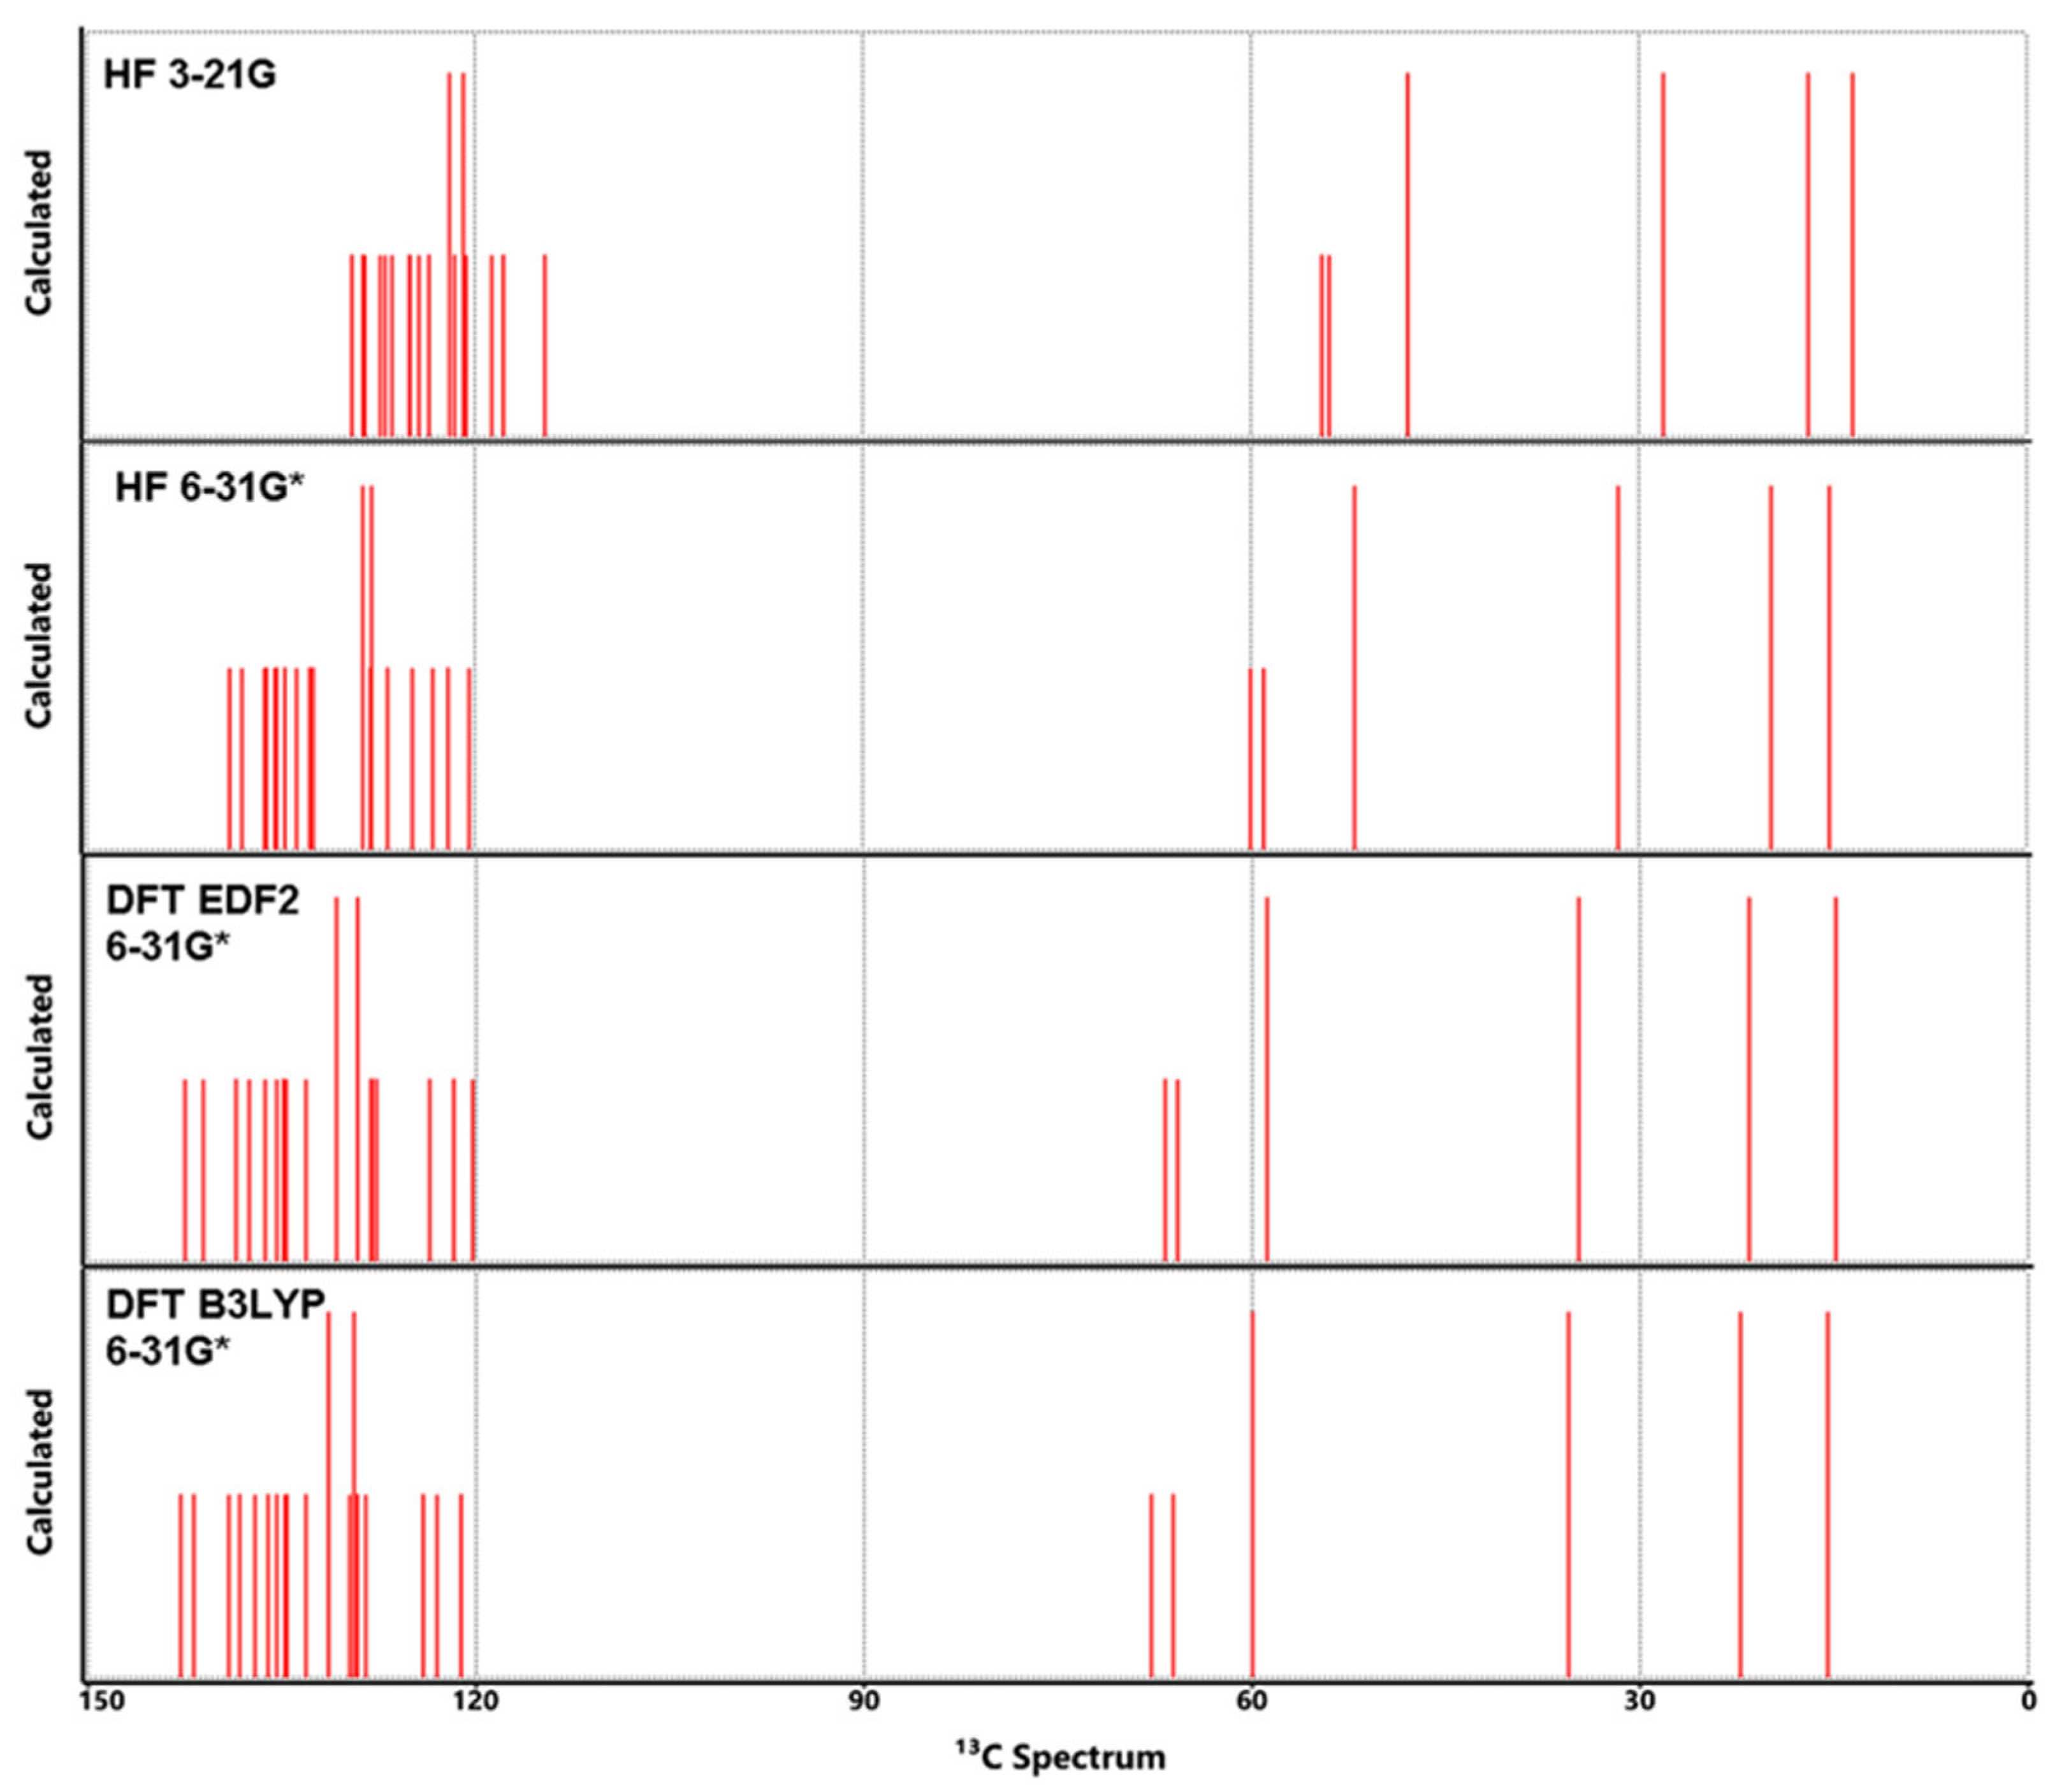
| Atom | HF | DFT | DFT | Exp** | Atom | HF | DFT | DFT | Exp** | ||
|---|---|---|---|---|---|---|---|---|---|---|---|
| 3-21G | 6-31G* | EDF2 6-31G* | B3LYP 6-31G* | 3-21G | 6-31G* | EDF26-31G* | B3LYP6-31G* | ||||
| C1 | 128.66 | 137.99 | 141.12 | 135.18 | 141.7 | H1 | 8.43 | 8.21 | 8.02 | 7.74 | 7.58 |
| C2 | 121.57 | 128.09 | 127.69 | 122.43 | 124.1 | H2 | 6.24 | 7.28 | 7.90 | 7.57 | 7.58 |
| C3 | 124.34 | 135.48 | 134.71 | 136.72 | 133.3 | H3 | 7.62 | 7.57 | 7.30 | 7.16 | 7.31 |
| C4 | 117.79 | 123.27 | 121.72 | 116.39 | 127.8 | H4 | 7.49 | 7.66 | 7.63 | 7.67 | 7.44 |
| C5 | 126.93 | 135.30 | 138.57 | 132.56 | 140.0 | H5 | 7.50 | 7.67 | 7.41 | 7.12 | 7.44 |
| C6 | 125.01 | 133.79 | 134.90 | 129.57 | 133.0 | H6 | 7.50 | 7.67 | 7.41 | 7.18 | 7.44 |
| C7 | 128.51 | 136.27 | 137.52 | 131.71 | 136.6 | H7 | 7.49 | 7.60 | 7.63 | 7.09 | 7.44 |
| C8 | 129.51 | 138.94 | 142.48 | 136.16 | 138.4 | H8 | 7.61 | 7.86 | 7.43 | 7.18 | 7.67 |
| C9 | 127.29 | 132.49 | 136.33 | 131.10 | 135.1 | H9 | 7.27 | 7.49 | 7.23 | 6.94 | 7.44 |
| C10 | 118.67 | 124.84 | 128.04 | 123.58 | 128.5 | H10 | 7.52 | 7.77 | 7.55 | 7.38 | 7.71 |
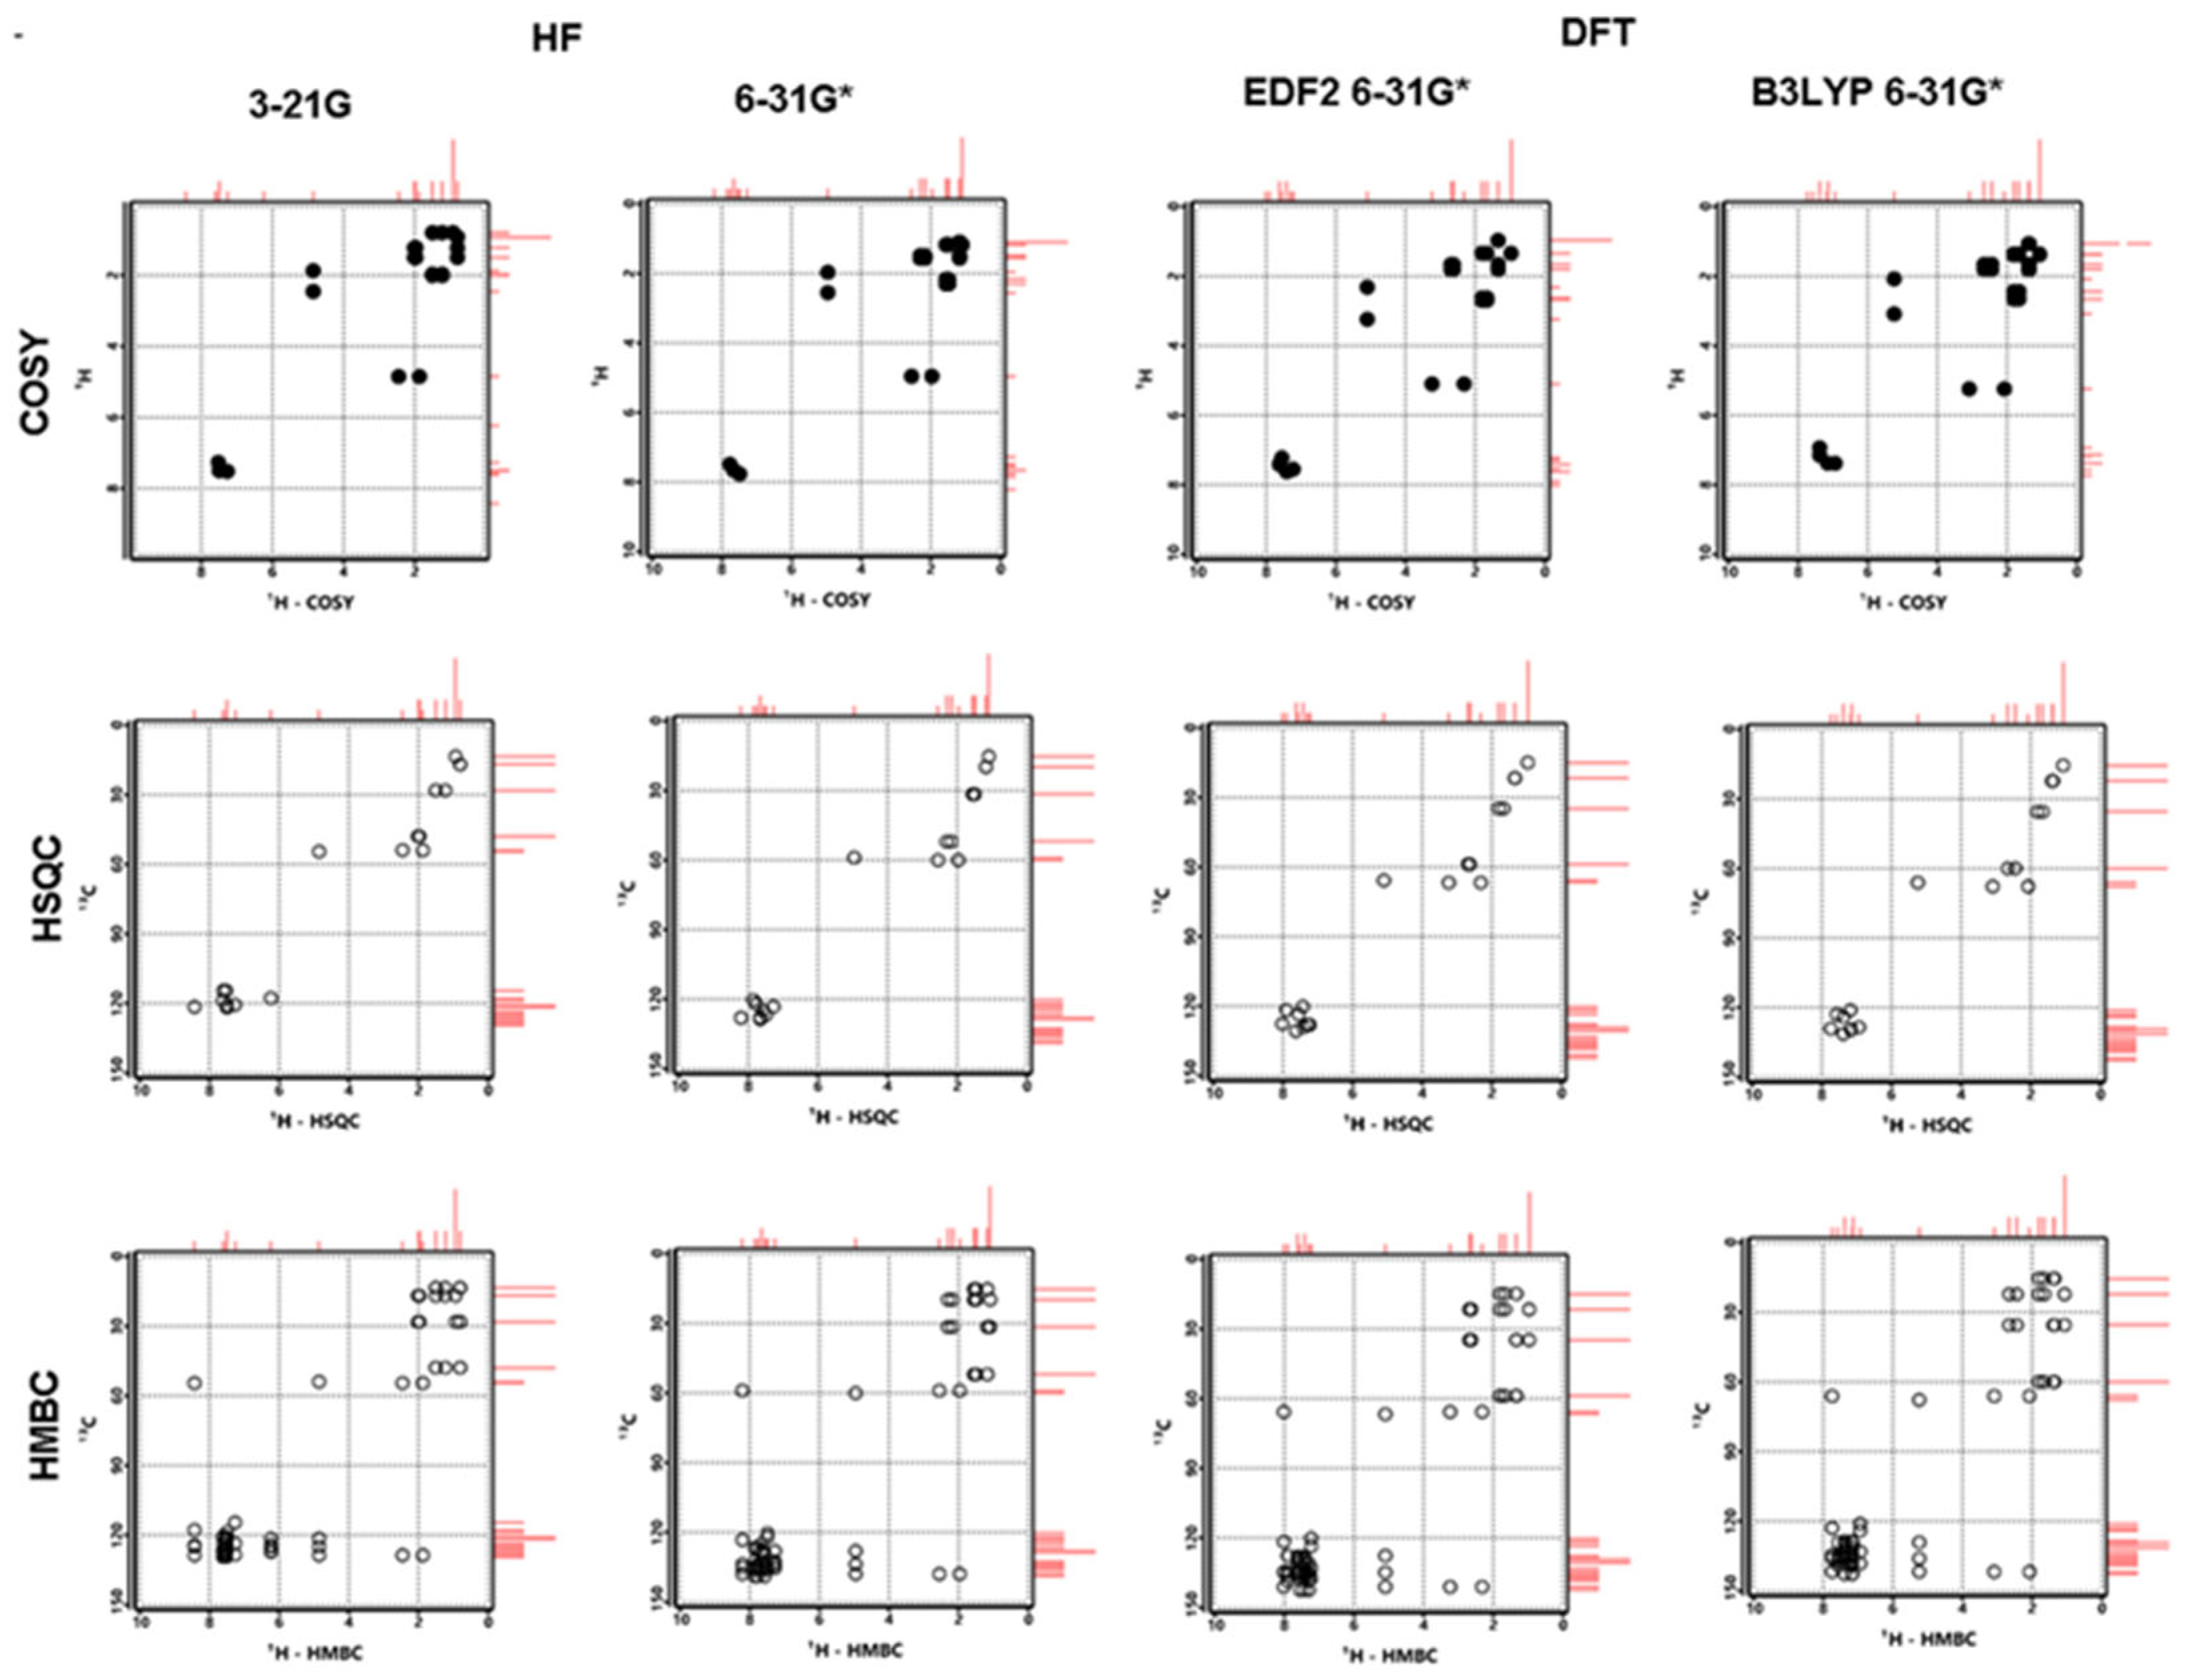
| C11 | 126.38 | 132.76 | 134.66 | 128.27 | 135.1 | H11 | 4.85 | 4.96 | 5.10 | 5.24 | 5.35 |
| C12 | 120.90 | 128.68 | 130.80 | 124.41 | 130.7 | H12 | 3.83 | 3.06 | 4.16 | 3.95 | -- |
| C13 | 121.93 | 127.96 | 129.17 | 122.37 | 129.2 | H13 | 1.87 | 1.97 | 2.31 | 2.07 | 2.44 |
| C14 | 125.05 | 136.10 | 135.43 | 137.50 | 134.8 | H14 | 2.45 | 2.55 | 3.24 | 3.09 | 2.87 |
| C15 | 121.93 | 127.96 | 129.17 | 122.99 | 129.2 | H15 | 1.97 | 2.30 | 2.69 | 2.58 | 2.59 |
| C16 | 120.90 | 128.68 | 130.80 | 124.88 | 130.7 | H16 | 2.01 | 2.17 | 2.63 | 2.57 | 2.59 |
| C17 | 114.58 | 120.41 | 120.28 | 114.59 | 126.5 | H17 | 1.50 | 1.56 | 1.80 | 2.00 | 1.49 |
| C18 | 123.53 | 134.68 | 133.14 | 135.27 | 134.3 | H18 | 1.23 | 1.49 | 1.66 | 1.64 | 1.49 |
| C19 | 120.67 | 126.74 | 128.14 | 121.79 | 130.7 | H19 | 0.81 | 1.17 | 1.33 | 1.38 | 1.36 |
| C20 | 114.60 | 122.07 | 123.59 | 117.46 | 120.8 | H20 | 0.80 | 1.18 | 1.34 | 1.42 | 1.36 |
| C21 | 54.52 | 58.98 | 65.74 | 65.49 | 65.6 | H21 | 0.93 | 1.09 | 0.97 | 1.19 | 0.96 |
| C22 | 53.92 | 60.05 | 66.73 | 65.96 | 60.1 | H22 | 0.93 | 1.09 | 0.97 | 1.06 | 0.96 |
| C23 | 47.89 | 52.00 | 58.82 | 56.47 | 53.5 | H23 | 0.93 | 1.09 | 0.97 | 0.98 | 0.96 |
| C24 | 28.11 | 31.58 | 34.76 | 36.97 | 29.2 | H24 | 2.01 | 2.17 | 2.63 | 2.31 | 2.59 |
| C25 | 16.90 | 19.79 | 21.57 | 23.31 | 20.7 | H25 | 1.97 | 2.30 | 2.69 | 2.73 | 2.59 |
| C26 | 13.48 | 15.27 | 14.86 | 15.78 | 14.2 | H26 | 1.50 | 1.56 | 1.80 | 1.61 | 1.49 |
| C27 | 47.89 | 52.00 | 58.82 | 60.59 | 53.5 | H27 | 1.23 | 1.49 | 1.66 | 1.66 | 1.49 |
| C28 | 28.11 | 31.58 | 34.76 | 34.67 | 29.2 | H28 | 0.81 | 1.17 | 1.33 | 1.34 | 1.36 |
| C29 | 16.90 | 19.79 | 21.57 | 23.05 | 20.7 | H29 | 0.80 | 1.18 | 1.34 | 1.34 | 1.36 |
| C30 | 13.48 | 15.27 | 14.86 | 15.89 | 14.2 | H30 | 0.93 | 1.09 | 0.97 | 1.17 | 0.96 |
| H31 | 0.93 | 1.09 | 0.97 | 0.97 | 0.96 | ||||||
| H32 | 0.93 | 1.09 | 0.97 | 1.03 | 0.96 | ||||||
Disclaimer/Publisher’s Note: The statements, opinions and data contained in all publications are solely those of the individual author(s) and contributor(s) and not of MDPI and/or the editor(s). MDPI and/or the editor(s) disclaim responsibility for any injury to people or property resulting from any ideas, methods, instructions or products referred to in the content. |
© 2023 by the authors. Licensee MDPI, Basel, Switzerland. This article is an open access article distributed under the terms and conditions of the Creative Commons Attribution (CC BY) license (http://creativecommons.org/licenses/by/4.0/).


