Submitted:
13 June 2023
Posted:
14 June 2023
You are already at the latest version
Abstract
Keywords:
1. Introduction
2. Materials and Methods
Experinemtal site, vineyard and growing conditions
Treatments
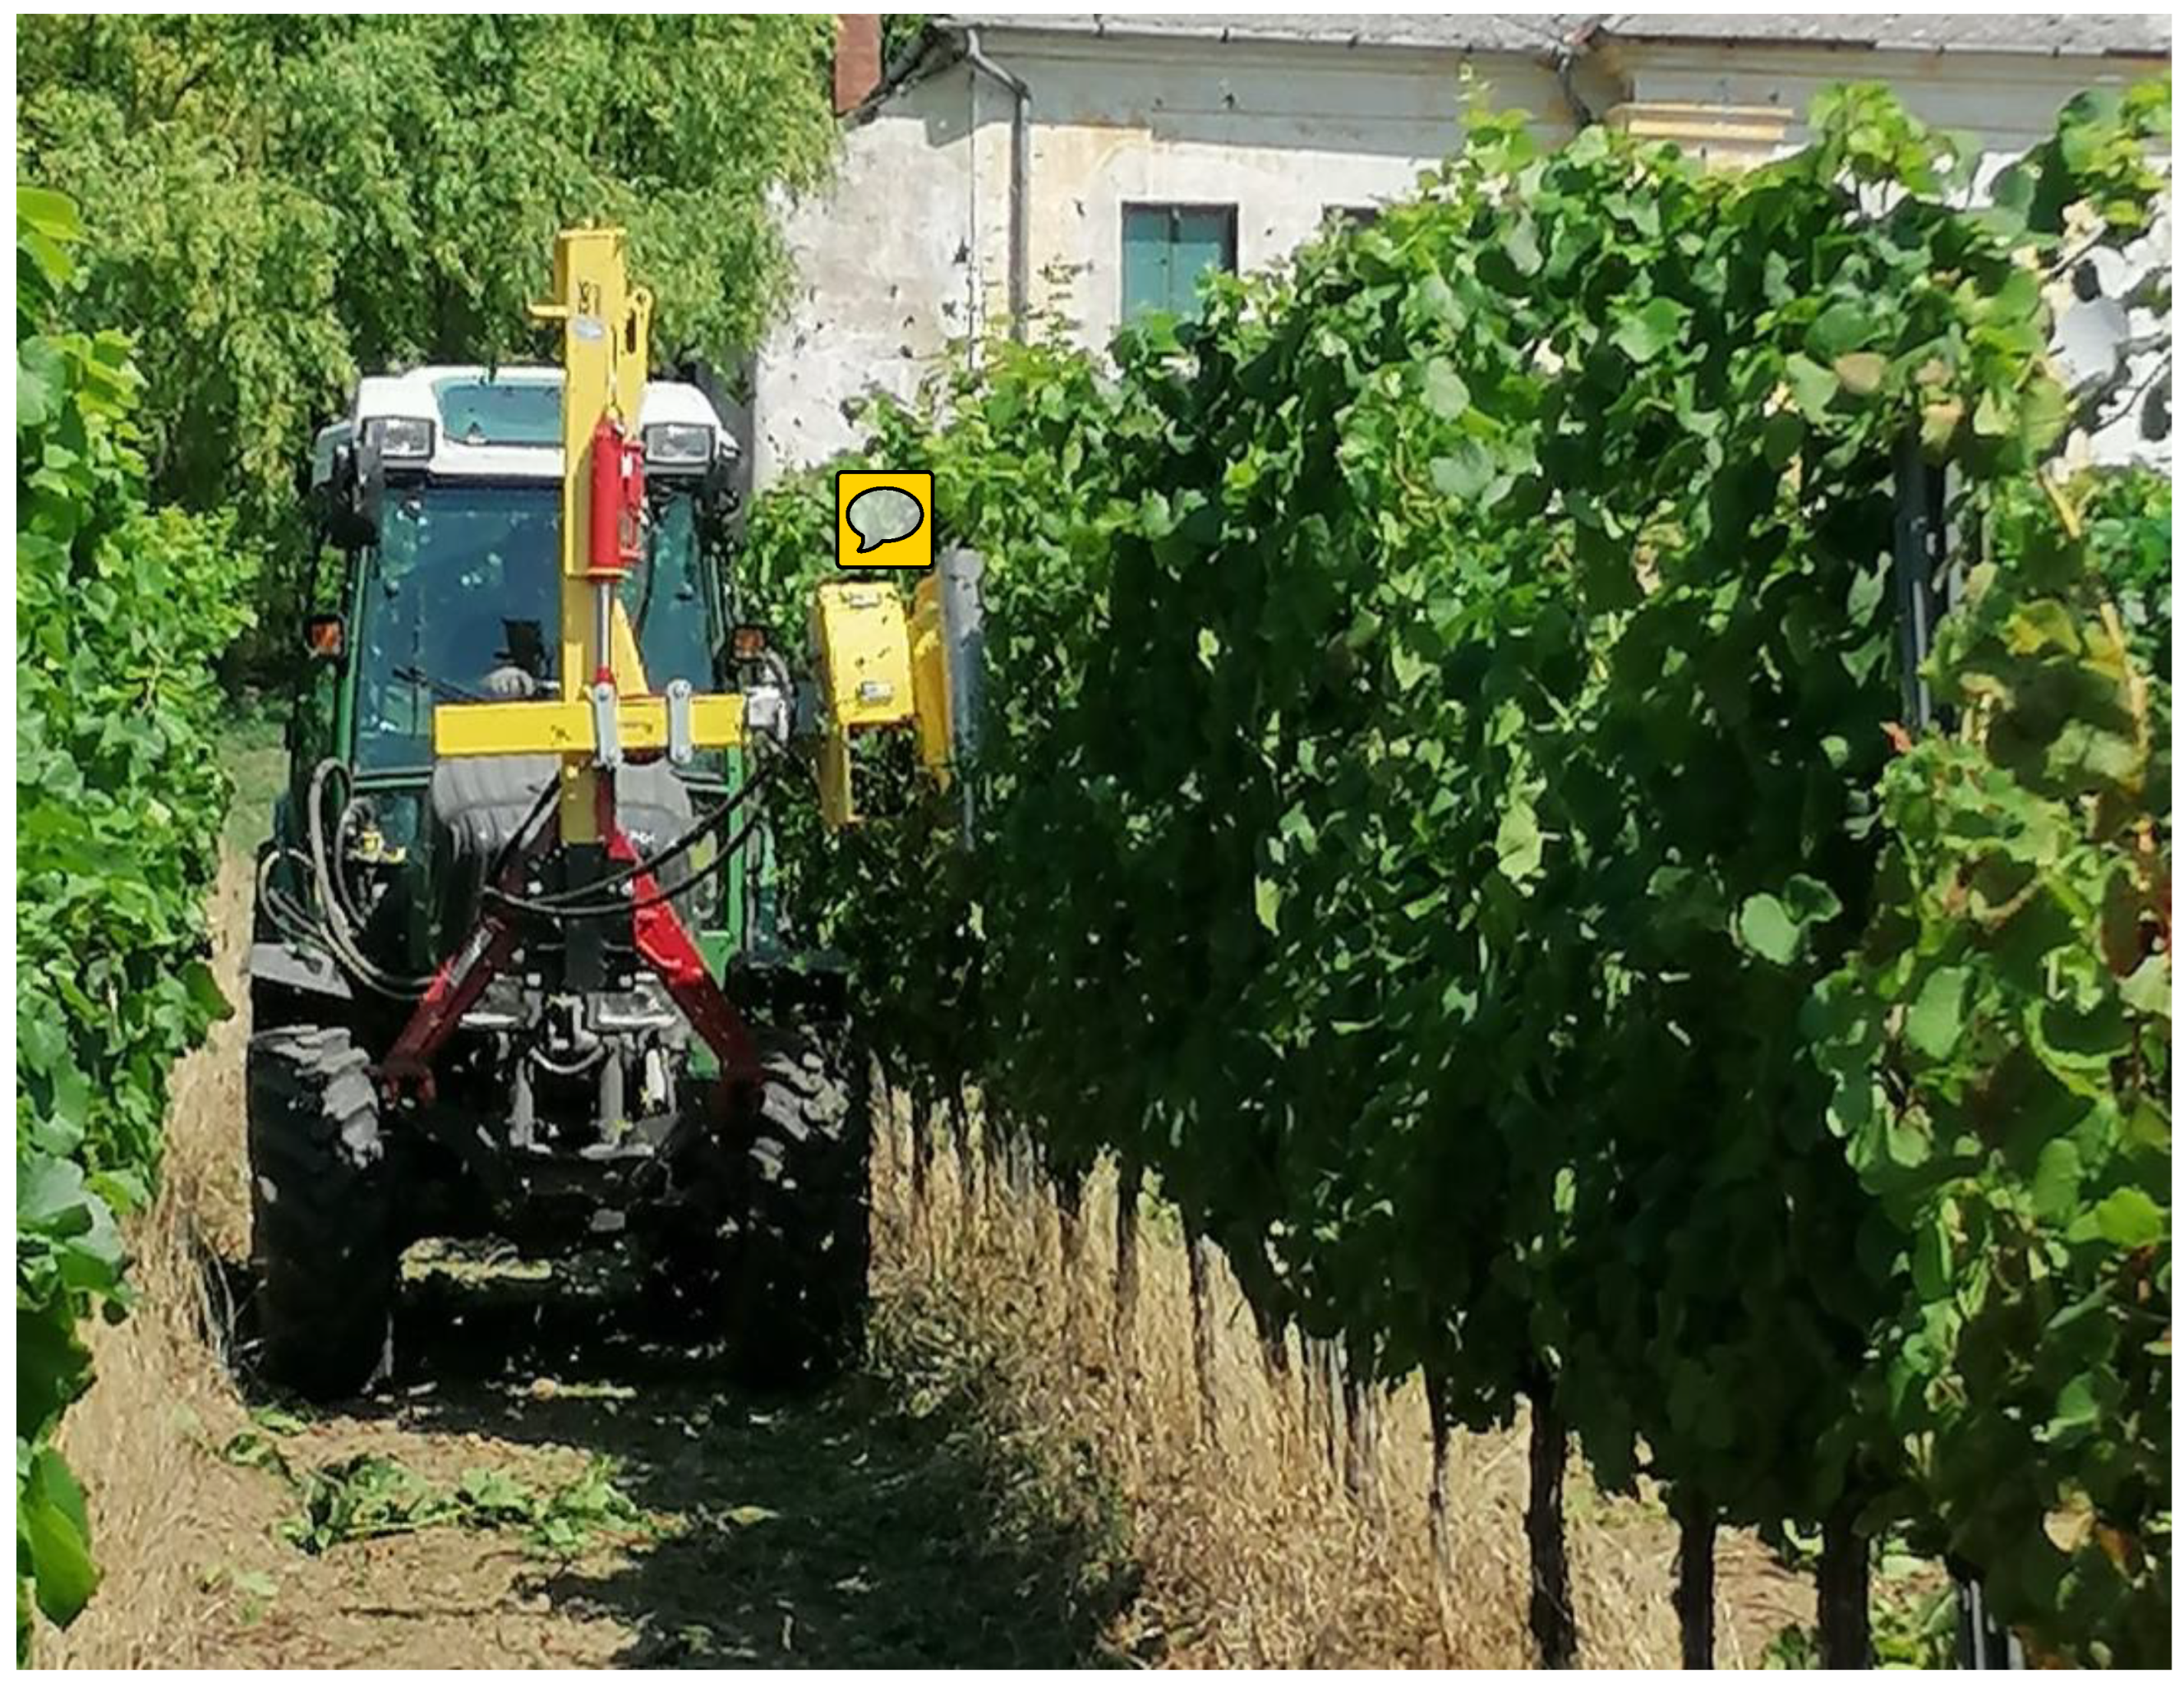
- LF (leaf removal) The leaves above the cluster zone were removed with a special leaf stripper (Figure 4.).
- ST (short topping) The shoots were trimmed short
- Control: no treatment was done.
Experimental harvest, measures
Data analyses
3. Results
3.1. Yield
3.2. Sugar content of grape juice
3.3. Titratable acidity of grape juice
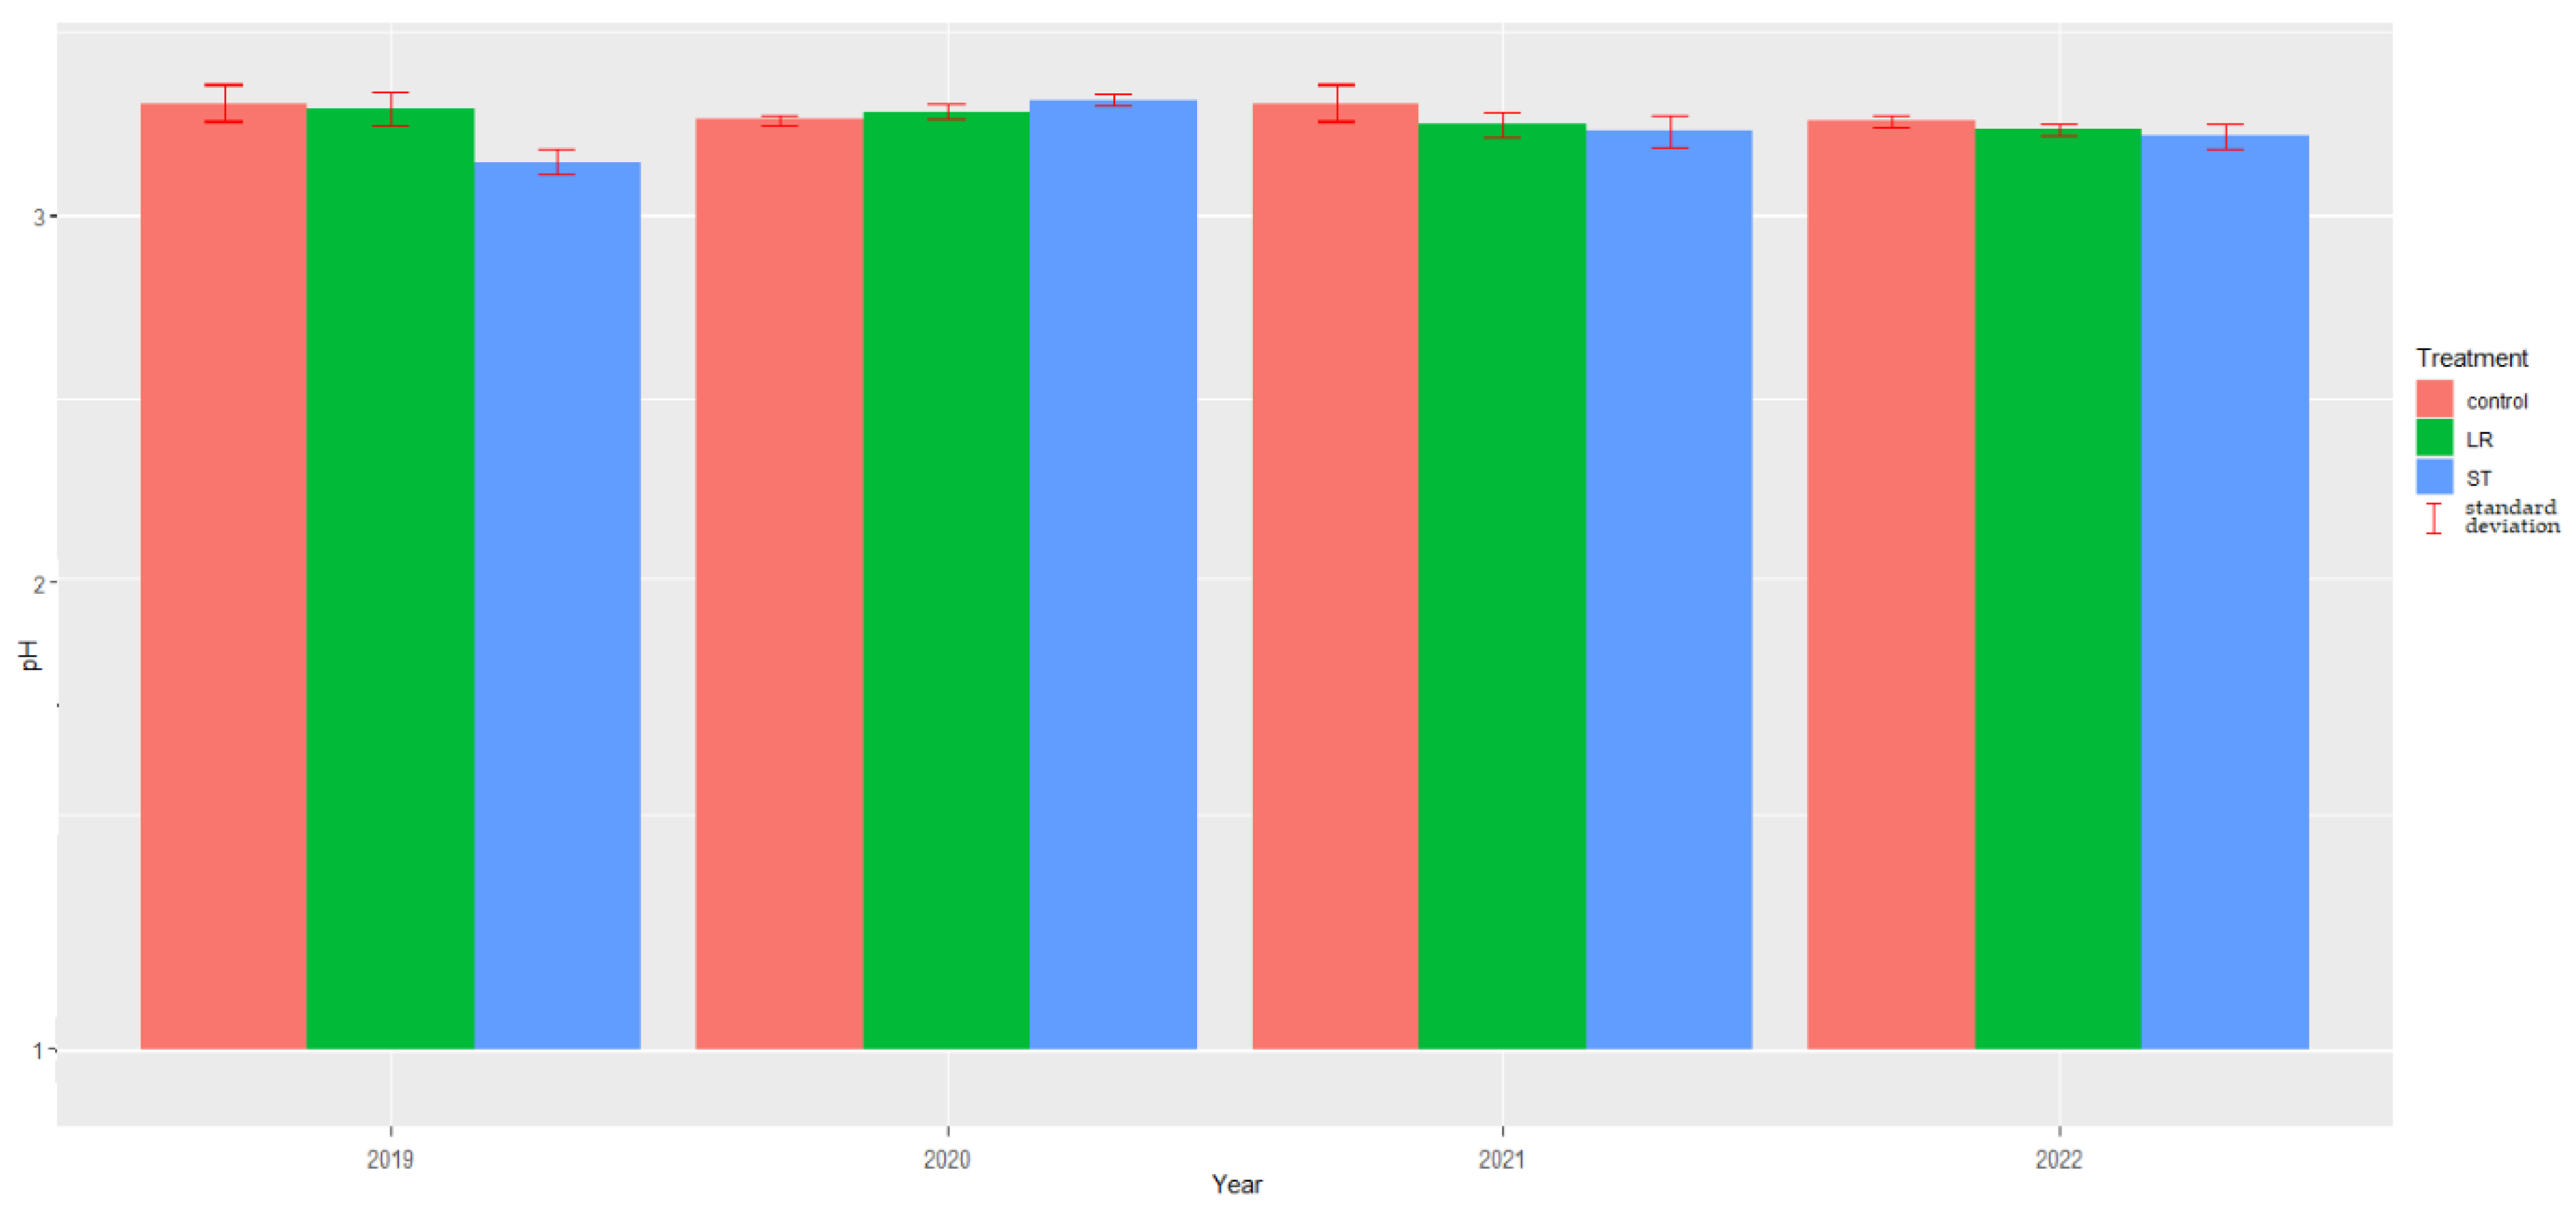
3.4. The pH value of the grape juice
3.5. Rate of Botrytis infection
| Cultivar | Pinot noir | Welshriesling | Yearly statistics | ||||
|---|---|---|---|---|---|---|---|
| Year | Control | Leaf Removal | Sort Topping | Control | Leaf Removal | Sort Topping | |
| 2019 | 0.00 | 5.00 | 10.00 | 0.00 | 5.00 | 0.00 | |
| 0.00 | 5.00 | 7.00 | 0.00 | 5.00 | 0.00 | ||
| 0.00 | 5.00 | 5.00 | 0.00 | 5.00 | 0.00 | ||
| 0.00 | 5.00 | 5.00 | 0.00 | 5.00 | 0.00 | ||
| Average | 0.00 | 5.00 | 6.75 | 0.00 | 5.00 | 0.00 | 2.79 |
| Variance | 0.0000 | 0.0000 | 5.5833 | 0.0000 | 0.0000 | 0.0000 | 9.2156 |
| 2020 | 2.00 | 15.00 | 5.00 | 0.00 | 5.00 | 0.00 | |
| 3.00 | 15.00 | 0.00 | 0.00 | 10.00 | 0.00 | ||
| 3.00 | 15.00 | 5.00 | 0.00 | 5.00 | 0.00 | ||
| 3.00 | 15.00 | 2.00 | 0.00 | 10.00 | 0.00 | ||
| Average | 2.75 | 15.00 | 3.00 | 0.00 | 7.50 | 0.00 | 4.71 |
| Variance | 0.2500 | 0.0000 | 6.0000 | 0.0000 | 8.3333 | 0.0000 | 30.5634 |
| 2021 | 0.00 | 10.00 | 3.00 | 0.00 | 0.00 | 0.00 | |
| 0.00 | 10.00 | 5.00 | 0.00 | 0.00 | 0.00 | ||
| 0.00 | 10.00 | 3.00 | 0.00 | 0.00 | 0.00 | ||
| 0.00 | 10.00 | 0.00 | 0.00 | 0.00 | 0.00 | ||
| Average | 0.00 | 10.00 | 2.75 | 0.00 | 0.00 | 0.00 | 2.13 |
| Variance | 0.0000 | 0.0000 | 4.2500 | 0.0000 | 0.0000 | 0.0000 | 14.5489 |
| 2022 | 10.00 | 5.00 | 2.00 | 5.00 | 0.00 | 0.00 | |
| 10.00 | 10.00 | 2.00 | 10.00 | 0.00 | 0.00 | ||
| 10.00 | 5.00 | 3.00 | 10.00 | 0.00 | 0.00 | ||
| 10.00 | 5.00 | 2.00 | 5.00 | 0.00 | 0.00 | ||
| Average | 10.00 | 6.25 | 2.25 | 7.50 | 0.00 | 0.00 | 4.33 |
| Variance | 0.0000 | 6.2500 | 0.2500 | 8.3333 | 0.0000 | 0.0000 | 17.1884 |
| Average | 5.31 | 1.67 | |||||
| Variance | 20.6024 | 9.9291 | |||||
3.6. Cultivar-wise analyses
3.6.1. Pinot noir
3.6.2. Welshriesling
4. Discussion
5. Conclusions
Author Contributions
Funding
Conflicts of Interest
References
- IPCC, 2022: Summary for Policymakers. In: Climate Change 2022: Mitigation of Climate Change. Contribution of Working Group III to the Sixth Assessment Report of the Intergovernmental Panel on Climate Change; Shukla, P.R., Skea, J., Slade, R., al Khourdajie, A., van Diemen, R., McCollum, D., Pathak, M., Some, S., Vyas, P., Fradera, R., Belkacemi, M., et al., Eds.; Cambridge University Press: Cambridge, UK and New York, NY, USA, 2022. [Google Scholar]
- Schultz, H.R. Climate Change and Viticulture: A European Perspective on Climatology, Carbon Dioxide and UV-B Effects. Aust J Grape Wine Res 2000, 6, 2–12. [Google Scholar] [CrossRef]
- Tate, A.B. Global Warming’s Impact on Wine. Int J Phytoremediation 2001, 21, 95–109. [Google Scholar] [CrossRef]
- Petgen, M. Reaktion Der Reben Auf Den Klimawandel. SCHWEIZ. Z. OBST-WEINBAU 2007, 9, 6–9.
- Prior, B. Bestandsführung an Klimawandel Anpassen. Das Deutsche Weinmagazin 2007, 10, 22–27. [Google Scholar]
- Becker, N.J. Einfluss von Standortfaktoren Auf Beerenreifung Und Ertragsbildung. Die Wein-Wissenschaft 1985, 40, 291-318.
- Kenny, G.J.; Shao, J. An Assessment of a Latitude-Temperature Index for Predicting Climate Suitability for Grapes in Europe. 2015, 67, 239–246. [CrossRef]
- Kenny, G.J.; Harrison, P.A. The Effects of Climate Variability and Change on Grape Suitability in Europe. 2007, 3, 163–183. [CrossRef]
- Jones, G. v.; Webb, L.B. Climate Change, Viticulture, and Wine: Challenges and Opportunities. J Wine Res 2010, 21, 103–106. [Google Scholar] [CrossRef]
- Vršic, S.; Vodovnik-Plevnik, T. Reactions of Vines Varieties to Climate Changes in NE Slovenia. Plant Soil Environ 2012, 58, 34–41. [Google Scholar] [CrossRef]
- Webb, L.B.; Whetton, P.H.; Barlow, E.W.R. Observed Trends in Winegrape Maturity in Australia. Glob Chang Biol 2011, 17, 2707–2719. [Google Scholar] [CrossRef]
- Jorquera-Fontena, E.; Orrego, R. Impact of Global Warming on the Phenology of a Variety of Grapevine Grown in Southern Chile. Agrociencia 2010, 44, 427–435. [Google Scholar]
- Duchêne, E.; Schneider, C. Grapevine and Climatic Changes: A Glance at the Situation in Alsace. Agron Sustain Dev 2005, 25, 93–99. [Google Scholar] [CrossRef]
- Duchêne, E.; Huard, F.; Dumas, V.; Schneider, C.; Merdinoglu, D. The Challenge of Adapting Grapevine Varieties to Climate Change. Clim Res 2010, 41, 193–204. [Google Scholar] [CrossRef]
- van Leeuwen, C.; Schultz, H.R.; de Cortazar-Atauri, I.G.; Duchêne, E.; Ollat, N.; Pieri, P.; Bois, B.; Goutouly, J.P.; Quénol, H.; Touzard, J.M.; et al. Why Climate Change Will Not Dramatically Decrease Viticultural Suitability in Main Wine-Producing Areas by 2050. Proc Natl Acad Sci U S A 2013, 110, 3051–3052. [Google Scholar] [CrossRef]
- Hannah, L.; Roehrdanz, P.R.; Ikegami, M.; Shepard, A. v.; Shaw, M.R.; Tabor, G.; Zhi, L.; Marquet, P.A.; Hijmans, R.J. Climate Change, Wine, and Conservation. Proc Natl Acad Sci U S A 2013, 110, 6907–6912. [Google Scholar] [CrossRef] [PubMed]
- Hannah, L.; Roehrdanz, P.R.; Ikegami, M.; Shepard, A. v.; Shaw, M.R.; Tabor, G.; Zhi, L.; Marquet, P.A.; Hijmans, R.J. Reply to van Leeuwen et al.: Planning for Agricultural Adaptation to Climate Change and Its Consequences for Conservation. Proc Natl Acad Sci U S A 2013, 110, 3053. [CrossRef]
- Mesterházy, I.; Mészáros, R.; Pongrácz, R. The Effects of Climate Change on Grape Production in Hungary. Időjárás - Quarterly Journal of the Hungarian Meteorological Service 2014, 118, 193–206.
- Mesterházy, I.; Pongrácz, R.; Köbölkuti, Z.A.; Ladányi, M. Predicted Changes of Grape Production Indicators Refined by Modified Growing Season Calculation Method (1951–2100), Hungary (Módosított Vegetációs Időszak-Számítási Módszerrel Korrigált Szőlőtermesztési Indikátorok Várható Változása Magyarországon (1951–2100) ). Erdélyi Múzeum-Egyesület 2016.
- Mesterházy, I.; Mészáros, R.; Pongrácz, R.; Bodor, P.; Ladányi, M. The Analysis of Climatic Indicators Using Different Growing Season Calculation Methods – An Application to Grapevine Grown in Hungary. Idojaras 2018, 122, 217–235. [Google Scholar] [CrossRef]
- Irimia, L.; Tardea, C.; Niculaua, M.; Rotaru, L. Influence of Canopy on Must and Wine Quality in The Zweigelt Variety. Revista Lucrări ştiinţifice USAMV Iaşi - Seria Horticultură 2007, 50, 439–444.
- Borghezan, M.; Pit, F.A.; Gavioli, O.; Malinovski, L.I.; Silva, A.L. Canopy Management on Ripening of ‘Sauvignon Blanc’ Grapevine Grown in São Joaquim, Brazil. Acta Hortic 2017, 1188, 83–90. [Google Scholar] [CrossRef]
- Minnaar, P.P.; Jolly, N.P.; Ntushelo, N.S. Effect of Grapevine Canopy Side on Selected Sensory Attributes of Pinotage and Cabernet Sauvignon Wines. South African Journal of Enology and Viticulture 2020, 41, 1–7. [Google Scholar] [CrossRef]
- Gao, X.T.; Sun, D.; Wu, M.H.; Li, H.Q.; Liu, F.Q.; He, F.; Pan, Q.H.; Wang, J. Influence of Cluster Positions in the Canopy and Row Orientation on the Flavonoid and Volatile Compound Profiles in Vitis Vinifera L. Cabernet Franc and Chardonnay Berries. Food Research International 2021, 143, 110306. [Google Scholar] [CrossRef]
- Fanny, P.; Raymond, N.; Feilhes, C.; Prezman, F.; Pasquier, G.; Saccharin, P.; Mille, B.; Bulon, E.; Dufourcq, T. Reducing Alcohol Content in Wines by Combining Canopy Management Practices and Biological Techniques. 2018.
- Gambacorta, G.; Faccia, M.; Natrella, G.; Noviello, M.; Masi, G.; Tarricone, L. Early Basal Leaf Removal at Different Sides of the Canopy Improves the Quality of Aglianico Wine. Foods 2022, Vol. 11, Page 3140 2022, 11, 3140. [Google Scholar] [CrossRef]
- Zhang, P.; Wu, X.; Needs, S.; Liu, D.; Fuentes, S.; Howell, K. The Influence of Apical and Basal Defoliation on the Canopy Structure and Biochemical Composition of Vitis Vinifera Cv. Shiraz Grapes and Wine. Front Chem 2017, 5, 48. [Google Scholar] [CrossRef]
- Wobbrock, J.O.; Findlater, L.; Gergle, D.; Higgins, J.J. The Aligned Rank Transform for Nonparametric Factorial Analyses Using Only ANOVA Procedures. Conference on Human Factors in Computing Systems - Proceedings 2011, 143–146. [CrossRef]
- Elkin, L.A.; Kay, M.; Higgins, J.J.; Wobbrock, J.O. An Aligned Rank Transform Procedure for Multifactor Contrast Tests. UIST 2021 - Proceedings of the 34th Annual ACM Symposium on User Interface Software and Technology 2021, 754–768. [CrossRef]
- R Core Team R: A Language and Environment for Statistical Computing. R Foundation for Statistical Computing, Vienna, Austria. Available online: http://www.r-project.org/.
- Data Visualization with R and Ggplot2 | the R Graph Gallery. Available online: https://r-graph-gallery.com/ggplot2-package.html (accessed on 28 February 2023).
- Nakasato, N.; Mori, M.; Ichi Nomoto, K. ’; Zhang, D. ; Zhang, Y.; Lin, K.; Guseynov, S.N.; Mayborodin, S. V Photosynthesis Productivity and Architectonics of the Crystal Grape Variety Canopy with Different Techniques of Training and Forming Grape Bushes. IOP Conf Ser Earth Environ Sci 2021, 624, 012055. [Google Scholar] [CrossRef]
- Raghavendra, A.S. PHOTOSYNTHESIS AND PARTITIONING | C3 Plants. Encyclopedia of Applied Plant Sciences 2003, 673–680. [Google Scholar] [CrossRef]
- Murakami, K. Global Maps of Canopy Photosynthesis of Wine Grape under Changing Climate. 2023. [CrossRef]
- Koufos, G.C.; Mavromatis, T.; Koundouras, S.; Jones, G. V. Adaptive Capacity of Winegrape Varieties Cultivated in Greece to Climate Change: Current Trends and Future Projections. OENO One 2020, 54, 1201–1219. [Google Scholar] [CrossRef]
- Poni, S.; Bernizzoni, F.; Civardi, S.; Libelli, N. Effects of Pre-Bloom Leaf Removal on Growth of Berry Tissues and Must Composition in Two Red Vitis Vinifera L. Cultivars. Aust J Grape Wine Res 2009, 15, 185–193. [Google Scholar] [CrossRef]
- Van Leeuwen, C.; Destrac-Irvine, A.; Dubernet, M.; Duchêne, E.; Gowdy, M.; Marguerit, E.; Pieri, P.; Parker, A.; De Rességuier, L.; Ollat, N. An Update on the Impact of Climate Change in Viticulture and Potential Adaptations. Agronomy 2019, Vol. 9, Page 514 2019, 9, 514. [Google Scholar] [CrossRef]
- Kliewer, W.M.; Dokoozlian, N.K. Leaf Area/Crop Weight Ratios of Grapevines: Influence on Fruit Composition and Wine Quality. Am J Enol Vitic 2005, 56, 170–181. [Google Scholar] [CrossRef]
- Parker, A.K.; Hofmann, R.W.; van Leeuwen, C.; Mclachlan, A.R.G.; Trought, M.C.T. Leaf Area to Fruit Mass Ratio Determines the Time of Veraison in Sauvignon Blanc and Pinot Noir Grapevines. Aust J Grape Wine Res 2014, 20, 422–431. [Google Scholar] [CrossRef]
- Parker, A.K.; Hofmann, R.W.; van Leeuwen, C.; Mclachlan, A.R.G.; Trought, M.C.T. Manipulating the Leaf Area to Fruit Mass Ratio Alters the Synchrony of Total Soluble Solids Accumulation and Titratable Acidity of Grape Berries. Aust J Grape Wine Res 2015, 21, 266–276. [Google Scholar] [CrossRef]
- Chemical, J.; Han, S.; Yang, J.; Choi, K.; Kim, J.; Adhikari, K.; Lee, J. Chemical Analysis of Commercial White Wines and Its Relationship with Consumer Acceptability. Foods 2022, Vol. 11, Page 603 2022, 11, 603. [Google Scholar] [CrossRef]
- Poni, S.; Gatti, M.; Bernizzoni, F.; Civardi, S.; Bobeica, N.; Magnanini, E.; Palliotti, A. Late Leaf Removal Aimed at Delaying Ripening in Cv. Sangiovese: Physiological Assessment and Vine Performance. Aust J Grape Wine Res 2013, 19, 378–387. [CrossRef]
- Palliotti, A.; Panara, F.; Silvestroni, O.; Lanari, V.; Sabbatini, P.; Howell, G.S.; Gatti, M.; Poni, S. Influence of Mechanical Postveraison Leaf Removal Apical to the Cluster Zone on Delay of Fruit Ripening in Sangiovese (Vitis Vinifera L.) Grapevines. Aust J Grape Wine Res 2013, 19, 369–377. [CrossRef]
- De Bei, R.; Wang, X.; Papagiannis, L.; Cocco, M.; O’Brien, P.; Zito, M.; Ouyang, J.; Fuentes, S.; Gilliham, M.; Tyerman, S.; et al. Postveraison Leaf Removal Does Not Consistently Delay Ripening in Semillon and Shiraz in a Hot Australian Climate. Am J Enol Vitic 2019, 70, 398–410. [Google Scholar] [CrossRef]
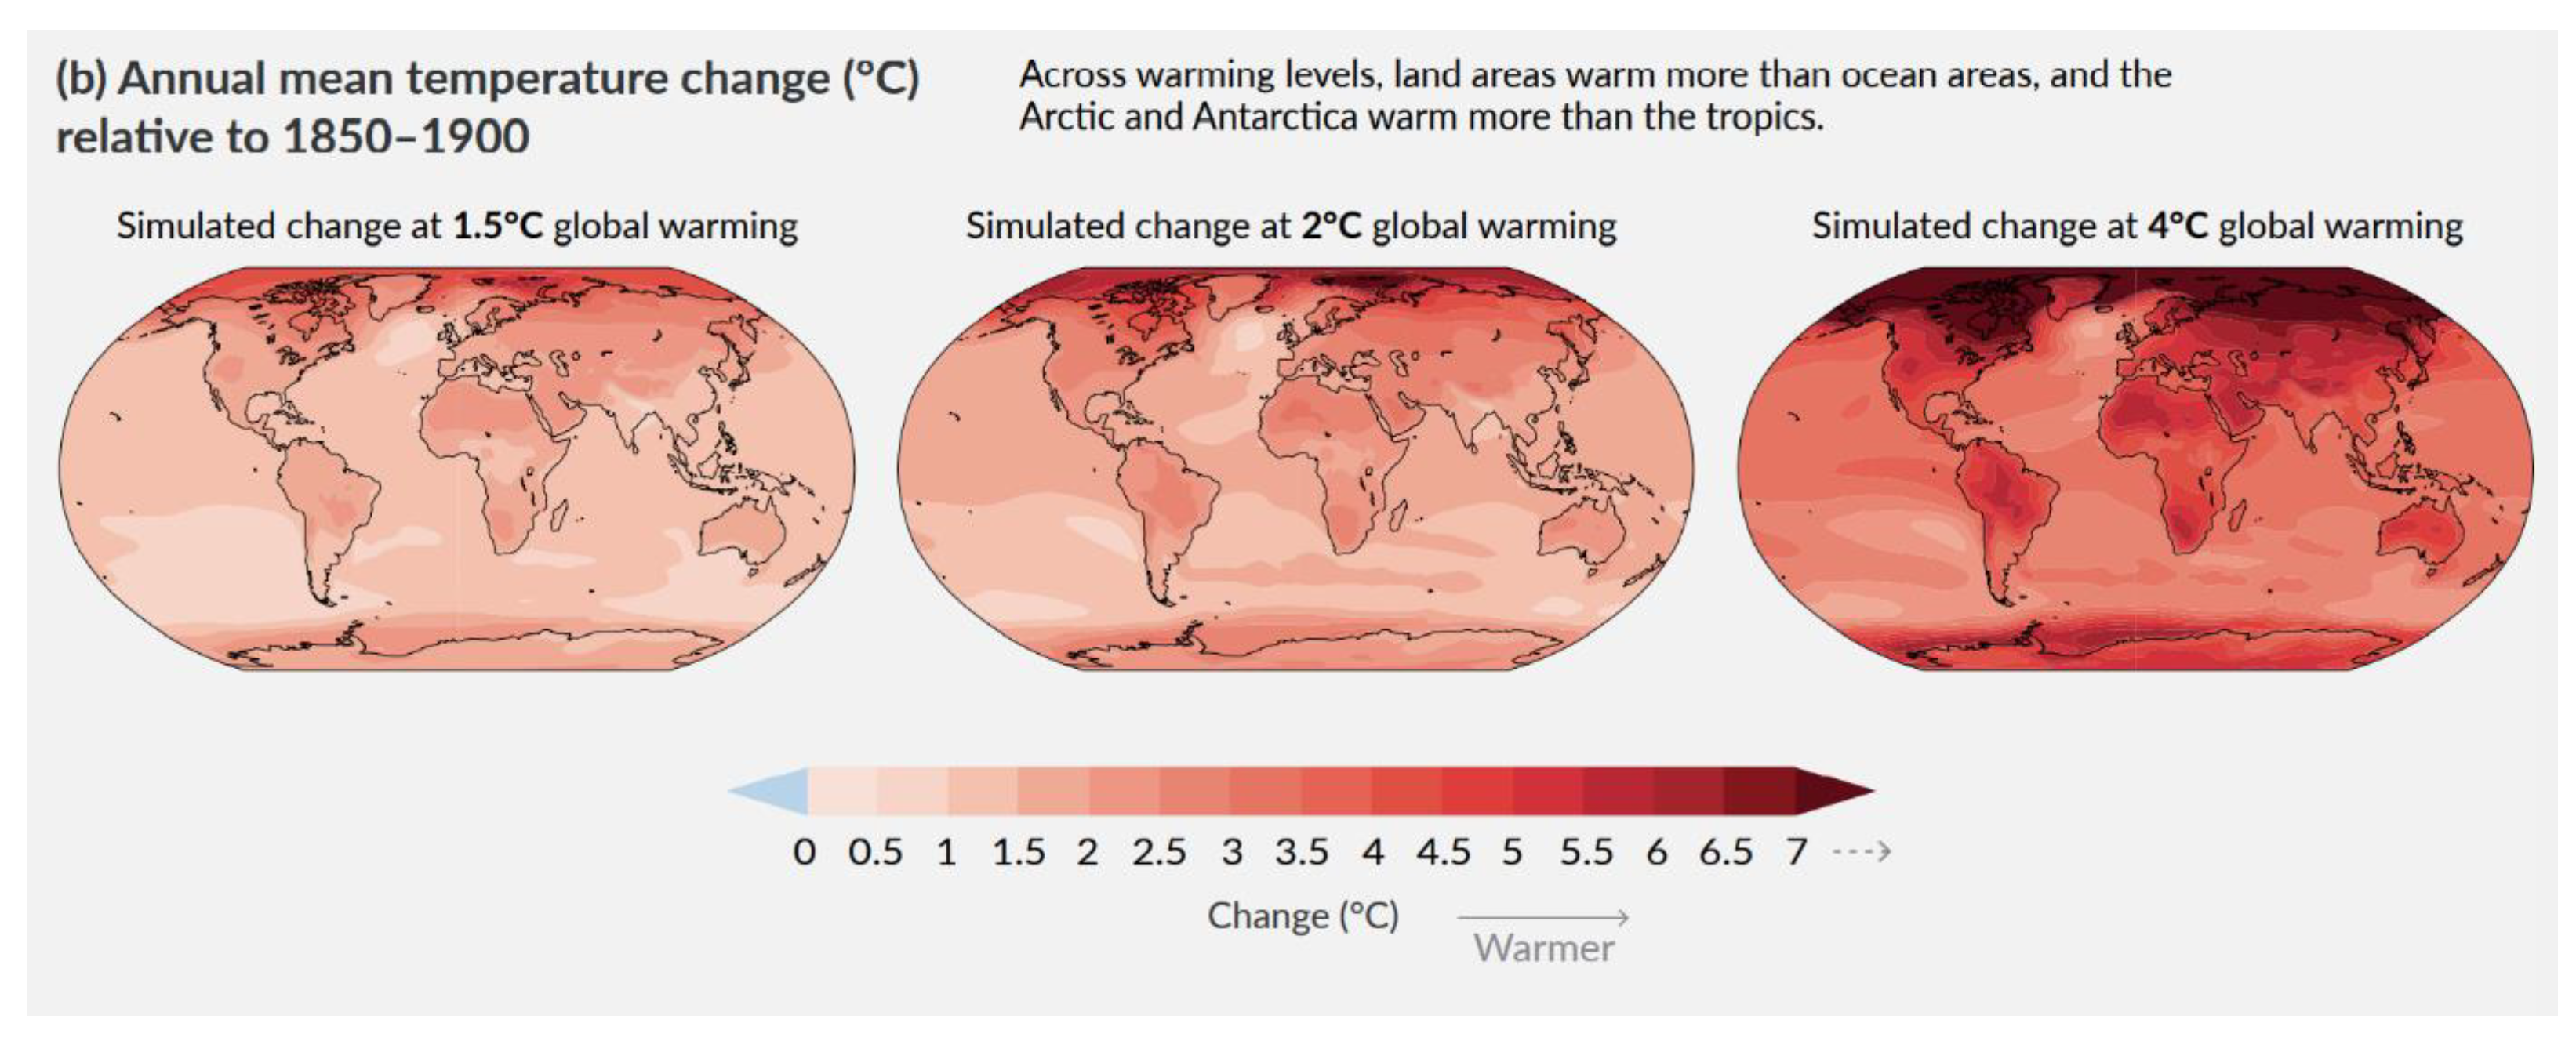
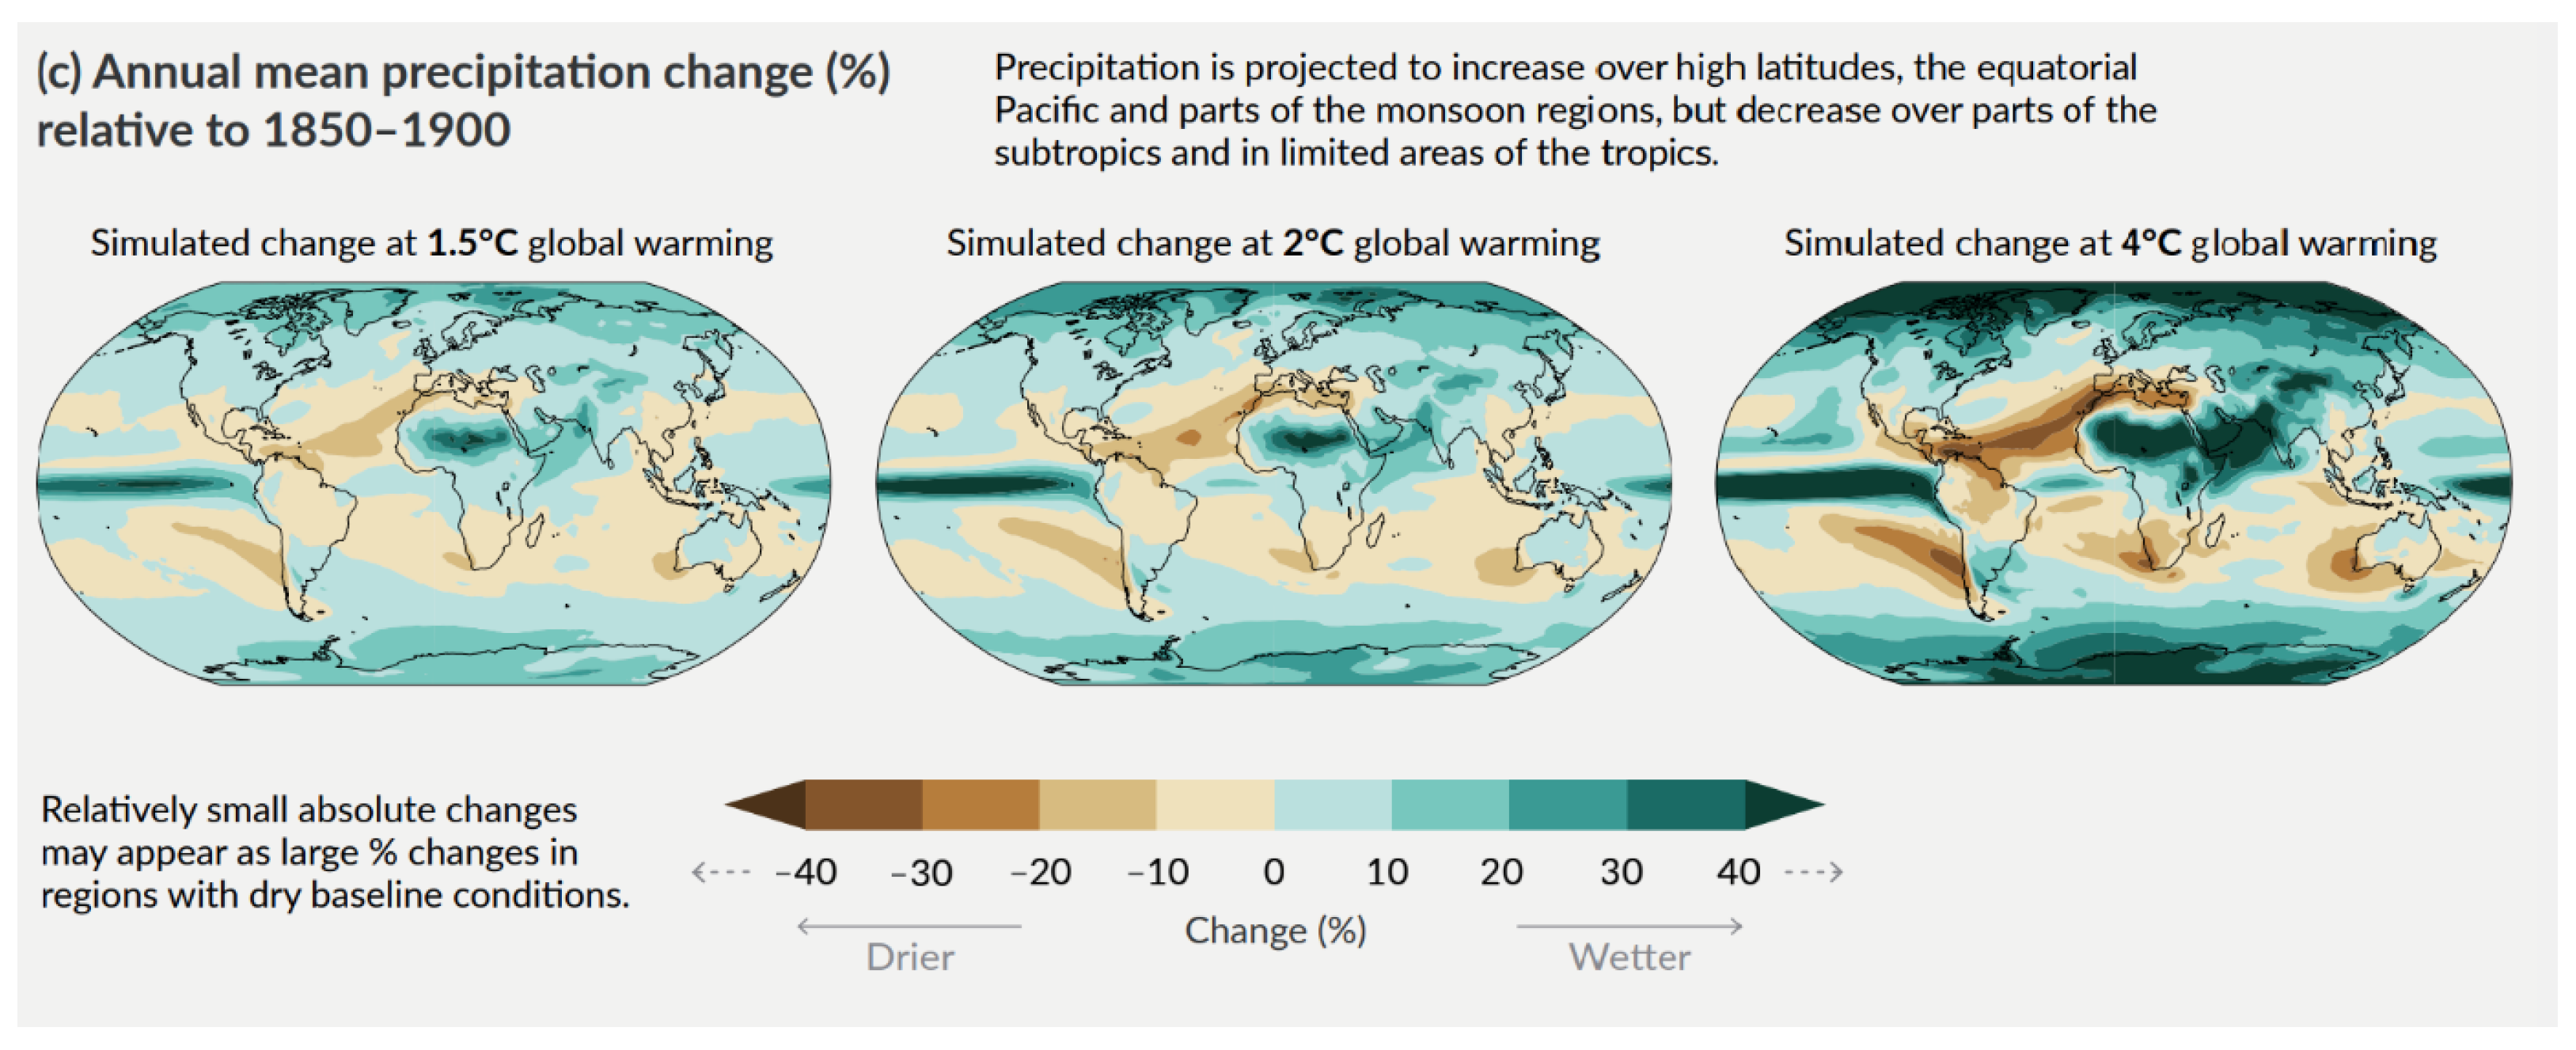
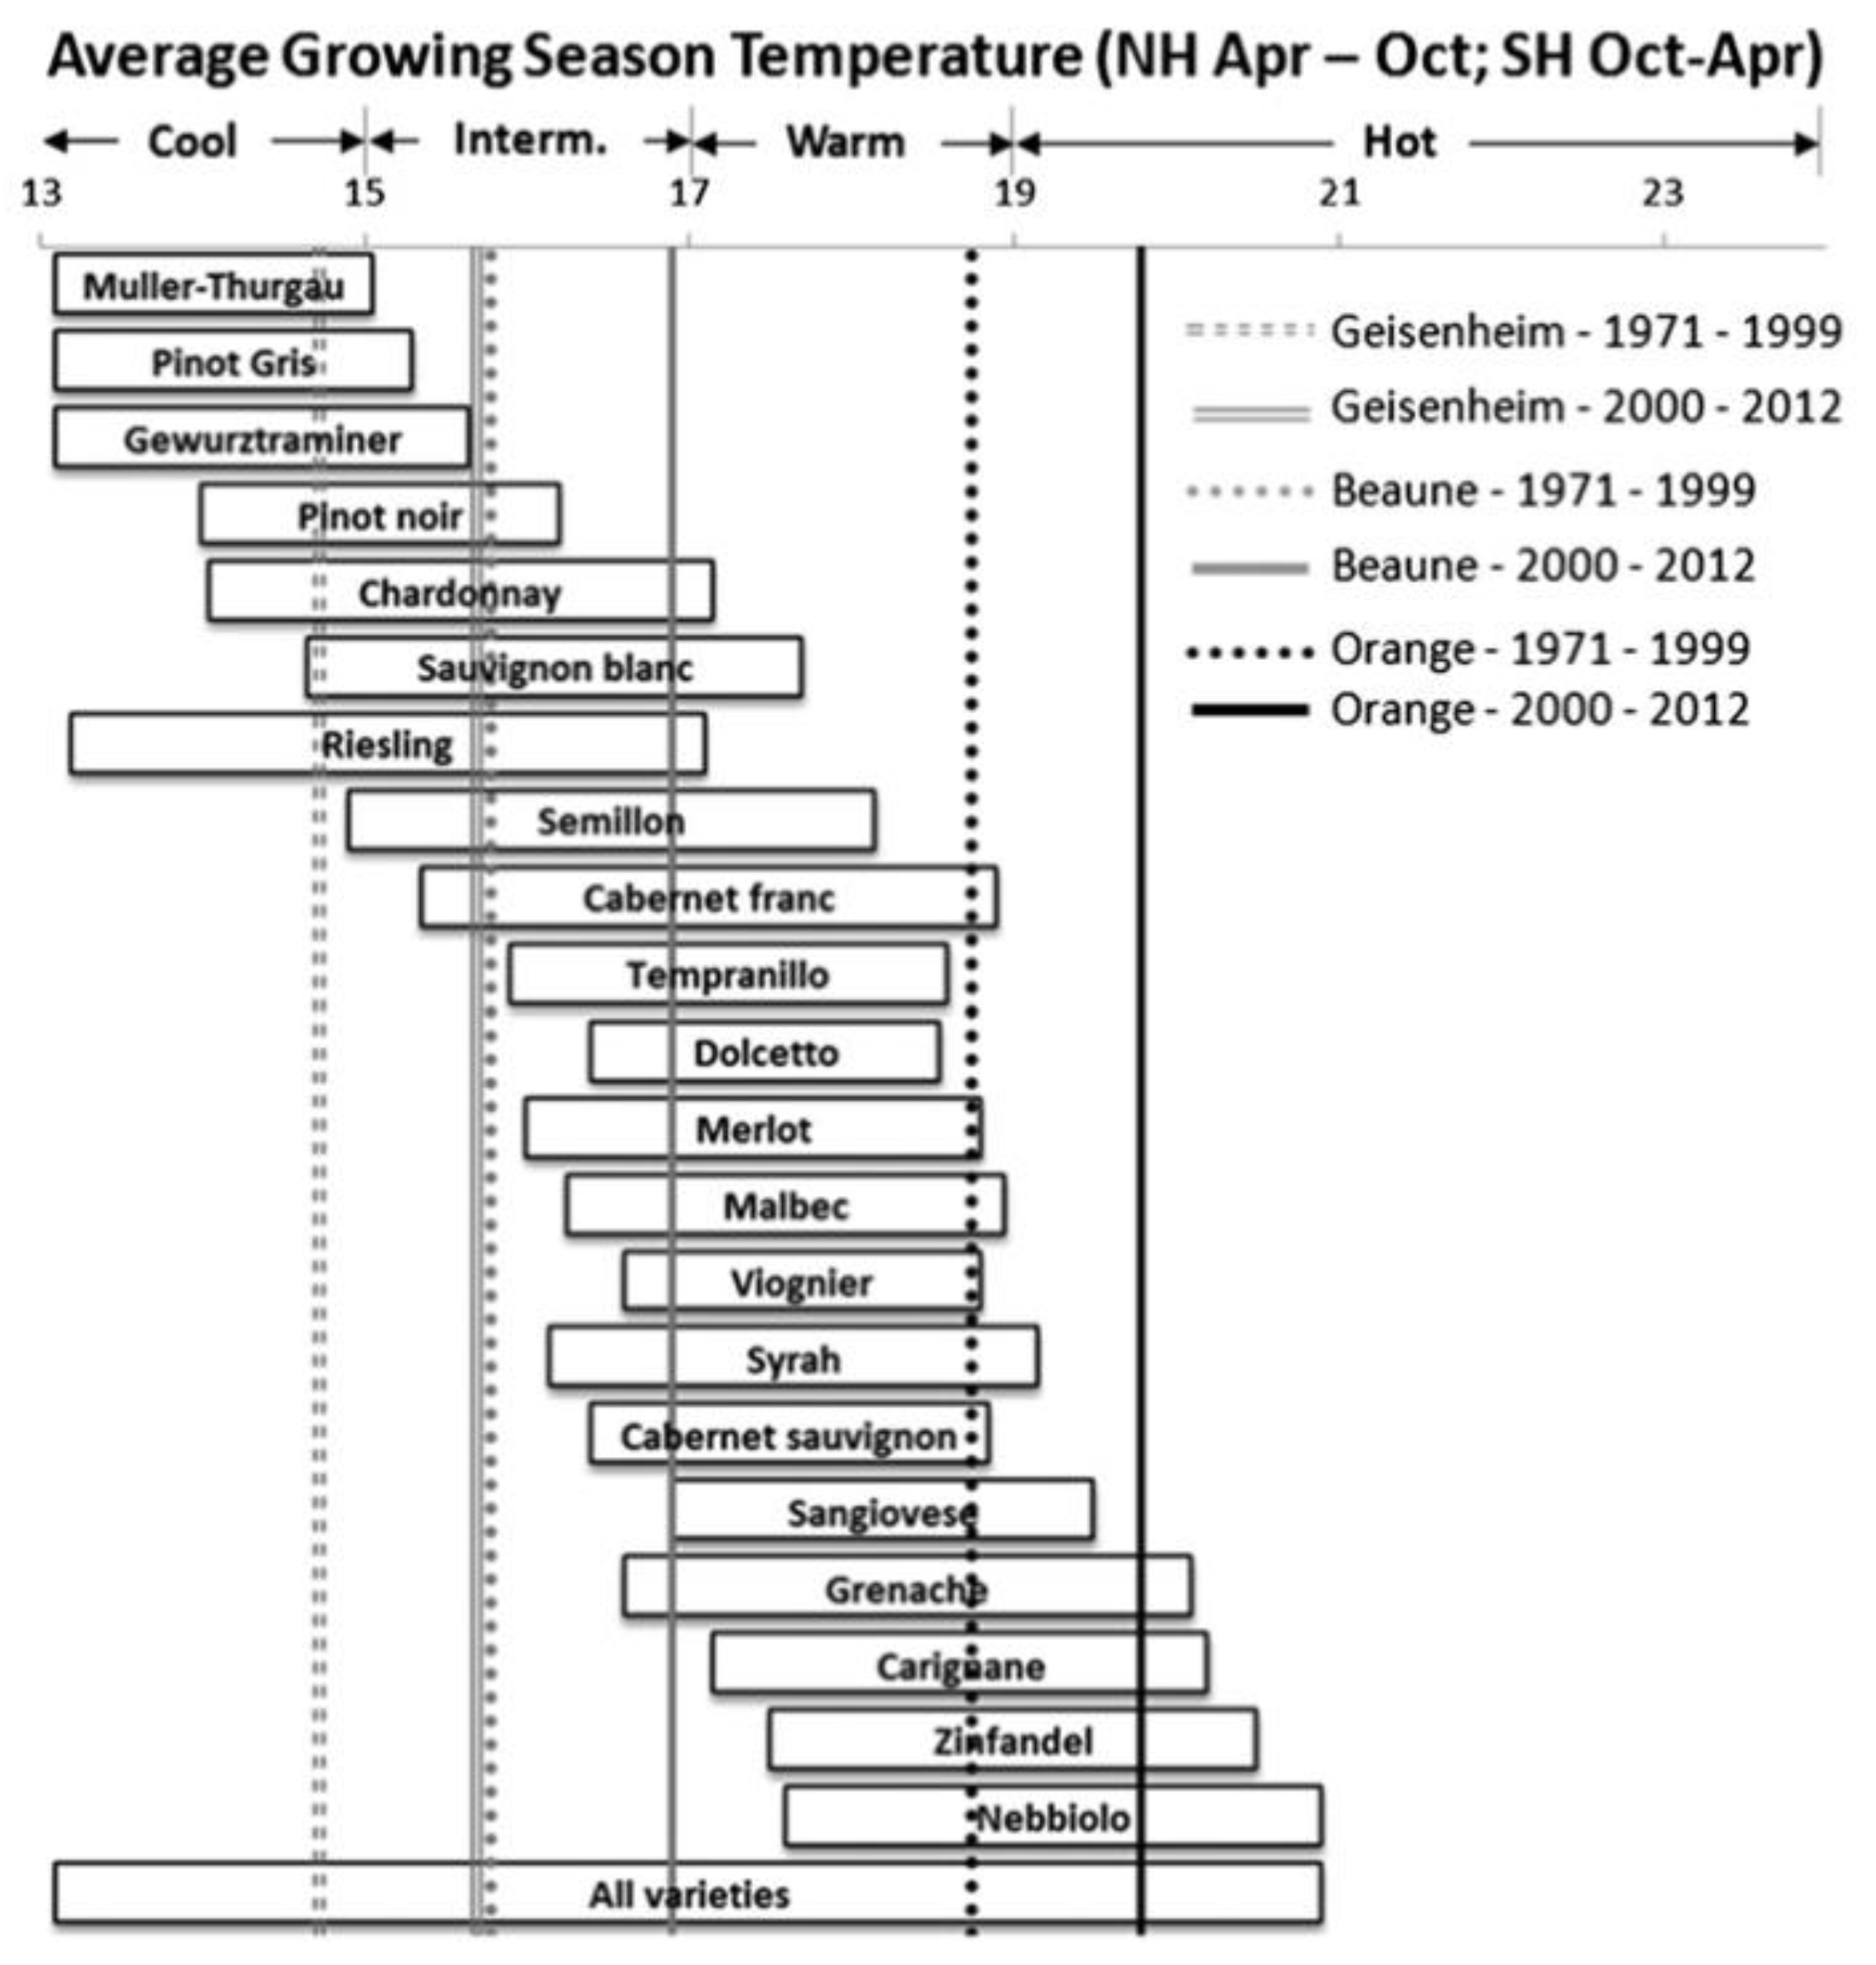
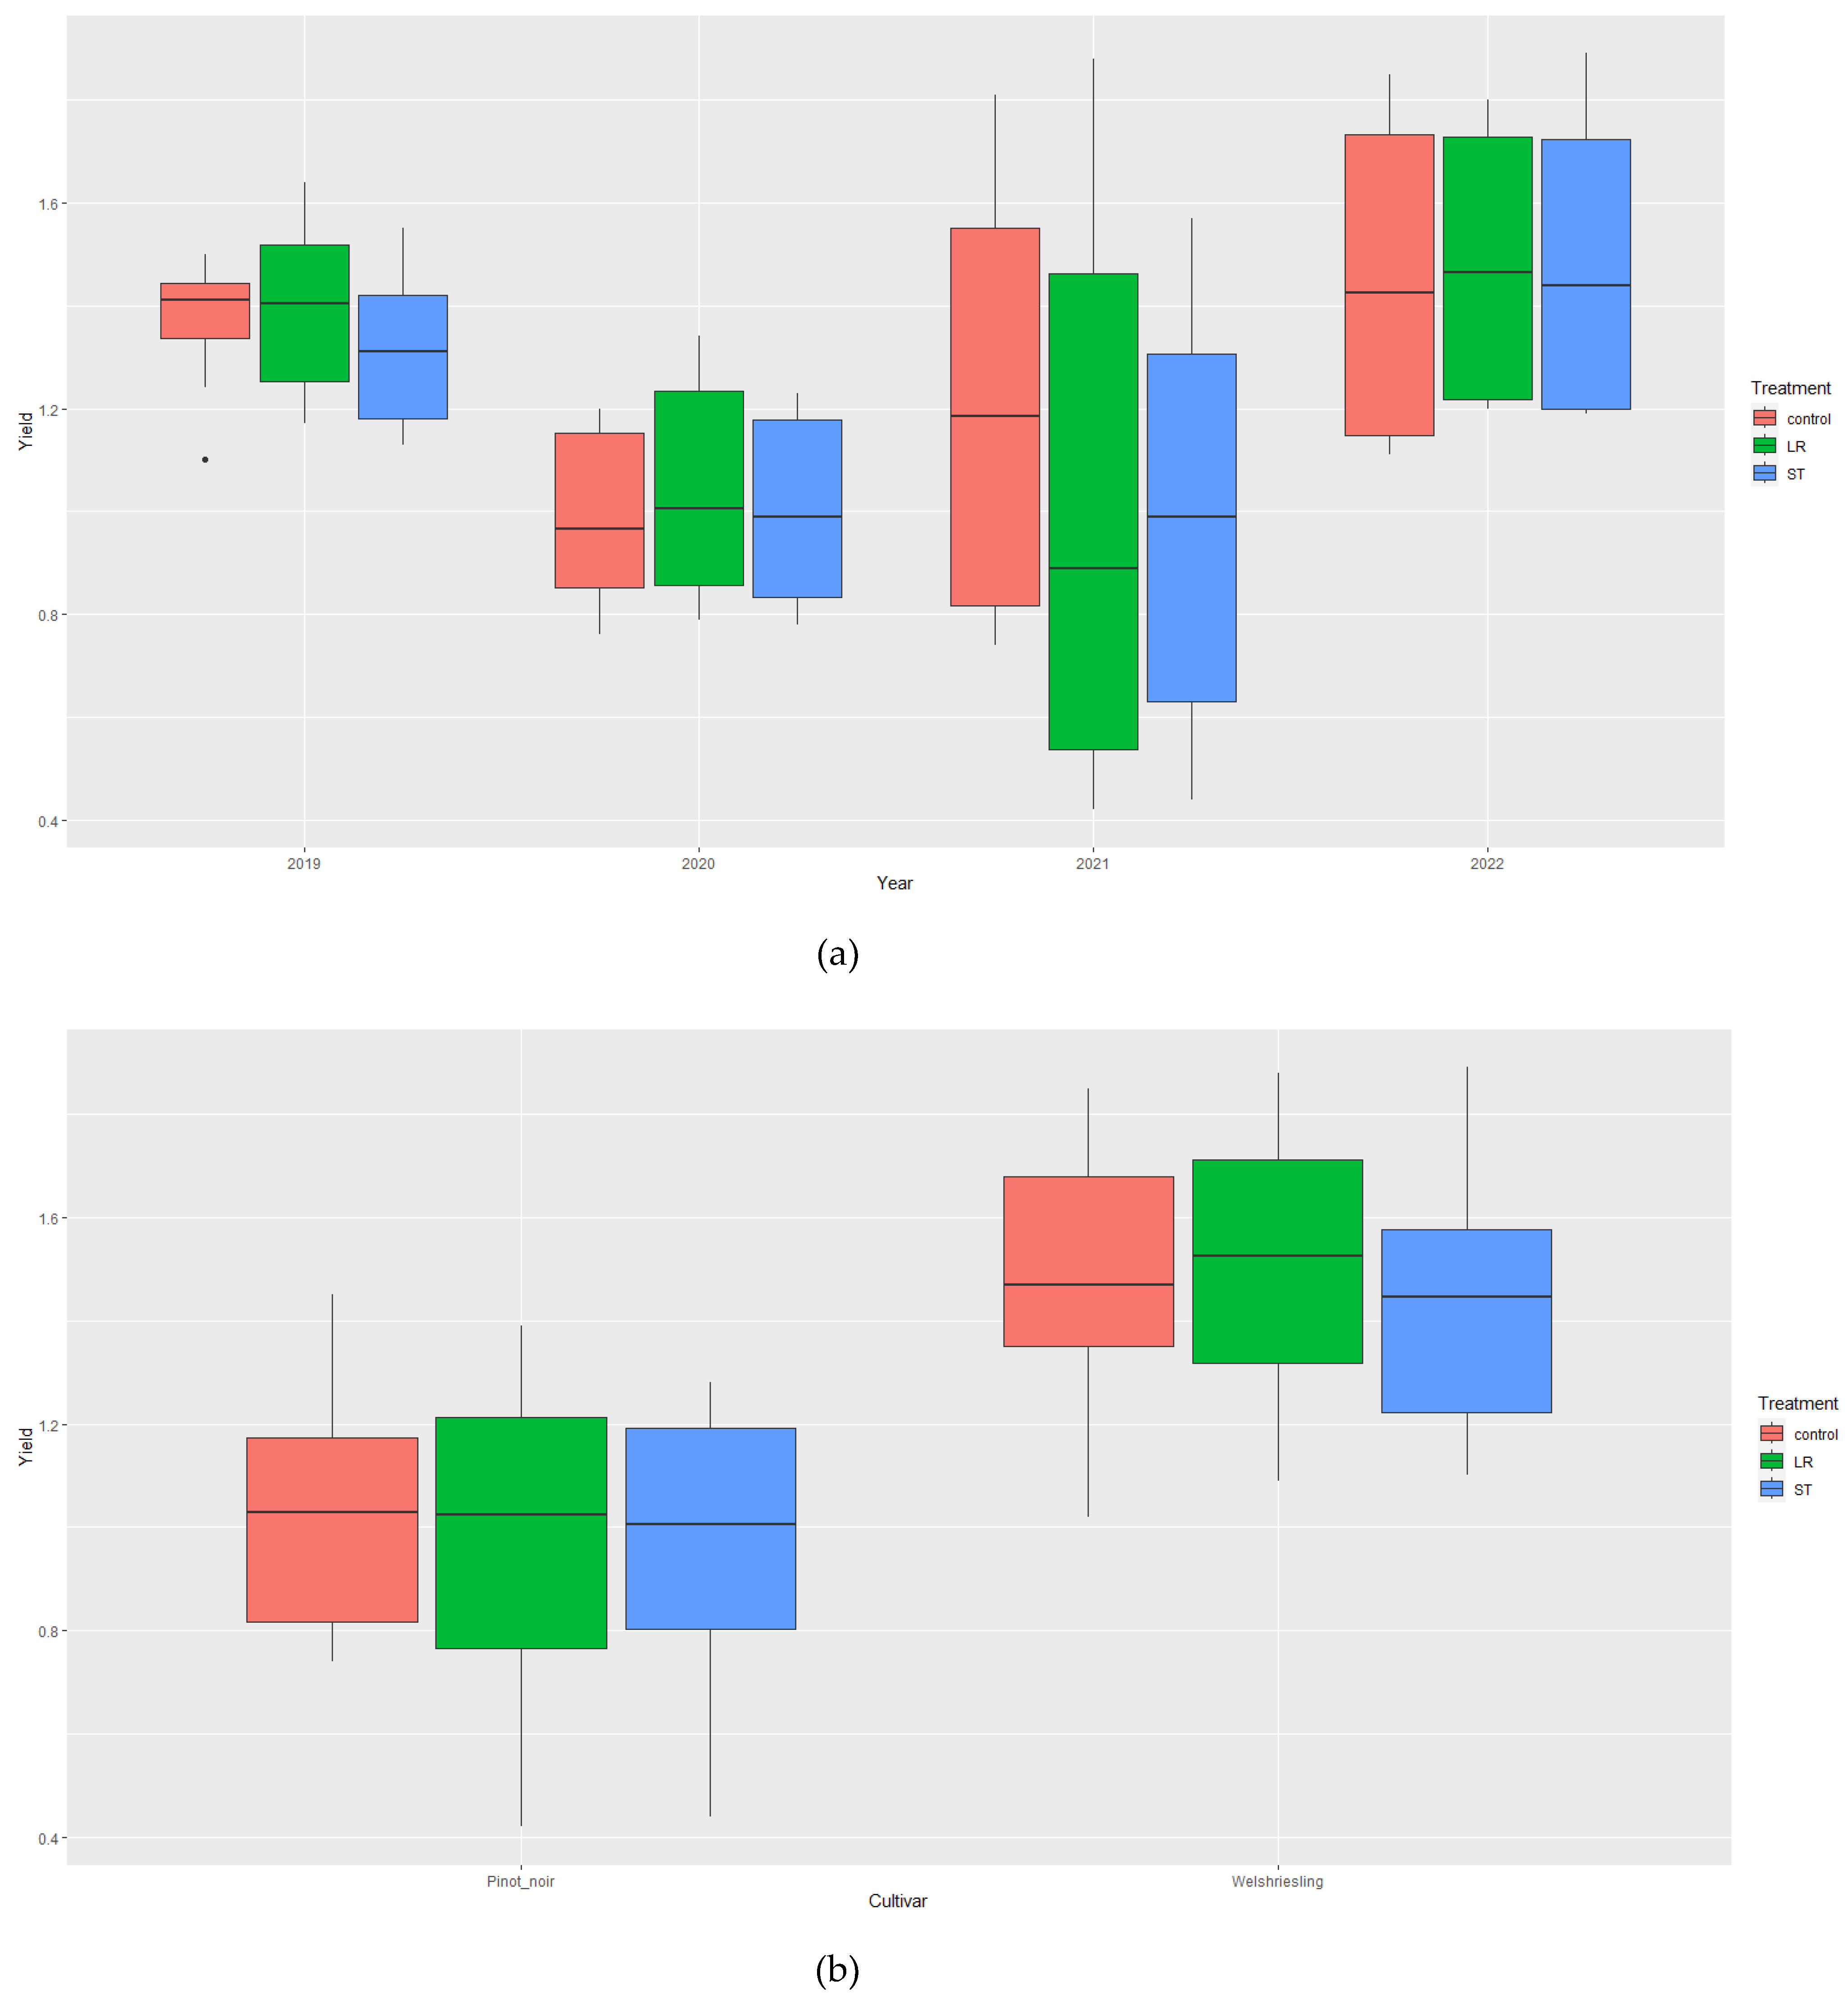
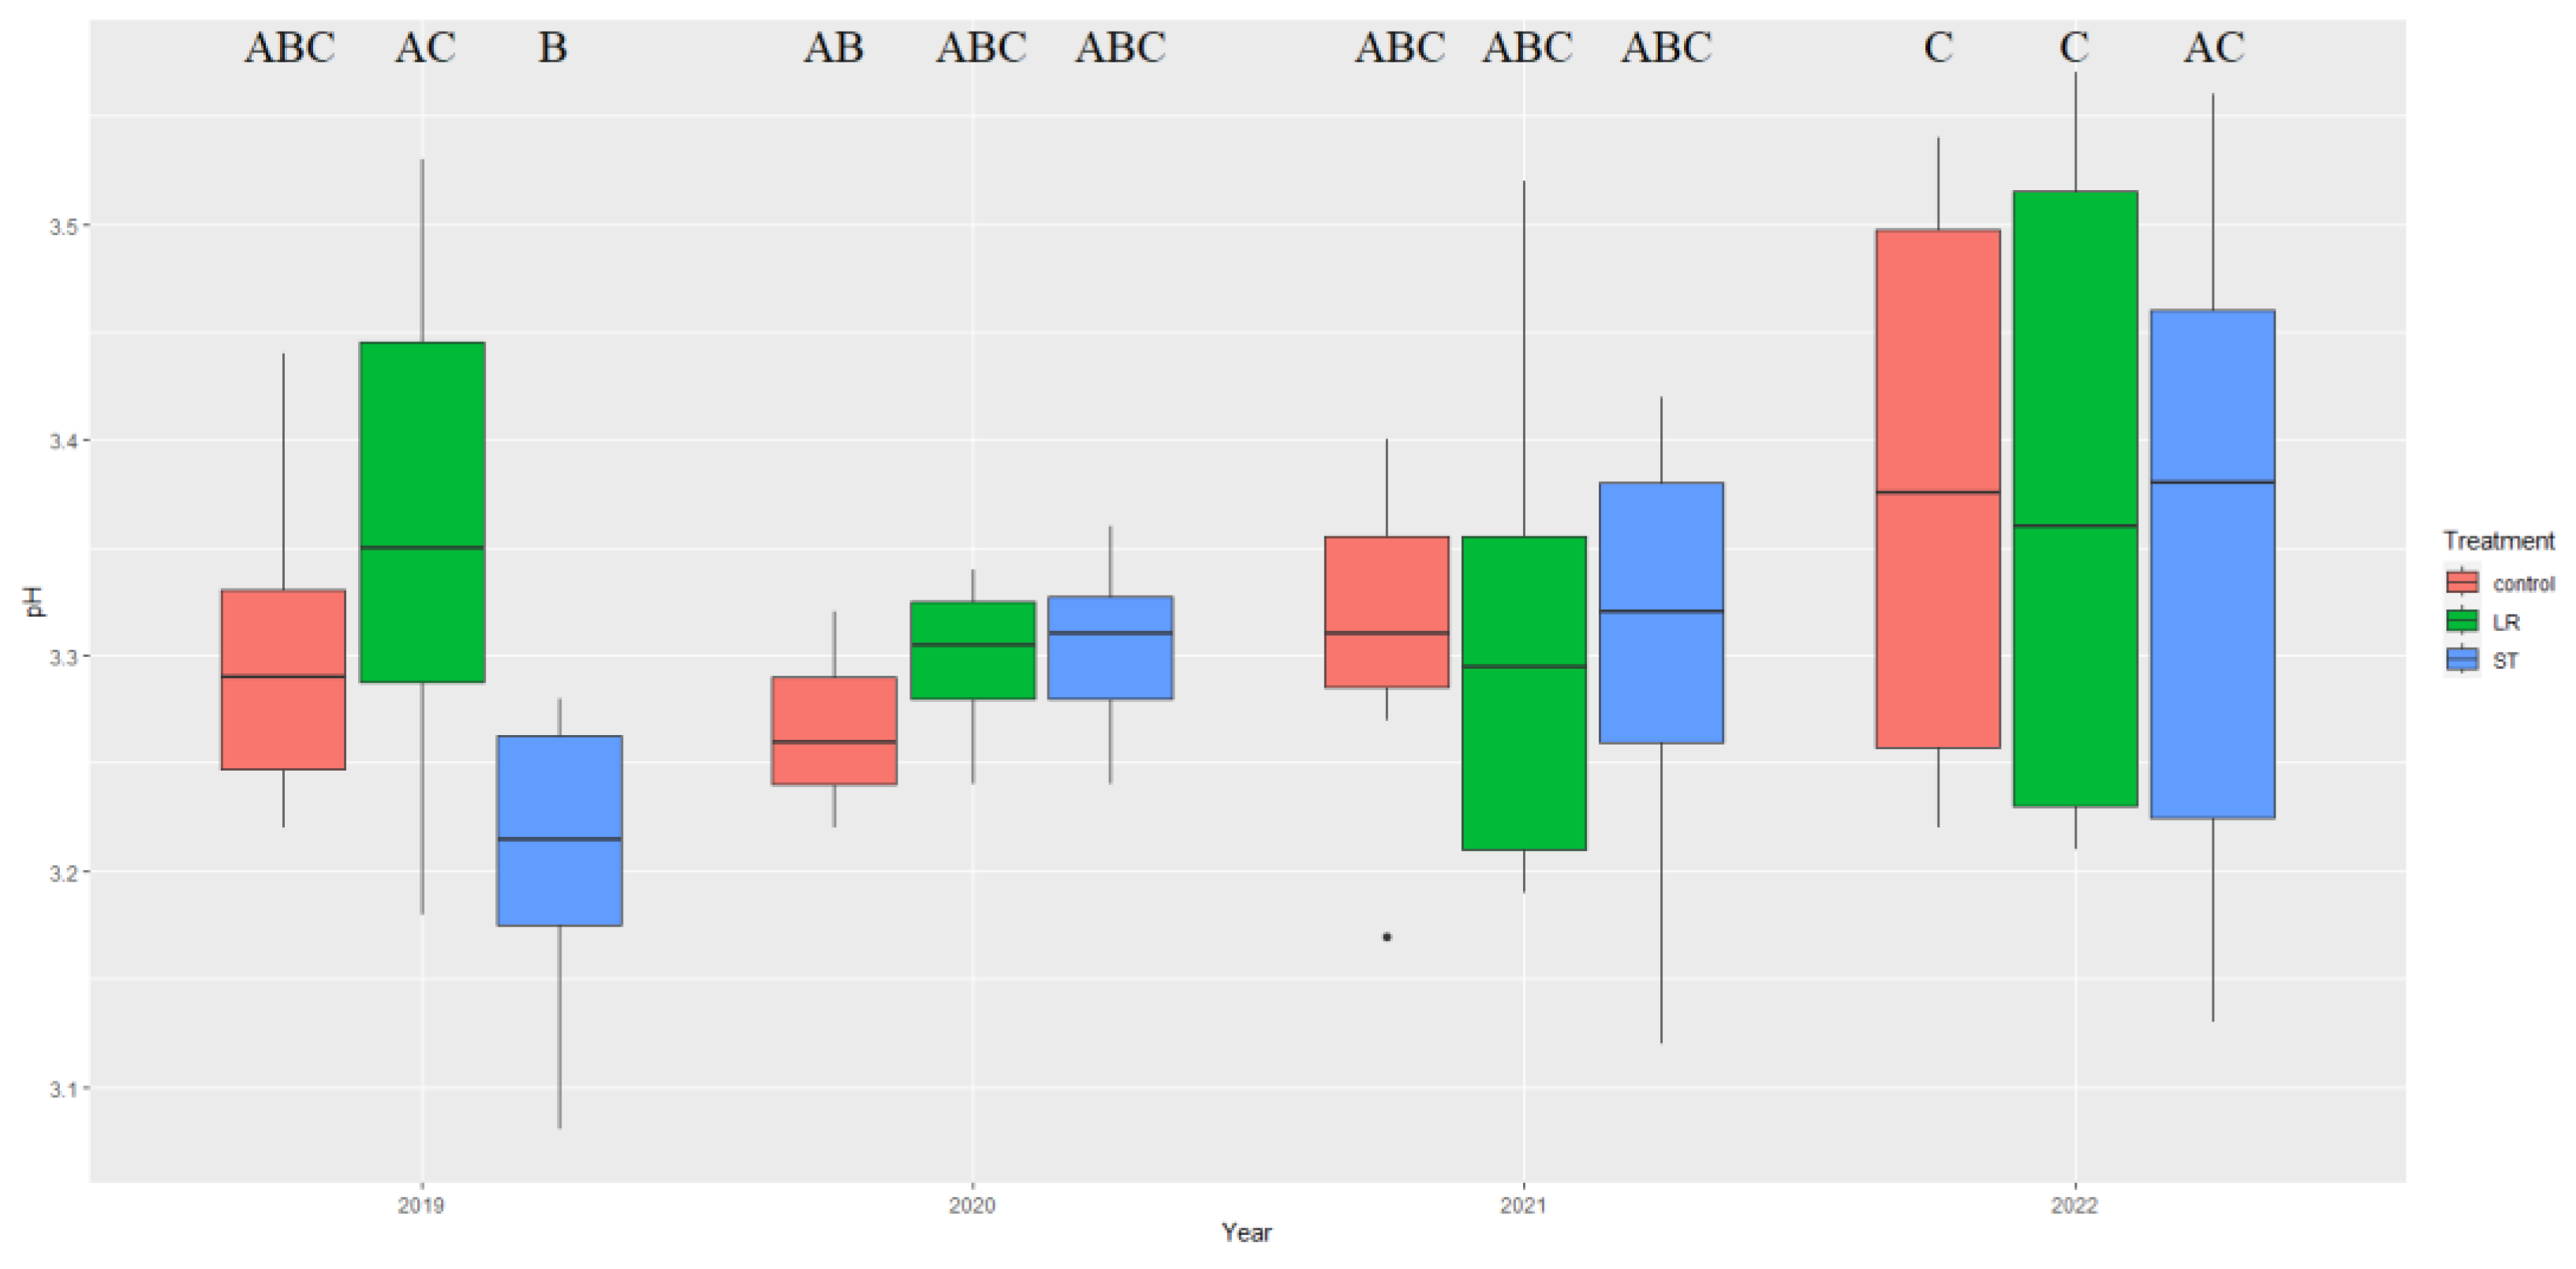
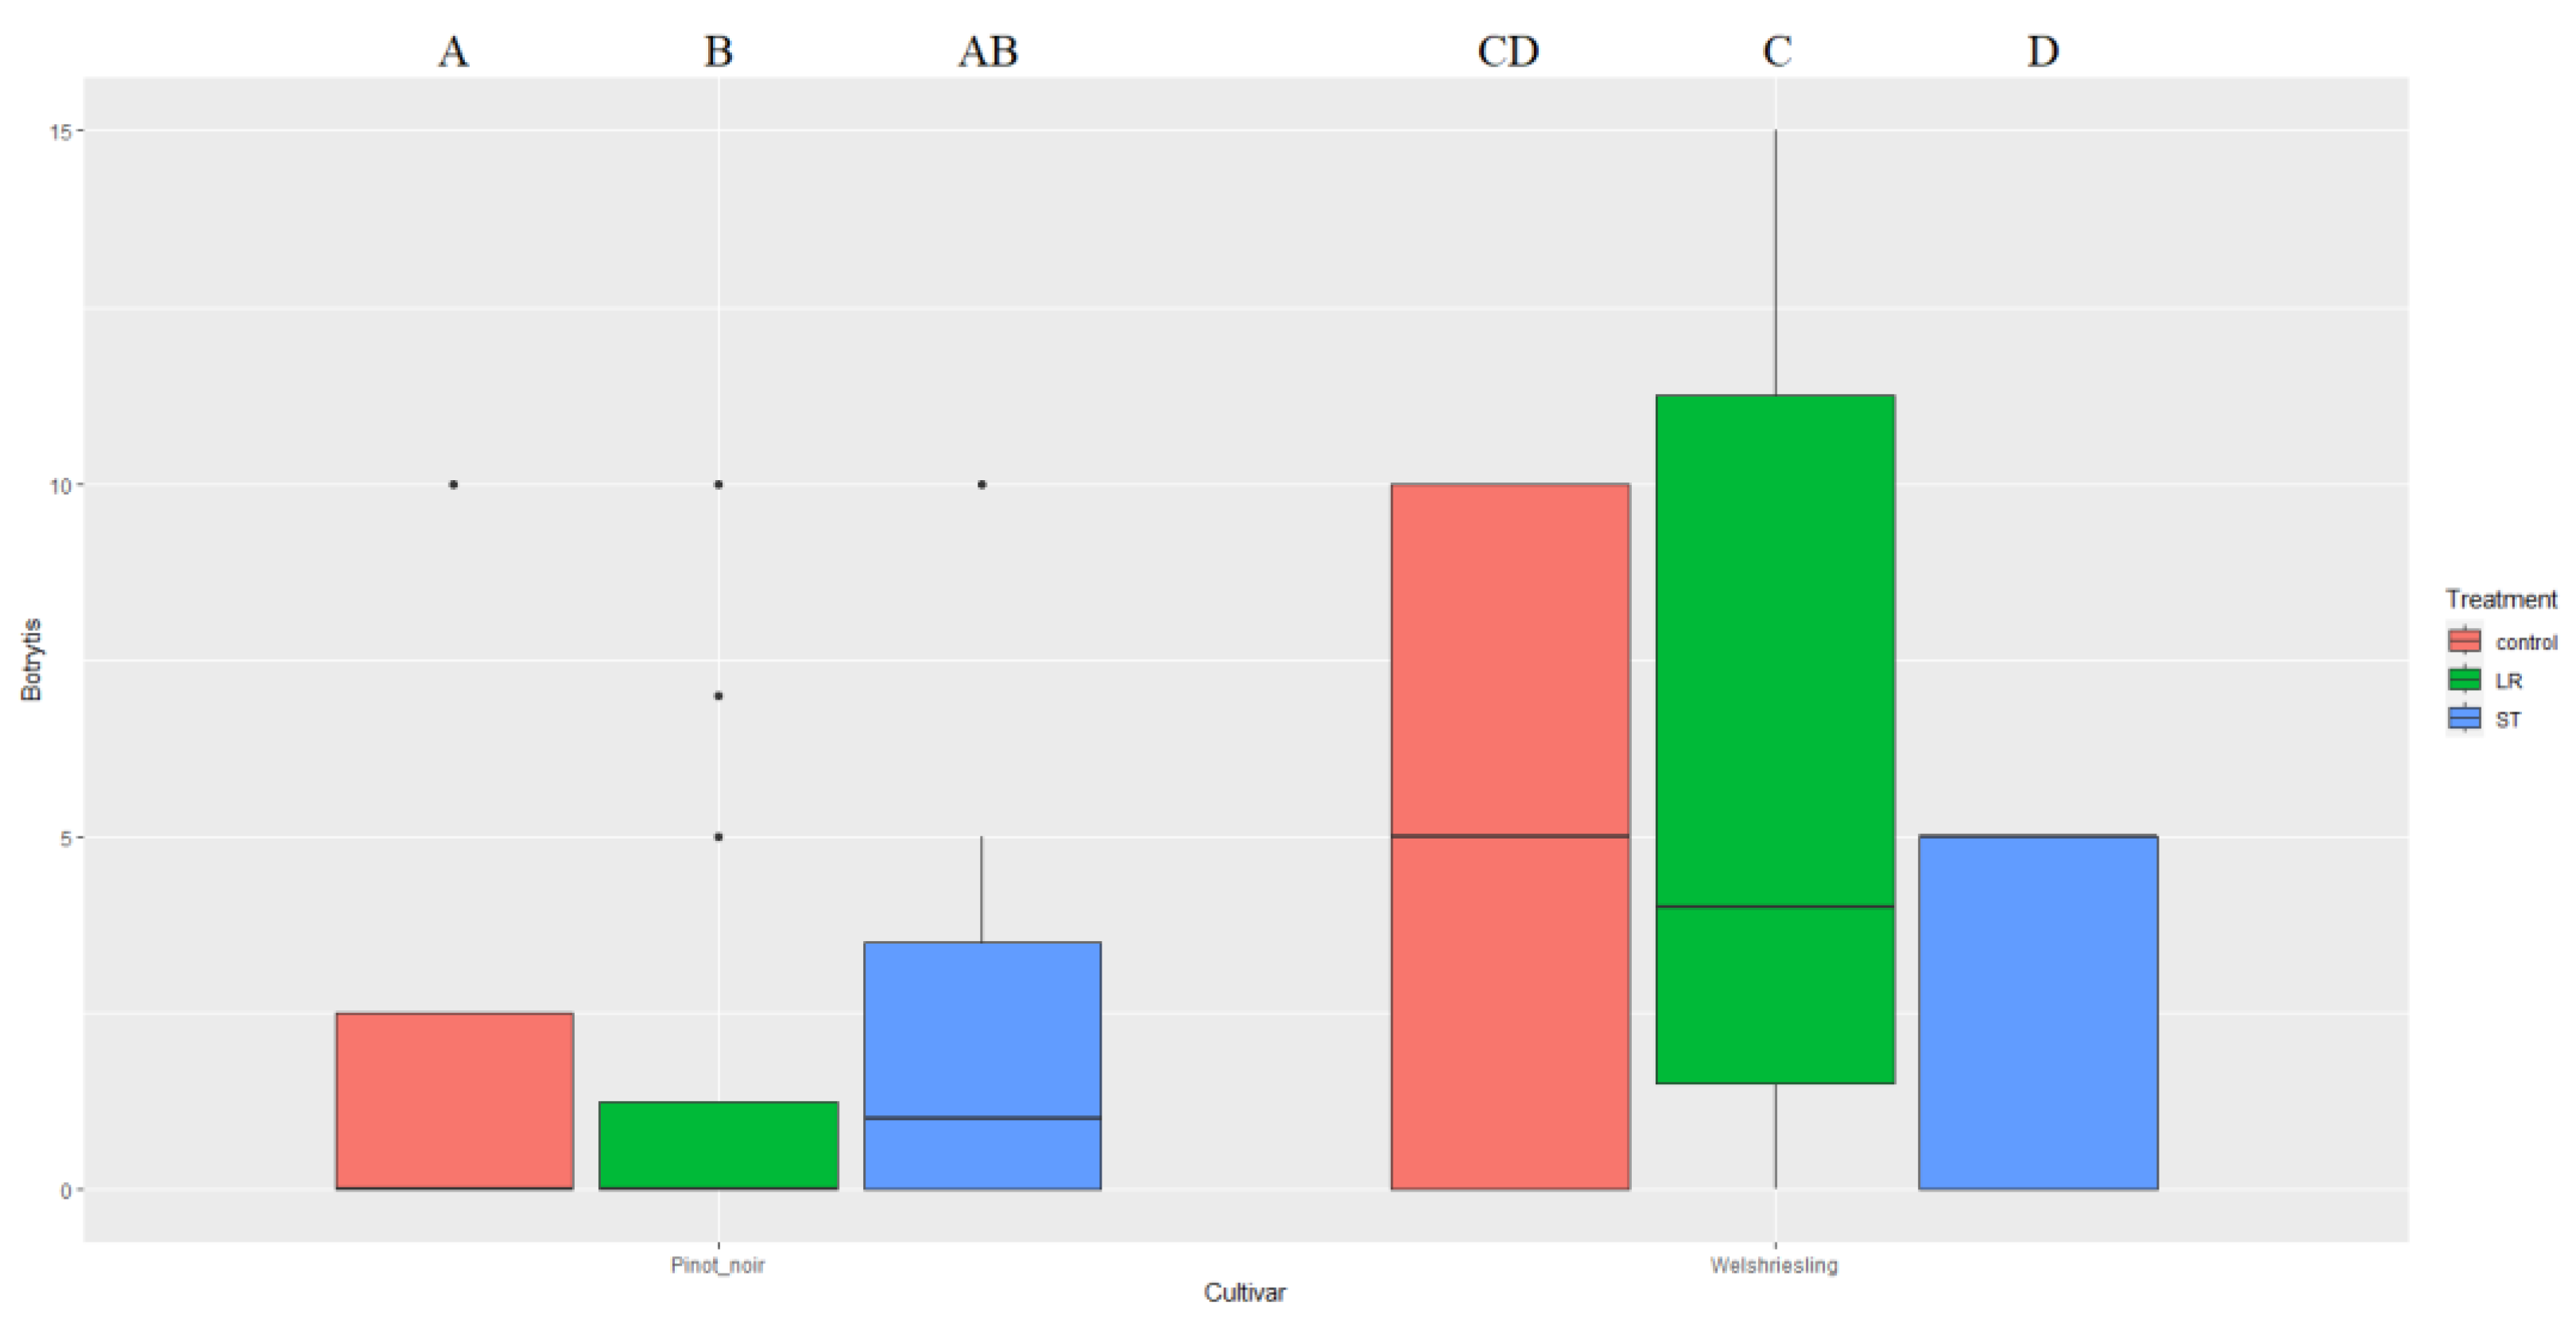


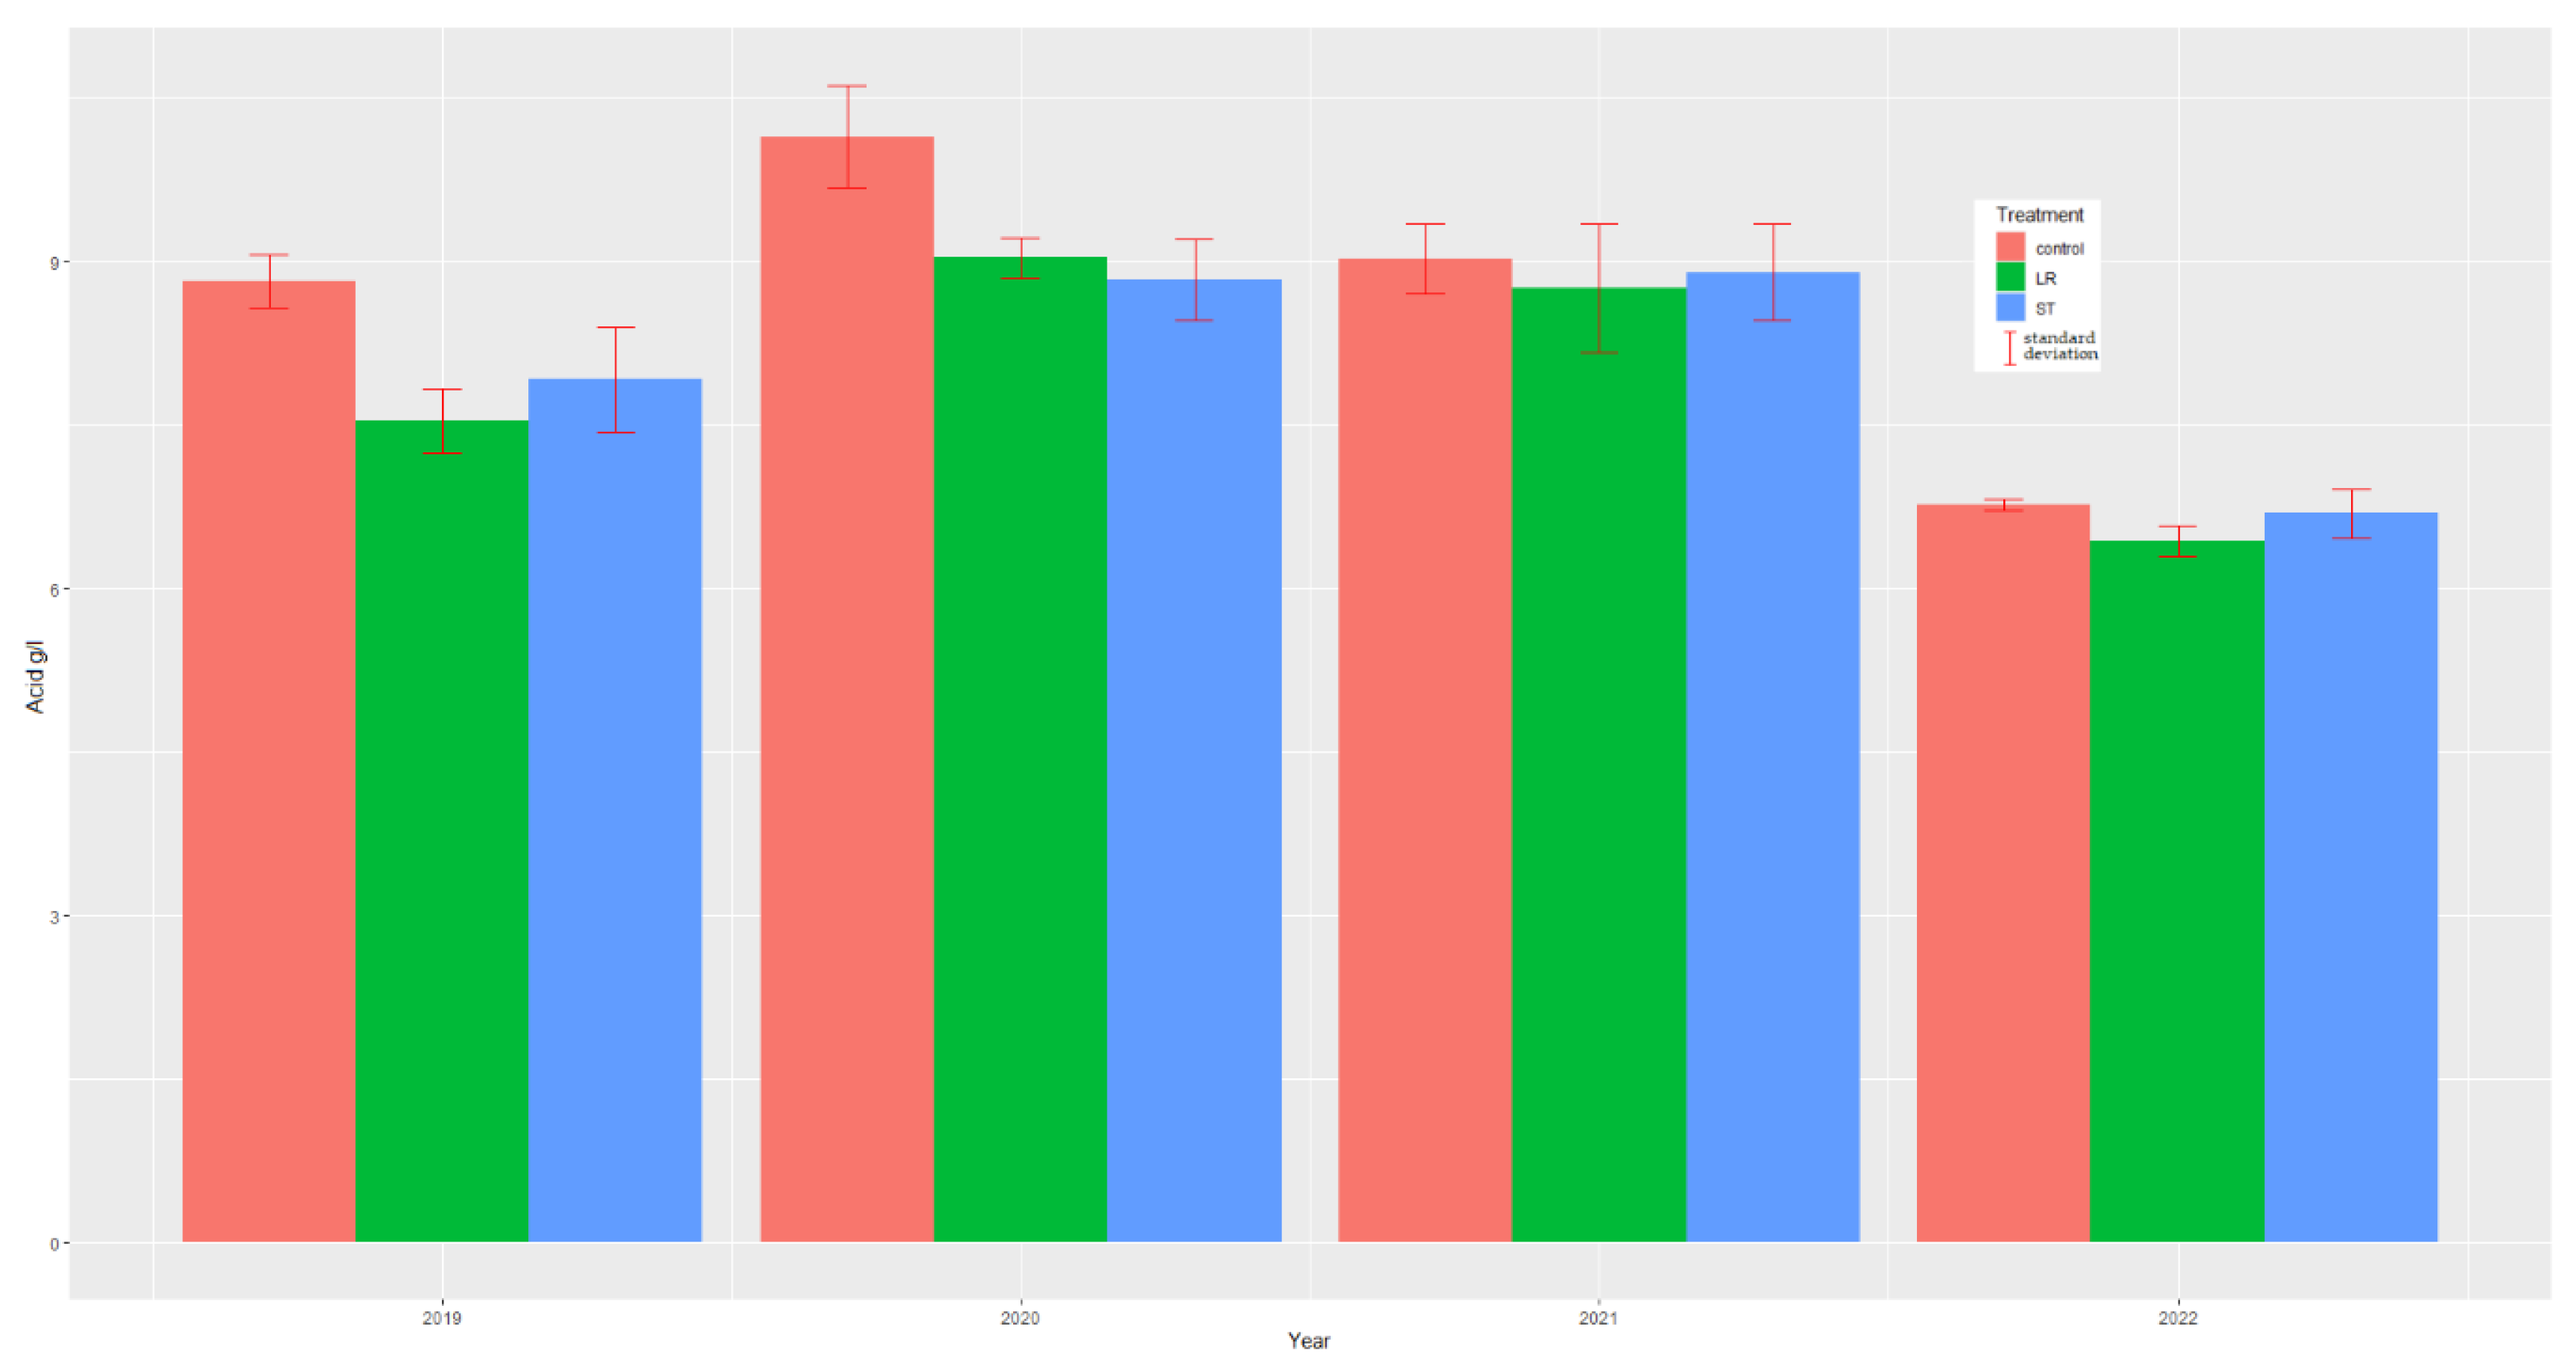
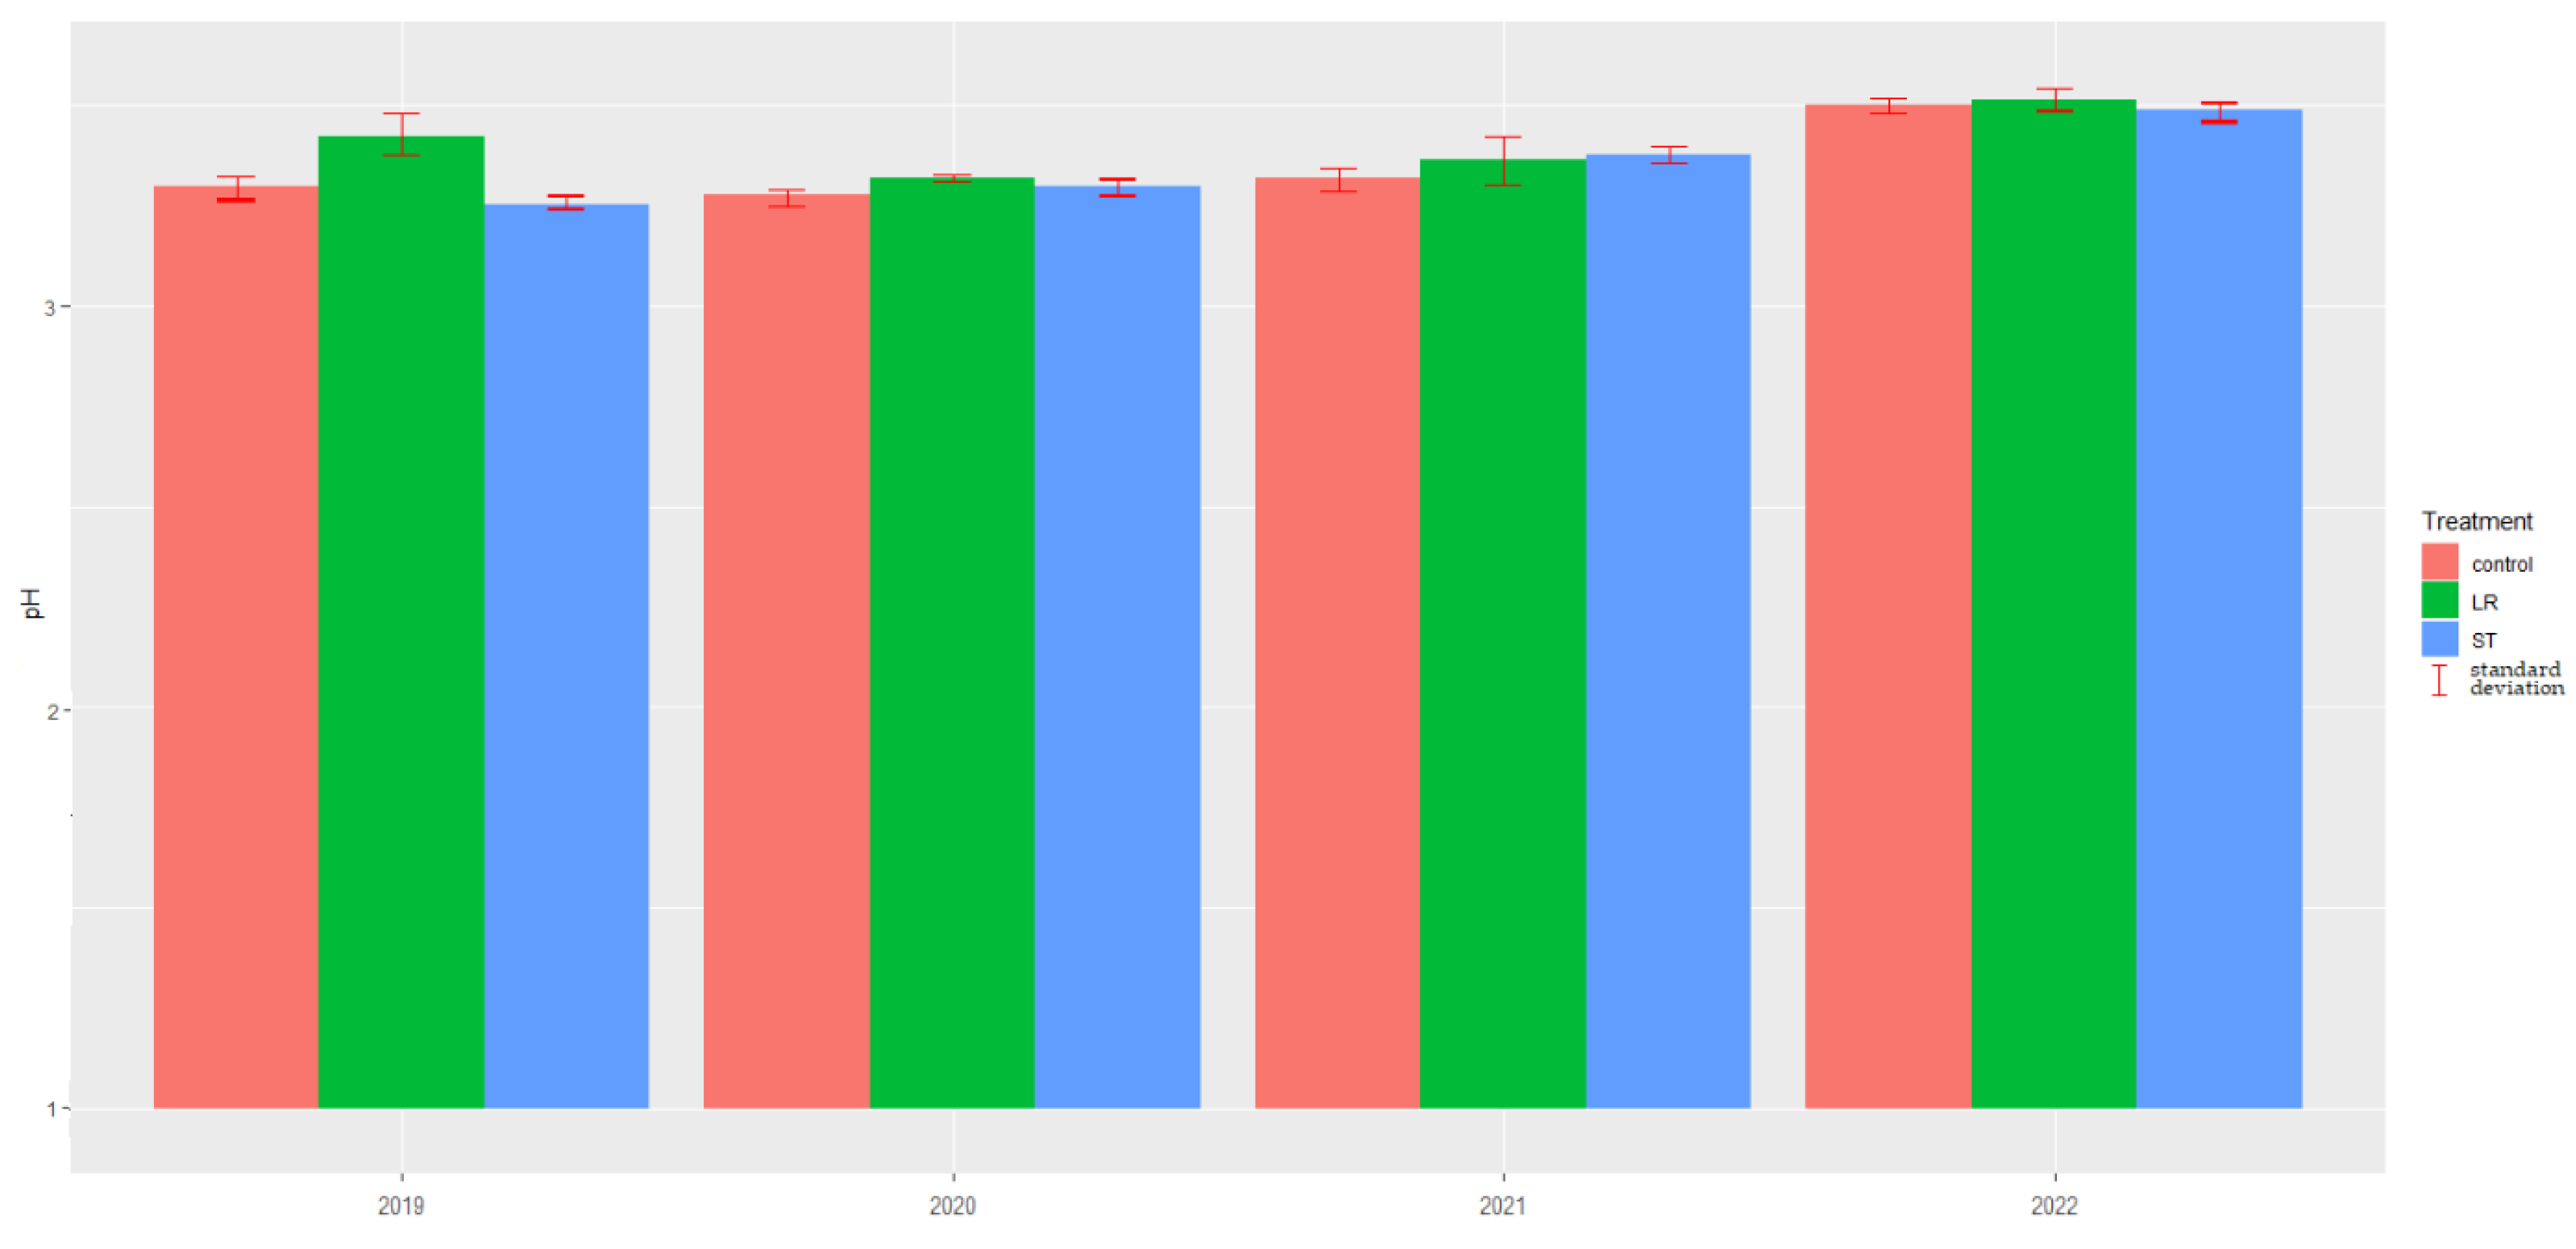
| Cultivar | Pinot noir | Welschriesling | Yearly statistics |
||||
|---|---|---|---|---|---|---|---|
| Year | Control | Short Topping |
Leaf Removal |
Control | Short Topping |
Leaf Removal |
|
| 2019 | 1.10 | 1.18 | 1.20 | 1.42 | 1.51 | 1.42 | |
| 1.45 | 1.26 | 1.17 | 1.44 | 1.55 | 1.51 | ||
| 1.24 | 1.18 | 1.27 | 1.40 | 1.36 | 1.64 | ||
| 1.37 | 1.13 | 1.39 | 1.50 | 1.39 | 1.54 | ||
| Average | 1.29 | 1.19 | 1.26 | 1.44 | 1.45 | 1.53 | 1.36 |
| Variance | 0.0235 | 0.0029 | 0.0096 | 0.0019 | 0.0084 | 0.0082 | 0.0224 |
| 2020 | 0.91 | 0.78 | 0.82 | 1.2 | 1.2 | 1.25 | |
| 0.76 | 0.88 | 0.88 | 1.19 | 1.23 | 1.34 | ||
| 0.77 | 0.84 | 0.79 | 1.14 | 1.1 | 1.13 | ||
| 0.88 | 0.81 | 0.87 | 1.02 | 1.17 | 1.23 | ||
| Average | 0.83 | 0.8275 | 0.84 | 1.1375 | 1.175 | 1.2375 | 1.01 |
| Variance | 0.0058 | 0.0018 | 0.0018 | 0.0068 | 0.0031 | 0.0074 | 0.0365 |
| 2021 | 0.81 | 0.63 | 0.42 | 1.67 | 1.57 | 1.68 | |
| 0.82 | 0.44 | 0.56 | 1.51 | 1.24 | 1.09 | ||
| 0.96 | 0.63 | 0.47 | 1.41 | 1.5 | 1.88 | ||
| 0.74 | 0.82 | 0.69 | 1.81 | 1.16 | 1.39 | ||
| Average | 0.8325 | 0.63 | 0.535 | 1.6 | 1.3675 | 1.51 | 1.08 |
| Variance | 0.0085 | 0.0241 | 0.0140 | 0.0311 | 0.0393 | 0.1189 | 0.2218 |
| 2022 | 1.15 | 1.20 | 1.22 | 1.8 | 1.89 | 1.75 | |
| 1.14 | 1.28 | 1.21 | 1.85 | 1.82 | 1.71 | ||
| 1.24 | 1.19 | 1.22 | 1.61 | 1.69 | 1.80 | ||
| 1.11 | 1.20 | 1.20 | 1.71 | 1.60 | 1.72 | ||
| Average | 1.16 | 1.2175 | 1.2125 | 1.7425 | 1.75 | 1.745 | 1.47 |
| Variance | 0.0031 | 0.0018 | 0.0001 | 0.0112 | 0.0169 | 0.0016 | 0.0836 |
| Average | 0.99 | 1.47 | |||||
| Variance | 0.07 | 0.06 | |||||
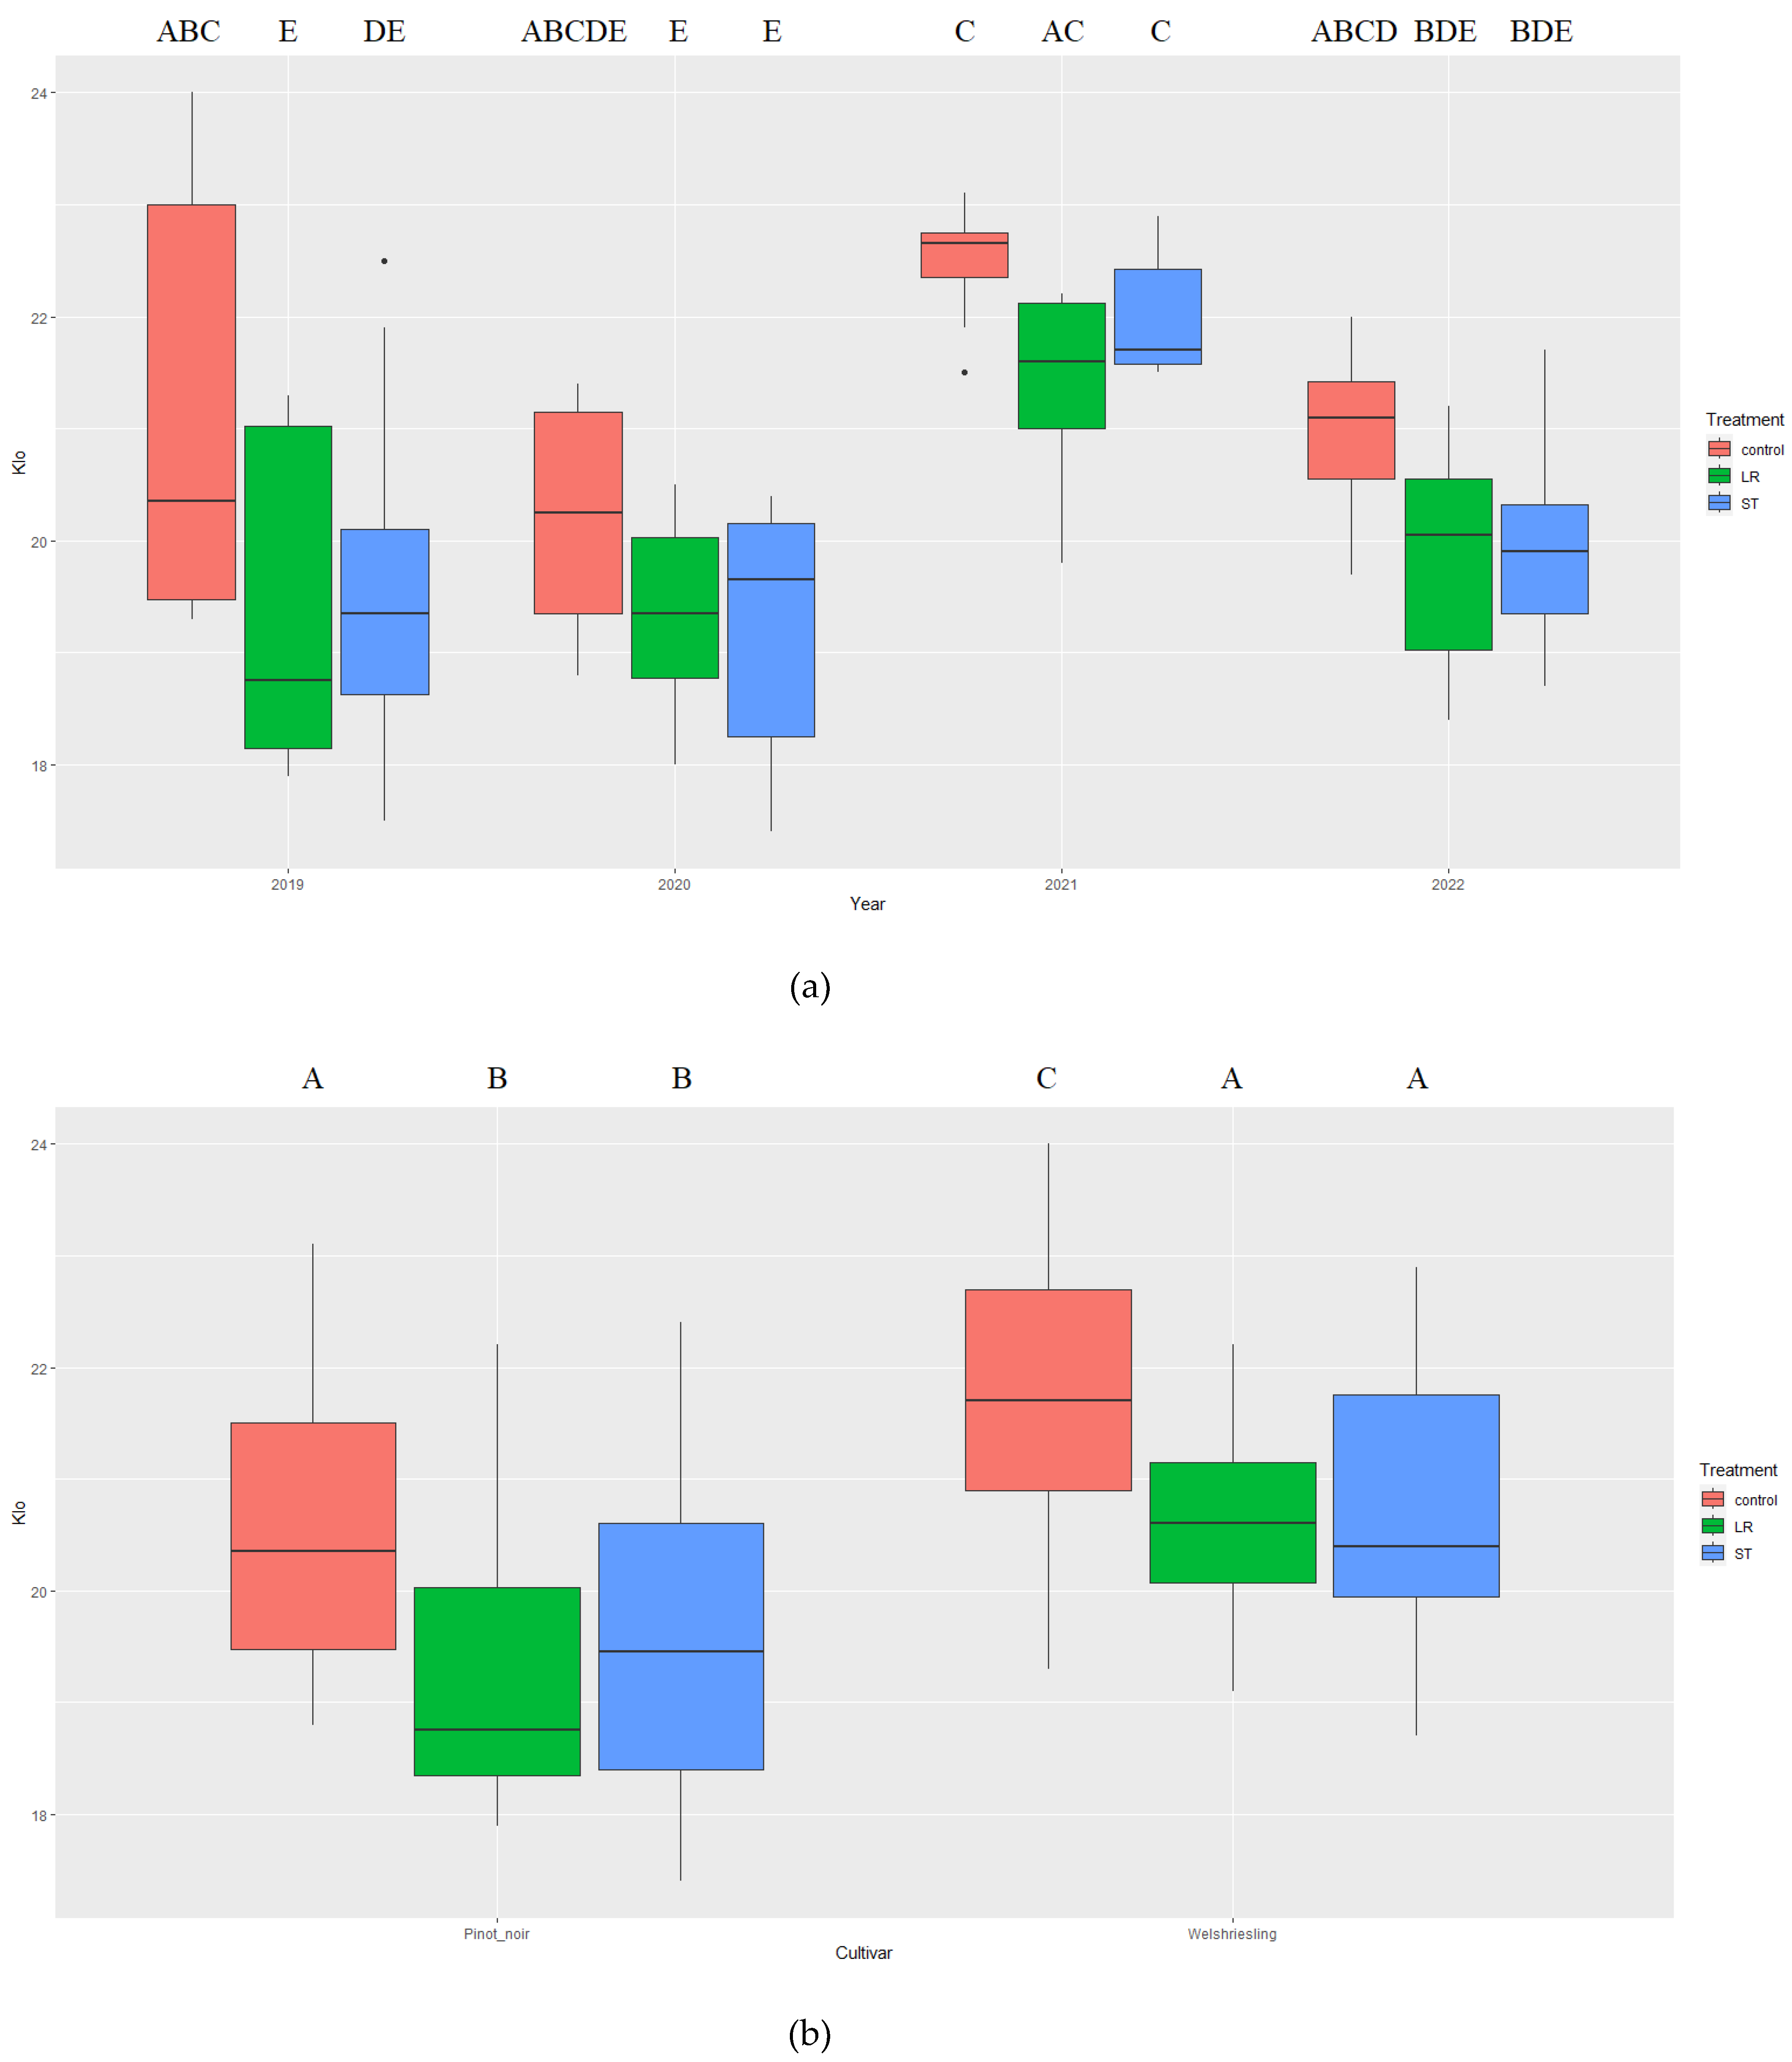
| Cultivar | Pinot noir | Welshriesling | Yearly statistics |
||||
|---|---|---|---|---|---|---|---|
| Year | Control | Leaf Removal |
Sort Topping |
Control | Leaf Removal |
Sort Topping |
|
| 2019 | 19.80 | 18.20 | 18.70 | 19.30 | 21.30 | 21.90 | |
| 20.90 | 18.40 | 19.40 | 22.70 | 21.10 | 22.50 | ||
| 19.40 | 17.90 | 17.50 | 24.00 | 19.10 | 19.50 | ||
| 19.50 | 18.00 | 18.40 | 23.90 | 21.00 | 19.30 | ||
| Avarage | 19.90 | 18.13 | 18.50 | 22.48 | 20.63 | 20.80 | 20.07 |
| Variance | 0.4733 | 0.0492 | 0.6200 | 4.8292 | 1.0492 | 2.6800 | 3.5091 |
| 2020 | 19.60 | 18.70 | 17.80 | 21.10 | 20.10 | 20.10 | |
| 19.40 | 18.80 | 19.20 | 21.40 | 20.00 | 20.40 | ||
| 19.20 | 18.00 | 18.40 | 20.90 | 20.50 | 20.10 | ||
| 18.80 | 18.80 | 17.40 | 21.30 | 19.90 | 20.30 | ||
| Avarage | 19.25 | 18.58 | 18.20 | 21.18 | 20.13 | 20.23 | 19.59 |
| Variance | 0.1167 | 0.1492 | 0.6133 | 0.0492 | 0.0692 | 0.0225 | 1.2251 |
| 2021 | 22.70 | 20.70 | 22.40 | 22.50 | 22.10 | 22.50 | |
| 23.10 | 21.70 | 21.50 | 22.90 | 21.10 | 22.90 | ||
| 21.50 | 19.80 | 21.70 | 22.60 | 22.20 | 21.50 | ||
| 21.90 | 22.20 | 21.60 | 22.70 | 21.50 | 21.70 | ||
| Avarage | 22.30 | 21.10 | 21.80 | 22.68 | 21.73 | 22.15 | 21.96 |
| Variance | 0.53 | 1.14 | 0.17 | 0.03 | 0.27 | 0.44 | 0.5938 |
| 2022 | 21.50 | 19.20 | 19.60 | 19.80 | 19.80 | 20.40 | |
| 21.30 | 18.50 | 20.30 | 20.90 | 20.30 | 21.70 | ||
| 21.40 | 18.40 | 20.20 | 22.00 | 20.50 | 18.70 | ||
| 19.70 | 21.20 | 19.50 | 20.80 | 20.70 | 18.90 | ||
| Avarage | 20.98 | 19.33 | 19.90 | 20.88 | 20.33 | 19.93 | 20.22 |
| Variance | 0.73 | 1.69 | 0.17 | 0.81 | 0.15 | 1.98 | 1.0678 |
| Avarage | 19.83 | 21.09 | |||||
| Variance | 2.3191 | 1.6348 | |||||
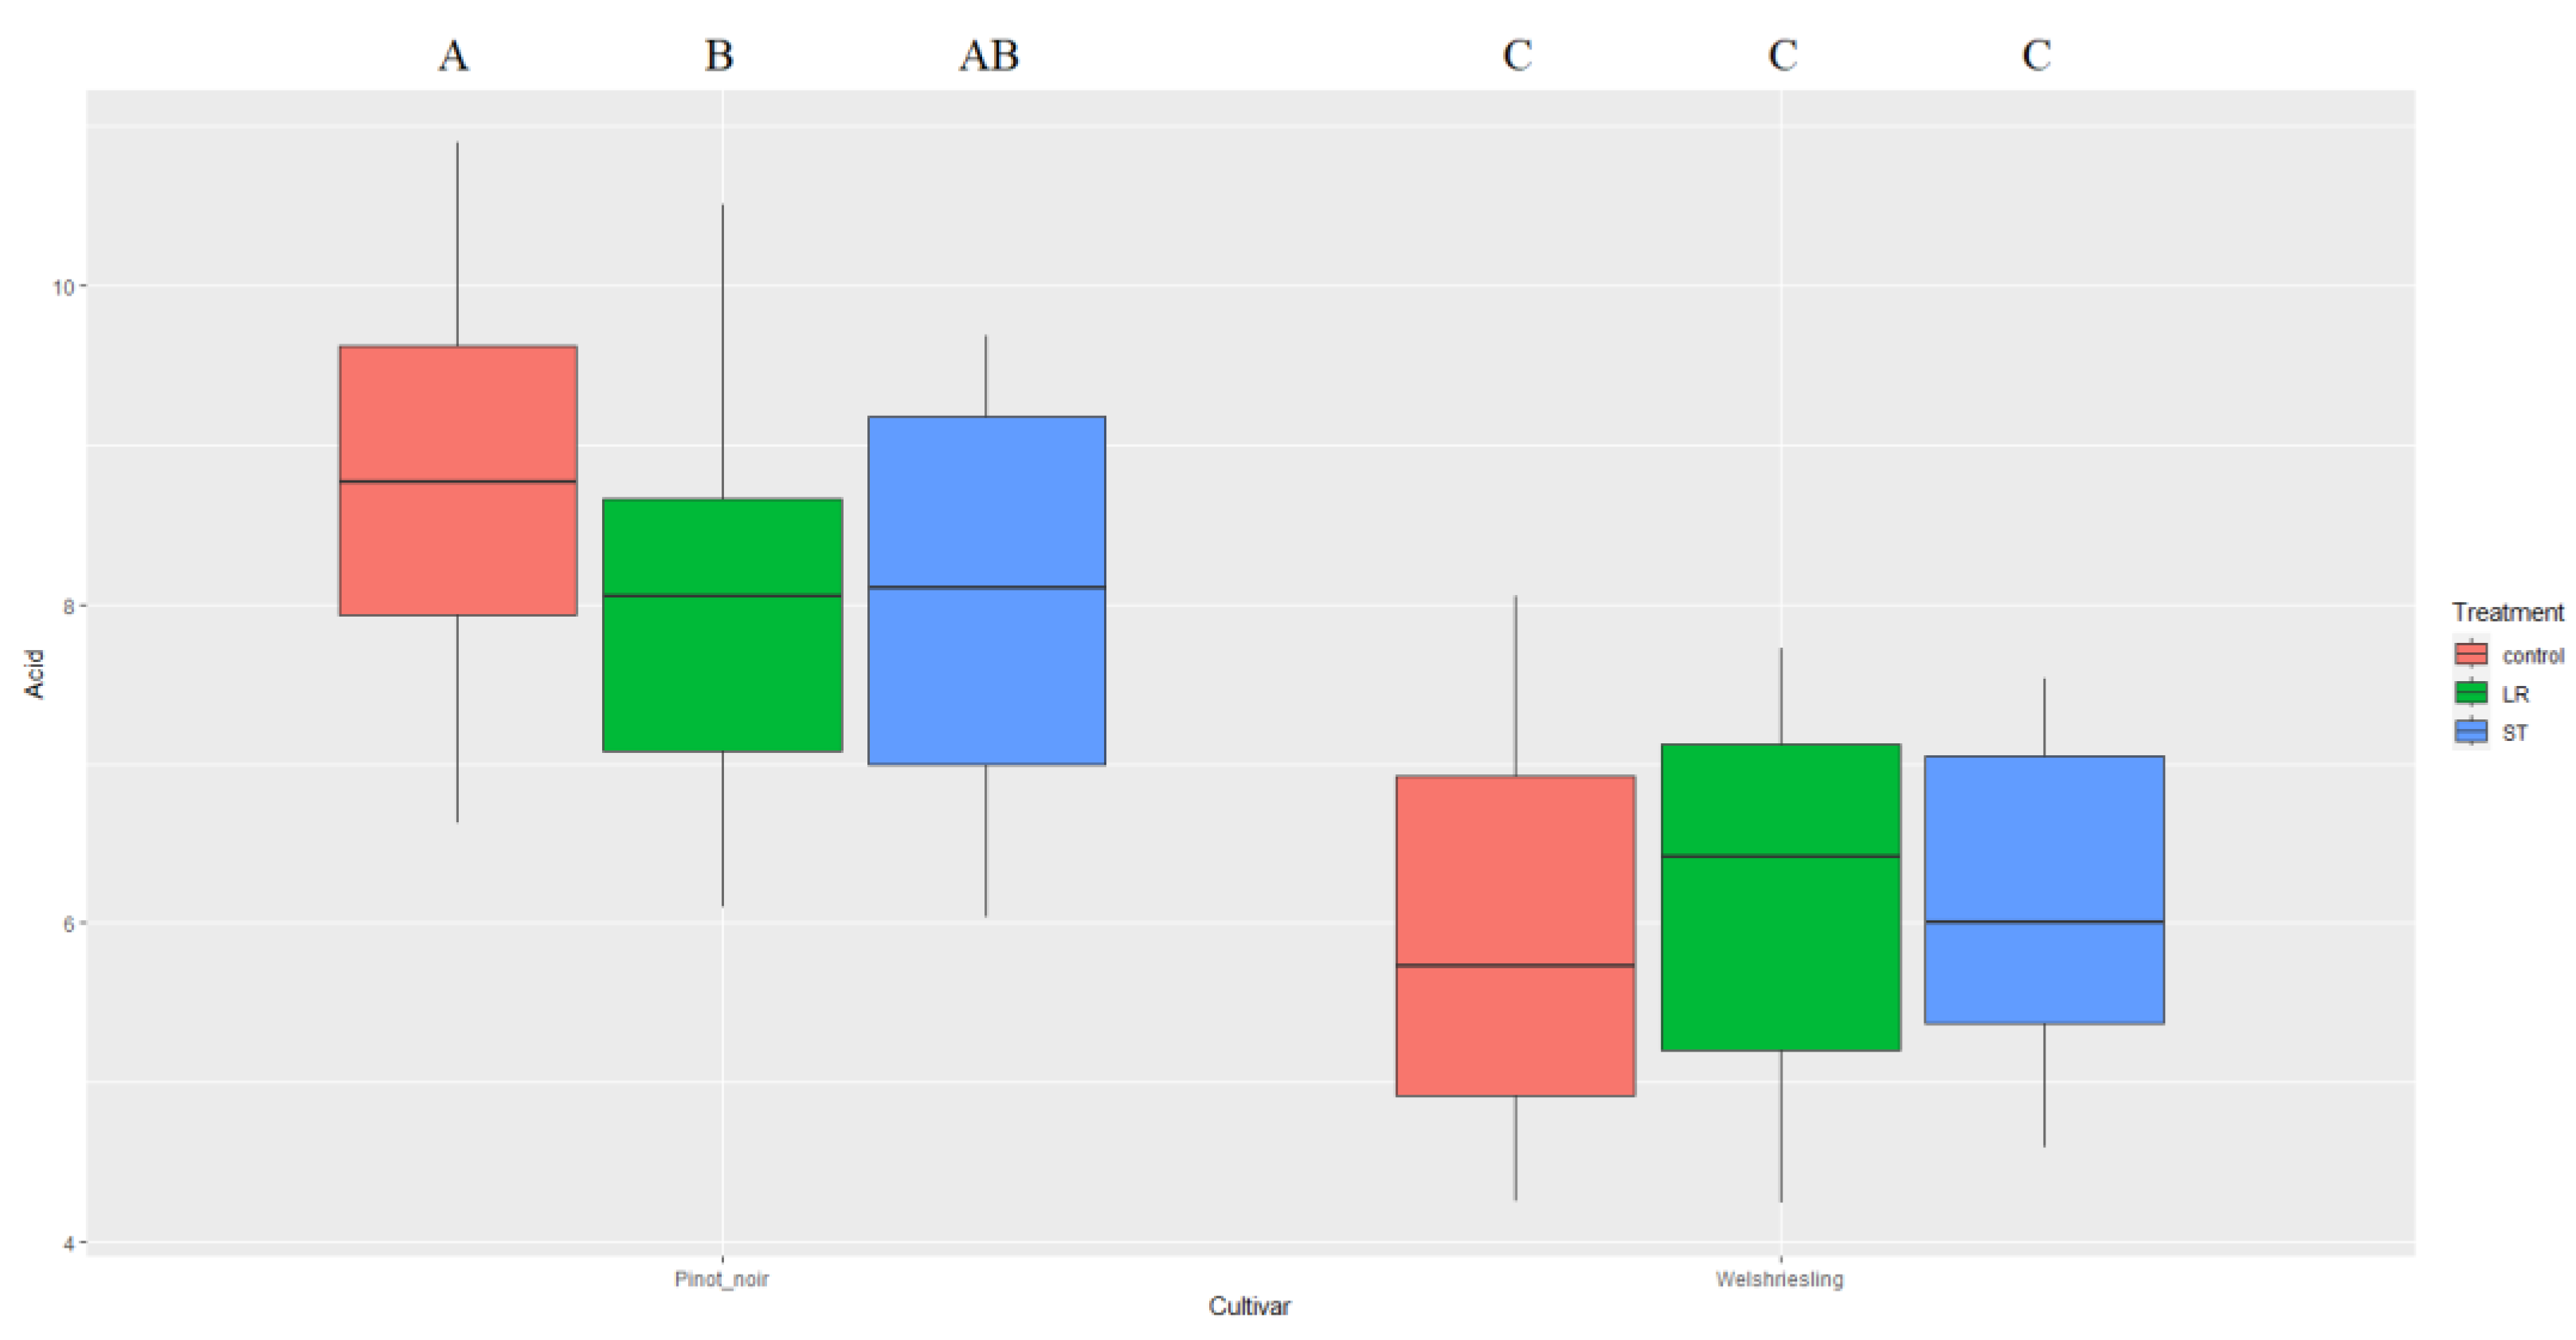
| Cultivar | Pinot noir | Welshriesling | Yearly statistics |
||||
|---|---|---|---|---|---|---|---|
| Year | Control | Leaf Removal |
Sort Topping |
Control | Leaf Removal |
Sort Topping |
|
| 2019 | 8.50 | 7.26 | 7.63 | 6.89 | 7.33 | 5.09 | |
| 9.54 | 7.25 | 6.82 | 6.06 | 6.22 | 7.11 | ||
| 8.50 | 7.20 | 9.12 | 7.65 | 7.72 | 7.51 | ||
| 8.74 | 8.41 | 8.09 | 6.17 | 6.6 | 6.64 | ||
| Average | 8.82 | 7.53 | 7.92 | 6.69 | 6.97 | 6.59 | 7.42 |
| Variance | 0.2432 | 0.3449 | 0.9210 | 0.5430 | 0.4638 | 1.1231 | 1.1084 |
| 2020 | 10.89 | 9.44 | 9.35 | 7.14 | 7.12 | 7.02 | |
| 8.78 | 9.06 | 8.27 | 6.78 | 6.79 | 6.79 | ||
| 10.37 | 8.53 | 8.11 | 7.03 | 7.37 | 7.53 | ||
| 10.53 | 9.09 | 9.58 | 8.05 | 7.14 | 7.2 | ||
| Average | 10.14 | 9.03 | 8.83 | 7.25 | 7.11 | 7.14 | 8.25 |
| Variance | 0.8724 | 0.1409 | 0.5550 | 0.3071 | 0.0570 | 0.0975 | 1.6696 |
| 2021 | 9.06 | 10.5 | 9.68 | 4.26 | 4.24 | 4.59 | |
| 8.89 | 8.05 | 9.54 | 4.43 | 4.69 | 5.5 | ||
| 8.3 | 8.4 | 8.55 | 5.39 | 5.78 | 6.23 | ||
| 9.84 | 8.05 | 7.82 | 4.27 | 6.91 | 5.07 | ||
| Average | 9.02 | 8.75 | 8.90 | 4.59 | 5.41 | 5.35 | 7.00 |
| Variance | 0.4031 | 1.3883 | 0.7690 | 0.2923 | 1.4247 | 0.4843 | 4.4208 |
| 2022 | 6.84 | 6.60 | 6.97 | 4.94 | 5.56 | 5.78 | |
| 6.8 | 6.71 | 7.00 | 4.84 | 5.26 | 5.05 | ||
| 6.63 | 6.10 | 6.04 | 5.33 | 5.03 | 5.46 | ||
| 6.79 | 6.30 | 6.73 | 5.28 | 5.05 | 5.46 | ||
| Average | 6.77 | 6.43 | 6.69 | 5.10 | 5.23 | 5.44 | 5.94 |
| Variance | 0.0086 | 0.0777 | 0.1995 | 0.0595 | 0.0607 | 0.0895 | 0.5771 |
| Average | 8.23 | 6.07 | |||||
| Variance | 1.6307 | 1.1942 | |||||
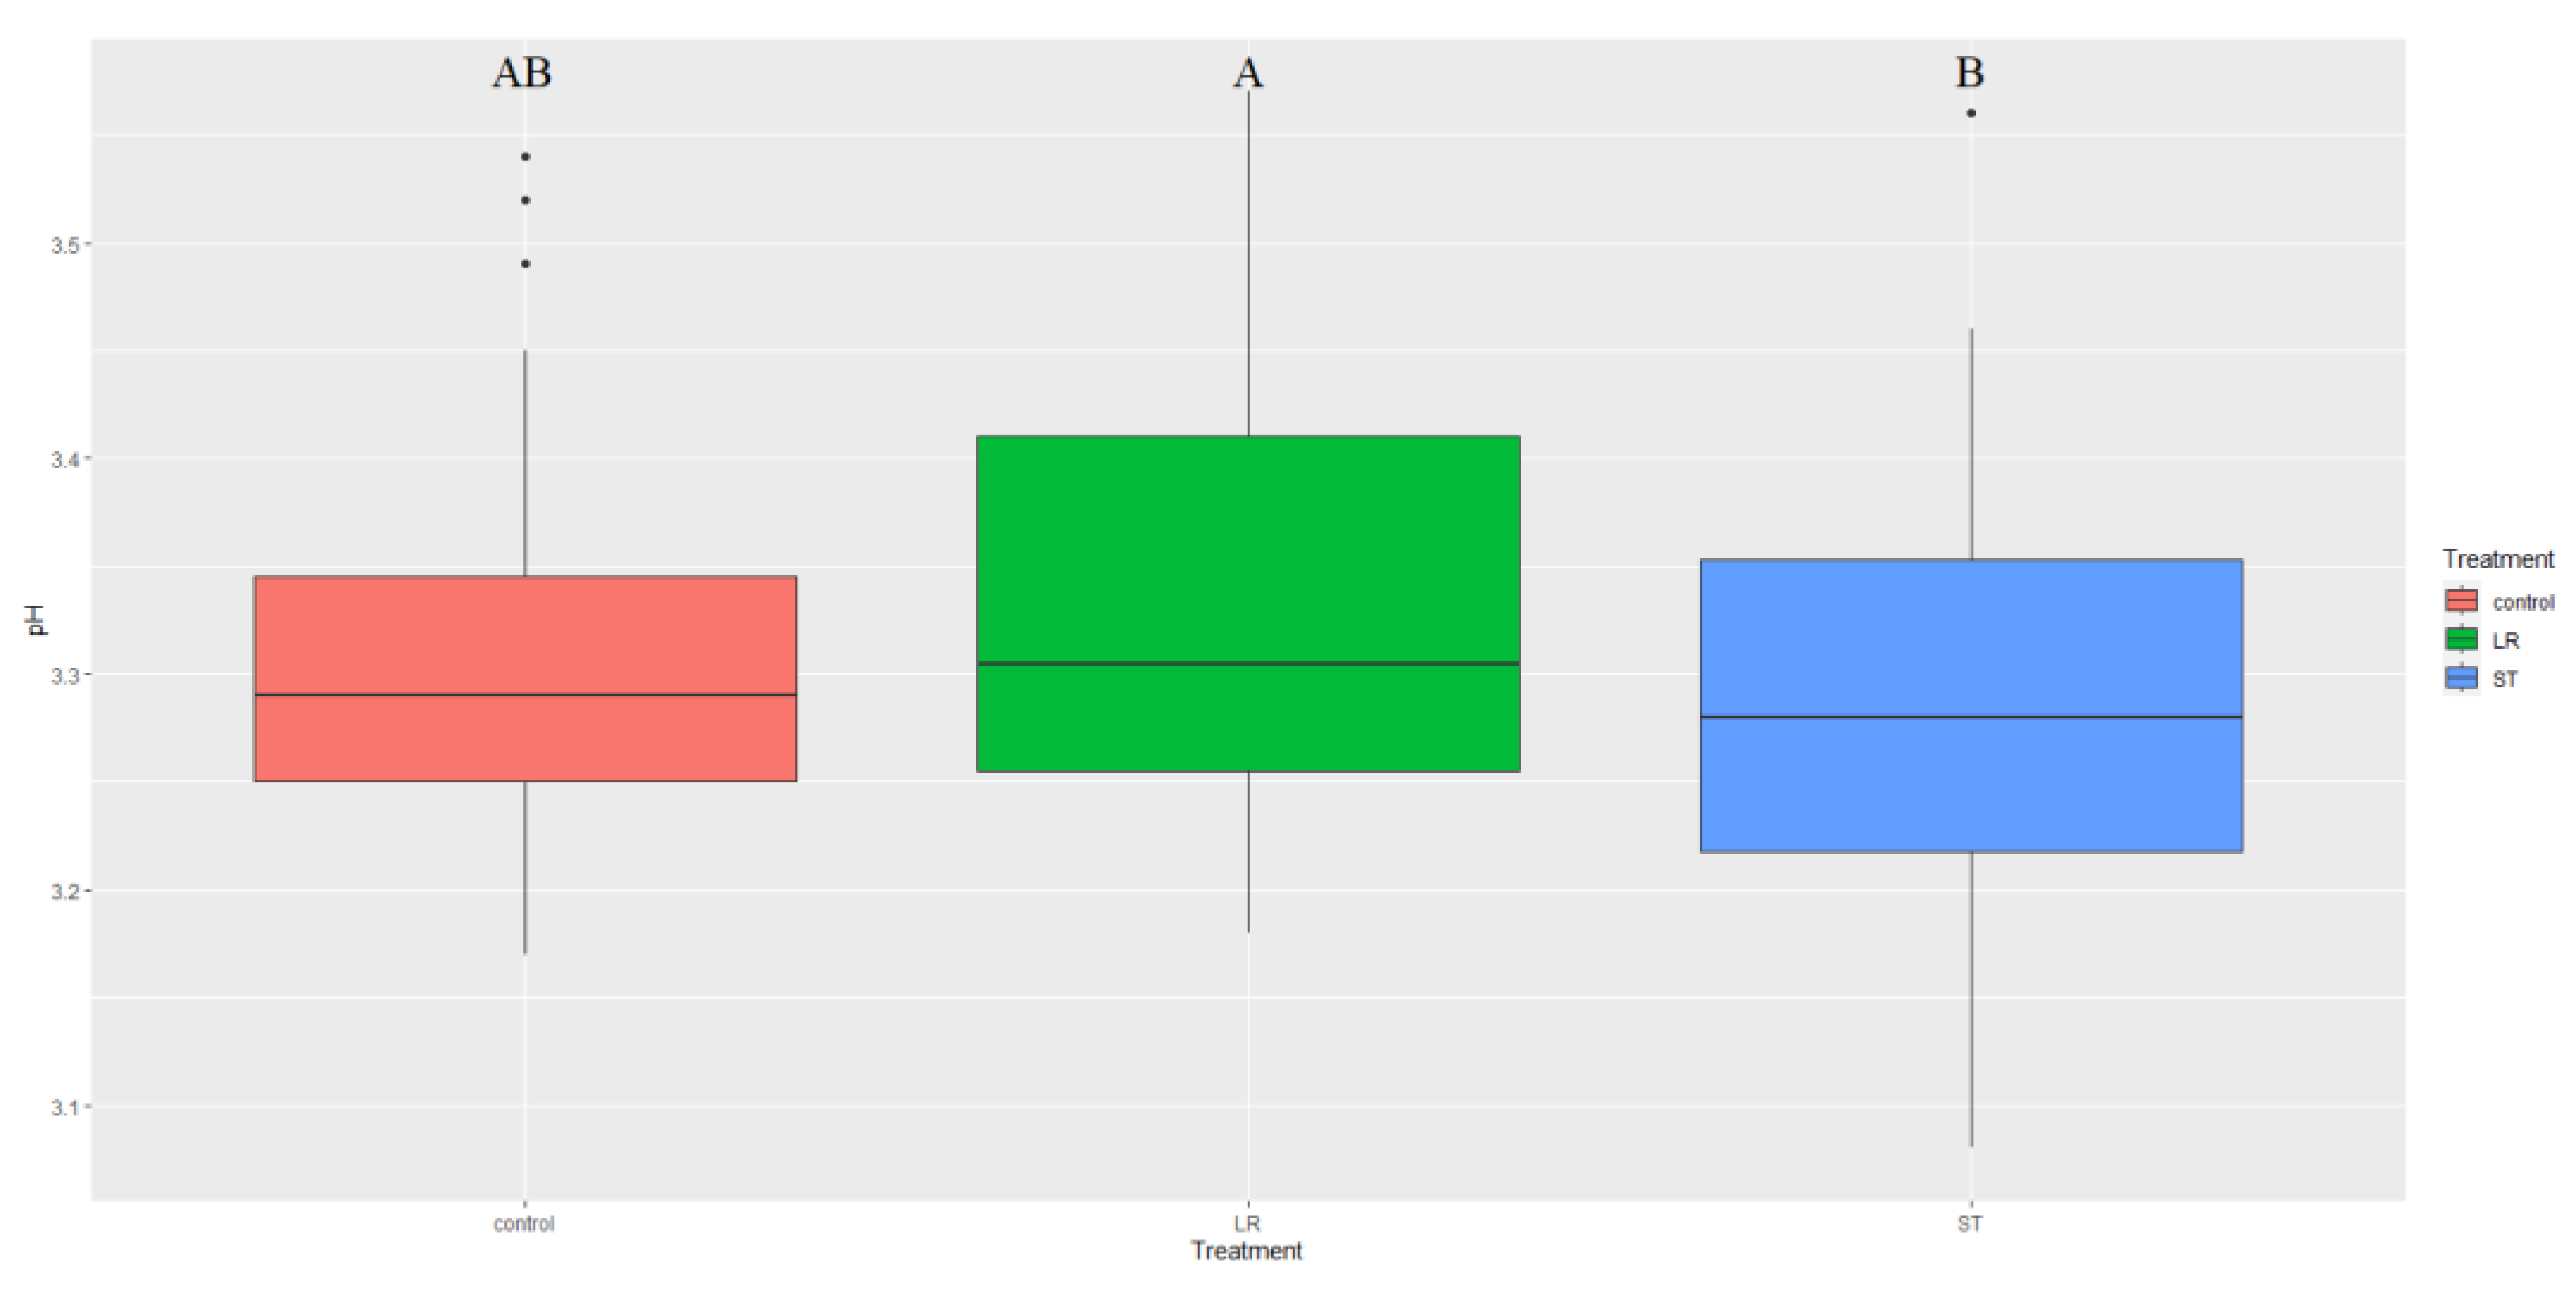
| Cultivar | Pinot noir | Welshriesling | Yearly statistics |
||||
|---|---|---|---|---|---|---|---|
| Year | Control | Leaf Removal |
Sort Topping |
Control | Leaf Removal |
Sort Topping |
|
| 2019 | 3.31 | 3.20 | 3.30 | 3.29 | 3.28 | 3.21 | |
| 3.36 | 3.21 | 3.34 | 3.3 | 3.32 | 3.23 | ||
| 3.27 | 3.10 | 3.32 | 3.4 | 3.12 | 3.28 | ||
| 3.24 | 3.08 | 3.31 | 3.27 | 3.2 | 3.23 | ||
| Average | 3.30 | 3.15 | 3.32 | 3.32 | 3.23 | 3.24 | 3.26 |
| Variance | 0.0027 | 0.0045 | 0.0003 | 0.0034 | 0.0079 | 0.0009 | 0.0063 |
| 2020 | 3.27 | 3.4 | 3.29 | 3.42 | 3.26 | 3.49 | |
| 3.28 | 3.3 | 3.27 | 3.41 | 3.34 | 3.45 | ||
| 3.22 | 3.18 | 3.24 | 3.37 | 3.19 | 3.54 | ||
| 3.26 | 3.28 | 3.24 | 3.32 | 3.21 | 3.52 | ||
| Average | 3.26 | 3.29 | 3.26 | 3.38 | 3.25 | 3.50 | 3.32 |
| Variance | 0.0007 | 0.0081 | 0.0006 | 0.0021 | 0.0045 | 0.0015 | 0.0108 |
| 2021 | 3.53 | 3.32 | 3.31 | 3.21 | 3.26 | 3.46 | |
| 3.46 | 3.29 | 3.32 | 3.4 | 3.3 | 3.46 | ||
| 3.44 | 3.22 | 3.28 | 3.33 | 3.25 | 3.56 | ||
| 3.29 | 3.25 | 3.36 | 3.52 | 3.22 | 3.46 | ||
| Average | 3.43 | 3.27 | 3.32 | 3.37 | 3.26 | 3.49 | 3.35 |
| Variance | 0.0102 | 0.0019 | 0.0011 | 0.0168 | 0.0011 | 0.0025 | 0.0115 |
| 2022 | 3.32 | 3.24 | 3.28 | 3.34 | 3.13 | 3.53 | |
| 3.44 | 3.35 | 3.28 | 3.32 | 3.3 | 3.44 | ||
| 3.25 | 3.31 | 3.34 | 3.17 | 3.23 | 3.51 | ||
| 3.22 | 3.28 | 3.24 | 3.4 | 3.21 | 3.57 | ||
| Average | 3.31 | 3.30 | 3.29 | 3.31 | 3.22 | 3.51 | 3.32 |
| Variance | 0.0096 | 0.0022 | 0.0017 | 0.0096 | 0.0049 | 0.0030 | 0.0127 |
| Average | 3.29 | 3.34 | |||||
| Variance | 0.0065 | 0.0150 | |||||
| Cultivar | Effect | Yield | Sugar content of the must | Titratable acids | pH | Botrytis infection | |
|---|---|---|---|---|---|---|---|
| Pinot noir | Treatment | . | *** | ** | * | *** | |
| Year | *** | *** | *** | *** | *** | ||
| Treatment:Year | ** | . | *** | ||||
| Welshriesling | Treatment | *** | . | *** | |||
| Year | *** | *** | *** | *** | |||
| Treatment:Year | . | *** |
Disclaimer/Publisher’s Note: The statements, opinions and data contained in all publications are solely those of the individual author(s) and contributor(s) and not of MDPI and/or the editor(s). MDPI and/or the editor(s) disclaim responsibility for any injury to people or property resulting from any ideas, methods, instructions or products referred to in the content. |
© 2023 by the authors. Licensee MDPI, Basel, Switzerland. This article is an open access article distributed under the terms and conditions of the Creative Commons Attribution (CC BY) license (http://creativecommons.org/licenses/by/4.0/).


