Preprint
Article

The Clinical Applications of Selected Circulating Tumor Biomarkers in Patients with Pancreatic Neuroendocrine Tumors/Neoplasms

Altmetrics

Downloads

94

Views

40

Comments

0

Submitted:

13 June 2023

Posted:

14 June 2023

You are already at the latest version

Alerts
Abstract
Due to the lack of a diagnostic tumor marker (TM), the diagnosis of pancreatic neuroendocrine neoplasia (PNEN) is usually delayed, and a large part of patients present with regional (RM) and distant metastases (DM). The project aimed to assess the serum TM levels in PNEN and their relationships with disease extent and grade. One hundred fifteen patients with PNEN and 40 healthy subjects (HS) were enrolled. Most of the PNEN were well-differentiated (93.04%) and non-functional (93.91%). Beta-2 microglobulin (BMG), carbohydrate antigen 19-9 (CA19-9), carcinoembryonic antigen (CEA), cytokeratin 18 (CY18), and ferritin concentrations in PNEN patients were significantly higher than in HS (p < 0.01). The highest area under the curve (AUC) ≥ 0.7 for differentiating PNEN patients from HS had CY18, CA19-9, and ferritin (p < 0.001). PNEN disease was localized (LD) in 63 patients, 8 had RM, and 44 exhibited DM. Patients with metastatic PNEN (RM, DM) also showed significantly higher levels of CY18, CA125, and CEA than those without metastases (p < 0.05). In conclusion, CY18, CA19-9, and ferritin were serum biomarkers that fair diagnosed PNEN disease. Elevated CY18, CA125, and CEA levels correlated with clinical stages (RM, DM) and elevated CY18, CA125 with high grade (G3) of disease.
Keywords: 
Subject: Medicine and Pharmacology  -   Medicine and Pharmacology

1. Introduction

Pancreatic neuroendocrine neoplasms (PNENs) represent 4% of all neuroendocrine neoplasms (NENs) and app. 30% of all gastroenteropancreatic neuroendocrine neoplasm (GEP-NEN) [1,2]. The prevalence of PNENs is still increasing and amounts to around ≤10 cases per 1 million population per year. PNENs may be classified as functioning (F-PNENs) or nonfunctioning (NF-PNENs) (60-90%).
PNENs are diagnosed based on histological type, including their differentiation and histological maturity, pathomorphological advancement (pTNM), grading (G), and clinical advancement staging (S). The Grade (G) is established on Ki-67 proliferative index [3] and the number of mitotic figures.
Based on the European Neuroendocrine Tumor Society (ENETS) and 2019 World Health Organization (WHO) classification, PNENs were classified into subtypes based on the grade of their histological maturity; well-differentiated PNENs (PNET G1 — high grade; Ki-67 < 3%, PNET G2 — intermediate grade; Ki-67 3-20%, and PNET G3 — low grade; Ki-67 > 20%), poorly-differentiated pancreatic neuroendocrine carcinomas (PNECs) (G3) and mixed neuroendocrine–non-neuroendocrine neoplasms (MiNENs) [1,4,5].
The histopathological staging of the tumours in PNEN patients is based on the assessment of the tumour size (T), the presence of nodal metastases (N), and distant metastases (M) (pTNM) [1,6].
According to their slow growth and usually asymptomatic or oligosymptomatic course, they are often detected in advanced or metastatic stages [1,2]. Progressive metastatic disease is the common scenario for PNEN management and happens in 50–80% of PNENs [7,8]. The frequency of metastasis disease in PNENs is 14% localized, 22% regional, and 64% distant metastasis [9]. The most common metastasis locations are lymph nodes [10], liver (1/3 of patients newly diagnosed PNENs) [1], and bone (8% of PNENs) [11].
The prognosis in PNEN patients is generally better than in pancreatic cancer, but it is still worsening in metastatic disease. The mean survival of patients with NF-PNENs was determined at 38 months. Unfortunately, patients with PNEN and distant metastases had shorter survival of about 23 months, compared with overall survival of 70–124 months in regionally metastatic disease (lymph node involvement and the number of affected lymph nodes) [1,6,12].
Among numerous prognostic parameters, the degree of histological differentiation of the tumor (tumor grade) is also an important factor influencing survival. The proliferation index is an important feature that can divide patients into groups for establishing prognosis. PNET G1 and PNET G2 tumours are characterized by better prognosis than PNET G3. The five-year survival in the case of PNET G2 is 62% and in PNET G3 — 29%. On the other hand, patients with PNEC G3 have a poor prognosis, and their five-year survival is 16% [1].
However, regardless of the tumor grade of histological maturity (G), a significant predictor of survival is the extent of liver metastases affecting one or two lobes or the presence of additional abdominal metastases. There are other unfavorable prognostic factors, such as high dynamics of the development of liver metastases (25% increase in their volume within 6–12 months) and other distant metastases, such as bone metastases [1,13,14].
The identification of effective treatment and the real-life monitoring of disease course and disease status is still an unmet need. The use of the general secretory amine, i.e., chromogranin A (CgA), as a nonspecific biomarker of NENs, has proved to have limited efficacy also in diagnosing and managing PNENs [15]. Therefore, detecting and using sensitive blood (serum) biomarkers can be essential for assessing numerous biological aspects of advanced disease. Metastases are always connected with a worsening prognosis [1,2], so finding good markers to predict the likelihood of metastasis and improve accurate treatment choices is important.
Therefore, the study aimed to assess the serum tumour marker levels in patients with PNEN, their relationships with disease extent (regional metastases and distant metastases), grade, and clinical status, and whether higher serum levels of these tumour markers increase the risk of advanced disease.

2. Materials and Methods

2.1. Cohorts

The Ethics Committee of the Medical University of Silesia approved the study. It was conducted at the Department of Endocrinology and Neuroendocrine Tumors, European Neuroendocrine Tumor Society Centre of Excellence, Medical University of Silesia, in accordance with the good clinical practice guidelines and the Declaration of Helsinki. Informed written consent was obtained from all study participants. The study group comprised 115 patients with PNEN and 40 healthy subjects (controls). The mean age (and range) of the patients in the PNEN cohort was 52.88 (19–79), and in the control group, 48.53 (22–76). Control subjects included persons of the hospital personnel, and subjects from the occupational medicine clinic, with no malignancy present and identified themselves in good health. All PNENs were histologically confirmed, with no other synchronous malignancy. The PNEN patient cohort included 113 sporadic PNENs, two multiple endocrine neoplasia type 1 related, 108 were non-functional (NF-PNEN), while the seven functional included three insulinomas, one glucagonoma, and three subjects with carcinoid syndrome.

2.2. Methods

2.2.1. Strategy

We compared serum tumour markers levels from PNENs (n = 115) with controls (n = 40). The diagnostic accuracy and metrics (area under the receiver operating characteristic curve (AUROC), sensitivity, specificity) for the TMs were calculated. The concordance of the tumour marker levels with various PNEN subgroups (disease extent, stage, and grade) was then assessed. We correlated changes in tumour marker levels with disease outcomes for clinical utility.

2.2.2. Measurement of Serum Tumor Markers.

The venous blood samples (5 ml each) from patients with PNEN were taken for serological examination of tumour markers levels. The blood was spun at 3000 rpm for 10 min. Then, the serum samples were placed into containers, coded, stored at -80°C, and collected for further examinations. Tumour markers containing cytokeratin 18 (CY18), ferritin, carbohydrate antigen 19-9 (CA19-9), cancer antigen 125 (CA125), alpha-fetoprotein (AFP), carcinoembryonic antigen (CEA), and beta-2 microglobulin (BMG) were measured with available kits: CY18, ferritin, and BMG with ELISA kits and CA19-9, CA12-5, CEA and AFP with EIA kits.
The reference ranges for tumour markers were: CY18 10-1200 U/l; ferritin 20-400 ng/ml (men) and 6-350 ng/ml (women); CA19-9 0-25 U/ml; CA125 5-39 U/ml; AFP 0.1-10 µg/l; CEA 0.5-9.1 µg/l and BMG < 2.5 mg/l

2.2.3. Radiological Evaluation of PNEN Disease Extent.

PNEN disease extent was determined by anatomical (computed tomography (CT) or magnetic resonance imaging (MRI)) and/ or functional imaging (68Gallium-somatostatin-analogues ([68Ga]Ga-SSA) positron emission tomography/computed tomography (PET/CT) in well-differentiated PNENs /pancreatic neuroendocrine tumours (PNETs)/ and, in selected patients, 18F-fluorodeoxyglucose ([18F]F-FDG PET/CT) - in G2/G3 PNETs and/or poorly- differentiated pancreatic neuroendocrine carcinoma (PNEC).
For anatomical imaging were utilized multiphase CT with the administration of iodine contrast with a 16-slice LightSpeed CT scanner or multiphase MRI with a 1.5-T MRI scanner (both from General Electrics, USA) with the injection of gadolinium contrast (slice thickness 3–6 mm) and T1/T2 sequences being obtained. Functional imaging was undertaken with hybrid PET/CT scanners with the administration of [68Ga]Ga-DOTATATE in well-differentiated PNETs ([68Ga]Ga-DOTATATE PET/CT) or [18F]F-FDG in higher-grade well-differentiated G2/G3 PNETs and poorly-differentiated PNECs ([18F]F-FDG PET/CT)).

2.2.4. Histological Diagnosis

All PNEN patients had histologically confirmed disease by an independent site expert pathologist in accordance with the TNM 8th edition classification and WHO 2017 for PNENs. All specimens were evaluated by H&E staining or immunohistochemistry.

2.2.5. Statistical Analysis

Statistical analyses were utilized using STATISTICA software (version 13.36.0, StatSoft, Poland). Data were tested for normal distribution by the Shapiro-Wilk test. Data were provided as means with standard deviations or medians and interquartile ranges. Statistical significance was defined as a p-value < 0.05. The intergroup analyses were undertaken using nonparametric tests: the 2-tailed Mann-Whitney U test for two groups or Kruskal-Wallis for multiple testing. To determine the diagnostic accuracy, sensitivity, and specificity of the measured tumor markers was used receiver-operating characteristic (ROC) curve analysis, leading to estimates of the area under the curve (AUC) with a 95% confidence interval (CI). AUC value > 0.9 is considered an excellent diagnostic marker; values 0.8 – 0.9 are considered good, whereas values < 0.8 are deemed fair, and < 0.7 to poor.

3. Results

Cohort structure and clinicopathological data are presented in Table 1. The majority of the PNENs subject was non-functional 108/115 (93.91 %) and well-differentiated, consisting of 60/115 NET G1 (52.17 %), 47/115 NET G2 (40.87 %), and 3/115 NET G3 (2.61 %).

3.1. Tumour Markers in Patients with PNEN vs. Controls

Except for CA125 and AFP, remain of tumour marker levels in PNENs were significantly higher than in controls (p < 0.01) (Table S1). CY18 levels in PNENs were significantly elevated (99.73 ± 97.27 (64.67 [35.96-121.55])) than in controls cases (51.28 ± 64.53 (31.51 [23.05-45.67]), p < 0.001). Similar differences were observed for ferritin and CA19-9 (104.78 ± 96.93 (75.43 [29.29-144.33]) vs. 60.11 ± 74.94 (19.19 [8.80-94.81]) and 12.97 ± 14.99 (9.13 [4.84-15.70]) vs. 5.60 ± 4.46 (4.10 [2.19-7.66]); respectively)). Also, CEA and BMG serum concentrations were significantly different between these groups (1.64 ± 1.57 (1.13 [0.66-2.02]) vs. 1.03 ± 0.68 (0.79 [0.49-1.51]), p = 0.03 and 3.72 ± 25.57 (1.20 [0.91-1.59]) vs. 1.01 ± 0.27 (0.94 [0.84-1.12]), p <0.01); respectively)).
The highest AUROC for differentiating PNENs from controls had CY18, CA19-9, and ferritin (0.74, 0.72, and 0.70; p < 0.001), and their accuracy for detecting PNENs subjects compared to controls was 68%, 73%, and 77%, respectively (Table 2, Figure 1a). Also, other markers (CEA, BMG) could differentiate PNENs from controls (p <0.05), but their AUC < 0.7 indicates that they are poor diagnostic markers.

3.2. Tumour Markers in Patients with PNEN - Analysis by Absence and Presence of Metastases

Stratifying tumour markers levels by the presence of metastases identified that individuals without metastases exhibited significantly lower levels of CY18 (75.61 ± 74.15 (51.07 [35.36-93.43]), CA125 (6.71 ± 8.70 (5.16 [2.87-7.92]), and CEA (1.26 ± 0.97 (0.91 [0.51-1.75] than those with metastases CY18 (128.96 ± 113.47 (86.71 [47.02-182.98], CA125 (17.14 ± 31.56 (7.24 [3.78-13.66]) and CEA (2.10 ± 2.00 (1.27 [0.79-2.65], respectively) (p < 0.05) (Table S3 in supplementary material). Levels of other tumour markers (ferritin, CA19-9, AFP, BMG) did not significantly differ between PNEN patients with- versus without metastases (p > 0.05) (Table S3).
Based on AUROC analysis (Table S4 in supplementary material), we noted that the highest statistically significant AUROC for differentiating metastatic PNENs from nonmetastatic PNENs had CY18, CA125, and CEA (0.66, 0.64, and 0.64; p < 0.05), and their accuracy for differentiating PNEN patients with metastasis compared to whom without metastasis was 65%, 67%, and 59%, respectively (Table 2, Figure 1a). These markers could differentiate both PNEN patients group, but their AUC < 0.7 indicates that they are poor predictive markers.

3.3. Tumour Markers in Patients with PNEN - Analysis by Disease Stage

Secondly, we assessed whether tumor marker levels correlated with PNEN subjects' disease stage (n = 115). The disease was localized in 63 patients, 8 had regional metastases, and 44 exhibited distant metastases (Table S5 in supplementary material). We evaluated whether tumour markers levels correlated with disease stages.
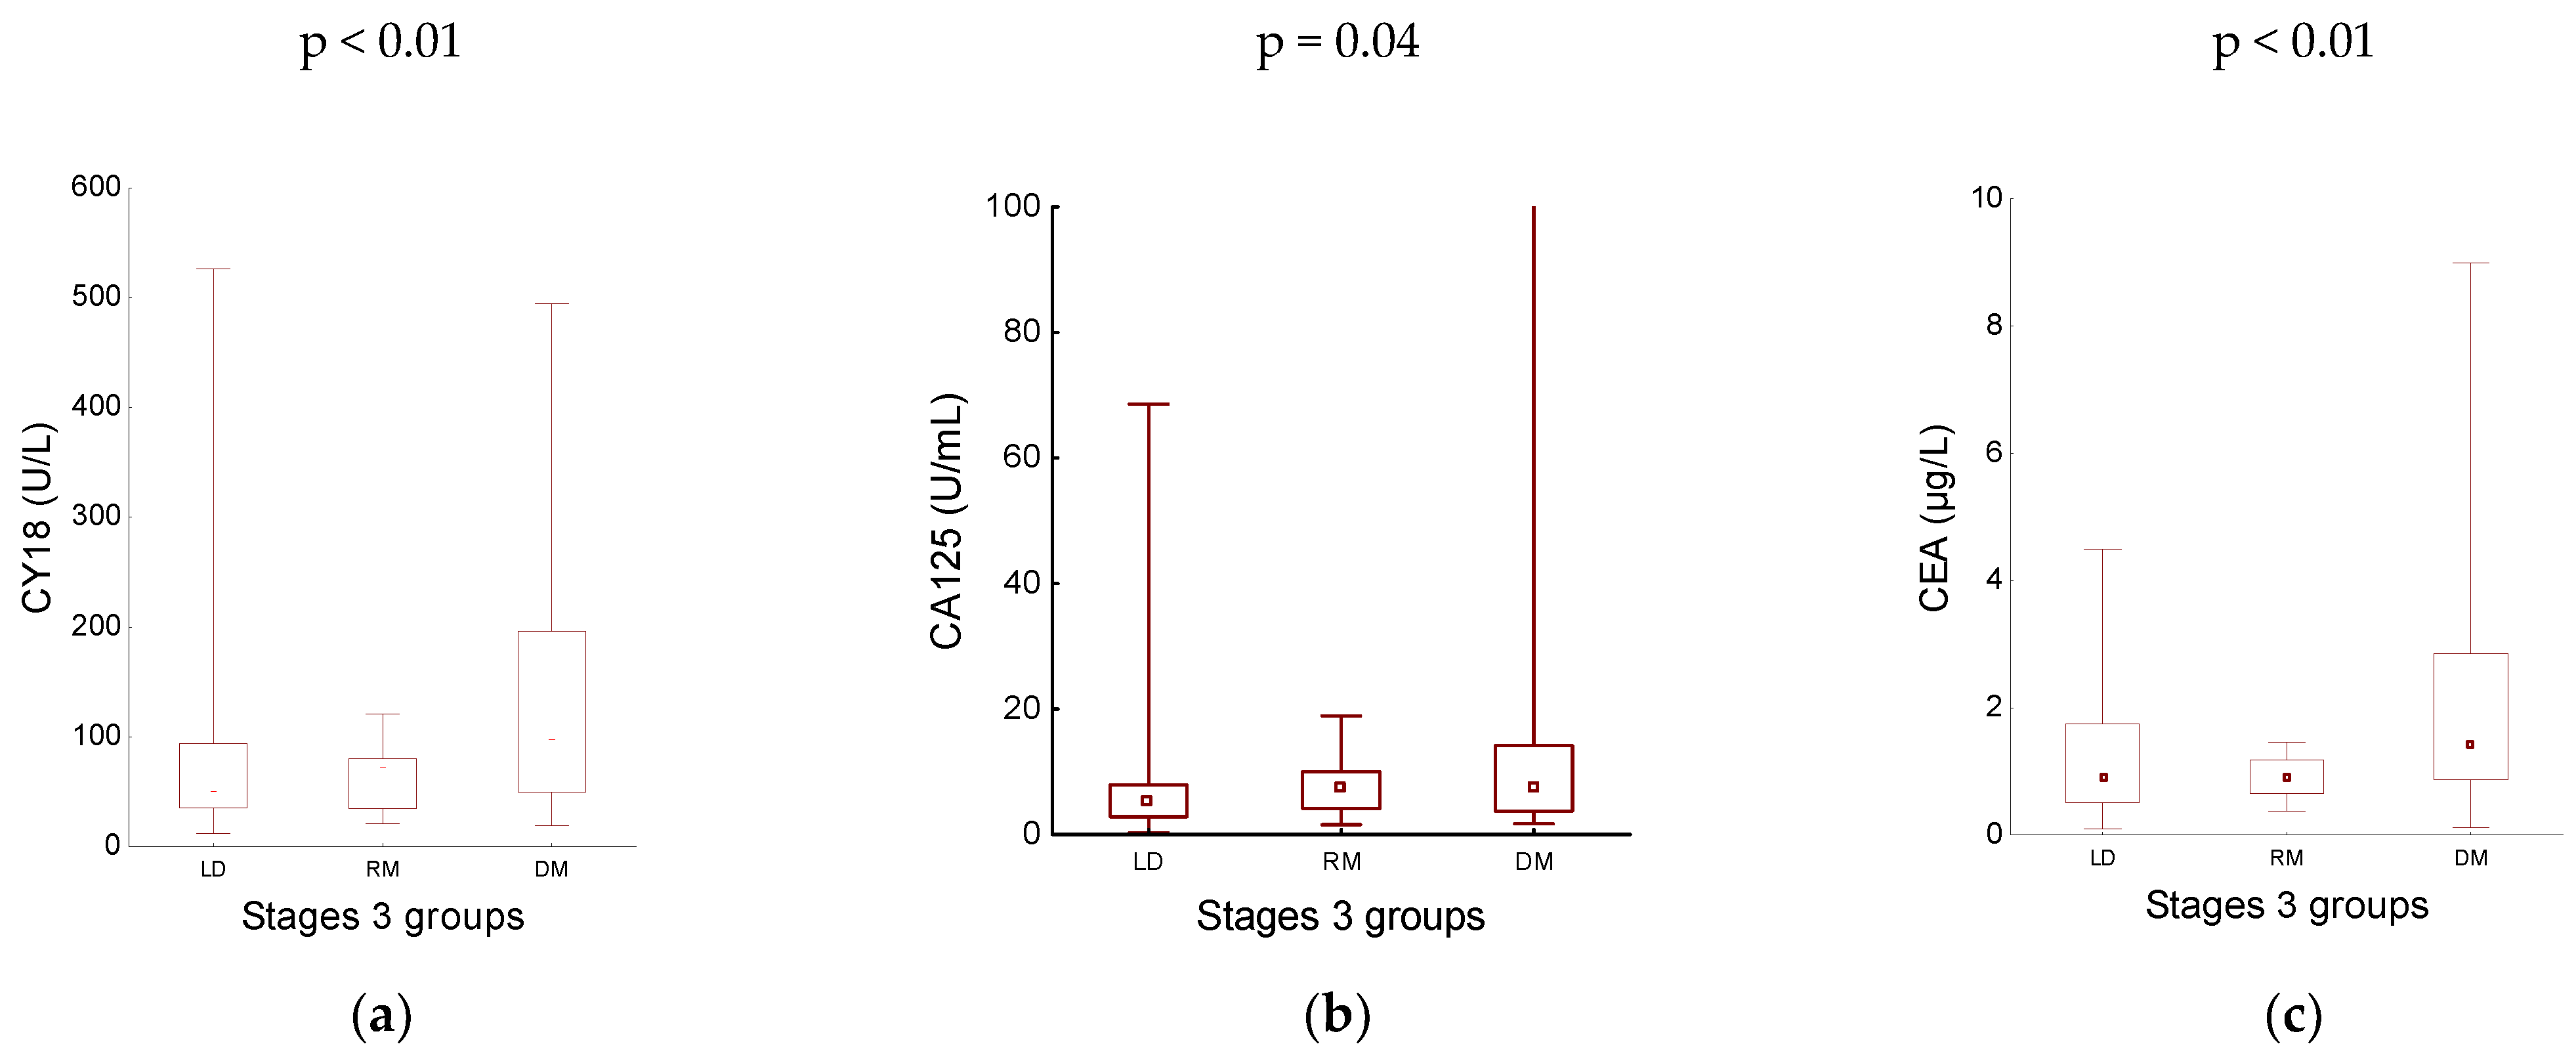
The Kruskal-Wallis analysis identified significant differences in CY18, CA125, and CEA levels across these three stages (Kruskal-Wallis statistics 9.97, 6.28, and 11.20; p < 0.01, p = 0.04 and p < 0.01, respectively) (Table S5 in supplementary material). Specifically for CY18, distant metastases disease (140.72 ± 119.06 (98.36 [147.01-196.26]) had a significantly higher level than the localized disease (75.61 ± 74.15 (51.07 [58.07-93.43]), p = 0.0064); but similar in regional metastases (64.26 ± 33.03 (72.05 [45.49-79.96]) (Figure 2a). In the case of CA125, its levels in distant metastases were significantly elevated (18.81 ± 34.03 (7.24 [10.39-14.17]) than in localized disease (6.71 ± 8.70 (5.16 [5.05-7.92], p = 0.0424), but not significantly different than in regional metastases (7.93 ± 5.46 (7.28 [5.86-10.02])) (Figure 2b). For CEA, comparing localized disease (1.26 ± 0.97 (0.91 [1.24-1.75]) with any metastatic disease (regional metastases or distant metastases) revealed that the CEA level was significantly elevated in patients only with distant metastases (2.31 ± 2.10 (1.45 [1.98-2.85]), p < 0.01)) (Figure 2c).
The other markers (ferritin, CA19-9, CA125, AFP, and BMG) levels were similar in these 3 TNM stages, and the Kruskal-Wallis statistics did not identify significant differences in their levels (p > 0.05).
We also performed the Kruskal-Wallis analysis according to the TNM stages of the disease (Table S6 and Table S7 in supplementary material), which led us to similar results. We obtained significant differences in the same marker (CY18, CA125, and CEA) given three stages (I - IIIA, IIIB, IV) (Kruskal-Wallis statistics > 10.0; p < 0.05).

3.3. Analysis by Disease Grade

In the next step, we evaluated the PNEN cohort as a group (n = 115), assigning patients a disease grade (G) of G1 (n = 60), G2 (n = 47), G3 (n = 8; 3 well-differentiated PNETs, and five poorly differentiated PNECs) (Table S8 in supplementary material).
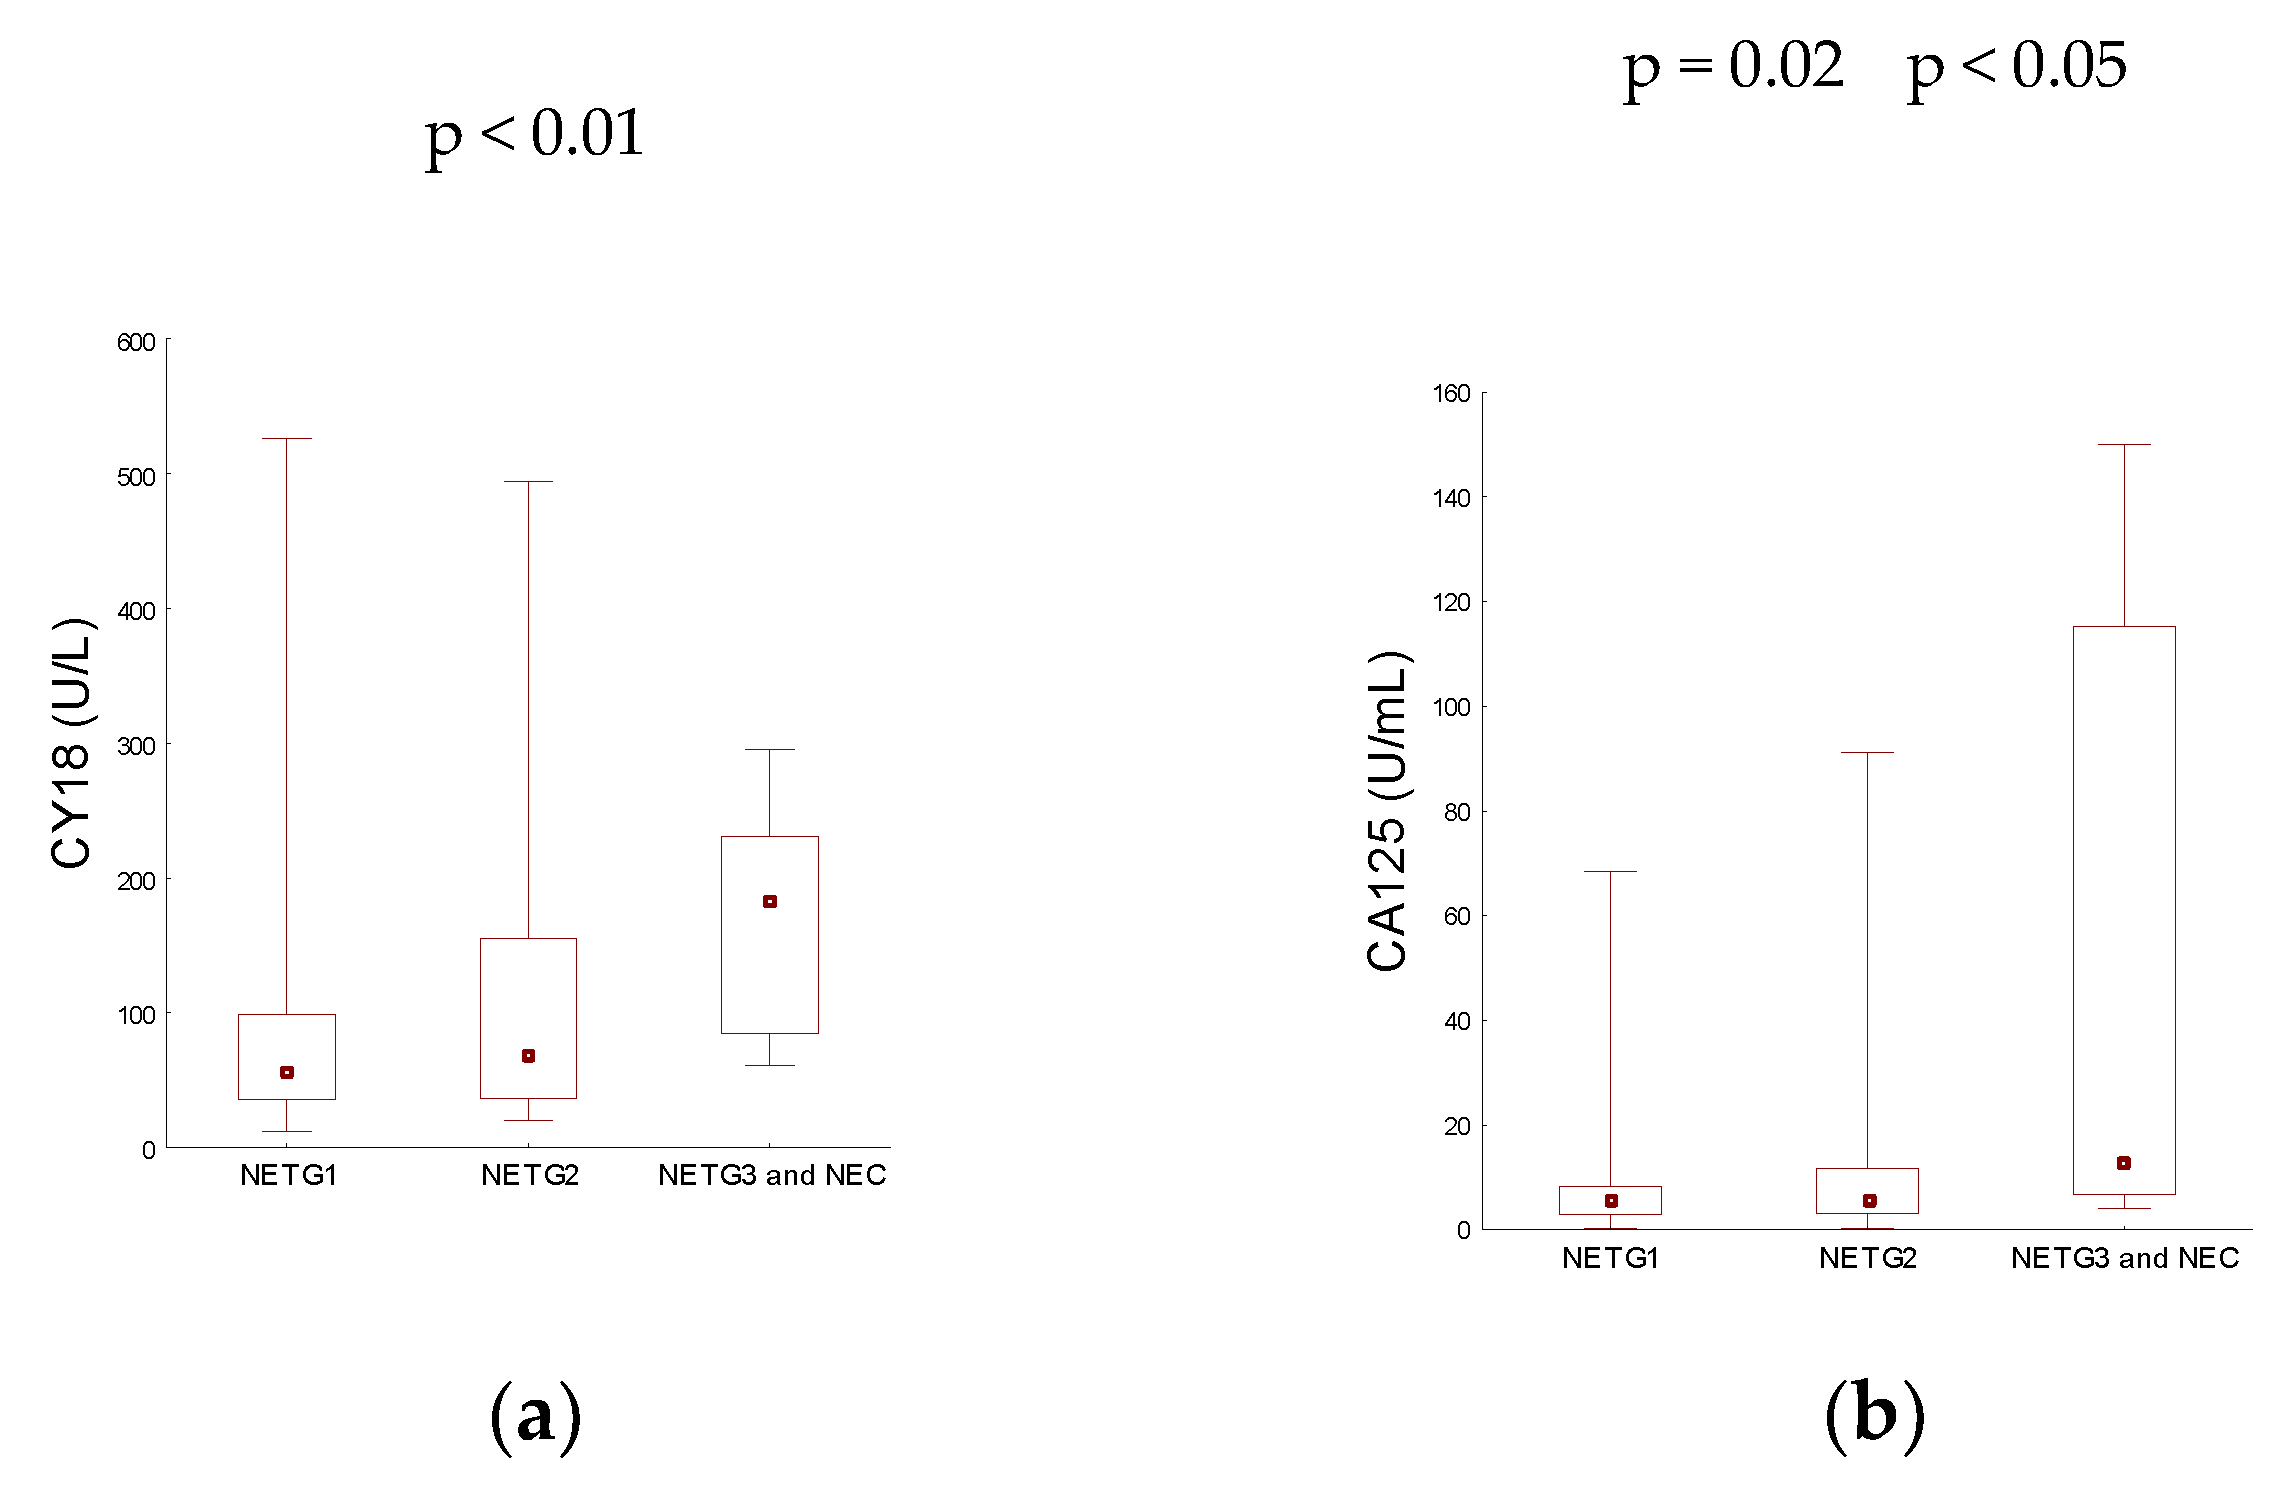
A significant difference in serum concentrations was noted between the PNEN grades for CY18 and CA125 (Kruskal-Wallis statistic 9.59 and 7.36 and p < 0.01 and 0.03, respectively).
Specifically, G3 disease (169.15 ± 85.31 (182.98 [84.51-230.81])) had significantly higher CY18 levels than G1 disease (78.31 ± 75.75 (57.48 [35.36-98.48])), p < 0.01 (Figure 3a). There was no significant difference between G1 and G2 (115.27 ± 115.32 (69.87 [35.96-155.46) (p = 0.46), as well as G2 and G3 grades (p = 0.08). There were few G3 samples for an accurate statistical analysis, but the levels were the highest.
For PNENs, CA125 levels in G1 (7.04 ± 8.76 (5.99 [2.93-8.37]) and G2 (9.95 ± 14.85 (5.61 [3.15-11.78) were similar but significantly lower than in G3 disease (52.96 ± 64.21 (12.54 [6.89-115.34] (p = 0.02). There was also a significant difference between G2 and G3 grades (p < 0.05) (Figure 3b).

3.4. R Spearman’s Correlation

Serum concentrations of tumour markers were significantly correlated with various variables (Table S9 in supplementary material). The most correlations were observed for CY18, which correlated with AFP, BMG, CA125, CEA, and ferritin. In addition, several markers have been shown to correlate with age (BMG, CEA, CY18, and ferritin).

4. Discussion

Pancreatic neuroendocrine neoplasms are the main reasons for death, especially if diagnosed in an advanced, disseminated stage. PNENs are generally difficult to diagnose and treat since they are often identified in their advanced (metastatic) stage [14,15]. Only once the disease spread the most symptomatology is present. Unfortunately, the common complaints are often dismissed as being nonneoplastic in origin [16].
The immunohistochemical examination of the tumor is the standard examination for diagnosing PNENs. Treatment of choice, if possible, mainly consists of surgery (localized and locally advanced disease). For metastatic disease, there is systemic therapy based on somatostatin analogs, mTOR inhibitors, peptide receptor radionuclide therapy, and cytotoxic chemotherapy [1].
Many factors, like disease stage, tumor grade, and functional status, influence prognosis. In our study group, most of the PNEN were well-differentiated (93.04%) and non-functional (93.91%).
The imaging procedure and markers measurements are also essential in the diagnosis process. Patients with symptomatic PNENs usually undertake a biochemical blood analysis first, including serum markers assessment.
Therefore, we aimed to prospectively evaluate the accuracy of selected tumor markers' diagnostic and predictive value. Given the TNM 8th edition classification, which estimates the prognosis based on the tumor anatomy [17], we also assessed tumour markers concentrations depending on disease stages of PNENs, including localized, regional metastatic, and distant metastatic disease.
Over three years, we evaluated the tumor marker levels in 155 subjects, including 115 patients with PNEN and 40 controls. Our data demonstrate that some tumour markers were a fair diagnostic for PNEN. BMG, CA19-9, CEA, CY18, and ferritin concentrations in PNEN patients were significantly higher than in controls (p < 0.01). The highest AUC ≥ 0.7 for differentiating PNEN patients from controls had CY18, CA19-9, and ferritin (p < 0.001). Our assessment of the tumour markers in PNENs found the assay of CY18, CA19-9, and ferritin to be mild accurate (68%, 73%, and 77%, respectively) and have a sensitivity (65, 78, 84%) and specificity (78, 58, 58%) for detecting PNENs compared to controls.
This project included patients enrolled at a one-center. Still, as a Center of Excellence (CoE), we had the availability of anatomical and functional imaging procedures and surgical histology data for all patients with PNENs. Therefore, we could assess the disease extent and were able to identify the correlation with clinical and serum biomarker data.
Our study does have some limitations. These include the relatively low numbers of control subjects compared to PNEN patients, the incomplete follow-up data on all patients, the absence of a centralized review of histology, and a paucity of G3 neoplasms.
In the next step in the current study, we questioned whether the tumour marker levels differed according to the disease stage. We observed that PNEN disease was localized in 63 patients, 8 had regional metastasis, and 44 exhibited distant metastasis (In our PNEN cohort, 63 had localized tumors, 8 had regional metastases, and 44 showed distant metastases). Serum levels of tumour markers were assessed depending on the presence of metastatic disease. PNEN patients with regional and distant metastases also exhibited significantly higher CY18, CA125, and CEA levels than those without metastases (p < 0.05). We also established the utility of the tumour markers in subjects with and without metastatic disease.
Our results are consistent with previous observations in a large case-control study by Xiao Z et al. [18]. In their research, a considerable proportion of 322 PNEN patients had elevated levels of the following biomarkers: CA19-9 (11.9%), CA125 (7.5%), and CEA (12.8%). PNENs with elevated circulating CA19-9, CA125, or CEA concentration accounted for 23.4% of all PNENs. Additionally, CA19-9 (hazard ratio [HR] = 2.26, p = 0.019), CA125 (HR = 3.79, p = 0.004), and CEA (HR = 3.16, p = 0.002) were each independent prognostic variables for overall survival and correlated with distant metastasis (p < 0.001).
Our findings demonstrated that the tumour markers such as CY18, CA125, and CEA were accurate (65, 39, 94%, AUC 0.66; 0.64; 0.64, respectively) for differentiating disease from metastatic disease. The AUC value of these biomarkers < 0.7 is considered a poor predictive marker.
In contrast to our findings, in patients with pancreatic cancer, detecting serum tumour markers such as CA19.9, CEA, and CA125 was conducive to early cancer diagnosis and improved pancreatic cancer diagnostic efficiency [19]. In this analysis, the serum levels of CA19-9, CEA, and CA125 in patients with pancreatic cancer were significantly higher than those in patients with benign pancreatic diseases and healthy controls (p < 0.001). The sensitivity of CA19-9 was the highest among these, followed by CA125 and CEA. The sensitivity and specificity of joint detection of these tumour markers were above 90%, obviously higher than single detection of those markers in the diagnosis of pancreatic cancer.
In the Chinese study of Chen L and coauthors [20], the elevated level of AFP, CEA, CA125, or CA19-9 in GEP-NEN patients was related to poor survival. In this study, 170 patients with GEP-NEN were enrolled, including 57 (33.5%) cases of PNEN. Increased concentrations of AFP, CEA, CA125, and CA19-9 were found in 3 (1.8%), 19 (11.2%), 22 (12.9%), and 21 (12.4%) patients, respectively. Elevated CEA level was associated with G3 disease (p = 0.02), and elevated CA125 was related to distant metastasis (p = 0.00), while elevated CA19-9 was related to both G3 disease (p = 0.02) and distant metastasis (p = 0.01). GEP-NEN patients with elevated CEA, CA125, or CA19-9 had worse OS compared with their counterparts with median survivals of 14 months (p = 0.00), six months (p = 0.00), and ten months (p = 0.00), respectively. Furthermore, GEP-NEN patients with more than two increased biomarkers (median survival six months) had worse survival than patients with only one elevated biomarker (median survival 26 months, p = 0.00).
CA19-9, AFP, and CA 125 also have the potential to distinguish pancreatic neuroendocrine carcinoma (PNEC) from pancreatic ductal adenocarcinoma (PDAC). In the study by Zhuge X et al. [21], twenty-one cases of PNEC and 33 of PDAC were retrospectively evaluated. Abnormal CA19-9, CEA, and AFP were observed in 19.0% to 28.6% of PNECs. A higher level of AFP was more common in PNEC than in PDAC (33.3% vs. 3.0%, P < 0.05). The cutoff value of CA 19-9 for detecting PNEC was calculated as 38.5 U/mL or less, with 78.8% sensitivity and 80.0% specificity. These data confirmed that CA19-9, AFP, and CA 125 were predictors in differentiating PNEC from PDAC.
Another Chinese group [22] in Peking University Cancer Hospital had retrospectively studied the prognostication and management role of biomarkers (io. CEA, and CA19-9) in 640 patients with gastroenteropancreatic neuroendocrine carcinoma (GEP-NEC). They noted that CEA and CA19-9 concentrations were elevated in 28.5% and 21.3% of the population, respectively. The GEP-NEC patients with higher CEA and CA19-9 levels had worse median overall survival.
Shimizu Y et al. [23] described a case report of mediastinal neuroendocrine tumor (NET) (atypical carcinoid) in a 54-year-old woman with an increased CA19-9 (95.3 U/ml) level detected on health screening. When the patient had the disease extended, the CA19-9 concentration was higher (CA19-9: 413 U/ml if she developed mediastinal lymph node metastasis and CA19-9: 2303 U/ml in multiple bone metastases stage).
In our ENETS CoE, the histological diagnosis of every PNEN patient was reviewed by an expert pathologist with huge experience at NEN. The majority of NEN tumors were grade G1 and G2. Only 7% of all PNEN had G3 disease (3 well-differentiated PNETs, and five poorly differentiated PNECs). According to the PNEN grades, we noted a significant difference in serum levels between them for CY18 and CA125. Specifically, G3 disease had significantly higher CY18 levels than G1 (p < 0.01). There was no significant difference between G1 and G2 (p = 0.46), as well as G2 and G3 grades (p = 0.08). There were small amounts of G3 samples for an accurate statistical analysis, but these patients’ levels were the highest. CA125 levels in NET G1 and NET G2 were similar but significantly lower than in NEN G3 (p = 0.02). There was also a significant difference for CA125 between G2 and G3 grades (p < 0.05).
Similar results were also confirmed by Gao C et al. [24], who observed that CA19-9, CEA, and CA125 levels have predictive value in the prognosis of high-grade GEP-NENs and CA19-9 levels can predict the prognosis of NECs. Their study aimed to explore the importance of CA19-9, CEA, and CA125 in differentiating NETs G3 from NECs and the prognosis prediction of high-grade GEP-NENs. This study recruited 72 patients diagnosed with high-grade GEP-NENs, including well-differentiated neuroendocrine tumors grade 3 (NETs G3) and poorly differentiated neuroendocrine carcinomas (NECs). Elevated serum CA19-9, CEA, and CA125 levels indicated poorer survival of high-grade GEP-NEN patients. Serum CEA level was dramatically higher in NECs than in NETs G3 (p = 0.025). Therefore, it can be used to distinguish NECs from NETs G3.
In opposition to this finding, researchers from Royal Marsden Hospital [25] revealed that serum AFP, CA19-9, did not have prognostic significance in colorectal carcinoma. On the other hand, serum CEA, CA125, was related to conveying an independent poor prognosis. This was the most extensive prognostic study using a prospectively acquired database of 377 patients with advanced colorectal adenocarcinoma.
Correlations with tumor markers were also evaluated. A positive correlation was found between tumour markers themself and tumour markers and age. These results indirectly demonstrate the relationship between studied markers and the age of study participants, which should be considered when patients and healthy volunteers are enrolled in the study.
There is a lack of studies investigating the relationship between traditional pancreatic cancer markers and PNENs. Our findings provide new insights into the connections between these markers and PNENs. Assessment of serum CY18, CA19-9, and ferritin levels may be helpful in PNENs in the diagnosis, and CY18, CA125, and CEA levels could serve as potential predictive biomarkers for PNENs (for regional and distant metastasis and high grade (G3) of disease).
Nevertheless, our data did not support the optimal efficacy of these biomarkers as a tool to facilitate clinical management. Also, as a diagnostic, these markers do not exhibit metrics consistent with the criteria for being a good or excellent biomarker (they are fair or poor diagnostic markers) [26].

5. Conclusions

CY18, CA19-9, and ferritin were serum biomarkers that fair diagnosed PNEN disease. Elevated CY18, CA125, and CEA levels correlated with clinical stages (regional and distant metastasis) and elevated CY18, CA125 with high grade (G3) of disease.

6. Limitations

This study did have several limitations. First, the study relies on blood samples from a single center with a single assessment of tumour markers. Second, the healthy subject group is relatively smaller than the PNEN patient group, and both groups are slightly female-dominated. Third, we had the absence of a centralized review of histology and a paucity of G3 neoplasia (< 7%).

Supplementary Materials

Table S1: The comparison of the studied tumor markers in patients with pancreatic neuroendocrine neoplasms (PNENs) and controls (Mann-Whitney U Test); Table S2: The serum tumor markers assay metrics in the diagnosis of patients with pancreatic neuroendocrine neoplasm (PNEN); Table S3: The comparison of the tumour markers in pancreatic neuroendocrine neoplasms – nonmetastatic vs metastatic disease (Mann-Whitney U-Test); Table S4: The serum tumor marker assay metrics in the diagnosis of patients with pancreatic neuroendocrine neoplasm (PNEN): metastatic vs nonmetastatic disease; Table S5: Tumor markers in patients with pancreatic neuroendocrine neoplasm according to the extent of disease; Table S6: Tumor markers in patients with pancreatic neuroendocrine neoplasm according to the TNM stages of the disease (I-IIIA, IIIB, IV); Table S7: Tumor markers in patients with pancreatic neuroendocrine neoplasm according to TNM stages of the disease (I-II, III, IV); Table S8: Tumor markers in patients with pancreatic neuroendocrine neoplasm according to the grade of disease; Table S9: Spearman’s coeffcients of the relationships among analyzed variables in patients with pancreatic neuroendocrine neoplasm.

Author Contributions

Conceptualization, V.R.; methodology, V.R.; software, V.R.; validation, V.R.; formal analysis, V.R.; investigation, V.R.; resources, V.R.; data curation, V.R.; writing—original draft preparation, V.R., A.Z., and M.L.O.; writing—review and editing, V.R. and B.K.K; visualization, V.R.; supervision, V.R.; project administration, V.R.; funding acquisition, V.R and B.K.K. All authors have read and agreed to the published version of the manuscript.

Funding

This research was funded by the Medical University of Silesia in Katowice, grant number: PCN-1-069/N/2/O.

Institutional Review Board Statement

The study was conducted by the Declaration of Helsinki and approved by the Ethics Committee of the Medical University of Silesia (protocol number PCN/CBN/0052/KB1/85/22.

Informed Consent Statement

Written informed consent was obtained from all subjects involved in the study to publish the paper.

Data Availability Statement

All data are available upon any reasonable request.

Conflicts of Interest

The authors declare no conflict of interest.

References

  1. Kos-Kudła, B.; Rosiek, V.; Borowska, M.; Bednarczuk, T.; Bolanowski, M.; Chmielik, E.; Ćwikła, J.B.; Foltyn, W.; Gisterek, I.; Handkiewicz-Junak, D.; et al. Pancreatic neuroendocrine neoplasms - update of the diagnostic and therapeutic guidelines (recommended by the Polish Network of Neuroendocrine Tumours). Endokrynol Pol. 2022, 73, 491–548. [Google Scholar] [CrossRef]
  2. Kos-Kudła, B.; Foltyn, W.; Malczewska, A.; Bednarczuk, T.; Bolanowski, M.; Borowska, M.; Chmielik, E.; Ćwikła, J.B.; Gisterek, I.; Handkiewicz-Junak, D.; et al. Update of the diagnostic and therapeutic guidelines for gastro-entero-pancreatic neuroendocrine neoplasms (recommended by the Polish Network of Neuroendocrine Tumours) [Aktualizacja zaleceń ogólnych dotyczących postępowania diagnostyczno-terapeutycznego w nowotworach neuroendokrynnych układu pokarmowego (rekomendowane przez Polską Sieć Guzów Neuroendokrynnych)]. Endokrynol Pol 2022, 73, 387–454. [Google Scholar] [CrossRef]
  3. Miller, H.C.; Drymousis, P.; Flora, R.; Goldin, R.; Spalding, D.; Frilling, A. Role of Ki-67 proliferation index in the assessment of patients with neuroendocrine neoplasias regarding the stage of disease. World J. Surg. 2014, 38, 1353–1361. [Google Scholar] [CrossRef]
  4. Bałdys-Waligórska, A.; Nowak, A. Neuroendocrine neoplasms of the digestive system—Current classification and terminology. Nowotwory 2021, 71, 26–37. [Google Scholar] [CrossRef]
  5. Nagtegaal, I.D.; Odze, R.D.; Klimstra, D.; Paradis, V.; Rugge, M.; Schirmacher, P.; Washington, K.M.; Carneiro, F.; Cree. I.A. WHO Classification of Tumours Editorial Board. The 2019 WHO classification of tumours of the digestive system. Histopathology 2020, 76, 182–188. [Google Scholar] [CrossRef]
  6. Kos-Kudła, B.; Rosiek, V.; Borowska, M.; Bałdys-Waligórska, A.; Bednarczuk, T.; Blicharz-Dorniak, J.; Bolanowski, M.; Boratyn-Nowicka, A.; Cichocki, A.; Ćwikła, J.B.; et al. Pancreatic neuroendocrine neoplasms — management guidelines (recommended by the Polish Network of Neuroendocrine Tumours). Endokrynol Pol. 2017, 68, 169–197. [Google Scholar] [CrossRef] [PubMed]
  7. Foulfoin, M.; Graillot, E.; Adham, M.; Rousset, P.; Forestier, J.; Hervieu, V.; Robinson, P.; Scoazec, J.Y.; Lombard-Bohas, C.; Walter, T. Treatment of metastatic pancreatic neuroendocrine tumors: relevance of ENETS 2016 guidelines. Endocr. Relat. Cancer. 2017, 24, 71–81. [Google Scholar] [CrossRef]
  8. O'Grady, H.L.; Conlon, K.C. Pancreatic neuroendocrine tumours. Eur. J. Surg. Oncol. 2008, 34, 324–332. [Google Scholar] [CrossRef] [PubMed]
  9. Yao, J.C.; Lombard-Bohas, C.; Baudin, E.; Kvols, L.K.; Rougier, P.; Ruszniewski, P.; Hoosen, S.; St Peter, J.; Haas, T.; Lebwohl, D.; et al. Daily oral everolimus activity in patients with metastatic pancreatic neuroendocrine tumors after failure of cytotoxic chemotherapy: a phase II trial. J. Clin. Oncol. 2010, 28, 69–76. [Google Scholar] [CrossRef] [PubMed]
  10. Tsutsumi, K.; Ohtsuka, T.; Mori, Y.; Fujino, M.; Yasui, T.; Aishima, S.; Takahata, S.; Nakamura, M.; Ito, T.; Tanaka, M. Analysis of lymph node metastasis in pancreatic neuroendocrine tumors (PNETs) based on the tumor size and hormonal production. J. Gastroenterol. 2012, 47, 678–685. [Google Scholar] [CrossRef]
  11. Van Loon, K.; Zhang, L.; Keiser, J.; Carrasco, C.; Glass, K.; Ramirez, M.T.; Bobiak, S.; Nakakura, E.K.; Venook, A.P.; Shah, M.H.; et al. Bone metastases and skeletal-related events from neuroendocrine tumors. Endocr. Connect. 2015, 4, 9–17. [Google Scholar] [CrossRef] [PubMed]
  12. Falconi, M.; Bartsch, D.K.; Eriksson, B.; Klöppel, G.; Lopes, J.M.; O'Connor, J.M.; Salazar, R.; Taal, B.G.; Vullierme, M.P.; O'Toole, D. Barcelona Consensus Conference participants. ENETS Consensus Guidelines for the management of patients with digestive neuroendocrine neoplasms of the digestive system: well-differentiated pancreatic non-functioning tumors. Neuroendocrinology. 2012, 95, 120–134. [Google Scholar] [CrossRef] [PubMed]
  13. Pavel, M.; O'Toole, D.; Costa, F.; Capdevila, J.; Gross, D.; Kianmanesh, R.; Krenning, E.; Knigge, U.; Salazar, R.; Pape, U.F.; et al. Vienna Consensus Conference participants. ENETS Consensus Guidelines Update for the Management of Distant Metastatic Disease of Intestinal, Pancreatic, Bronchial Neuroendocrine Neoplasms (NEN) and NEN of Unknown Primary Site. Neuroendocrinology. 2016, 103, 172–185. [Google Scholar] [CrossRef] [PubMed]
  14. Pavel, M.; Öberg, K.; Falconi, M.; Krenning, E.P.; Sundin, A.; Perren, A.; Berruti, A. Gastroenteropancreatic neuroendocrine neoplasms: ESMO Clinical Practice Guidelines for diagnosis, treatment, and follow-up. Ann. Oncol. 2020, 31, 844–860. [Google Scholar] [CrossRef] [PubMed]
  15. Gibson, W.E.; Gonzalez, R.S.; Cates, J.M.M.; Liu, E.; Shi, C. Hepatic micrometastases are associated with poor prognosis in patients with liver metastases from neuroendocrine tumors of the digestive tract. Hum Pathol. 2018, 79, 109–115. [Google Scholar] [CrossRef]
  16. Cives, M.; Strosberg, J.R. Gastroenteropancreatic Neuroendocrine Tumors. CA Cancer J Clin. 2018, 68, 471–487. [Google Scholar] [CrossRef]
  17. Perri, G.; Prakash, L.R.; Katz, M.H.G. Pancreatic neuroendocrine tumors. Current opinion in gastroenterology. 2019, 35, 468–477. [Google Scholar] [CrossRef]
  18. Xiao, Z.; Xu, H.; Strosberg, J.R.; Lu, R.; Zhu, X.; Deng, S.; Ding, L.; Ni, Q.; Warshaw, A.L.; Yu, X.; et al. EGFR is a potential therapeutic target for highly glycosylated and aggressive pancreatic neuroendocrine neoplasms. Int J Cancer. 2023, 153, 164–172. [Google Scholar] [CrossRef]
  19. Gu, Y.L.; Lan, C.; Pei, H.; Yang, S.N.; Liu, Y.F.; Xiao, L.L. Applicative Value of Serum CA19-9, CEA, CA125 and CA242 in Diagnosis and Prognosis for Patients with Pancreatic Cancer Treated by Concurrent Chemoradiotherapy. Asian Pac J Cancer Prev. 2015, 16, 6569–6573. [Google Scholar] [CrossRef]
  20. Chen, L.; Zhang, Y.; Chen, M.; Chen, J. [Prognostic value of carcinoembryonic antigen, alpha fetoprotein, carbohydrate antigen 125 and carbohydrate antigen 19-9 in gastroenteropancreatic neuroendocrine neoplasms]. Zhonghua Wei Chang Wai Ke Za Zhi. 2017, 20, 1002–1008. [Google Scholar]
  21. Zhuge, X.; Guo, C.; Chen, Y.; Feng, L.; Jia, R.; Zhao, Y.; Sun, K.; Wang, Z.; Chen, X. The Levels of Tumor Markers in Pancreatic Neuroendocrine Carcinoma and Their Values in Differentiation Between Pancreatic Neuroendocrine Carcinoma and Pancreatic Ductal Adenocarcinoma. Pancreas. 2018, 47, 1290–1295. [Google Scholar] [CrossRef] [PubMed]
  22. Zhang, J.; Cao, Y.; Zhang, P.; Zhang, X.; Li, J.; Zhou, J.; Wang, X.; Peng, Z.; Sun, Y.; Li, J.; et al. Serum Biomarker Status with a Distinctive Pattern in Prognosis of Gastroenteropancreatic Neuroendocrine Carcinoma. Neuroendocrinology. 2022, 112, 733–743. [Google Scholar] [CrossRef] [PubMed]
  23. Shimizu, Y.; Kanda, S.; Fukushima, T.; Kobayashi, T.; Kondo, R.; Koizumi, T. Increased carbohydrate antigen 19-9 expression in a thymic neuroendocrine tumor. Thorac Cancer. 2021, 12, 2949–2952. [Google Scholar] [CrossRef] [PubMed]
  24. Gao, C.; Fan, Z.; Yang, J.; Shi, M.; Li, Y.; Zhan, H. Diagnostic role and prognostic value of tumor markers in high-grade gastro-enteropancreatic neuroendocrine neoplasms. Pancreatology. 2023, 23, 204–212. [Google Scholar] [CrossRef]
  25. Webb, A.; Scott-Mackie, P.; Cunningham, D.; Norman, A.; Andreyev, J.; O'Brien, M.; Bensted, J. The prognostic value of CEA, beta HCG, AFP, CA125, CA19-9 and C-erb B-2, beta HCG immunohistochemistry in advanced colorectal cancer. Ann Oncol. 1995, 6, 581–587. [Google Scholar] [CrossRef]
  26. McShane, L.M.; Hayes, D.F. Publication of tumor marker research results: the necessity for complete and transparent reporting. J Clin Oncol. 2012, 30, 4223–4232. [Google Scholar] [CrossRef]
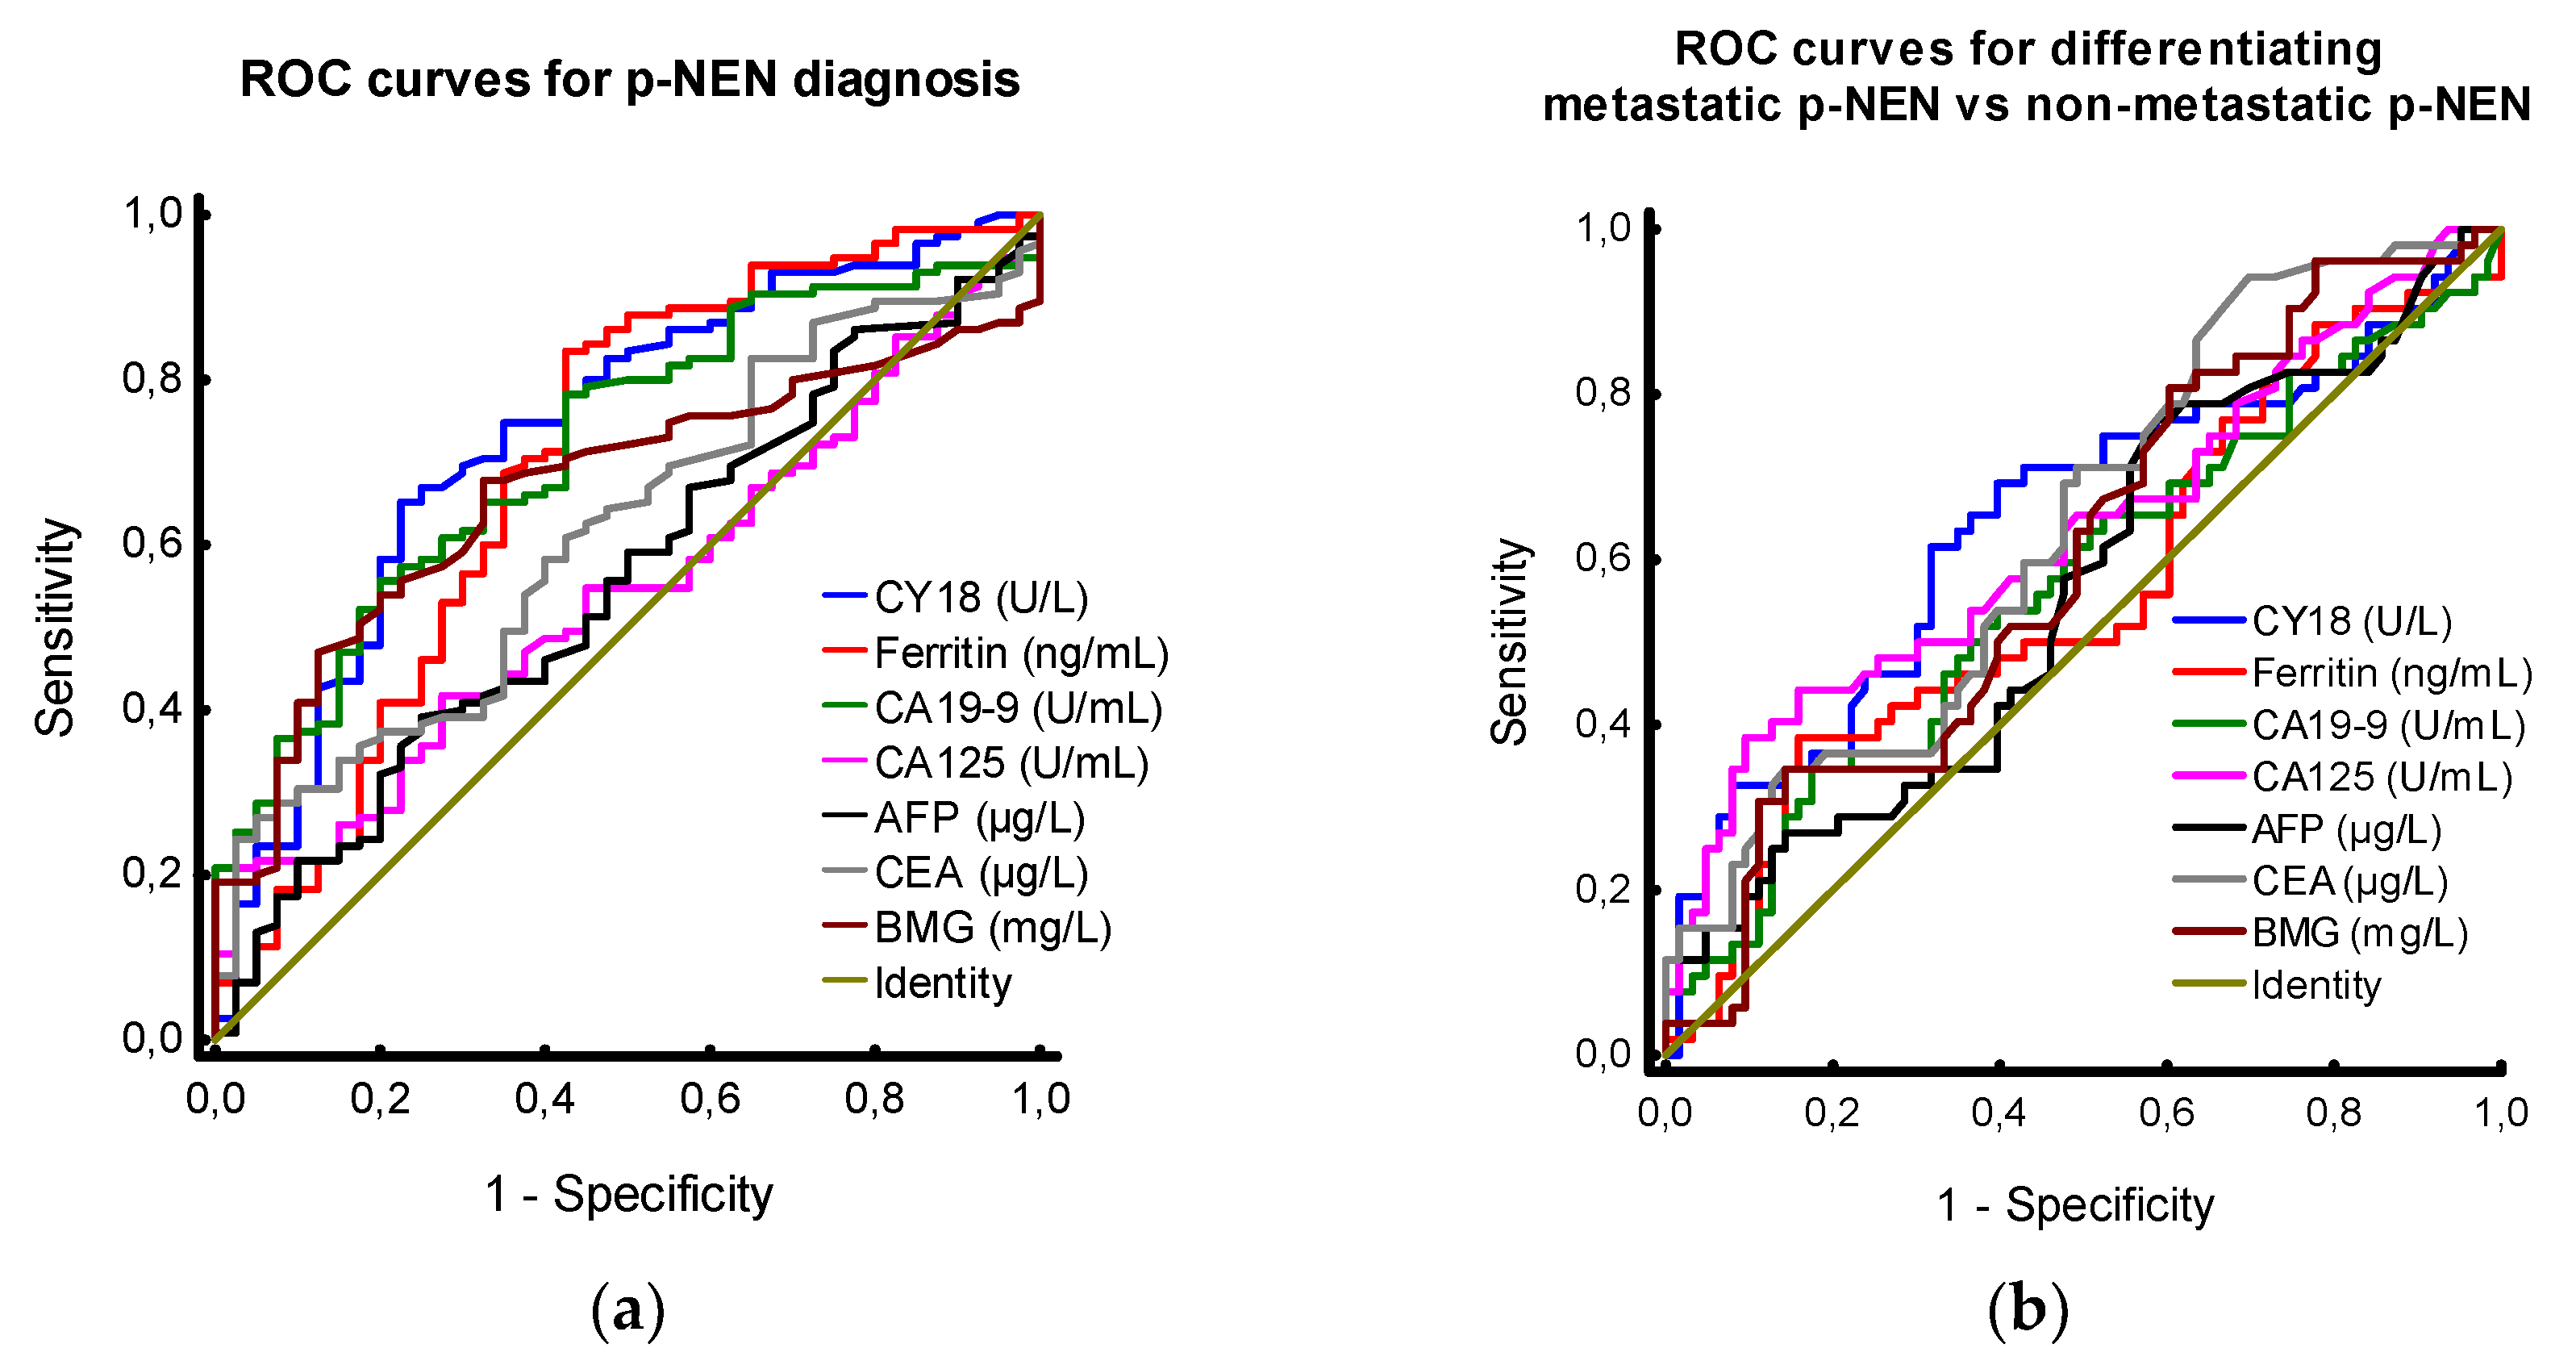
Figure 1. ROC curves for diagnosing PNENs and for differentiating metastatic PNENs from non-metastatic PNENs, (PNENs, pancreatic neuroendocrine neoplasms): (a) The AUROC for tumour markers in PNENs and controls; (b) The AUROC for tumour markers in metastatic and non-metastatic PNENs.
Preprints 76565 g001
Figure 2. Tumor markers in PNEN – relationship to histological assessment: (a) CY18 in PNEN by stage: CY18 levels were significantly elevated in patients with distant metastases compared to patients with LD (p = 0.0064). Concentrations were not significantly elevated compared to those with regional metastases but no distant metastases (p = 0.3179). Group analysis identified CY18 was significantly different across all three groups (KW statistic 9.97, p < 0.01); (b) CA125 in PNEN by stage: CA125 levels were significantly higher in patients with distant metastases compared to patients with LD (p = 0.04). Concentrations were not significantly higher than those with RM disease but no distant metastases (p = 0.92). Group analysis identified CA125 was significantly different across all three groups (KW statistic 6.28, p = 0.04); (c) CEA in PNEN by stage: CEA levels were significantly elevated in patients with distant metastases compared to patients with LD (p < 0.01). Concentrations were not significantly elevated compared to those with RM disease but no distant metastases (p = 0.10). Group analysis identified that CEA was significantly different across all three groups (KW statistic 11.20, p < 0.01). LD, localized disease; RM, regional metastatic; distant metastases, distant metastatic.
Preprints 76565 g002
Figure 3. Comparison of tumour marker levels in PNENs by disease grade: (a) CY18 levels were significantly lower in grade 1 than in grade 3 (p < 0.01); (b) CA125 levels were significantly higher in poorly differentiated PNENs (grade 3) than in well-differentiated PNETs (grade 1, p = 0.02 and grade 2, p < 0.05).
Preprints 76565 g003
Table 1. Demographic and clinicopathological data of the study cohort.
Variables PNEN
n = 115
Controls
n = 40
Number data data
Gender:
Males 49 (42.61 %) 19 (47.50 %)
Females 66 (57.39 %) 21 (52.50 %)
Age [years]
Mean (range) 52.88 (19 – 79) 48.53 (22 - 76)
Functionality status: N/A
Non-functional 108 (93.91 %)
Functional 7 (6.09 %)
Grade: N/A
G1 NET 60 (52.17 %)
G2 NET 47 (40.87 %)
G3 NET and G3 NEC 8 (6.96 %)
TNM stage: N/A
Stage I 31 (26.96 %)
Stage IIA 20 (17.39 %)
Stage IIB 6 (5.22 %)
Stage IIIA 6 (5.22 %)
Stage IIIB 8 (6.95 %)
Stage IV 44 (38.26 %)
Disease extend: N/A
Localized disease 63 (54.78 %)
Regional metastatic 8 (6.96 %)
Distant metastatic 44 (38.26 %)
Abbreviations: PNEN, pancreatic neuroendocrine neoplasm; NET, neuroendocrine tumour; NEC, neuroendocrine carcinoma; TNM, tumour–node–metastasis; N/A, not applicable;.
Disclaimer/Publisher’s Note: The statements, opinions and data contained in all publications are solely those of the individual author(s) and contributor(s) and not of MDPI and/or the editor(s). MDPI and/or the editor(s) disclaim responsibility for any injury to people or property resulting from any ideas, methods, instructions or products referred to in the content.
Copyright: This open access article is published under a Creative Commons CC BY 4.0 license, which permit the free download, distribution, and reuse, provided that the author and preprint are cited in any reuse.
Prerpints.org logo

Preprints.org is a free preprint server supported by MDPI in Basel, Switzerland.

Subscribe

© 2024 MDPI (Basel, Switzerland) unless otherwise stated