1. Introduction
Electricity shortages are currently a very common problem for many countries, especially in hot or cold seasons when air conditioning (AC) or heating is needed [
1]. Regular power outages harm an economy and cause major social problems. One reason for a spike in electricity consumption is the widespread use of AC systems during summer, which has been exacerbated by rises in ambient temperature in recent years as a direct consequence of climate change. With electricity shortages, however, people have to limit their use of AC systems, which leads to inconvenience in daily life and increases the risk of damaging these systems, so Solar-AC could be a very promising solution to this problem. As the name suggest, Solar-AC uses solar energy rather than mains electricity to condition the air and ensure a comfortable ambient temperature. What is more, solar energy is considered an extremely clean and renewable source of energy for mitigating electricity shortages [
2]. Indeed, if we couple Solar-AC systems with thermal energy storage systems, users can reduce their electricity costs by capitalizing on their distributed power. The most eco-friendly options that can provide more sustainable solutions to store energy are thermal and pumped-hydro storage systems. A combination of thermal and electrical storage systems could provide a more economical solution compared to the utilization of only electrical storage systems [
3,
4,
5]. Moreover, Energy storage on microgrids and nano grids could be a potential solution for providing a better electrical service for both insufficiently supplied and rural areas. These include small renewable energy collectors and Energy storage units typically installed in different buildings [
6].
Several studies have investigated the combination of solar energy with AC systems: In 2008, Hwang et al. discussed implementing solar collector technology together with various refrigeration technologies to maximize overall system efficiency. The researchers revealed that the adsorption cycle is more efficient than other technologies because it requires a lower heat source temperature. Furthermore, vacuum tube solar collectors have a greater efficiency compared to other types of solar collectors [
7]. In 2011, Albers et al. re-viewed developments on sorption cooling systems, which when using closed cycle or ceilings can facilitate solar-assisted cooling. The heat is discharged using a heat rejection coil or an open cycle [
8]. In 2015, Abdul Ghafoor and Munir analyzed different installed solar thermal-cooling technologies, both experimentally and numerically. They showed that the coefficient of performance (COP) increases when the hot water inlet temperature of the chiller is increased [
9]. Next, Abo Elmaaref demonstrated that the thermoelectric efficiency of a whole system could be increased with optimum design considerations and configuration, ultimately showing that thermoelectric-based cooling systems are a clean form of technology [
10]. For their part, Ayman and Esmail compared different solar cooling technologies and analyzed their advantages and disadvantages, finding that many modern commercial systems are based on absorption cycles [
11]. In 2017, Muhammad et al. calculated the overall performance of cooling technologies, ultimately recommending that adsorption cooling should be improved in the future [
12]. Swapnil and Tejaswini, meanwhile, found that hybrid desiccant/vapor-compression AC could be a better option due to its 30–80% increase in energy saving [
13]. In 2018, Ajib and Alahmer analyzed several available solar cooling technologies based on different attributes in order to establish their advantages and disadvantages. They found that the capacity of a chiller is affected by variations in the temperature range, while the cold water temperature depends on the COP value and the refrigeration capacity [
14]. Rishi et al. analyzed various factors that should be considered when choosing the right solar cooling technology for an implemen-tation. They found that active cooling has a greater efficiency than passive cooling, which is generally limited by natural ventilation. However, active cooling is more expensive than passive cooling due to the high electricity consumption of equipment [
15]. Naskar et al. designed and constructed an AC system supplied with direct current (DC) from photo-voltaic (PV) panels. The obtained results were analyzed and the technical effectiveness and economic competitiveness were found to be improved [
16]. Velasco et al., meanwhile, designed and built an alternative evaporative cooler pad using cotton fabric. They showed that saturation efficiency was strongly affected by humidity at the air inlet, with larger air flows leading to lower efficiency. They also revealed that air humidification increases re-markably with the inlet air’s dry bulb temperature, with it slightly affecting specific humidity [
17]. Next, Rasuli and Torii studied the feasibility of using solar-powered AC technology in real weather conditions, finding that this technology is sustainable, cost-effective, and environmentally friendly [
18]. In 2021, Aiman et al. examined a PV–AC coupled system and a solar cooling system where thermal energy was provided by solar collectors. They showed that solar cooling systems were a cost-effective and environmentally friendly alternative to traditional air conditioning systems that use electricity generated from fossil fuels. However, the PV-AC technology systems were found to be more promising, and their development could significantly affect the prospects of solar cooling systems [
19]. Lai et al. studied performance-enhancement strategies for integrating indirect evaporative technology with a solid desiccant, showing that this technology could enhance direct evaporative cooling applications under different climate conditions [
20].
Table 1 summaries the optimized performance parameters of the evaporative cooling systems.
The main objective of this study was to develop an experimental-like numerical predictive model for an evaporative cooling system with the aim of predicting the effects that the characteristics of the input air and water have on system efficiency. A steady-state numerical model, based on energy and mass transfer processes was built in the evaporative cooler. The model used is a ‘fundamental’ model based on the equations of mass and energy balance and on the direction and quantities of transfer of matter and heat from one phase to another. We consider that the air is dispersed in the water, in a homogeneous way, we also assume that the flows of water and air are stable and that their variations are negligible. Let us assume that heat and matter transfers are in a steady state. The thermodynamic data provided in the form of value tables are approximated and put into equations. This program makes it possible to determine the relative humidity, at the exit of the cooler, according to the input parameters. It gives us the opportunity to predict that humidification will take place. It allows us to choose the optimal conditions for a fixed input rate, air.
2. Materials and Methods
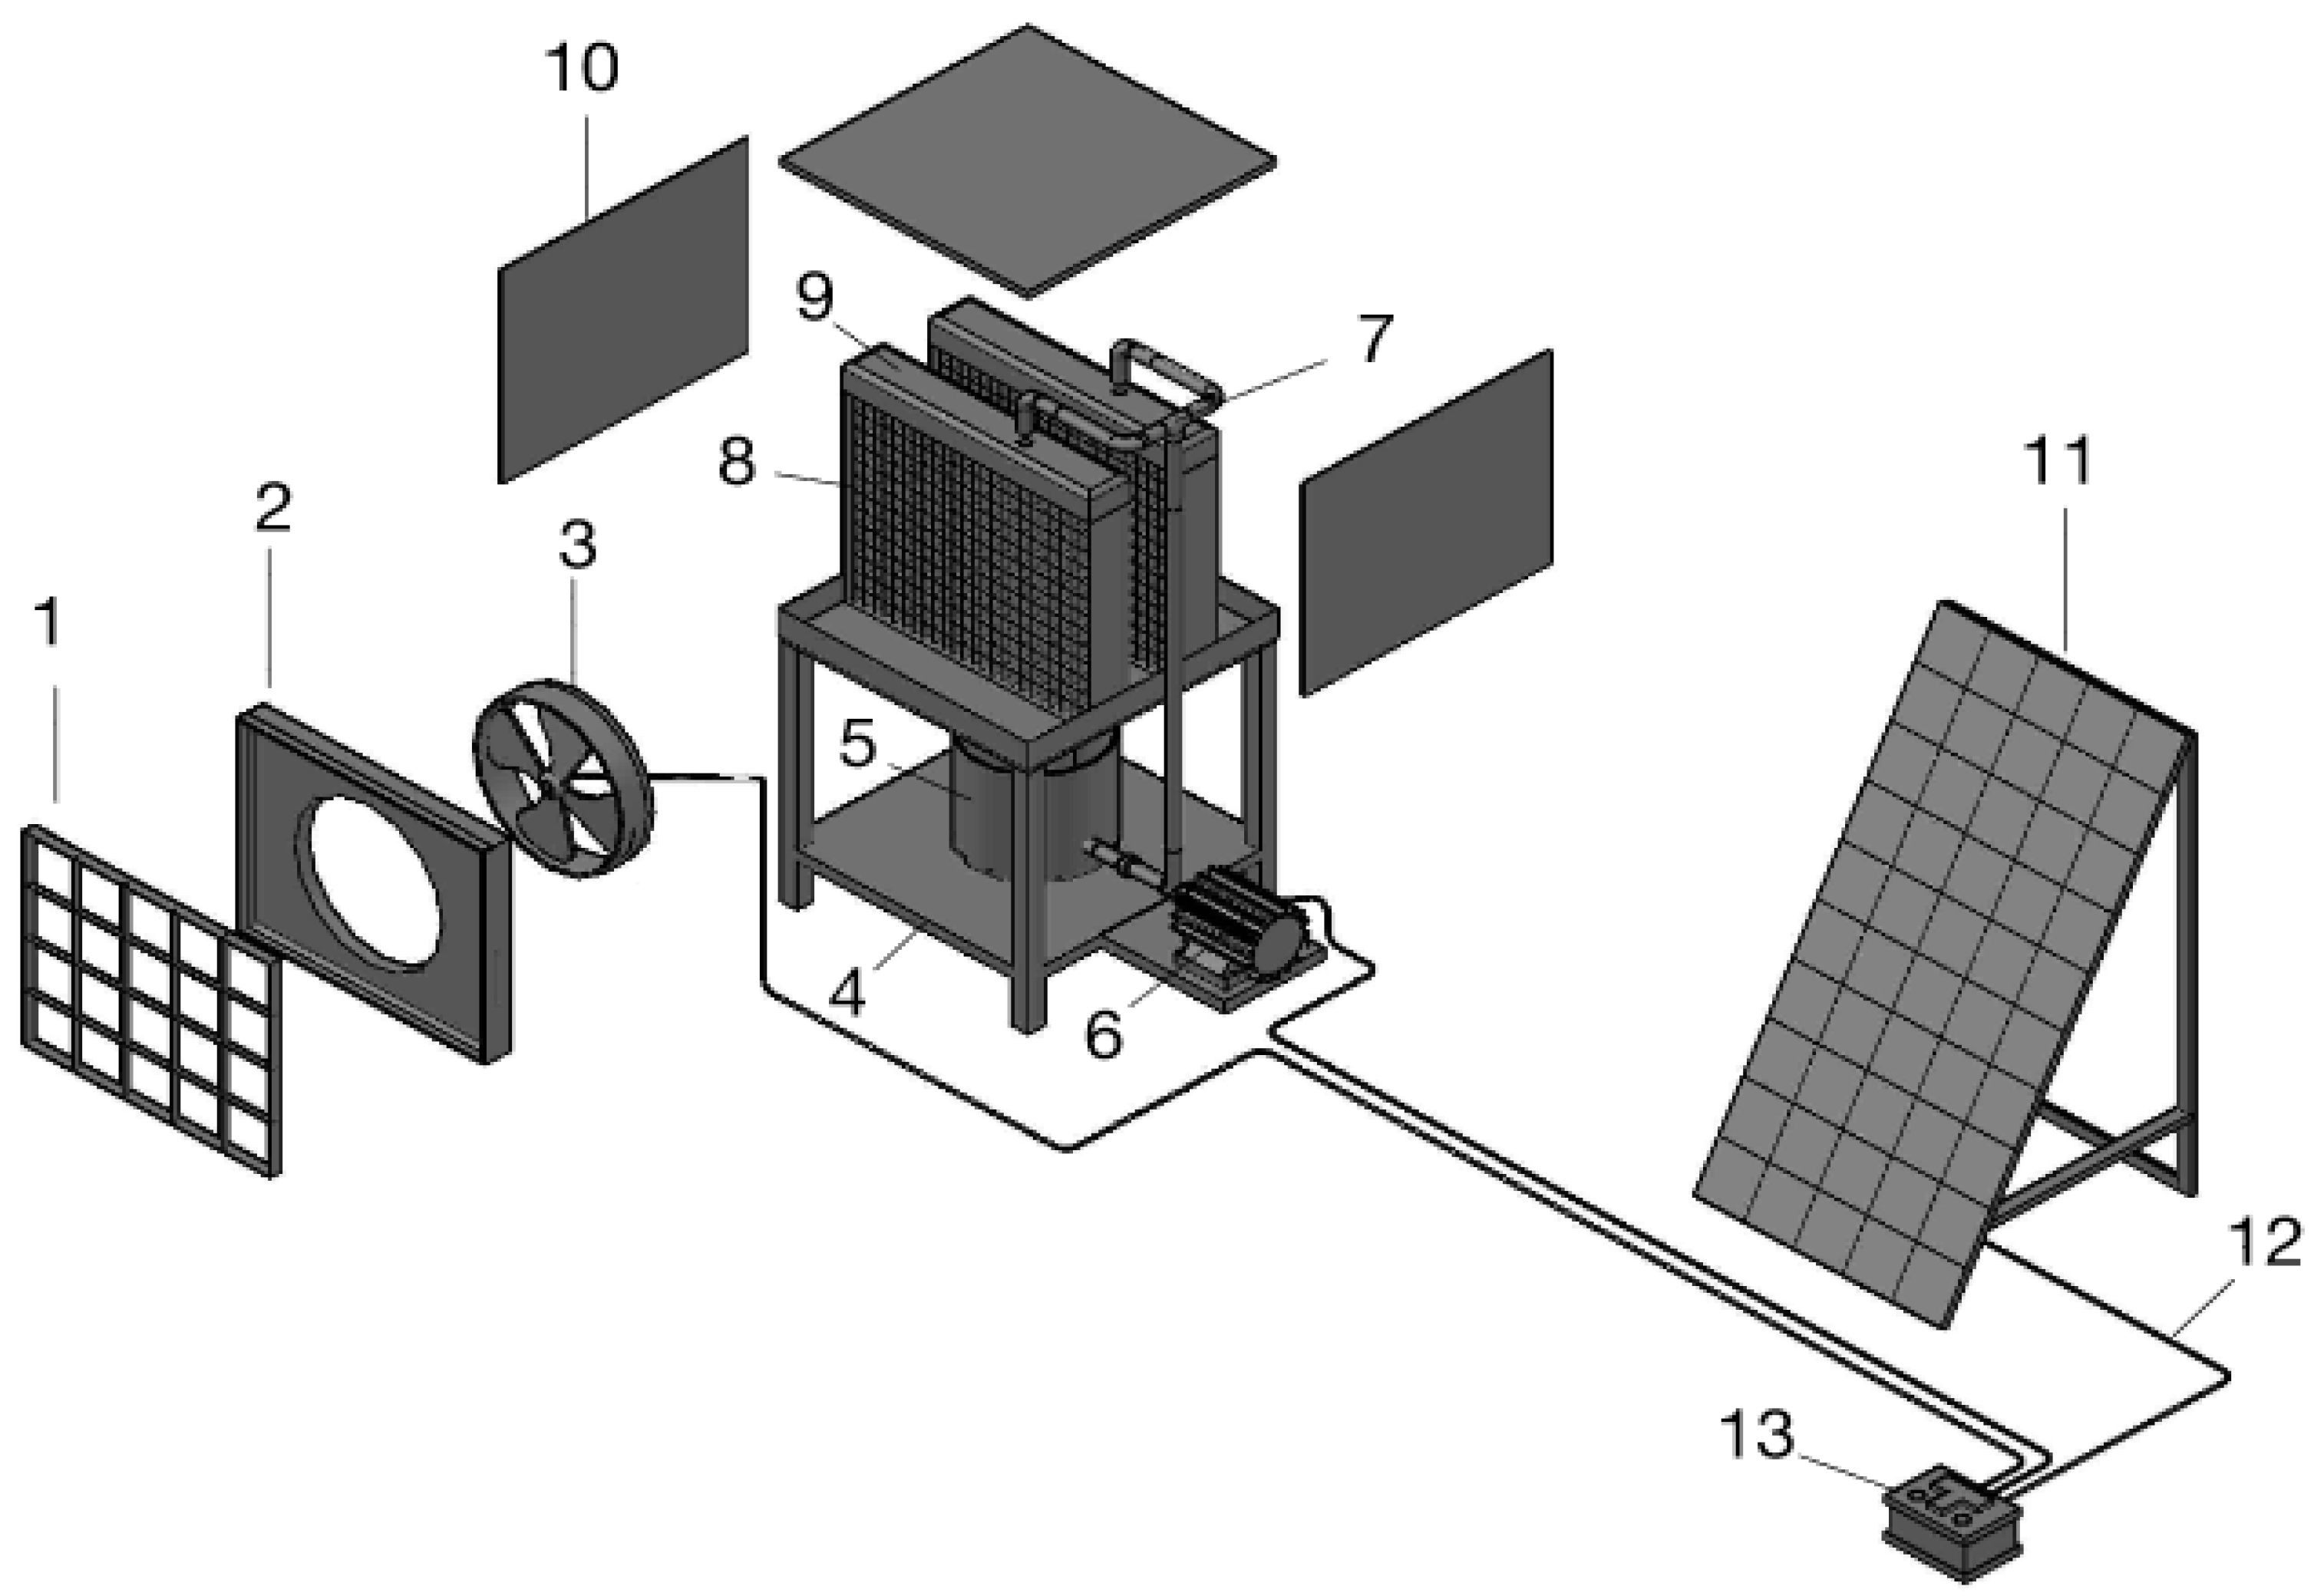
The model for our system is illustrated in
Figure 1. It comprises a water reservoir (5), a fan (3), and a pump to recirculate water (6). The fan and the pump are supplied with solar energy, which is delivered to a solar battery by the PV panel. The housing is louvered on three sides, with each side being fitted with a thick excelsior pad. A water distribution system with a PVC tube keeps these pads saturated with water when the cooler is operating. The system can be roof- or window-mounted. The adiabatic effi-ciency of this system is affected by the nature of the wetted pad, and a water spray system is used to humidify the dry air sucked in by the fan.
The evaporative cooling process occurs as follows:
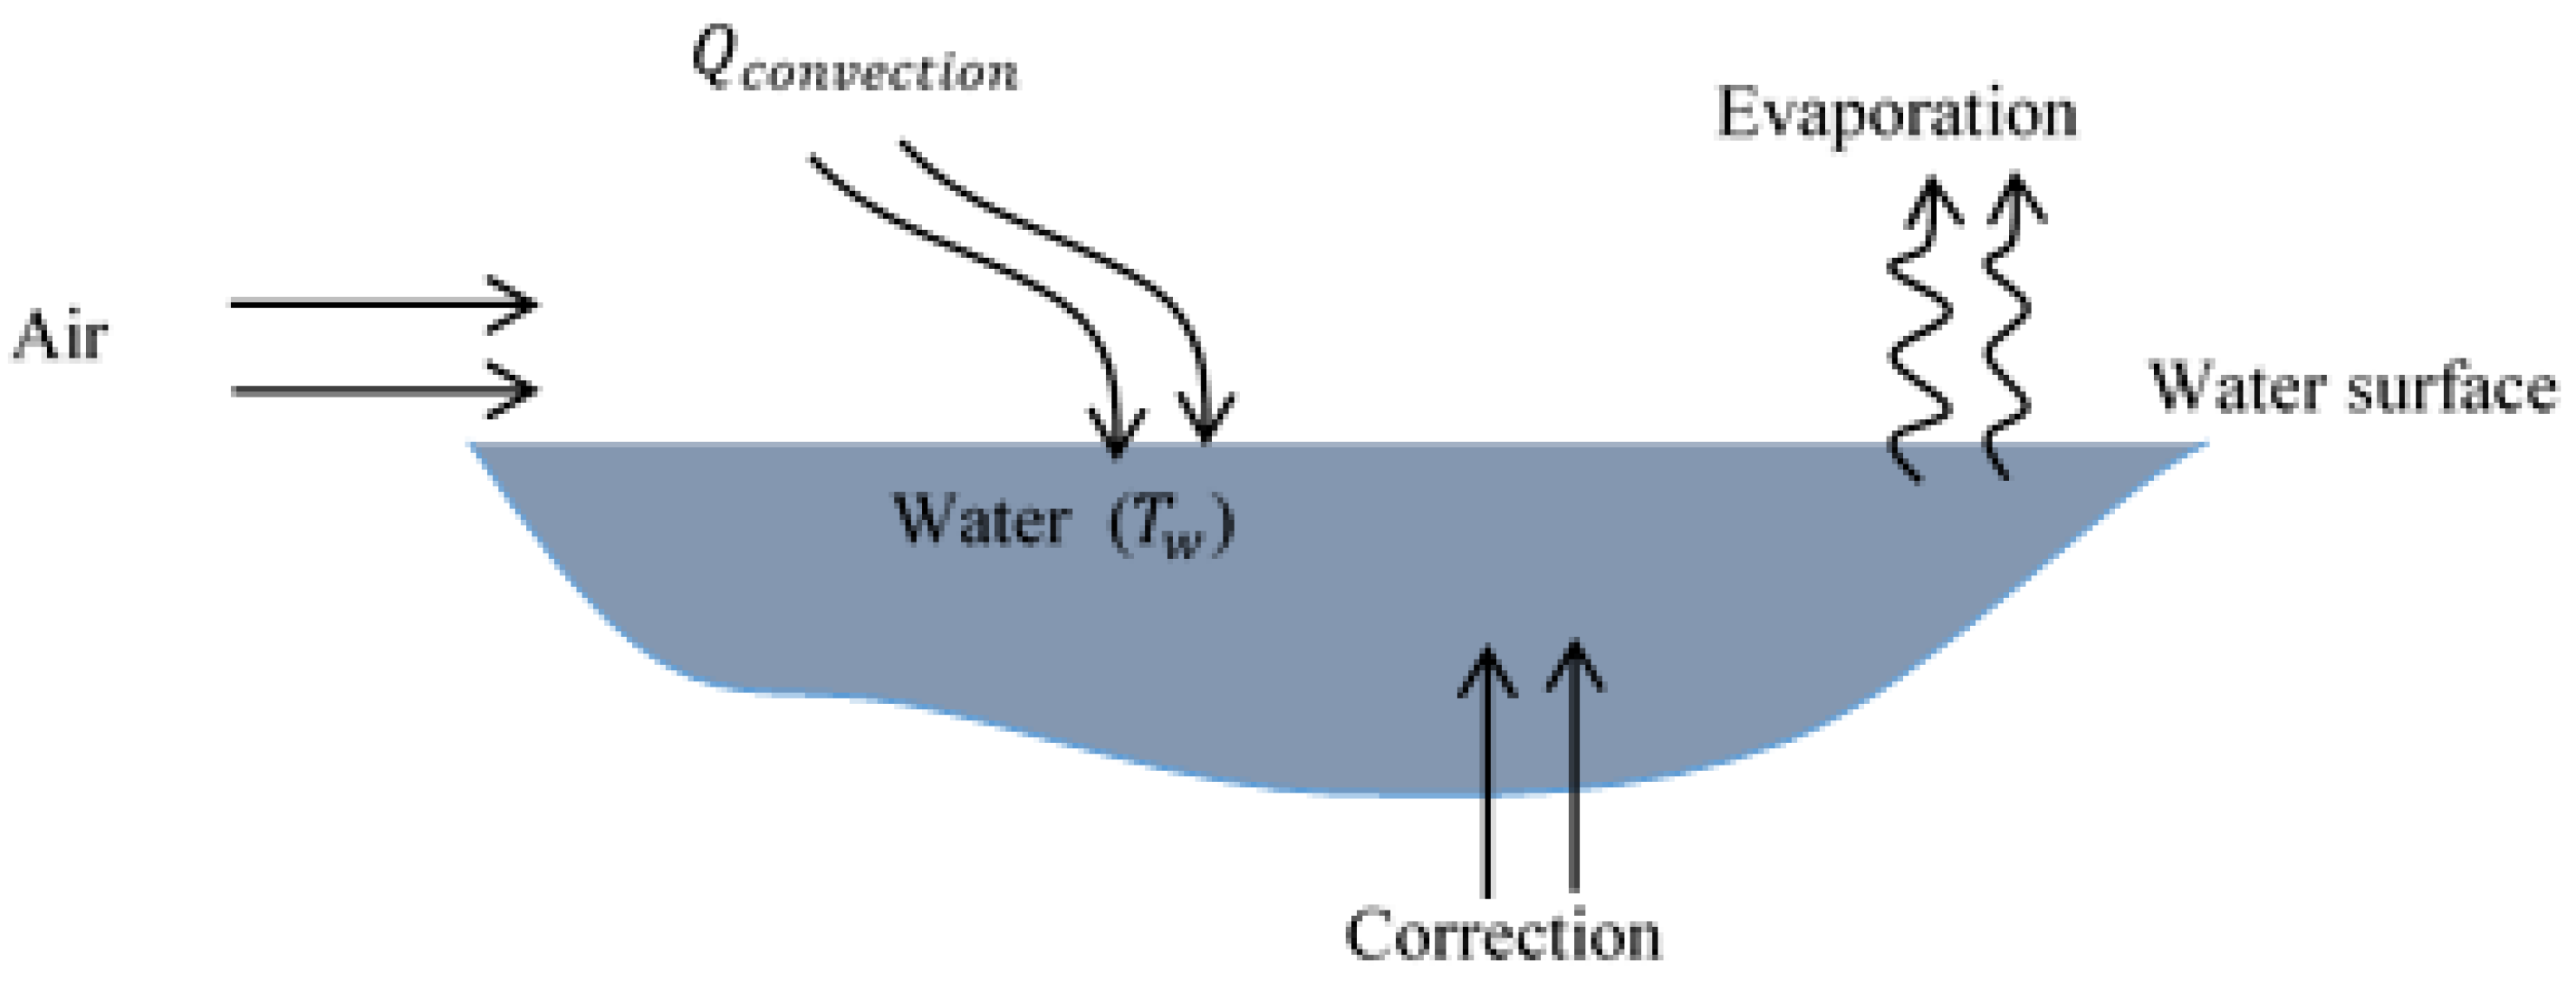
By passing dry air at dry-bulb temperature Tdb over a water surface at temperature TWb (< Tdb), a heat transfer occurs through convection between the air and the water. This heat transfer in turn causes a certain quantity of water to evaporate, as shown in
Figure 2. The water’s temperature does not vary, but its volume decreases over time, so it becomes necessary to replace the evaporated water. Air-cooling therefore occurs due to the convective heat transfer between the incoming air and the injected water, which absorbs energy in the form of latent heat until it evaporates.
3. Mathematical Modeling
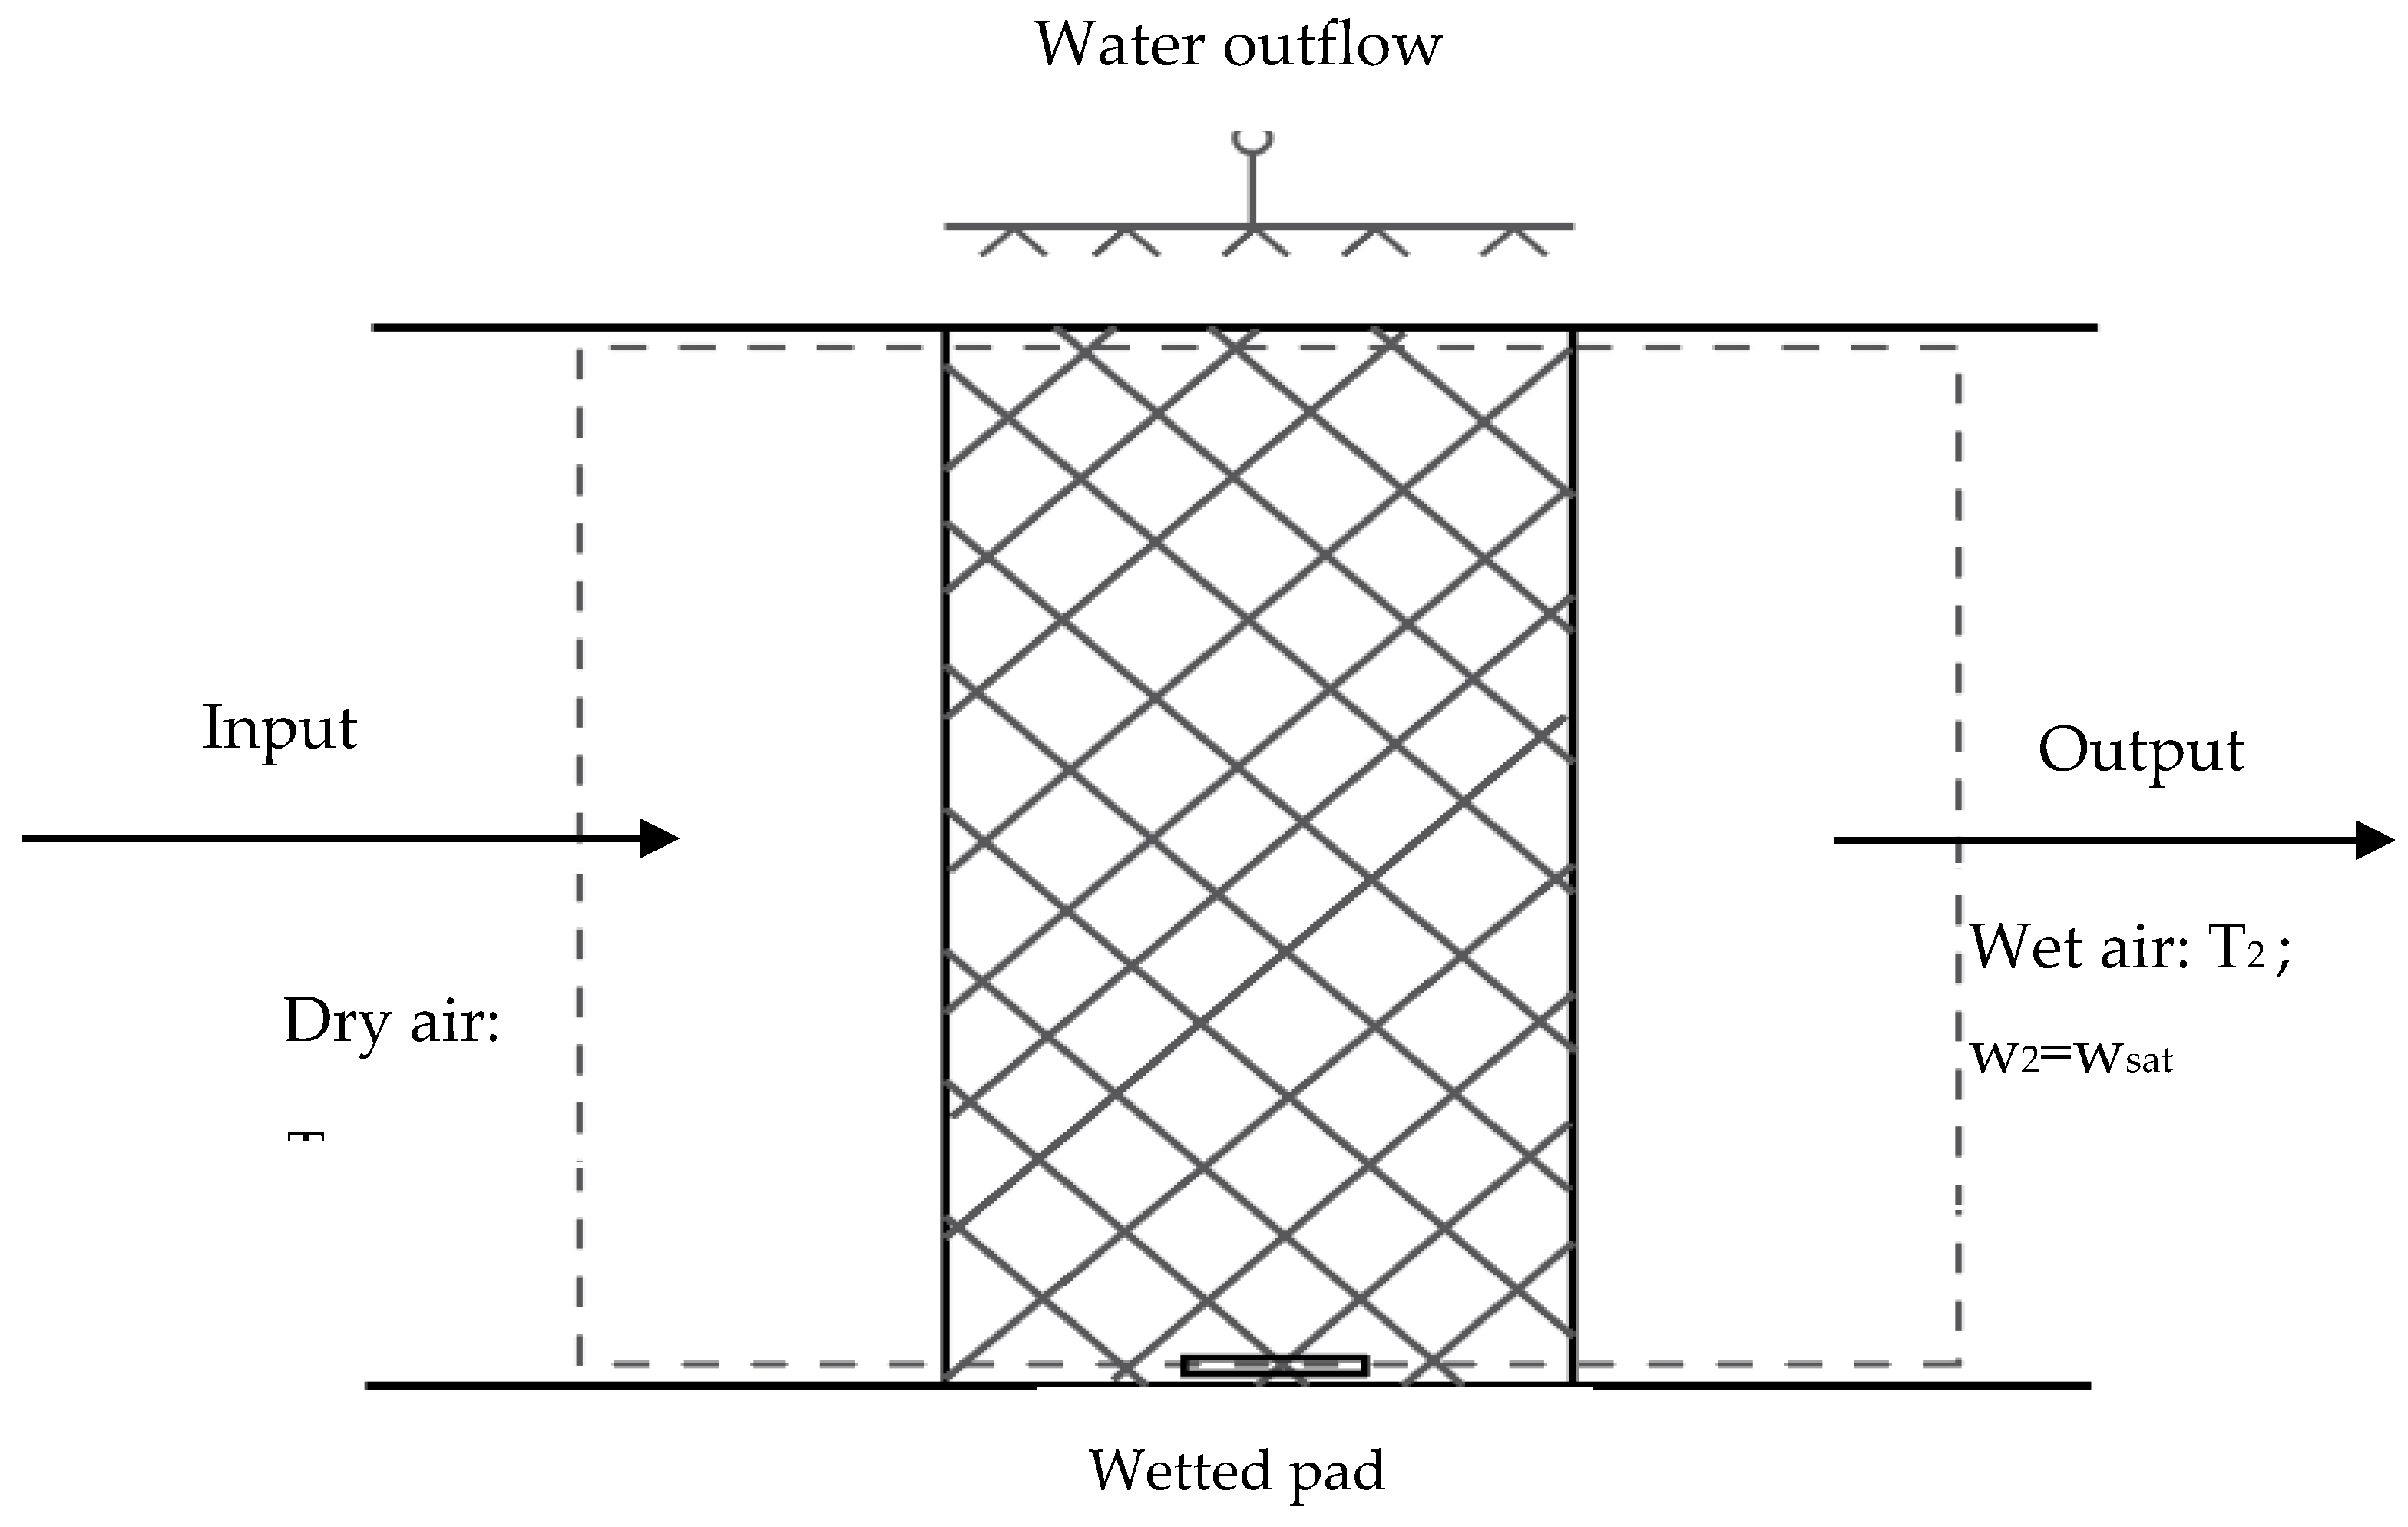
The evaporative cooling process of the PV–AC system is based on the mass and heat transfer that occurs between the hot air and the cold water. For this model, we will talk about how this system functions. Consider an air conditioning process: State 1 is the inputted dry air with dry-bulb temperature T
1, specific humidity w
1, enthalpy h
a1, and mass flow rate
. State 2 is the outputted moist air with wet-bulb temperature T
2, specific humidity w
2, enthalpy ha
2, and a mass flow rate
. The water spray system is shown in
Figure 3.
3.1. Mass Balance
The amount of air that comes in (state 1) is the same as the air that goes out [
31].
Water vapor comes in along with the air, and combined with the water that is being added, this equals the amount of water that leaves the system [
31]:
Where the specific humidity (w) is given by the following equation [
31]:
and φ is the relative humidity, given as follows [
31]:
P
sat is the saturating vapor pressure, which depends only on the air temperature, to be calculated through the
Cadiergues correlation. For a temperature variation of
, the saturating vapor pressure is obtained through the
Cadiergues correlation as follows [
31]:
3.2. Energy Balance
We assume that the system does not exchange heat or mechanical work with the external environment, so the energy conservation is reduced to enthalpy conservation. Thus, the enthalpy at the inlet is the sum of the enthalpy of the incoming air and that of the liquid water, while at the outlet, it is simply the enthalpy of the outgoing air [
31]:
The mass of water vapor added to the input dry air, as expressed in kg per kg of dry air, is given by the following equation:
Given the previous equations, we then get:
The term
can be removed from before the term
to then obtain:
The dew point temperature
is given by the following equation [
32]:
The efficiency of the evaporative cooler is defined by the following equation [
32]:
4. Numerical Simulation
Numerical code was developed and implemented in MATLAB to predict the performance of the modeled evaporative cooler. The input parameters, such as the dry-bulb temperature and relative humidity, were varied to simulate genuine climatic conditions, while the output conditions were set to ensure the desired level of human comfort.
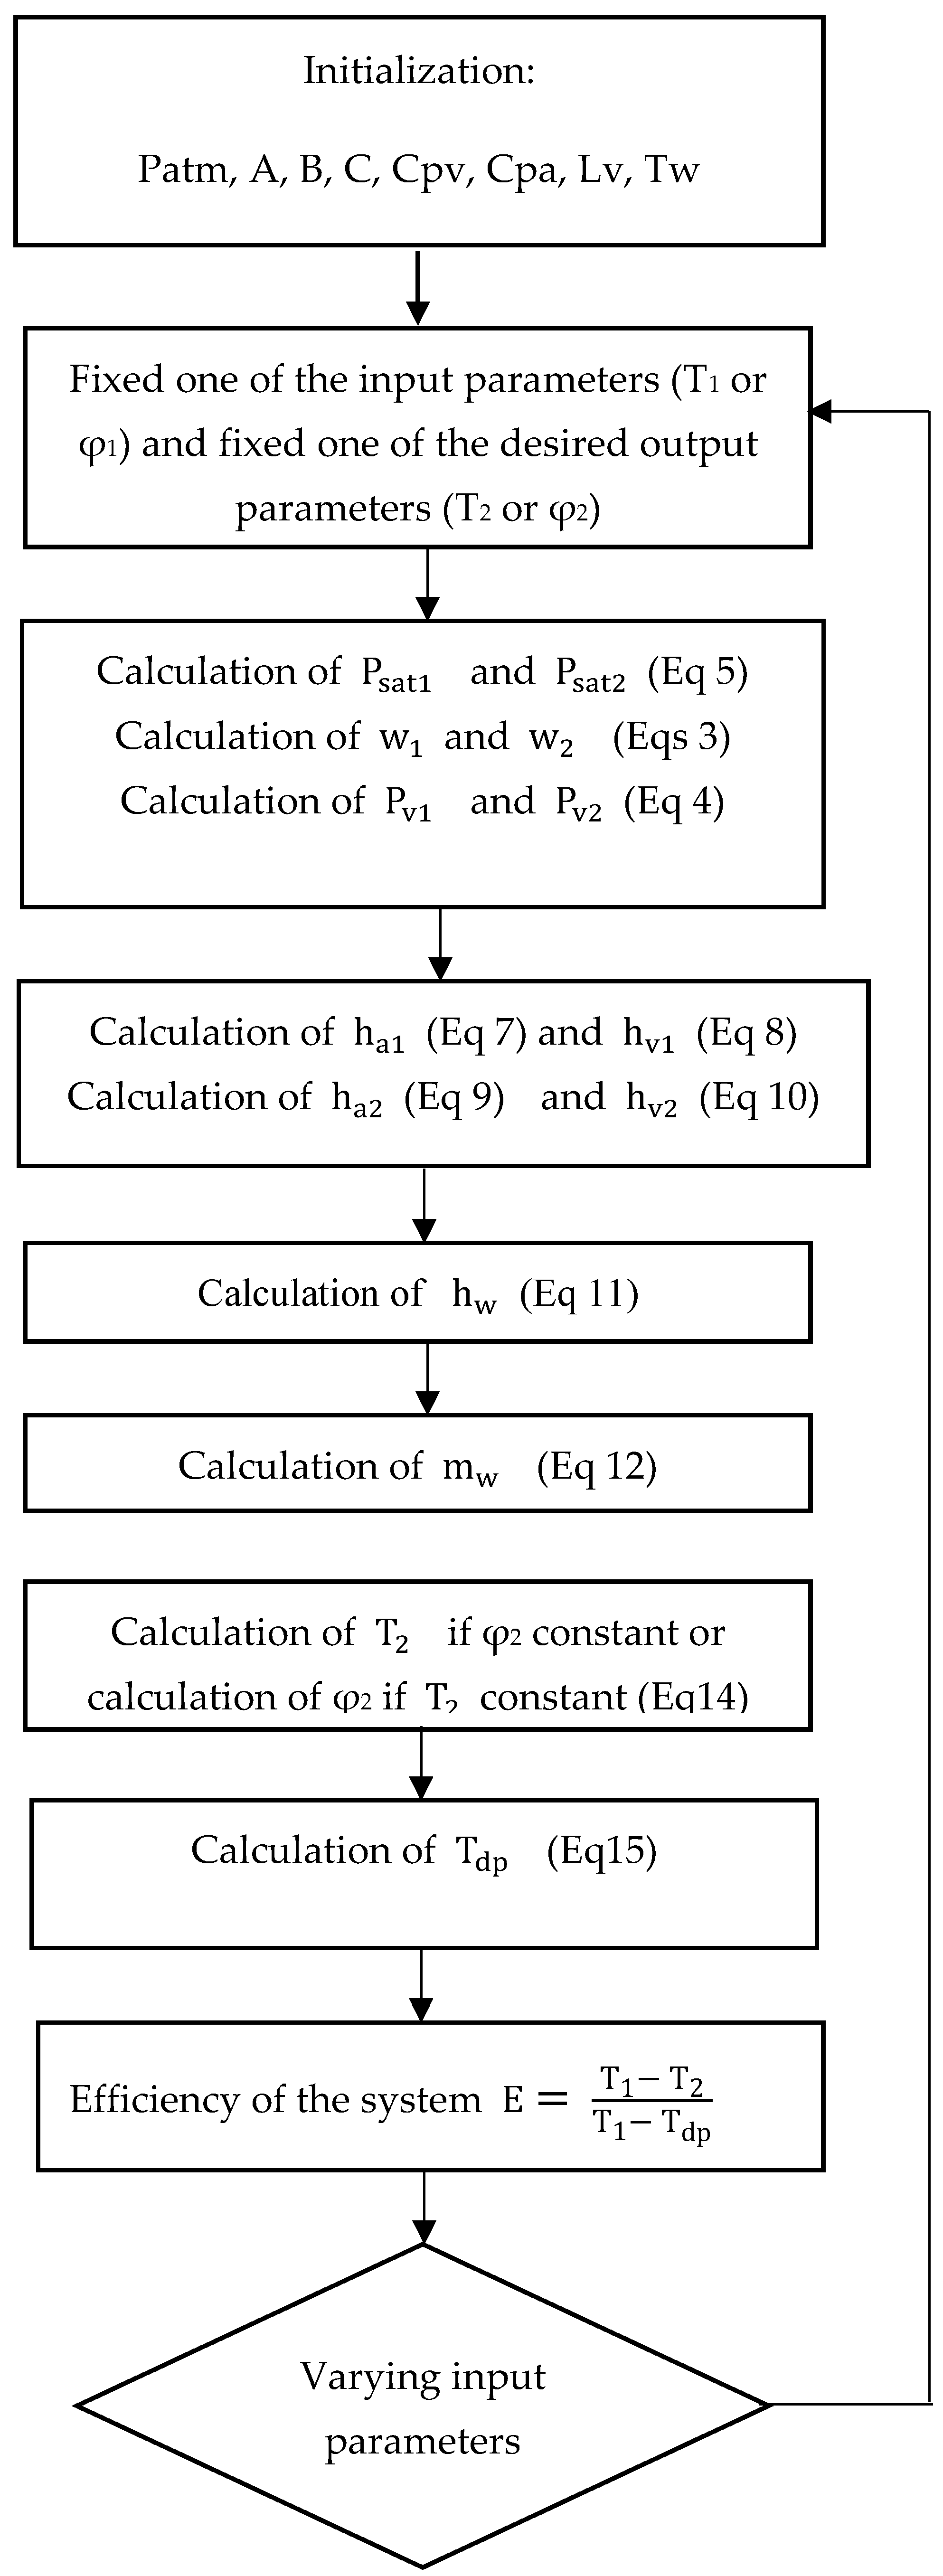
We initially fixed one of the two output parameters (i.e., the preferred temperature or relative humidity for the wet air). We then analyzed the effect of the input parameters on the output parameters, the output and input enthalpies, the enthalpy of the added water, the mass of the added water, and the efficiency of the evaporative cooler. The flowchart presented in
Figure 4 depicts the multistep procedure that was adopted to solve the heat and mass transfer equations.
5. Results and Discussion
5.1. Effect of Dry-Bulb Temperature on the Wet Air’s Relative Humidity
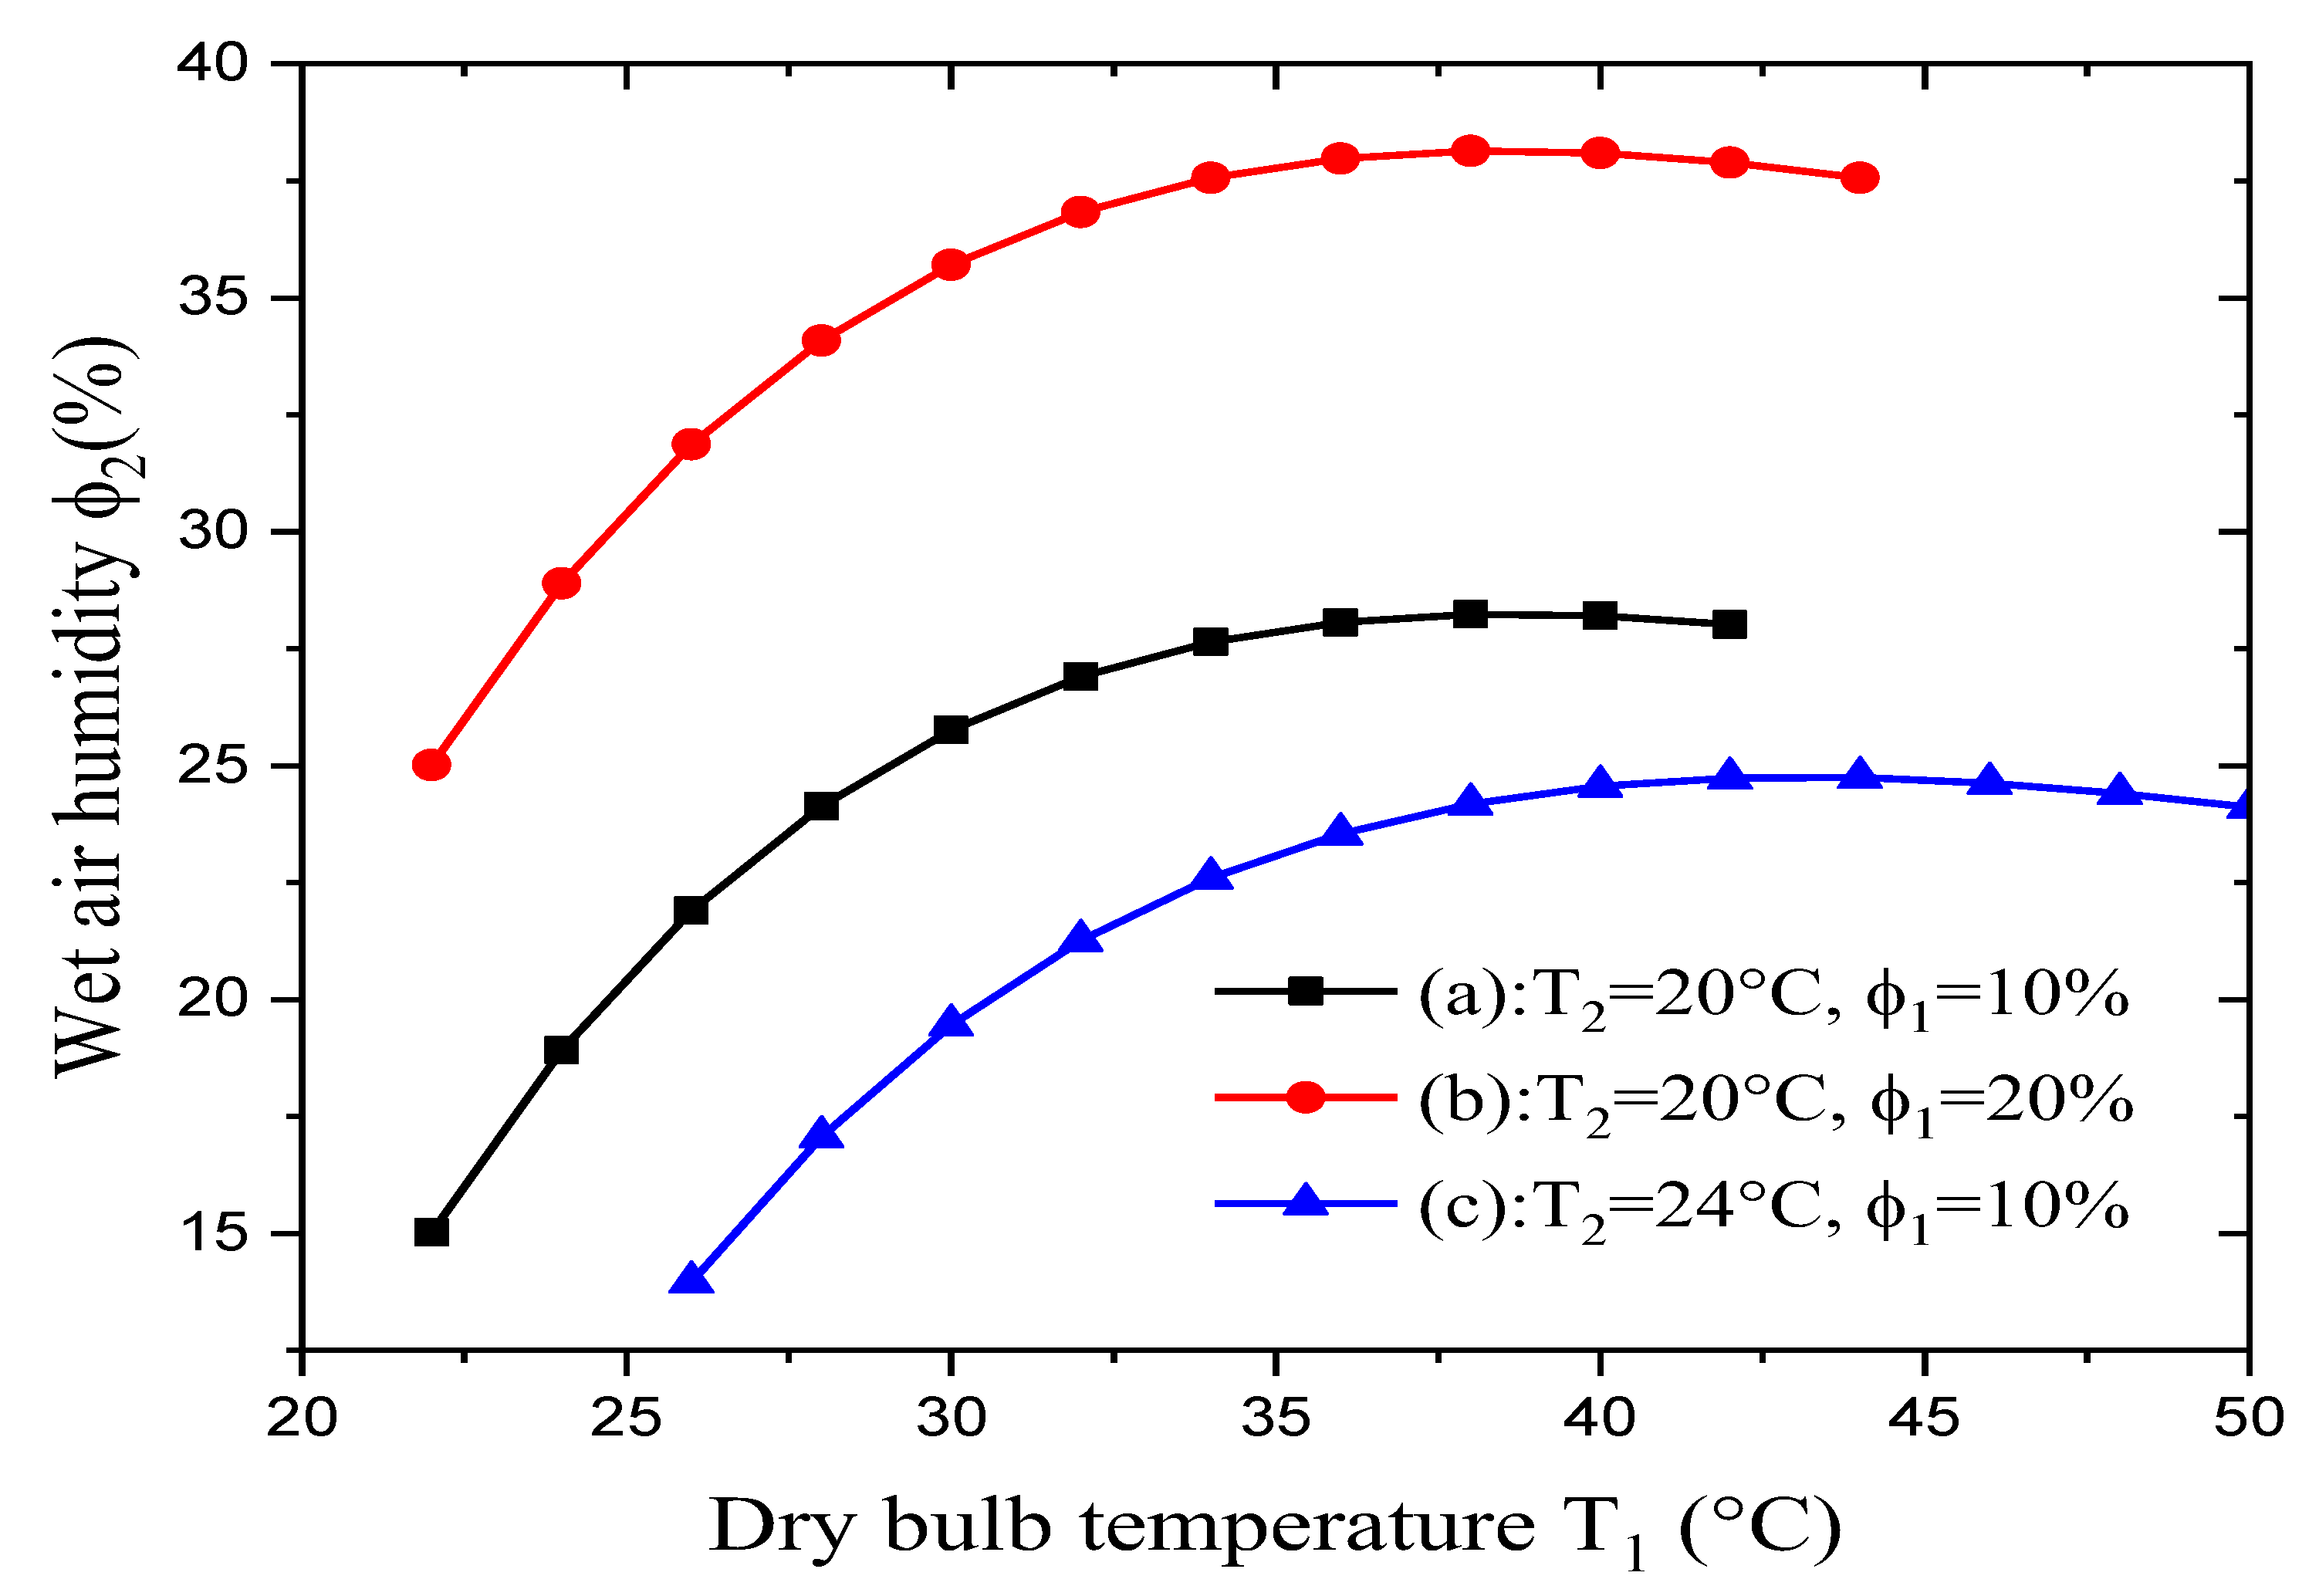
Figure 5 shows the variation in relative humidity φ
2 of the wet air when varying the dry air’s temperature T
1. The simulations obtained various results for different constant values for the dry air’s relative humidity φ
1 and a constant wet-bulb temperature T
2. These results revealed that:
The output air’s relative humidity depends mainly on the input air’s relative humidity when varying the dry bulb-temperature but keeping the wet-bulb temperature constant.
In cases (a) and (b), the wet-bulb temperature was kept constant while the dry air’s relative humidity was doubled. The wet air’s relative humidity increased when increasing the dry-bulb temperature until it achieved a maximum value of about 28% in case (a) and 37.5% in case (b). When doubling the value of the dry air’s relative humidity, the maximum value for the wet air’s relative humidity rose by about 40%.
In cases (a) and (c), the dry air’s relative humidity was kept constant while the wet-bulb temperature increased by about 20%. Thus, the wet air’s relative humidity increased along with increasing dry-bulb temperature until it achieved a maximum value of about 28% in case (a) and 24% in case (c). A rise in the wet-bulb temperature by approximately 20% leads to a roughly 14% decrease in the maximum value of the wet air’s relative humidity.
5.2. Effect of Dry-Bulb Temperature on the Enthalpies of the Air and Water
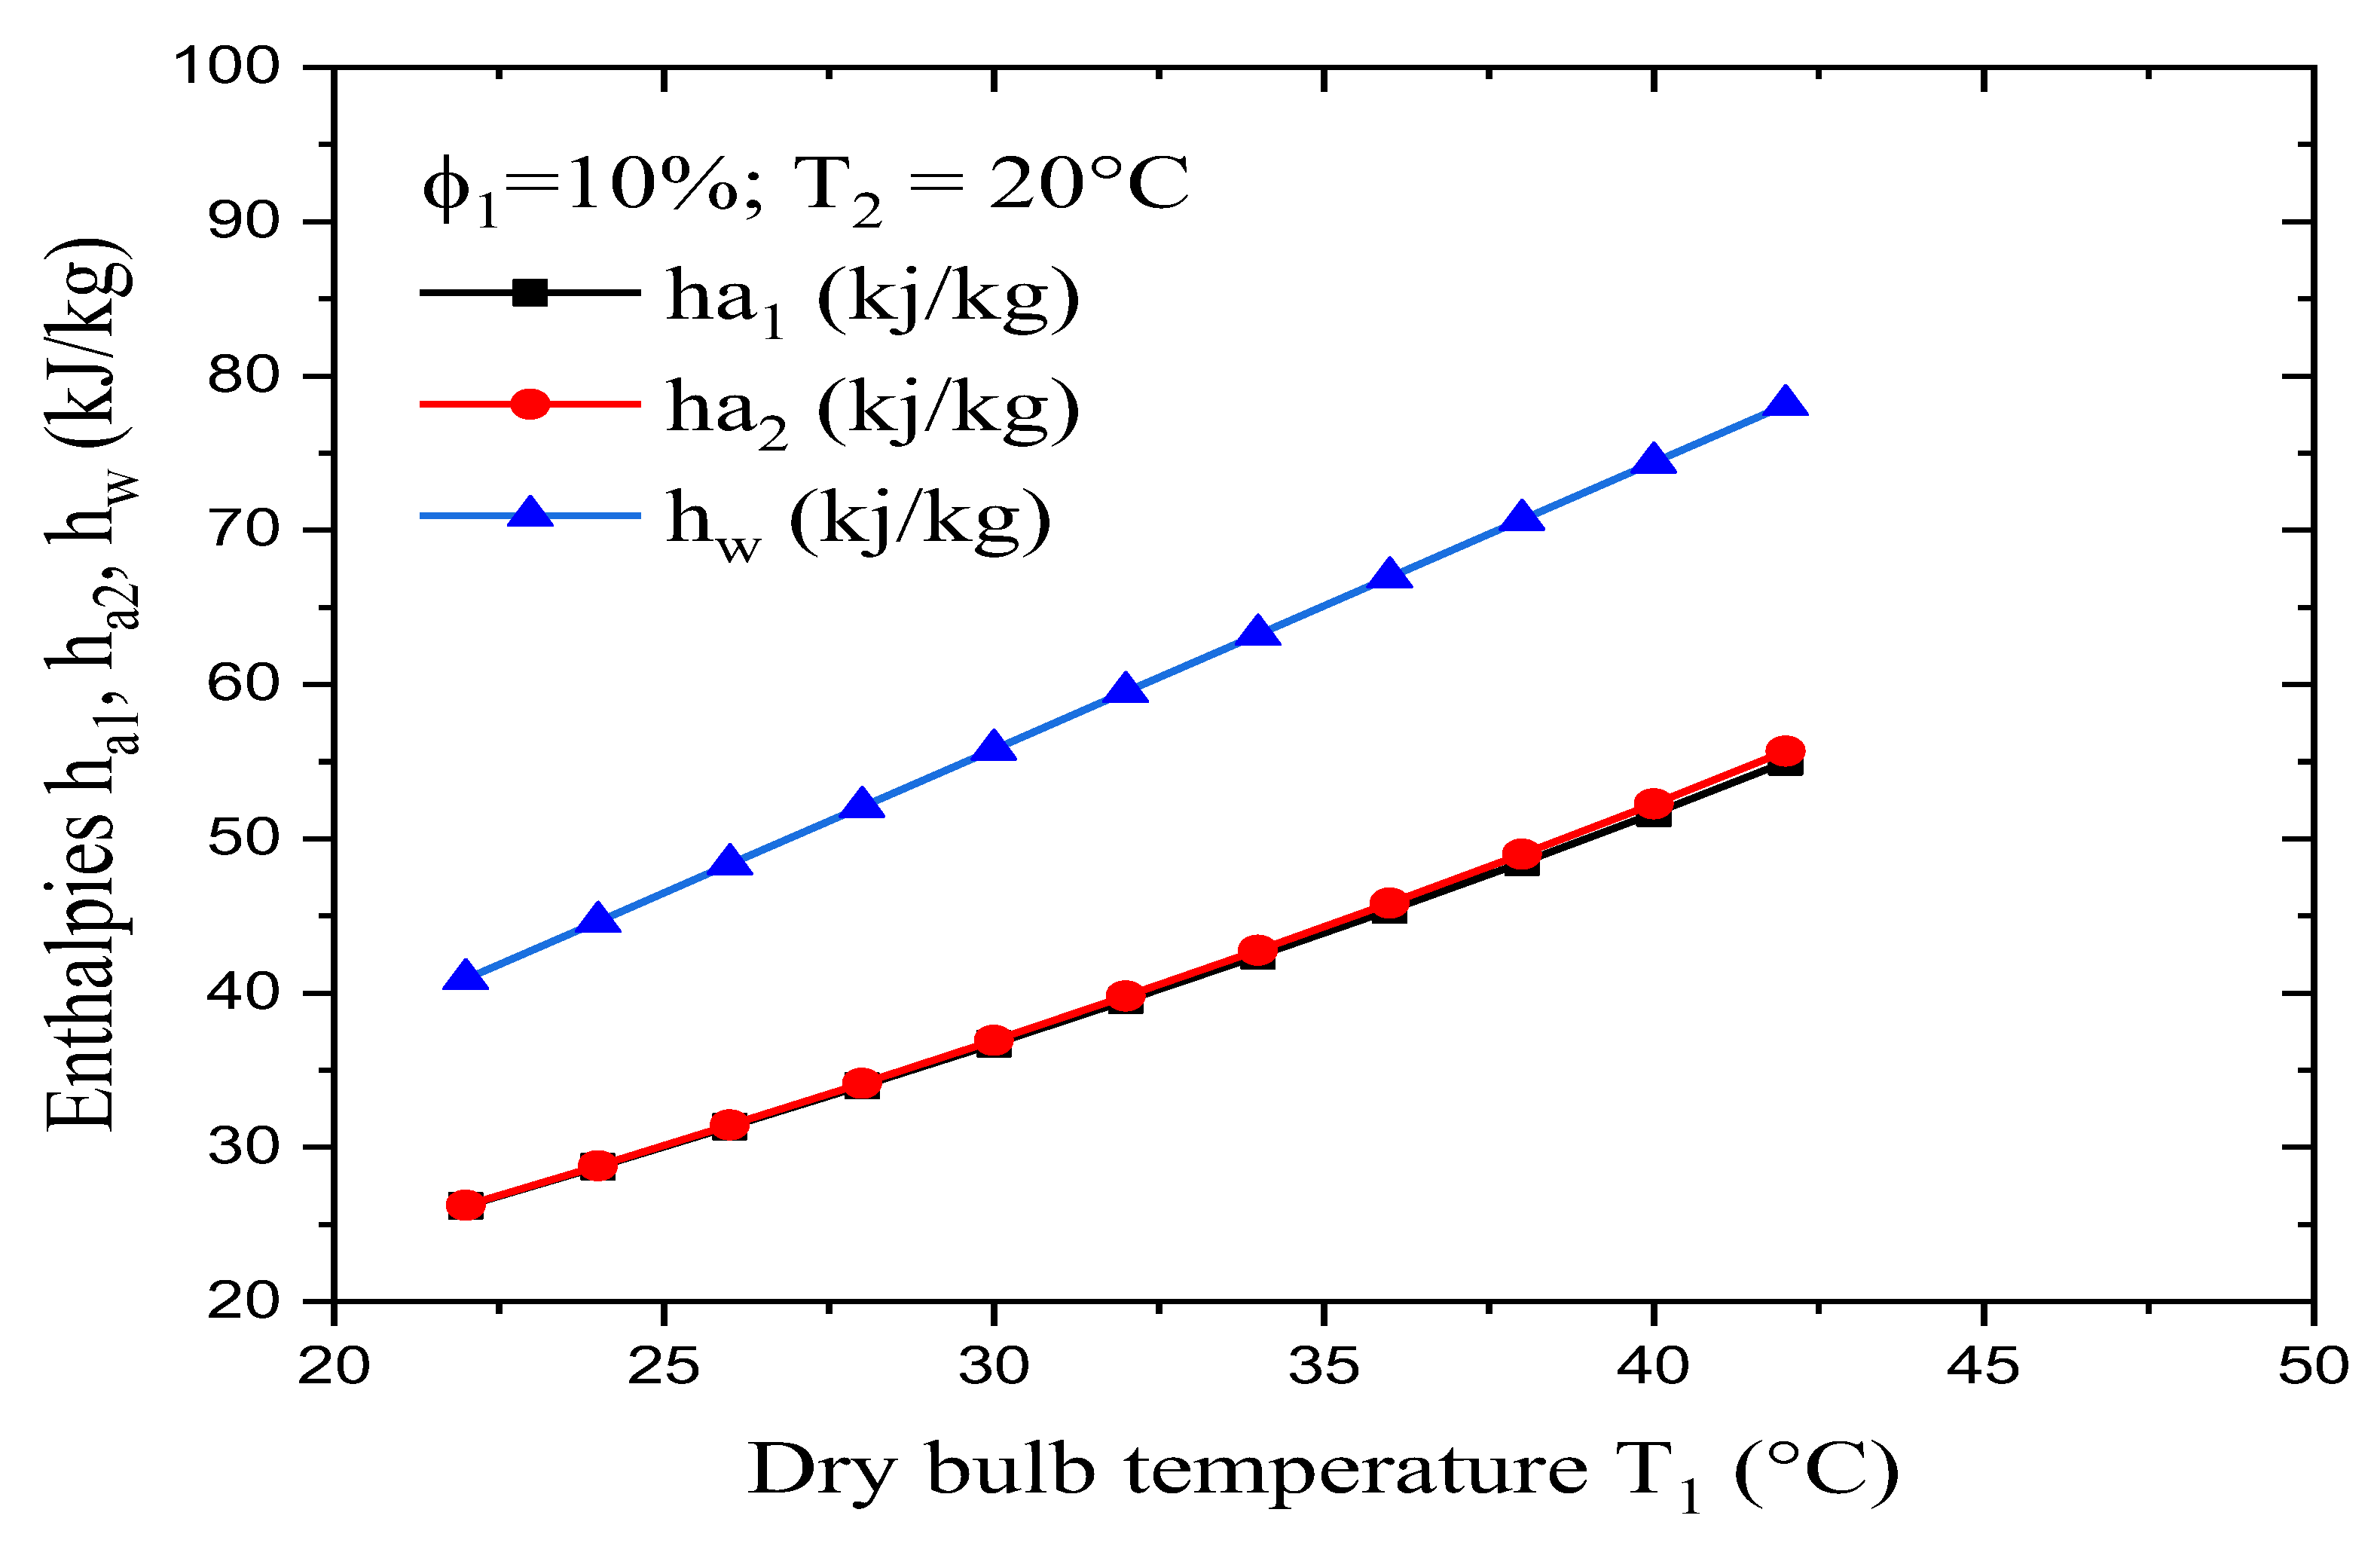
Figure 6 shows the variation in the dry and wet airs’ enthalpies (h
a1 and h
a2) when varying the dry-bulb temperature. These results were obtained with a constant relative humidity φ
1 of 10% for the input air and a desired wet-bulb temperature T
2 of 20°C. It was found that for dry-bulb temperatures from 22°C to 42°C, which corresponds to a rise of about 47.6%, the values for the dry and wet airs’ enthalpies are close, with them varying from about 26 kj/kg to 55 kj/kg (a rise of about 52.7%). We can therefore use the approximation that for a constant dry-bulb temperature, the process takes place with constant enthalpy, although this is still an approximation nevertheless. Indeed, in the psychrometric chart, the lines of constant enthalpy are identical to the lines for constant wet-bulb temperatures. Thus, if we surmise that enthalpy is constant during this process, the wet-bulb temperature also has to be constant.
Figure 6 shows that when the dry-bulb temperature T
1 varies from 22°C to 42°C, the enthalpy of the added water increases from 41 kj/kg to 78 kj/kg, which corresponds to a rise of about 47.4%. The variation that occurs in this range of dry-bulb temperatures is due to the difference in specific humidity (w
1 – w
2), which is very important in determining differences between air enthalpies (h
1 – h
2).
5.3. Effect of the Dry Air’s Temperature on the Mass of the Added Water
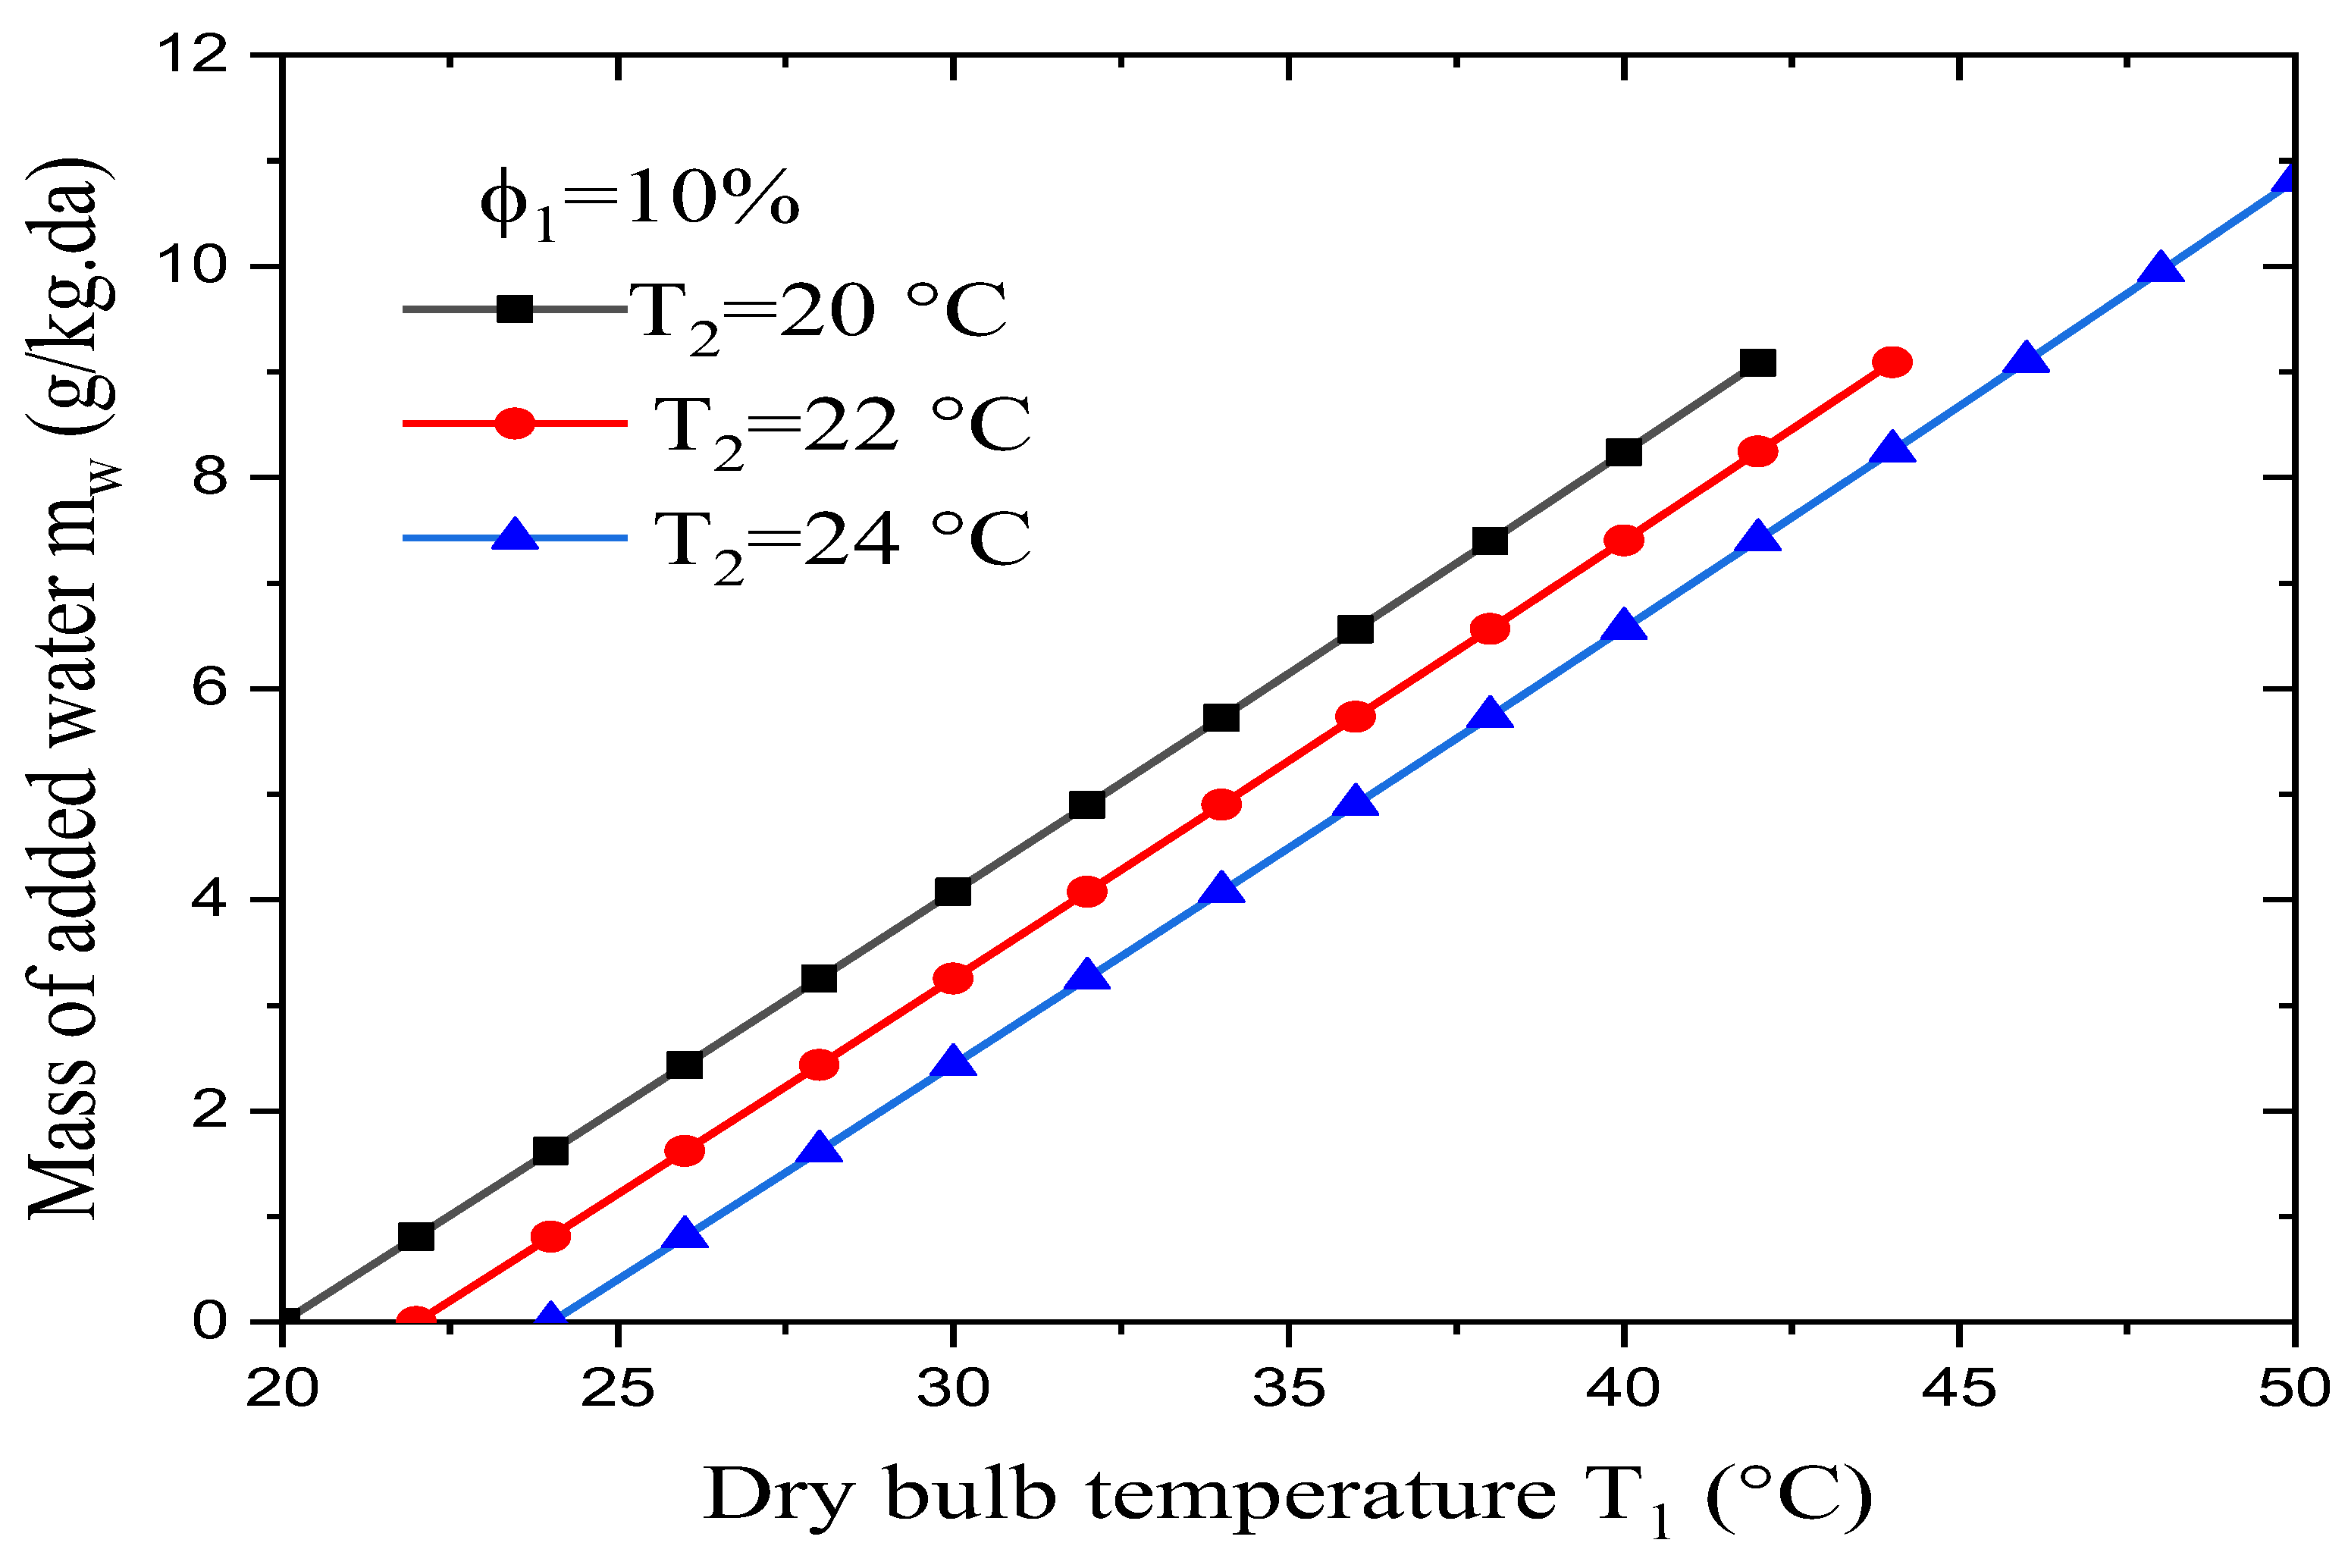
Figure 7 shows the effect of the dry-bulb temperature on the mass of water that needs to be added to humidify the input dry air. These results were obtained for a constant relative humidity for the dry air φ
1 of 10% combined with different values for the wet-bulb temperature T
2. The results obtained show that by varying dry-bulb temperature and making the input air’s relative humidity constant, the mass of water needed to humidify the dry air increases linearly. It was also found that:
The added water depends strongly on the input dry air’s temperature, although the flow rate for the water is much less than for the air.
For a constant dry-bulb temperature and relative humidity, a rise in the wet-bulb temperature leads to a decrease in the mass of water that needs to be added.
For φ1 = 10% and T2 = 20°C, the maximum value for the water to be added is about 9g/kg.da, and it is achieved at T1 = 42°C. For φ1 = 10% and T2 = 22°C, meanwhile, the maximum amount of added water is the same (9g/kg.da), but it is achieved for T1 = 44°C.
For φ1 = 10% and T2 = 24°C, the maximum value of the added water is about 11g/kg.da, and it is achieved for T1 = 50°C.
It seems that every (T1, φ1) pair for the dry air corresponds to an optimal (T2, φ2) pair for the wet air.
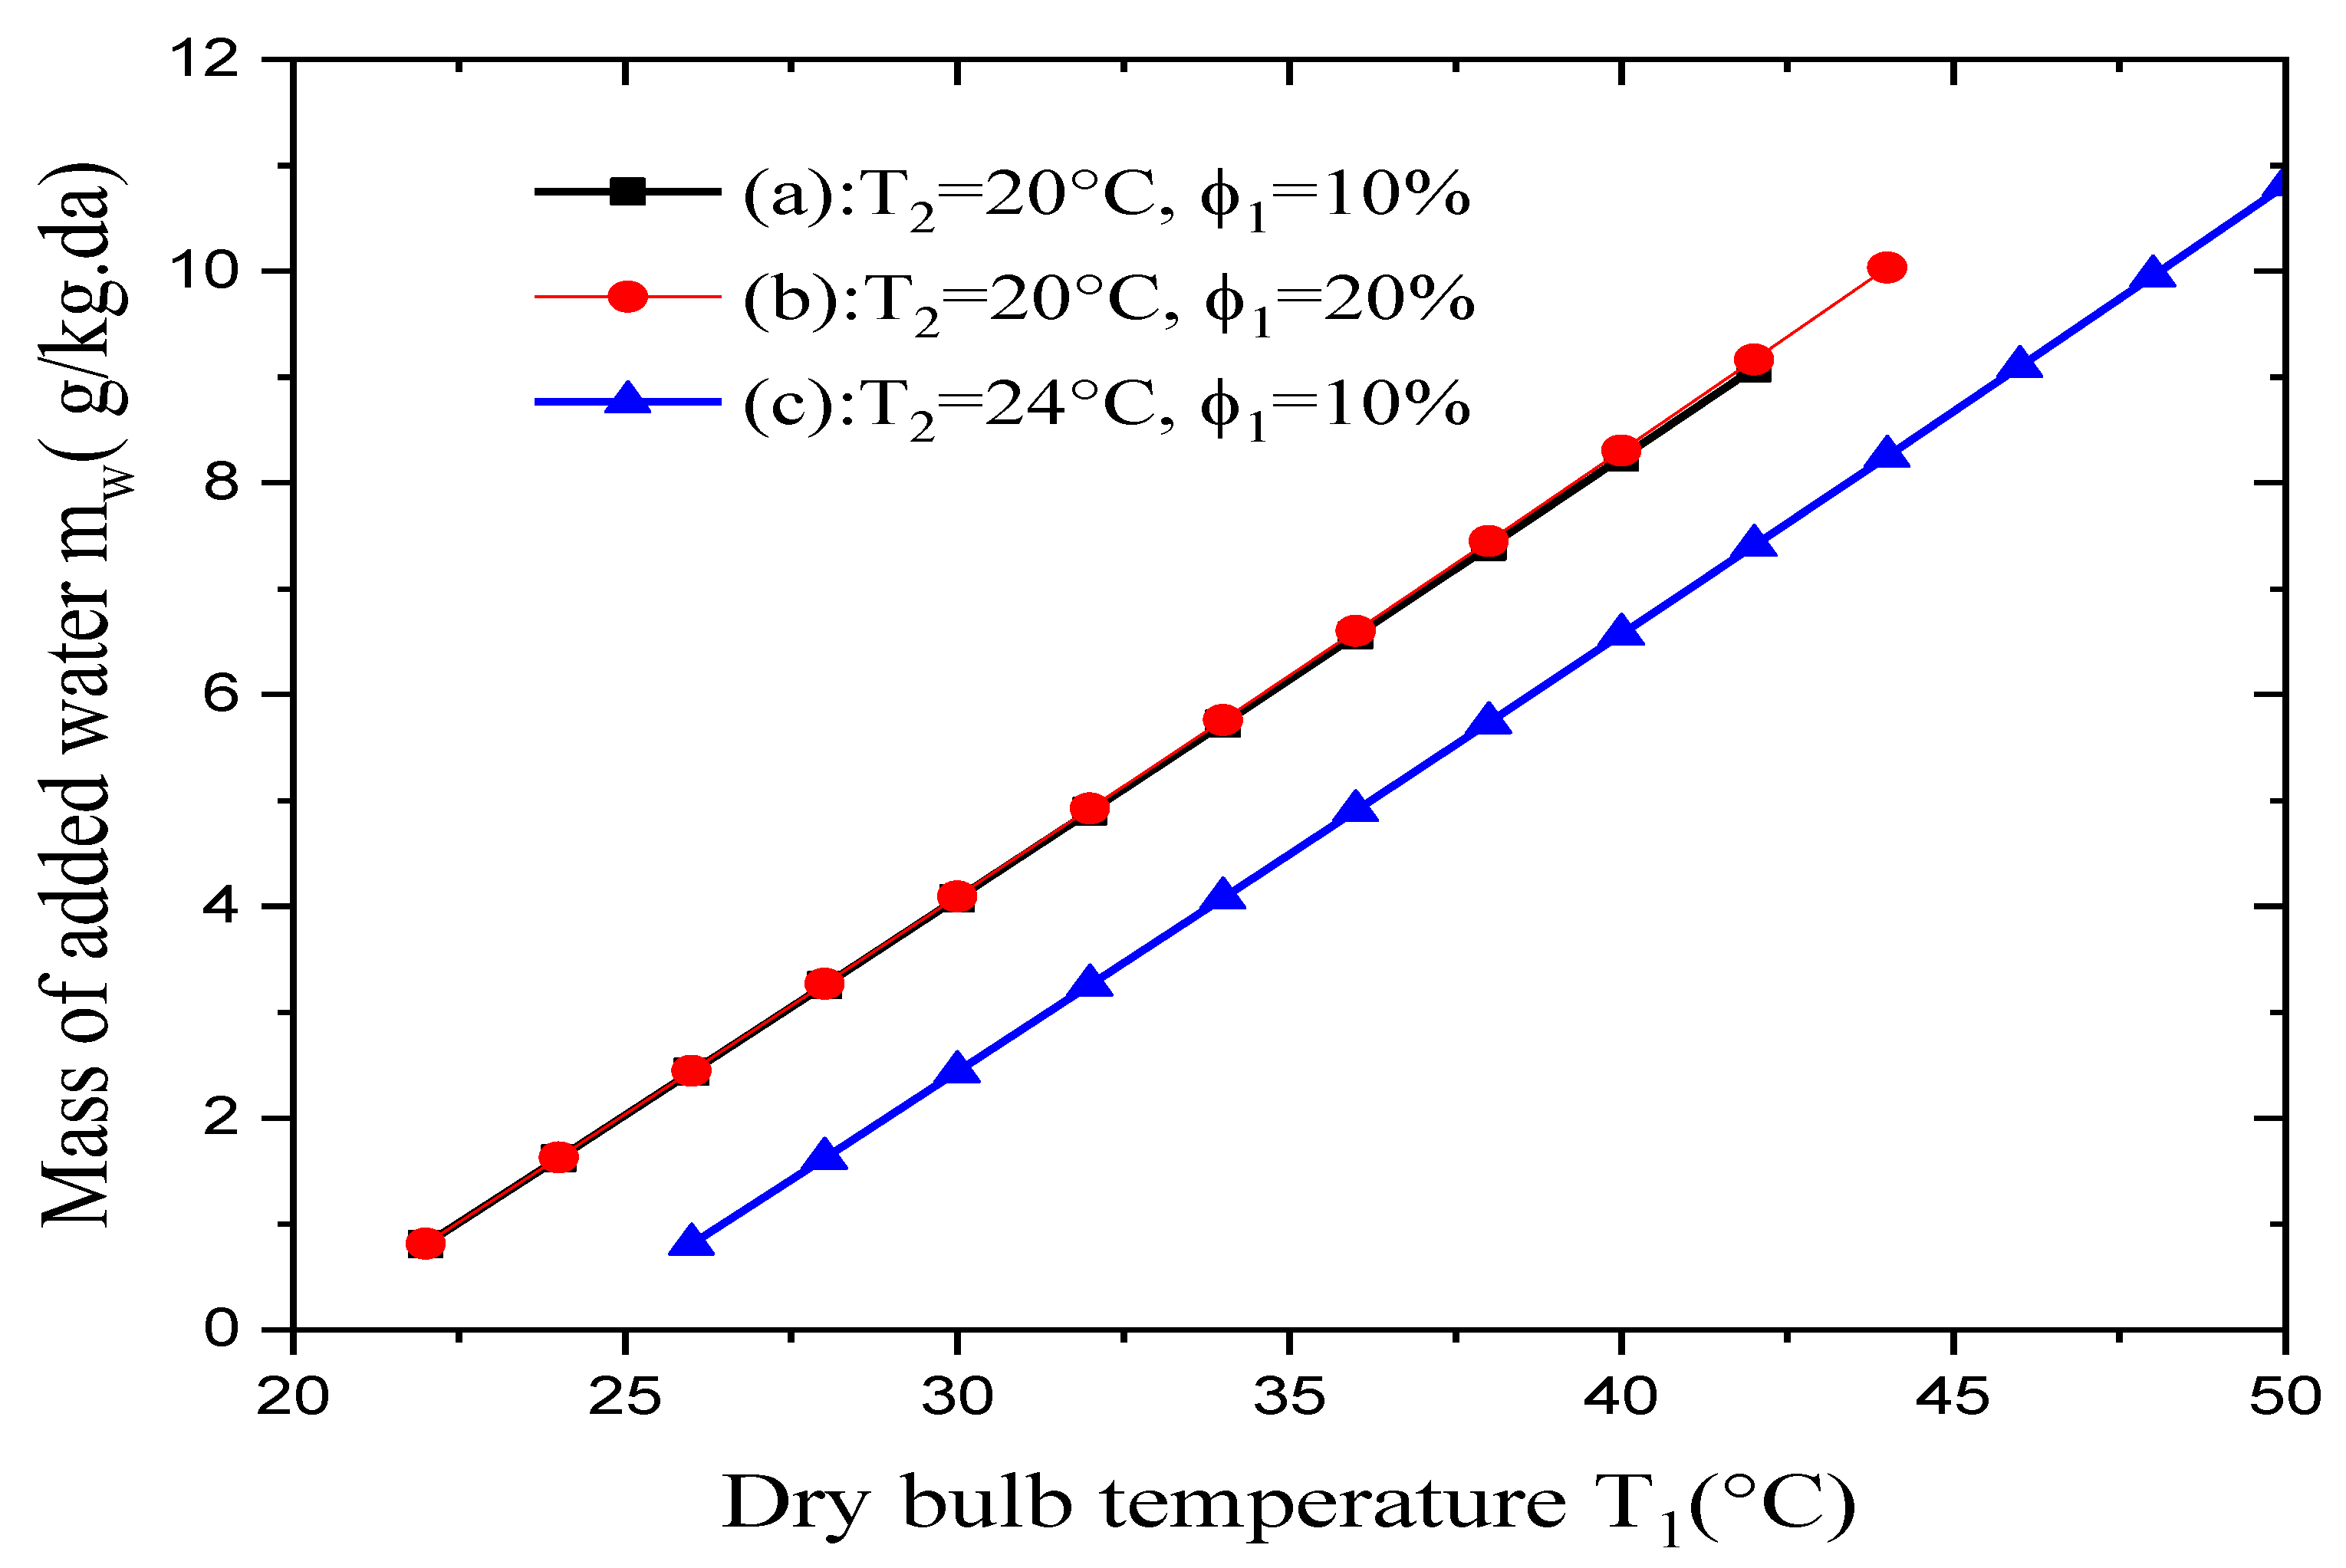
Figure 8 reveals that the added mass at a constant wet-bulb temperature was less sensitive to variations in the dry air’s relative humidity. Indeed, for the two cases (T
2 = 20°C, φ
1 = 10%) and (T
2 = 20°C, φ
1 = 20%) the difference between the values of the added mass water are less than 1%, the black and red curves coincide.
5.4. Effect of the Dry Air’s Relative Humidity on the Mass of the Added Water
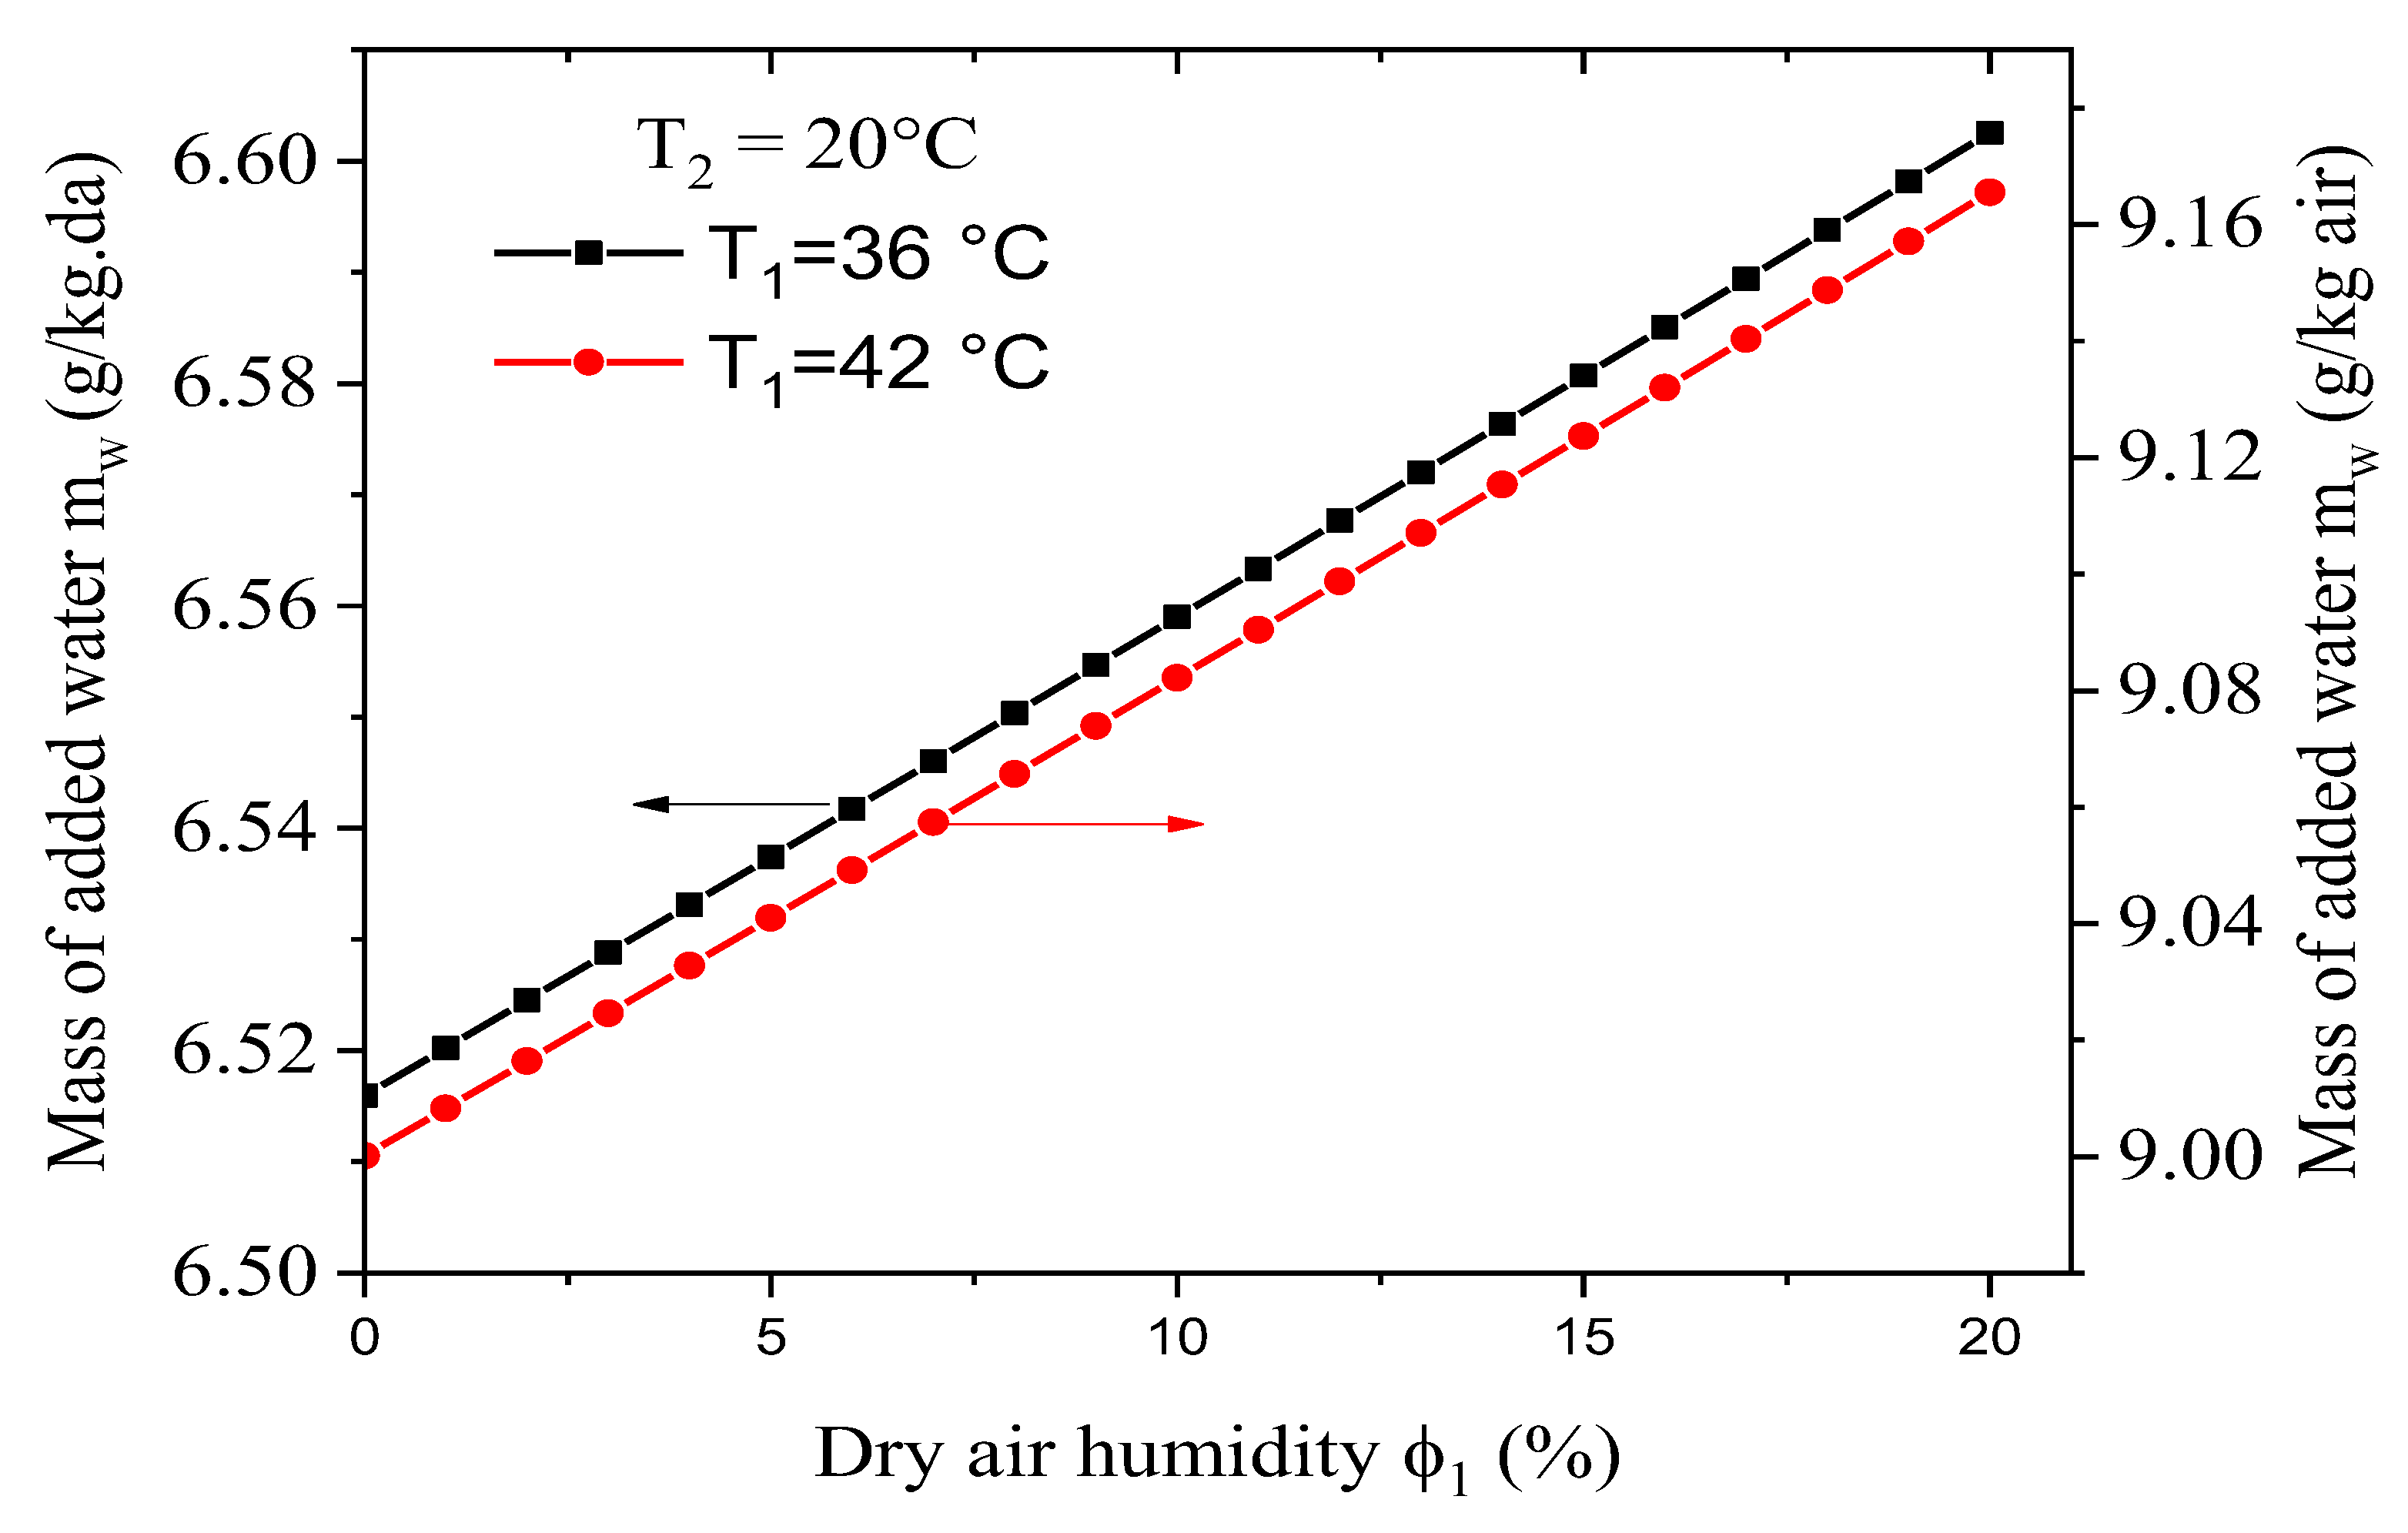
Figure 9 shows the effect of the dry air’s relative humidity φ
1 on the mass of the added water at a constant wet-bulb temperature T
2 with a variable dry-bulb temperature T
1.
It was shown that:
For a constant dry-bulb temperature T1 and constant wet-bulb temperature T2, the mass of the added water was less sensitive to increases in the dry air’s humidity φ1.
For a constant relative humidity for the wet air and a constant wet-bulb temperature, any rise in the dry-bulb temperature leads to an increase in the mass of the added water, because more water is needed to humidify the dry air.
5.5. Effect of the Dry-Bulb Temperature on the Evaporative Cooler’s Efficiency
The dry- and wet-bulb temperatures place important limitations on the evaporative cooler’s performance. In fact, evaporative cooling can only be successful in regions where the wet-bulb temperature is reasonably low and coincides with a high dry-bulb temperature. As far as the dry-bulb temperature is concerned, most people agree that cooling is desirable in any climate where the ambient temperature exceeds 32°C for several hours of the day over an extended period.
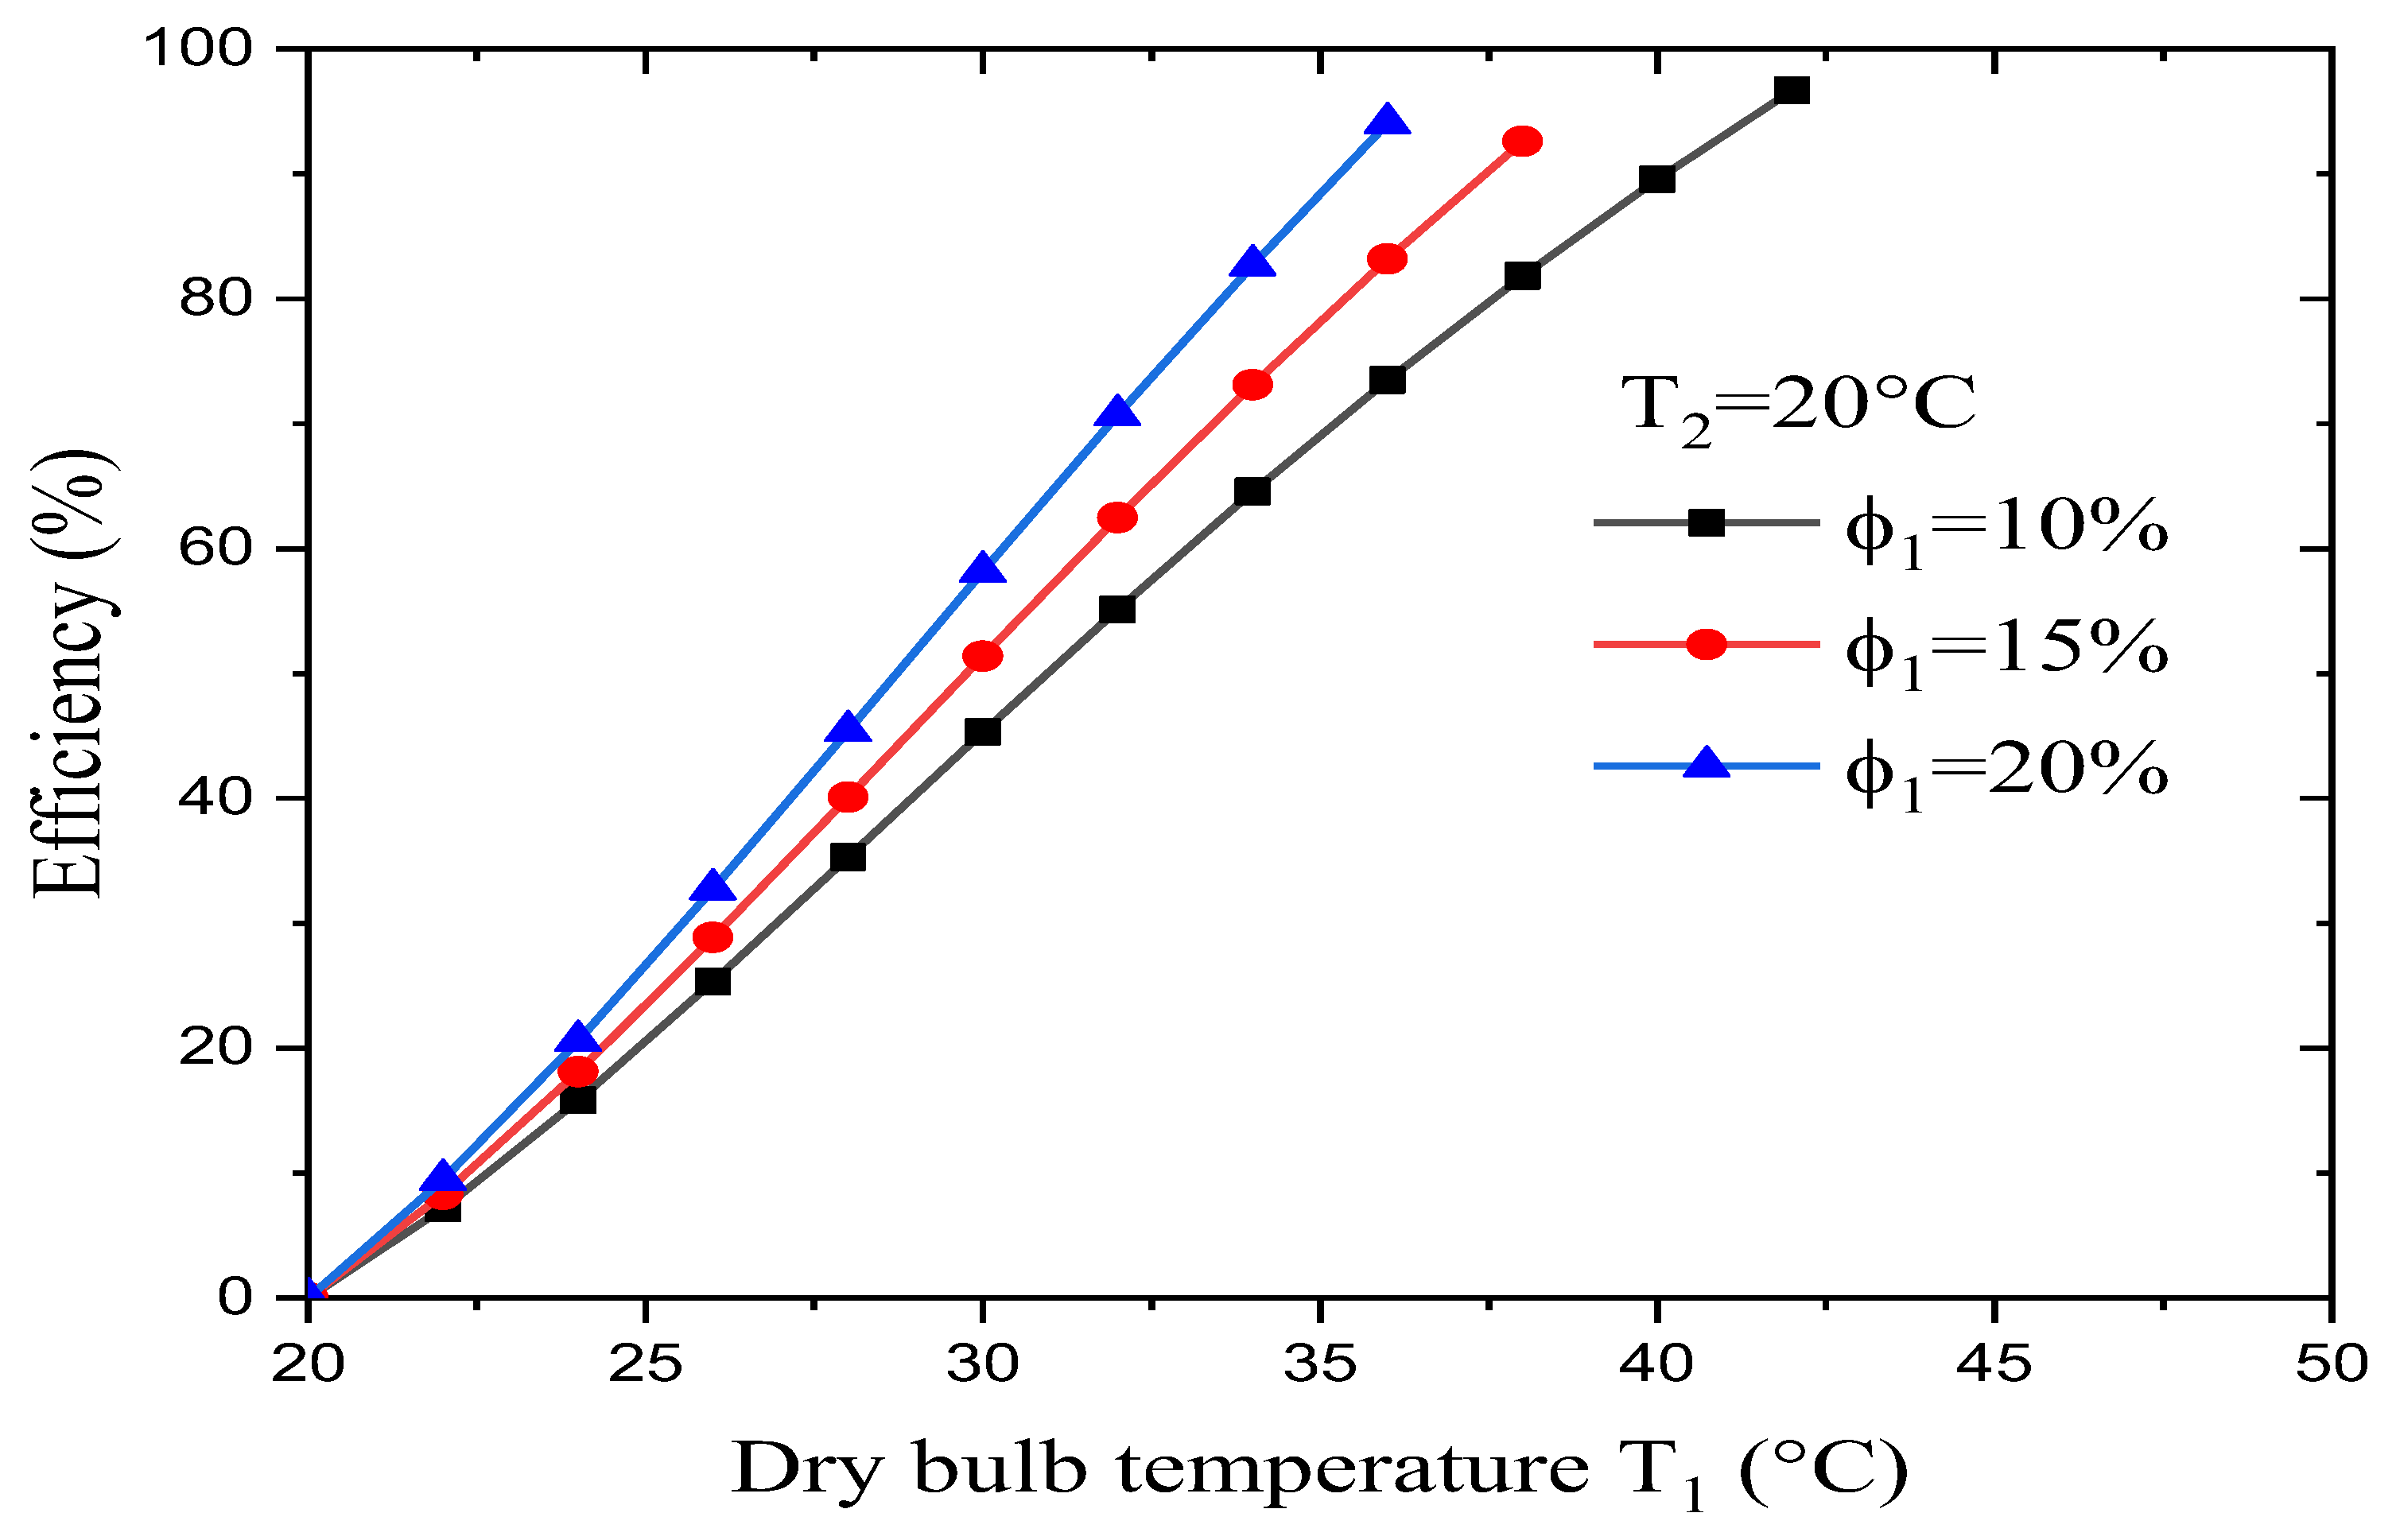
Figure 10 presents the effect of changes in the input parameters (i.e., dry-bulb temperature T
1 and relative humidity φ
1) on the evaporative cooler’s efficiency. It was found that:
For a desired wet-bulb temperature T2, an increase in the dry-bulb temperature leads to an increase in the evaporative cooler’s efficiency.
-
At a constant dry-bulb temperature and desired wet-bulb temperature, an increase in the dry air’s relative humidity leads to an increase in the evaporative cooler’s efficiency.
It is generally accepted that evaporative cooling is satisfactory only when dry-bulb temperatures in excess of 32°C coincide with wet-bulb temperatures below 24°C.
For a desired wet-bulb temperature, the evaporative cooler reaches its maximum efficiency (about 94%) when the dry air’s relative humidity is low and the dry-bulb temperature is maximal, while it reaches its minimum efficiency (about 90%) when the dry air’s relative humidity is high and the dry-bulb temperature is low.
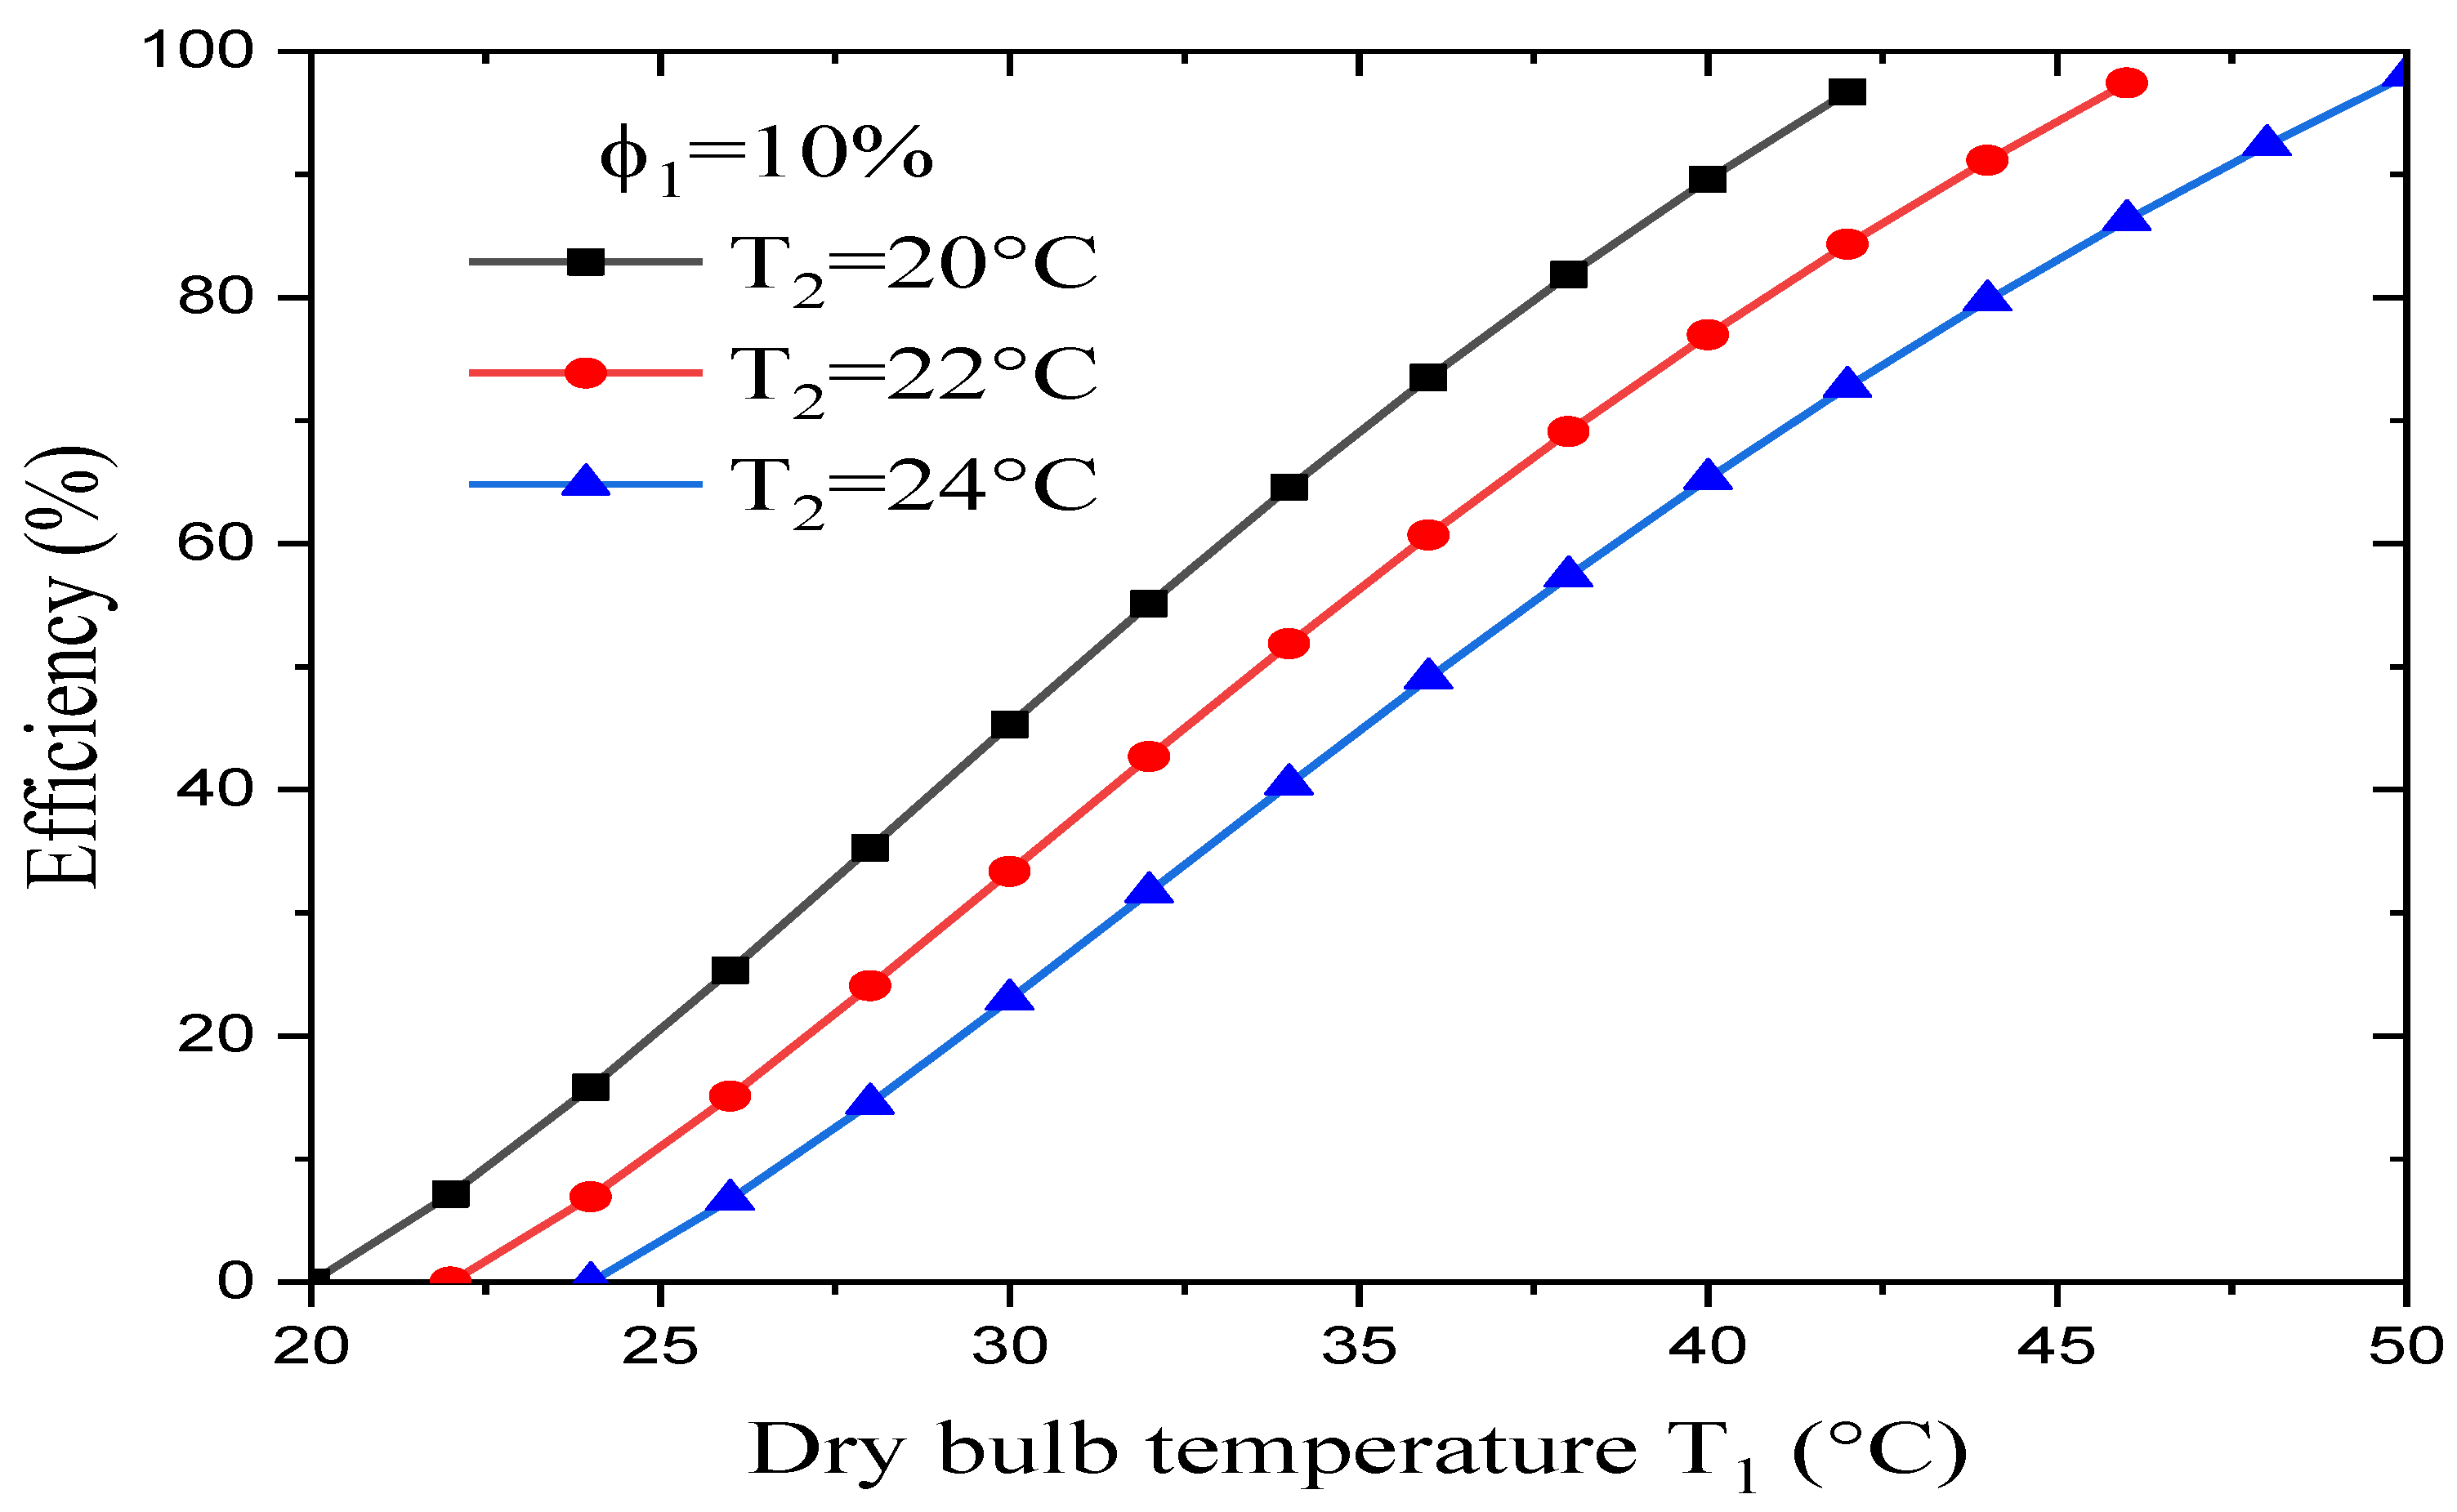
Figure 11 shows the effect that the dry-bulb temperature T
1 and wet-bulb temperature T
2 on the evaporative cooler’s efficiency when the dry air’s relative humidity is constant. It was found that:
At constant relative humidity for the dry air, a rise in the dry-bulb temperature leads to an increase in the evaporative cooler’s efficiency.
With the dry-bulb temperature and the dry air’s relative humidity kept constant, a rise in the wet-bulb temperature leads to a decrease in the evaporative cooler’s efficiency.
-
For a preferred wet-bulb temperature, the evaporative cooler reaches its maximum efficiency (about 98%) with a high wet-bulb depression (WBD), while it reaches its minimum efficiency (about 96%) for a low wet-bulb depression (WBD).
These results are consistent with those obtained by Ayad and Jasim [
33] and Camargo et al [
34].
The wet-bulb depression (WBD) gives a useful indication of the degree of heat stress prevention, something that is at its greatest during the summer. In this study’s case, the WBD is so large that it will affect the efficiency of the evaporative cooler.
5.6. Effect of the Dry Air’s Relative Humidity on the Evaporative Cooler’s Efficiency
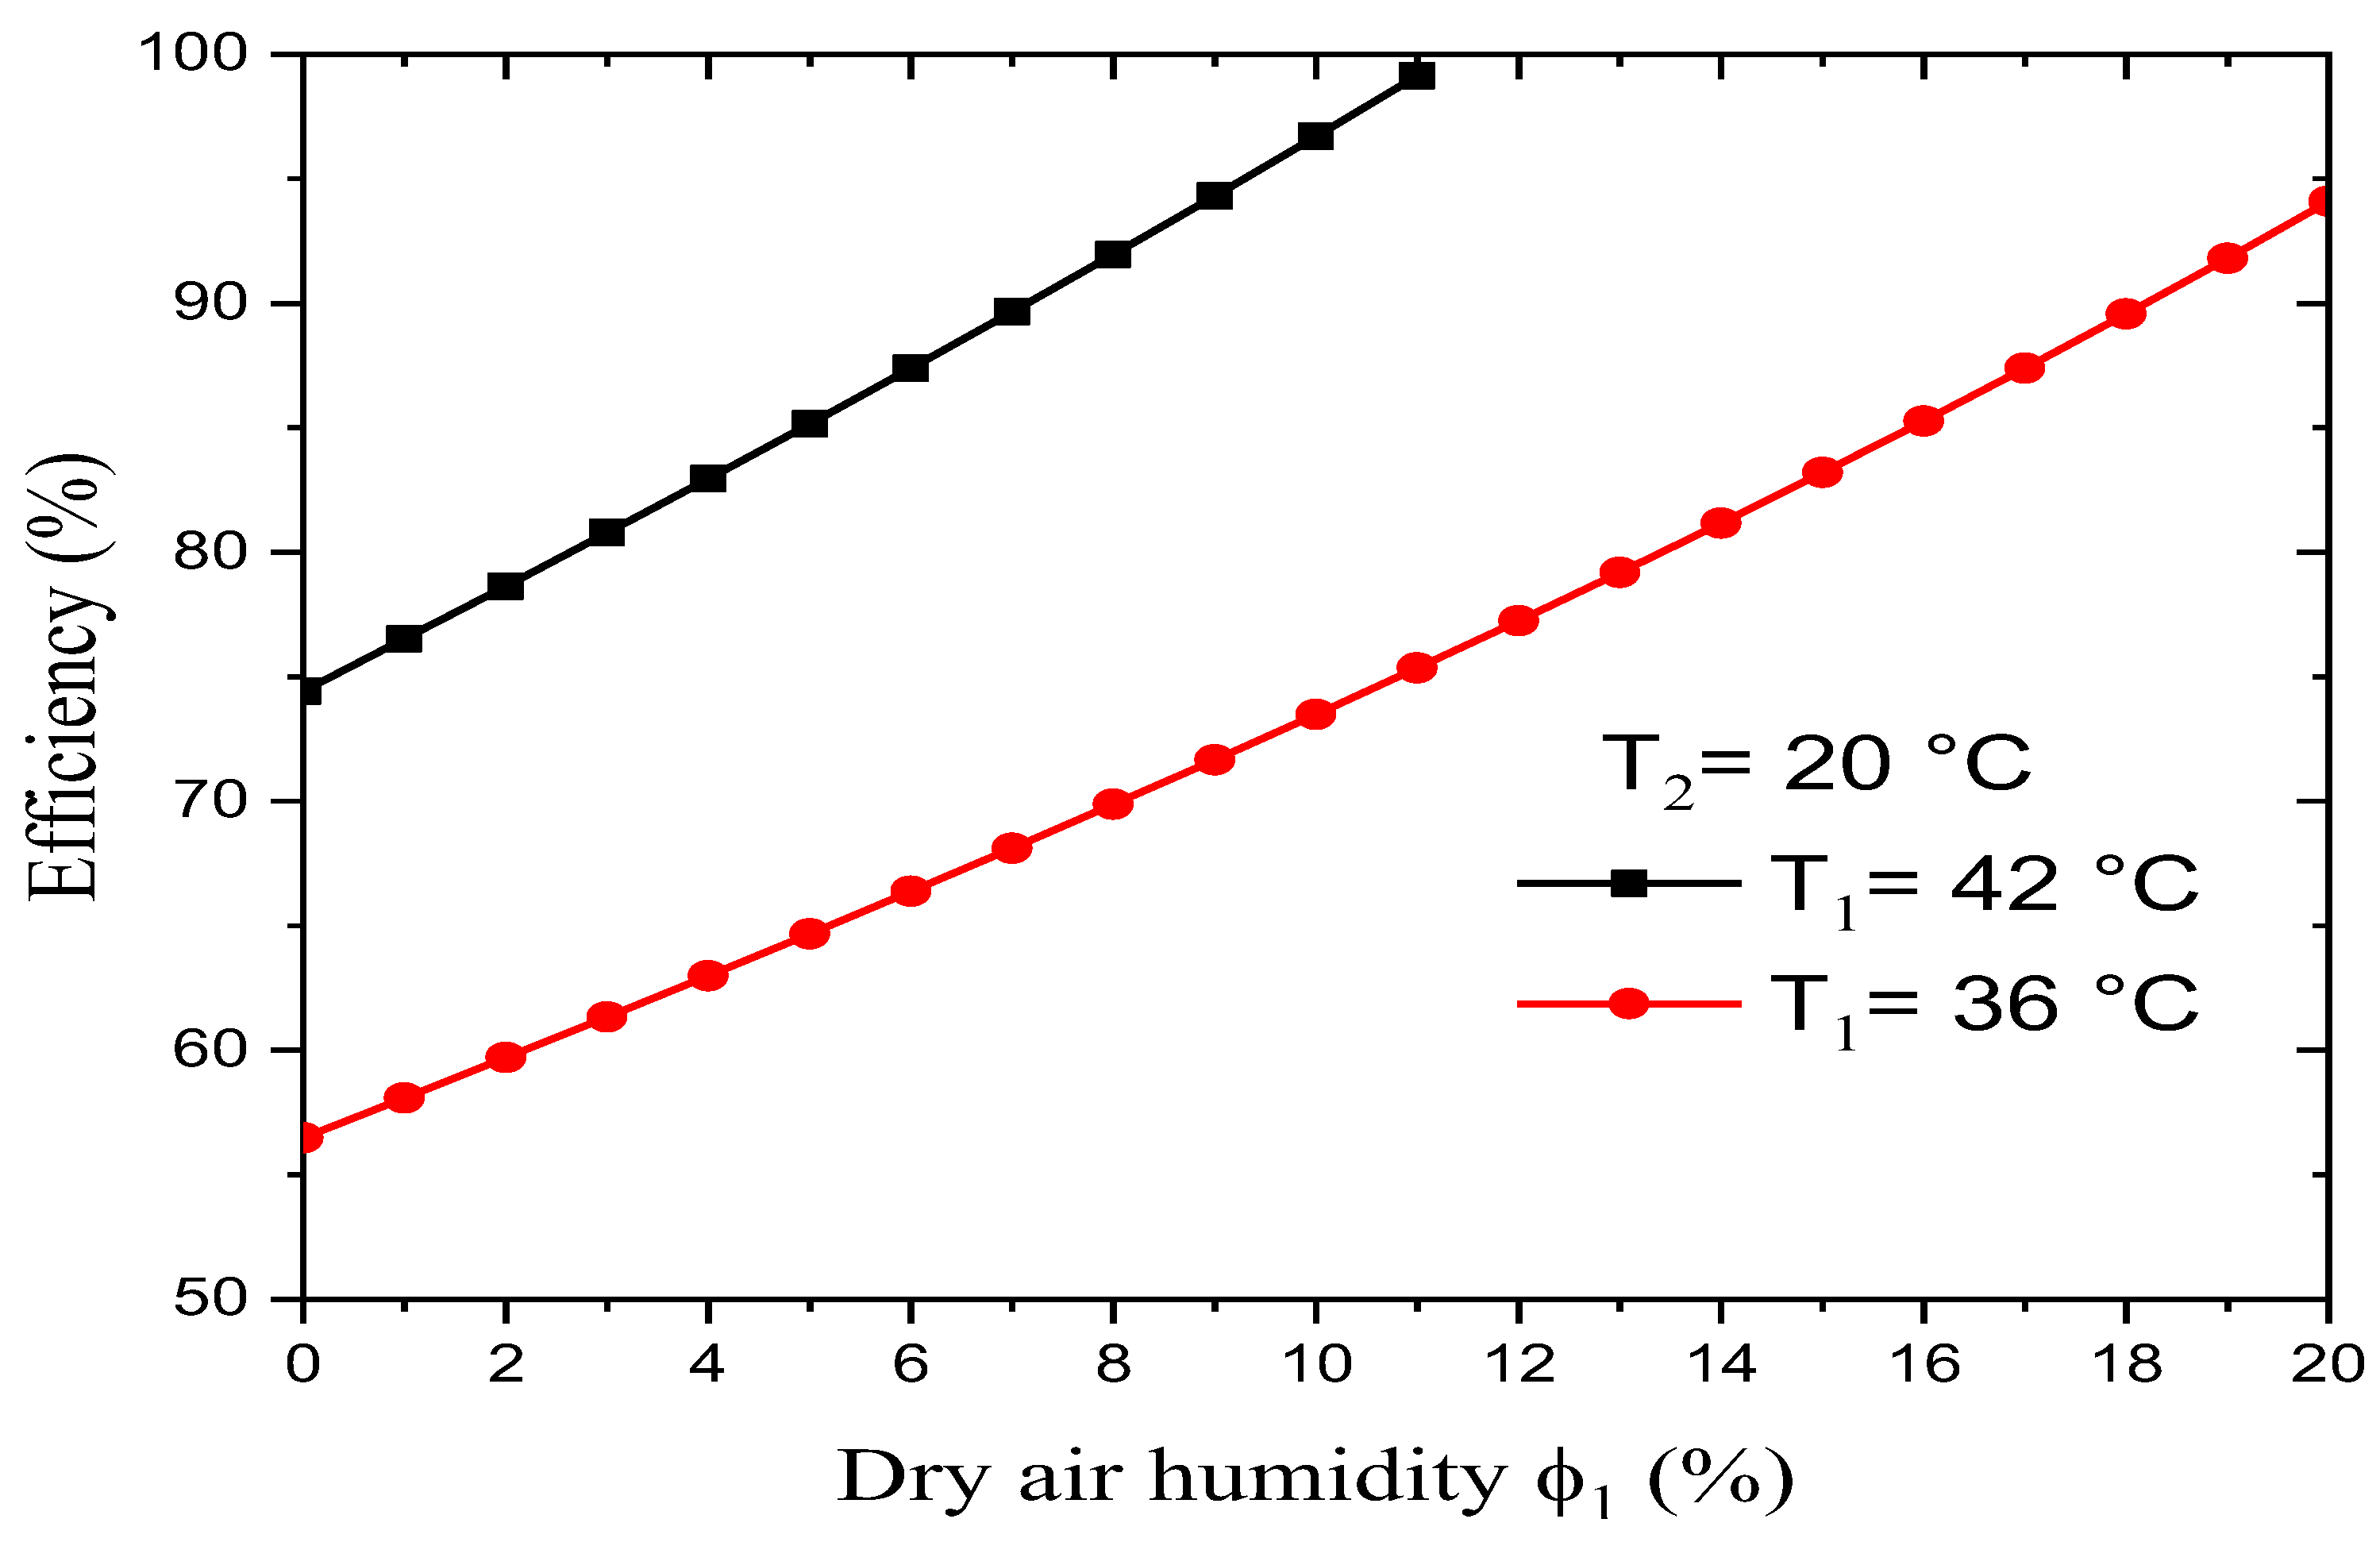
Figure 12 shows the effect of the dry air’s humidity φ
1 on the evaporative cooler’s efficiency for a constant wet-bulb temperature but varying dry-bulb temperature. It was found that:
At a constant relative humidity for the dry air and desired wet-bulb temperature, the evaporative cooler’s efficiency increased along with an increasing dry-bulb temperature. This efficiency was maximized for a critical pair of input parameters (T1, φ1).
At a constant desired wet-bulb temperature and dry-bulb temperature, the variation in the evaporative cooler’s efficiency according to the dry air’s relative humidity was not linear. Indeed, for the pair (T1 = 42°C; T2 = 20°C), a 10% rise in the dry air’s relative humidity φ1 leads to an increase in the evaporative cooler’s efficiency of about 25%. For the pair (T1 = 36°C; T2 = 20°C), however, a rise in the dry air’s relative humidity φ1 of about 20% leads to an increase in the evaporative cooler’s efficiency of about 40%.
6. Conclusions
An experimental-like numerical model was developed to investigate the performance of an evaporative cooling system under different climate conditions. Evaporative cooling systems are essentially useful in environments where a high dry-bulb temperature (more than 32°C) simultaneously coincides with a low wet-bulb temperature (less than 24°C) for extended periods. Under different input dry-air conditions, the obtained results show that evaporative cooling systems can provide substantial relief from the high dry-bulb temperatures found in desert-type climates. This present study found that the dry- and wet-bulb temperatures are determining factors for an evaporative cooler’s efficiency. For a desired wet-bulb temperature, the evaporative cooler reaches its maximum efficiency at a high wet-bulb depression (WBD = T1 – T2), and it achieves its minimum efficiency for a low wet-bulb depression. Further studies are being developed to experimentally investigate a prototype evaporative cooler powered by solar energy.
Author Contributions
All authors contributed to the study conception and design. Material preparation, data collection and analysis were performed by K. Choubani, M.A. Almeshaal, M. Ben Rabha. formal analysis by M.A. Almeshaal, M. Ben Rabha. The first draft of the manuscript was written by K. Choubani, M.A. Almeshaal, data curation by K. Choubani, M.A. Almeshaal, M. Ben Rabha, and supervision, K. Choubani. all authors commented on previous versions of the manuscript. All authors have read and agreed to the published version of the manuscript.
Funding
This research received no external funding.
Data Availability Statement
Not applicable.
Acknowledgements
This work was supported by college of Engineering, Imam Mohammad Ibn Saud Islamic University, Riyadh, Saudi Arabia in collaboration with the Research and Technology Centre of Energy (CRTEn) Tunisia.
Conflicts of Interest
The authors declare no conflict of interest.
List of Symbols
Dry bulb temperature (°C)
Wet bulb temperature (°C)
Water temperature (°C)
Dew point temperature (°C)
Wet bulb Depression () (°C)
Air flow rate (kg/s)
Watre flow rate (kg/s)
Mass of air (g/kg.da)
Mass of added water (g/kg.da)
Specific humidity (kg/kg.da)
Specific humidity at saturation (kg/kg.da)
Relative humidity (%)
Atmosperic pressure ( = 101300 Pa)
Saturation pressure (Pa)
Water vapor partial pressure (Pa)
Efficiency (%)
Specific heat of air ( kj/kg°C )
Specific heat of water ( kj/kg°C)
Specific heat of water ( kj/kg°C)
Latent heat of vaporization ( kj/kg)
Subscripts
i Input
o Output
sat Saturation values
da Dry air
References
- World Energy Council, World Energy Resources 2016. https://www.worldenergy.org/assets/images/imported/2016/10/World-Energy-Resources-Full-report-2016.10.03.pdf.
- International Energy Agency. https://www.iea.org/publications/.
- Sebastian Kuboth.; Florian Heberle.; Andreas König-Haagen.; Dieter Brüggemann. Economic model predictive control of combined thermal and electric residential building energy systems. Applied Energy 2019, 240, 372-385. [CrossRef]
- Alexander Alexandrovich Shukhobodskiy.; Giuseppe Colantuono. RED WoLF: Combining a battery and thermal energy reservoirs as a hybrid storage system. Applied Energy 2020, 274, 115209. [CrossRef]
- Ali Baniasadi.; Daryoush Habibia.; Waleed Al-Saedia.; Mohammad A.S. Masoumb.; Choton K. Dasa.; Navid Mousavia. Optimal sizing design and operation of electrical and thermal energy storage systems in smart buildings. Journal of Energy Storage 2020, 101186. [CrossRef]
- Antonio Moreno-Munoz. Nanogrids, Microgrids, and the Internet of Things (IoT): Towards the Digital Energy Network. energies. 2019, (12), 3878. [CrossRef]
- Yunho Hwang.; Reinhard Radermacher.; Ali Al Alili.; Isoroku Kubo. Review of Solar Cooling Technologies. HVAC&R Research 2008, 14 (3), 507-528. [CrossRef]
- Albers Jan.; Annett Kuhn.; Stefan Petersan.; Felix Zieglar. Development and Progress in Solar Cooling Technologies with Sorption System. Chemie Ingenieur Technik 2011, 83(11), 1853-1863. [CrossRef]
- Abdul Ghafoor.; Anjum Munir. Worldwide Overview of Solar Thermal Cooling Technologies. Renewable and Sustainable Energy Reviews 2015, 43, 763-774. [CrossRef]
- Abo Elmaaref.M.M. Solar Thermoelectric Cooling Technology. In Proc. of 3rd International Conference on Energy Engineering, Faculty of Energy Engineering, Aswan University-Aswan-Egypt, 2015, 1-8.
- Ayman Jamal Alazazmeh.; Esmail M Mokheimer. Review of Solar Cooling Technologies. Journal of Applied Mechanical Engineering 2015, 4 (5), 1-15. [CrossRef]
- Muhammad Usman.; Qazi Shehzad Ali.; Muhammed Bilal. Assessment of Solar Cooling Technologies using the Analytical Hierarchical Process. World Journal of Engineering 2017, 14 (1), 84-90. [CrossRef]
- Swapnil Ghatol.; Tejaswini Rajput. Hybrid Solar Desiccant Cooling System. International. Journal of Engineering Science and Research Technology 2017, 6(12), 569- 575. [CrossRef]
- Salman Ajib.; Ali Alahmer. Solar Cooling Technologies. In Energy Conversion - Current Technologies and Future Trends., Edited by Ibrahim H. Al-Bahadly.; Intech Open, 2018. [CrossRef]
- Rishi.K.; M Balachandran.; G. Ragul.; A. Srinivasagopalan.; B. Ramkiran.; P. Neelamagem. Solar Cooling Technologies-A Review. In International Conference on Computation of Power, Energy, Information and Communication (ICCPEIC), Chennai, India, 28-29 March 2018. 174-178. [CrossRef]
- Naskar. N.; A. Ghosh.; R. Mandal. Design and New Development of Solar Air Conditioner. International Journal of Scientific Research in Multidisciplinary Studies 2018, 4(6), 19-23. [CrossRef]
- Velasco-Gómez, E.; Tejero-González, A.; Jorge-Rico, J.; Rey-Martínez, F.J. Experimental Investigation of the Potential of a New Fabric-Based Evaporative Cooling Pad. Sustainability 2020, 12, 7070. doi: 10.3390/su12177070.
- Mohammad Azim Rasuli.; Shuichi Torii. Feasibility of solar air conditioning system for Afghanistan’s climate. International Journal of Innovative Research and Scientific Studies 2021, 4(2), 120-125. [CrossRef]
- Aiman Albatayneh.; Mustafa Jaradat.; Murad Al-Omary.; Maha Zaquot. Evaluation of Coupling PV and Air Conditioning vs. Solar Cooling Systems—Case Study from Jordan. Applied sciences 2021, 11(511), 1-15. [CrossRef]
- Lai, L.; Wang, X.; Kefayati, G.; Hu, E. Evaporative Cooling Integrated with Solid Desiccant Systems: A Review. Energies 2021, 14, 5982. doi: 10.3390/en14185982.
- Kassem, A. S. Energy and water management in evaporitive cooling systems in Saudi Arabia. Resources. Conservation and Recycling 1994, 12(3-4), 135–146. doi:10.1016/0921-3449(94)90002-7 .
- Ghiabaklou,Z, Ballinger,JA. A passive evaporative system by natural ventilation. Building and Environment 1996, 31(6):503–7.
- Ghiabaklou,;Z. Thermal comfort prediction for a new passive cooling system. Building and Environment 2003, 38(7), 883–891. doi:10.1016/s0360-1323(03)00028-3.
- Ibrahim;E., Shao;L, Riffat;S. B. Performance of porous ceramic evaporators for building cooling application. Energy and Buildings 2003, 35(9), 941–949. doi:10.1016/s0378-7788(03)00019-7.
- Ben Cheikh;H., Bouchair;A. Passive cooling by evapo-reflective roof for hot dry climates. Renewable Energy 2004. , 29(11), 1877–1886. doi:10.1016/j.renene.2003.12.021.
- Metin;D, Cengiz;, Y ilmaz, Ali; Ömer;P. The effects of air velocity on the performance of pad evaporative cooling systems. African Journal of Agronomy 2020, 8 (11), 001-010.
- Rajendra;K, Nilesh;F, Kalyani;K. Design, development and performance evaluation of an on-farm evaporative cooler. International Journal of Science, Technology and Society 2015; 3(2-2): 1-5. [CrossRef]
- Mohamed;M.El-Awad. Feasibility of a solar-assisted winter air-conditioning system using evaporative air-coolers. International Journal of Energy and Environment (IJEE) 2011, 2, (2) , 277-286.
- Hussain;s, AlMogbel;A., Rafique;Z., Almashaal;M. Experimental investigations of evaporative cooling system for buildings under hot and dry environmental conditions. Heat Transfer Research 2020, 51 (9), 825-835. doi: 10.1615/HeatTransRes.2020033184.
- Imtiyaz;H, Farzana;B, Showkat;A.Bh, Uzair;S, Muhammad;S, Muhammad;W.Azam, Sachin;K.K, Sajid;H, Wei;M.Y, Evaluating the parameters affecting the direct and indirect evaporative cooling systems, Engineering Analysis with Boundary Elements 2022, 145, 211-223.
- ASHRAE Handbook. Fundamentals, American Society of Heating, Refrigerating and Air-Conditioning Engineers 1992.
- CRETINON, Bernard. Mesure des paramètres de l’air humide. Technique de l’Ingénieur R, 3rd ed; 1995, p. 045.
- Ayad T. Mustafa.; Hassan S. Jasim. Performance evaluation of a developed evaporative air cooler with solar irradiance effect. International Journal of Engineering & Technology 2018, 7 (4), 4785-4791. [CrossRef]
- Camargo.; Jose Rui.; Carlos Daniel Ebinuma.; Jose Luz Silveira. Experimental performance of a direct evaporative cooler operating during summer in a Brazilian city. International Journal of Refrigeration 2005, 28 (7), 1124-1132. [CrossRef]
|
Disclaimer/Publisher’s Note: The statements, opinions and data contained in all publications are solely those of the individual author(s) and contributor(s) and not of MDPI and/or the editor(s). MDPI and/or the editor(s) disclaim responsibility for any injury to people or property resulting from any ideas, methods, instructions or products referred to in the content. |
© 2023 by the authors. Licensee MDPI, Basel, Switzerland. This article is an open access article distributed under the terms and conditions of the Creative Commons Attribution (CC BY) license (http://creativecommons.org/licenses/by/4.0/).
