1. Introduction
The incidence of many types of cancer continues to rise in the global population, despite many successes in screening, prevention and treatment [
1]. Several factors contribute to the development and progression of cancer such as resistance to various drugs and mutations in important genes [
2]. The sum of changes in oncogenes, tumor suppressor genes, repair mechanisms and epigenetic changes lead to cancer development [
3]. For most human cancers, it is impossible to infer how many independent events are required to produce all the changes that result in cancer [
4]. Therefore, continuous discovery of new therapeutic alternatives is necessary.
In addition, 40% of the interindividual differences are responsible for the variation in the response to treatment of patients with the same type of cancer. Genetic factors such as single nucleotide polymorphisms (SNPs) are reported as important variants that may affect treatment [
5,
6]. In addition, natural human genetic variation can cause individuals to respond differently to the same drug [
7]. Therefore, it is also necessary to identify new therapeutic alternatives based on the genetic profile of the patient.
Several studies focus on enzymes as important therapeutic targets for various types of tumors. Tyrosine kinases belonging to the ABL family act in the coordination and remodeling of actin in response to stimuli mediated by tyrosine phosphorylation of actin cytoskeletal remodeling proteins and by the adhesion and aggregation domain of carboxy-terminal filamentous actin ABL [
8]. ABL perform a variety of activities vital to cell maintenance, such as division, adhesion to membranes, cellular skeletal remodeling, and DNA damage repair [
9]. However, mutations or abnormalities in tyrosine kinase activity can result in an uninterrupted disruption of the highly active state that can lead to cancer development and progression [
10]. The epidermal growth factor receptor (EGFR) acts as a transcription factor that plays a regulatory role in the expression of many genes important for inflammation [
11]. EGFR belongs to the ErbR family, which irregularly can activate epithelial tumors [
11]. Histone deacetylases (HDACs) are key enzymes that have a regulatory function of gene expression, related to the control of cell cycle advancement and apoptosis, boosting tumorigenesis and favoring the evolution of cancer [
12,
13,
14]. mTOR threonine-protein kinase (mTOR) is an enzyme formed by two structural complexes. mammalian rapamycin complex 1 (mammalian target of rapamycin complex 1) (mTORC1) and mammalian target of rapamycin complex 2 (mammalian target of rapamycin complex 2) (mTORC2). mTORC1 performs the function of regulating cell growth and metabolism, while mTORC2 controls cell proliferation and survival [
15,
16,
17]. mTOR plays a functional role in tumor formation and is widely used in targeted therapy research for tumors and other diseases [
18]. The polyadenosine diphosphate ribose polymerase (PARP) superfamily is made up of proteins and enzymes that are responsible for regulating the process of identification and repair of deoxyribonucleic acid molecules through the BER pathway [
19]. PARP1 is the best known and acts as a catalyst for ADP-ribose units of the NAD+ substrate in nuclear proteins. This process is performed as a post-translational modification necessary for activating the response to DNA damage generated by ionizing radiation, alkylating agents and/or free radicals [
20]. PARP inhibitors destabilize replication forks through entrapment of PARP DNA and induce cell death through replication stress-induced mitotic catastrophe [
21].
Targeted therapy is usually the initial treatment for a cancer patient. More than 60% of antitumor drugs are closely related to natural products [
10]. Lignans are natural products made up of phenylpropanoid dimers and have a wide variety of biological activities. Many studies have reported lignans as potent anticancer agents [
22,
23,
24,
25]. However, ten extremely diverse subclasses of lignans making it difficult to correlate anticancer activity with chemical structure. In addition, genetic variations cause different responses to treatment, requiring personalized treatment per patient. Therefore, the present study aims to select and evaluate the association of lignan subclasses with antitumor activity, considering the genetic profile of important variants.
2. Results
2.1. Quantitative modeling of the structure-activity rela-tionship (QSAR)
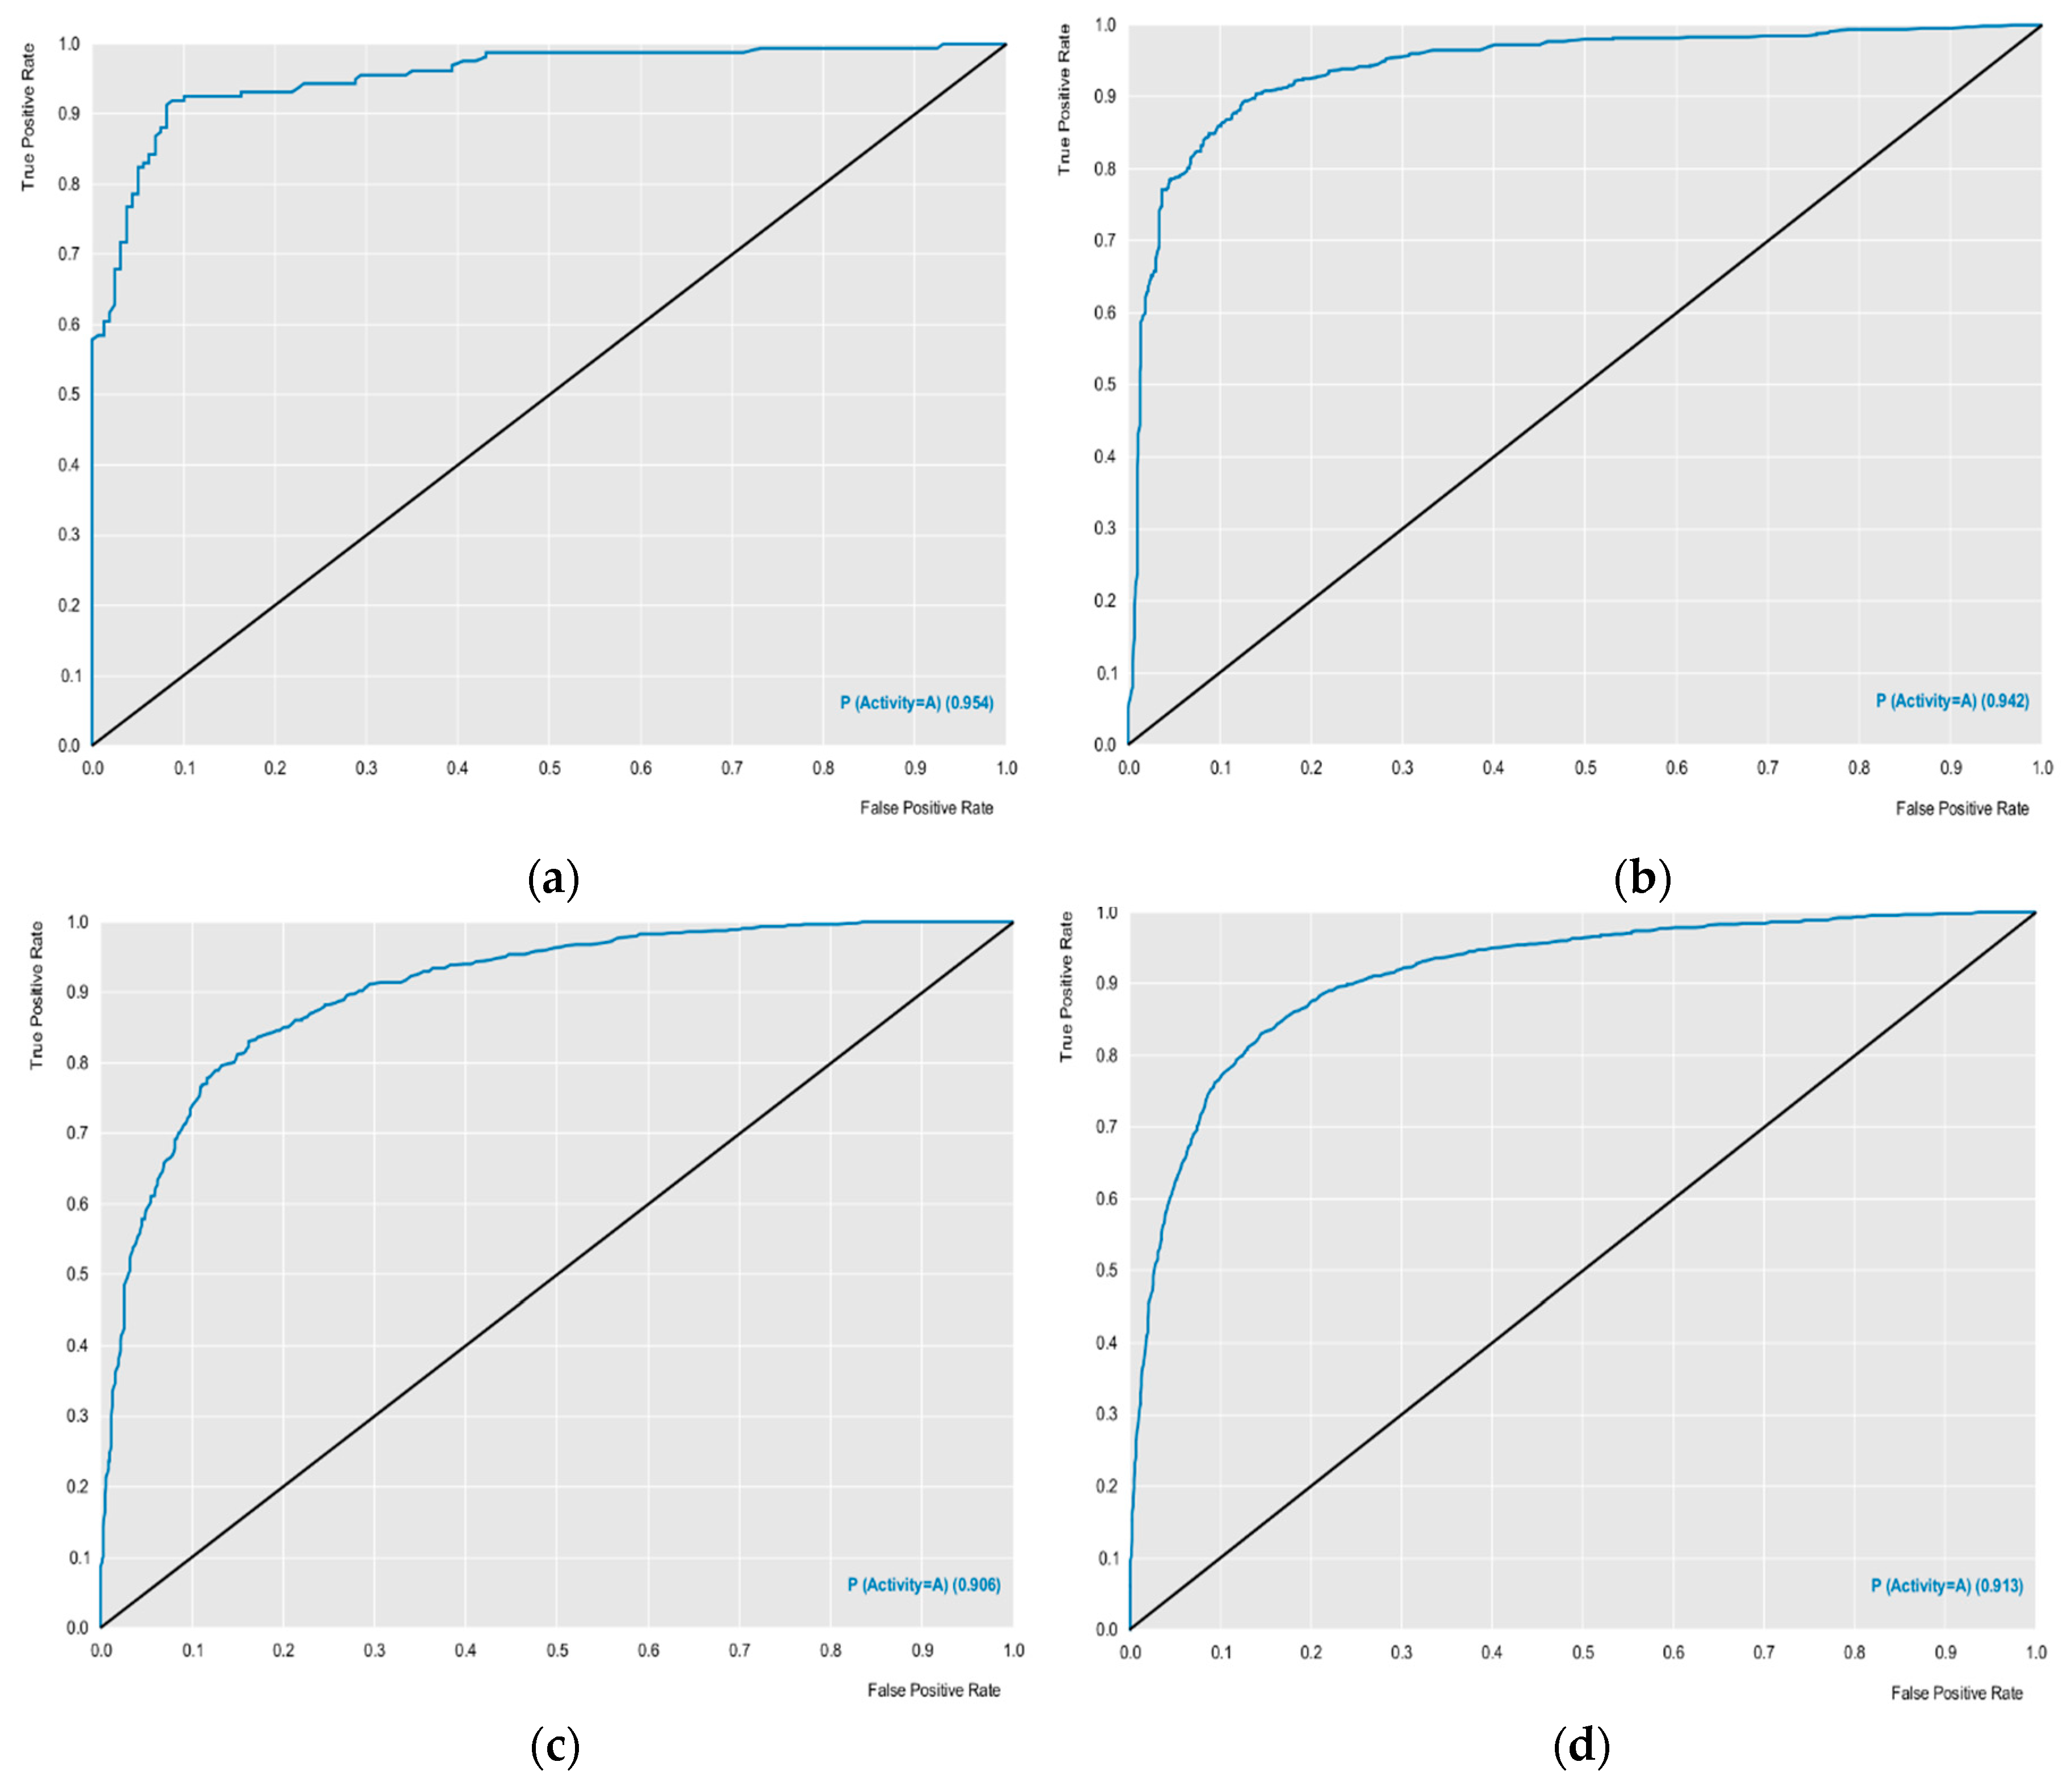
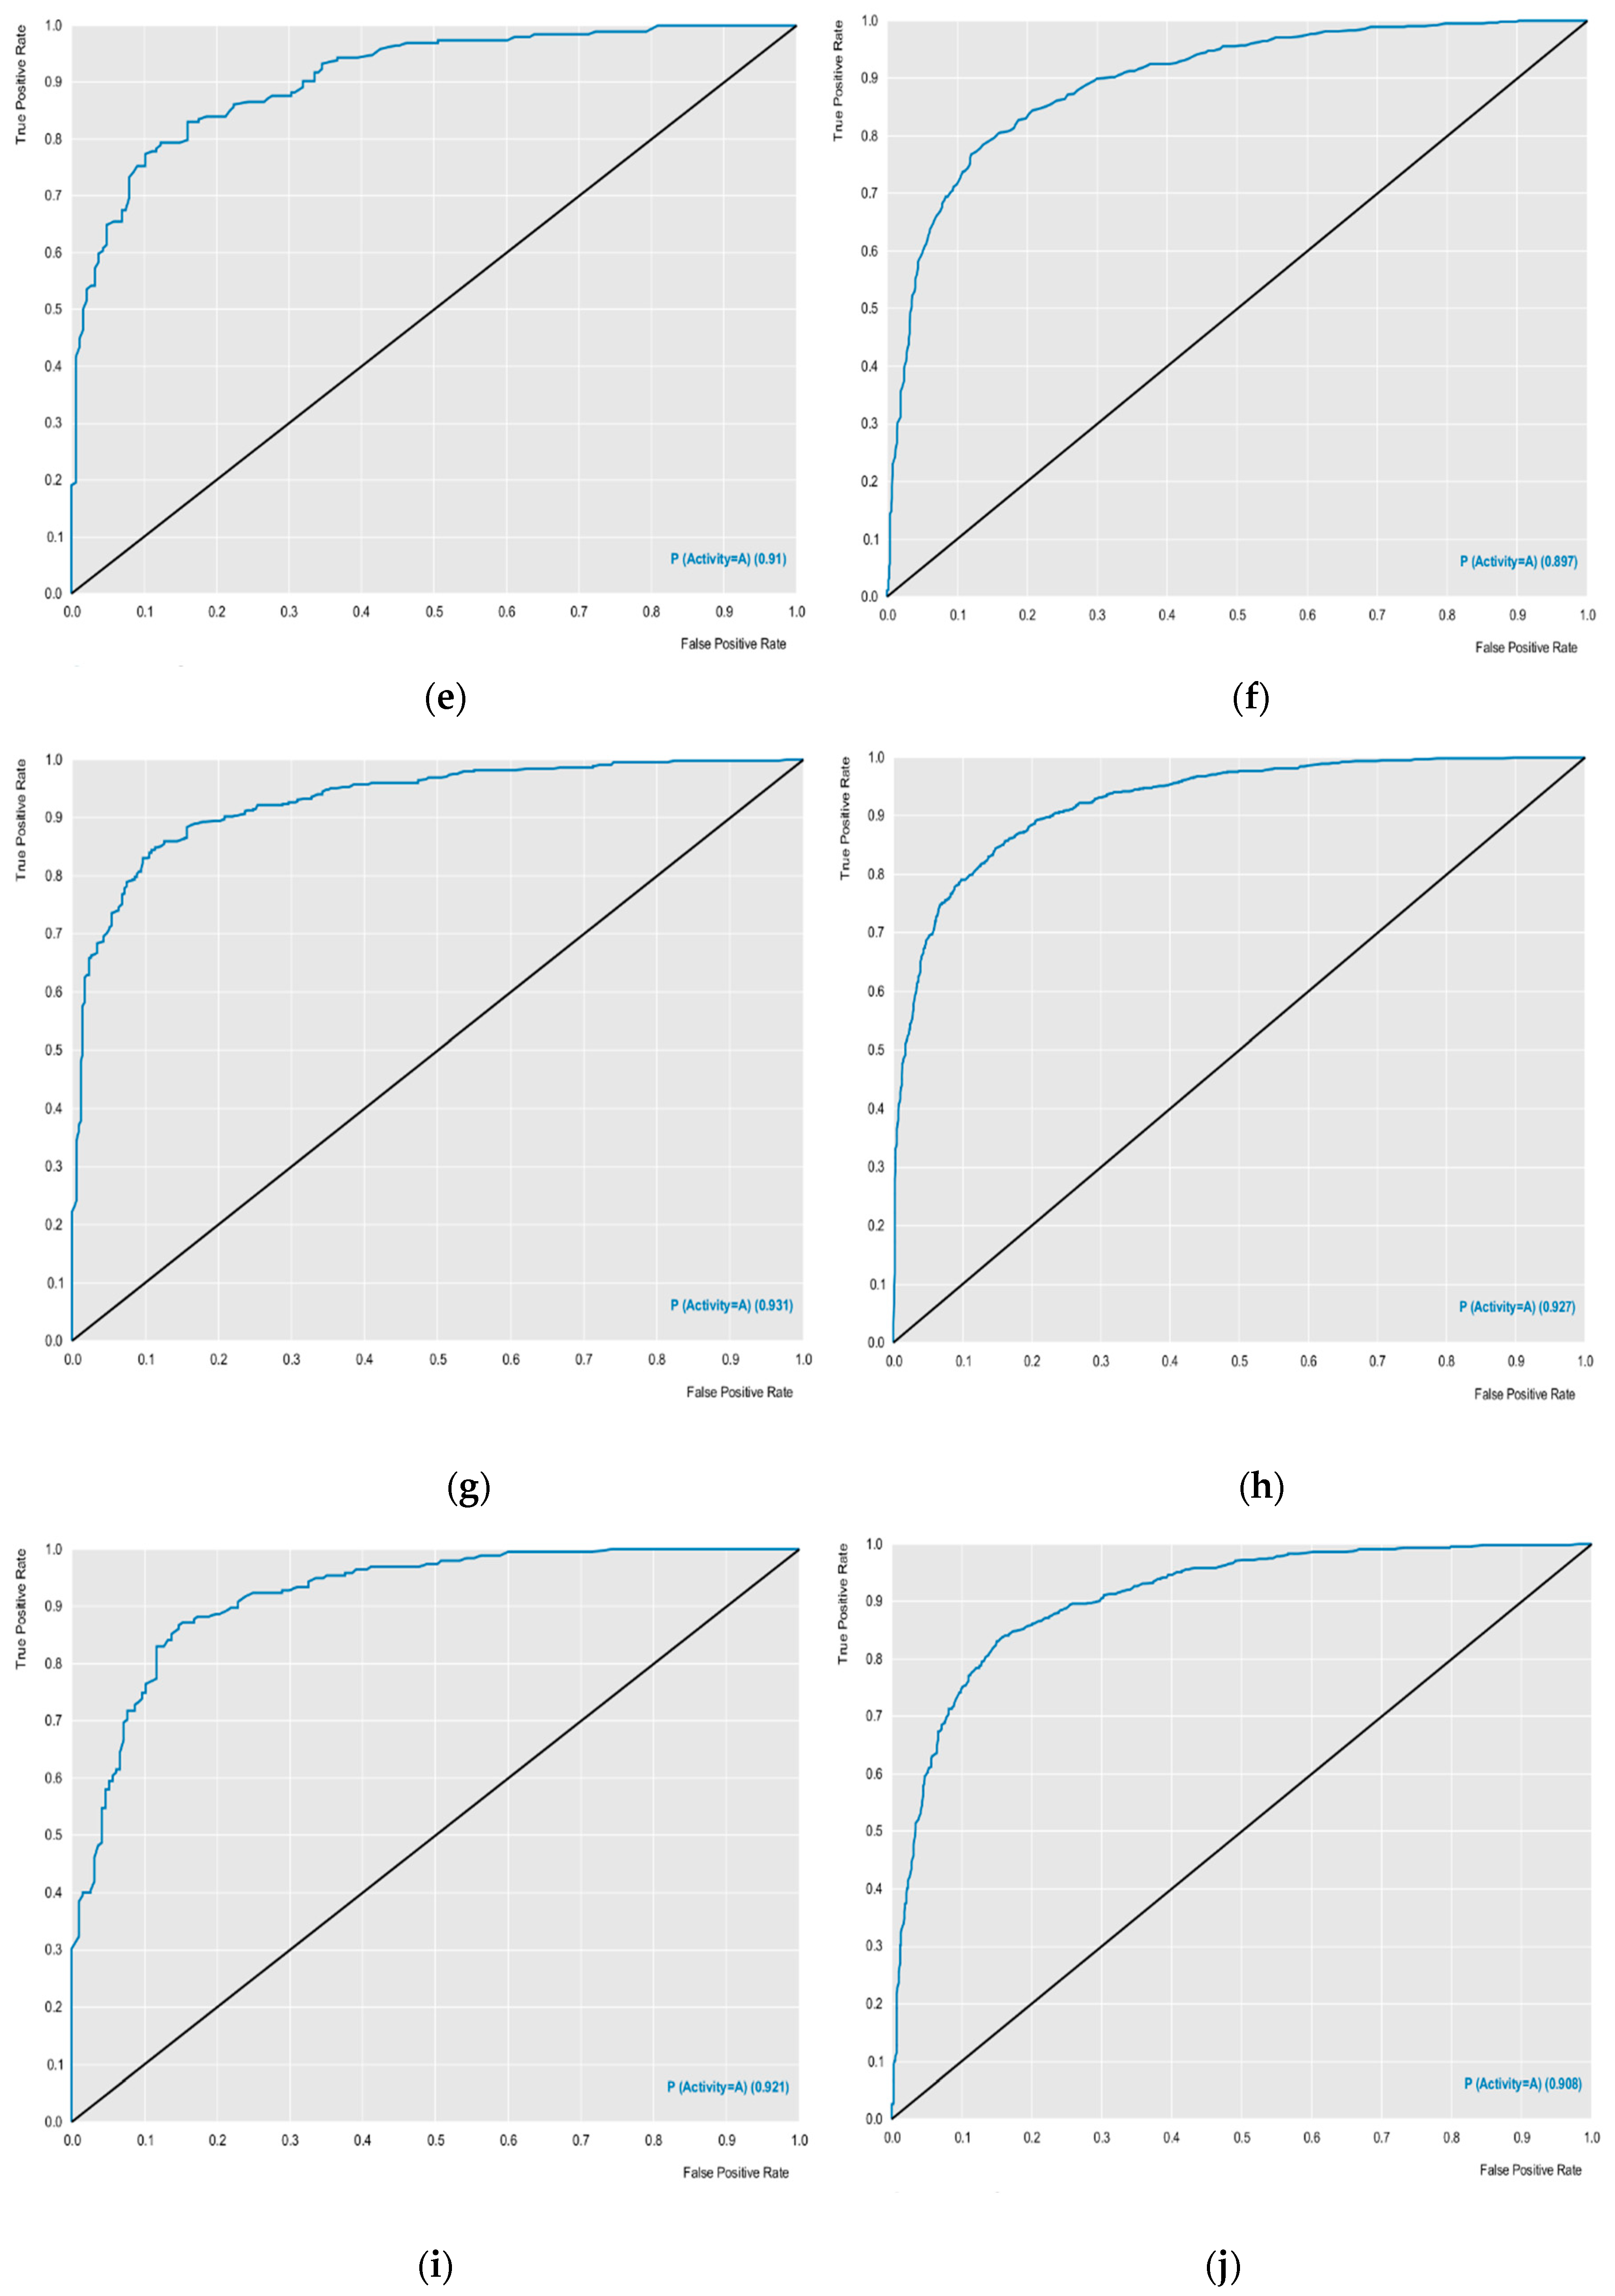
The external performances of the selected models were analyzed for sensitivity (true positive rate or active rate), specificity (true negative rate or inactive rate) and accuracy (overall predictability). These parameters are the most used to ensure the high predictability of the model. Other parameters such as ROC curve results and MCC analyzes revealed excellent results. The models obtained ROC curves greater than 0.89 during cross-validation, and MCC values were also greater than 0.63 during cross-validation, revealing a model with excellent classification, performance and robustness (
Table 1,
Figure 1). Using the models created, with excellent performance, the lignan bank was screened to select potentially active compounds against the selected proteins.
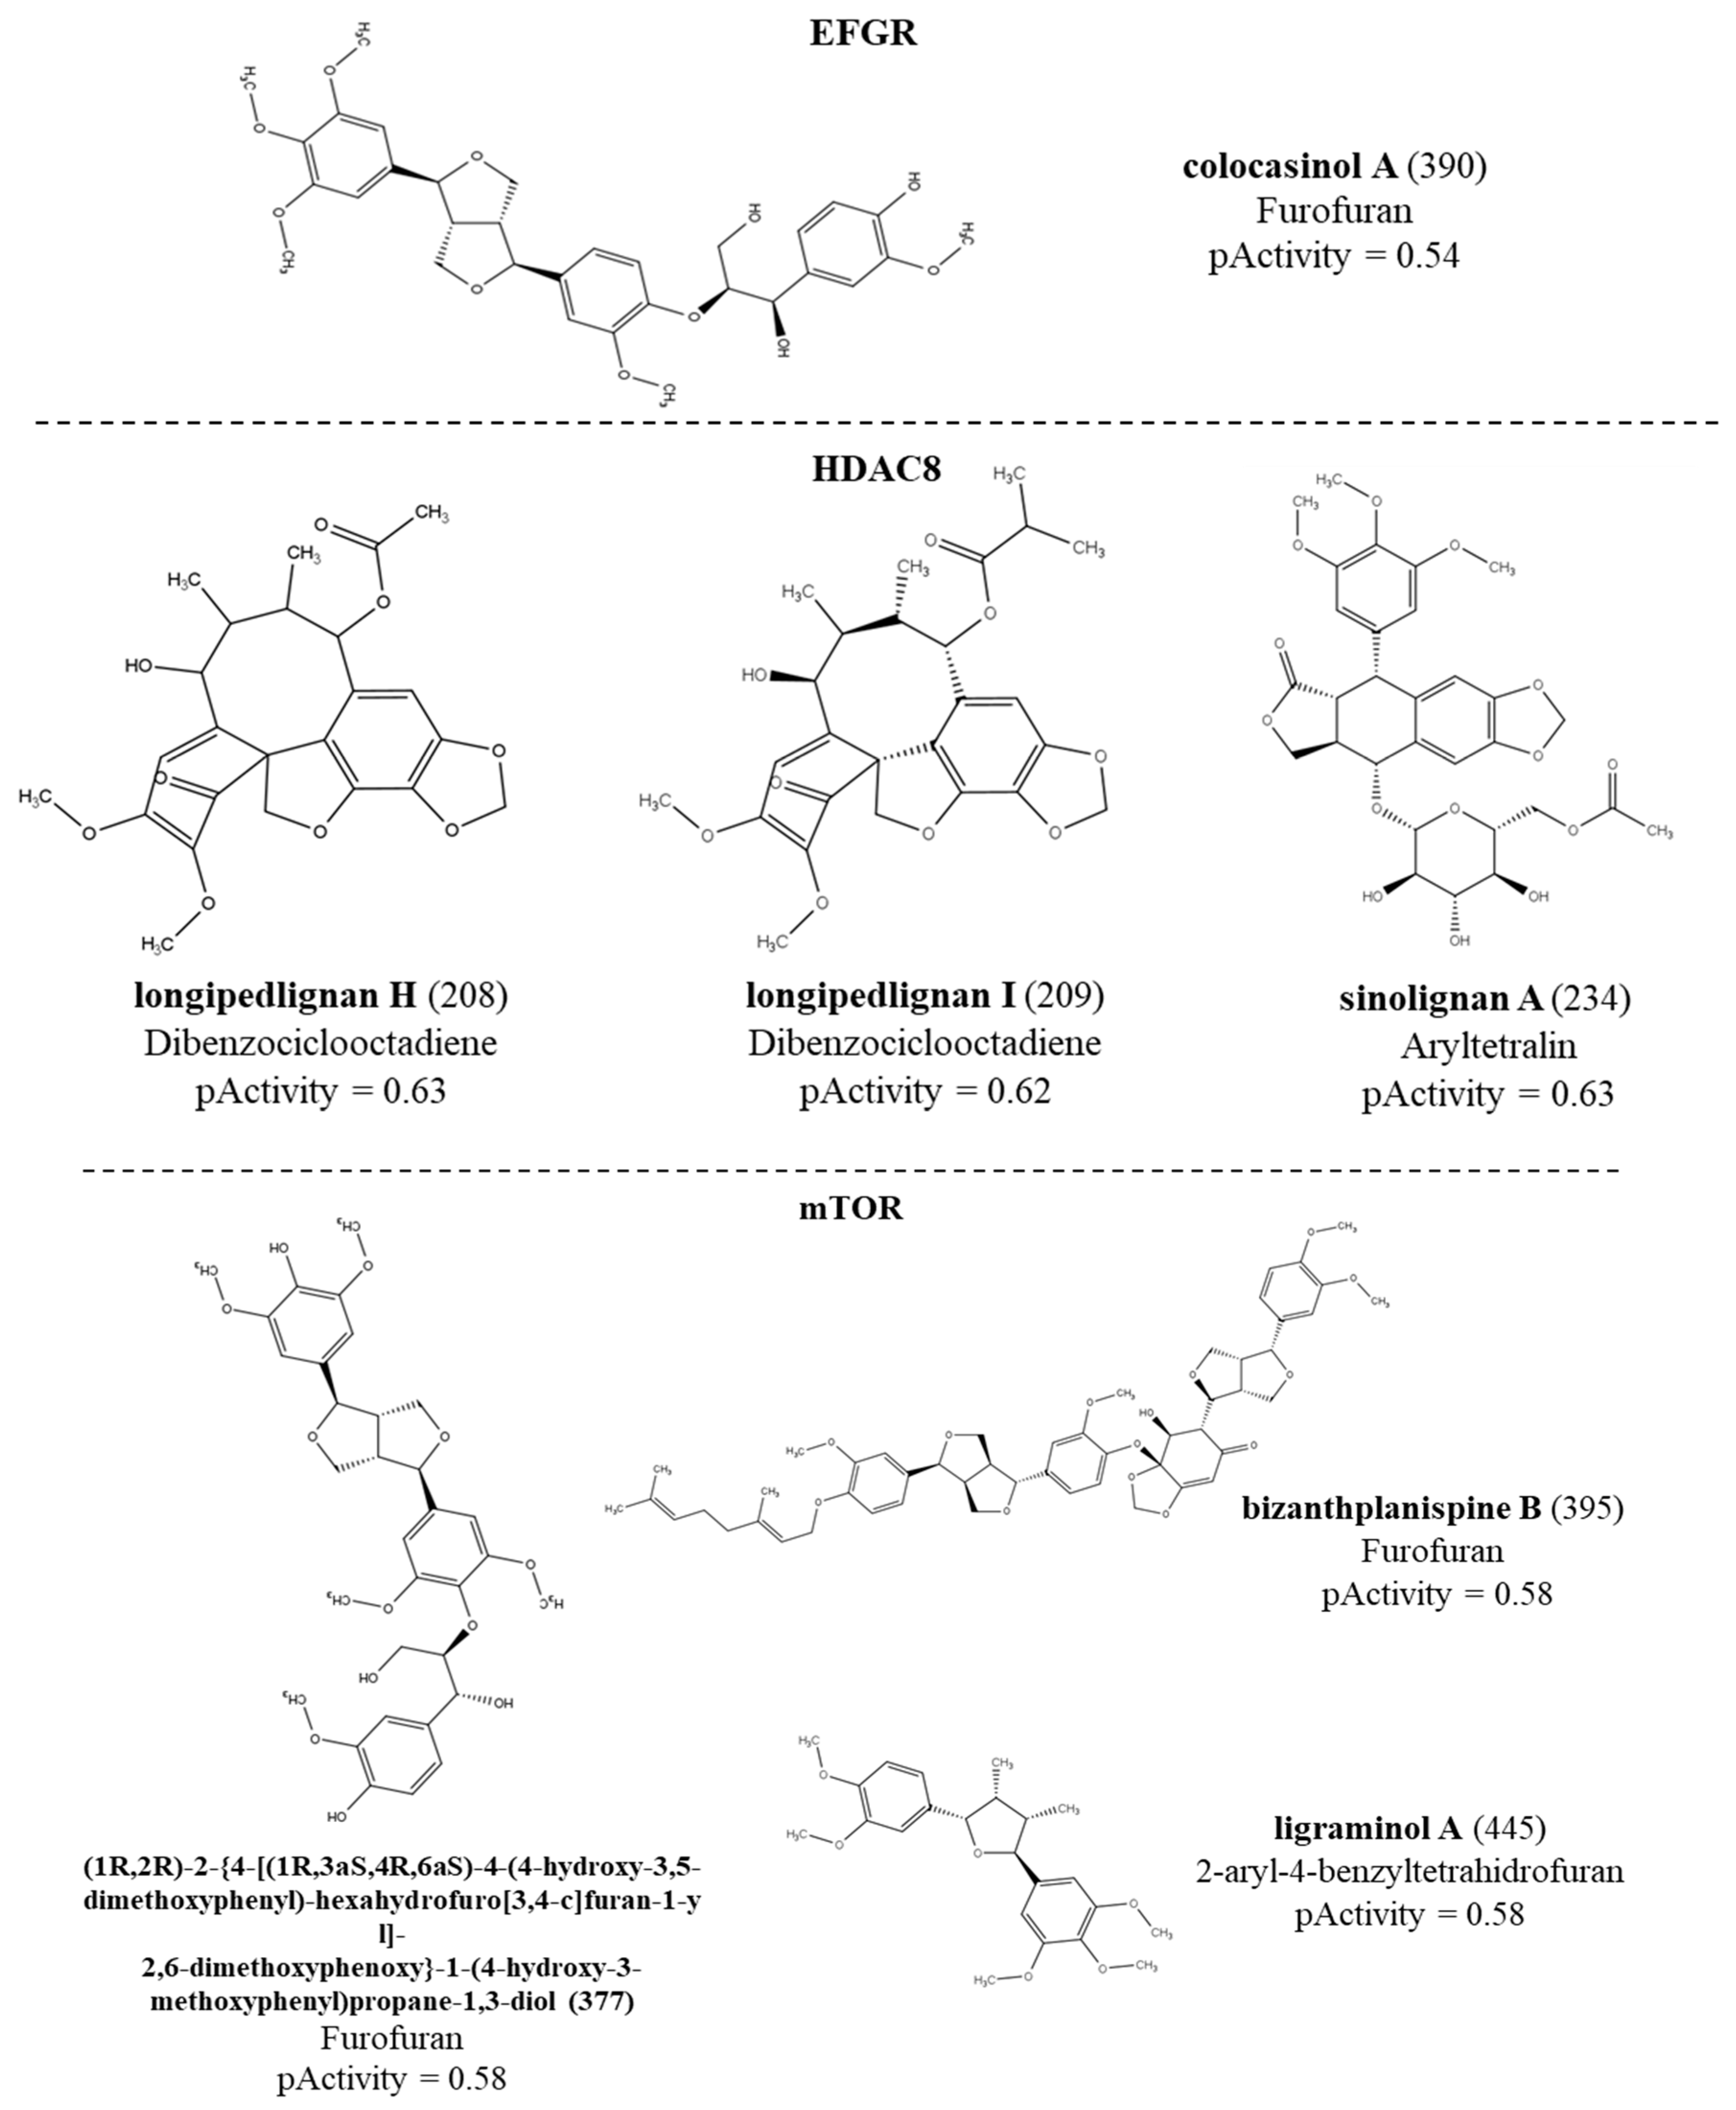
The RF model was able to select a lignan with potential active against the EFGR receptor with a probability of activity of 54%. For the HDAC enzyme, 86 lignans were considered active with activity probabilities ranging from 50 to 63%. While for the mTOR protein, 155 active compounds with activity ranging from 50 to 58% were selected. The model for the PARP enzyme selected 156 compounds with activity ranging from 50 to 56%. No lignans were active for the ABL enzyme. We noticed that the only active compound against the EFGR enzyme was colocasinol A (
390).
Table 2 shows details of these results by subclasses. The structure, subclass and compounds with the highest values of biological activity predicted in the QSAR modeling for each enzyme can be seen in
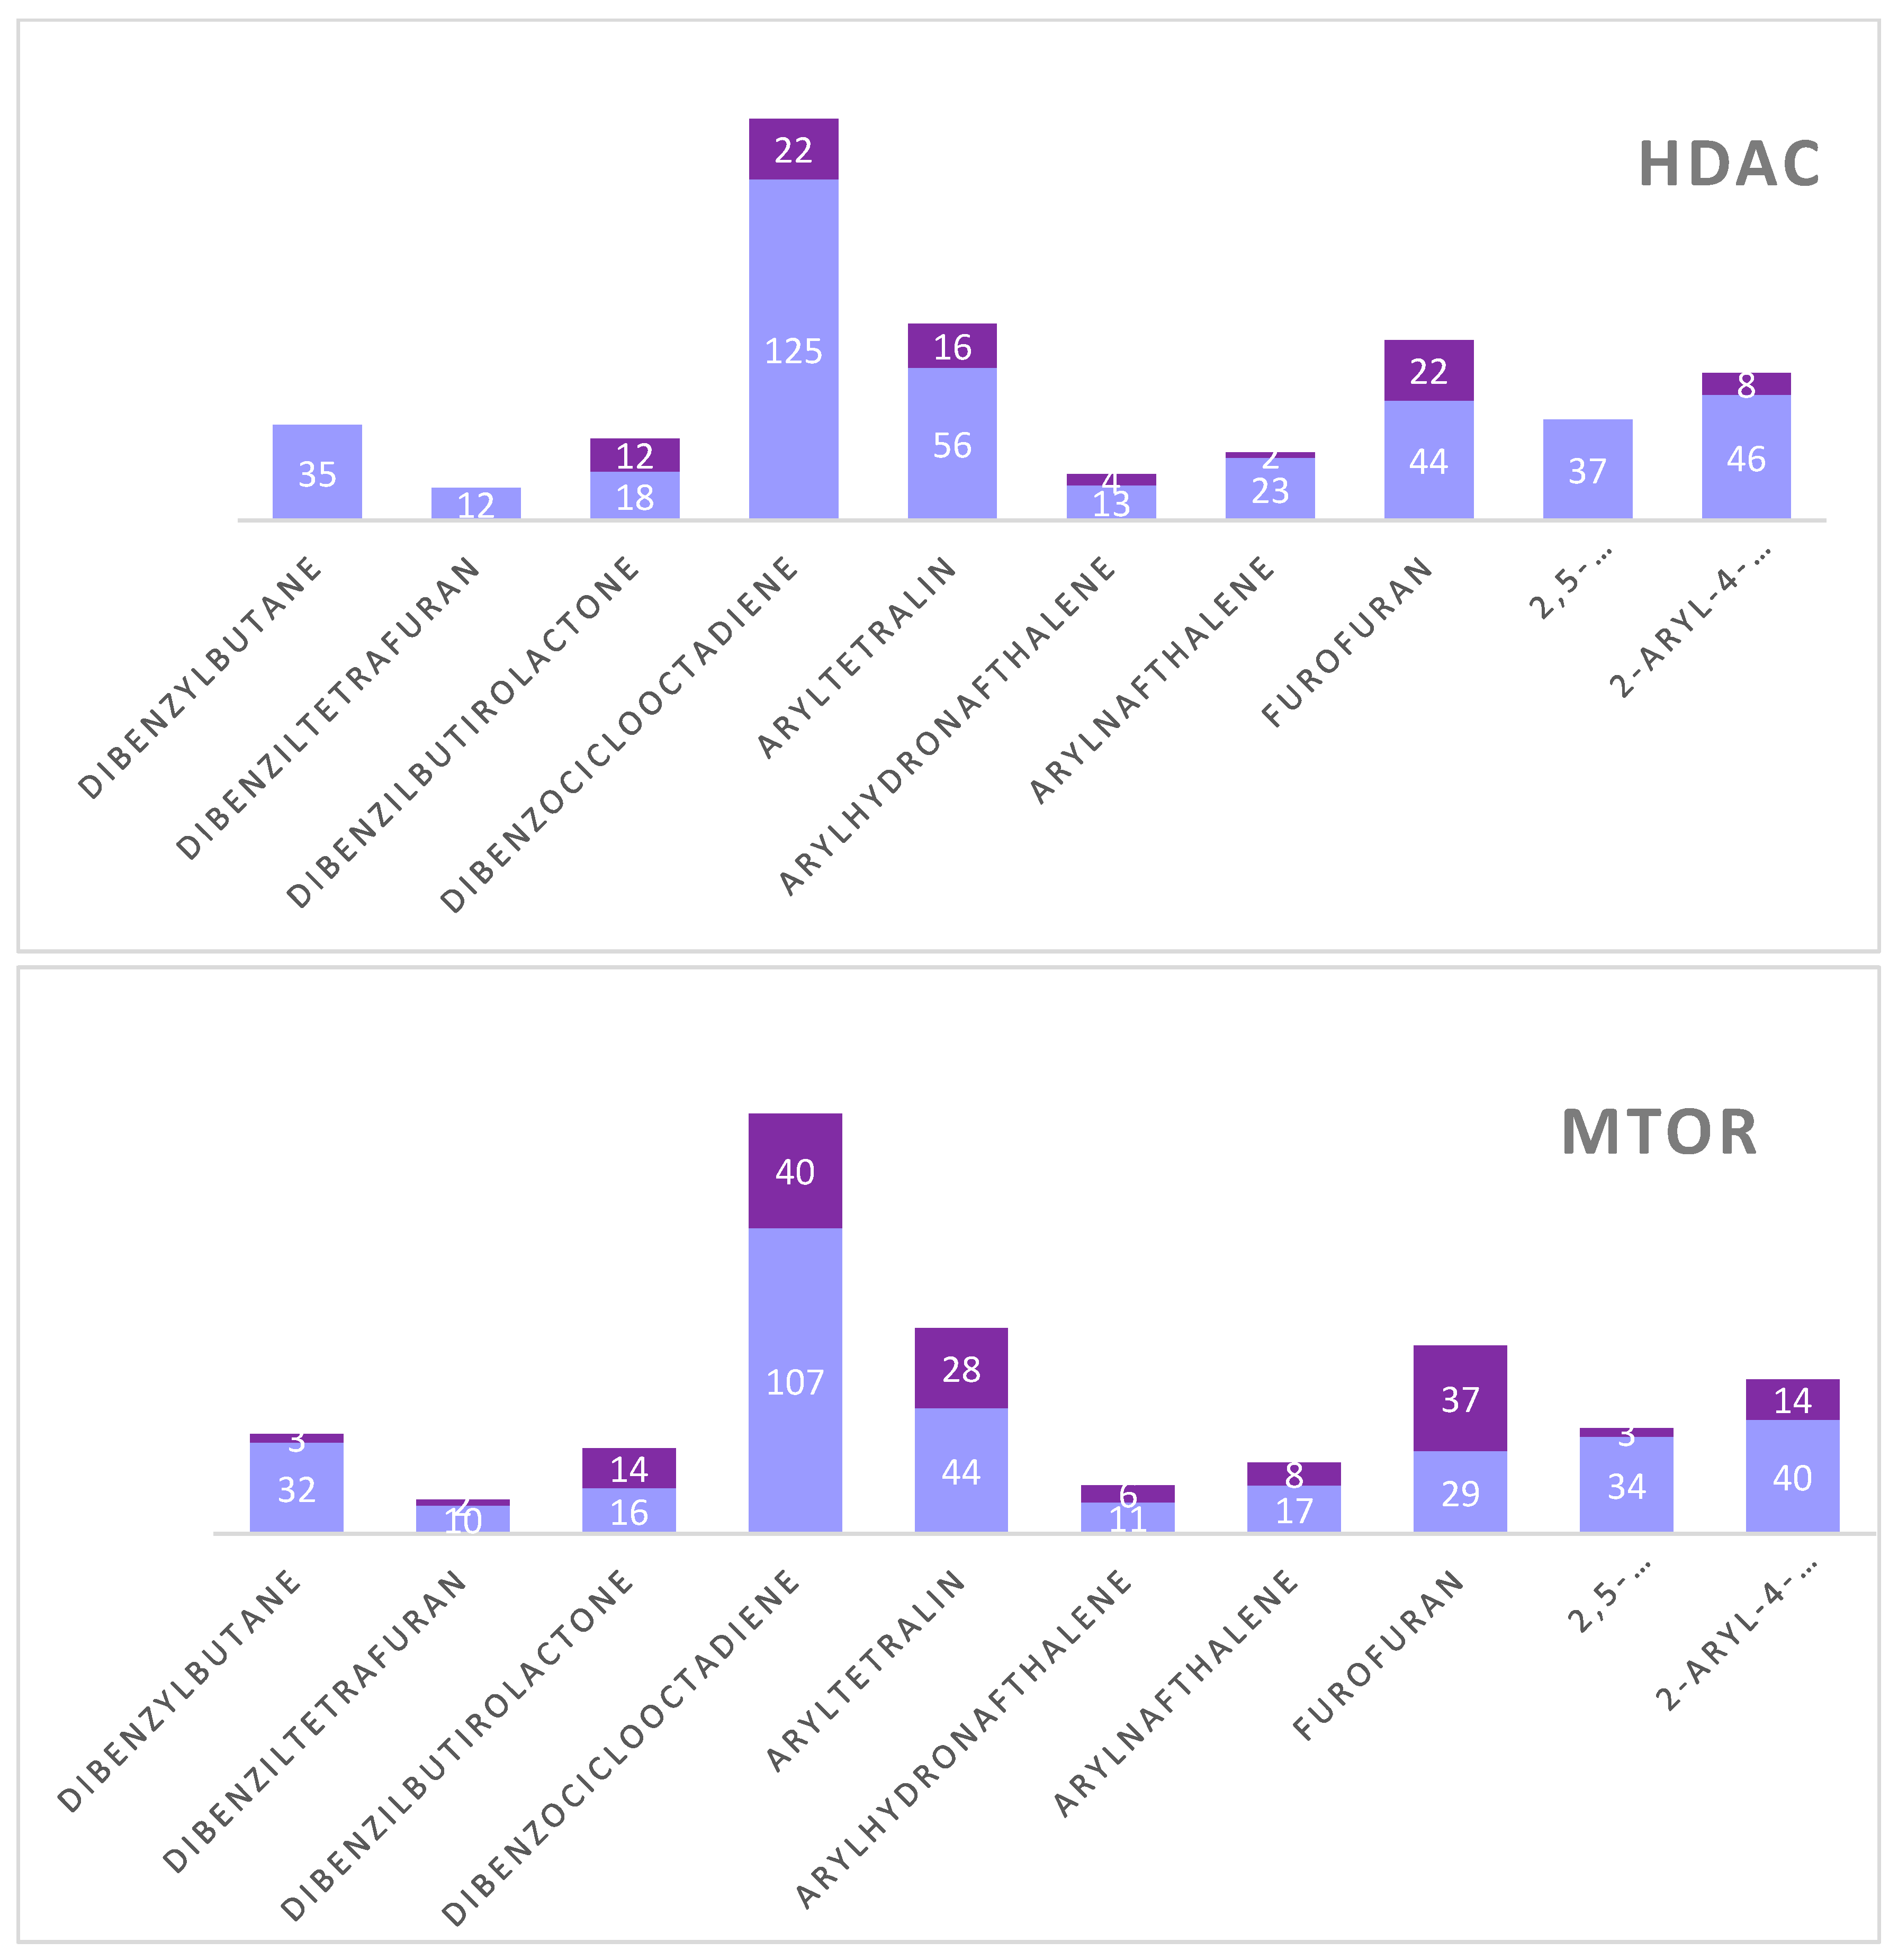
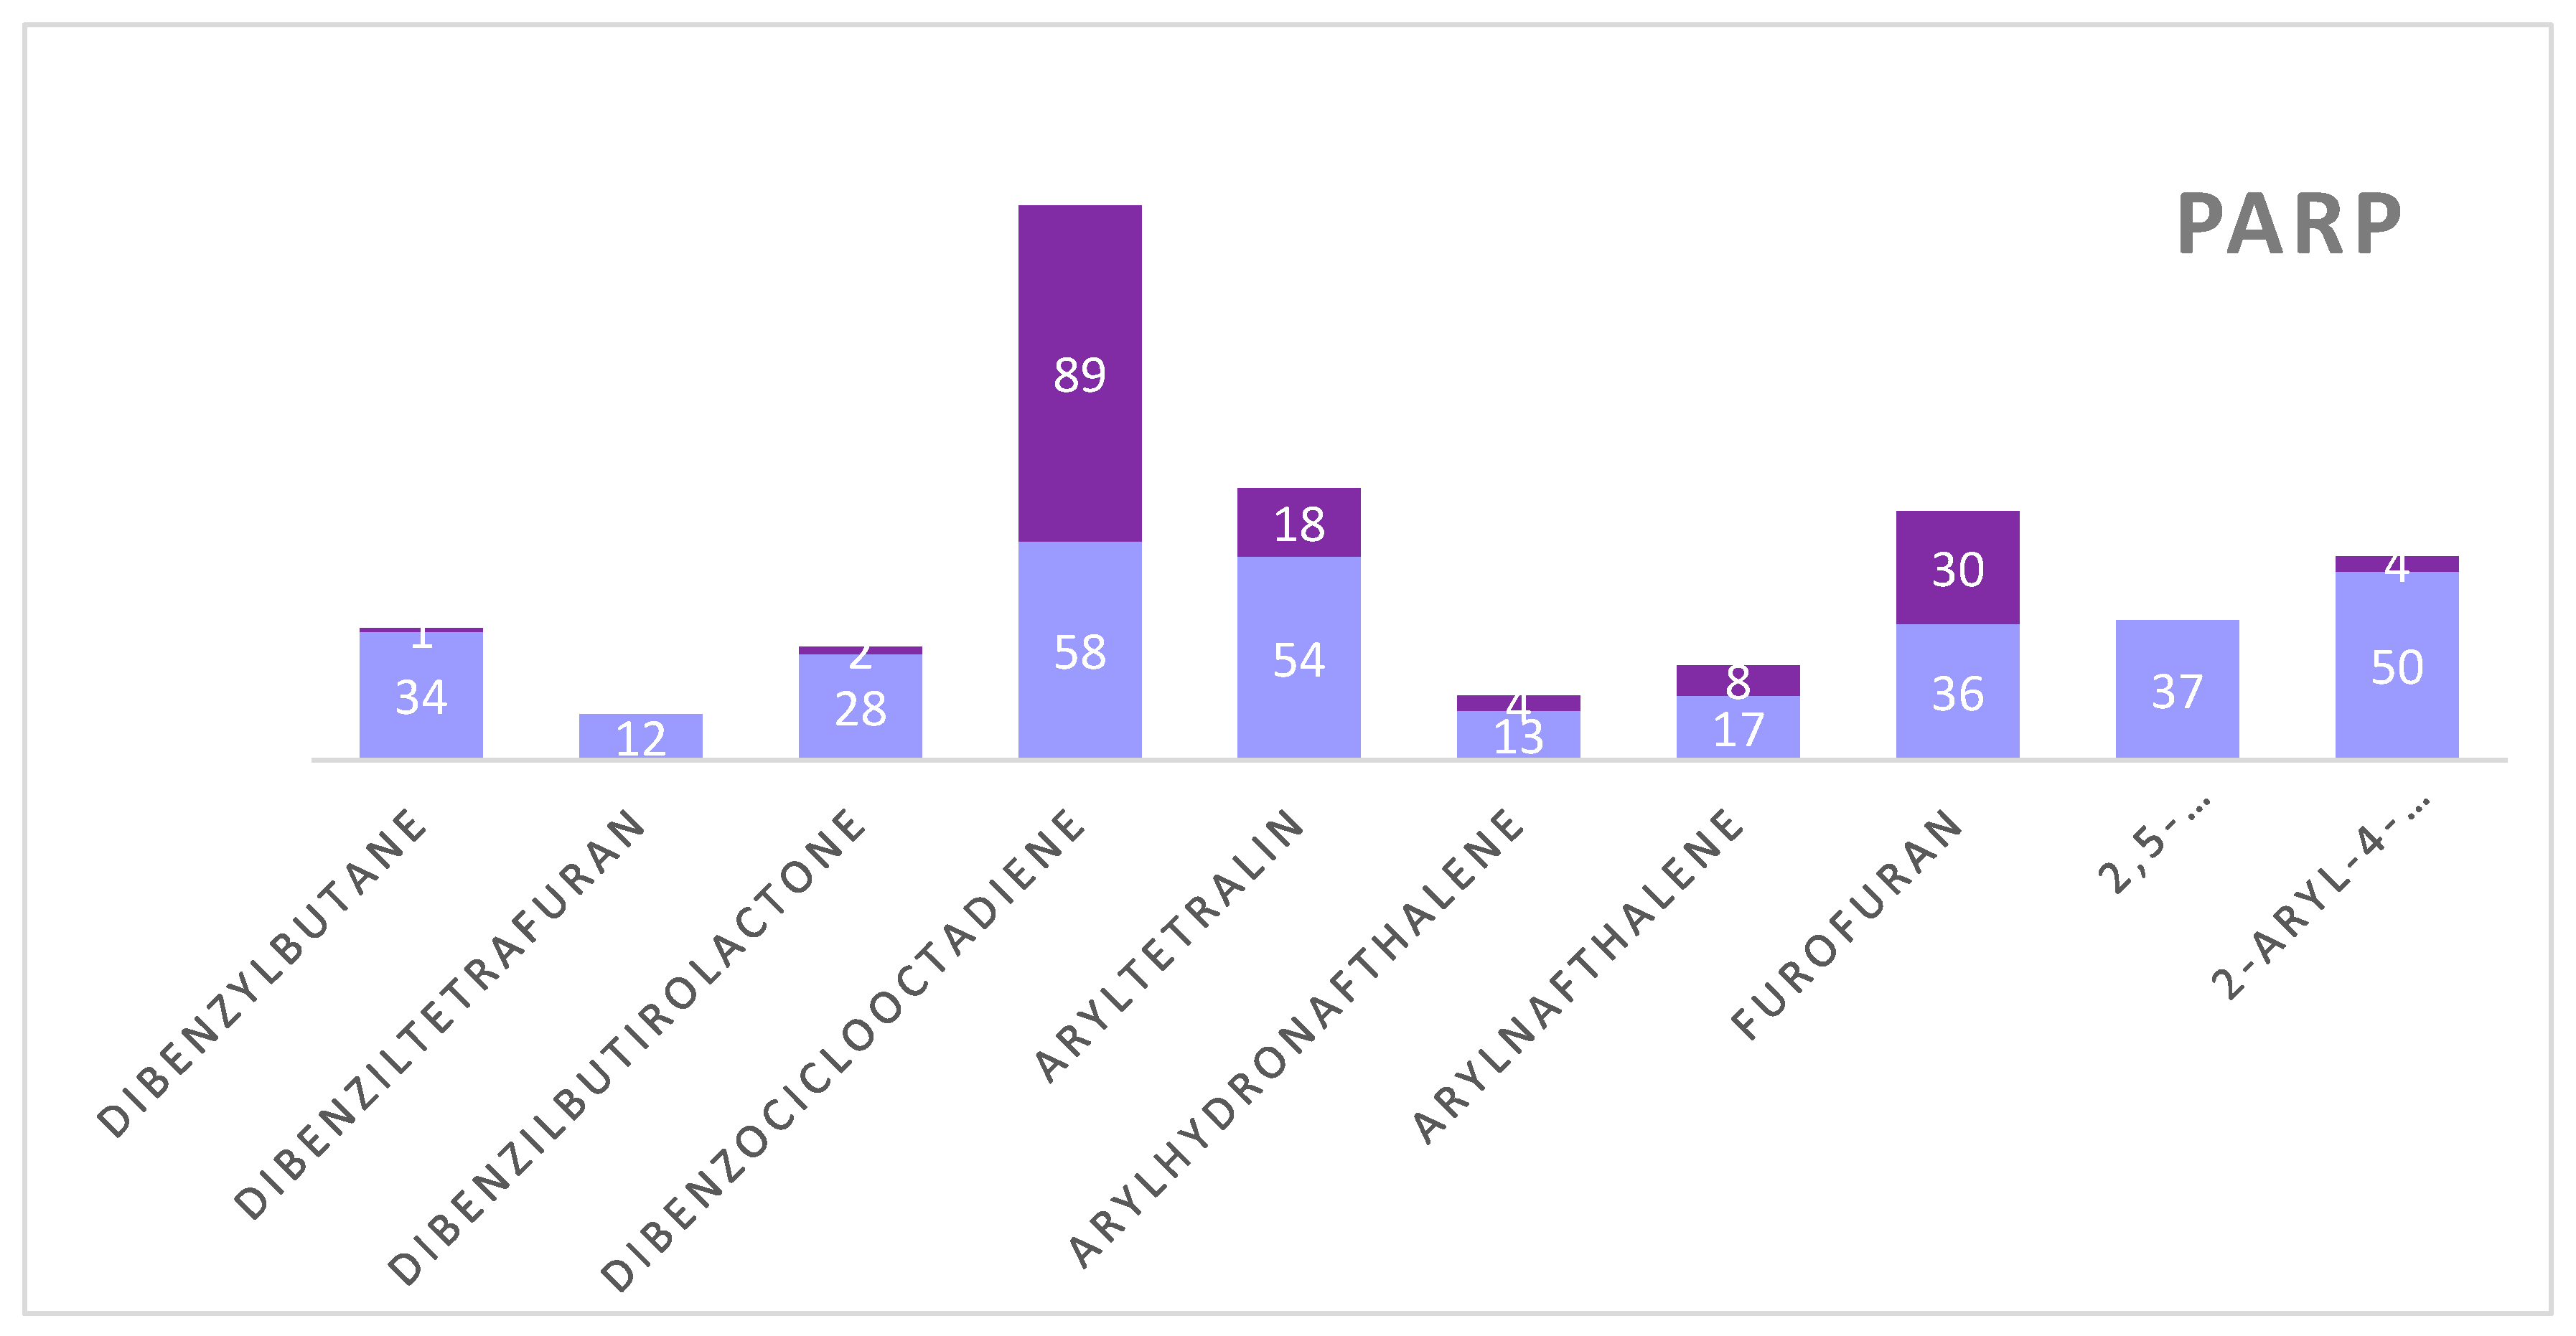
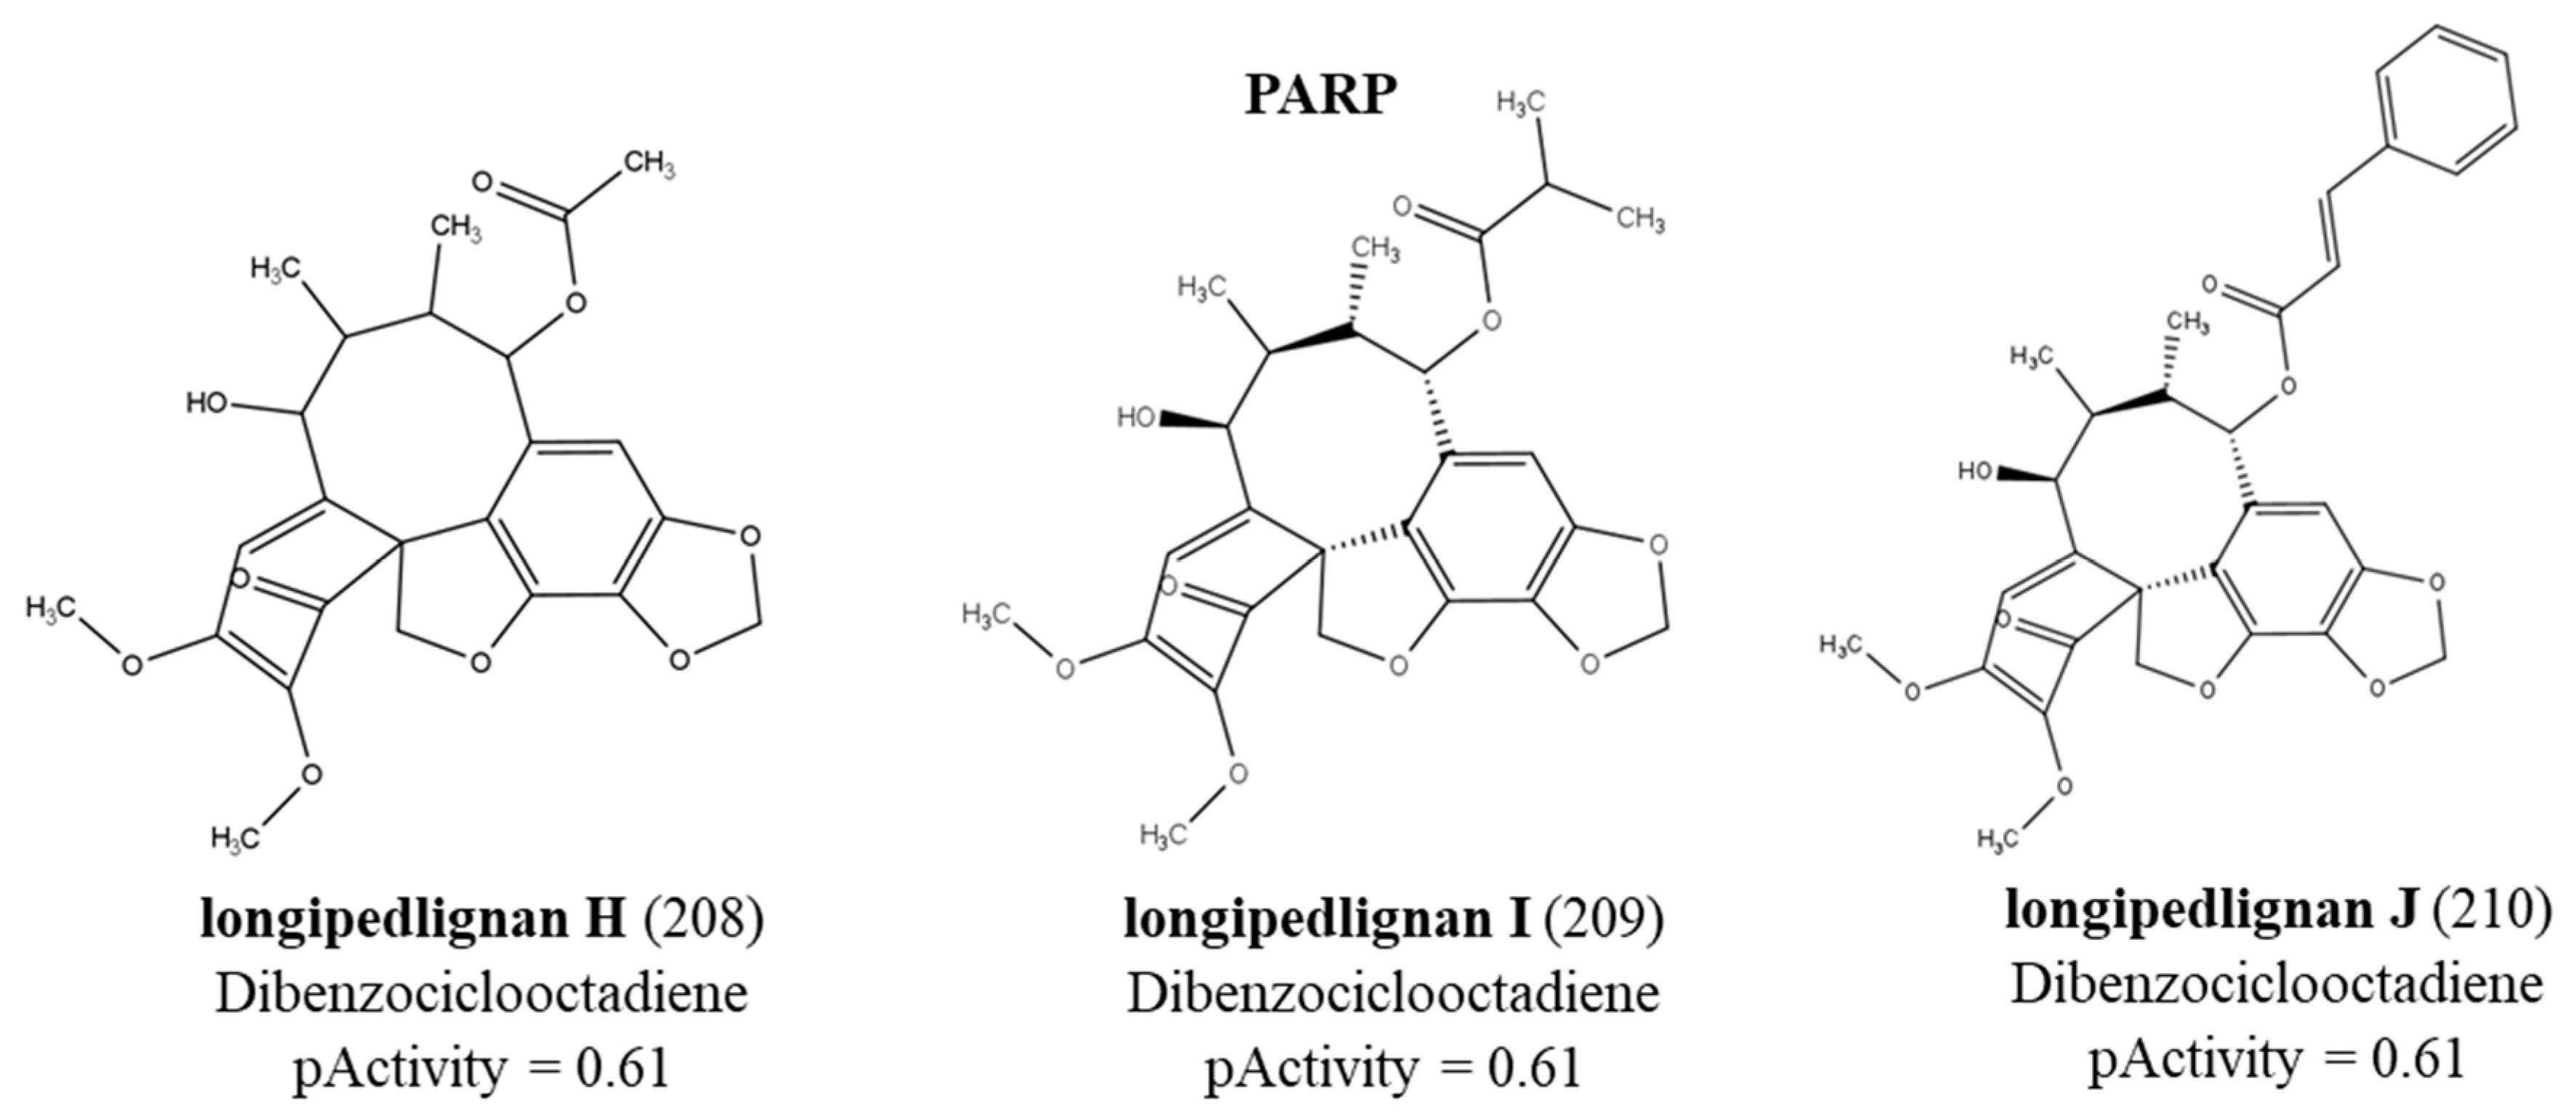
Figure 2. We observed that although the HDAC model selected fewer active compounds when compared to the mTOR and PARP models, the HDAC model was able to select compounds with greater potential for biological activity. For the mTOR protein, active compounds were seen for all subclasses. For PARP, the subclass with the most active compounds was dibenzocyclooctadiene. Furthermore, we also noticed that the subclasses with more active compounds were dibenzocyclooctadiene, furofuran and aryltetralin for all proteins. Graph 1 represents the distribution of active and inactive compounds for each analyzed protein, except for the ABL that did not present an active compound and for the EFGR that obtained only one active compound.
Graph 1.
Structures of the lignans with the highest pActivity values for each protein.
Graph 1.
Structures of the lignans with the highest pActivity values for each protein.
2.2. Mapping single nucleotide polymorphisms (SNPs)
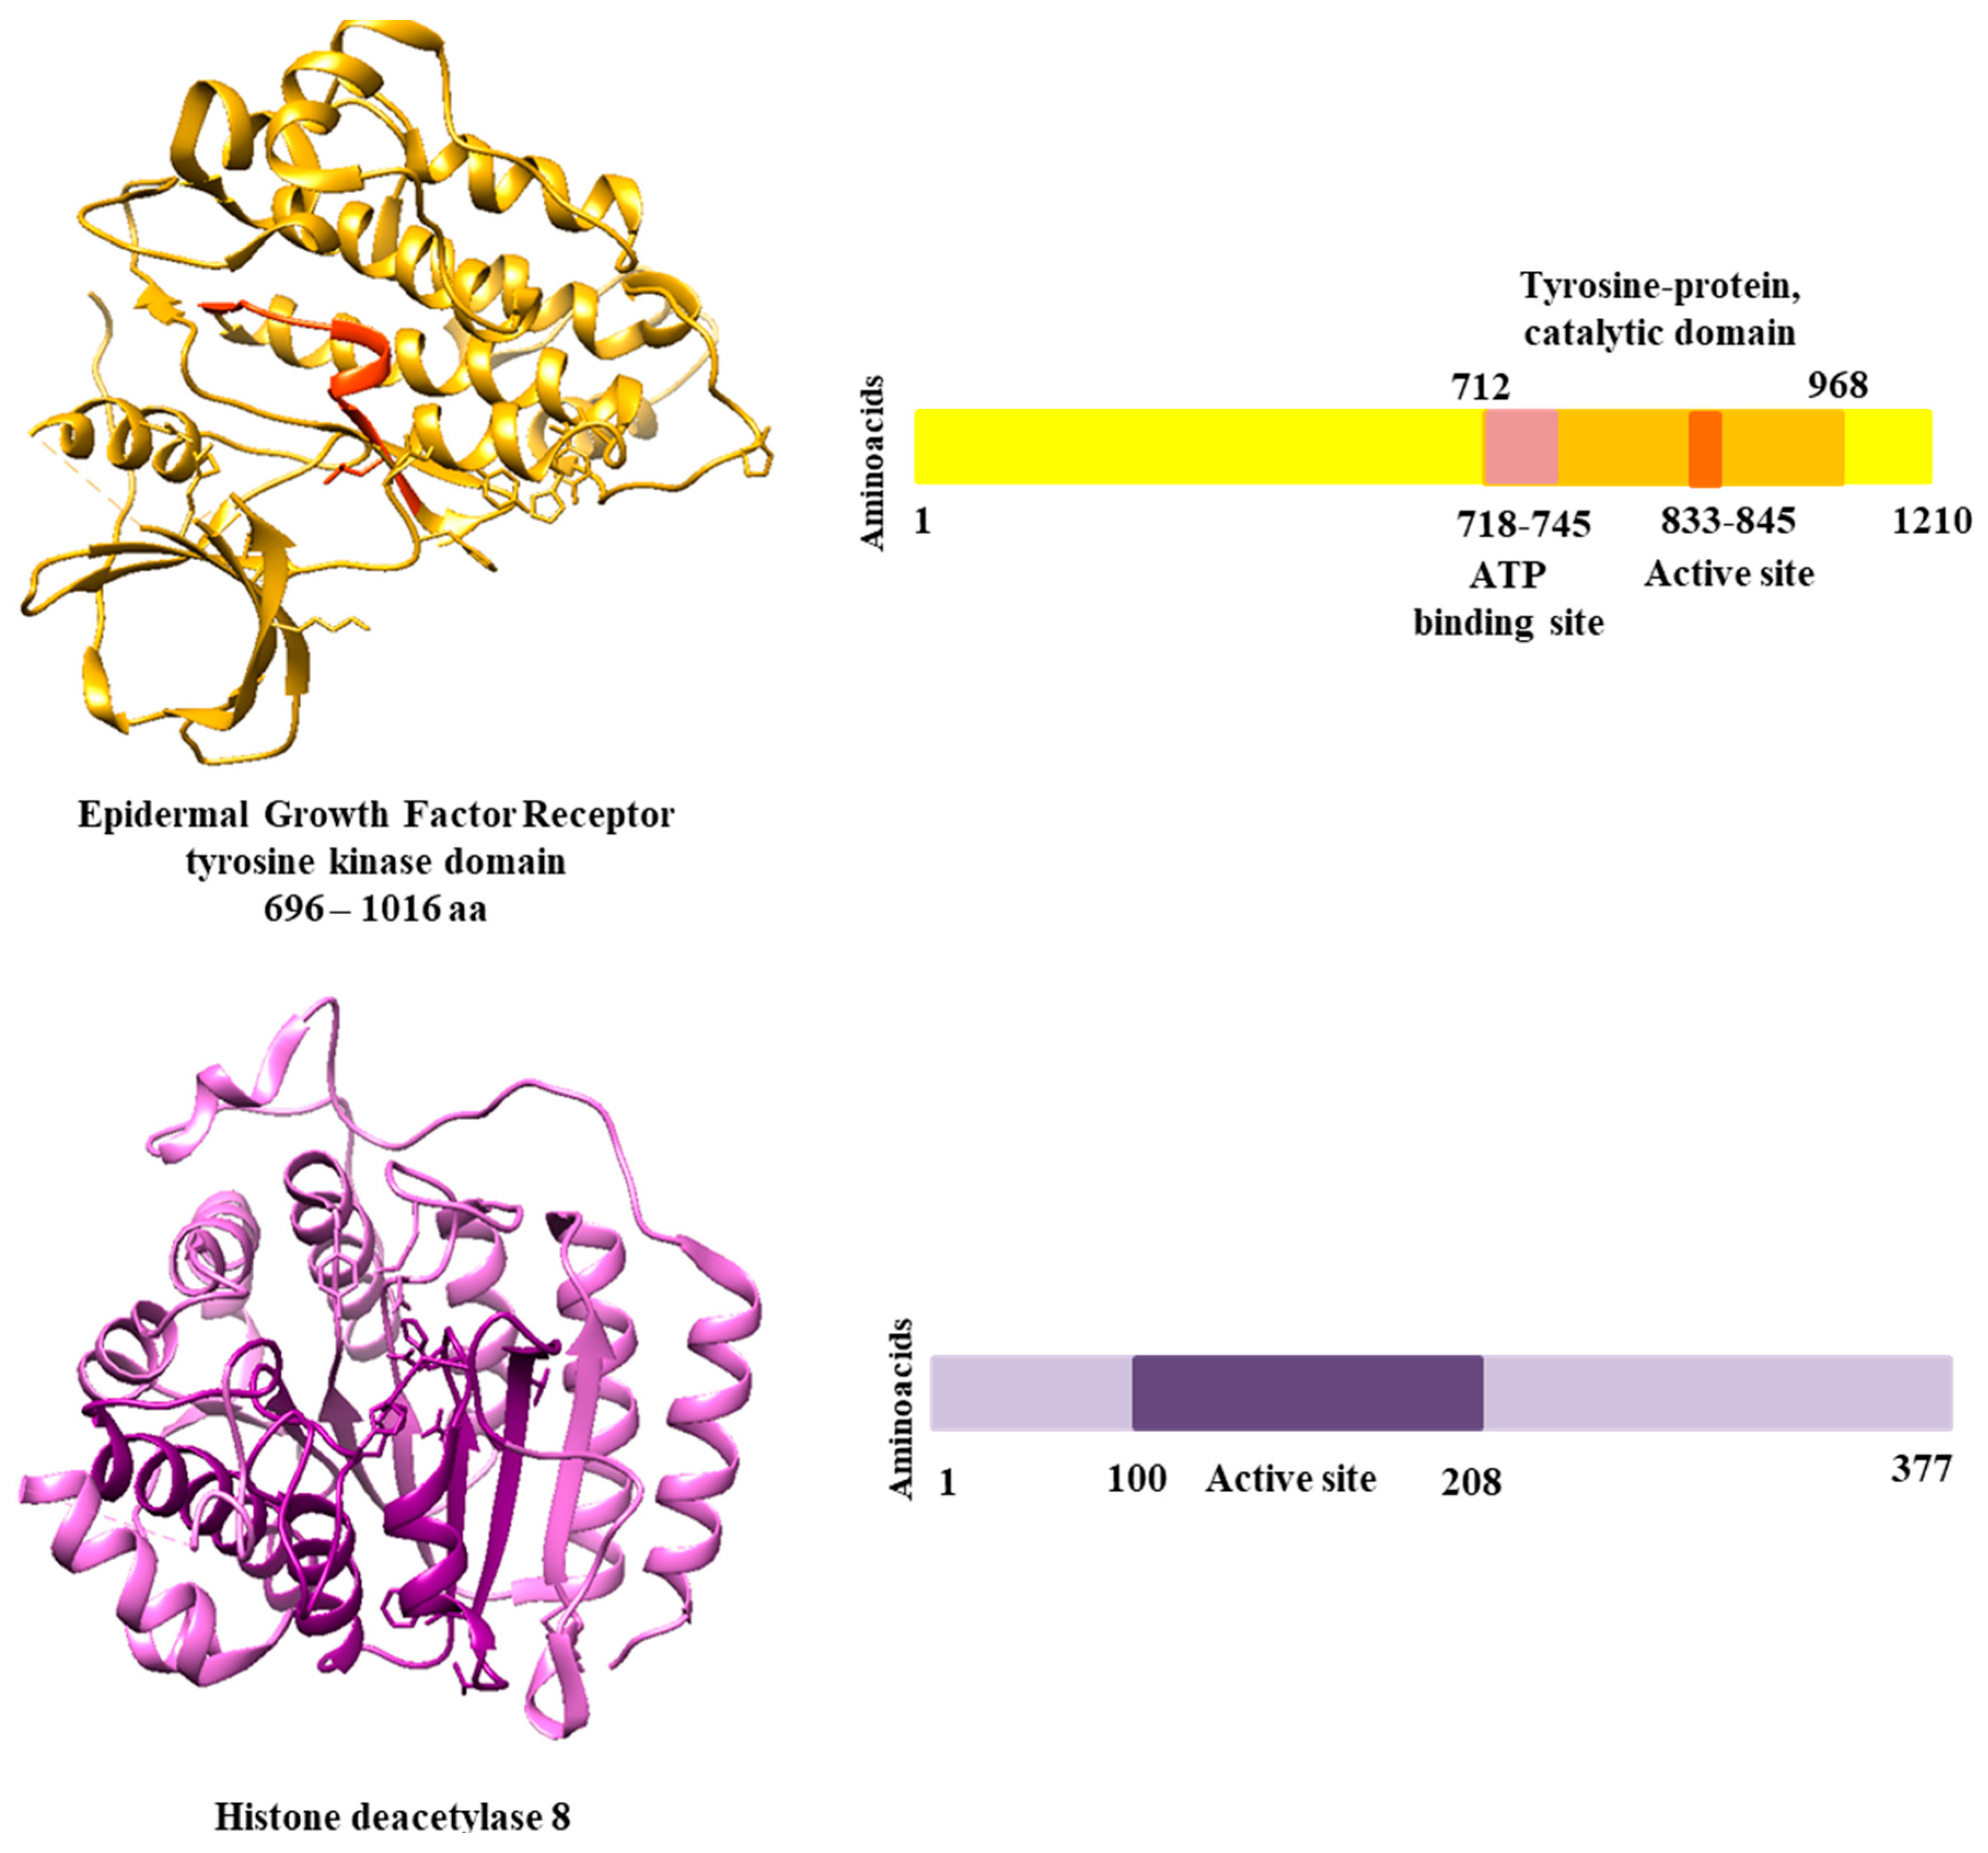
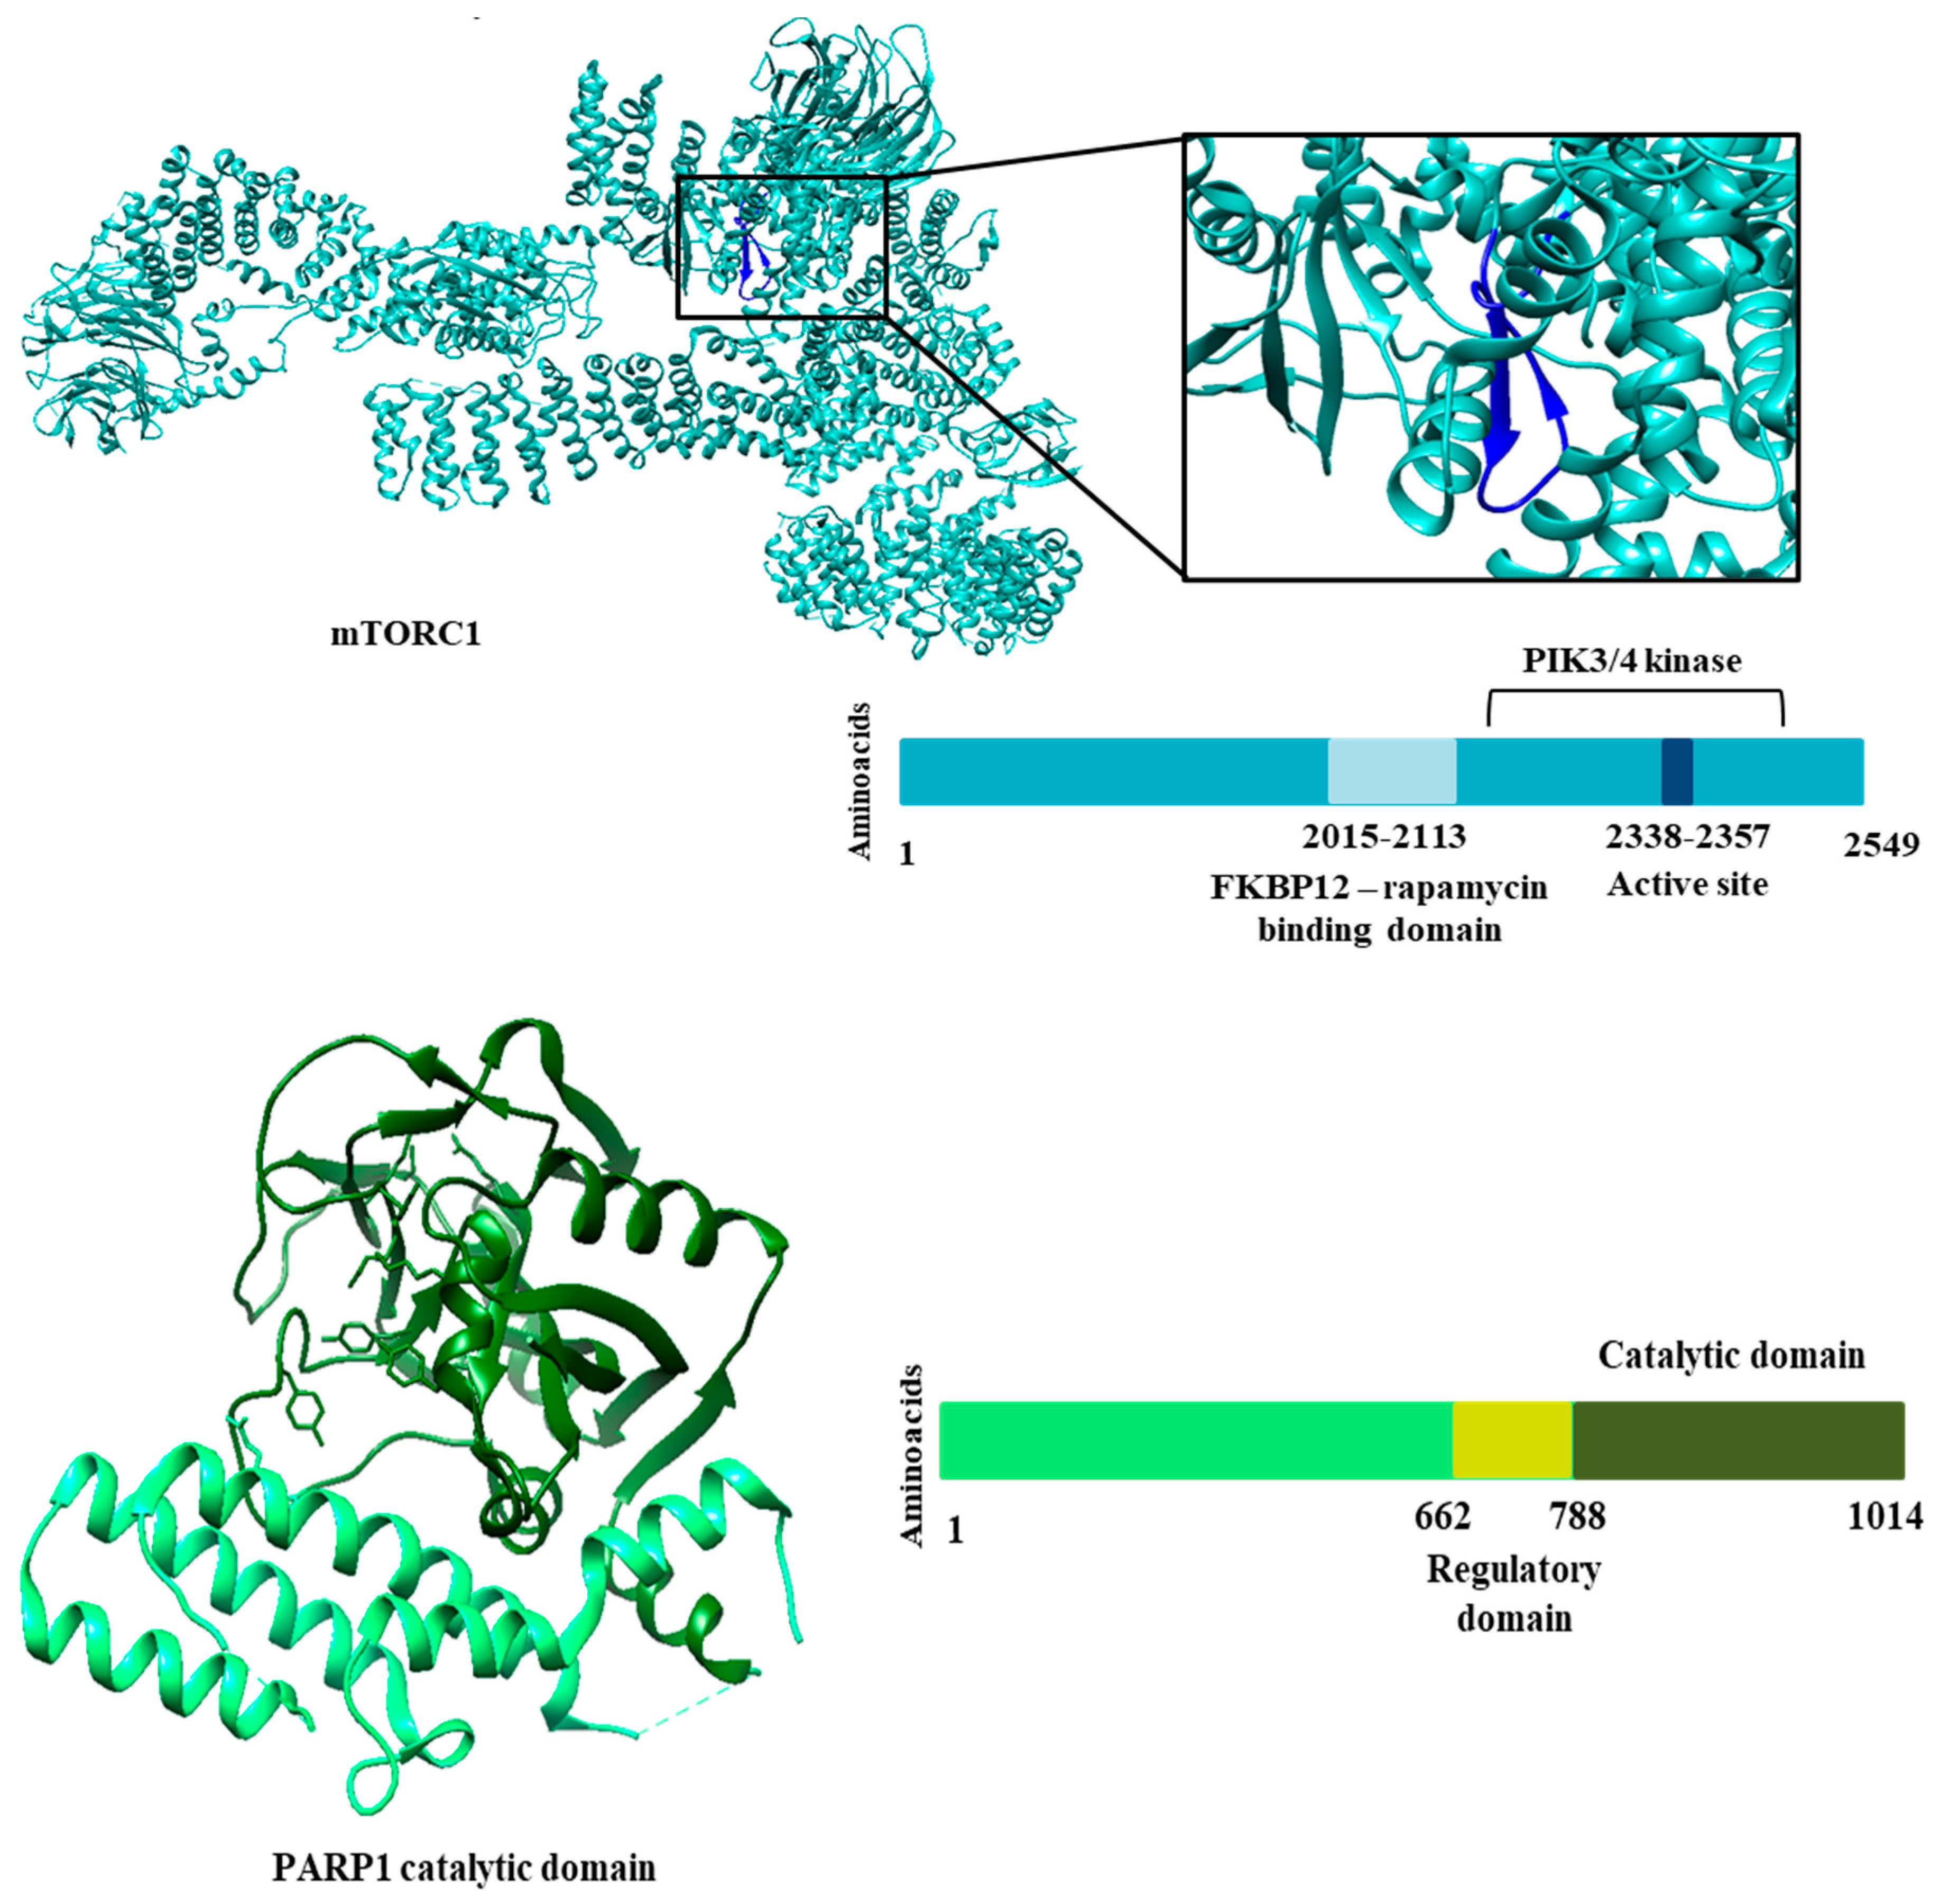
Genomic analysis mapped non-synonymous SNPs to regions of catalytic domains and active site.
Table 3 shows the clinically relevant SNPs that were selected for molecular docking studies.
Figure 3 shows the regions of each protein that were analyzed. We identified 16 SNPs for the EGFR receptor, 28 SNPs for the HDAC8 protein, 40 SNPs for mTOR1 and 113 SNPs for the PARP1 protein. The choice of SNPs to design polymorphic mutations and undergo molecular docking was based on clinical relevance. Therefore, we considered the SNPS that presented some study related to an altered phenotype or disease. In addition, we selected SNPs with allele frequencies of the polymorphic allele greater than expected for certain populations. Therefore, for these analyses, we could select four SNPs for the EGFR receptor, 11 for the HDAC8 protein, 11 for mTOR1 and two for PARP1. Although the results shown show few SNPs with clinical relevance, most show a high probability that the polymorphic variant will affect protein function if the mutation occurs. This result was provided by Polyphen, a tool that predicts variants likely to affect protein function based on physical and comparative considerations.
2.3. Docking molecular
The lignans with the highest values of predicted biological activity for EFGR, HDAC8, mTOR and PARP1 proteins were subjected to molecular docking. Docking was per-formed with the ancestral protein and the mutated proteins. Only one lignan (colocasinol A) was coupled to the EGFR receptor. The remaining lignans were renamed to better express the Docking results in Table 4. For HDAC8, lignans longipedlignan H, longipedlignan I and sinolignan A; were renamed as lignan 1, lignan 2 and lignan 3, respectively. For mTOR, lignans (1R,2R)-2-{4-[(1R,3aS,4R,6aS)-4-(4-hydroxy-3,5-dimethoxyphenyl)-hexahydrofuro[3,4-c] furan-1-yl]-2,6-dimethoxyphenoxy, bizanthplanispine B and bigraminol A; were renamed as lignan 1, lignan 2 and lignan 3, respectively. The same happened with the lignans active against the PARP1 protein (longipedlignan H, longipedlignan I and longipedlignan J). Results were generated using the Moldockscore function. More negative values indicated better predictions. In this study, we only sought to analyze the difference in binding affinity according to the polymorphic variant. Thus, it is possible to verify the contribution of the binding affinity of a compound ac-cording to the genetic profile.
Table 3.
Binding energy values obtained from Molecular Docking for lignans with higher biological activity prediction values. Results with higher binding energy values are highlighted in bold.
Table 3.
Binding energy values obtained from Molecular Docking for lignans with higher biological activity prediction values. Results with higher binding energy values are highlighted in bold.
| Enzyme |
Ancestor/mutation |
Binding energy values |
| Lignan 1 |
Lignan 2 |
Lignan 3 |
| EGFR |
Ancestor |
-24.04 |
|
|
| L833V |
-20.91 |
|
|
| H835L |
-18.77 |
|
|
| N842H |
-23.86 |
|
|
| V845L |
-34.46 |
|
|
| |
|
|
|
|
| HDAC8 |
Ancestor |
- |
-91.43 |
-72.66 |
| D101G |
- |
-76.40 |
-103.84 |
| G139A |
- |
-84.29 |
-75.52 |
| G140R |
- |
-85.82 |
-95.60 |
| G140V |
- |
-80.36 |
-77.22 |
| K145E |
- |
-83.07 |
-76.75 |
| L155F |
- |
-84.68 |
-104.49 |
| D176G |
- |
-76.04 |
-109.54 |
| E186K |
- |
-77.42 |
-74.81 |
| A188T |
- |
-87.21 |
-92.01 |
| V195G |
- |
-75.94 |
-90.33 |
| S199T |
- |
-97.80 |
-102.33 |
| mTOR |
Ancestor |
-84.51 |
-57.71 |
-85.76 |
| V2326F |
-56.35 |
-92.26 |
-45.96 |
| M2327I |
-34.21 |
-96.85 |
-49.40 |
| T2367A |
-49.53 |
-78.14 |
-56.66 |
| V2406L |
-69.68 |
-78.05 |
-51.91 |
| S2413I |
-44.52 |
-90.24 |
-48.06 |
| E2419K |
-69.90 |
-100.11 |
-47.54 |
| L2427P |
-63.85 |
-63.74 |
-39.79 |
| L2431P |
-64.20 |
-85.28 |
-43.77 |
| |
|
|
|
|
| PARP1 |
Ancestor |
- |
-136.95 |
-172.23 |
| S864A |
- |
-134.17 |
-157.52 |
| K940R |
- |
-137.38 |
-154.40 |
The docking results can be seen in Table 4. According to the results, the colocasinol A lignan presented similar values, except for the V845L variant, which obtained a binding energy value of -34.46 kcal/mol-1. For the HDAC8 protein, we observed that lignan 1 (longipedlignan H) failed to interact with the enzyme, despite the QSAR mod-eling results. The other lignans varied results, with more negative values for the ancestor and some variants, such as S199T. More negative values may indicate a probability of better binding affinity, suggesting stronger protein inhibition. As for mTOR, we were unable to design the mutation in two variants due to the incomplete ancestral protein available in databases. The results for mTOR revealed quite varied energy values when compared with the results for the ancestral protein. Only bizanthplanispine B obtained higher binding energy values than the ancestor. The lowest binding energy value for this protein was -34.21 kcal/mol-1 for the M2327I variant. How-ever, the bizanthplanispine B lignan obtained a high binding energy value (-96.85 kcal/mol-1) for this variant. These results show that not only the type of mutation interferes with binding affinity, but also the structural variety of compounds. While the PARP1 protein, showed similar values, except for longipedlignan H that did not interact with the protein.
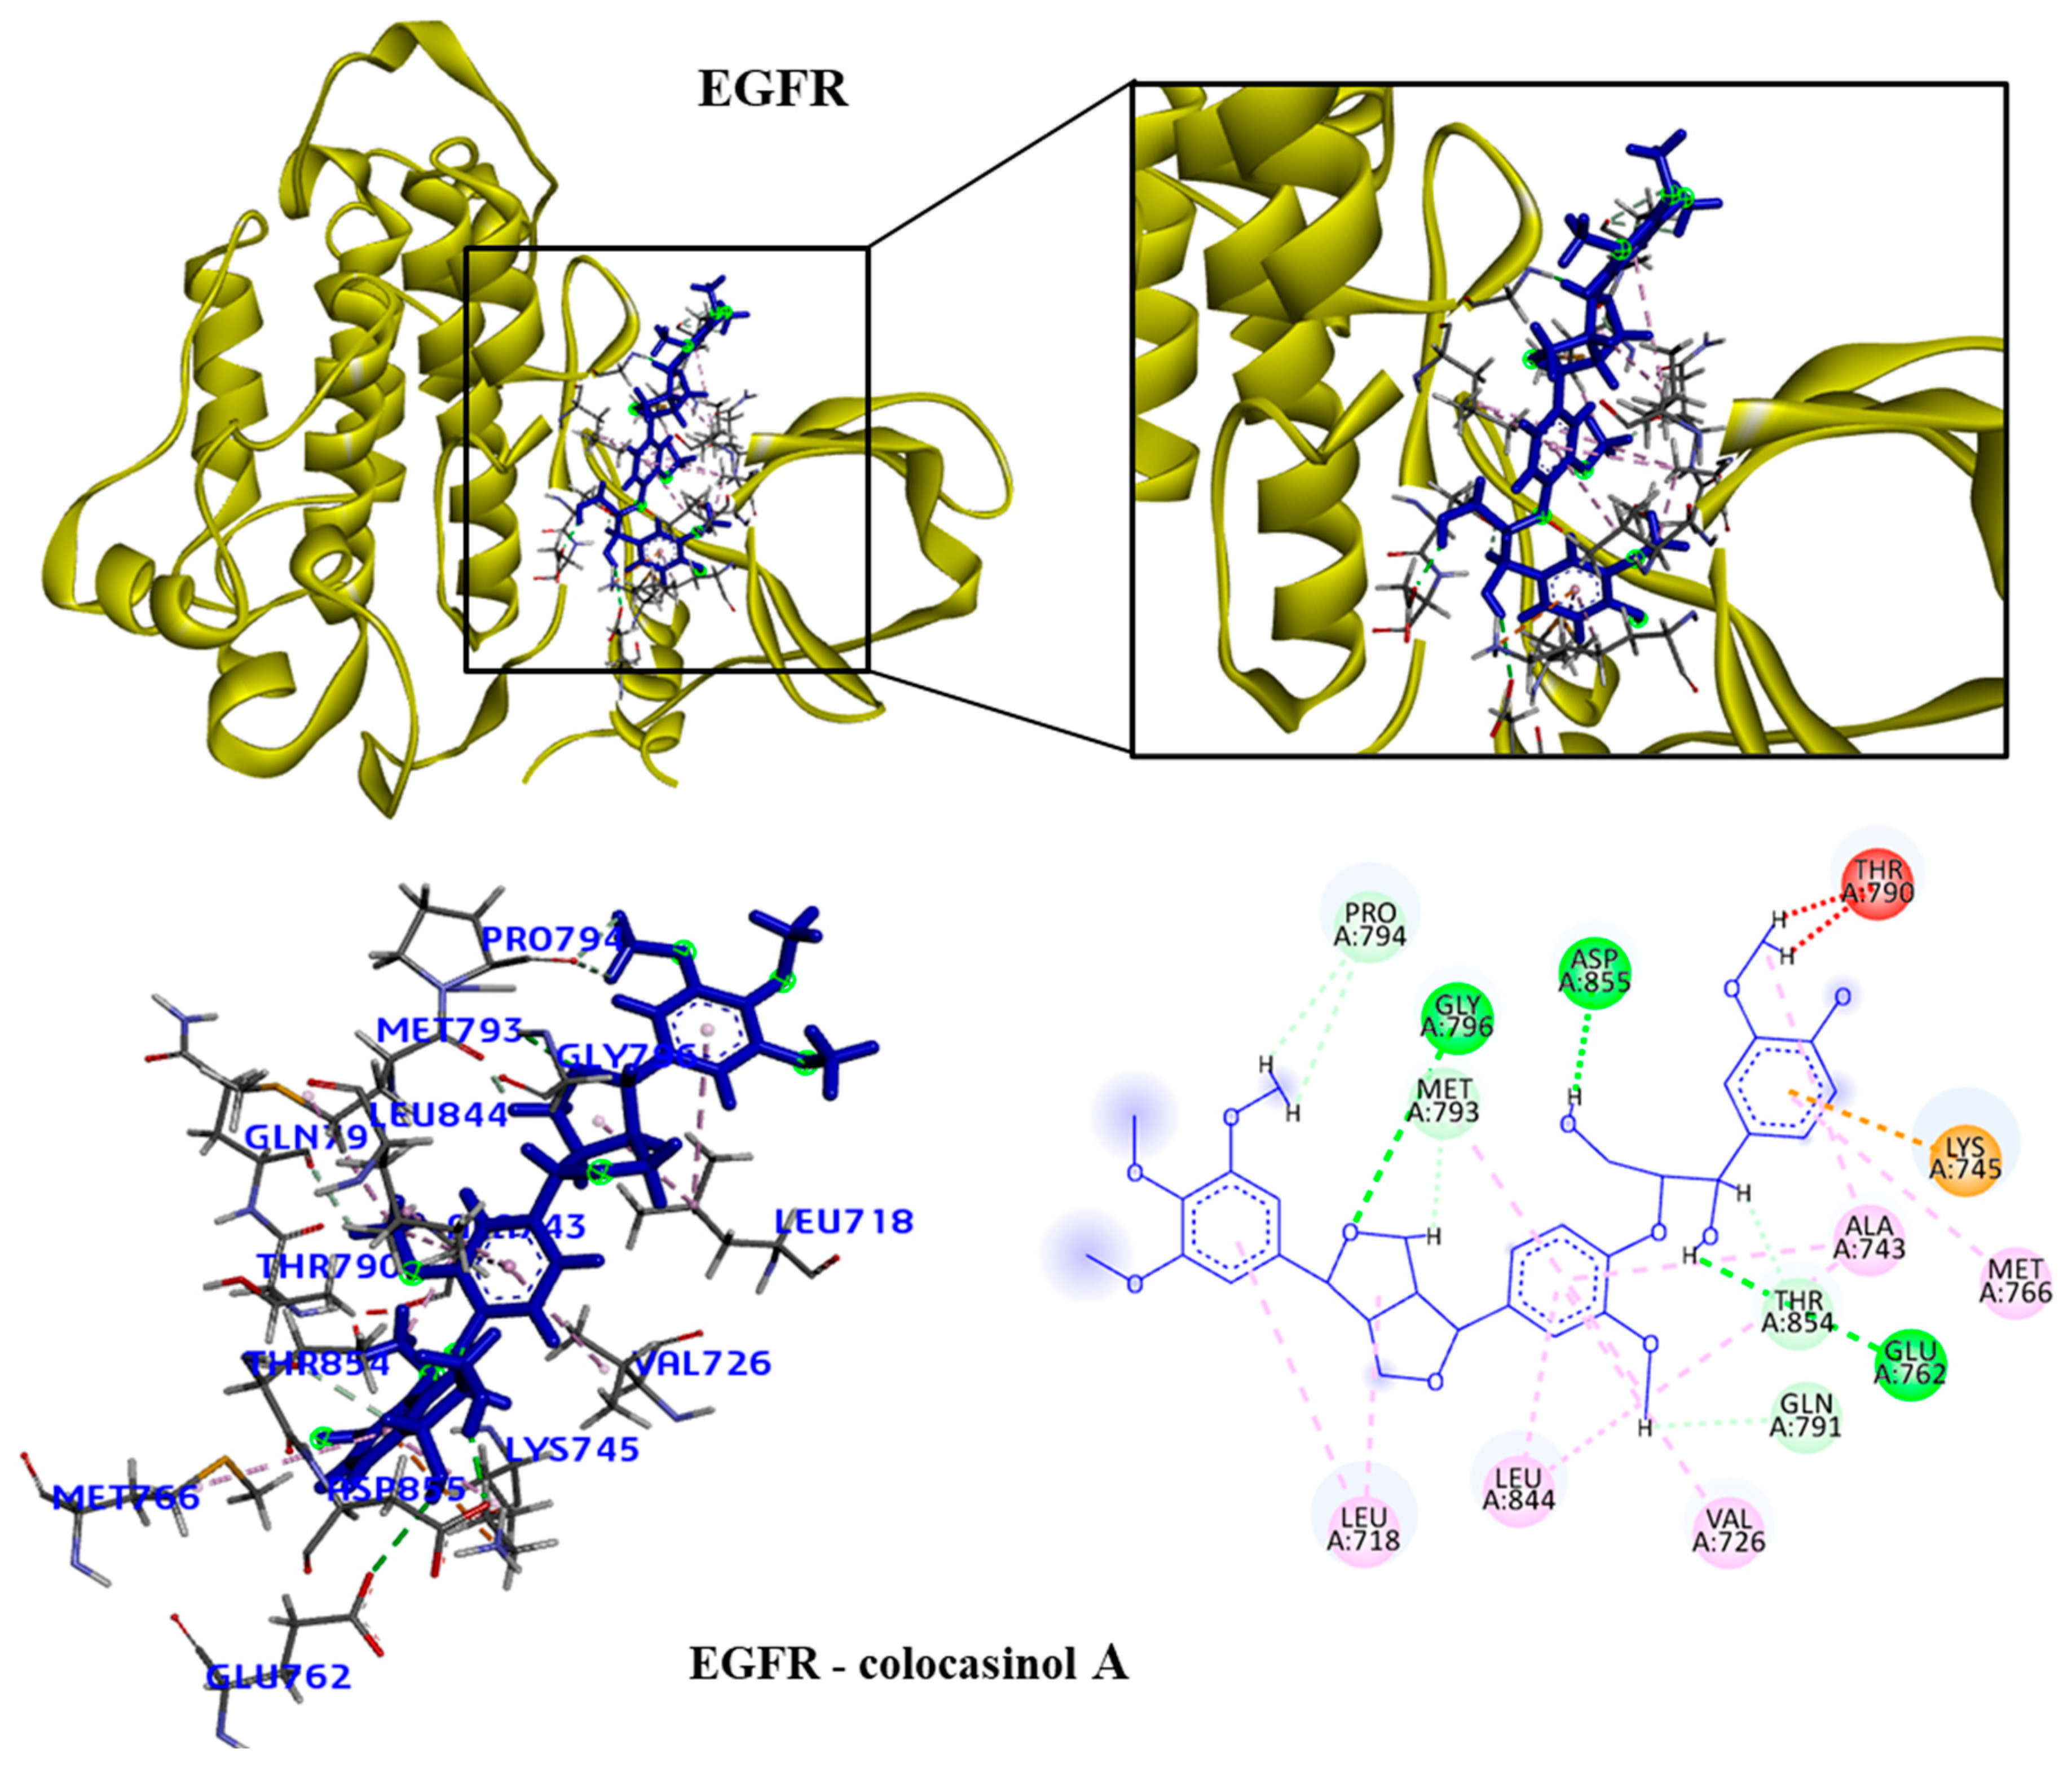
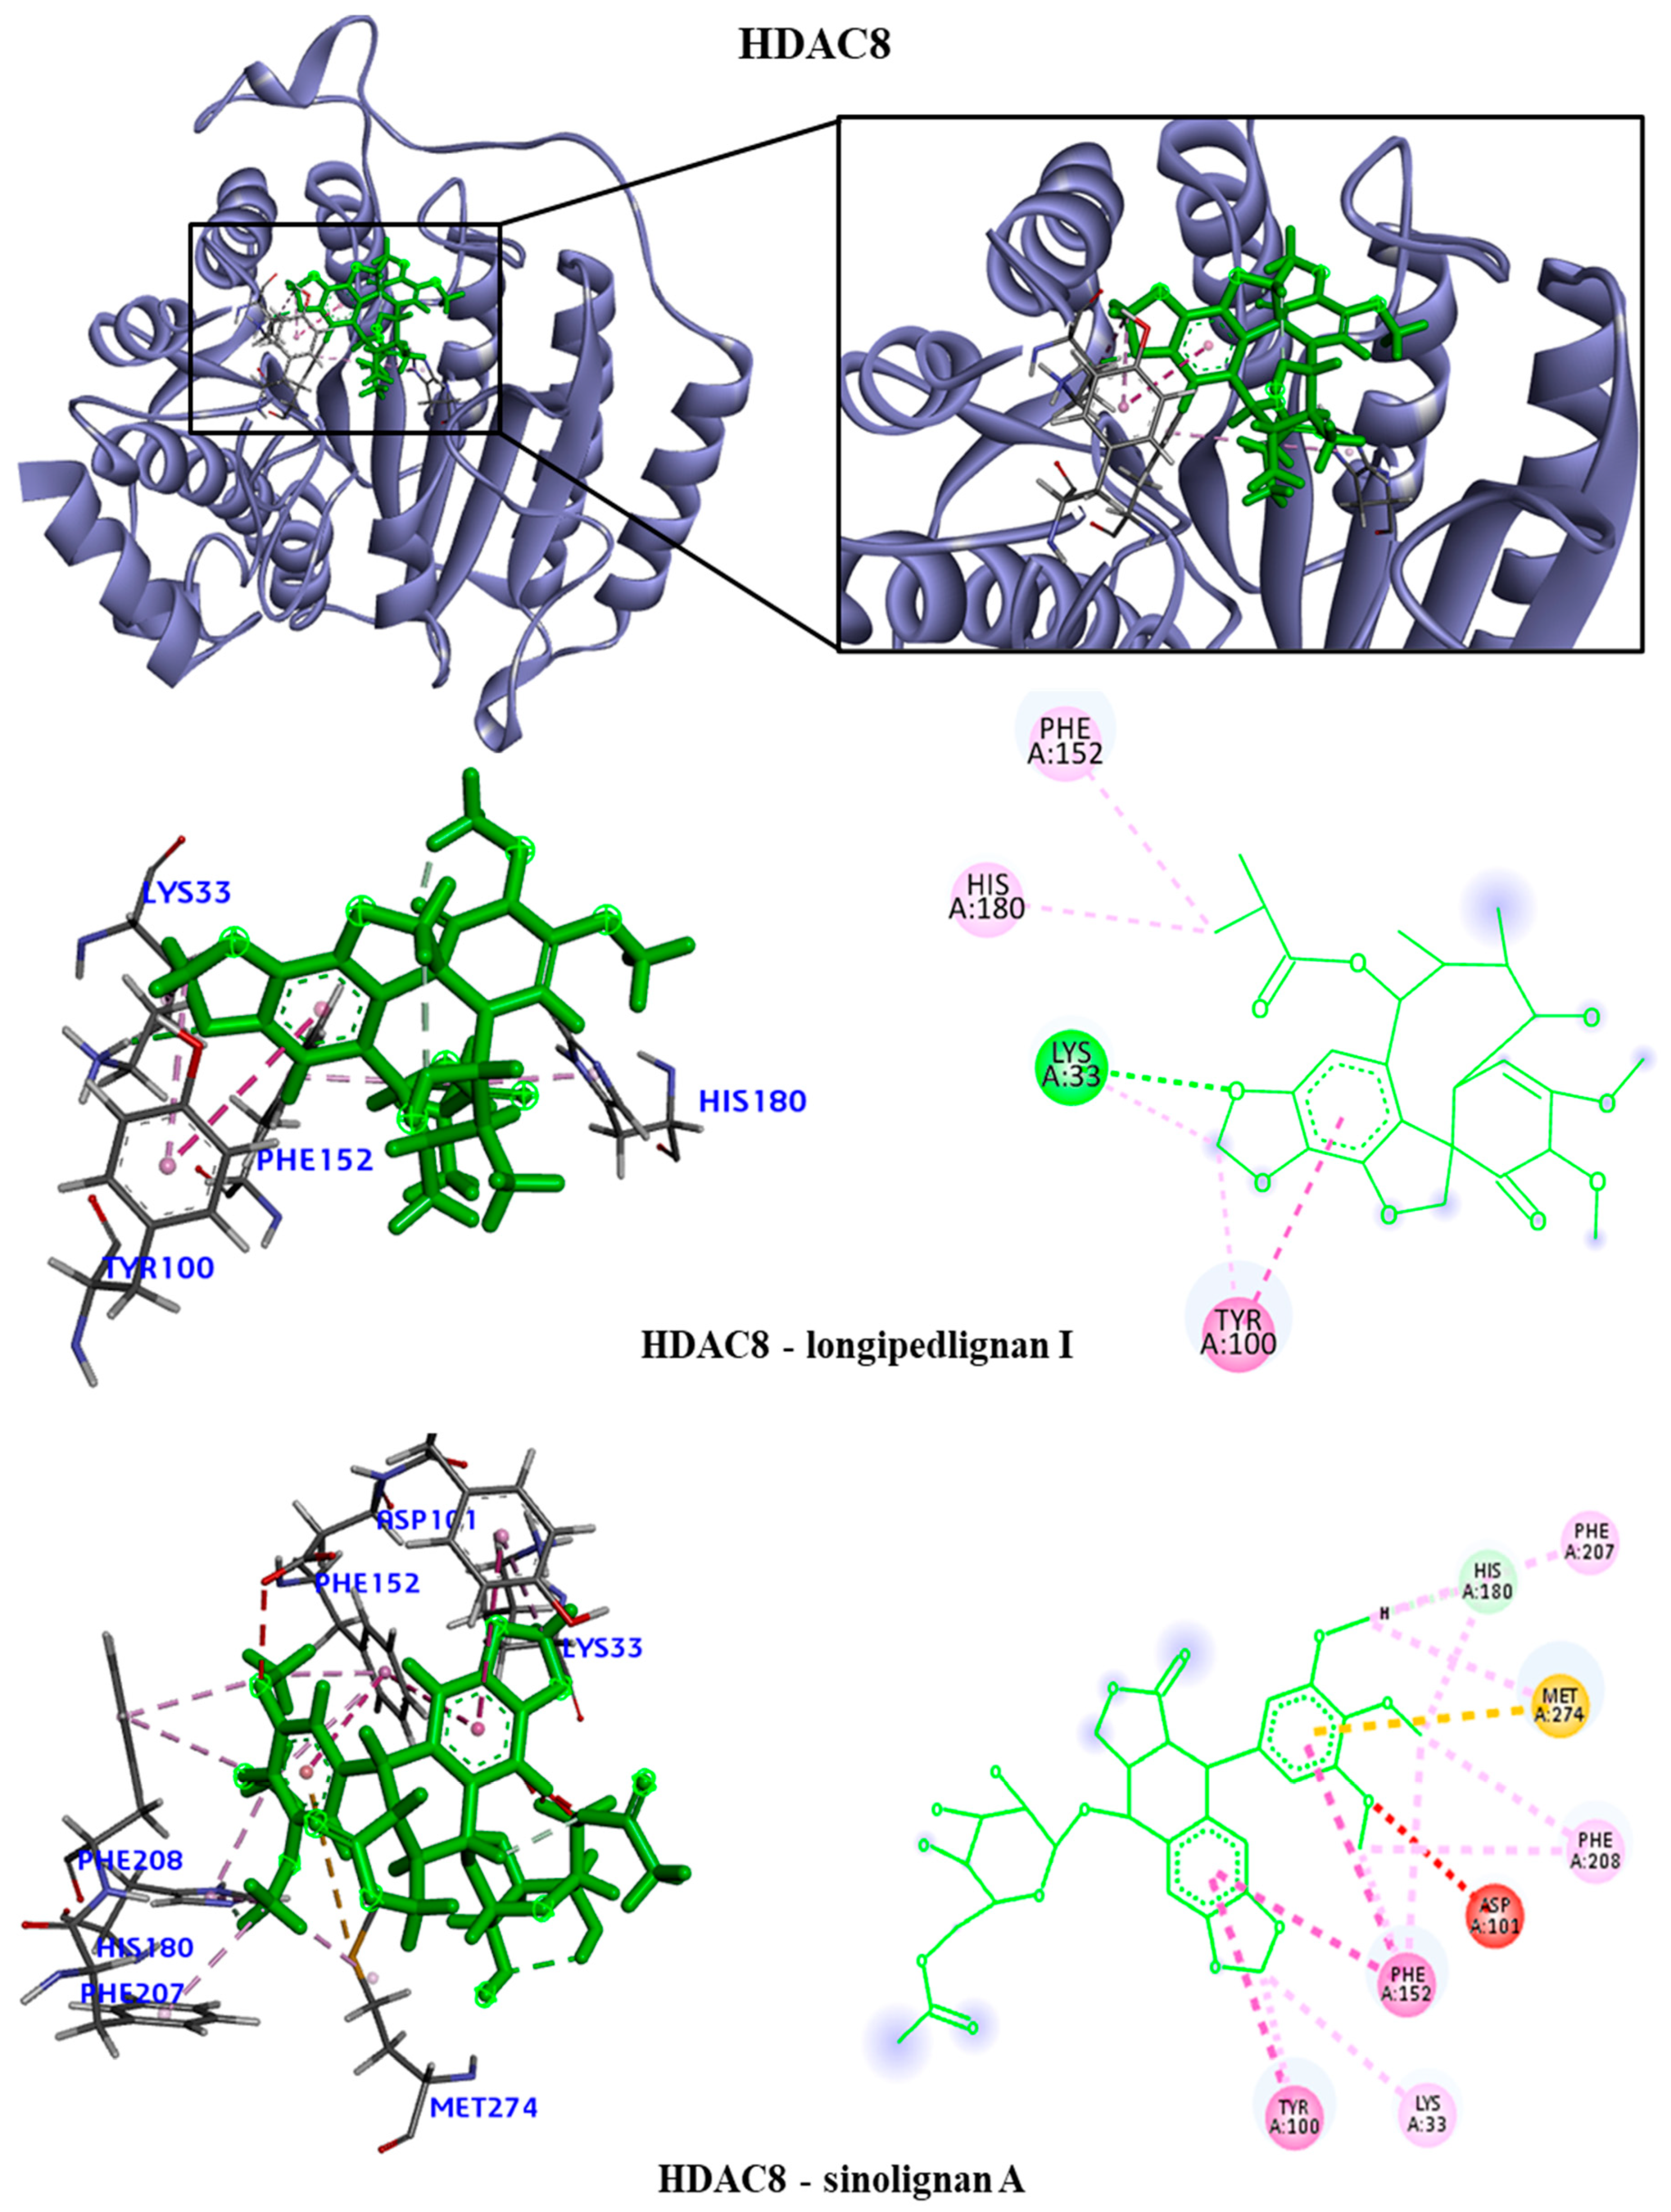
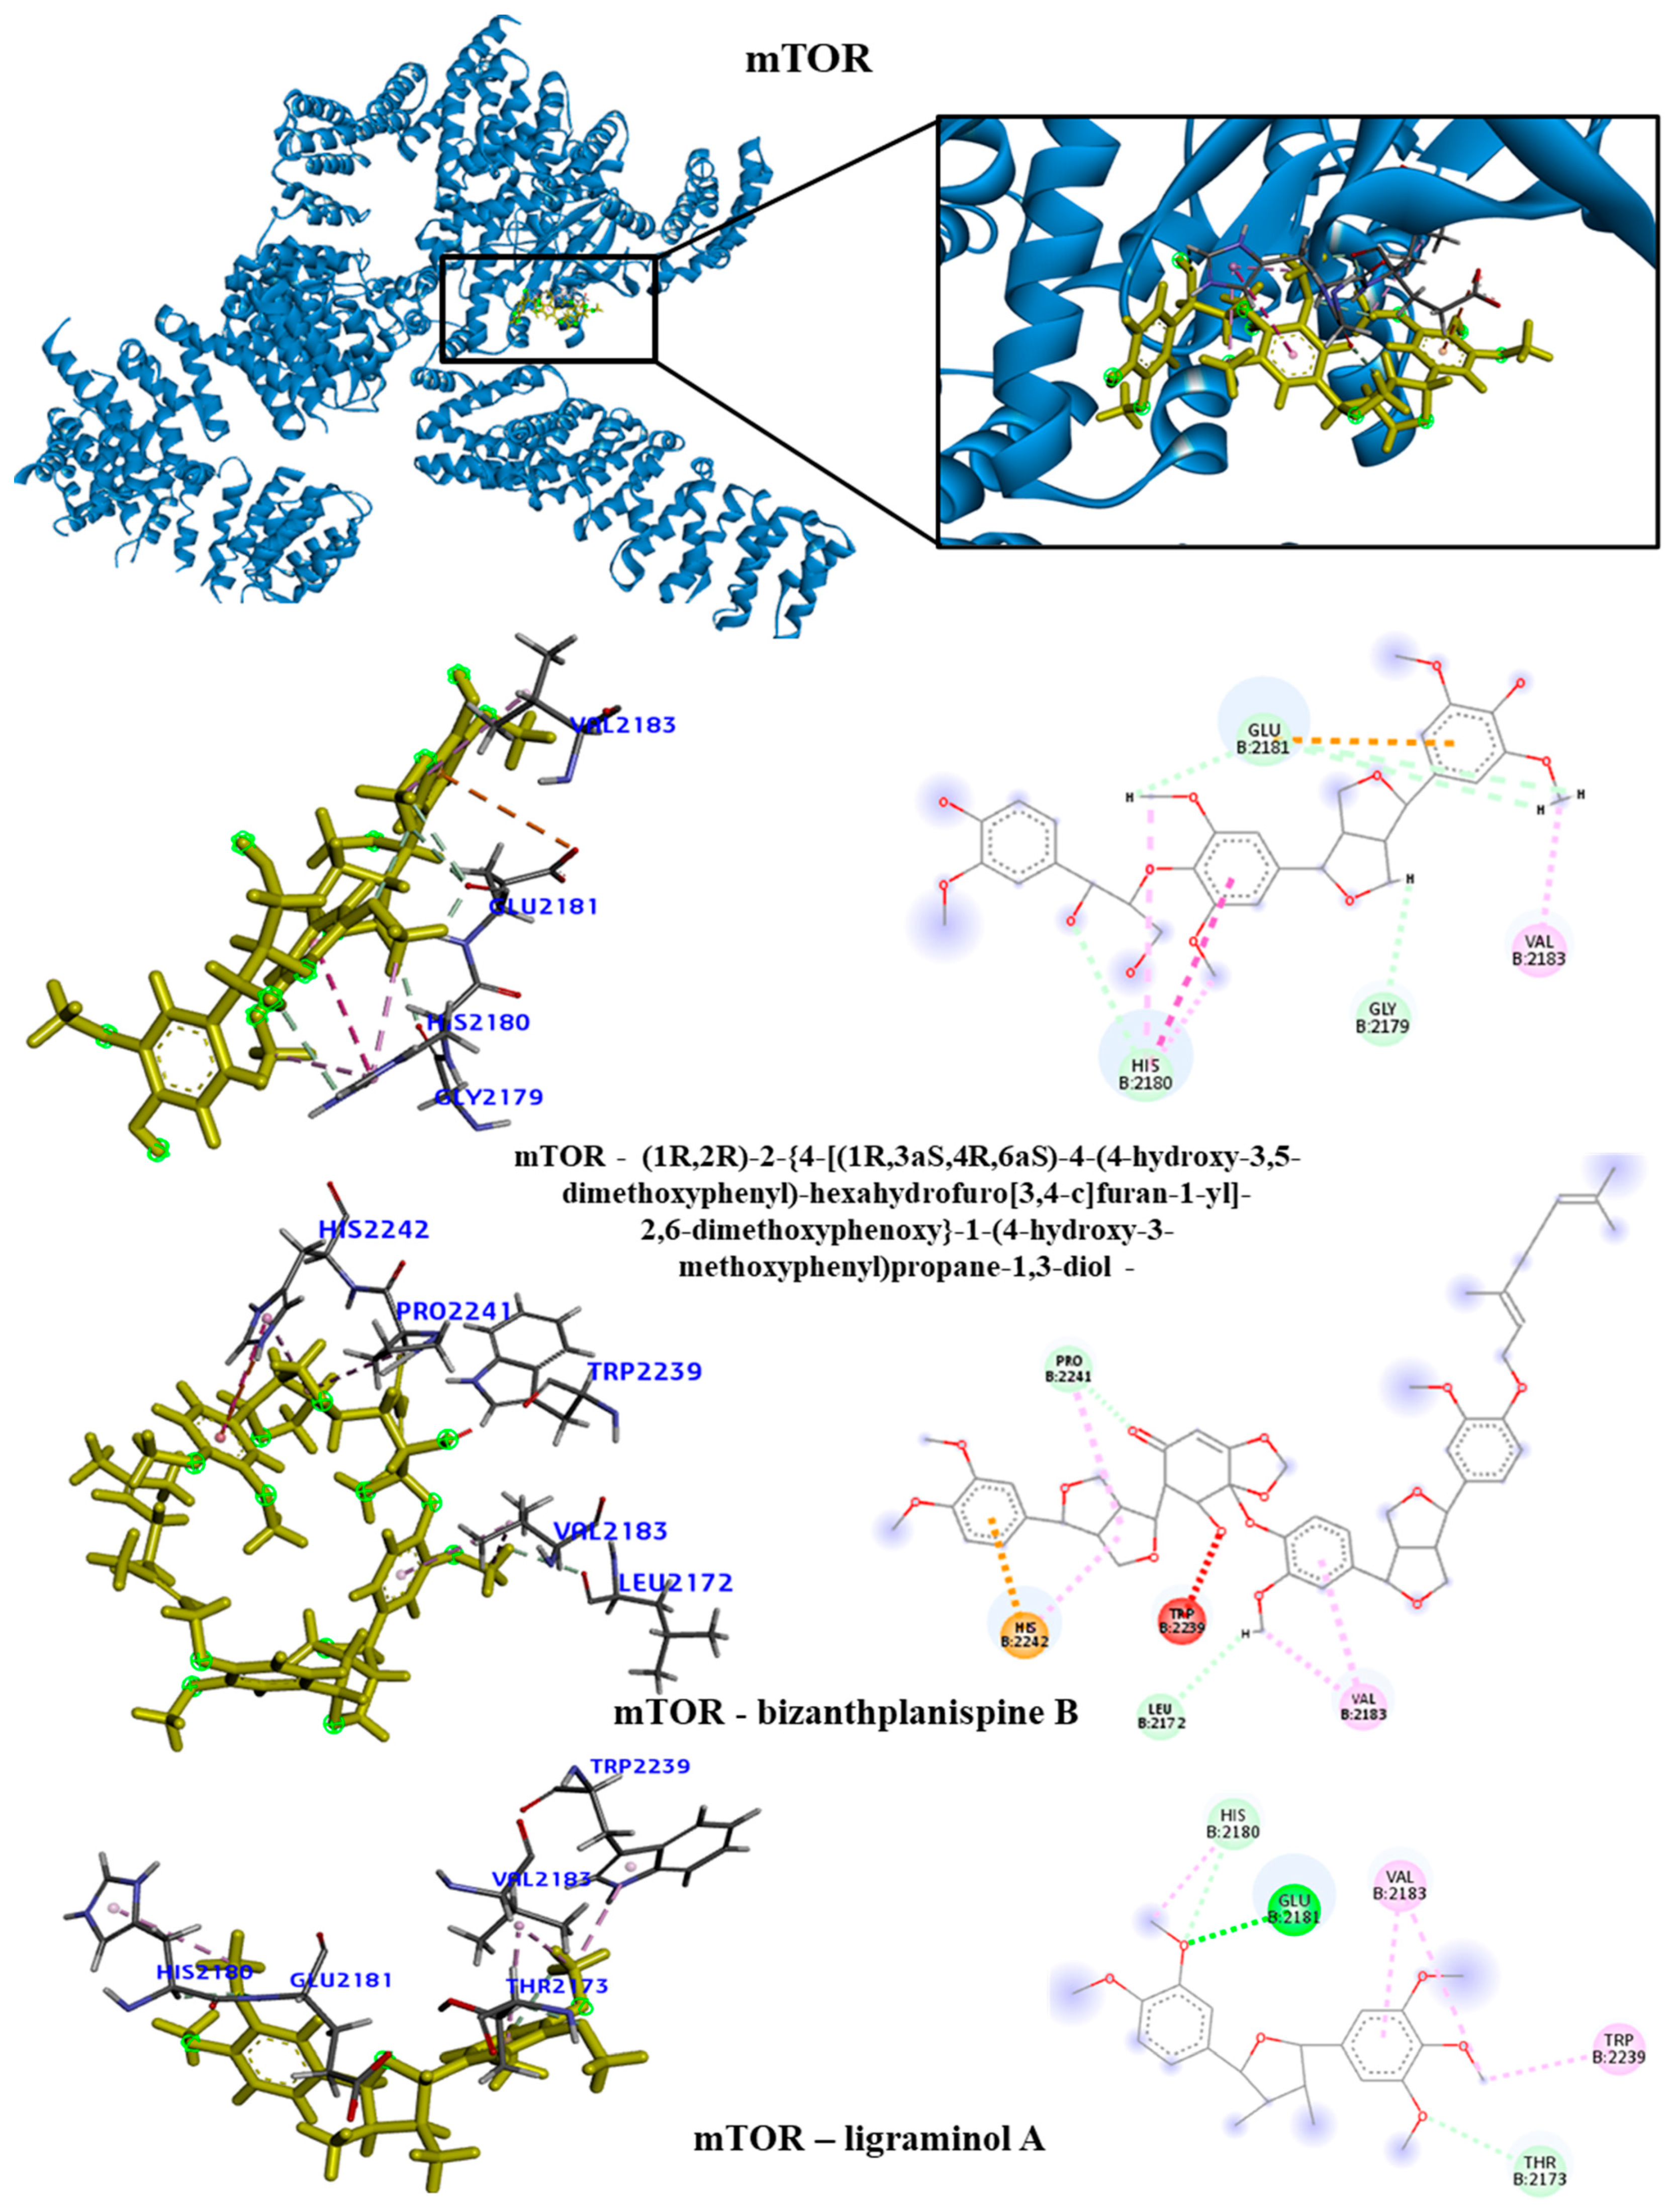
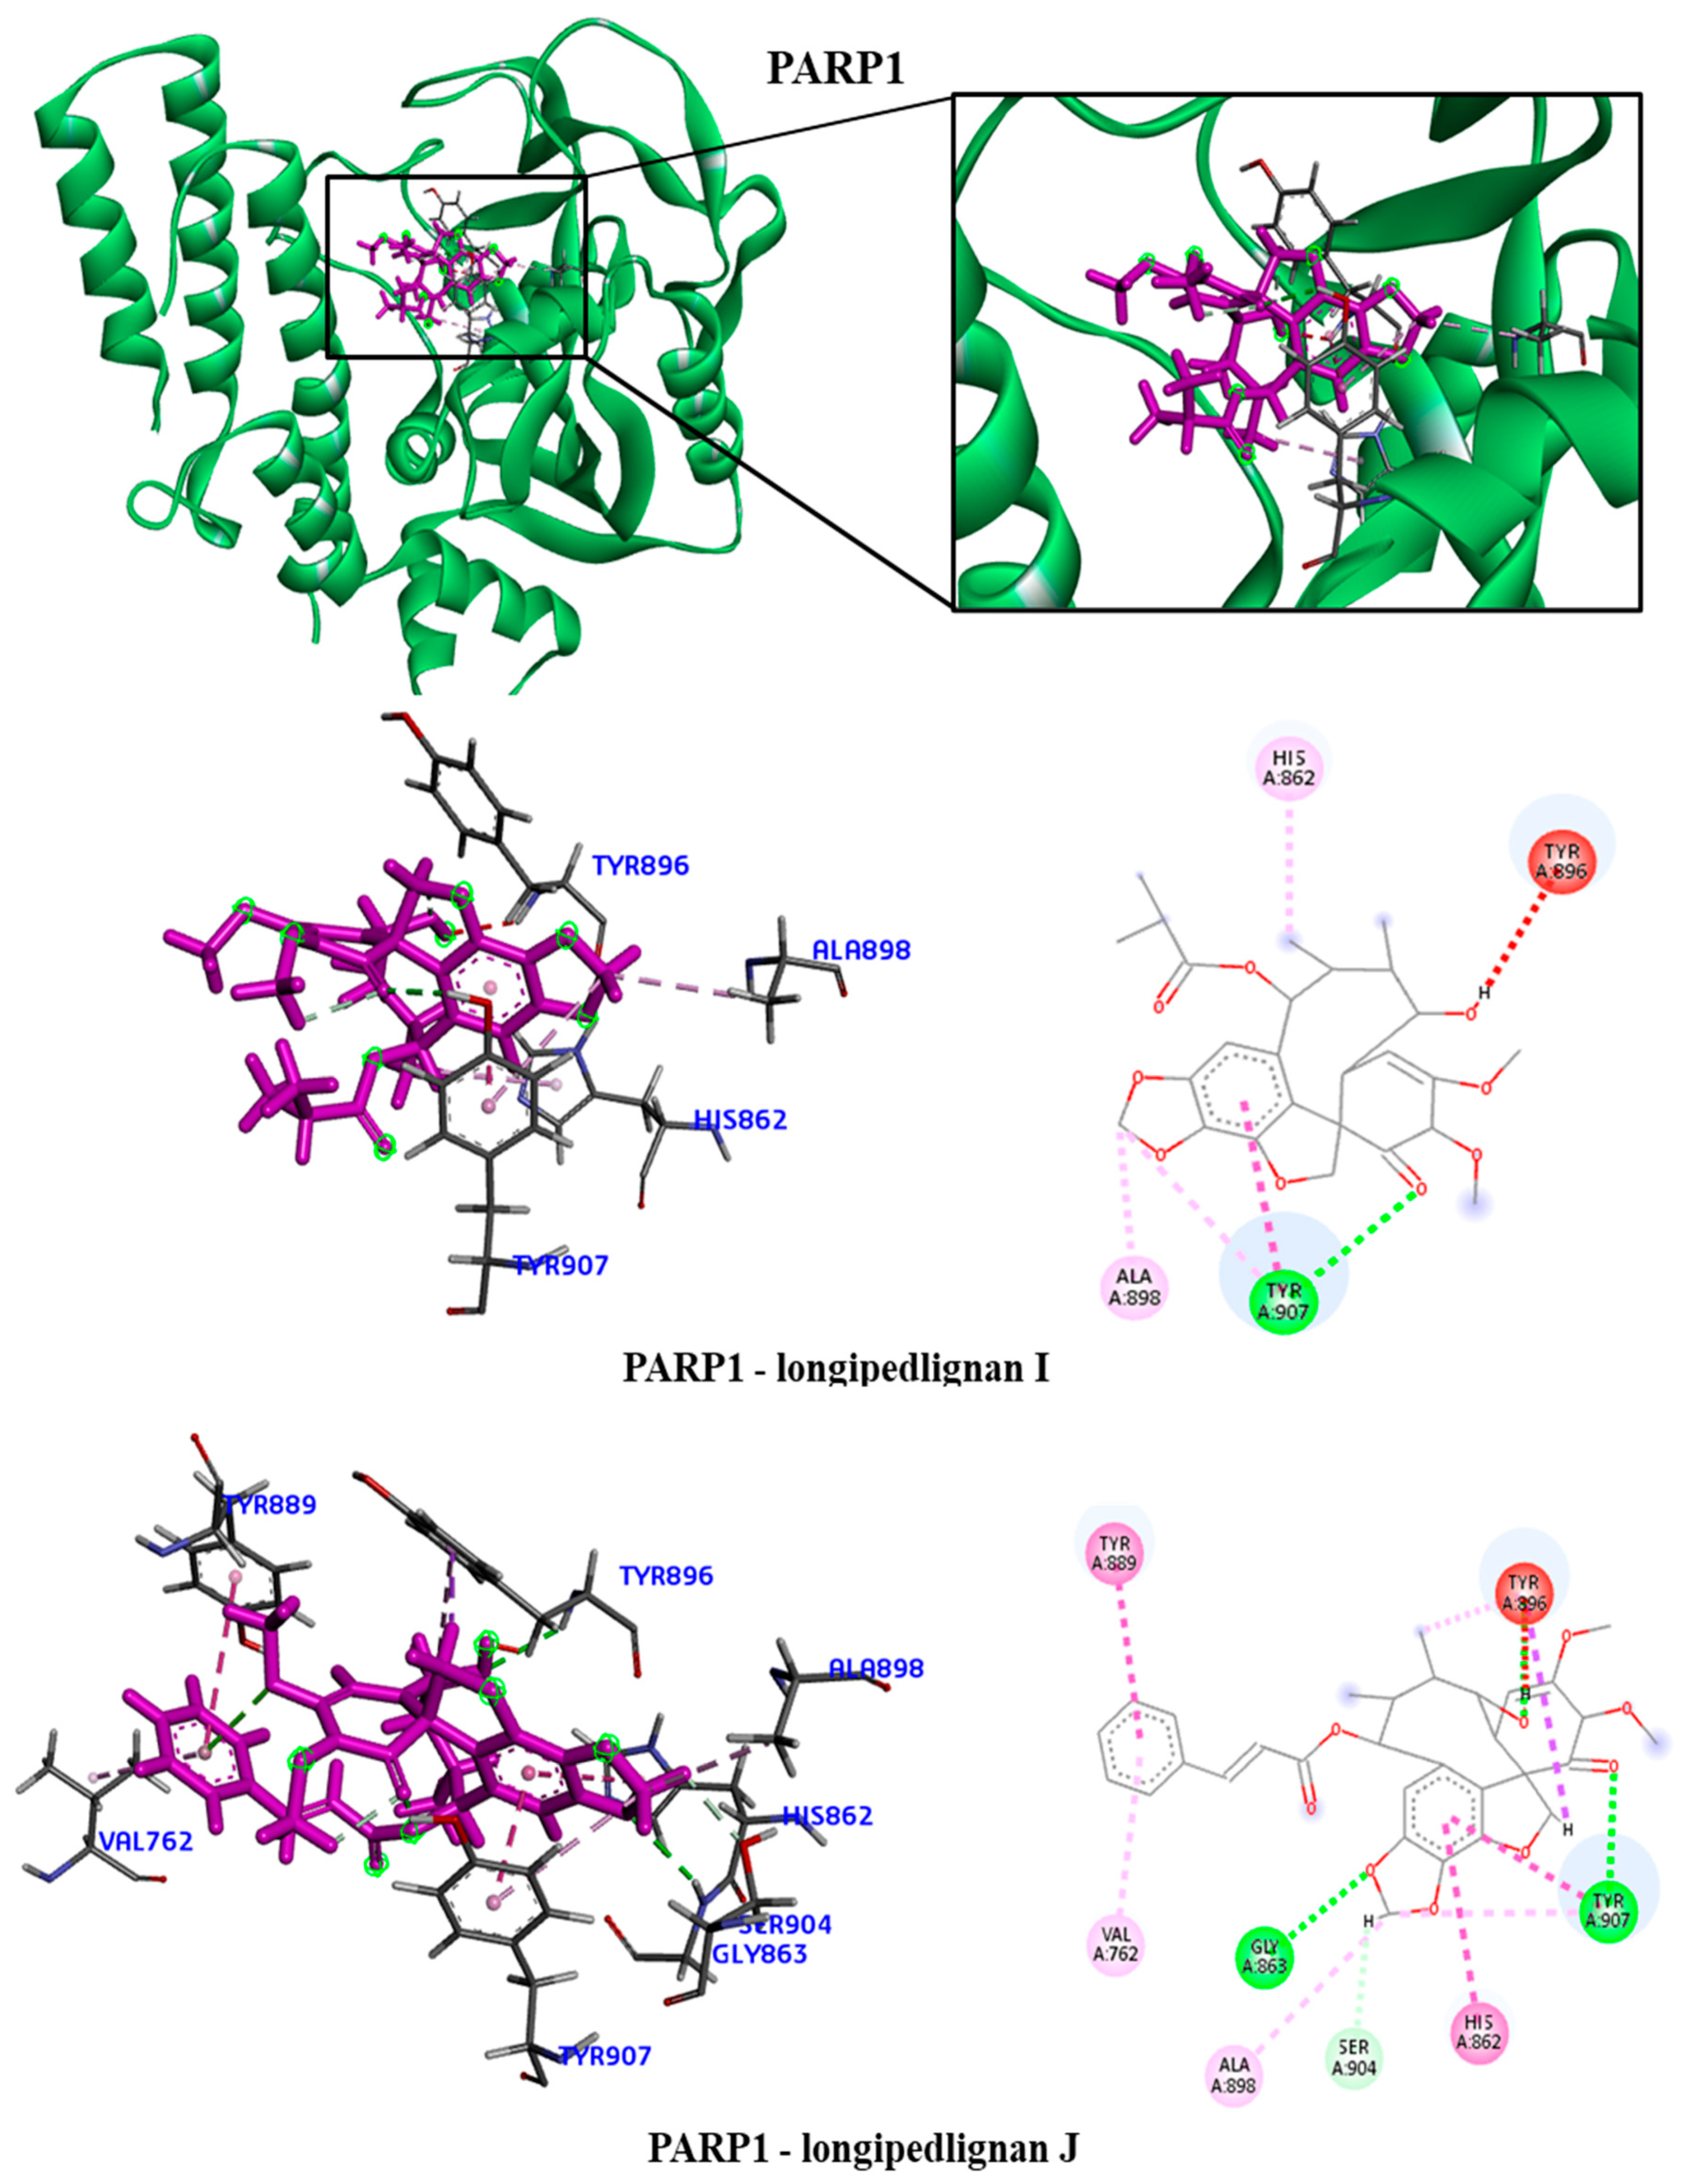
We took the opportunity to analyze the observed interactions between the selected lignans and the proteins with the ancestral allele (
Figure 4,
Figure 5,
Figure 6 and
Figure 7). We observed that the EGFR receptor formed several hydrogen bonds stabilizing the bonds with the amino acids Glu762, Glu796 and Asp855, in addition to several hydrophobic interactions, including Leu718, Val726, Ala743, Met766 and Leu844. For the HDAC8 protein, there was no interaction with the longipedlignan H lignan. But interactions with the other lignans were observed and we identified four common links/interactions between these compounds and the active site. Interactions were observed with residues Lys33, Tyr100, Phe152 and His180. For the mTOR protein, three common interactions between lignans and the active site were observed.
The hydrophobic interactions formed were with residues His2180, Glu2181 and Val2183. For the PARP1 protein, the lignan longipedlignan H also did not interact with the active site. But we analyzed the interactions with lignans longipedlignan I and longipedlignan J and observed inter-actions between them and the active site, forming interac-tions with the amino acids His862, Tyr896, Ala898 and Tyr907.
2.4. Prediction of absorption, distribution, metabolism, excretion and toxicity (ADMET) properties
Many drugs used to treat cancer are toxic and have a variety of side effects. Therefore, in this study we sought to verify the ADMET properties of lignans, with emphasis on toxicity. The pharmacokinetic mechanisms that involve the steps of absorption, distribution, metabolism, excretion and toxicity (ADMET) when failures are found are considered the main causes of failure in the development of drugs derived from natural or synthetic products. Therefore, virtual plat-forms such as pkCSM can be used to identify these possible problems through an in silico approach involving predictive models [
26]. Thus, for the lignans studied, ADMET analyzes were carried out whose parameters can be observed in the tables below (
Table 5). The lignans colocasinol A, longipedlignan H, longipedlignan I, longipedlignan J, sinolignan A, (1R,2R)-2-{4-[(1R,3aS,4R,6aS)-4-(4-hydroxy-3,5-dimethoxyphenyl)-hexahydrofuro[3,4-c]furan-1-yl]-2,6-dimethoxyphenoxy, bizanthplanispine B and ligraminol were renamed in these analyzes as L1, L2, L3, L4, L5 and L6, respectively.
To determine the absorption parameters, virtual models were used to evaluate this behavior against Caco-2 cellular models, intestinal absorption and skin permeability. Caco-2 cell lines are com-posed of human epithelial colorectal adenocarcinoma cells widely used to predict oral drug absorption. In this predictive model, values above 0.90 consider that the compounds have high permeation in these cells. Therefore, the lignans (L1, L2, L3 and L8) present satisfactory values. Regarding the complementary result of intestinal absorption, the main site of drug absorption, all lignans showed ade-quate values, ranging from 89 – 100% absorption. Finally, regarding permeation, all lignans showed (log Kp > -2.5) values, suggesting low potential for transdermal administration [
27].
With regard to possible interactions with P-glycoproteins – an important efflux pump that can compromise the bioavailability of xenobiotics, it can be seen that lignans (L4, L5 and L6) are potential substrates. The modulation of P-glycoprotein-mediated transport has significant pharmacokinetic implications for the PgP substrate, which can be exploited for therapeutic advantages or result in contraindications, in case there are interactions between drugs used concurrently with lignans [
28].
Among the distribution parameters, it was possible to evaluate the theoretical volume of distribution (VDss) – total dose of the drug distributed in a way that guarantees the same plasma concentration, permeability in the blood-brain
barrier and permeation in the CNS. In view of this, the results obtained suggest that lignans (L3, L4 and L7) have a high volume of distribution, whose values (logL/kg > 0.45), however, with regard to bioavailability in the CNS, all compounds have a low permeation potential in the brain (logBB <-1 and logPS < -3). Therefore, these results demonstrate that lignans have low pharmacological potential against neurological disorders and little influence on neurotoxic processes [
29]. The in silico tool also made it possible to identify whether the structures are substrates or inhibitors of the mitochondrial enzymatic metabolism system – CYP450. This system constitutes an important family of monooxygenase capable of biotransforming 90% of xenobiotics. Among the main ones involved in the metabolic process, CYPA4, CYPB6, CYP3C19, CYP2D6 stand out [
30]. In the table, it was possible to identify which isoforms are substrates and/or inhibitors of the lignans used in the study, emphasizing the importance of possible pharmacokinetic interactions of possible drugs that may act as enzyme inducers or inhibitors. Finally, with regard to excretion, the behavior of lignans vis-à-vis organic cation transporters 2 was also predicted – an important renal uptake protein in the clearance process, being a point subject to pharmacokinetic interactions between drugs. As observed, lignans are not substrates for the transporter, in addition to presenting satisfactory renal clearance - proportionality constant (clot by the combination of hepatic and renal clearance, which demonstrates good elimination capacity [
31].
The preclinical safety profile is one of the main concerns in the development of new drugs that should present preserved efficacy and good topical and systemic tolerability. In the assessment of toxicity through virtual approaches, the toxicological profile of lignans was evaluated against the mutagenic potential in bacteria (AMES), potassium channels encoded by hERG, hepatotoxicity and skin sensitization. Based on the results obtained, it was seen that lignans do not present toxicity according to the AME model, do not inhibit hERG I channels and do not promote skin sensitization. However, L5, L6 and L7 can inhibit hERG II. This condition may be related to echocardiographic changes called acquired long QT syndrome, which promotes ventricular arrhythmias27. Therefore, it is important to point out that the pharmacokinetic determination may substantially contribute to the preclinical research of these derivatives, early recognizing possible ADMET failures.
3. Discussion
We found no structural correlation between subclasses of lignans and anticancer activity in the literature. This is the first work that correlates the structure of lignan subclasses with anticancer activity. Among the ten subclasses of lignans, three were considered the most promising for anticancer activity: furofurans, dibenzocycooctadiens and aryltrtalins.
Furofuran lignans contain the backbone of 2,6-diaryl-3,7-dioxabicyclo[3.3.0]octane and represent one of the major subclasses of the lignan family. The furofuran lignans have a wide variety of structures due to different substituents on the aryl groups and diverse configurations on the furofuran ring. Among the main activities reported are antioxidant, anti-inflammatory, cytotoxic and antimicrobial activities [
32]. Our study contributes to further explore furofuran lignans as anticancer agents.
An example is a study by Cheng et al (2022) [
33]; who isolated five new furofuran lignans, brasesquilignan A-E (1-5), from
Selaginella braunii Baker. All of these compounds were evaluated for antiproliferative activities against various human cancer cells in vitro, but showed weak inhibition. Vitória et al (2018) [
34], isolated two new tetrahydrofuran lignans, taungtangyiols A and B, and eight known furofuran lignans from
Premna integrifolia wood. Taungtangyiols A and B were observed to inhibit melanin deposition in B16F10 mouse melanoma cells, with IC
50 values of 50.7 and 40.9 μM, respectively, without notable cytotoxicity.
Another study isolated seven dibenzocyclooctadiene lignans from the fruits of
Schisandra chinensis. Cell viability assays verified the cytotoxicity of isolated dibenzocyclooctadiene lignans against AGS, HeLa and HT-29 human cancer cell [
35].
Podophyllotoxin (PTOX, 1) is an aryltetralin-type lignan, first discovered in the plant
Podophyllum peltatum. Due to its potent anticancer activities, it has been used in biosynthesis and total synthesis as prospective alternatives [
36,
37]. Another lignan structurally and closely related to podophyllotoxin is deoxypodophyllotoxin. This aryltetralin is a potent antitumor and anti-inflammatory agent and is especially used as a precursor for the semi-synthesis of the cytostatic drugs etoposide phosphate and teniposide. These analogues are also used in cancer therapy [
38]. Another study by Zilla et al [
39] extracted six aryltetralin-type lignans from the root of
Podophyllum hexandrum as a potential source of bioactive lead metabolites with anticancer activity. Aryltetralins are designated as 4'-demethyl-deoxypodophyllotoxin, podophyllotoxin, 4'-demethyl-podophyllotoxin, podophyllotoxin-4-O-β-d-glucopyranoside, 4'-demethyl-deoxypodophyllotoxin-4-O-β-d-glycopyranoside, and 4'-demethyl-podophyllotoxin-4-O-β-d-glucopyranoside. All aryltetralins exhibited remarkable cytotoxic potential in several cancer cell lines. The latter was observed to increase apoptotic cascades in MCF-7 breast cancer cells, ie nuclear condensation, membrane blebbing, probably by destabilizing the microtubular protein tubulin. Additionally, it binds and modulates checkpoint kinase-2, a key cell cycle regulatory protein in normal and cancer cells.
Correlation studies between the chemical structure and anticancer activities are important to reduce costs in identifying new drugs and to develop more potent drugs. An example of this is the study carried out by Scotti et al [
40], who tabulated the most important examples of determined virtual screening for anticancer flavonoids and highlighted the structural determinants. Like lignans, flavanoids have a structural variety and different described biological activities. This research group's study identified the mode of action, the most potent anticancer flavonoids, and tips for the structural design of anticancer flavonoids in a review.
4. Materials and Methods
4.1. Data collection and curation
This study selected and investigated five proteins involved in cancer pathogenesis with available biological activity. Compounds with known biological activity for ABL, EGFR, HDAC, mTOR and PARP were obtained (
https://www.ebi.ac.uk/chembl/) [
41,
42]. Details of the pools can be found in Table 6. Compounds were ranked based on pIC50 [-log IC50 (mol/l)]. The IC50 value represents the concentration required for 50% inhibition. The compounds and these data were used to build predictive models with biological activity for the indicated proteins. In addition, 495 subclassed lignans were evaluated by ligand-based virtual screening to identify molecules with potential activity against the selected proteins. The subclasses of lignans are formed by: (35) Dibenzylbutanes, (12) 3,4-Dibenzyltetrafurans, (30) Dibenzylbutyrolactones, (147) Dibenzocyclooctadienes, (72) Aryltetralins, (17) Arylhydronaphthalene, (25) Arylnaphthalenes, (66) Furofuran, (37) 2,5-diarlytetrahydrofuran and (54) 2-aryl-4-benzyltetrahydrofuran. The three-dimensional structures were generated by Chemaxon Standardiser v.18.17.0, (
www.chemaxon.org).
4.2. Modelagem QSAR
Compounds with known biological activity towards the proteins ABL, EGFR, HDAC, mTOR e PARP were saved in special data file format (SDF) and imported into Dragon 7.0 software [
43,
44,
45], to generate descriptors. For each protein bank, a predictive model was built. The descriptors referring to each bank and biological activity information were imported into the Knime 3.5.3 software (KNIME 3.5.3, Konstanz Information Miner Copyright, 2018,
www.knime.org) to generate the predictive models. In the software, the data were divided in a “Partitioning” tool, using the “Stratified sample” option, which separated the data into Training and Test sets, which represented 80% and 20% of all compounds, respectively. The sets were randomly selected, but the proportions of active and inactive substances were maintained in both databases. We use the Random Forest (RF) algorithm to build predictive models. Cross-validation was performed to estimate the predictive power of the developed models.
The external performances of the selected models were analyzed for sensitivity, specificity and accuracy. In addition, receiver operating character (ROC) curve sensitivity and specificity were used because they describe actual performance more clearly than accuracy. The Matthews correlation coefficient (MCC) was used to evaluate the model globally, based on the results obtained in the confusion matrix [
46]. The applicability domain (APD) was used to analyze the compounds in the test sets, if the predictions are reliable [
47,
48]. The lignans considered active against the selected proteins were submitted to the other methodologies.
4.3. Mapping SNPs
Identifying single nucleotide polymorphisms (SNPs) in important regions of proteins involved in the progression of different types of tumors can help rational drug design. In addition, it contributes to the development of new therapies based on the genetic profile. Genetic variations in target proteins were identified by searching two databases. The National Center for Biotechnology Information (
https://www.ncbi.nlm.nih.gov/) and Ensembl (
https://www.ensembl.org/index.html) databases [
49] were consulted to obtain essential information about genes, phenotype and SNPs in the investigated proteins. SNPs with varied allele frequencies in catalytic domain and active site regions were considered in the study. Mutations with the polymorphic variants were designed using the UCSF Chimera program (Visualization and Informatics – RBVI, San Francisco, USA) [
50].
4.4. Docking molecular
Molecular docking was performed using Molegro Virtual Docker v6.0.1 (MVD) software (Molexus IVS Rørth Ellevej 3, Odder, Denmark) [
51] on the five targets selected for anchoring studies (Table 7). The MolDock score algorithm was used as a scoring function to predict the best interactions between ligand and receptor. The 3D structures of the proteins used in this study were obtained from the Protein Data Bank (PDB) [
52,
53] (Table 7). Initially, all water molecules were removed from the crystalline structure and the root mean square deviation (RMSD) was calculated from the poses to indicate the degree of reliability of the fit. RMSD values less than 2.0 Å were considered successful.
4.5. Prediction of ADMET properties
ADMET parameters were calculated using the open access web tool SwissADME (
http://www.swissadme.ch) [
54] and ADMET profiles of lignans investigated using the pkCSM web platform (
https://biosig.lab.uq.edu.au/pkcsm/) [
27], which offers a set of rapid predictive models for the evaluation of physicochemical, pharmacokinetic, pharmacological and toxicity properties.
5. Conclusions
Due to the structural diversity of lignans and the various pharmacological properties, it is not easy to correlate anticancer activity with particular subclass. Therefore, the present used a set of lignans distributed in the ten known subclasses and submitted to in silico methodologies to verify the anticancer potential of these compounds. Five predictive models were built against important targets in cancer development. The RF model was able to select a lignan potentially active against the EFGR receptor, 86 lignans considered against HDAC, 155 lignans active against the mTOR protein and 156 lignans active against the PARP protein. Overall, the predictions of biological activities showed inhibition values ranging from 50-63%. No compound was active against the ABL protein. The results also showed that the subclasses with the most active compounds were dibenzocyclooctadiene, furofuran and aryltetralin for all proteins. These subclasses are interesting for anticancer activity. The other subclasses are correlated with other pharmacological properties known for lignans, such as anti-inflammatory, antioxidant and trypanocidal activity. The lignans considered most active for each protein (colocasinol A for EGFR; longipedlignan H, longipedlignan I and sinolignan A for HDAC8; (1R,2R)-2-{4-[(1R,3aS,4R,6aS)-4-(4-hydroxy-3,5-dimethoxyphenyl)-hexahydrofuro[3,4-c]furan-1-yl]-2,6-dimethoxyphenoxy, bizanthplanispine B and ligraminol A for mTOR and longipedlignan H, longipedlignan I and longipedlignan J for PARP1 were subjected to molecular docking.
Genomic analysis selected four clinically relevant SNPs for the EGFR receptor, 11 for the HDAC8 protein, 11 for mTOR1 and two for PARP1. The projected mutations and molecular docking results showed differences in binding energy values between proteins and between selected lignans. mTOR presented the most discrepant energy values. We suggest with these results that mutations in the catalytic domain of target proteins can generate strong or low inhibition depending on the type of variant present in the individual.
Author Contributions
Conceptualization, L.S ; methodology, M.d.S.M., A.S.S., N.I.P.O., A.N., P.R.S., and G.C.S.R.; software, L. S., M.T.S., A.N. and M.d.S.M.; validation, M.d.S.M., A.P.AD.G., A.N. and C.F.B.F.; formal analysis, M.d.S.M. and G.C.S.R.; investigation, M.d.S.M. and A.PA.D.G.; resources, L.S. and F.J.B.M.-J.; data curation, M.d.S.M.; writing—Original draft preparation, M.d.S.M., P.R.F., and G.C.S.R..; writing—Review and editing, M.d.S.M., M.T.S., L.S.; F.J.B.M.-J., A.N., and K.A.d.F.R.; visualization, M.d.S.M.; supervision, L.S. and M.T.S.; project administration, M.d.S.M.; funding acquisition, L.S., F.J.B.M.-J. and A.P.A.D.G.
Funding
This research was funded by Conselho Nacional de Desenvolvimento Científico e Tecnológico (CNPq) from Brazil, grant number #306798/2020-4. Additionally, this study received financial support from the Coordination of Improvement of Higher Education Personnel—Brazil (CAPES)—Financing Code 001; FAPESQ, funding No. 04/2022—Apoio ao Desenvolvimento Científico e Tecnológico do Estado da Paraíba—grant number #3783/2022-0, Paraíba State Research Foundation (FAPESQ), and Paraíba State Research Foundation (FAPESQ; BLD-PDRP PB).
Acknowledgments
Coordination of Improvement of Higher Education Personnel—Brazil (CAPES)—Financing Code 001
Conflicts of Interest
The authors declare no conflict of interest.
References
- Hulvat, MC. Cancer Incidence and Trends. Surgical Clinics of North America. 2020;100(3), pp469-481.
- Vasan, N.; Baselga, J.; Hyman, D.M. A view on drug resistance in cancer. Nature 2019, 575, 299–309. [Google Scholar] [CrossRef] [PubMed]
- Dixon, K.; Kopras, E. Genetic alterations and DNA repair in human carcinogenesis. Semin. Cancer Biol. 2004, 14, 441–448. [Google Scholar] [CrossRef]
- Golemis, E.; Scheet, P.; Beck, T.N.; Scolnick, E.M.; Hunter, D.J.; Hawk, E.; Hopkins, N. Molecular mechanisms of the preventable causes of cancer in the United States. Genes Dev. 2018, 32, 868–902. [Google Scholar] [CrossRef]
- Shastry, B.S. Pharmacogenetics and the concept of individualized medicine. Pharmacogenomics J. 2005, 6, 16–21. [Google Scholar] [CrossRef]
- John F Carlquist JLA. Pharmacogenetic mechanisms underlying unanticipated drug responses. Discov Med. 2011;11(60), pp469-478.
- Jockers, R.; As, H.; S, C.; I, M.; Lj, J.; Ka, M.; DE, G.; Mm, B. Faculty Opinions recommendation of Pharmacogenomics of GPCR drug targets. . 2018, 172, 41–54. [Google Scholar] [CrossRef]
- Liu, J.; Zhang, Y.; Huang, H.; Lei, X.; Tang, G.; Cao, X.; Peng, J. Recent advances in Bcr-Abl tyrosine kinase inhibitors for overriding T315I mutation. Chem. Biol. Drug Des. 2020, 97, 649–664. [Google Scholar] [CrossRef]
- Colicelli, J. ABL Tyrosine Kinases: Evolution of Function, Regulation, and Specificity. Sci. Signal. 2010, 3, re6–re6. [Google Scholar] [CrossRef] [PubMed]
- Yin, B.; Fang, D.-M.; Zhou, X.-L.; Gao, F. Natural products as important tyrosine kinase inhibitors. Eur. J. Med. Chem. 2019, 182, 111664. [Google Scholar] [CrossRef]
- Normanno, N.; De Luca, A.; Bianco, C.; Strizzi, L.; Mancino, M.; Maiello, M.R.; Carotenuto, A.; De Feo, G.; Caponigro, F.; Salomon, D.S. Epidermal growth factor receptor (EGFR) signaling in cancer. Gene 2006, 366, 2–16. [Google Scholar] [CrossRef] [PubMed]
- Li, G.; Tian, Y.; Zhu, W.-G. The Roles of Histone Deacetylases and Their Inhibitors in Cancer Therapy. Front. Cell Dev. Biol. 2020, 8, 576946. [Google Scholar] [CrossRef]
- Seto, E.; Yoshida, M. Erasers of Histone Acetylation: The Histone Deacetylase Enzymes. Cold Spring Harb. Perspect. Biol. 2014, 6, a018713–a018713. [Google Scholar] [CrossRef] [PubMed]
- nbsp; Ropero, S. ; Cancer Epigenetics Laboratory, M.P.P.; Spanish National Cancer Centre; Esteller, M.; Cancer Epigenetics Laboratory, M.P.P., Spanish National Cancer Centre (CNIO), 28029 Madrid, Spain. The role of histone deacetylases (HDACs) in human cancer. Mol. Oncol. 2007, 1, 19–25. [Google Scholar] [CrossRef]
- Chen, Y.; Zhou, X. Research progress of mTOR inhibitors. Eur. J. Med. Chem. 2020, 208, 112820. [Google Scholar] [CrossRef]
- Hua, H.; Kong, Q.; Zhang, H.; Wang, J.; Luo, T.; Jiang, Y. Targeting mTOR for cancer therapy. J. Hematol. Oncol. 2019, 12, 71. [Google Scholar] [CrossRef]
- Huang, S. mTOR Signaling in Metabolism and Cancer. Cells 2020, 9, 2278. [Google Scholar] [CrossRef]
- Zou, Z.; Tao, T.; Li, H.; Zhu, X. mTOR signaling pathway and mTOR inhibitors in cancer: progress and challenges. Cell Biosci. 2020, 10, 1–11. [Google Scholar] [CrossRef]
- Muñoz-Gámez MOD, Aguilar-Quesada R. PARP. Vol 19.; 2006.
- Cortesi, L.; Rugo, H.S.; Jackisch, C. An Overview of PARP Inhibitors for the Treatment of Breast Cancer. Target. Oncol. 2021, 16, 255–282. [Google Scholar] [CrossRef] [PubMed]
- Slade, D. PARP and PARG inhibitors in cancer treatment. Genes Dev. 2020, 34, 360–394. [Google Scholar] [CrossRef] [PubMed]
- R. W, e Silva MLA, Sola Veneziani RC, Ricardo S, Kenupp J. Lignans: Chemical and Biological Properties. Phytochemicals - A Global Perspective of Their Role in Nutrition and Health. 2012;(March).
- Xu, W.-H.; Zhao, P.; Wang, M.; Liang, Q. Naturally occurring furofuran lignans: structural diversity and biological activities. Nat. Prod. Res. 2018, 33, 1357–1373. [Google Scholar] [CrossRef]
- Xu, W.-H.; Zhao, P.; Wang, M.; Liang, Q. Naturally occurring furofuran lignans: structural diversity and biological activities. Nat. Prod. Res. 2018, 33, 1357–1373. [Google Scholar] [CrossRef]
- Zálešák, F.; Bon, D.J.-Y.D.; Pospíšil, J. Lignans and Neolignans: Plant secondary metabolites as a reservoir of biologically active substances. Pharmacol. Res. 2019, 146, 104284. [Google Scholar] [CrossRef]
- Durán-Iturbide, N.A.; Díaz-Eufracio, B.I.; Medina-Franco, J.L. In Silico ADME/Tox Profiling of Natural Products: A Focus on BIOFACQUIM. ACS Omega 2020, 5, 16076–16084. [Google Scholar] [CrossRef] [PubMed]
- Pires, D.E.V.; Blundell, T.L.; Ascher, D.B. pkCSM: Predicting Small-Molecule Pharmacokinetic and Toxicity Properties Using Graph-Based Signatures. J. Med. Chem. 2015, 58, 4066–4072. [Google Scholar] [CrossRef] [PubMed]
- Grime, K.H.; Barton, P.; McGinnity, D.F. Application of In Silico, In Vitro and Preclinical Pharmacokinetic Data for the Effective and Efficient Prediction of Human Pharmacokinetics. Mol. Pharm. 2013, 10, 1191–1206. [Google Scholar] [CrossRef] [PubMed]
- Silva, P.; de Almeida, M.; Silva, J.; Albino, S.; Espírito-Santo, R.; Lima, M.; Villarreal, C.; Moura, R.; Santos, V. (E)-2-Cyano-3-(1H-Indol-3-yl)-N-Phenylacrylamide, a Hybrid Compound Derived from Indomethacin and Paracetamol: Design, Synthesis and Evaluation of the Anti-Inflammatory Potential. Int. J. Mol. Sci. 2020, 21, 2591. [Google Scholar] [CrossRef] [PubMed]
- Zaretzki, J.; Matlock, M.; Swamidass, S.J. XenoSite: Accurately Predicting CYP-Mediated Sites of Metabolism with Neural Networks. J. Chem. Inf. Model. 2013, 53, 3373–3383. [Google Scholar] [CrossRef]
- Andrade JC, Monteiro ÁB, Andrade HHN, et al. Involvement of GABAAReceptors in the Anxiolytic-Like Effect of Hydroxycitronellal. Biomed Res Int. 2021.
- Xu, W.-H.; Zhao, P.; Wang, M.; Liang, Q. Naturally occurring furofuran lignans: structural diversity and biological activities. Nat. Prod. Res. 2018, 33, 1357–1373. [Google Scholar] [CrossRef]
- Cheng F, Wu J, Zhang Y, et al. Brasesquilignan A–E, Five New Furofurans Lignans from Selaginella braunii Baker. Molecules. 2022;27(19).
- Win, N.N.; Woo, S.-Y.; Ngwe, H.; Prema; Wong, C. P.; Ito, T.; Okamoto, Y.; Tanaka, M.; Imagawa, H.; Asakawa, Y.; et al. Tetrahydrofuran lignans: Melanogenesis inhibitors from Premna integrifolia wood collected in Myanmar. Fitoterapia 2018, 127, 308–313. [Google Scholar] [CrossRef]
- Choi SK, Lee YG, Wang RB, et al. Dibenzocyclooctadiene lignans from the fruits of Schisandra chinensis and their cytotoxicity on human cancer cell lines. Appl Biol Chem. 2020;63(1).
- Motyka, S.; Jafernik, K.; Ekiert, H.; Sharifi-Rad, J.; Calina, D.; Al-Omari, B.; Szopa, A.; Cho, W.C. Podophyllotoxin and its derivatives: Potential anticancer agents of natural origin in cancer chemotherapy. Biomed. Pharmacother. 2023, 158, 114145. [Google Scholar] [CrossRef]
- Shen, S.; Tong, Y.; Luo, Y.; Huang, L.; Gao, W. Biosynthesis, total synthesis, and pharmacological activities of aryltetralin-type lignan podophyllotoxin and its derivatives. Nat. Prod. Rep. 2022, 39, 1856–1875. [Google Scholar] [CrossRef]
- Khaled, M.; Jiang, Z.-Z.; Zhang, L.-Y. Deoxypodophyllotoxin: A promising therapeutic agent from herbal medicine. J. Ethnopharmacol. 2013, 149, 24–34. [Google Scholar] [CrossRef] [PubMed]
- Zilla, M.K.; Nayak, D.; Amin, H.; Nalli, Y.; Rah, B.; Chakraborty, S.; Kitchlu, S.; Goswami, A.; Ali, A. 4′-Demethyl-deoxypodophyllotoxin glucoside isolated from Podophyllum hexandrum exhibits potential anticancer activities by altering Chk-2 signaling pathway in MCF-7 breast cancer cells. Chem. Interactions 2014, 224, 100–107. [Google Scholar] [CrossRef]
- Scotti L, Jaime Bezerra Mendonca Junior F, Rodrigo Magalhaes Moreira D, Sobral da Silva M, R. Pitta I, Tullius Scotti M. SAR, QSAR and Docking of Anticancer Flavonoids and Variants: A Review. Curr Top Med Chem. 2013;12(24), pp2785-2809.
- Bento, A.P.; Gaulton, A.; Hersey, A.; Bellis, L.J.; Chambers, J.; Davies, M.; Krüger, F.A.; Light, Y.; Mak, L.; McGlinchey, S.; et al. The ChEMBL bioactivity database: an update. Nucleic Acids Res. 2013, 42, D1083–D1090. [Google Scholar] [CrossRef]
- Gaulton, A.; Bellis, L.J.; Bento, A.P.; Chambers, J.; Davies, M.; Hersey, A.; Light, Y.; McGlinchey, S.; Michalovich, D.; Al-Lazikani, B.; et al. ChEMBL: a large-scale bioactivity database for drug discovery. Nucleic Acids Res. 2012, 40, D1100–D1107. [Google Scholar] [CrossRef] [PubMed]
- Talete srl. Dragon - Software for Molecular Descriptor Calculation) Version 7.
- Dragon T srl. Software for Molecular Descriptor Calculation.
- Mauri A, Consonni V, Pavan M, Todeschini R. DRAGON software: An easy approach to molecular descriptor calculations. Match. 2006;56(2), pp237-248.
- Chicco, D.; Jurman, G. The advantages of the Matthews correlation coefficient (MCC) over F1 score and accuracy in binary classification evaluation. BMC Genom. 2020, 21, 1–13. [Google Scholar] [CrossRef]
- Sutton, C.; Boley, M.; Ghiringhelli, L.M.; Rupp, M.; Vreeken, J.; Scheffler, M. Identifying domains of applicability of machine learning models for materials science. Nat. Commun. 2020, 11, 1–9. [Google Scholar] [CrossRef] [PubMed]
- Weaver, S.; Gleeson, M.P. The importance of the domain of applicability in QSAR modeling. J. Mol. Graph. Model. 2008, 26, 1315–1326. [Google Scholar] [CrossRef]
- Cunningham, F.; E Allen, J.; Allen, J.; Alvarez-Jarreta, J.; Amode, M.R.; Armean, I.M.; Austine-Orimoloye, O.; Azov, A.G.; Barnes, I.; Bennett, R.; et al. Ensembl 2022. Nucleic Acids Res. 2021, 50, D988–D995. [Google Scholar] [CrossRef]
- Pettersen, E.F.; Goddard, T.D.; Huang, C.C.; Couch, G.S.; Greenblatt, D.M.; Meng, E.C.; Ferrin, T.E. UCSF Chimera?A visualization system for exploratory research and analysis. J. Comput. Chem. 2004, 25, 1605–1612. [Google Scholar] [CrossRef]
- Bitencourt-Ferreira, G.; de Azevedo, W.F. Molegro Virtual Docker for Docking. Docking Screens for Drug Discovery. Published online 2019, pp149-167. [CrossRef]
- Berman HM, Westbrook J, Feng Z, et al. The Protein Data Bank. Vol 28.; 2000. http://www.rcsb.org/pdb/status.
- Brice MD, Rodgers JR, Kennard O. The Protein Data Bank.
- Daina A, Michielin O. SwissADME : uma ferramenta web gratuita para avaliar farmacocinética, semelhança medicamentosa e química medicinal Abstrato. Published online 2018:1-20.
Figure 1.
ROC (Receiver Operating Characteristic) curve generated for the five selected protein models. (a) Test of ABL; (b) Cross of ABL; (c) Test of EFGR; (d) Cross of EFGR; (e) Test of HDAC; (f) Cross of HDAC; (g) Test of mTOR; (h) Cross of mTOR; (i) Test of PARP and (j) Cross of PARP.
Figure 1.
ROC (Receiver Operating Characteristic) curve generated for the five selected protein models. (a) Test of ABL; (b) Cross of ABL; (c) Test of EFGR; (d) Cross of EFGR; (e) Test of HDAC; (f) Cross of HDAC; (g) Test of mTOR; (h) Cross of mTOR; (i) Test of PARP and (j) Cross of PARP.
Figure 2.
Structures of the lignans with the highest pActivity values for each protein.
Figure 2.
Structures of the lignans with the highest pActivity values for each protein.
Figure 3.
Three-dimensional structure of selected proteins. On the right side, information on domains and regions important for the biological activity of each protein.
Figure 3.
Three-dimensional structure of selected proteins. On the right side, information on domains and regions important for the biological activity of each protein.
Figure 4.
3D and 2D interactions of the EGFR receptor and the colocasinol A lignan. Hydrogen bonds are highlighted in dark green, van der Waals interactions are highlighted in light green, hydrophobic interactions are highlighted in pink, and steric interactions are high-lighted in red.
Figure 4.
3D and 2D interactions of the EGFR receptor and the colocasinol A lignan. Hydrogen bonds are highlighted in dark green, van der Waals interactions are highlighted in light green, hydrophobic interactions are highlighted in pink, and steric interactions are high-lighted in red.
Figure 5.
3D and 2D interactions of the HDAC8 receptor with selected lignans. Hydrogen bonds are highlighted in dark green, van der Waals interactions are highlighted in light green, hydrophobic interactions are highlighted in pink, and steric interactions are highlighted in red.
Figure 5.
3D and 2D interactions of the HDAC8 receptor with selected lignans. Hydrogen bonds are highlighted in dark green, van der Waals interactions are highlighted in light green, hydrophobic interactions are highlighted in pink, and steric interactions are highlighted in red.
Figure 6.
3D and 2D interactions of the mTOR receptor with selected lignans. Hydrogen bonds are highlighted in dark green, van der Waals interactions are highlighted in light green, hydrophobic interactions are highlighted in pink, and steric interactions are highlight-ed in red.
Figure 6.
3D and 2D interactions of the mTOR receptor with selected lignans. Hydrogen bonds are highlighted in dark green, van der Waals interactions are highlighted in light green, hydrophobic interactions are highlighted in pink, and steric interactions are highlight-ed in red.
Figure 7.
3D and 2D interactions of the PARP1 receptor with selected lignans. Hydrogen bonds are highlighted in dark green, van der Waals interactions are highlighted in light green, hydrophobic interactions are highlighted in pink, and steric interactions are highlighted in red.
Figure 7.
3D and 2D interactions of the PARP1 receptor with selected lignans. Hydrogen bonds are highlighted in dark green, van der Waals interactions are highlighted in light green, hydrophobic interactions are highlighted in pink, and steric interactions are highlighted in red.
Table 1.
Performance summary corresponding to the results obtained for all Random Forest models.
Table 1.
Performance summary corresponding to the results obtained for all Random Forest models.
| Enzyme |
Validation |
Accuracy |
Sensitivity |
Specificity |
PPV* |
NPV* |
MCC |
ROC |
| ABL |
Test |
0.99 |
1 |
0.99 |
0.99 |
1 |
0.76 |
0.95 |
| |
Cross |
0.88 |
0.86 |
0.90 |
0.89 |
0.86 |
0.82 |
0.94 |
| EFGR |
Test |
0.82 |
0.84 |
0.80 |
0.82 |
0.82 |
0.65 |
0.90 |
| |
Cross |
0.83 |
0.86 |
0.81 |
0.83 |
0.84 |
0.67 |
0.91 |
| HDAC |
Test |
0.82 |
0.80 |
0.84 |
0.83 |
0.80 |
0.64 |
0.91 |
| |
Cross |
0.81 |
0.84 |
0.79 |
0.80 |
0.83 |
0.63 |
0.89 |
| mTOR |
Test |
0.85 |
0.89 |
0.80 |
0.85 |
0.85 |
0.70 |
0.93 |
| |
Cross |
0.84 |
0.88 |
0.79 |
0.84 |
0.84 |
0.68 |
0.92 |
| PARP |
Test |
0.86 |
0.82 |
0.84 |
0.85 |
0.87 |
0.72 |
0.92 |
| |
Cross |
0.83 |
0.85 |
0.81 |
0.81 |
0.84 |
0.66 |
0.90 |
Table 2.
Number of active lignans divided by subclass and the respective probability of biological activity for each enzyme.
Table 2.
Number of active lignans divided by subclass and the respective probability of biological activity for each enzyme.
| Protein |
Subclass |
Active compounds |
pActivity |
| EFGR |
Furofuran |
1 |
0.54 |
| |
|
|
|
| HDAC |
Dibenzilbutirolactone |
12 |
0.50 - 0.55 |
| Dibenzociclooctadiene |
22 |
0.50 - 0.63 |
| Aryltetralin |
16 |
0.50 - 0.63 |
| Arylhydronafthalene |
4 |
0.50 |
| Arylnaftalene |
2 |
0.50 - 0.52 |
| Furofuran |
22 |
0.50 - 0.57 |
| 2-aryl-4-benzyltetrahidrofuran |
8 |
0.51 - 0.56 |
| mTOR |
Dibenzylbutane |
3 |
0.50 - 0.53 |
| Dibenziltetrafuran |
2 |
0.50 - 0.56 |
| Dibenzilbutirolactone |
14 |
0.50 - 0.56 |
| Dibenzociclooctadiene |
40 |
0.50 - 0.55 |
| Aryltetralin |
28 |
0.50 - 0.56 |
| Arylhydronafthalene |
6 |
0.50 - 0.54 |
| Arylnaftalene |
8 |
0.50 - 0.56 |
| Furofuran |
37 |
0.50 - 0.58 |
| 2,5-diarlytetrahydrofuran |
3 |
0.50 - 0.58 |
| 2-aryl-4-benzyltetrahidrofuran |
14 |
0.50 - 0.58 |
| |
|
|
|
| PARP |
Dibenzylbutane |
1 |
0.50 |
| Dibenzilbutirolactone |
2 |
0.52 - 0.54 |
| Dibenzociclooctadiene |
89 |
0.50 - 0.61 |
| Aryltetralin |
18 |
0.50 - 0.54 |
| Arylhydronafthalene |
4 |
0.50 - 0.51 |
| Arylnaftalene |
8 |
0.53 - 0.56 |
| Furofuran |
30 |
0.50 - 0.56 |
| 2-aryl-4-benzyltetrahidrofuran |
4 |
0.52 - 0.55 |
Table 3.
Clinically relevant SNPs located in the catalytic domain selected for molecular docking analyses.
Table 3.
Clinically relevant SNPs located in the catalytic domain selected for molecular docking analyses.
| Enzyme |
Aminoacid |
SNP |
Alleles |
Ancestral amino acid |
Polymorphic amino acid |
Ancestor allele frequency |
Allelic frequency of the polymorphism |
Poly-phen |
| EGFR |
833 |
rs397517126 |
T/G |
L |
V |
- |
- |
0.829 |
| 835 |
rs397517128 |
A/T |
H |
L |
- |
- |
0.999 |
| 842 |
rs1003269794 |
A/C/G |
N |
H/D |
- |
- |
1 |
| 845 |
rs1787407031 |
G/C |
V |
L |
- |
- |
0.428 |
| |
|
|
|
|
|
|
|
|
| HDAC8 |
101 |
rs2051867176 |
T/C |
D |
G |
- |
- |
1 |
| 139 |
rs878853048 |
C/G |
G |
A |
- |
- |
0.999 |
| 140 |
rs1569412360 |
C/T |
G |
R |
- |
- |
1 |
| 140 |
rs1057518047 |
C/A |
G |
V |
- |
- |
1 |
| 145 |
rs2051860492 |
T/C |
K |
E |
- |
- |
0.727 |
| 155 |
rs2048985556 |
G/A |
L |
F |
- |
- |
0.017 |
| 176 |
rs1057518727 |
T/C |
D |
G |
- |
- |
1 |
| 186 |
rs797045612 |
C/T |
E |
K |
- |
- |
0.923 |
| 188 |
rs1603069440 |
C/T |
A |
T |
- |
- |
0.997 |
| 195 |
rs1556009247 |
A/C/T |
V |
G/D |
- |
- |
1 |
| 199 |
rs1057518126 |
A/T |
S |
T |
- |
- |
0.979 |
| |
|
|
|
|
|
|
|
|
| mTOR1 |
2326 |
rs1642201364 |
C/A |
V |
F |
- |
- |
|
| 2327 |
rs878855328 |
C/T |
M |
I |
- |
- |
|
| 2367 |
rs1642080627 |
T/C |
T |
A |
- |
- |
|
| 2406 |
rs1557739557 |
C/A/T |
V |
L/M |
- |
- |
|
| 2413 |
rs1553171141 |
C/A |
S |
I |
- |
- |
|
| 2416 |
rs1173643064 |
G/A |
A |
V |
- |
- |
|
| 2419 |
rs587777900 |
C/T |
E |
K |
- |
- |
|
| 2427 |
rs1085307113 |
A/G/T |
L |
P/Q |
- |
- |
|
| 2431 |
rs1057524044 |
A/G |
L |
P |
- |
- |
|
| 2457 |
rs1060501911 |
A/G |
I |
T |
- |
- |
|
| 2458 |
rs1641759287 |
C/A |
L |
F |
- |
- |
|
| |
|
|
|
|
|
|
|
|
| PARP1 |
864 |
rs993561075 |
A/C |
S |
A |
0.5 |
0.5 |
0.993 |
| 940 |
rs3219145 |
T/C/G |
K |
R/T |
0.998329 |
0.001671 |
0.79 |
Table 5.
ADMET properties of lignans selected by QSAR and molecular modeling studies.
Table 5.
ADMET properties of lignans selected by QSAR and molecular modeling studies.
| Absorption |
L1 |
L2 |
L3 |
L4 |
L5 |
L6 |
L7 |
L8 |
| Caco2 Permeability#break#(log Papp in 10-8 cm/s) |
1.325 |
1.214 |
1.272 |
0.337 |
0.597 |
0.496 |
0.555 |
1.249 |
| Intestinal absorption #break#(% absorbed) |
89.098 |
100 |
100 |
100 |
53.666 |
67.479 |
100 |
97.43 |
| Skin Permeability#break#(log Kp) |
-2.747 |
-2.736 |
-2.735 |
-2.735 |
-2.735 |
-2.735 |
-2,735 |
-2.82 |
| P-glycoprotein substrate |
No |
No |
No |
Yes |
Yes |
Yes |
No |
No |
| Distribution |
L1 |
L2 |
L3 |
L4 |
L5 |
L6 |
L7 |
L8 |
| VDss#break#(log L/kg) |
0.064 |
-0.285 |
-0.714 |
-0.484 |
0.138 |
-0.101 |
-0.496 |
-0.052 |
| BBB permeability#break#(log BB) |
-0.55 |
-1.189 |
-1.19 |
-1.899 |
-1.941 |
-1.848 |
-2.389 |
-0.026 |
| CNS permeability#break#(log PS) |
-2.966 |
-2.846 |
-2.904 |
-4.136 |
-3.799 |
-3.674 |
-3.219 |
-2.613 |
| Metabolism |
L1 |
L2 |
L3 |
L4 |
L5 |
L6 |
L7 |
L8 |
| CYP2D6 (Substrate) |
No |
No |
No |
No |
No |
No |
No |
No |
| CYP3A4 (Substrate) |
No |
Yes |
Yes |
Yes |
Yes |
Yes |
Yes |
Yes |
| CYP1A2 (Inhibitior) |
No |
No |
No |
No |
No |
No |
No |
No |
| CYP2C19#break#(Inhibitior) |
No |
No |
No |
No |
No |
No |
No |
Yes |
| CYP2C9#break#(Inhibitior) |
No |
No |
No |
No |
No |
Yes |
No |
Yes |
| CYP2D6 (Inhibitior) |
No |
No |
No |
No |
No |
No |
No |
No |
| CYP3A4 (Inhibitior) |
No |
No |
Yes |
No |
No |
Yes |
No |
Yes |
| Excretion |
L1 |
L2 |
L3 |
L4 |
L5 |
L6 |
L7 |
L8 |
| Total Clearance #break#(log ml/min/Kg) |
0.171 |
0.293 |
0.225 |
0.156 |
0.192 |
0.259 |
-0.498 |
0.132 |
| Renal OCT2 #break#(substrate) |
No |
No |
No |
No |
No |
No |
No |
No |
| Toxicity |
L1 |
L2 |
L3 |
L4 |
L5 |
L6 |
L7 |
L8 |
| AMES toxicity |
No |
No |
No |
No |
No |
No |
No |
No |
| hERG 1 inhibitor |
No |
No |
No |
No |
No |
No |
No |
No |
| hERG 2 inhibitor |
No |
No |
No |
No |
Yes |
Yes |
Yes |
No |
| Hepatotoxicity |
No |
Yes |
No |
No |
No |
No |
No |
No |
| Skin sensitization |
No |
No |
No |
No |
No |
No |
No |
No |
|
Disclaimer/Publisher’s Note: The statements, opinions and data contained in all publications are solely those of the individual author(s) and contributor(s) and not of MDPI and/or the editor(s). MDPI and/or the editor(s) disclaim responsibility for any injury to people or property resulting from any ideas, methods, instructions or products referred to in the content. |
© 2023 by the authors. Licensee MDPI, Basel, Switzerland. This article is an open access article distributed under the terms and conditions of the Creative Commons Attribution (CC BY) license (http://creativecommons.org/licenses/by/4.0/).
