1. Introduction
Gas hydrates or clathrates are crystalline compounds formed under certain thermobaric conditions and containing gas and water in their composition. Under certain thermobaric conditions, gas hydrates are formed mainly from gas and water (or ice) [
1,
2]. Since the sixties of the twentieth century the emphasis in the study of gas hydrates began to shift towards the extraction of gas from their composition. At that time, the Messoyakh gas hydrate field, deposits in the Mackenzie Delta, and natural accumulations of hydrates at the bottom of the seas and oceans were discovered. At present, the volume of gas in the composition of gas hydrates is estimated at about 10
16 m
3 [
3]. Therefore, the development of gas from such fields is quite relevant. In particular, the following methods of gas production from the gas hydrate composition have been proposed [
4,
5]: thermal, depressurization, and injection of inhibitors. These methods of extracting gas from the composition of the gas hydrate are called traditional methods. It should be noted that the methods of gas production from the gas hydrate composition described above are, for the most part, inefficient and costly.
A fairly large number of theoretical and experimental works have been devoted to the problems of gas production from the composition of gas hydrates. Among the theoretical works published over the past 15 years, the following can be distinguished [
6,
7,
8,
9,
10,
11,
12]. It should be noted that these works are devoted to the theoretical study of traditional methods for the development of gas hydrate deposits. At the same time, the mathematical models are based on the methods and equations of the mechanics of multiphase media (the system of basic equations necessarily includes the continuity equation, Darcy's law, the continuity equation, and the energy equation). The most complete mathematical models of the formation and decomposition of gas hydrates, which are close to real conditions for the development of gas hydrate deposits, are presented in [
13,
14,
15,
16,
17]. Modeling of gorenje hydrate methane with account of the non-stationary process of its dissociation in the powder layer is presented, in particular, in [
18].
In contrast to theoretical works, experimental works on the study of methane extraction from methane gas hydrate also include works on the method of replacing methane with carbon dioxide in methane gas hydrate. In particular, in [
19,
20], the very possibility of the reaction of substitution of methane molecules by carbon dioxide molecules in methane gas hydrate was convincingly proved. Also, as a result of the experiments, the following features were established that occur when methane hydrate samples are exposed to carbon dioxide. Thus, if the temperature of the system is below the equilibrium temperature (at a given pressure) of the decomposition of methane gas hydrate into methane and water, then the reaction of replacing methane with carbon dioxide does not release free water [
21,
22]. In this case, instead of methane hydrate, carbon dioxide hydrate is formed without the formation of an intermediate liquid phase. At the same time, it was shown in [
19] that the reaction of replacing methane with carbon dioxide, i.e., occurs with the release of heat. In general, characterizing the experimental work on this topic, it should be noted that in most experimental work, this process is studied in free volume, and not in the pore space. In addition, in experimental studies, studies were carried out, as a rule, in samples of small size and under conditions of thermal and pressure control. Therefore, in these studies, due to the small size of the samples and the maintenance of constant thermobaric conditions, the replacement process is limited primarily by the kinetics of the process. These studies do not provide a complete picture of the processes for the tasks set in the project, since in the case of extended natural reservoirs with constant injection of carbon dioxide into the reservoir, due to the release of latent heat of phase transitions, absorption / release of gas and active mass transfer in a porous medium, the process of replacing methane with carbon dioxide in a gas hydrate will be determined not only by the kinetics of the process, but also by heat and mass transfer in the porous medium itself.
Numerical modeling of the replacement of methane by carbon dioxide in methane gas hydrate is the subject of, in particular, works [
23,
24,
25]. Basically, they study only the kinetics of the process. At the same time, the formulation of problems in them corresponds to the case when carbon dioxide instantly fills all points of the reservoir saturated with methane and water, i.e. does not take into account the processes of heat and mass transfer in the reservoir itself (at the macrolevel).
It should also be noted that there are a number of theoretical and experimental works on the study of carbon dioxide injection into underground reservoirs in the context of the problem of greenhouse gas utilization. For example, in [
26,
27,
28], the processes of formation and decomposition of gas hydrates are not studied, but it is proved that the injection of carbon dioxide into underground reservoirs is a fairly effective way of its sequestration. It was also shown in [
29,
30] that one of the promising methods for utilizing sulfur dioxide is its injection in the liquid phase into depleted natural gas fields. This technique, firstly, provides a fairly reliable conservation of SO
2 in the solid phase at relatively low economic costs, and secondly, it ensures the release of natural gas (methane) from such reservoirs. These solutions for the utilization of industrial gases will help solve a number of environmental problems. Therefore, in the presented work, some features of the injection of liquid sulfur dioxide for porous reservoirs of finite length, initially saturated with methane and ice, are numerically investigated.
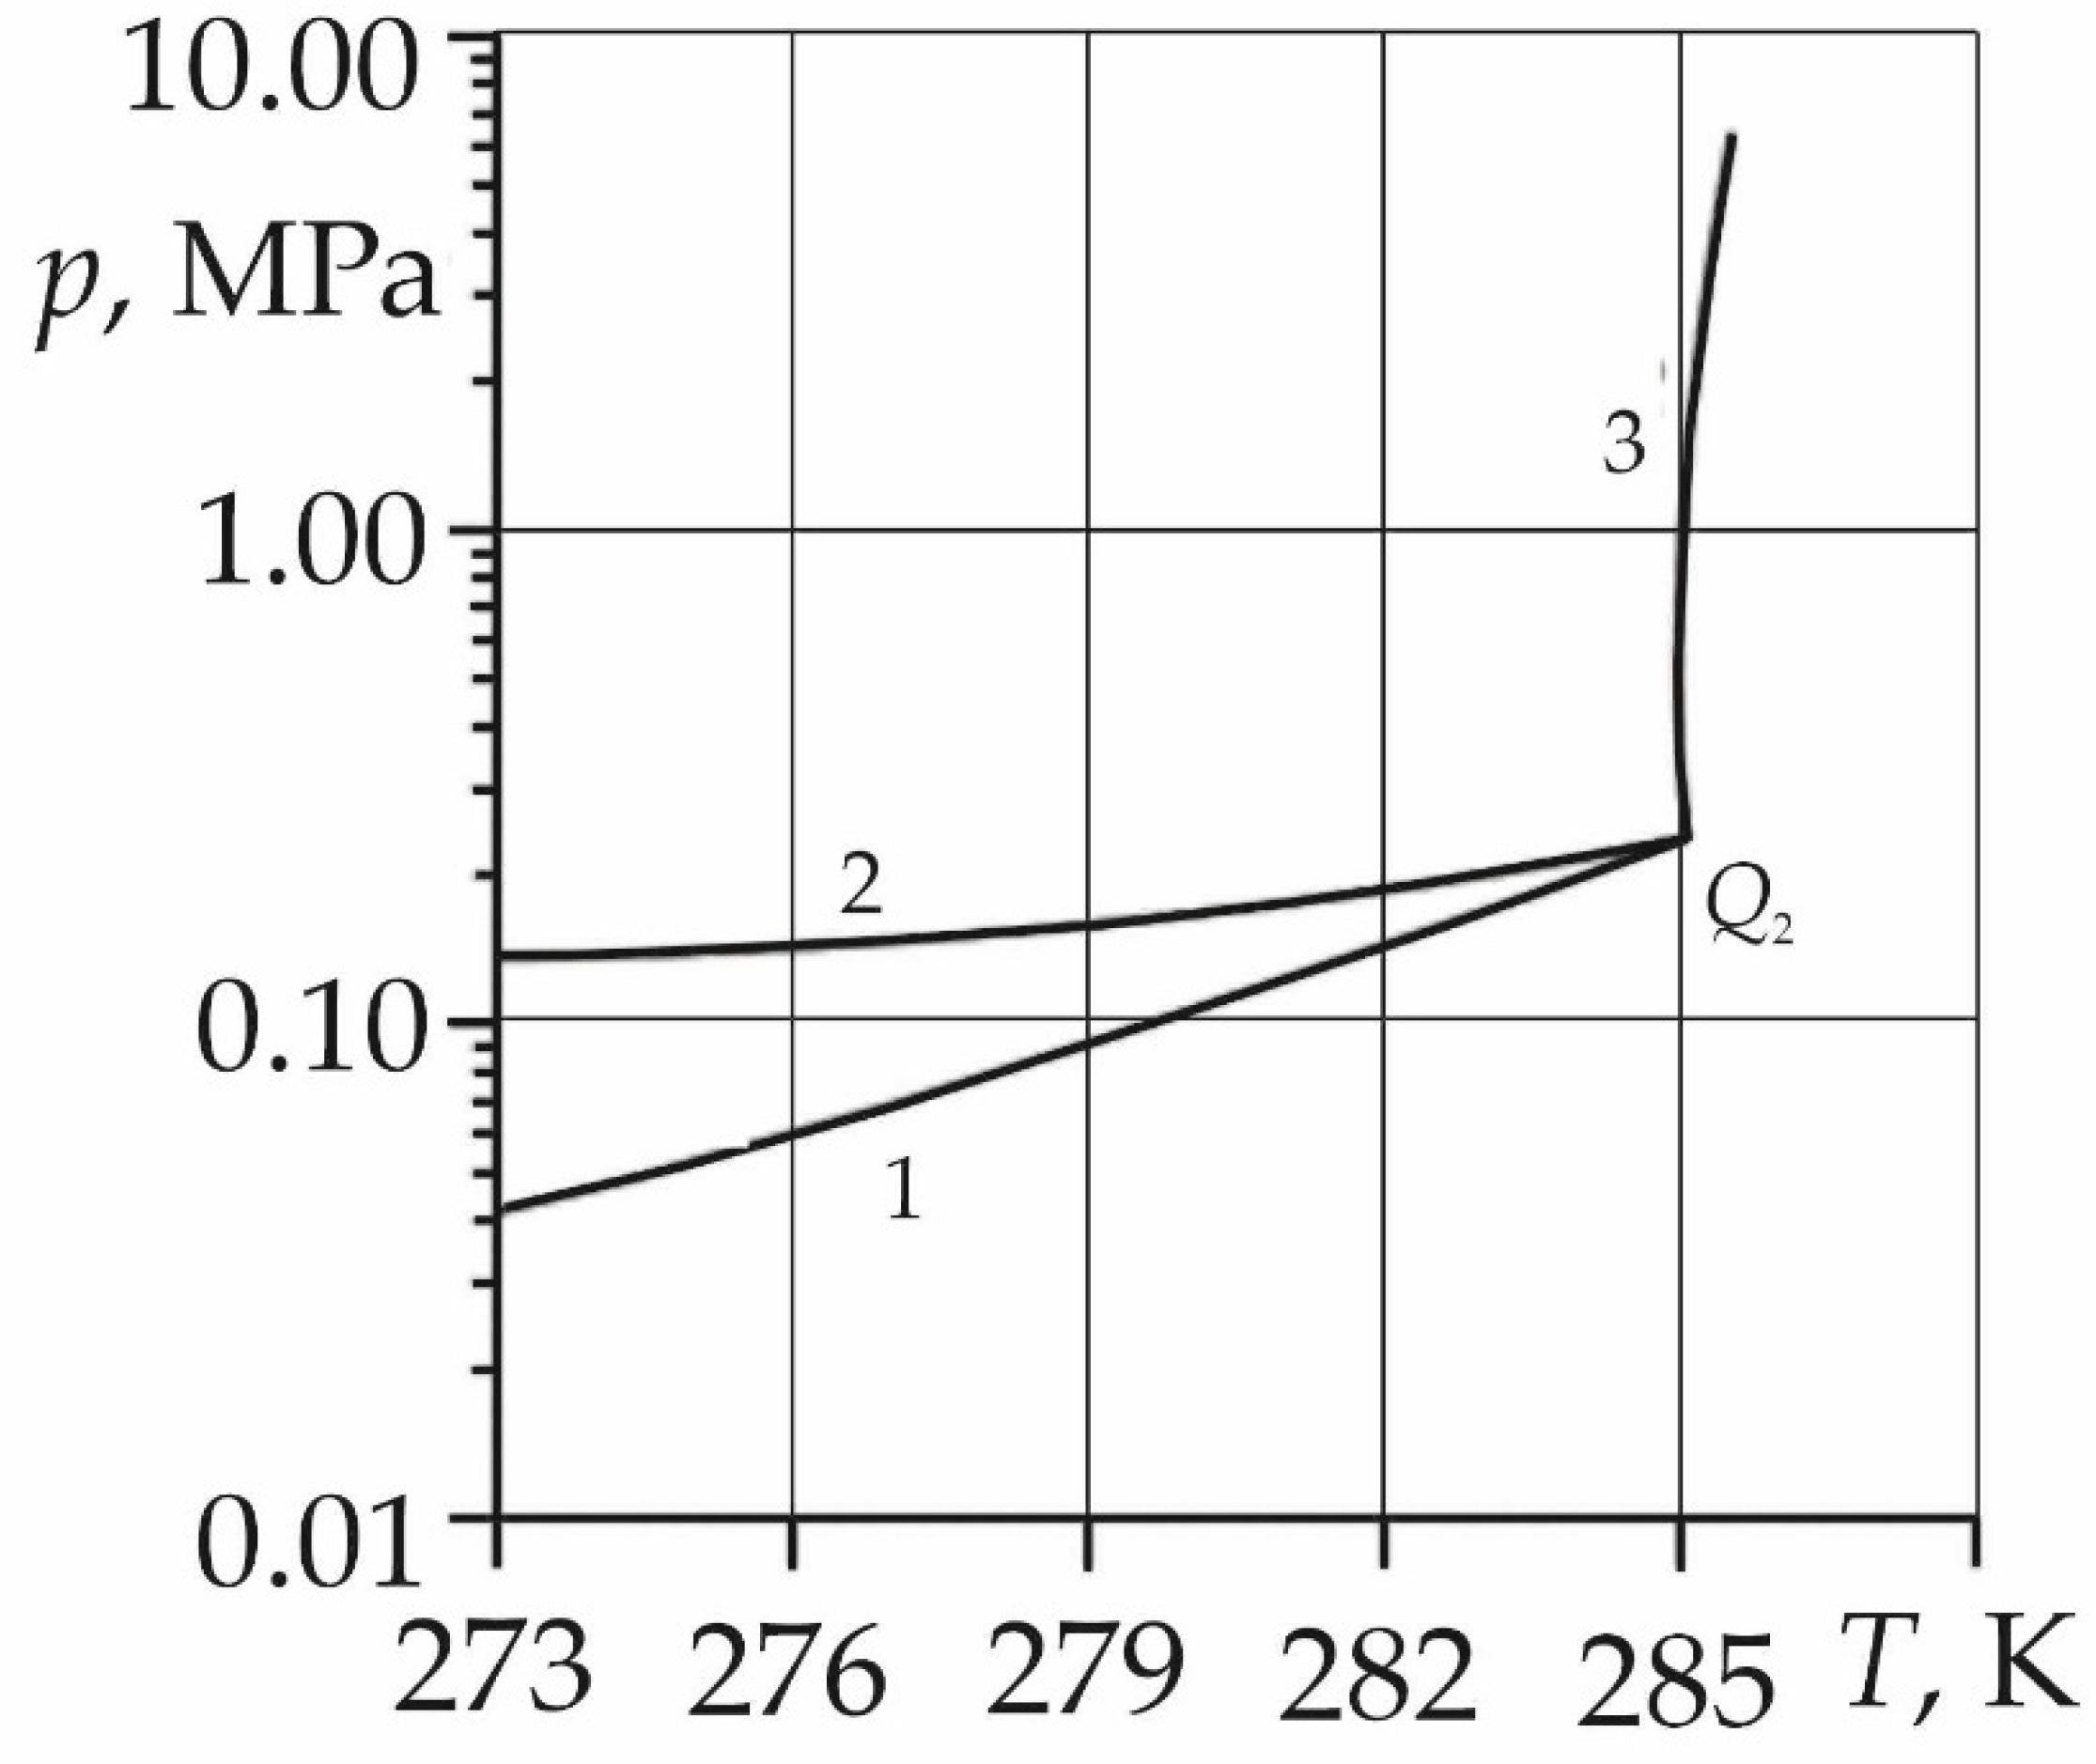
The phase diagram (
Figure 1) shows the thermobaric conditions for the existence of sulfur dioxide gas hydrate [
31]. In the above diagram, curve 1 corresponds to a three-phase equilibrium between gaseous sulfur dioxide, its gas hydrate, and water (ice), curve 2, to a two-phase equilibrium between gaseous and liquid sulfur dioxide, and curve 3, to an equilibrium between liquid sulfur dioxide, its gas hydrate, and water. SO
2 gas hydrate exists above curve 1 and to the left of curve 3, i.e. at sufficiently high pressures and low temperatures. At the upper quadrupole point
Q2 (
TQ = 285.1 K and
pQ = 0.233 MPa), gaseous and liquid sulfur dioxide, as well as its gas hydrate and water, are in equilibrium.
Let a porous horizontal layer of length
L in the initial state be saturated with ice with initial saturation
Sw0 and methane. We will assume that the initial values of temperature
T0 and pressure
p0 of the formation correspond to the thermodynamic conditions for the existence of sulfur dioxide (in the liquid state) and its gas hydrate (i.e., above curve 2 in
Figure 1). Let liquid sulfur dioxide be injected through the left boundary of the formation (
x = 0), the pressure
pe and temperature
Te of which correspond to the conditions for the existence of sulfur dioxide gas hydrate. We will assume that in this case three regions are formed in the reservoir: near, far and intermediate. In the near zone, liquid sulfur dioxide and its gas hydrate will be present in the formation pores. The intermediate zone will be saturated with water and methane, while the far zone will be saturated with ice and methane. In this case, two boundaries of phase transitions will appear in the reservoir, separating these areas and moving deep into the reservoir. So, at the near boundary of the phase transition
x =
x(n), SO
2 gas hydrate is formed from water and sulfur dioxide, and at the far surface of the phase transition
x =
x(d) ice melting.
2. Basic equations
To describe the processes of heat and mass transfer, accompanied by the formation of sulfur dioxide hydrate and melting of ice, we will use a single-temperature model of the system under consideration with a constant value of porosity. In this case, the skeleton of a porous medium, gas hydrate, water are incompressible and motionless; methane will be considered a calorically perfect gas, and liquid sulfur dioxide will be considered an elastic liquid. In addition, SO
2 hydrate is a two-component system with a mass fraction of the hydrate-forming gas equal to
G. The system of basic equations, which is the laws of conservation of mass and energy, Darcy's law and the equation of state under the above assumptions in each of the regions, has the form [
32,
33]:
Here, the subscripts i = s, m refer to the parameters of liquid sulfur dioxide and methane, respectively; ϕ is porosity; ρ(i), υ(i), k(i), C(i) and μ(i) are, respectively, the true density, velocity, permeability, specific heat and dynamic viscosity of the i - phase; p is pressure; T is temperature; S(i) – saturation of pores with the i phase; Rg is the gas constant of methane, β is the volumetric compression ratio of liquid SO2; ρ0s is the true density of liquid sulfur dioxide corresponding to pressure p0; ρC and λ are the specific volumetric heat capacity and the thermal conductivity of the system. Since the main contribution to the values of ρC and λ is made by the corresponding parameters of the skeleton of the porous medium, we will assume them to be constant values.
The dependence of the phase permeability coefficient k(i) on saturation S(i) is set based on the Kozeny formula [
34]:
where
k0 is the absolute permeability of the reservoir. The subscripts 1, 2 and 3 refer to the parameters of the near, intermediate and far regions.
The conditions for the balance of mass and heat at the near boundary of the phase transition
x =
x(n), which separates the near and intermediate regions and at which SO
2 hydrate is formed from water and sulfur dioxide, can be represented as:
Here ρh and ρl are the densities of hydrate and water, respectively; Sh and Sl are hydrate saturation and water saturation; Lh is the specific heat of SO2 hydrate formation; is the velocity of the phase transition boundary.
Similarly, the conditions at the far boundary of the phase transition
x =
x(d), where ice melts, can be represented as:
Here ρw0 and Lw are the density and specific heat of ice melting, respectively; is the velocity of the boundary of the far boundary of the phase transition.
The pressure and temperatures at the boundaries of phase transitions will be considered continuous quantities. In addition, since ice melts at the far boundary of phase transitions x = x(d), we assume that its temperature is T(d) = 273 K.
Since the initial ice saturation was assumed to be equal to
Sw0, then from the equations of systems (2) and (3) for the values of
Sl and
Sh, one can obtain:
The initial conditions, as well as the conditions at the outer boundaries of the reservoir, can be represented as:
From system (1), the piezoconductivity equation for the near region (
i = 1) can be represented as:
Similar equations for the intermediate and far regions ( i = 2, 3) have the form:
The equation of heat influx after transformations can also be represented as:
where
is the formation thermal diffusivity;
;
(
i = 2, 3).
To solve a closed system of Equations (5) - (7) with initial boundary conditions (4) and conditions (2) - (3) at the boundaries of the phase transition, the method of catching fronts in the nodes of a spatial grid is used [
35].
3. Analysis of the results
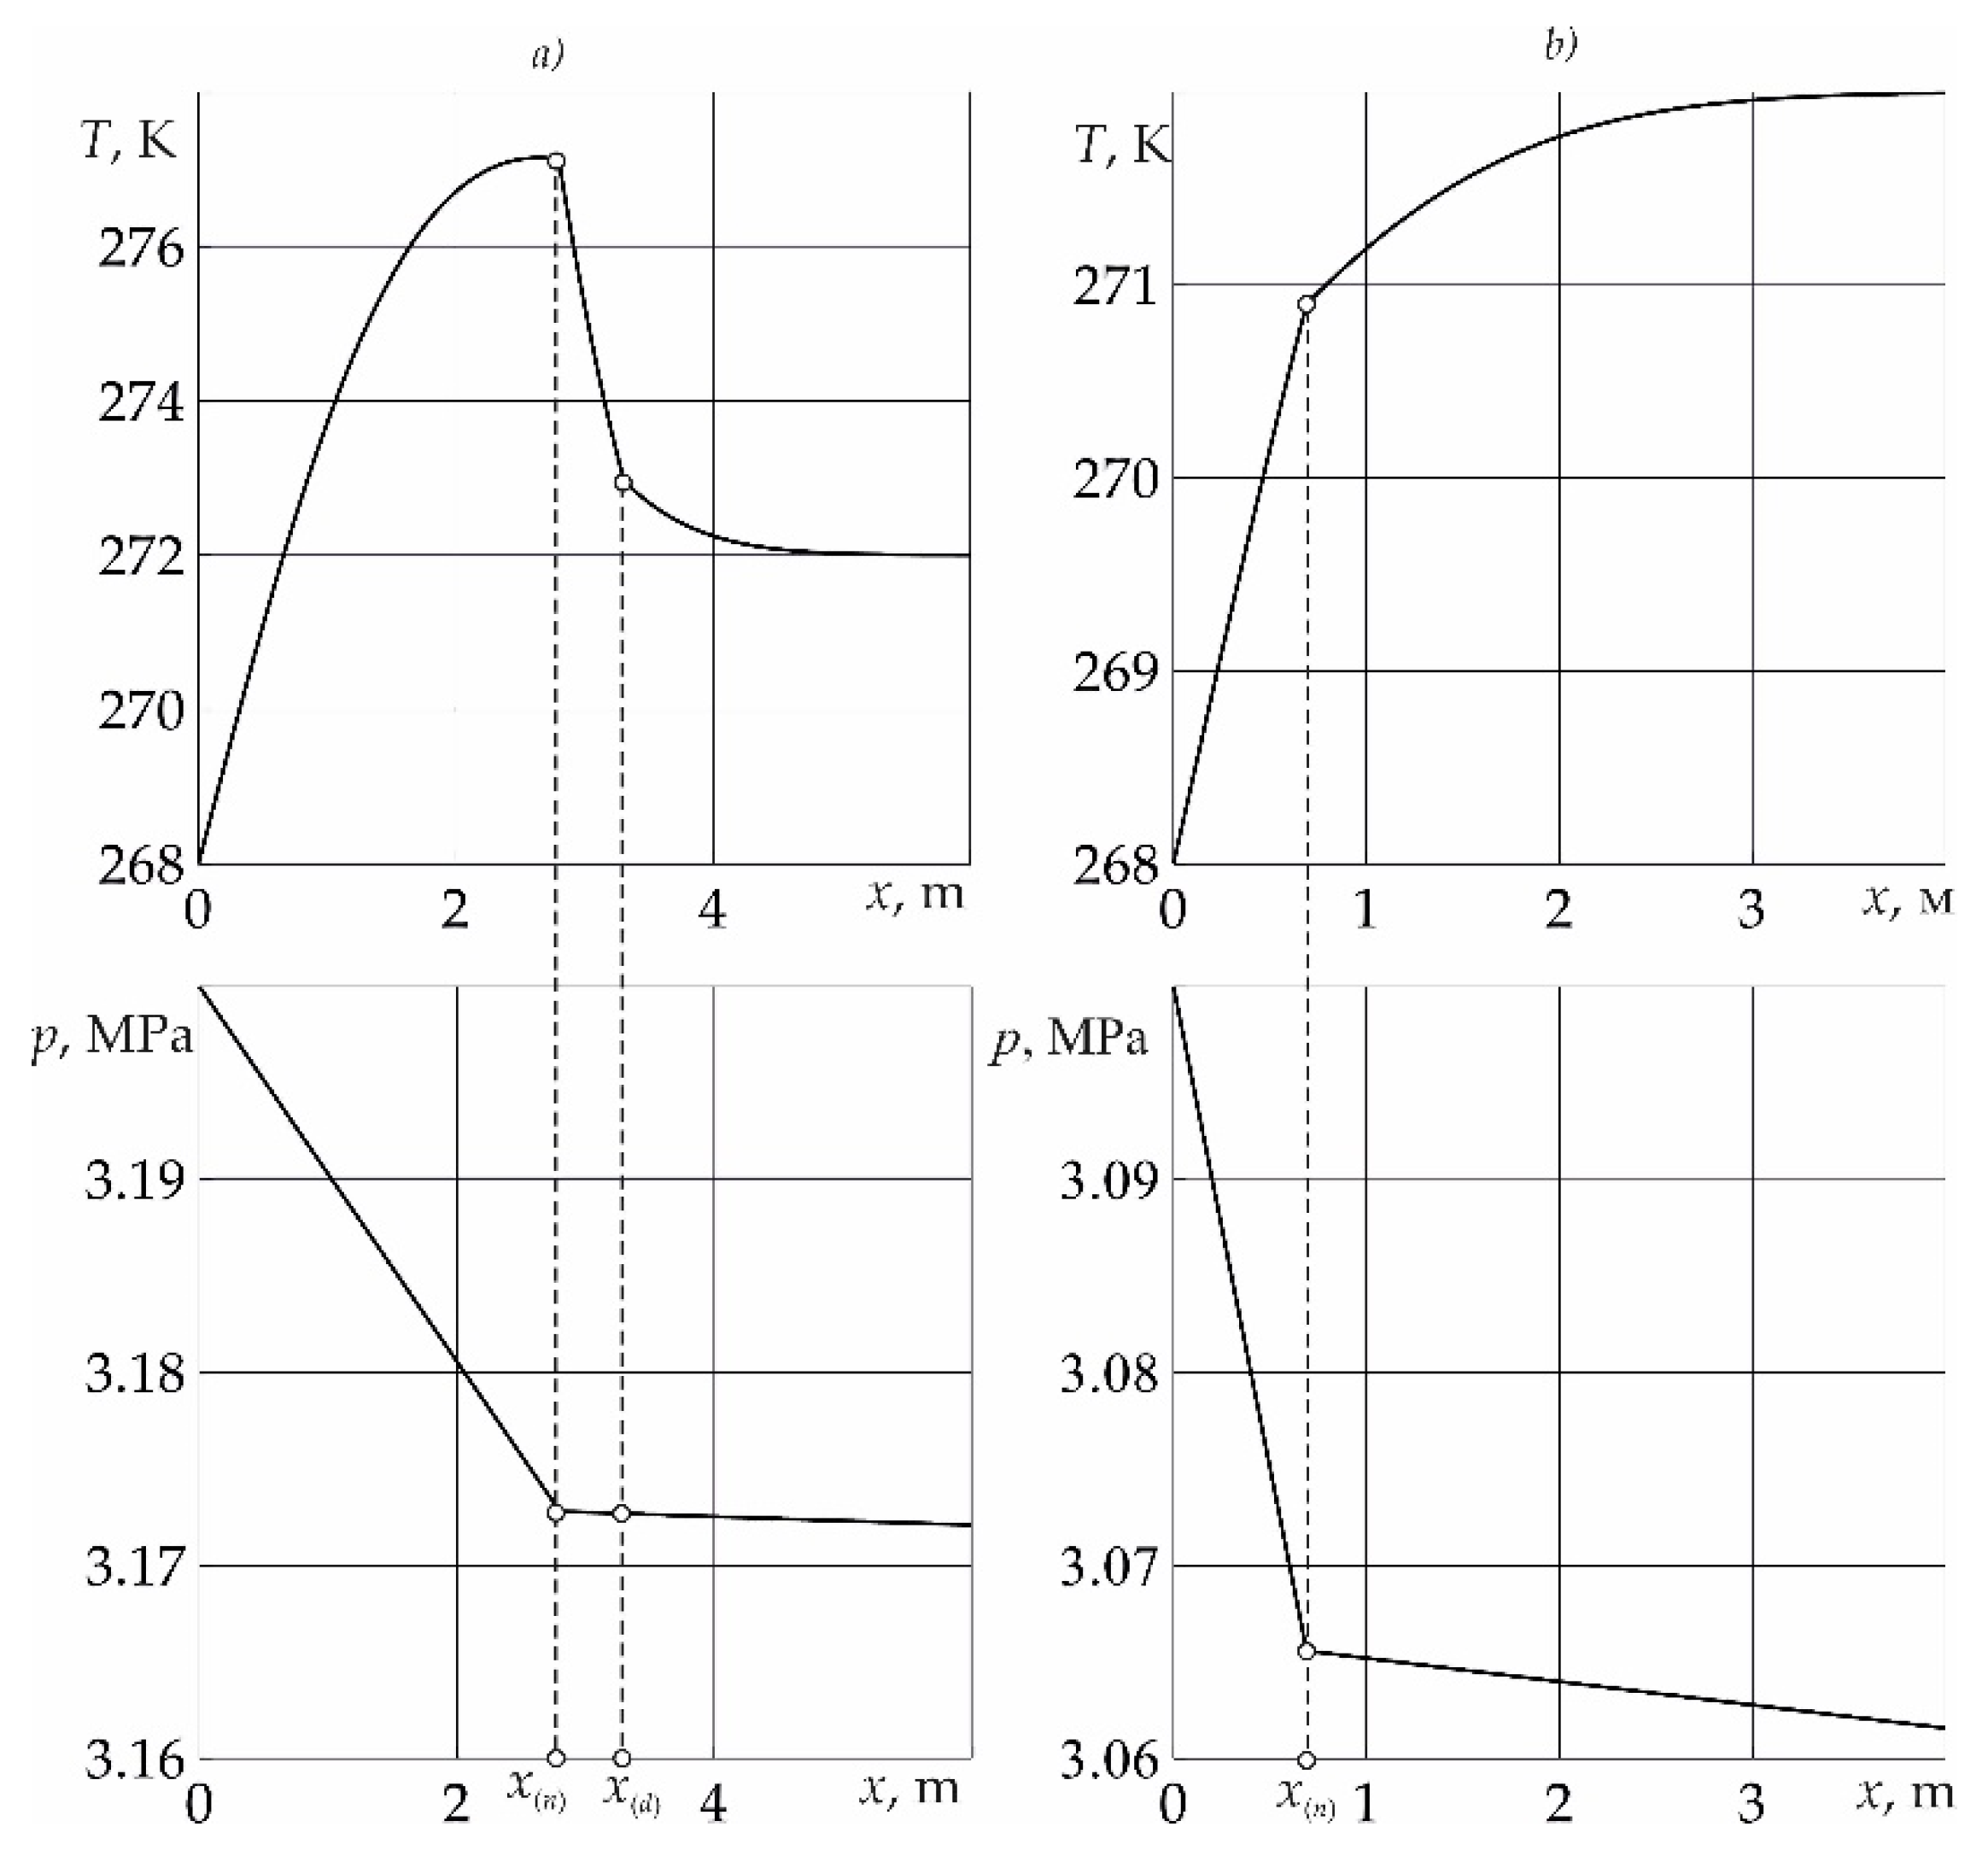
In
Figure 1 for time
t = 10 day. reservoir temperature and pressure distributions are presented. The injection pressure of liquid sulfur dioxide corresponds to the value
pe = 3.2 MPa (fragment
a) and
pe = 3.1 MPa (fragment
b). For the remaining parameters characterizing the system, the following values are taken:
L = 50 m,
ϕ = 0.2,
Sw0 = 0.2,
k0 = 10
-15 m
2,
G = 0.327,
µs = 3.68∙10
-4 Pa∙s,
µm = 10
-5 Pa∙s ,
λ = 2 W/(m∙K),
ρC = 2·10
6 J/(K·m
3),
βs = 1.35·10
-9 Pa
-1,
ρh = 1390 kg/m
3,
ρl = 1000 kg/m
3,
ρw0 = 900 kg/ m
3,
ρ0s = 1434 kg/m
3,
Cs = 1350 J/(K∙kg),
Cm = 1560 J/(K∙kg),
Lw = 3.3∙10
5 J/kg,
Lh = 2.5∙10
5 J/kg,
p0 = 3 MPa,
Te = 268 K,
T0 = 272 K. As follows from
Figure 2 and when SO
2 is injected under pressure
pe = 3.2 MPa (fragment
a), the formation of hydrate occurs according to the formulation presented in the problem with the formation of three regions. When the injection pressure decreases (fragment
b), the formation of SO
2 hydrate occurs without the formation of a region containing methane and water from sulfur dioxide and ice.
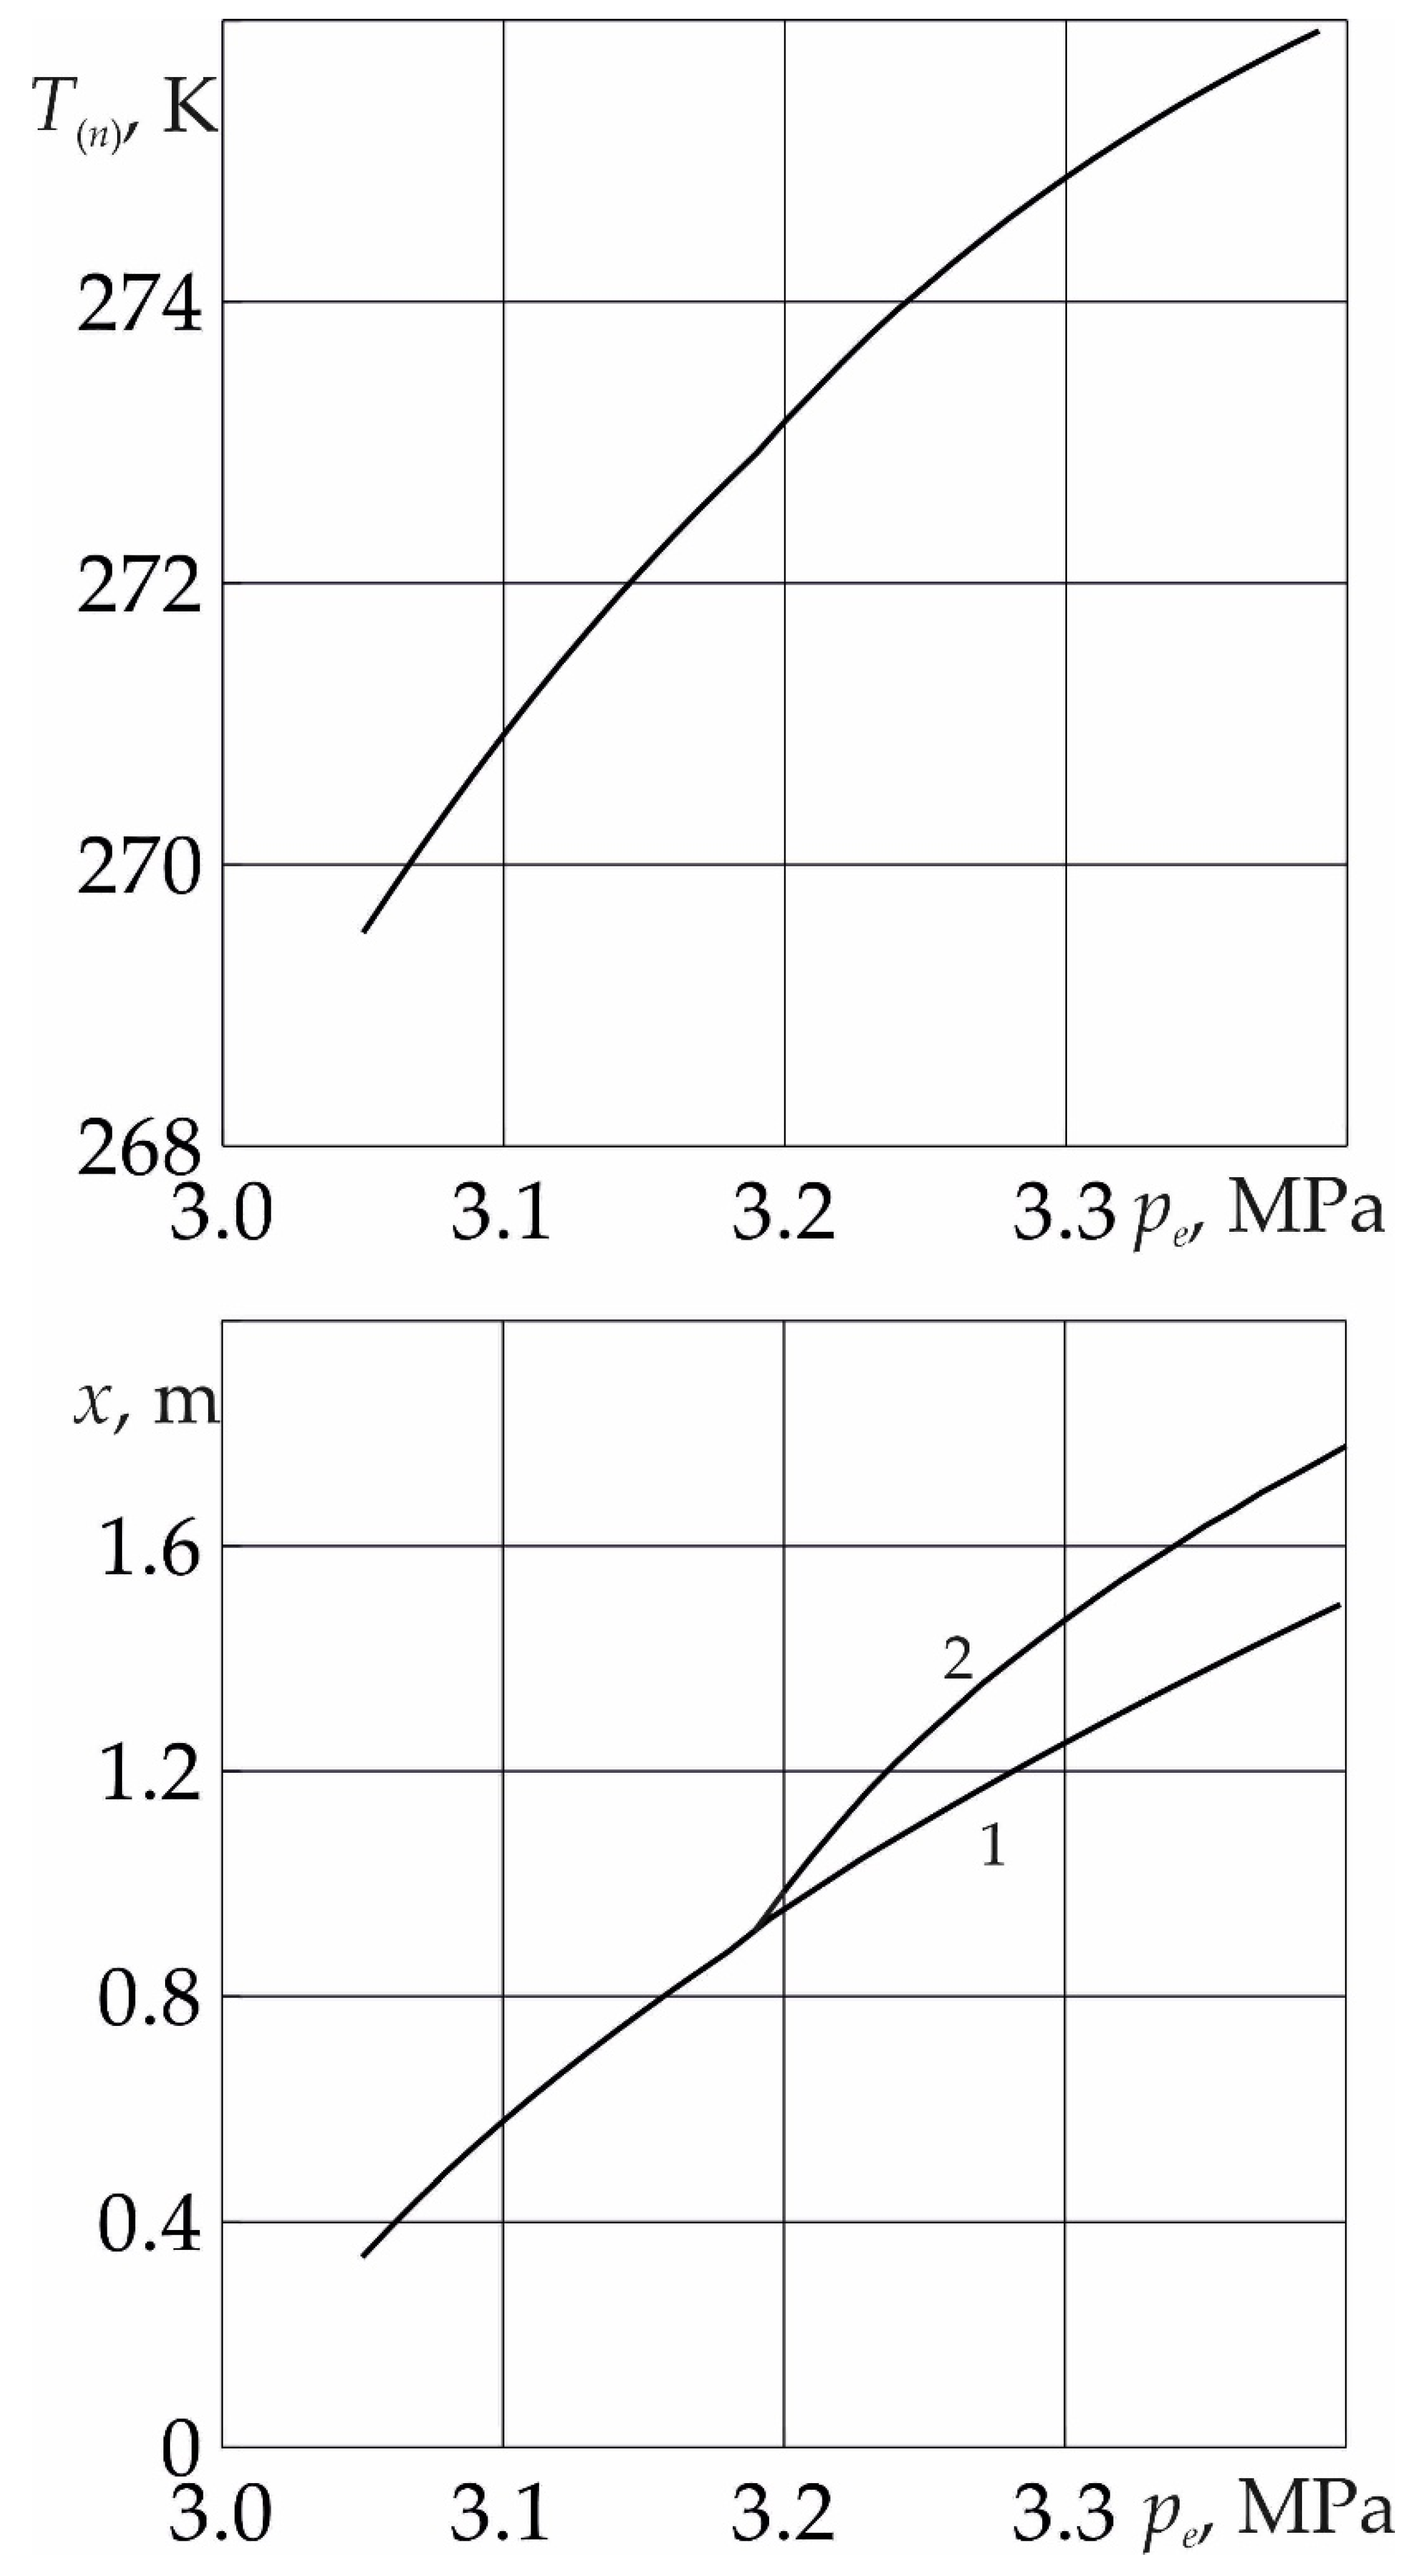
In
Figure 3. for time
t = 10 day dependences of the temperature
T(n) on the near surface of the phase transition, as well as the coordinates of the near and far boundaries of the phase transition, on the injection pressure
pe are presented. As follows from the figure, with a decrease in the injection pressure, both the temperature at the near boundary of the phase transition and the length of the region containing methane and water decrease. This is due to the fact that with a decrease in the value of
pe, the intensity of the formation of SO
2 hydrate decreases. Thus, in the case of low values of
pe, the intensity of hydrate formation is low and the temperature does not rise above the melting point of ice. In this case, the formation of sulfur dioxide occurs from ice and SO
2 without the formation of a region saturated with methane and water.
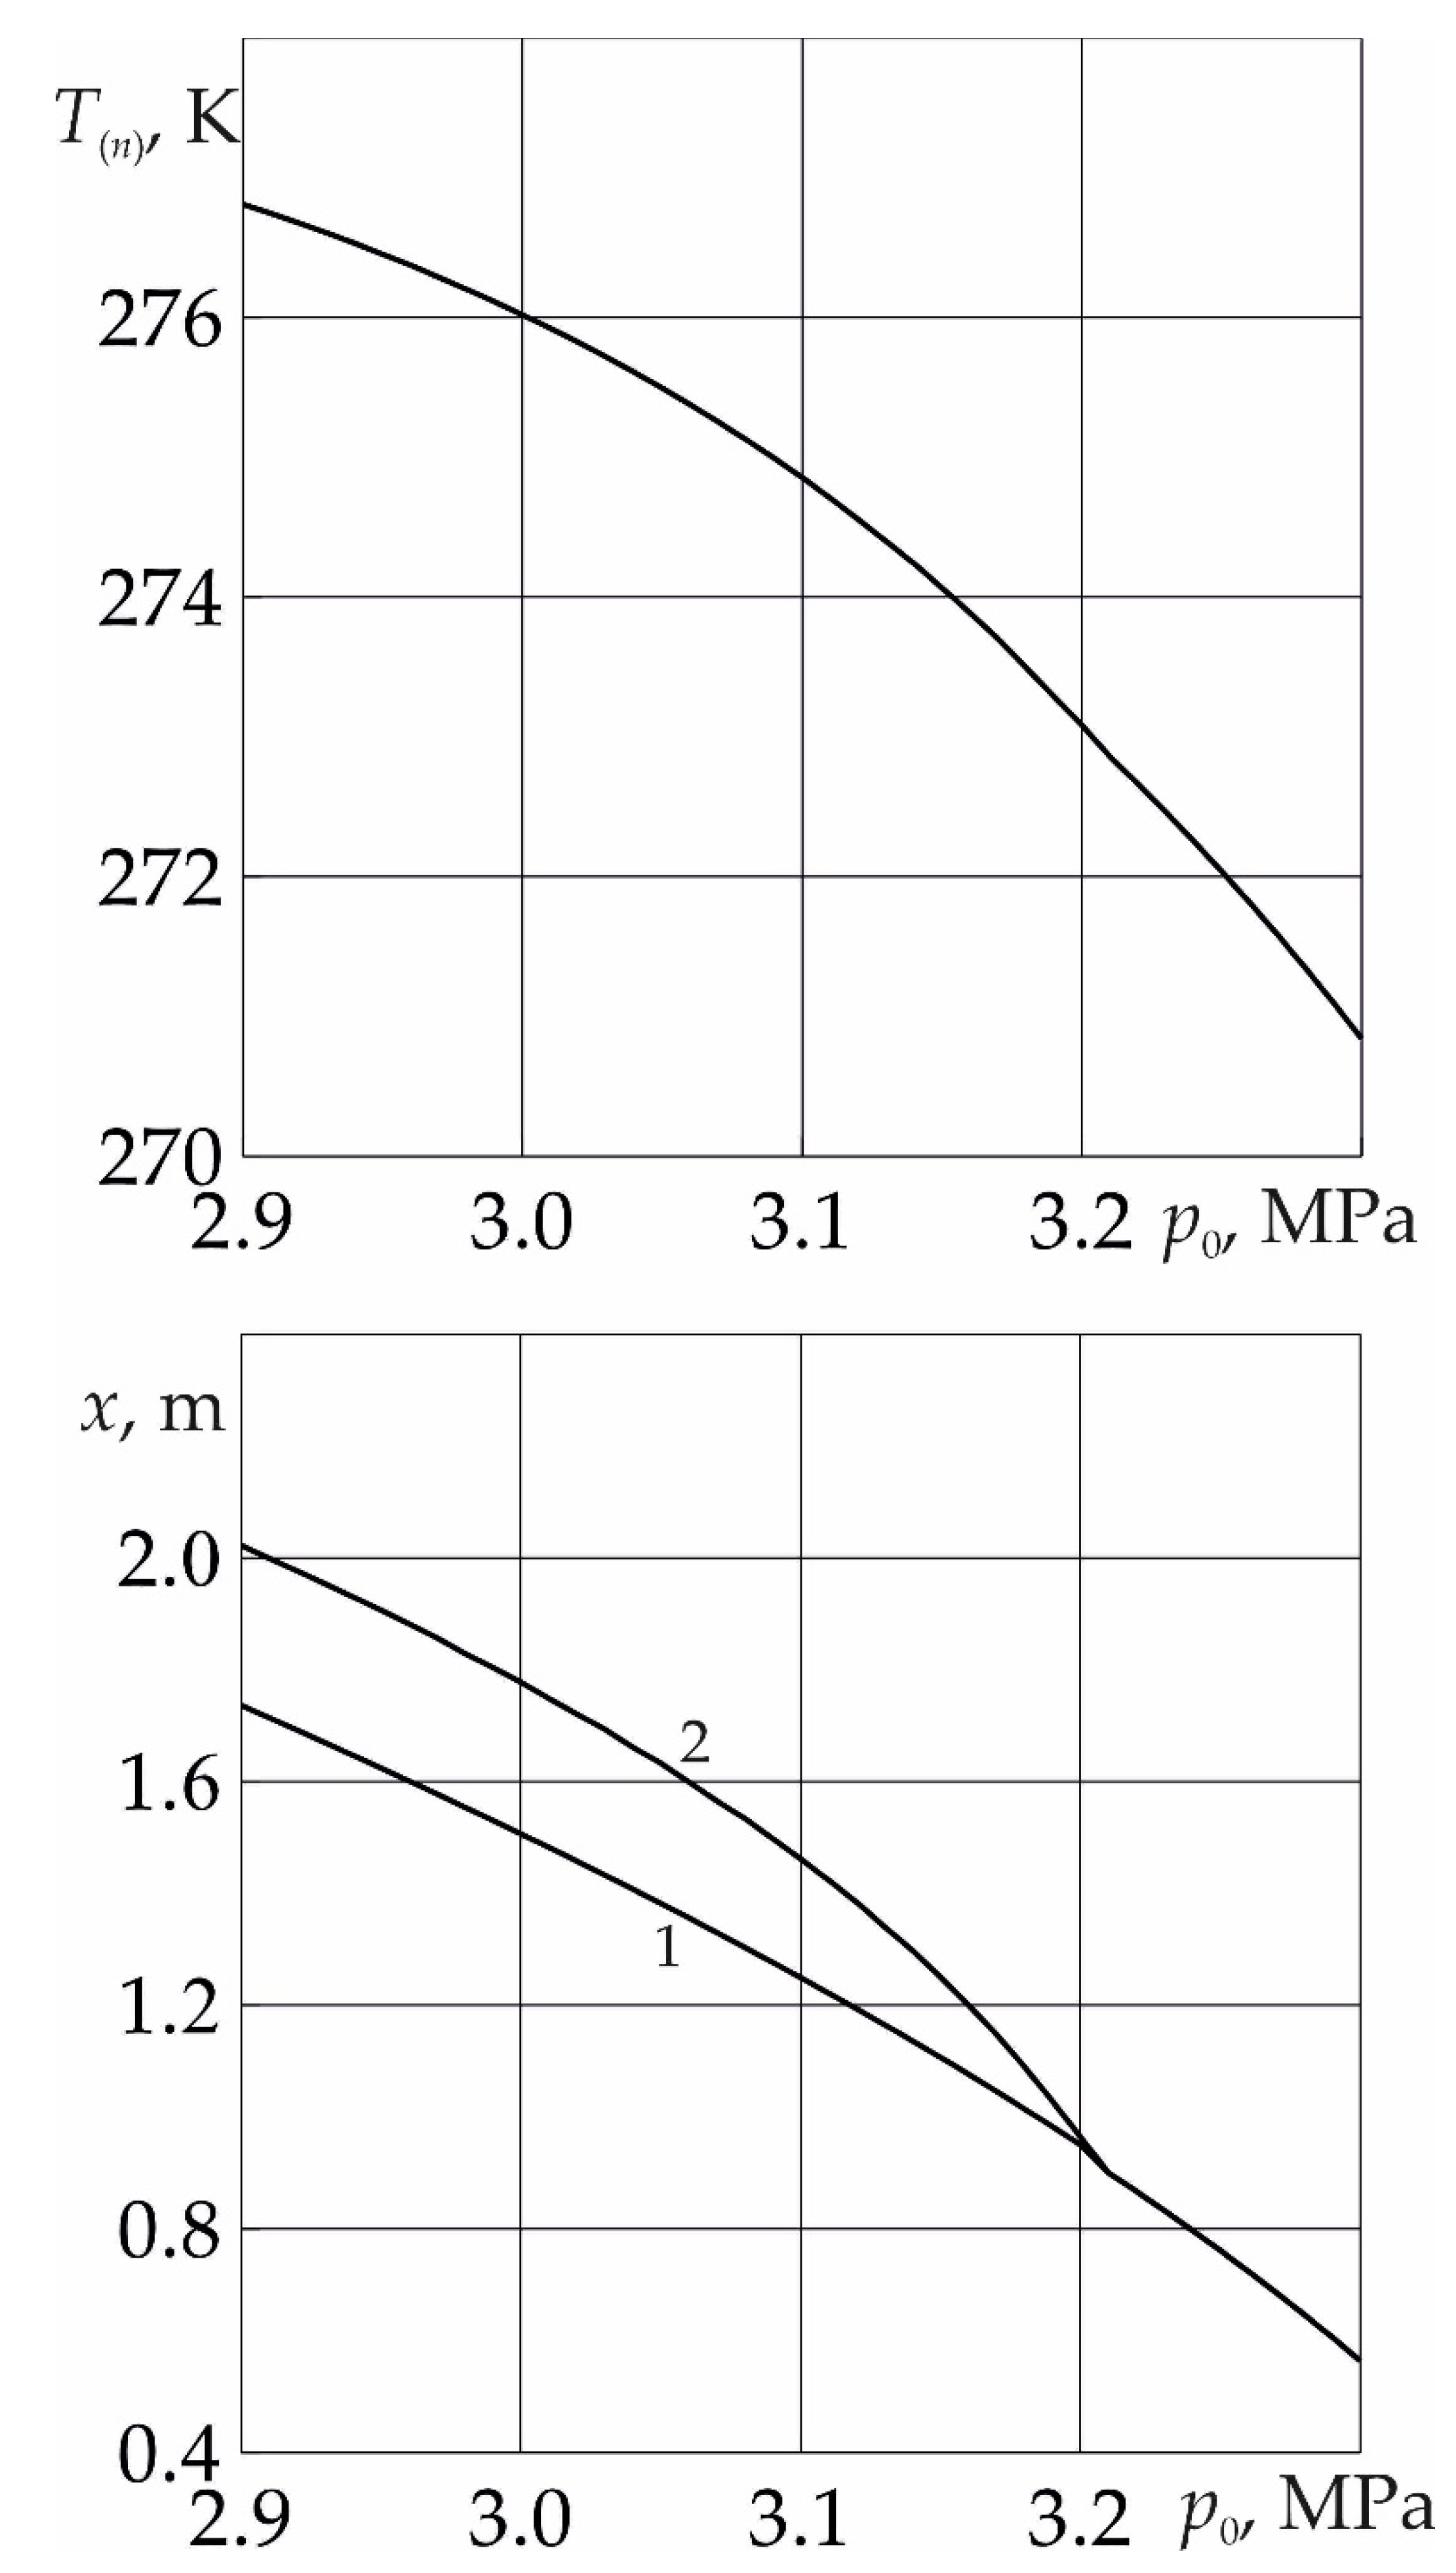
Figure 4 shows the dependences of the temperature
T(n) on the near surface of the phase transition, as well as the coordinates of the near and far boundaries of the phase transition, on the initial pressure of the system. As follows from the figure, with an increase in the initial pressure of the system, both the temperature at the near boundary of the phase transition and the length of the region containing methane and water decrease. This is explained by the fact that as
p0 increases, the pressure drop in the system decreases and, as a consequence of Darcy's law, the intensity of the phase transition decreases. Thus, at high values of
p0, the formation of SO
2 hydrate occurs from ice and sulfur dioxide without the formation of a region saturated with methane and water.
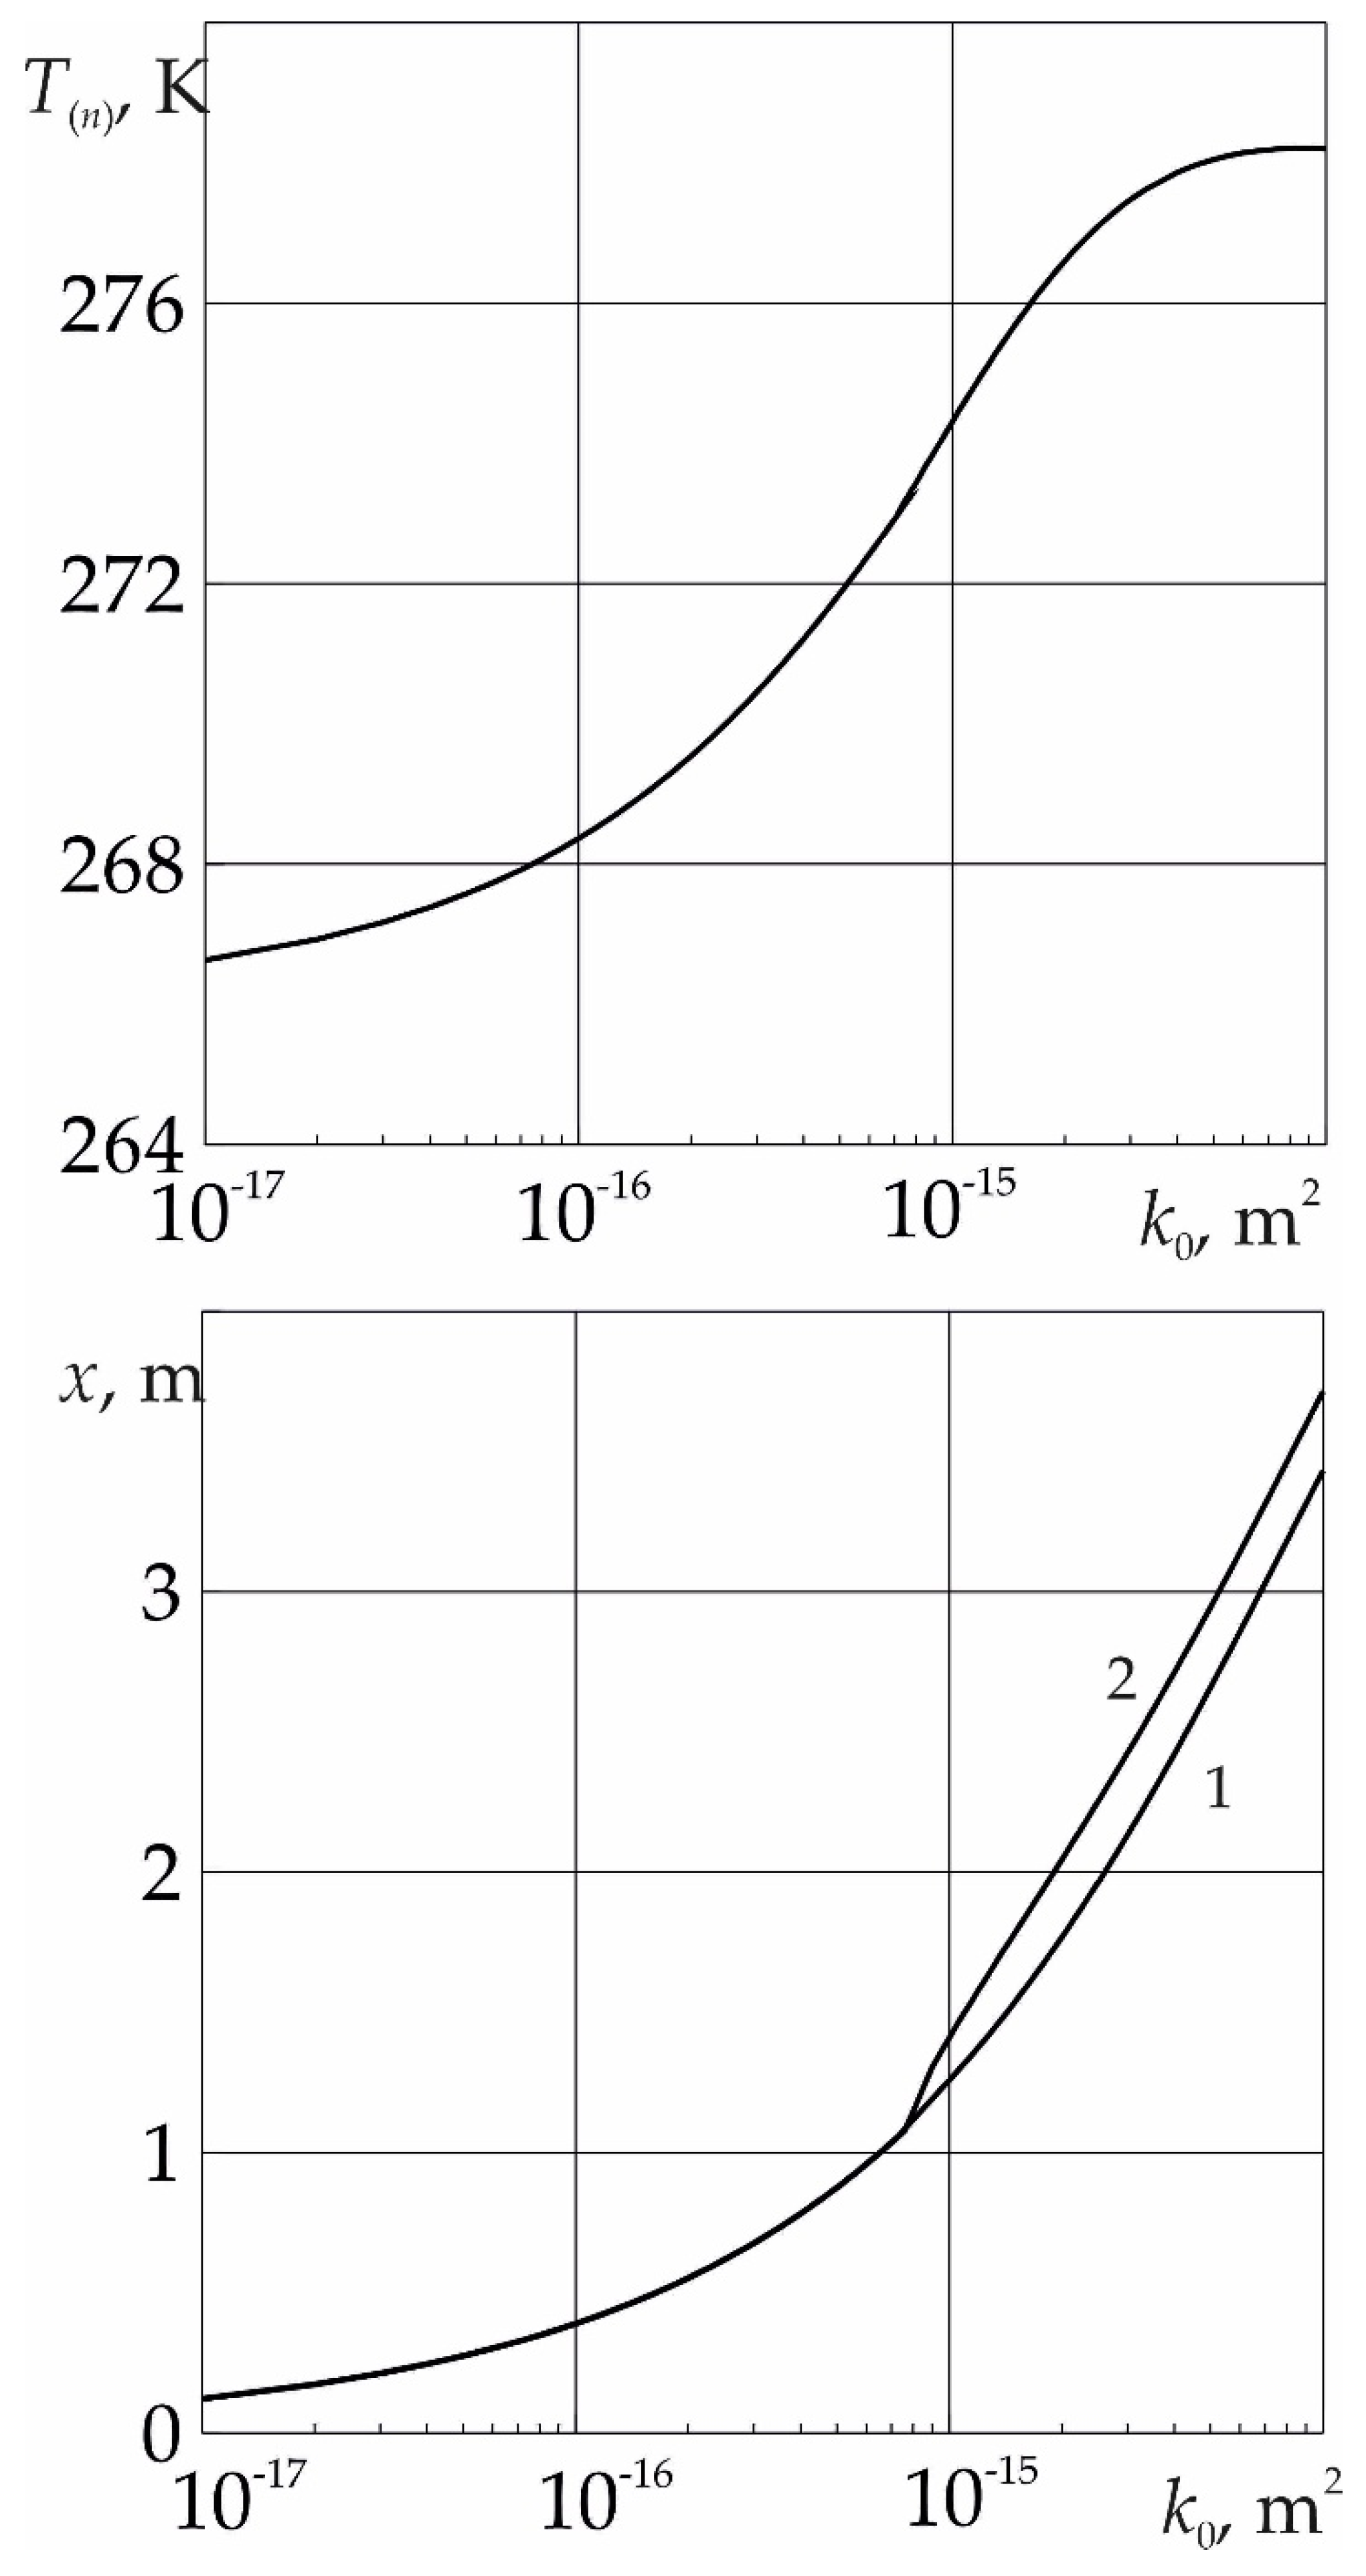
Figure 5 shows the dependences of the temperature
T(n) on the near surface of the phase transition, as well as the coordinates of the near and far boundaries of the phase transition, on the absolute permeability of the reservoir. It follows from the figure that at low values of the absolute permeability of the formation, the formation of sulfur dioxide hydrate occurs from SO
2 and ice. As the value of
k0 increases, the temperature at the phase transition boundary begins to rise. This is due to an increase in the intensity of the phase transition, which is limited by the flow of SO
2 to it and, as follows from the Darcy law, is proportional to the reservoir permeability. In this case, the temperature
T(n) can become higher than the melting point of ice. In this case, the formation of SO
2 hydrate occurs with the formation of a region saturated with methane and water.
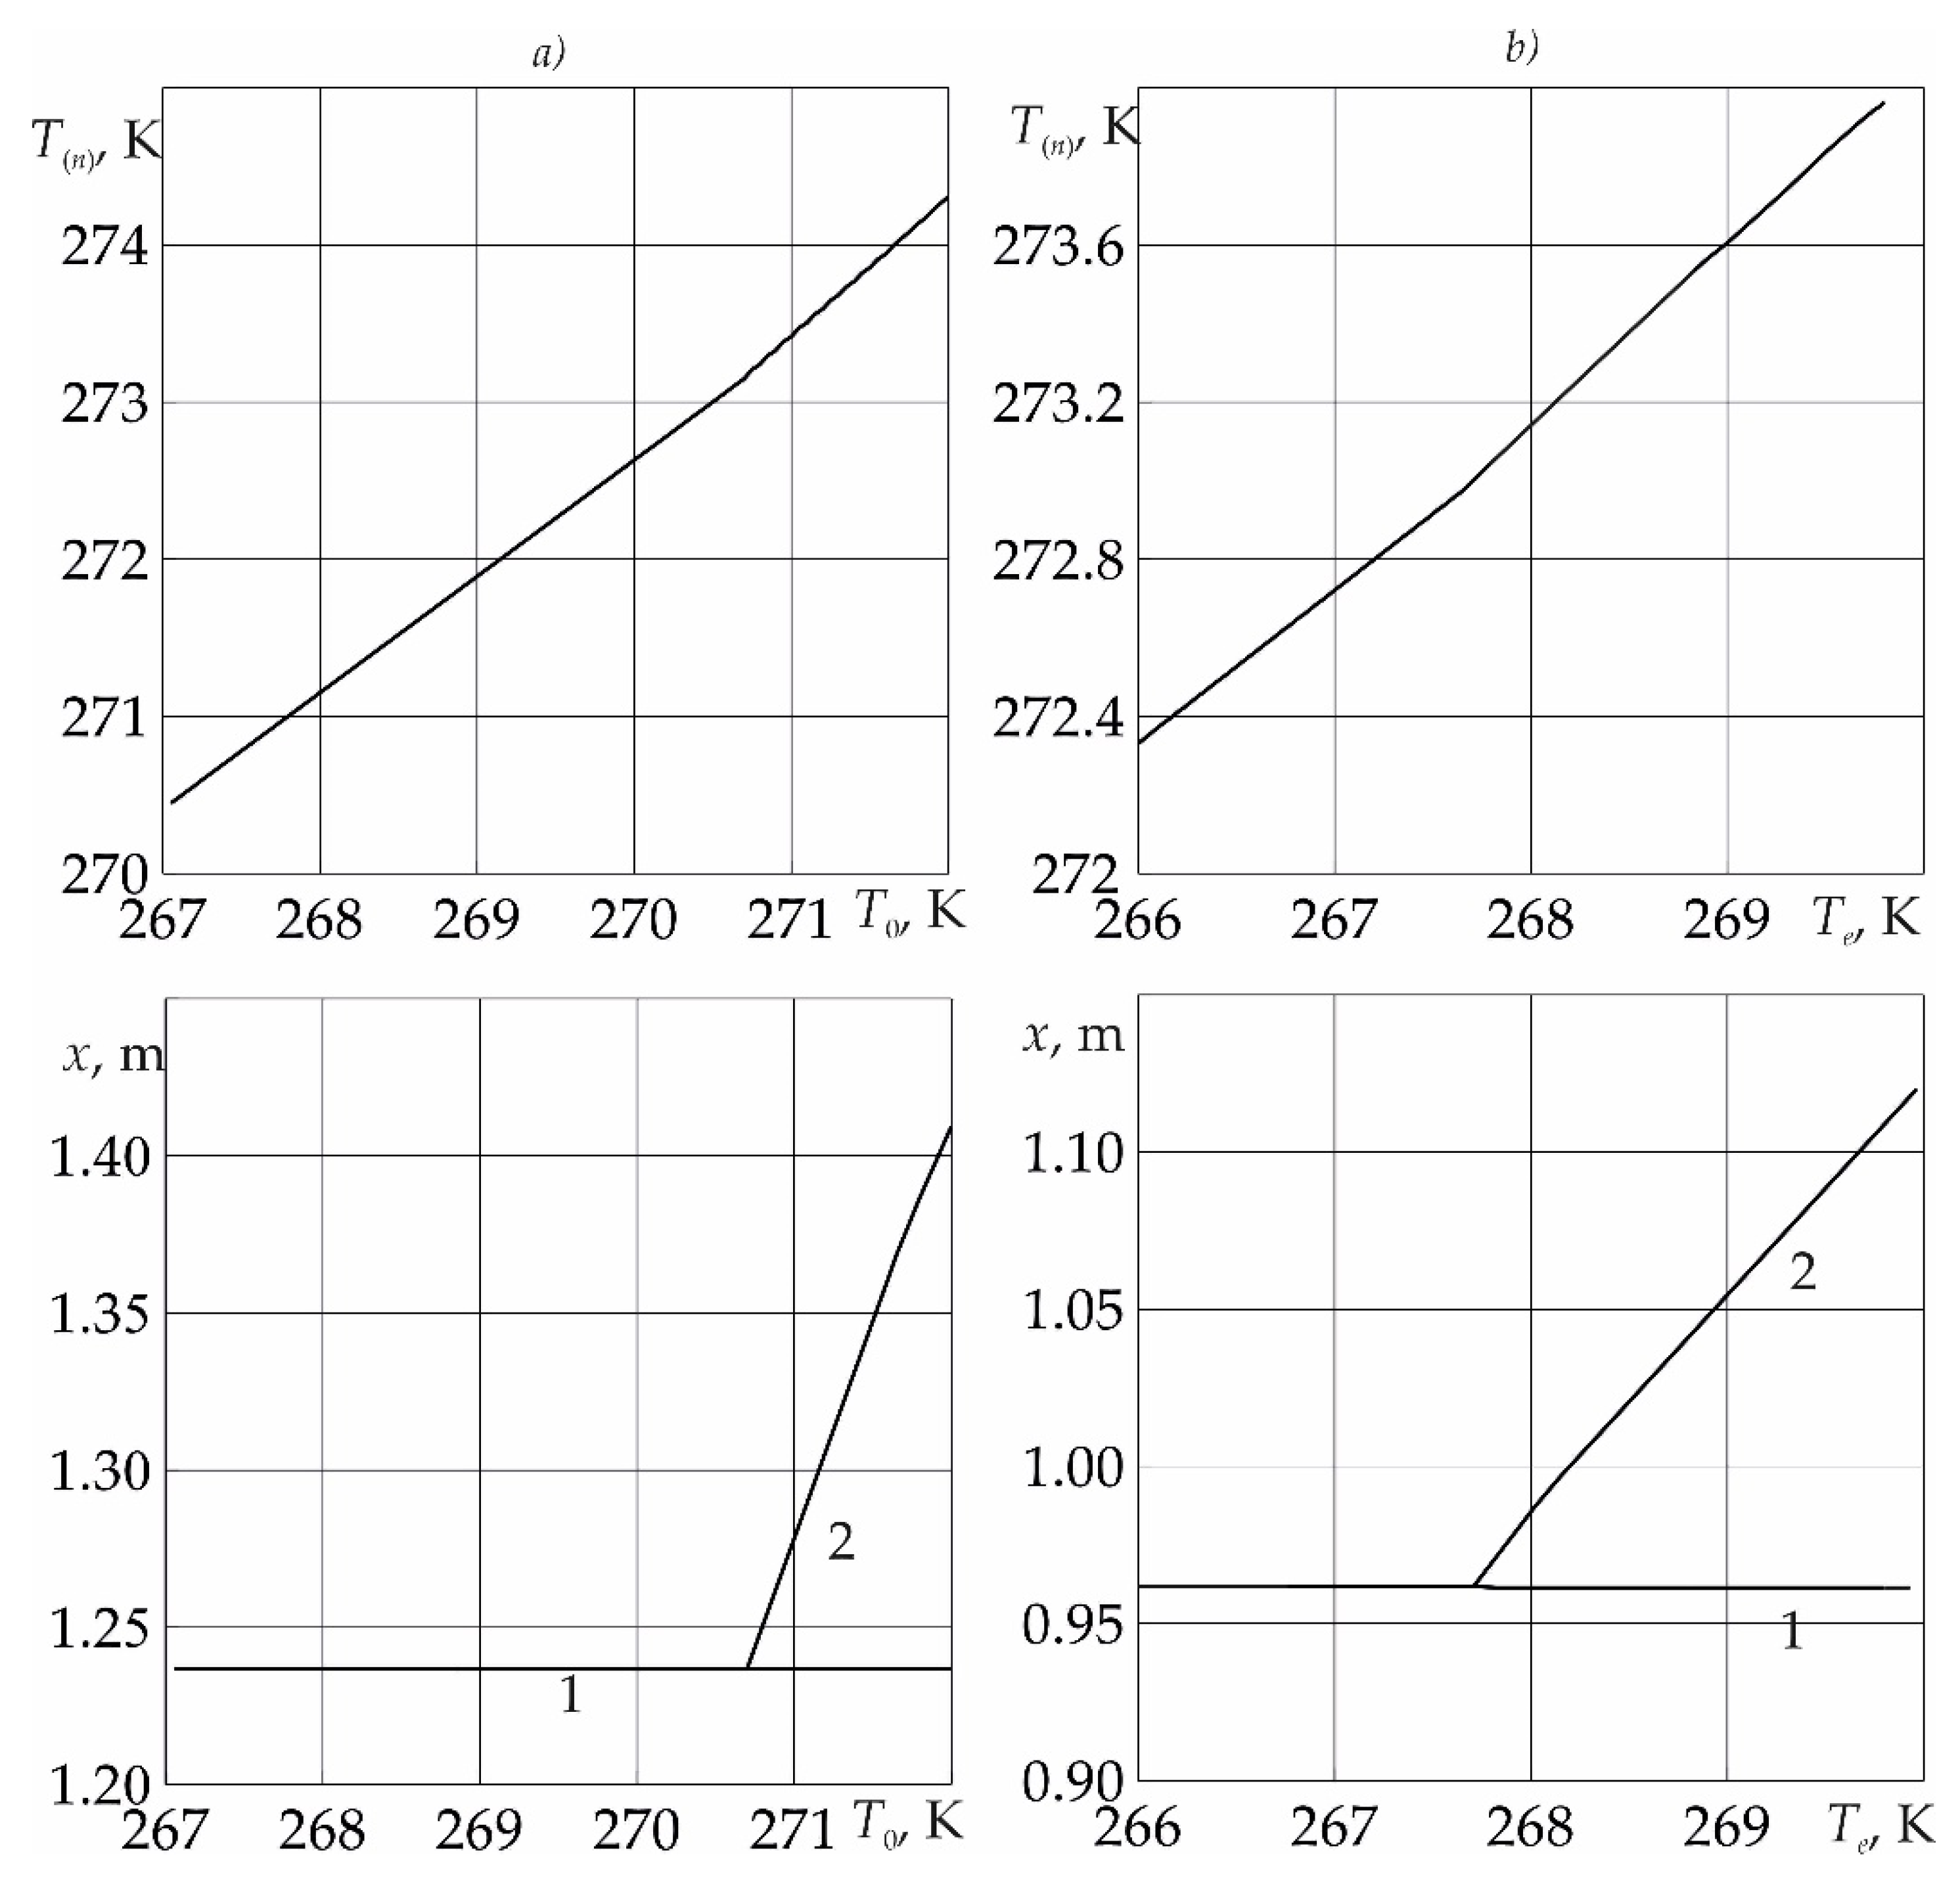
Figure 6 shows the dependences of the temperature
T(n) on the near surface of the phase transition, as well as the coordinates of the near and far boundaries of the phase transition, on the initial formation temperature (fragment
a) and injection temperature (fragment
b) of liquid sulfur dioxide. As follows from the figure, the temperature at the near boundary of the phase transition increases with an increase in both the initial reservoir temperature and the temperature of the injected sulfur dioxide. Thus, as follows from the figure, the formation of sulfur dioxide from SO
2 and water occurs at high initial formation temperature and liquid sulfur dioxide injection temperature.
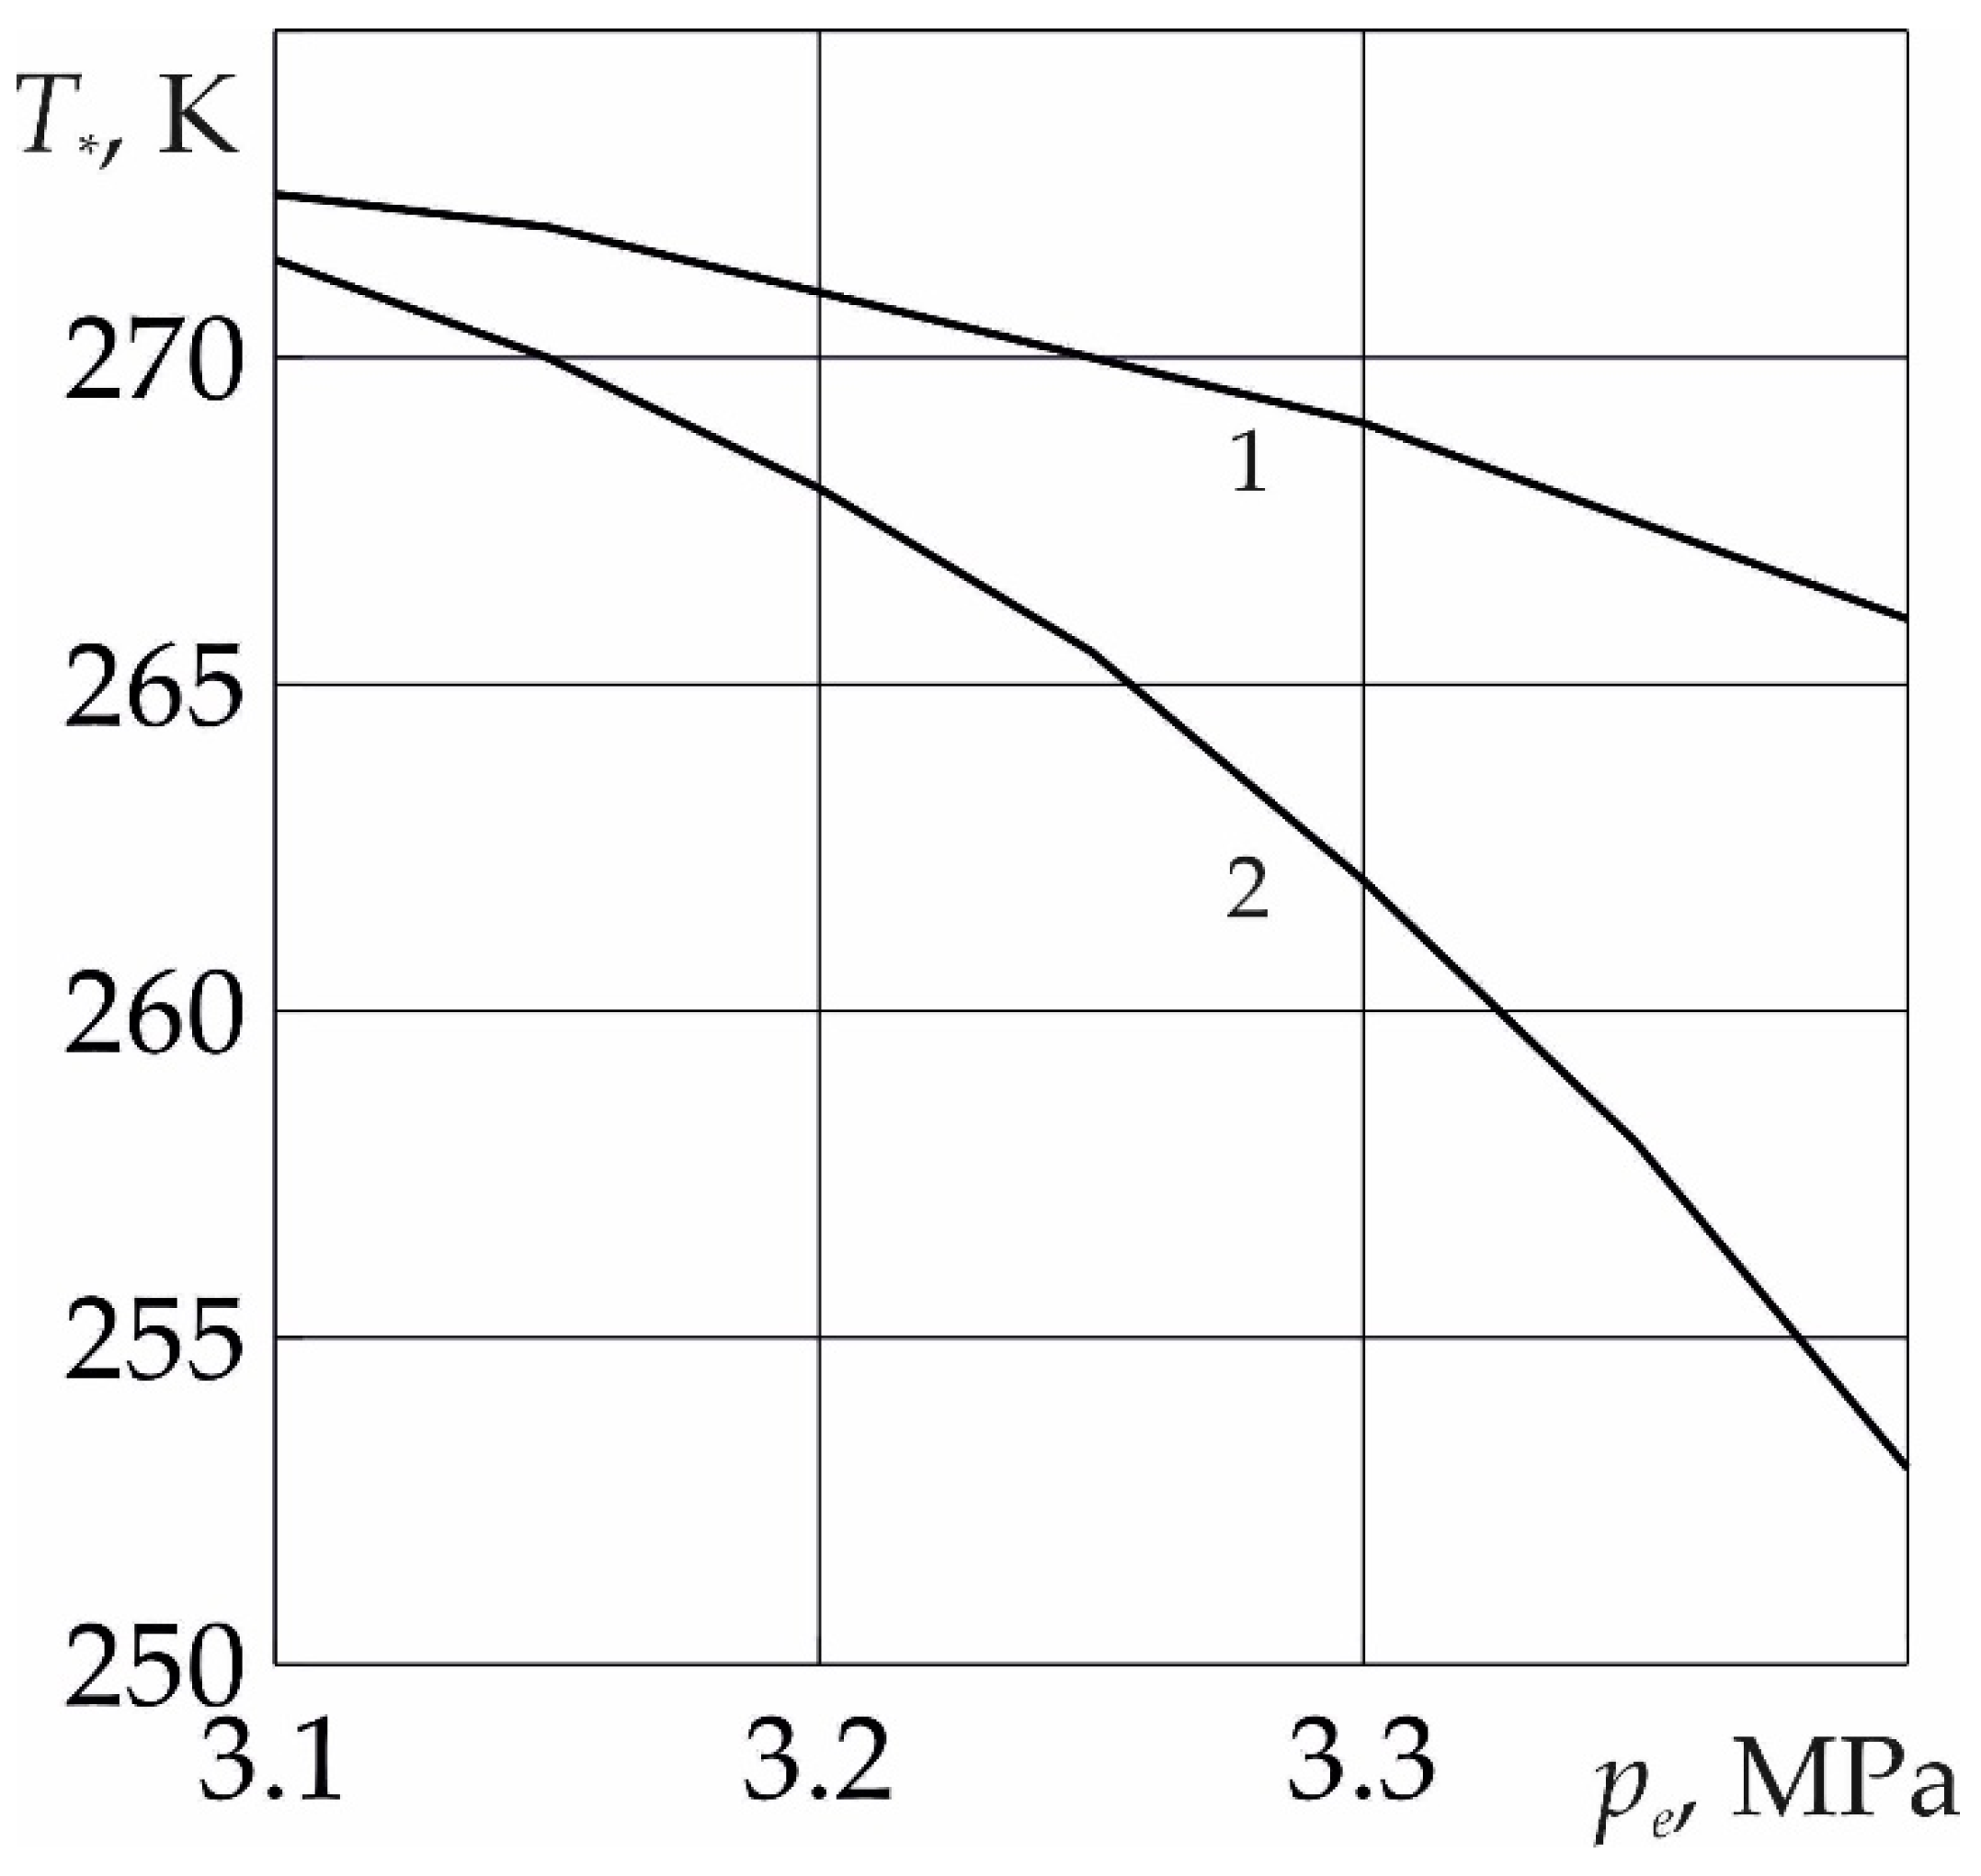
In
Figure 7 for the moment of time
t = 10 days the dependence of the critical injection temperature, below which the formation of SO
2 hydrate occurs without the formation of a region saturated with methane and water, on the injection pressure of sulfur dioxide is presented. As follows from the figure, with an increase in the value of
pe, th
e value of the critical temperature decreases. This is due to the fact that in this case the intensity of the phase transition increases; therefore, the formation of sulfur dioxide hydrate from ice and SO
2 occurs at lower temperatures. In addition, as follows from the figure, the critical temperature also depends on the formation permeability. As the reservoir permeability increases, the critical injection temperature also decreases. This is explained by the fact that an increase in the value of
k0 also leads to an increase in the intensity of the phase transition.
