Preprint
Article

Implementing an On-Slide Molecular Classification of Gastric Cancer: A Tissue Microarray Study

Altmetrics

Downloads

164

Views

62

Comments

0

Submitted:

15 June 2023

Posted:

16 June 2023

You are already at the latest version

Alerts
Abstract
Background and Objectives: Gastric cancer (GC) is one of the most commonly diagnosed cancer and the fourth cause of cancer death worldwide. Personalised treatment improves GC outcomes. A molecular classification is needed to choose the appropriate therapy. A classification that uses on-slide biomarkers and formalin-fixed and paraffin-embedded (FFPE) tissue is preferable to comprehensive genomic analysis. In 2016, Setia et al. proposed an on-slide classification, however this is not in widespread use. We propose a modification of this classification that has six subgroups: GC associated with Epstein-Barr virus (GC EBV+), GC with mismatch repair deficiency (GC dMMR), GC with epithelial-mesenchymal transformation (GC EMT), GC with functional loss of p53 due to mutation (GC p53m), CG with intact p53 (GC p53wt) and GC not otherwise specified (GC NOS). This classification also has provision for biomarkers for current or emerging targeted therapies (Her2, PD-L1 and Claudin18.2). Here we assess the implementation and feasibility of this inclusive working classification. Materials and Methods: We constructed a tissue microarray library from a cohort of 79 resection cases from FFPE tissue archives. We used a restricted panel of on-slide markers (EBER, MMR, E-cadherin, beta-catenin and p53), defined their interpretation algorithms, and assigned each case to a specific molecular subtype. Results: GC EBV(+) cases were 6%, GC dMMR cases were 20%, GC EMT cases were 14%, GC p53m cases were 23%, GC p53wt cases were 29% and GC NOS cases were 8%. Conclusions: This working classification uses markers that are widely available in Histopathology and are easy to interpret. A diagnostic subgroup is obtained for 92% of the cases. The proportion of cases in each subgroup is in keeping with other published series. Widescale implementation appears feasible. A study using endoscopic biopsies is warranted.
Keywords: 
Subject: Medicine and Pharmacology  -   Pathology and Pathobiology

1. Introduction

There are unmet needs for a large proportion of gastric cancer (GC) patients. Classification of GC into actionable diagnostic categories would result in more effective treatment [1]. NGS-based molecular classifications such as The Cancer Genome Atlas Program (TCGA) [2] and the Asian Cancer Research Group (ACRG) [3,4] are difficult to implement in the diagnostic routine.
The Boston group (Setia et al.) proposed a hierarchical classification using a small number of on-slide tests that would stratify these patients into molecular-based and clinically-actionable categories but this has not been widely adopted [5]. The Boston group and others then published a number of re-iterations of this hierarchical approach [6,7,8] but these are still not widely used. On reflection and learning from the experience of implementing similar classification for endometrial carcinoma [9,10,11], we proposed minor modifications [12], namely the inclusion of an indeterminate category, the addition of the predictive oncology biomarkers currently required for therapy selection and the provision for new biomarkers that inevitably will become mandatory [13].
Our proposed classification represents an inexpensive and effective tool that Histopathologists can use to provide prognostic information and help in the identification of personalised cancer treatment. It is likely that Histopathologists will need to deliver numerous additional predictive biomarkers in the near future. This classification will give some guidance for the prioritization of the required companion diagnostic tests.
In order to assess the strengths and weaknesses of our proposed classification, we need to understand the feasibility of delivering these tests in a diagnostic histopathology laboratory, describe the interpretation of staining for each biomarker used and the interpretative hierarchical algorithm. For this, we used a cohort of gastric cancer resection cases in a retrospective study. We constructed a tissue microarray (TMA) library from formalin-fixed and paraffin-embedded (FFPE) tissue and evaluated a number of on-slide tests in order to classify each tumour into a defined molecular subtype.

2. Materials and Methods

2.1. Patient and tissue samples

We identified a cohort of 130 consecutive patients from a single hospital (University Emergency Hospital Bucharest, Bucharest, Romania) who underwent partial or complete gastrectomy for primary GC between January 2013 and February 2020, using the original histopathology report as data source [14,15]. Each case was annotated with demographic data (age and gender), histologic subtype (according to the WHO classification 5th edition, 2019 and the Laurén type, see below), grade of differentiation, stage, presence of lymphovascular and perineurial invasion and lymph node status. All glass slides were reviewed and tumours staged using the latest edition (version eight) of The American Joint Committee on Cancer (AJCC) [16]. We could not obtain suitable well-preserved FFPE tissue or there was insufficient carcinoma left in the blocks for 51 cases, thus a total of 79 patients were included in the final study.
This study was conducted according to World Medical Association Declaration of Helsinki. All patients provided informed written consent for the use of their tissue in research. The local Bioethics Committee from University Emergency Hospital Bucharest (Bucharest, Romania) approved this study (study number 31673/01.07.2020).

2.2. Slide digitisation and viewing

Glass slides were digitised using 3D-Histech P1000 digital slide scanner with x36 primary magnification and SlideCentre v3.1. Digital slides were examined using 3D-Histech CaseViewer v2.6 on monitors with 4K resolution.

2.3. Preparation of TMA

All haematoxylin and eosin (H&E) stained tumour sections from each case were reviewed by one pathologist (SC) and a representative slide selected for each tumour. The selected H&E slides were then digitised and annotated digitally to identify two representative areas from each slide. TMAs were prepared using a 3D-Histech TMA-Grandmaster with digital recognition of the annotated areas and automatic matching of the corresponding FFPE tissue block. TMA templates had 32 tumour cores; for orientation we used two reference cores of liver tissue and an empty space. Each tumour was sampled in duplicate. Cores of tissue 1.5mm in diameter were drilled out of the donor FFPE blocks and a total of five TMA blocks were obtained. H&E-stained sections from the TMA blocks were then compared with the original H&E sections to validate the TMA library.

2.4. On-slide biomarkers

FFPE sections from each TMA were cut at 3µm and transferred on coated slides (TOMO, Matsunami, Japan), together with the relevant on-slide controls. They were stained using validated protocols in automated stainers. See Table 1 for a list and protocols of the biomarkers used. For Her2 IHC UltraView DAB detection system was used.

2.5. Evaluation of ISH and IHC staining

Digital pathology (DP) was used to assess all the stained TMA sections (H&E and all biomarkers). The TMAs contained duplicate cores for each case. Cases were assessed as a whole and, where appropriate, findings in duplicate cores were averaged. Where one of the cores was not assessable, only one core was used; when neither of the cores were assessable, the test was scored as “indeterminate”. The IHC and ISH stained TMAs cores were scored independently by two pathologists (S.C. and C.D.). Discrepancies were reviewed, discussed and consensus reached. All biomarkers were assessed on invasive carcinoma tissue; in situ carcinoma was excluded from the assessment.
EBER positivity was assessed by presence of nuclear staining in tumour cells (TC) [17]; absence of chromogen in the nucleus of TC was defined as negative staining. Cytoplasmic staining, if present at all, was not taken into consideration.
Nuclear staining in TC was used to assess MMR status. Diffuse absence of nuclear staining in TC in the presence of staining in internal controls (stromal cells, normal glands and inflammatory cells) was regarded as evidence of MMR deficiency [18].
E-cad and β-cat were assessed jointly. Strong circumferential membrane staining in TC was considered normal expression. Weak, discontinuous or absent membrane staining as well as granular cytoplasmic staining or nuclear staining in at least one of these markers was regarded as aberrant expression [19,20].
P53 was assessed in TC according to Köbel et al [21]. Briefly, p53 mutation (p53m) was attributed to the three abnormal staining patterns: presence of strong and diffuse nuclear staining in at least 80% of TC (overexpression), diffuse cytoplasmic staining with or without nuclear staining and diffuse lack of nuclear staining (complete absence). Conversely, p53 normal/wild type (p53wt) expression was characterized by nuclear staining of variable intensity admixed with TC lacking nuclear staining.
Her2 was interpreted in line with Hofmann et al [22] and Rüschoff et al [23] and refers to presence of HER2 gene amplification. This algorithm has been adopted by the College of American Pathology (CAP) and Food and Drug Administration (FDA) [24]. The magnification rule was used to assess intensity of membrane staining [25]. Accordingly, a positive result (3+ IHC score) was given if circumferential, basolateral or lateral membrane staining of strong intensity was discernable in ≥5 clustered TC. An equivocal result (2+ IHC score) was given if the tumour cells showed circumferential, basolateral or lateral membrane staining of weak to moderate intensity in ≥5 clustered TC. A negative result (0/1+ IHC score) was given for tumours with no staining, or very weak segmental/granular membrane staining, irrespective of the number of TC stained.
PD-L1 was evaluated using the combined positive score (CPS) as described in the 22C3 Agilent/Dako pharmDx interpretation guidelines and in the work of Kulangara and colleagues [26]. In CPS, both TC and immune cells (IC) are scored. For TC, only membrane staining of any intensity is included while for IC both membrane and cytoplasmic staining is included. Arbitrarily, a threshold for positivity of CPS= 5 was used; a carcinoma was regarded as positive for PD-L1 if CPS≥ 5 and negative if CPS< 5.
Claudin18.2 (CLDN18.2) was assessed by determining the proportion of TC that showed any amount (partial or complete) of membrane staining of strong or moderate intensity (determined using the magnification rule).

2.6. Identification of the molecular subtypes using a hierarchical approach

Tumours were given one of six diagnostic categories using a hierarchical approach similar to that used by the WHO classification for endometrial carcinoma [11] and by others who devised on-slide molecular classifications for GC [5,6,7,8]. This is described in details in Costache et al (in press) [12] and summarised in Figure 1. First the EBER status was considered and, if positive, the case was classified as GC EBV(+); all GC EBER negative cases were then evaluated for MMR status and, if MMR-deficient, were classified as GC dMMR. All GC MMR proficient (pMMR) and EBER(-) cases were then screened for E-cad and ß-cat expression and, if this was aberrant, they were classified as GC with epithelial-mesenchymal transformation (EMT). Following this, all tumours with preserved E-cad and ß-cat expression, pMMR and EBER(-) were assessed for p53 status; those showing p53m pattern were classified as GC p53m, while those with wild type staining pattern were classified as GC p53wt.
With this hierarchical approach, once a tumour is assigned to a molecular subgroup, there is no need for the other biomarkers to be assessed; if the next necessary biomarker cannot be interpreted (indeterminate result), the case is classified as GC NOS (indeterminate).

2.7. Assessment of Laurén type

Laurén type was determined on the whole sections and on the TMAs using the two tiers system (intestinal and diffuse), according to Laurén [15]. The third category of "unclassified" from Laurén was later divided by Carnero and colleagues into solid type and mixed type [27]. We classified the solid tumours as intestinal and the mixed tumours according to the majority component. Mucinous (colloid) carcinoma was included in the intestinal type if formation of glands or trabeculae was present, or in the diffuse type, if only single cell pattern was present [15,27].

3. Results

3.1. Cohort description

In our cohort of 79 patients, 66% were male and aged between 42 and 83 years (median age 65.5 years) and 34% were females and aged between 47 and 83 years (median age 67 years). The predominant Laurén subtype was intestinal (75%). The WHO classification [14] recognises five main histological subtypes of gastric adenocarcinoma: tubular, papillary, poorly cohesive (including signet ring), mucinous and mixed. In our series, the most common histological subtypes was tubular and papillary (together 44%), followed by poorly cohesive carcinoma (25%), mixed carcinoma (20%) and mucinous (7.5%). Using the two tier system for tumour grading [14], 75% of our cohort had high grade (poorly differentiated) and 25% had low grade (moderate and well differentiated).
Regarding staging, most tumours were pT3, invading the subserosal space (60%), followed by pT4 (34%), pT2 (5%) and pT1 (1%). The most common regional lymph node stage was pN2 and pN3 (each 31%), followed by pN0 (19%) and pN1 (17%). The greatest majority of cases (94%) showed carcinoma within vessels (lymphatics and/or veins) and 84% of cases had perineurial infiltration.

3.2. Molecular classification

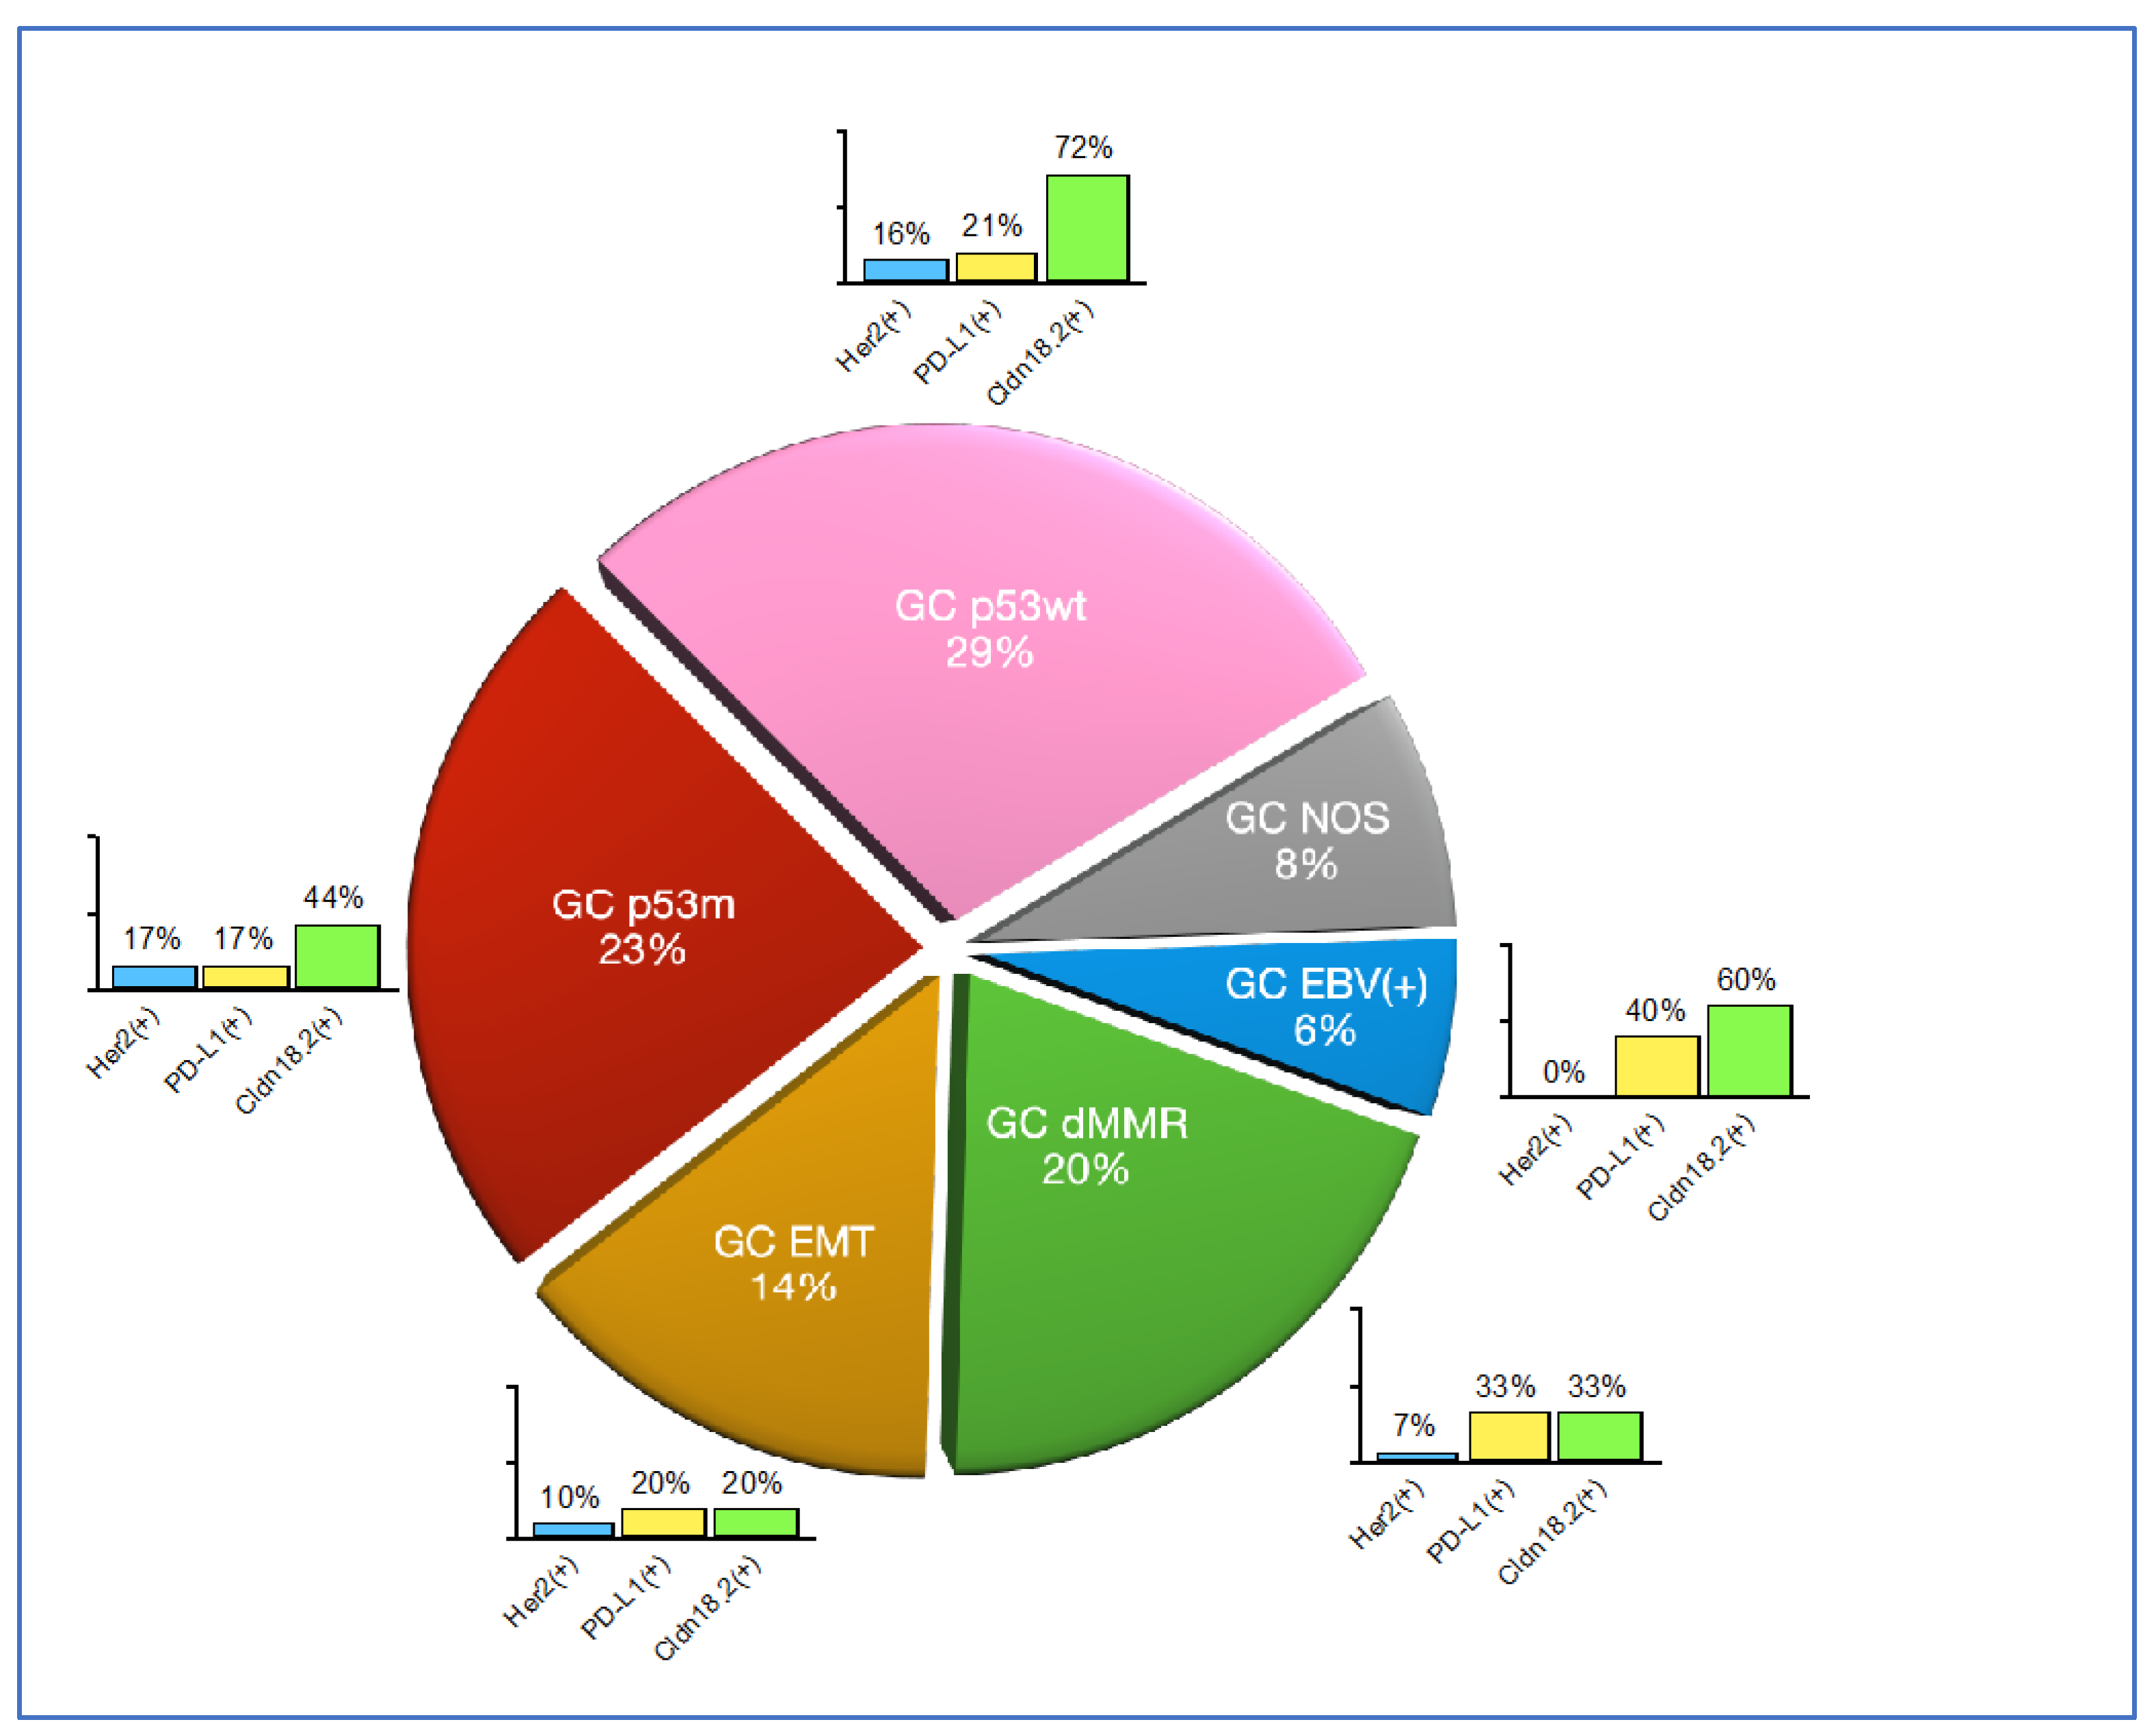
There were five cases (6%) of GC EBV(+), 16 cases (20%) of GC dMMR, 11 cases (14%) of GC EMT, 18 cases (23%) of GC p53m, 23 cases (29%) of GC p53wt and six cases (8%) of GC NOS. Overall, 10 cases had at least one indeterminate test but only six cases fell into the GC NOS category, as the classification of the other four cases was unaffected. All indeterminate tests (and by extension, diagnoses of GC NOS) were due either to TMA block failure at microtomy or loss of tissue during staining. Laurén intestinal type was prevalent (≥80%) amongst all molecular subtypes except for the GC EMT (9%). These results are summarised in Table 2.

3.3. Companion diagnostic predictive biomarkers

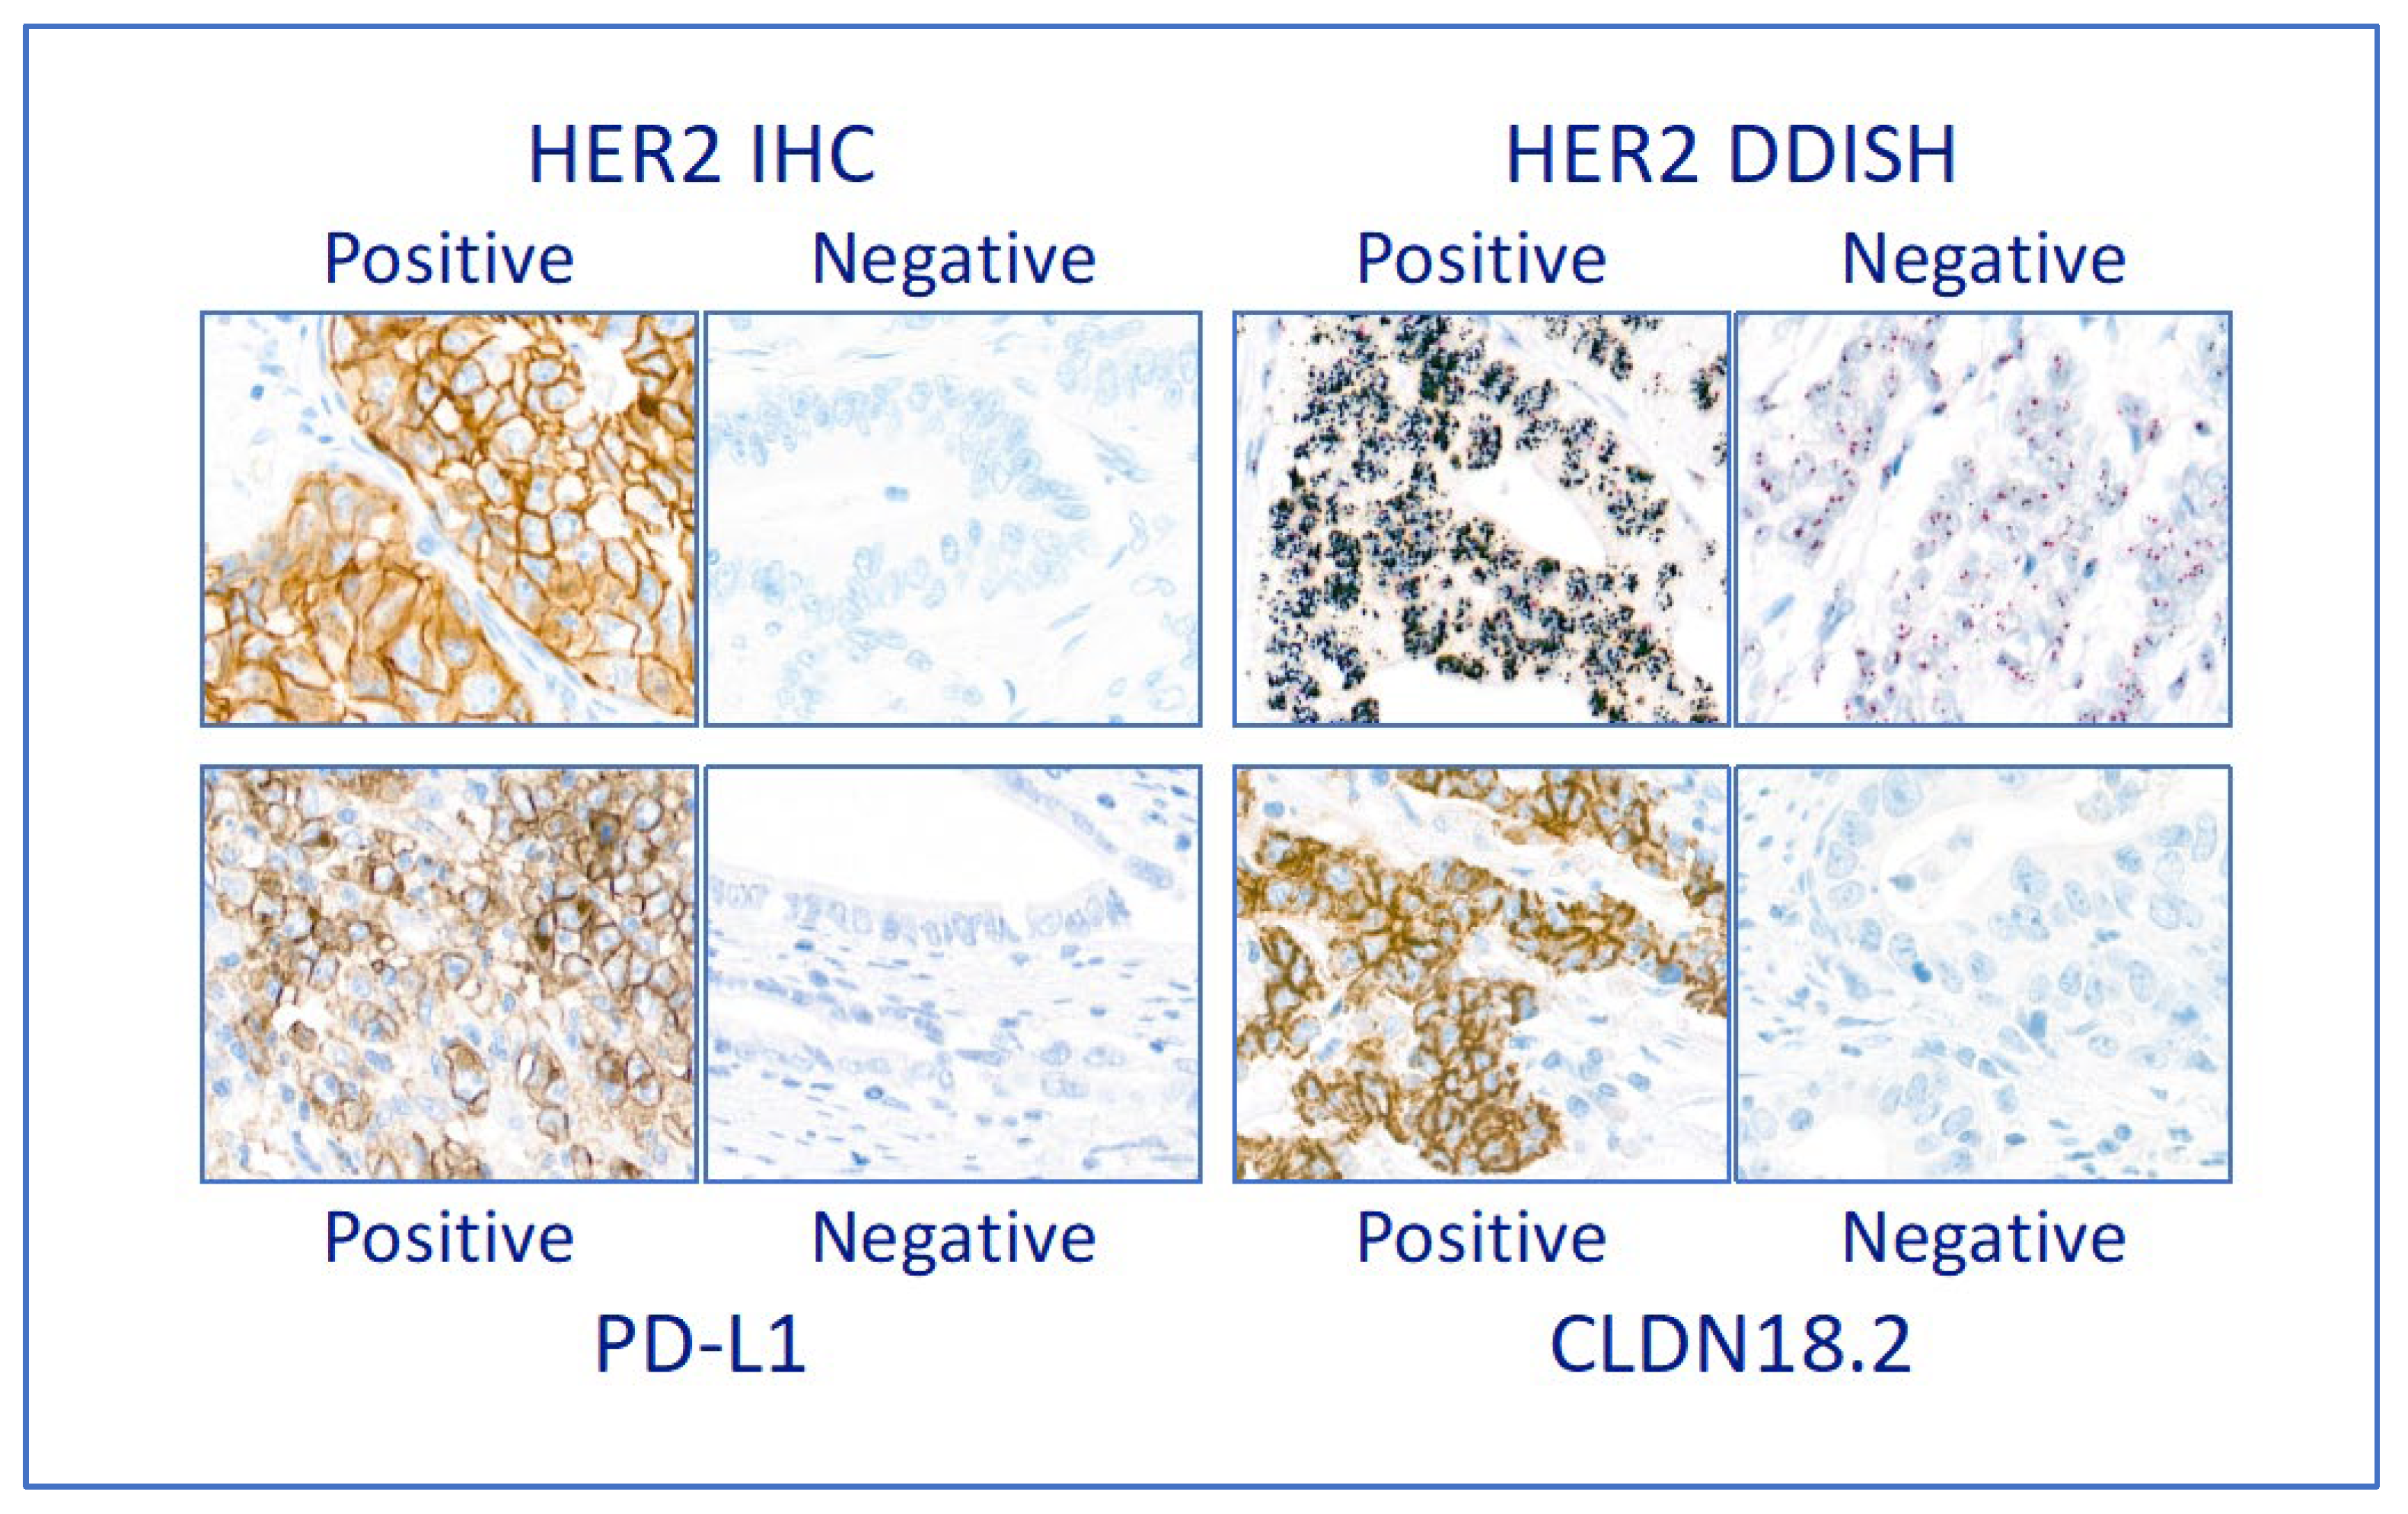
We assessed three predictive biomarkers: Her2, PD-L1 and claudin 18.2. Examples of positive and negative cases are in Figure 2.
The Her2 status could not be determined in six cases (8%) due to TMA failure. There were four cases (5%) Her2 positive on IHC (3+) and four (5%) Her2 equivocal on IHC (2+); DDISH studies on these four equivocal cases showed that all have HER2 gene amplification with numerous large amplification clusters throughout and therefore were classified as Her2 positive. All the Her2 positive cases were of Laurén intestinal type. They were distributed amongst GC dMMR (1 case), GC EMT (1 case), GC p53m (3 cases) and GC p53wt (3 cases) and there were none amongst the GC EBV(+) and GC NOS.
The PD-L1 status could not be determined in six cases (8%) due to TMA failure; these were the same cases where the Her2 status could not be determined. We found 16 cases (22%) positive for PD-L1 (CPS ≥5), with highest prevalence amongst the GC EBV(+) (40%) and the GC dMMR (33%), followed by GC p53wt (21%), GC EMT (20%) and GC p53m (17%).
The CLDN18.2 status could not be determined in seven cases (9%) due to TMA failure or insufficient number of tumour cells; these included all the cases where Her2 and PD-L1 status was indeterminate. There were 41 cases (57%) with CLDN18.2 in <40% of the TC, 11 cases (15%) with Claudin 18.2 in ≥40% TC but <75% TC and 20 cases (28%) with CLDN18.2 in ≥75% TC. Overall there were 31cases (43%) with expression of CLDN18.2 in at least 40% TC; the highest prevalence of cases with ≥40% TC was in the GC p53wt (77%) followed by GC EBV(+) (60%) and GC p53m (44%), while prevalence amongst the GC dMMR (33%) and GC EMT (20%) appeared lower. Importantly, the prevalence amongst the Laurén intestinal type of tumours with ≥40% TC expression of CLDN18.2 was 48%, while that of the Laurén diffuse type was 30%. These findings are summarised in Figure 3.

4. Discussion

Our results demonstrate that, in the majority of cases (92%), GC can be classified into one of five molecular subtypes. We did not find GC EBV(+) that were also dMMR and this is consistent with other published data [28,29]. A hierarchical approach is necessary, since a proportion of GC dMMR is also p53m (38%) and some dMMR cases (12%) have also aberrant expression of E-cad or β-cat. This hierarchical approach also proved useful in cases with test failure, since we were still able to reach a specific diagnostic category in 40% of such cases. GC NOS/indeterminate represents 8% of our total; this was due to test failure for MLH1 (two cases), E-cad (three cases) and β-cat (one case).
In our cohort, GC EBV(+) has a prevalence of 6%. This compares favorably with Setia et al. (2016), who found EBV(+) in 5% of their cases, with the TCGA (9%) and with Ramos et al. (10%) [2,5,8]. To determine the EBV status, we chose EBER ISH. In the context of a classification for widespread adoption, the use of IHC may be more desirable, however, the sensitivity (44%) and specificity (93%) of IHC for the latent membrane protein 1 (LMP1) compares unfavorably with EBER ISH (sensitivity 94% and specificity of 69%) [30]. Other techniques, such as sequencing, microRNA and droplet digital PCR may be more specific but EBER ISH is considered the gold standard for detecting and localising latent EBV in FFPE tissue [31,32,33]. The role of EBV in GC remains uncertain and it is possible that it has an involvement in a larger number of GC cases through a “hit and run” mechanism [34]. What has been clear from the comprehensive molecular assessments of the TCGA is that in a smaller group of GC patients, the tumour retains EBV-related molecular pathways which correlate with specific outcomes and response to treatment [35,36]. For these reasons, the use of EBER-ISH is appropriate to recognise these cases.
Systematic sequencing in different tumour sites (for instance endometrium and colorectum) has shown presence of independent molecular pathways with broad commonalities such chromosomal instability (CIN), CpG island methylator phenotype (CIMP) and defects of double stranded DNA repair (MMR deficiency) [37]. In addition, a smaller proportion of cases seem to have oncogenic drivers specific to the tumour site. For instance, HER2 amplification in breast cancer or POL-E mutation in endometrial carcinoma [38,39]. In this context, GC has a small number of cases where EBV appears to be the oncogenic driver; these tumours have extremely high CIMP and are molecularly, genetically and epigenetically distinct form all other types [40]. Unlike the ACRG study, the TCGA group recognised this as unique category with good prognosis, distinct pathological features and an association with good response to immune checkpoint therapy [41,42]. We believe that GC EBV(+) should be recognised as a distinct category as the first step in the hierarchical approach.
The proportion of dMMR tumours in our cohort is 20%. Similar proportions were found in other studies [2,3,5,6,7,8], with prevalence ranging between 16% (Setia et al.) and 24% (Ahn et al.). In our study, the predominant cause of dMMR was loss of MLH1 (94%), followed by MSH2 (6%). This is concordant with published data, which identifies hypermethylation of MLH1 promoter as the most common mechanism of dMMR in GC, MSH2 mutation being present only in a minority of cases [43].
Absence of IHC staining for the MMR enzymes MLH1, PMS2, MSH2 and MSH6 is widely accepted as a surrogate marker of mismatch repair status and correlates well with previously used surrogate markers such as microsatellite instability and sequencing [18]. While in our diagnostic routine we assess MMR status using all four IHC makers, for this work we used only two of the biomarkers (MLH1 and MSH2), principally in order to save tissue sections. Since MLH1 promoter methylation and germline mutation in MLH1 and MSH2 are the most frequent causes of MMR deficiency in gastric cancer, some institutes use only MLH1 and MSH2 also in the diagnostic routine [44]. In our experience, the use of all four markers aids interpretation and we would not advocate implementing GC classification using only two of these biomarkers. For GC dMMR may be desirable to perform MLH1 promoter methylation studies to help distinguish syndromic patients from sporadic cases; this distinction is not part of our molecular classification. Within the GC dMMR group, we identified two cases (12%) that showed also aberrant expression of E-cad or β-cat. Similar cases were also described in the cohort assessed by Setia et al.[5].
In this study, GC EMT represents 14% of the cohort. This category comprises all cases with aberrant expression of E-cad and/or β-cat. The majority of these cases (10/11 or 91%) are of Laurén diffuse type. Prevalence of GC EMT is slightly higher than that found by Ramos et al. (9%) [8] but similar to that that found in the ACRG study (15%) [3,4] and in the study of Ahn et al. (15%) [6]. However, it is much lower than the incidence found in other studies which ranged between 20% and 29% [2,5,7]. One case in our GC EMT cohort was of Laurén intestinal type. On review, this case shows tubular morphology. There are reports of tubular carcinoma of the stomach with aberrant E-cad expression [6,7,8]. It is difficult to argue that tubular carcinoma shows morphological evidence of EMT, since it has well developed epithelial structures nevertheless, in comprehensive genomic studies, it has gene expression profiles more similar to tumours with more classic EMT [3,4]. This may signify that GC EMT may not be the most appropriate term to identify this group of tumours.
In order to identify cases of GC EMT, we used β-cat in addition to E-cad. Others who attempted molecular classification of GC with on-slide biomarkers limited testing to E-cad only [5,6,7,8]. EMT is linked to loss of cell-to-cell adhesion and this is in most cases due to a defect in E-cad. A prototype tumour with EMT is lobular carcinoma of the breast (LBC), which can be associated with sporadic or familiar defects in CDH1, the gene encoding for E-cad. Nevertheless, in a small proportion (10-15%) of LBC, the defect lies in accessory molecules of the cadherin-catenin complex which includes α-catenin, β-catenin and p120 catenin [45]. The addition of IHC for β-cat has proven helpful in understanding loss of cell-to-cell adhesion [46,47] and both markers are now used routinely in breast pathology, providing more accurate diagnosis of LBC [48,49].
There are strong similarities between LBC and diffuse GC. A proportion of diffuse GC is hereditary and part of a rare autosomal dominant syndrome that was first described in 1998 and is characterised by increased risk of diffuse GC and LBC [50]. The most common underlying defect in this syndrome is mutation in CDH1 gene, followed by mutation in the CTNNA1 gene that encodes for α-catenin [51]. Alpha catenin defects result in destabilisation of the cadherin-catenin complex with increases degradation of these molecules and leads to abnormal localisation of β-cat [52,53]. For these reasons we added β-cat to our panel. Others have shown that aberrant expression of β-cat is linked with defective cadherin-catenin complex also in GC but this marker is yet to be in routine use [54].
In our study, 64% of GC EMT (7/11) show loss of both E-cad and β-cat expression, 18% (2/11) show only aberrant E-cad expression and in the remaining 18% (2/11) E-cad is indeterminate while β-cat show aberrant expression. Our experience supports published evidence that the assessment of EMT is greatly facilitated by the use of both markers [55]. In addition, a promising new immunotherapy targeting, CLDN18.2, appears particularly effective in diffuse GC. CLDN18.2 is a constituent of tight junctions and becomes accessible to the immune system when tight junctions are not functional, as in the case of GC EMT. Zolbetuximab, a humanized monoclonal antibody, selectively binds CLDN18.2 on tumour cells and mediates antibody-dependent cell-mediated cytotoxicity (ADCC); this treatment is more effective in tumours with higher expression of CLDN18.2 [56,57,58]. The correct identification of GC EMT is important not only because of its associated with poorer prognosis but also for the selection of specific immune therapy.
CLDN18.2 has potential to become an important predictive biomarker in view of its effectiveness in clinical trials [56,57,58]. There is some uncertainty over the threshold for positivity. Some trials considered a case positive for CLDN18.2 if there was moderate or strong intensity in ≥40% TC, others in ≥70% TC or in ≥ 75% TC [59]. For the purpose of this analysis we considered a threshold for positivity ≥40%. It is possible that some of the molecular subgroups may have a better response to this new drug, nevertheless this requires further work.
GC p53m represents 23% of our cohort, which is lower than that found by Ramos et al. (35%) and the ACRG (36%). It is worth noting that in both studies there is no indeterminate group. If the p53m cases of the GC NOS group are added to the GCp53m group, the total (27%) approaches that of these two studies [3,8]. In our study, the proportion of p53m cases is considerably lower than those in the work of Setia et al. (51%) and Ahn et al. (49%) [5,6].
The number of cases in the GC p53wt category in our study (29%) compares well with that of Ramos and colleagues (29%), Ahn et al. (21%) and the ACRG study (26%) but is very different to that reported by Setia et al. (7%) [3,5,6,8]. These differences are not surprising, since p53 mutation is assessed by IHC in three of these studies and relies on sequencing in the ACRG study. In addition, staining parameters and interpretative algorithms are different, and these are known to impact significantly on results. For example, both Setia et al. and Ahn et al. did not recognise cytoplasmic staining as aberrant expression linked to mutation. We used more recent guidelines which have been developed for p53 assessment in endometrial carcinoma [21].
Eight of our cases (10%) are Her2 positive (IHC 3+ and DDISH amplified). Other studies reported a prevalence (between 3% and 5%) [3,6]. Our study is small but we found no association with particular molecular subtypes. However, all cases were of Laurén intestinal type, confirming previous observations [5,6,7,8] and highlighting the important of the Laurén model to determine further downstream tests.
We found a total of 16 PD-L1 positive cases in our cohort. These results should be interpreted with caution as PD-L1 staining in tumour tissue can be heterogeneous and smaller samples (such as those in our TMAs) may have significant sample bias. In addition, we chose a positivity threshold of CPS 5 in view of the approval of nivolumab in GC. There is a second clinical threshold for GC at CPS 10 for the use of pembrolizumab. Our study showed that the GC EBV(+) is enriched with PD-L1 positive cases (40% vs 21% in GC EBV(-)) and this is in keeping with other published data [2,5,6]. Some authors have linked this to high numbers of lymphoid cells in the stroma of EBV(+) GC [60]. In our study, the majority (81%) of PD-L1(+) GC is of the Laurén intestinal type and only 3/16 cases (19%), signifying no preferential expression in either subgroups. There is a variation of percentage of PD-L1 overexpression in the literature, ranging between 28-65% for the intestinal type and between 19-54% for the diffuse-type. Comparison is difficult because of the different thresholds for positivity that have been used [61,62,63,64].
This study shows that a molecular classification is possible to implement using existing histopathology resources and expertise. While this study has a very small number of cases and further work using larger cohorts is needed, the correlation between molecular subgroups and prevalence of key predictive oncology biomarkers is apparent. The clinical value of such association in the context of busy clinical units cannot be overlooked, especially when some of these predictive biomarkers are send away tests with long turnaround times. Knowledge of the molecular subgroup and hence an understanding of the prognosis as well as the prevalence of specific predictive tests, would greatly assist the multi disciplinary team (MDT) discussions and aid treatment decision making while awaiting the result of predictive tests.
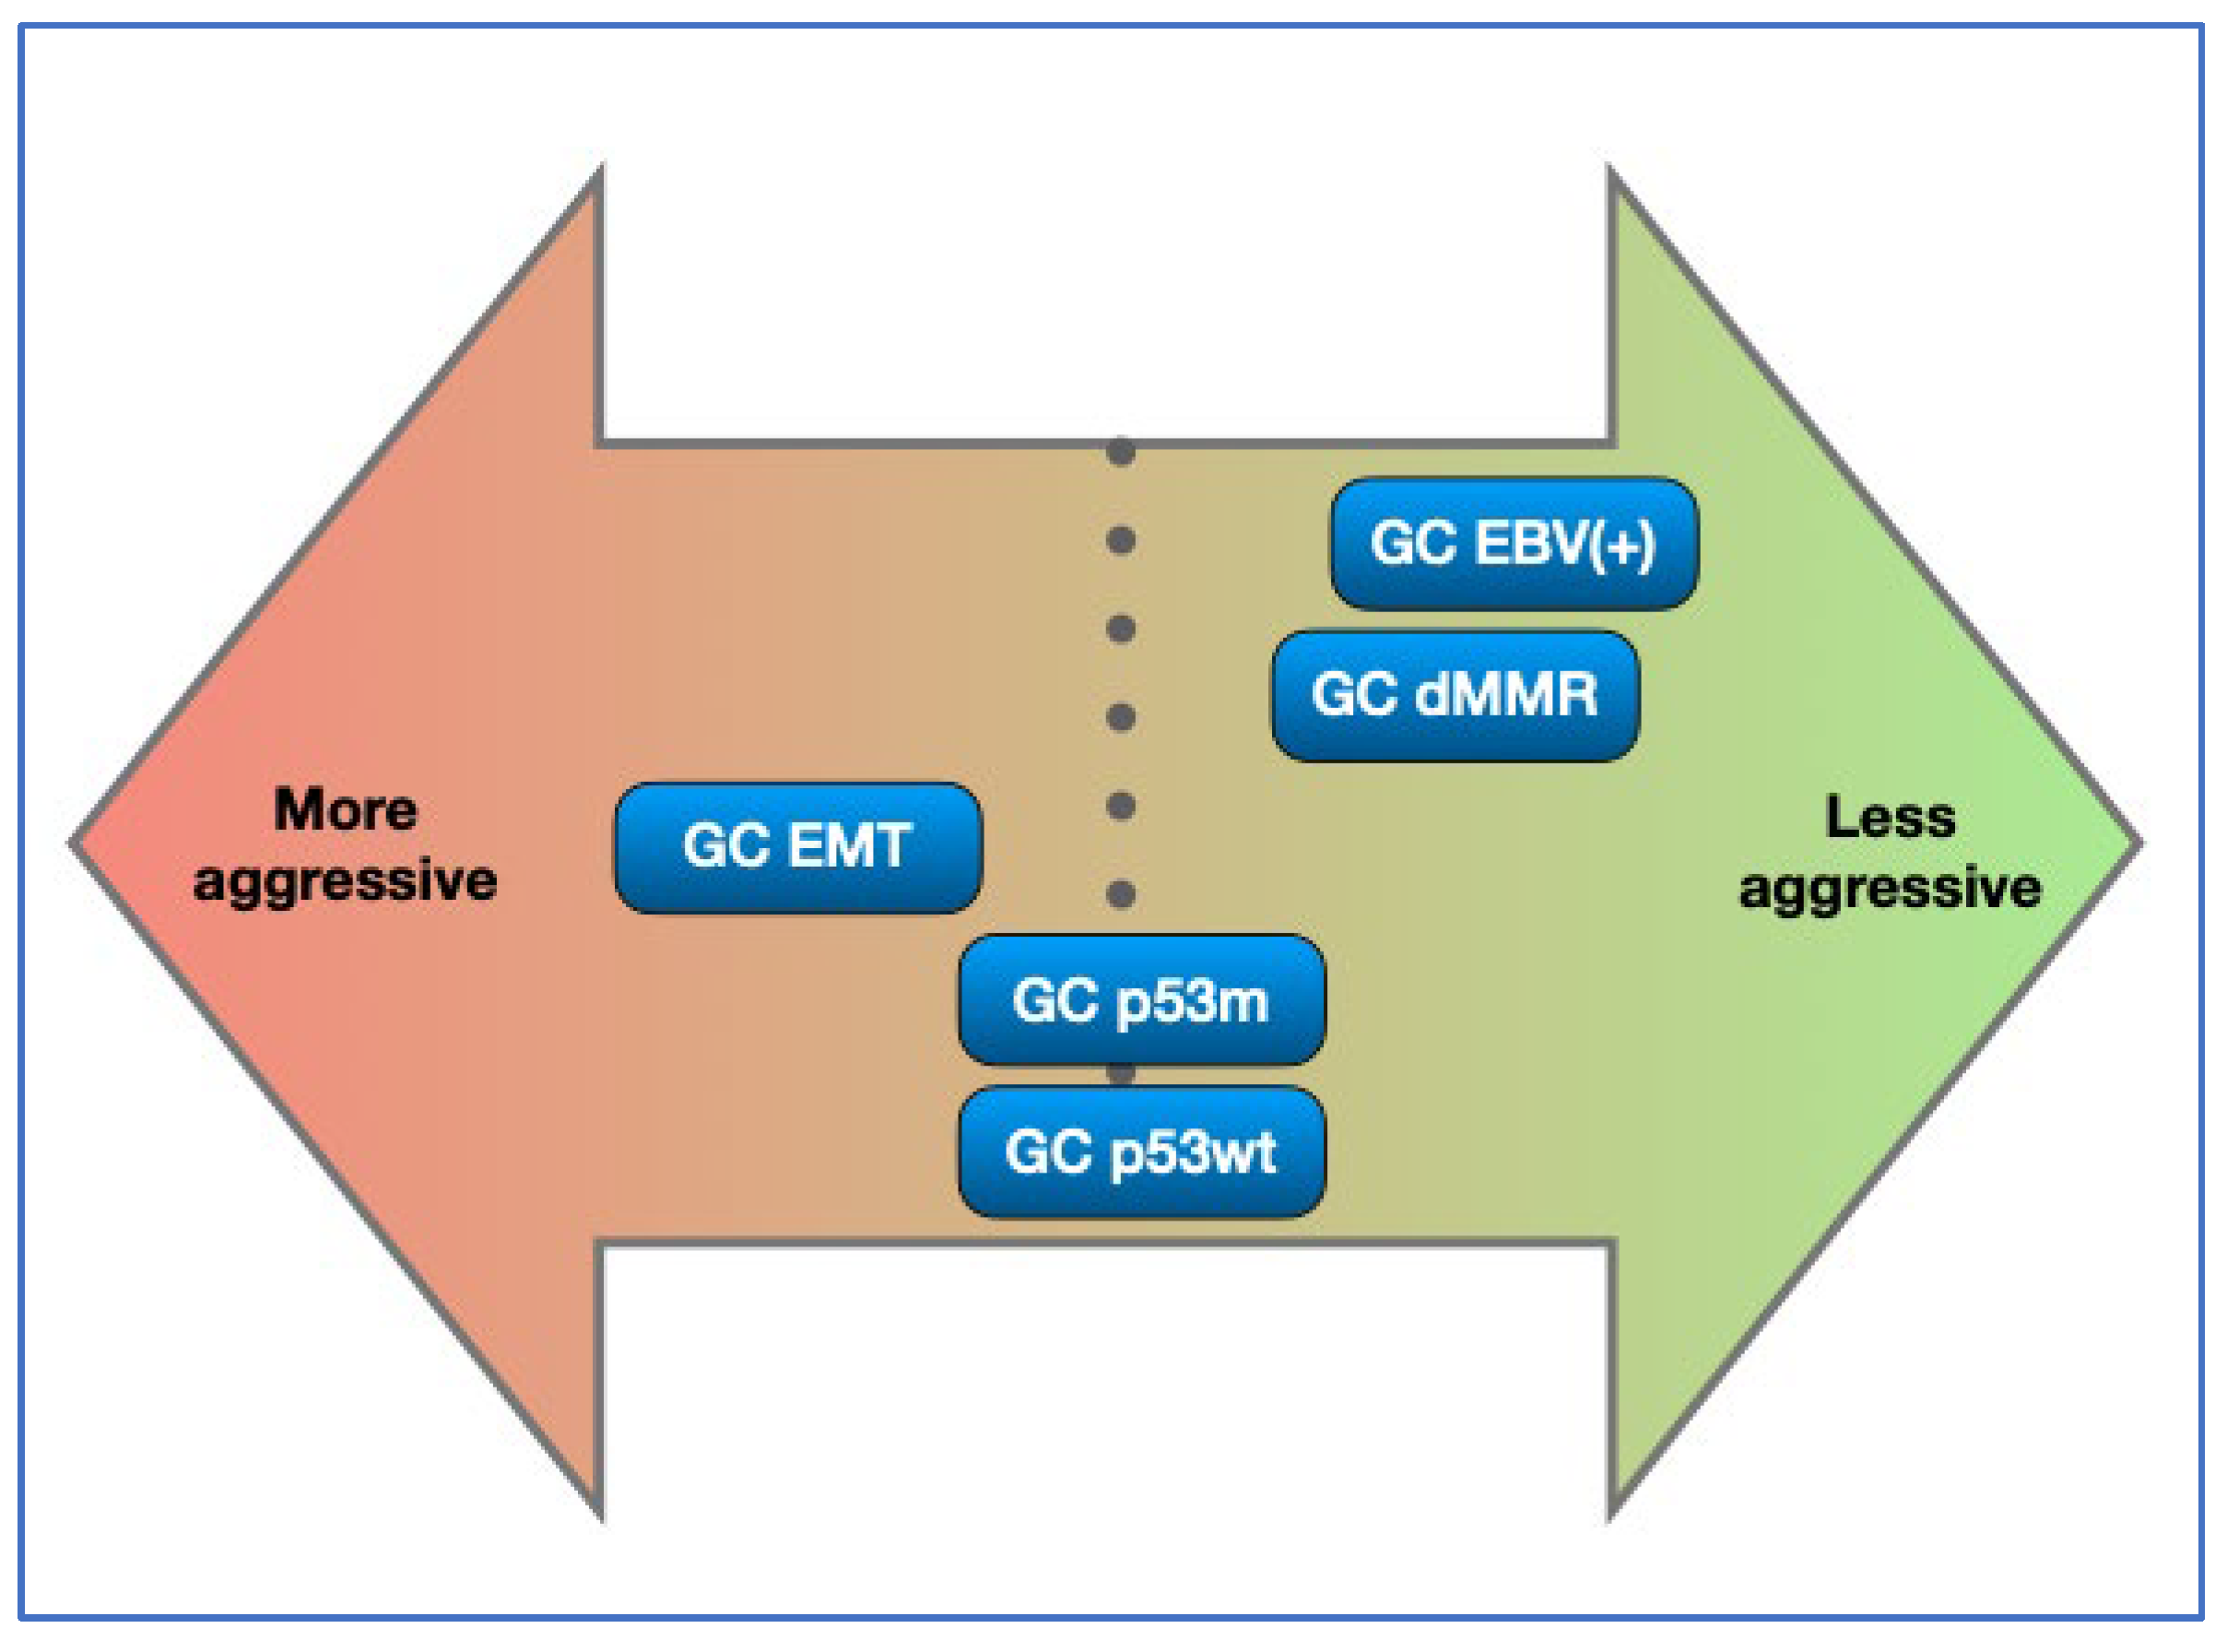
There is limited data on the biological behaviour of each of the molecular subtypes of GC. An understanding of prognosis is difficult in consideration of the fact that some of these subgoups are enriched for responders to immunotherapy. The relative aggressiveness of each subgroup has been estimated from published papers [2,3,4,5,6,8] and we have attempted to collate available data in Figure 4, which provides an indication on the aggressiveness of each subtype. This picture may change when considering relative abundance of responders in each category and the effectiveness of existing biological therapy (for instance herceptin, pembrolizumab and nivolumab) [24,65,66] and new biological drugs (for instance zolbetuximab) [56,57,58].
This study has a number of limitations. We have no outcome data for our cohort of patients therefore assumption on the prognostic significance of these categories are inferred from other studies. The study uses TMAs which may be suboptimal when assessing heterogenous tumours and the relatively small cohort means that some subgroups have very low number of events. The tissue used might have been affected from suboptimal pre-analytics, since these are derived from gastric resection specimens where fixation and processing was not controlled. Finally, the study was not designed to assess accuracy of interpretation of the biomarkers used.

5. Conclusions

Our study demonstrates that a hierarchical molecular classification that uses five on-slide biomarkers on FFPE tissue can be performed in a histopathology laboratory, can be interpreted by Histopathologists and has the potential to be used in the diagnostic routine. Our results, using this classification, are in line with other published work. The definition of the parameters for the interpretation of these tests, the establishment of an indeterminate category and the inclusion of predictive biomarkers for treatment selection represent an improvement over previous studies. Our hierarchical classification may represent an effective and affordable screening tool for personalised treatment of gastric cancer. We are currently undertaking a study using endoscopic biopsy to understand if this classification can be implemented using the diagnostic samples.

Supplementary Materials

The data presented in this study are available on request from the corresponding author. The data are not publicly available due to patients privacy.

Author Contributions

Conceptualization: S.C. and C.D.; methodology: S.C., C.D. and S.W.; software: S.C., R.H. and S.D.M.; validation: S.C, C.D. and M.S.; formal analysis: S.C, C.D. and M.S.; investigation: S.C, R.H and S.D.M.; resources: S.C., C.D., R.H., S.D.M. and M.S.; data curation: S.C., C.D. and M.S.; writing—original draft preparation: S.C. and C.D..; writing—review and editing: S.C., C.D. and S.W.; visualization: S.C., C.D. and S.W.; supervision: S.C., C.D., S.W. and M.S. All authors have read and agreed to the published version of the manuscript.

Funding

This research received no external funding.

Institutional Review Board Statement

This study was approved by the Ethics Committee of University Emergency Bucharest, Bucharest, Romania (study number 31673/01.07.2020).

Informed Consent Statement

This study was conducted according to the current version of World Medical Association Declaration of Helsinki and was approved by the local institutional ethics committee. All patients provided informed written consent for the use tissue in research.

Data Availability Statement

All data is available on requested.

Acknowledgments

Not applicable.

Conflicts of Interest

The authors declare no conflict of interest.

References

  1. Ichikawa, H.; Nagahashi, M.; Shimada, Y.; Hanyu, T.; Ishikawa, T.; Kameyama, H.; Kobayashi, T.; Sakata, J.; Yabusaki, H.; Nakagawa, S.; et al. Actionable Gene-Based Classification toward Precision Medicine in Gastric Cancer. Genome Med 2017, 9, 93. [Google Scholar] [CrossRef]
  2. The Cancer Genome Atlas Research Network Comprehensive Molecular Characterization of Gastric Adenocarcinoma. Nature 2014, 513, 202–209. [CrossRef]
  3. Cristescu, R.; Lee, J.; Nebozhyn, M.; Kim, K.-M.; Ting, J.C.; Wong, S.S.; Liu, J.; Yue, Y.G.; Wang, J.; Yu, K.; et al. Molecular Analysis of Gastric Cancer Identifies Subtypes Associated with Distinct Clinical Outcomes. Nat Med 2015, 21, 449–456. [Google Scholar] [CrossRef]
  4. Wong, S.S.; Kim, K.-M.; Ting, J.C.; Yu, K.; Fu, J.; Liu, S.; Cristescu, R.; Nebozhyn, M.; Gong, L.; Yue, Y.G.; et al. Genomic Landscape and Genetic Heterogeneity in Gastric Adenocarcinoma Revealed by Whole-Genome Sequencing. Nat Commun 2014, 5, 5477. [Google Scholar] [CrossRef]
  5. Setia, N.; Agoston, A.T.; Han, H.S.; Mullen, J.T.; Duda, D.G.; Clark, J.W.; Deshpande, V.; Mino-Kenudson, M.; Srivastava, A.; Lennerz, J.K.; et al. A Protein and MRNA Expression-Based Classification of Gastric Cancer. Modern Pathology 2016, 29, 772–784. [Google Scholar] [CrossRef]
  6. Ahn, S.; Lee, S.-J.; Kim, Y.; Kim, A.; Shin, N.; Choi, K.U.; Lee, C.-H.; Huh, G.Y.; Kim, K.-M.; Setia, N.; et al. High-Throughput Protein and MRNA Expression–Based Classification of Gastric Cancers Can Identify Clinically Distinct Subtypes, Concordant With Recent Molecular Classifications. American Journal of Surgical Pathology 2017, 41, 106–115. [Google Scholar] [CrossRef] [PubMed]
  7. Zhao, C.; Feng, Z.; He, H.; Zang, D.; Du, H.; Huang, H.; Du, Y.; He, J.; Zhou, Y.; Nie, Y. Protein Expression-Based Classification of Gastric Cancer by Immunohistochemistry of Tissue Microarray. PLoS ONE 2020, 15, e0238836. [Google Scholar] [CrossRef] [PubMed]
  8. Ramos, M.F.K.P.; Pereira, M.A.; Amorim, L.C.; Mello, E.S.; Faraj, S.F.; Ribeiro, U.; Hoff, P.M.G.; Cecconello, I.; Castria, T.B. Gastric Cancer Molecular Classification and Adjuvant Therapy: Is There a Different Benefit According to the Subtype? J Surg Oncol 2019, 5792. [Google Scholar] [CrossRef] [PubMed]
  9. Alexa, M.; Hasenburg, A.; Battista, M.J. The TCGA Molecular Classification of Endometrial Cancer and Its Possible Impact on Adjuvant Treatment Decisions. Cancers 2021, 13, 1478. [Google Scholar] [CrossRef] [PubMed]
  10. Talhouk, A.; McAlpine, J.N. New Classification of Endometrial Cancers: The Development and Potential Applications of Genomic-Based Classification in Research and Clinical Care. gynaecol oncol res pract 2016, 3, 14. [Google Scholar] [CrossRef] [PubMed]
  11. Female Genital Tumours; Organisation mondiale de la santé, Centre international de recherche sur le cancer, Eds.; World health organization classification of tumours; 5th ed.; International agency for research on cancer: Lyon, 2020; ISBN 978-92-832-4504-9.
  12. Costache, S.; Sajin, M.; Wedden, S.; D’Arrigo, C. A Consolidated Working Classification of Gastric Cancer for Histopathologists (in Press.).
  13. Nakamura, Y.; Kawazoe, A.; Lordick, F.; Janjigian, Y.Y.; Shitara, K. Biomarker-Targeted Therapies for Advanced-Stage Gastric and Gastro-Oesophageal Junction Cancers: An Emerging Paradigm. Nat Rev Clin Oncol 2021, 18, 473–487. [Google Scholar] [CrossRef]
  14. Digestive System Tumours; Organisation mondiale de la santé, Centre international de recherche sur le cancer, Eds.; World health organization classification of tumours; 5th ed.; International agency for research on cancer: Lyon, 2019; ISBN 978-92-832-4499-8.
  15. Laurén, P. THE TWO HISTOLOGICAL MAIN TYPES OF GASTRIC CARCINOMA: DIFFUSE AND SO-CALLED INTESTINAL-TYPE CARCINOMA: An Attempt at a Histo-Clinical Classification. Acta Pathologica Microbiologica Scandinavica 1965, 64, 31–49. [Google Scholar] [CrossRef]
  16. Amin, M.B.; Greene, F.L.; Edge, S.B.; Compton, C.C.; Gershenwald, J.E.; Brookland, R.K.; Meyer, L.; Gress, D.M.; Byrd, D.R.; Winchester, D.P. The Eighth Edition AJCC Cancer Staging Manual: Continuing to Build a Bridge from a Population-Based to a More “Personalized” Approach to Cancer Staging. CA Cancer J Clin 2017, 67, 93–99. [Google Scholar] [CrossRef]
  17. Gulley, M.L.; Glaser, S.L.; Craig, F.E.; Borowitz, M.; Mann, R.B.; Shema, S.J.; Ambinder, R.F. Guidelines for Interpreting EBER In Situ Hybridization and LMP1 Immunohistochemical Tests for Detecting Epstein-Barr Virus in Hodgkin Lymphoma. Am J Clin Pathol 2002, 117, 259–267. [Google Scholar] [CrossRef]
  18. McCarthy, A.J.; Capo-Chichi, J.; Spence, T.; Grenier, S.; Stockley, T.; Kamel-Reid, S.; Serra, S.; Sabatini, P.; Chetty, R. Heterogenous Loss of Mismatch Repair (MMR) Protein Expression: A Challenge for Immunohistochemical Interpretation and Microsatellite Instability (MSI) Evaluation. J Pathol Clin Res 2019, 5, 115–129. [Google Scholar] [CrossRef]
  19. Burandt, E.; Lübbersmeyer, F.; Gorbokon, N.; Büscheck, F.; Luebke, A.M.; Menz, A.; Kluth, M.; Hube-Magg, C.; Hinsch, A.; Höflmayer, D.; et al. E-Cadherin Expression in Human Tumors: A Tissue Microarray Study on 10,851 Tumors. Biomark Res 2021, 9, 44. [Google Scholar] [CrossRef]
  20. Montgomery, E.; Folpe, A.L. The Diagnostic Value of β-Catenin Immunohistochemistry. Advances in Anatomic Pathology 2005, 12, 350–356. [Google Scholar] [CrossRef] [PubMed]
  21. Köbel, M.; Ronnett, B.M.; Singh, N.; Soslow, R.A.; Gilks, C.B.; McCluggage, W.G. Interpretation of P53 Immunohistochemistry in Endometrial Carcinomas: Toward Increased Reproducibility. International Journal of Gynecological Pathology 2019, 38, S123–S131. [Google Scholar] [CrossRef] [PubMed]
  22. Hofmann, M.; Stoss, O.; Shi, D.; Büttner, R.; Van De Vijver, M.; Kim, W.; Ochiai, A.; Rüschoff, J.; Henkel, T. Assessment of a HER2 Scoring System for Gastric Cancer: Results from a Validation Study. Histopathology 2008, 52, 797–805. [Google Scholar] [CrossRef] [PubMed]
  23. Abrahao-Machado, L.F.; Scapulatempo-Neto, C. HER2 Testing in Gastric Cancer: An Update. WJG 2016, 22, 4619. [Google Scholar] [CrossRef] [PubMed]
  24. Abrahao-Machado, L.F.; Scapulatempo-Neto, C. HER2 Testing in Gastric Cancer: An Update. WJG 2016, 22, 4619. [Google Scholar] [CrossRef]
  25. Scheel, A.H.; Penault-Llorca, F.; Hanna, W.; Baretton, G.; Middel, P.; Burchhardt, J.; Hofmann, M.; Jasani, B.; Rüschoff, J. Physical Basis of the ‘Magnification Rule’ for Standardized Immunohistochemical Scoring of HER2 in Breast and Gastric Cancer. Diagn Pathol 2018, 13, 19. [Google Scholar] [CrossRef] [PubMed]
  26. Kulangara, K.; Hanks, D.A.; Waldroup, S.; Peltz, L.; Shah, S.; Roach, C.; Juco, J.W.; Emancipator, K.; Stanforth, D. Development of the Combined Positive Score (CPS) for the Evaluation of PD-L1 in Solid Tumors with the Immunohistochemistry Assay PD-L1 IHC 22C3 PharmDx. JCO 2017, 35, e14589–e14589. [Google Scholar] [CrossRef]
  27. Carneiro, F.; Seixas, M.; Sobrinho-Simões, M. New Elements for an Updated Classification of the Carcinomas of the Stomach. Pathology - Research and Practice 1995, 191, 571–584. [Google Scholar] [CrossRef] [PubMed]
  28. Grogg, K.L.; Lohse, C.M.; Pankratz, V.S.; Halling, K.C.; Smyrk, T.C. Lymphocyte-Rich Gastric Cancer: Associations with Epstein-Barr Virus, Microsatellite Instability, Histology, and Survival. Modern Pathology 2003, 16, 641–651. [Google Scholar] [CrossRef] [PubMed]
  29. Shi, J.; Yang, X.; Wang, X.; Luo, Y.; Zhou, W.; Luo, H.; Bianba, Z.; Nima, Z.; Wang, Q.; Wang, H.; et al. Prevalence of Epstein–Barr Virus Infection and Mismatch Repair Protein Deficiency and the Correlation of Immune Markers in Tibetan Patients with Gastric Cancer. BioMed Research International 2022, 2022, 1–11. [Google Scholar] [CrossRef] [PubMed]
  30. Fanaian, N.K.; Cohen, C.; Waldrop, S.; Wang, J.; Shehata, B.M. Epstein-Barr Virus (EBV)-Encoded RNA: Automated In-Situ Hybridization (ISH) Compared with Manual ISH and Immunohistochemistry for Detection of EBV in Pediatric Lymphoproliferative Disorders. Pediatr Dev Pathol 2009, 12, 195–199. [Google Scholar] [CrossRef] [PubMed]
  31. Siciliano, M.C.; Tornambè, S.; Cevenini, G.; Sorrentino, E.; Granai, M.; Giovannoni, G.; Marrelli, D.; Biviano, I.; Roviello, F.; Yoshiyama, H.; et al. EBV Persistence in Gastric Cancer Cases Conventionally Classified as EBER-ISH Negative. Infect Agents Cancer 2022, 17, 57. [Google Scholar] [CrossRef] [PubMed]
  32. Fan, H.; Gulley, M.L. Molecular Methods for Detecting Epstein-Barr Virus (Part I): In Situ Hybridization to Epstein-Barr Virus-Encoded RNA (EBER) Transcripts. In Molecular Pathology Protocols; Humana Press: New Jersey, 2000; ISBN 978-1-59259-081-0. [Google Scholar]
  33. Tavakoli, A.; Monavari, S.H.; Solaymani Mohammadi, F.; Kiani, S.J.; Armat, S.; Farahmand, M. Association between Epstein-Barr Virus Infection and Gastric Cancer: A Systematic Review and Meta-Analysis. BMC Cancer 2020, 20, 493. [Google Scholar] [CrossRef]
  34. Mundo, L.; Ambrosio, M.R.; Picciolini, M.; Lo Bello, G.; Gazaneo, S.; Del Porro, L.; Lazzi, S.; Navari, M.; Onyango, N.; Granai, M.; et al. Unveiling Another Missing Piece in EBV-Driven Lymphomagenesis: EBV-Encoded MicroRNAs Expression in EBER-Negative Burkitt Lymphoma Cases. Front. Microbiol. 2017, 8. [Google Scholar] [CrossRef]
  35. Sun, K.; Jia, K.; Lv, H.; Wang, S.-Q.; Wu, Y.; Lei, H.; Chen, X. EBV-Positive Gastric Cancer: Current Knowledge and Future Perspectives. Front. Oncol. 2020, 10, 583463. [Google Scholar] [CrossRef]
  36. Li, G.; Zhou, Z.; Wang, Z.; Wang, Z. Assessing Epstein–Barr Virus in Gastric Cancer: Clinicopathological Features and Prognostic Implications. Infect Agents Cancer 2023, 18, 11. [Google Scholar] [CrossRef]
  37. Teodoridis, J.M.; Hardie, C.; Brown, R. CpG Island Methylator Phenotype (CIMP) in Cancer: Causes and Implications. Cancer Letters 2008, 268, 177–186. [Google Scholar] [CrossRef]
  38. Krishnamurti, U.; Silverman, J.F. HER2 in Breast Cancer: A Review and Update. Advances in Anatomic Pathology 2014, 21, 100–107. [Google Scholar] [CrossRef]
  39. Billingsley, C.C.; Cohn, D.E.; Mutch, D.G.; Stephens, J.A.; Suarez, A.A.; Goodfellow, P.J. Polymerase ɛ ( POLE ) Mutations in Endometrial Cancer: Clinical Outcomes and Implications for Lynch Syndrome Testing: POLE Mutations and Endometrial Cancer. Cancer 2015, 121, 386–394. [Google Scholar] [CrossRef]
  40. Stanland, L.J.; Luftig, M.A. The Role of EBV-Induced Hypermethylation in Gastric Cancer Tumorigenesis. Viruses 2020, 12, 1222. [Google Scholar] [CrossRef]
  41. Dai, C.; Geng, R.; Wang, C.; Wong, A.; Qing, M.; Hu, J.; Sun, Y.; Lo, A.W.I.; Li, J. Concordance of Immune Checkpoints within Tumor Immune Contexture and Their Prognostic Significance in Gastric Cancer. Molecular Oncology 2016, 10, 1551–1558. [Google Scholar] [CrossRef]
  42. Panda, A.; Mehnert, J.M.; Hirshfield, K.M.; Riedlinger, G.; Damare, S.; Saunders, T.; Kane, M.; Sokol, L.; Stein, M.N.; Poplin, E.; et al. Immune Activation and Benefit From Avelumab in EBV-Positive Gastric Cancer. JNCI: Journal of the National Cancer Institute 2018, 110, 316–320. [Google Scholar] [CrossRef] [PubMed]
  43. Hudler, P. Genetic Aspects of Gastric Cancer Instability. The Scientific World Journal 2012, 2012, 1–10. [Google Scholar] [CrossRef] [PubMed]
  44. Schöniger, S.; Rüschoff, J. Mismatch Repair Deficiency and Microsatellite Instability. Encyclopedia 2022, 2, 1559–1576. [Google Scholar] [CrossRef]
  45. Gomes, D.S.; Porto, S.S.; Rocha, R.M.; Gobbi, H. Usefulness and Limitations of E-Cadherin and β-Catenin in the Classification of Breast Carcinomas in Situ with Mixed Pattern. Diagn Pathol 2013, 8, 114. [Google Scholar] [CrossRef] [PubMed]
  46. Buechel, D.; Sugiyama, N.; Rubinstein, N.; Saxena, M.; Kalathur, R.K.R.; Lüönd, F.; Vafaizadeh, V.; Valenta, T.; Hausmann, G.; Cantù, C.; et al. Parsing β-Catenin’s Cell Adhesion and Wnt Signaling Functions in Malignant Mammary Tumor Progression. Proc. Natl. Acad. Sci. U.S.A. 2021, 118, e2020227118. [Google Scholar] [CrossRef] [PubMed]
  47. Gottardi, C.J.; Gumbiner, B.M. Adhesion Signaling: How β-Catenin Interacts with Its Partners. Current Biology 2001, 11, R792–R794. [Google Scholar] [CrossRef] [PubMed]
  48. Canas-Marques, R.; Schnitt, S.J. E-Cadherin Immunohistochemistry in Breast Pathology: Uses and Pitfalls. Histopathology 2016, 68, 57–69. [Google Scholar] [CrossRef] [PubMed]
  49. Mastracci, T.L.; Tjan, S.; Bane, A.L.; O’Malley, F.P.; Andrulis, I.L. E-Cadherin Alterations in Atypical Lobular Hyperplasia and Lobular Carcinoma in Situ of the Breast. Modern Pathology 2005, 18, 741–751. [Google Scholar] [CrossRef] [PubMed]
  50. Guilford, P.; Hopkins, J.; Harraway, J.; McLeod, M.; McLeod, N.; Harawira, P.; Taite, H.; Scoular, R.; Miller, A.; Reeve, A.E. E-Cadherin Germline Mutations in Familial Gastric Cancer. Nature 1998, 392, 402–405. [Google Scholar] [CrossRef]
  51. Blair, V.R.; McLeod, M.; Carneiro, F.; Coit, D.G.; D’Addario, J.L.; Van Dieren, J.M.; Harris, K.L.; Hoogerbrugge, N.; Oliveira, C.; Van Der Post, R.S.; et al. Hereditary Diffuse Gastric Cancer: Updated Clinical Practice Guidelines. The Lancet Oncology 2020, 21, e386–e397. [Google Scholar] [CrossRef]
  52. Han, A.; Xiong, M.; Li, Z.; Liang, Y. [E-cadherin associated protein expression and its significance in invasive lobular carcinoma and invasive ductal carcinoma of breast]. Zhonghua Bing Li Xue Za Zhi 2001, 30, 27–30. [Google Scholar]
  53. Morrogh, M.; Andrade, V.P.; Giri, D.; Sakr, R.A.; Paik, W.; Qin, L.X.; Arroyo, C.D.; Brogi, E.; Morrow, M.; King, T.A. Cadherin–Catenin Complex Dissociation in Lobular Neoplasia of the Breast. Breast Cancer Res Treat 2012, 132, 641–652. [Google Scholar] [CrossRef]
  54. Cheng, X.-X.; Wang, Z.-C.; Chen, X.-Y.; Sun, Y.; Kong, Q.-Y.; Liu, J.; Gao, X.; Guan, H.-W.; Li, H. Frequent Loss of Membranous E-Cadherin in Gastric Cancers: A Cross-Talk with Wnt in Determining the Fate of β-Catenin. Clin Exp Metastasis 2005, 22, 85–93. [Google Scholar] [CrossRef]
  55. Huiping, C.; Kristjansdottir, S.; Jonasson, J.G.; Magnusson, J.; Egilsson, V.; Ingvarsson, S. Alterations of E-Cadherin and β-Catenin in Gastric Cancer. BMC Cancer 2001, 1, 16. [Google Scholar] [CrossRef]
  56. Van Laarhoven, H.W.M.; Derks, S. Claudin-18.2 Targeting by Zolbetuximab: Results of SPOTLIGHT in Perspective. The Lancet 2023, 401, 1630–1631. [Google Scholar] [CrossRef]
  57. Shah, M.A.; Ajani, J.A.; Al-Batran, S.-E.; Bang, Y.-J.; Catenacci, D.V.T.; Enzinger, P.C.; Ilson, D.H.; Kim, S.S.; Lordick, F.; Shitara, K.; et al. Zolbetuximab + CAPOX versus CAPOX in First-Line Treatment of Claudin18.2 + /HER2 Advanced/Metastatic Gastric or Gastroesophageal Junction Adenocarcinoma: GLOW Phase 3 Study. JCO 2022, 40, TPS365–TPS365. [Google Scholar] [CrossRef]
  58. Sahin, U.; Türeci, Ö.; Manikhas, G.; Lordick, F.; Rusyn, A.; Vynnychenko, I.; Dudov, A.; Bazin, I.; Bondarenko, I.; Melichar, B.; et al. FAST: A Randomised Phase II Study of Zolbetuximab (IMAB362) plus EOX versus EOX Alone for First-Line Treatment of Advanced CLDN18.2-Positive Gastric and Gastro-Oesophageal Adenocarcinoma. Annals of Oncology 2021, 32, 609–619. [Google Scholar] [CrossRef] [PubMed]
  59. Choi, S.; Park, S.; Kim, H.; Kang, S.Y.; Ahn, S.; Kim, K.-M. Gastric Cancer: Mechanisms, Biomarkers, and Therapeutic Approaches. Biomedicines 2022, 10, 543. [Google Scholar] [CrossRef] [PubMed]
  60. Lima, Á.; Sousa, H.; Medeiros, R.; Nobre, A.; Machado, M. PD-L1 Expression in EBV Associated Gastric Cancer: A Systematic Review and Meta-Analysis. Discov Onc 2022, 13, 19. [Google Scholar] [CrossRef] [PubMed]
  61. Ooki, A.; Yamaguchi, K. The Dawn of Precision Medicine in Diffuse-Type Gastric Cancer. Ther Adv Med Oncol 2022, 14, 17588359221083048. [Google Scholar] [CrossRef] [PubMed]
  62. Fukamachi, H.; Kim, S.-K.; Koh, J.; Lee, H.S.; Sasaki, Y.; Yamashita, K.; Nishikawaji, T.; Shimada, S.; Akiyama, Y.; Byeon, S.; et al. A Subset of Diffuse-Type Gastric Cancer Is Susceptible to MTOR Inhibitors and Checkpoint Inhibitors. J Exp Clin Cancer Res 2019, 38, 127. [Google Scholar] [CrossRef] [PubMed]
  63. Liu, X.; Choi, M.G.; Kim, K.; Kim, K.-M.; Kim, S.T.; Park, S.H.; Cristescu, R.; Peter, S.; Lee, J. High PD-L1 Expression in Gastric Cancer (GC) Patients and Correlation with Molecular Features. Pathology - Research and Practice 2020, 216, 152881. [Google Scholar] [CrossRef] [PubMed]
  64. Gu, L.; Chen, M.; Guo, D.; Zhu, H.; Zhang, W.; Pan, J.; Zhong, X.; Li, X.; Qian, H.; Wang, X. PD-L1 and Gastric Cancer Prognosis: A Systematic Review and Meta-Analysis. PLoS One 2017, 12, e0182692. [Google Scholar] [CrossRef]
  65. Muro, K.; Chung, H.C.; Shankaran, V.; Geva, R.; Catenacci, D.; Gupta, S.; Eder, J.P.; Golan, T.; Le, D.T.; Burtness, B.; et al. Pembrolizumab for Patients with PD-L1-Positive Advanced Gastric Cancer (KEYNOTE-012): A Multicentre, Open-Label, Phase 1b Trial. The Lancet Oncology 2016, 17, 717–726. [Google Scholar] [CrossRef] [PubMed]
  66. Janjigian, Y.Y.; Shitara, K.; Moehler, M.; Garrido, M.; Salman, P.; Shen, L.; Wyrwicz, L.; Yamaguchi, K.; Skoczylas, T.; Campos Bragagnoli, A.; et al. First-Line Nivolumab plus Chemotherapy versus Chemotherapy Alone for Advanced Gastric, Gastro-Oesophageal Junction, and Oesophageal Adenocarcinoma (CheckMate 649): A Randomised, Open-Label, Phase 3 Trial. The Lancet 2021, 398, 27–40. [Google Scholar] [CrossRef] [PubMed]
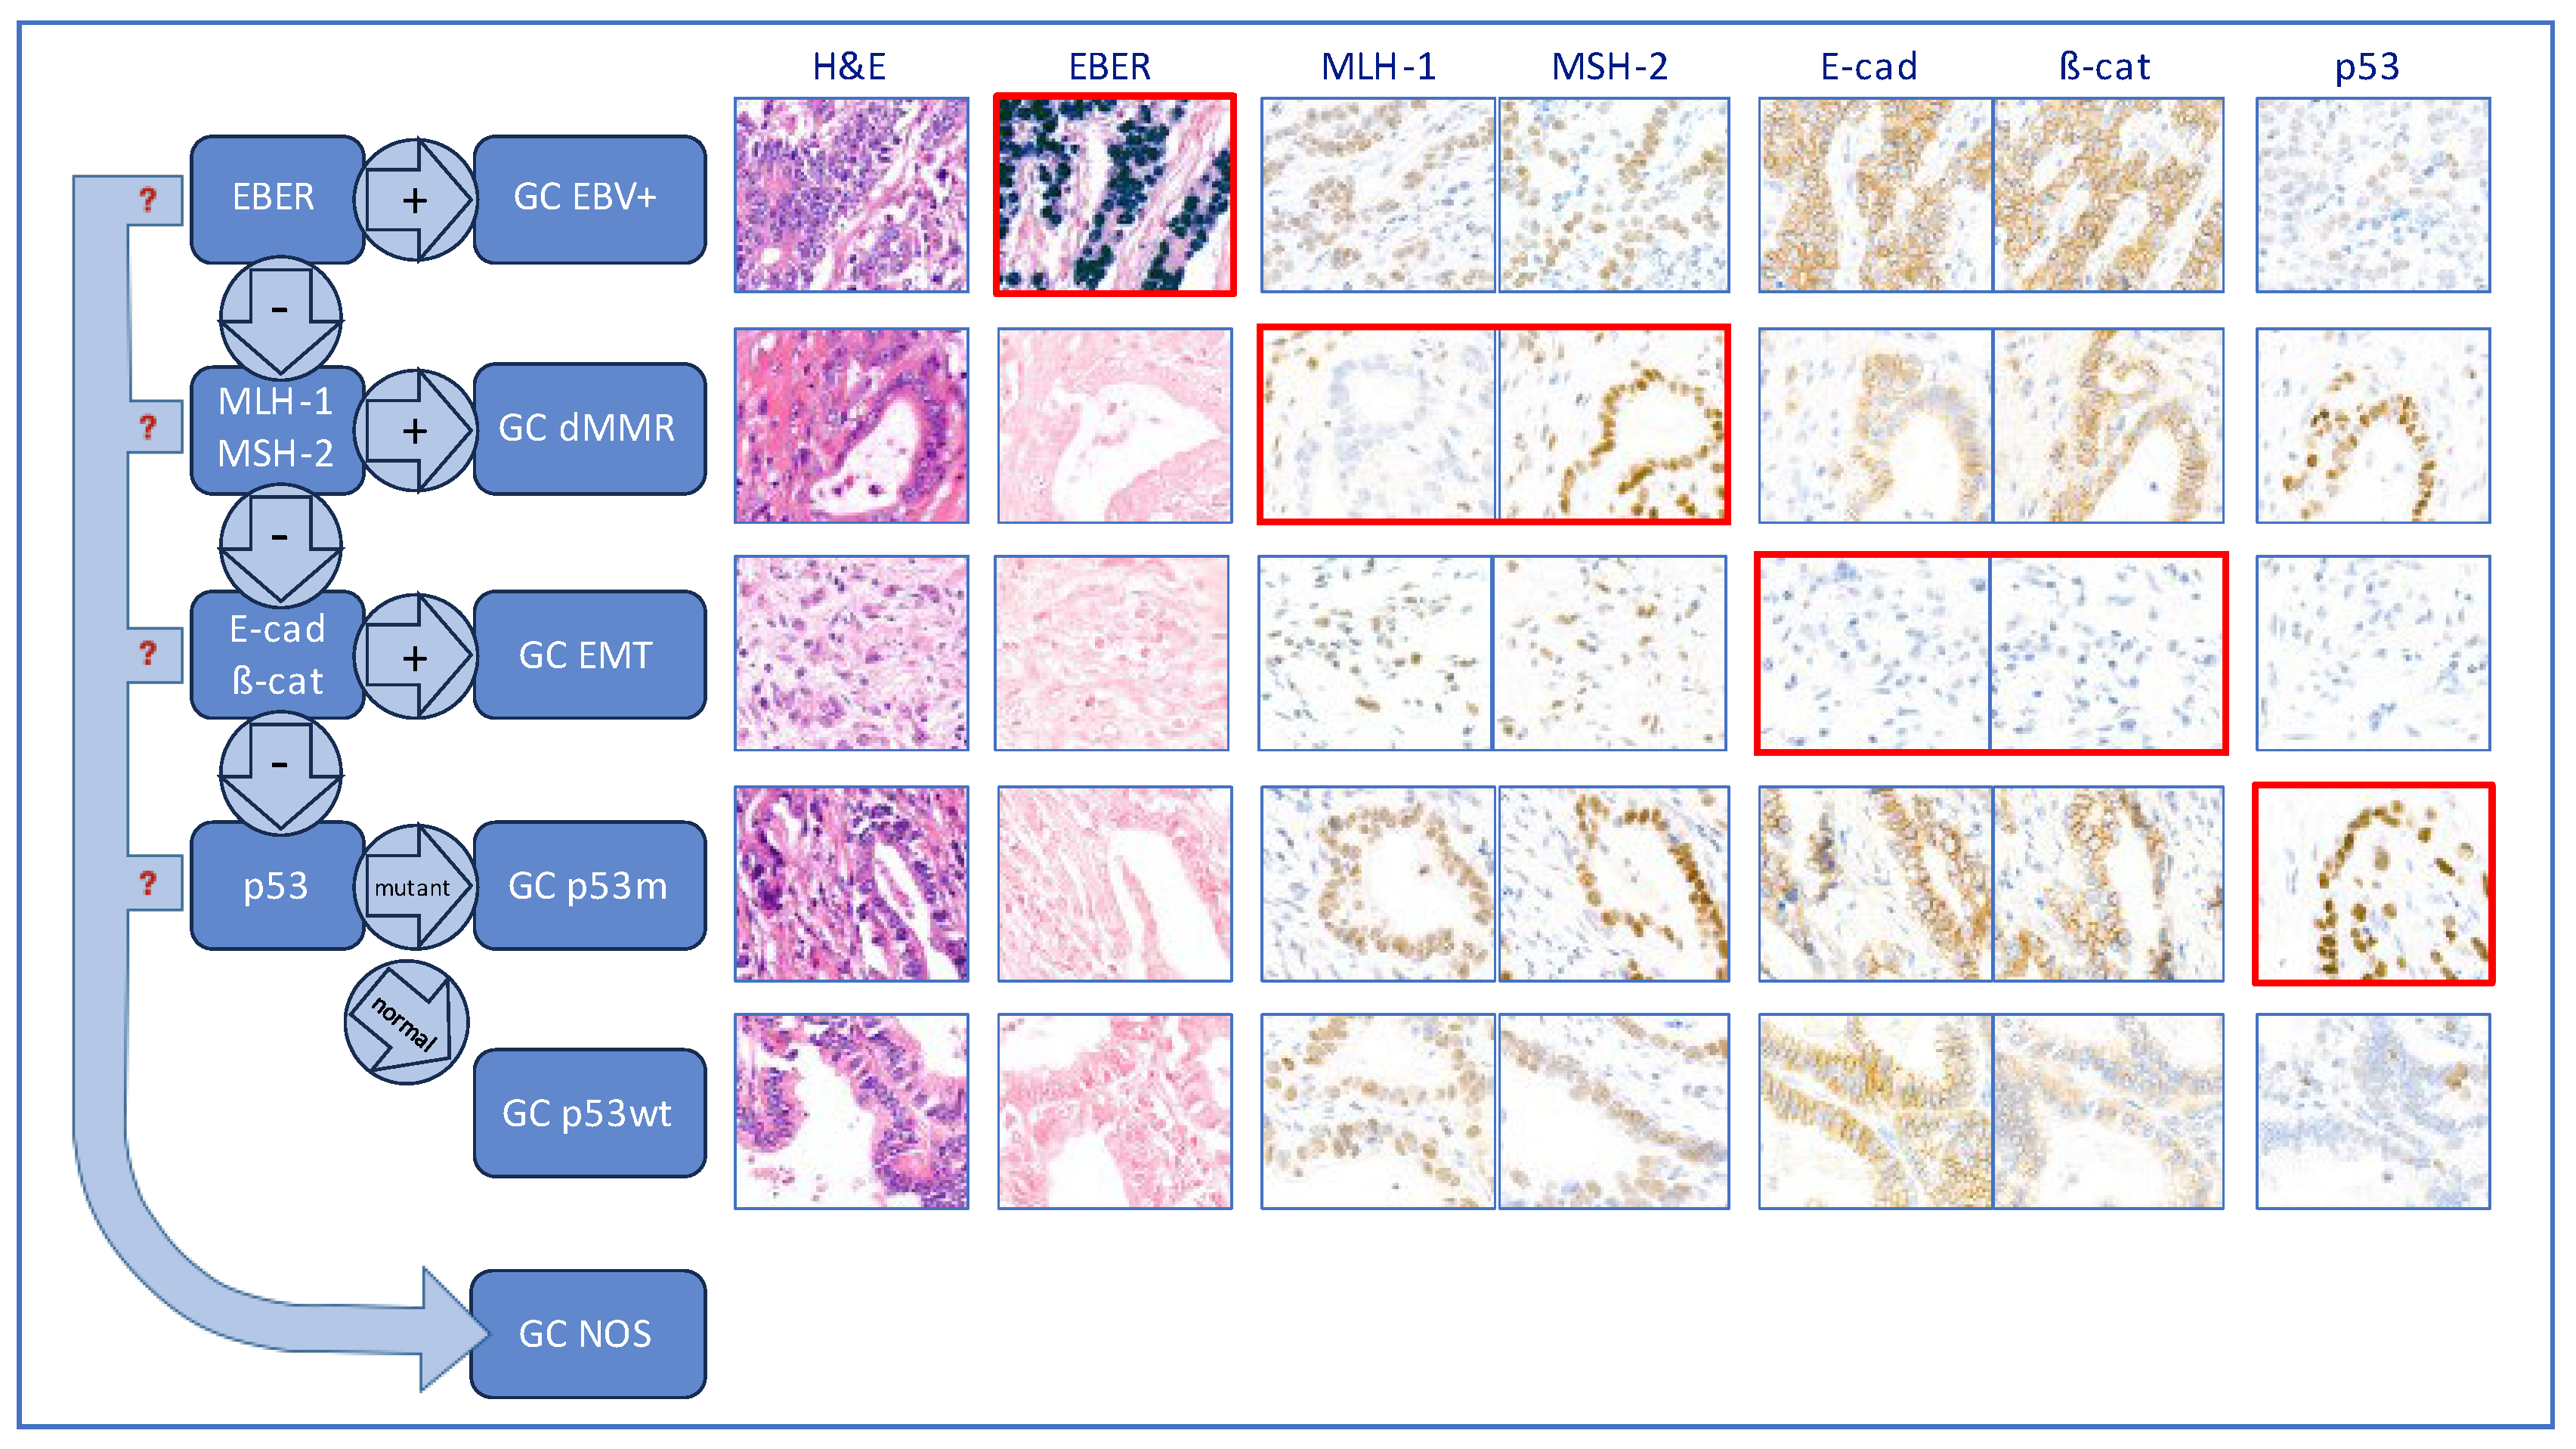
Figure 1. Hierarchical classification. On-slide biomarkers are assessed sequentially; tumours are placed into the GC EBV(+) group is EBER is positive; if EBER is negative, MMR markers are assessed and, if found to be deficient, tumours are classified as dMMR; if MMR proficient, E-cadherin and β-catenin are next assessed and, if expression is aberrent, tumour are classified as GC EMT; lastly, if EMT markers expression is normal, tumours are assessed for p53 mutation and classified accordingly as GC p53m or GC p53wt. The micrographs framed with a red line highlight the critical test results.
Preprints 76759 g001
Figure 2. Predictive on-slide biomarkers. Examples of positive and negative cases of the three predictive biomarkers assessed, photographed at x400 magnification. Case positive for Her2 IHC shows presence of complete membrane staining of strong intensity in the TC; case positive for HER2 DDISH shows presence of large clusters of amplification (denoted by silver black dots) in each TC; case positive for PD-L1 shows membrane staining in TC as well as some staining in IC; case positive for CLDN18.2 shows strong membrane staining in most TC.
Preprints 76759 g002
Figure 3. Molecular classification of our GC study cohort. The pie chart indicates the relative prevalence of each molecular subtype; the bar graphs indicate the prevalence of specific predictive biomarkers (Her2, PD-L1 and Claudin18.2- CLDN18.2) in each of the molecular subtypes.
Preprints 76759 g003
Figure 4. Molecular subgroups and their aggressiveness. This is an indicative diagram considering published papers [2,4,5,6,7,8]. GC EBV(+) and GC dMMR are the two less aggressive subtypes, while GC EMT is the most aggressive. Availability of effective treatment may alter outcomes and therefore the prognosis.
Preprints 76759 g004
Table 1. Lists of reagents used for on-slide tests and protocols.
Test Type Vendor,
Catalogue number
Clone On-slide control Conc. or RTU Retrieval Solution and Time (min) Antibody Incubation Time (min) and T Platform
EBER ISH Ventana, 800-2842 - Cell lines (Ventana) As per package insert
MLH-1 IHC Leica,
PA0988
ES05 Appendix RTU AR1, 30 15min
RT
Bond III
MSH-2 IHC Leica,
PA0989
79H11 Appendix RTU AR2, 30 15min
RT
Bond III
E-cadherin IHC Leica,
PA0387
36B5 Skin RTU AR2, 20 15min
RT
Bond III
Beta catenin IHC Leica,
PA0083
17C2 Skin RTU AR1, 20 15min
RT
Bond III
p53 IHC Leica, P53-DO7-L-CE DO-7 Colon AC 1:200 AR2, 30 15min
RT
Bond III
Her2 IHC Ventana, 790-4493 4B5 Cell lines (Histiocyte) RTU CC1, 36 16min
36C
Benchmark
Ultra
DDISH ISH Ventana, 800-6043 - Cell lines (Histiocyte) As per package insert
PD-L1 (22C3) IHC Agilent, SK006 22C3 Cell lines (Histiocyte) RTU TRS low pH, 20 30min
RT
Dako Autostainer Link 48
Claudin18.2 IHC Ventana, 790-7027 43-14A Stomach RTU CC1, 64 16min
36C
Benchmark
ISH= in situ hybridisation; IHC= immunohistochemistry; AC= adenocarcinoma; RTU= ready to use; AR1 and AR2= Leica antigen retrieval solution 1 and 2; CC1 and CC2= Roche Ventana cell conditioning solution 1 and 2; TRS= Dako Agilent target retrieval solution low pH.
Table 2. Molecular classification of the study cohort.
Molecular type Prevalence Laurén’s type
GC EBV(+) 6% Intestinal: 80%
Diffuse: 20%
GC dMMR 20% Intestinal: 88%
Diffuse: 13%
GC EMT 14% Intestinal: 9%
Diffuse: 91%
GC p53m 23% Intestinal: 94%
Diffuse: 6%
GC p53wt 29% Intestinal: 87%
Diffuse: 13%
GC NOS 8% Intestinal: 50%
Diffuse: 50%
Disclaimer/Publisher’s Note: The statements, opinions and data contained in all publications are solely those of the individual author(s) and contributor(s) and not of MDPI and/or the editor(s). MDPI and/or the editor(s) disclaim responsibility for any injury to people or property resulting from any ideas, methods, instructions or products referred to in the content.
Copyright: This open access article is published under a Creative Commons CC BY 4.0 license, which permit the free download, distribution, and reuse, provided that the author and preprint are cited in any reuse.
Prerpints.org logo

Preprints.org is a free preprint server supported by MDPI in Basel, Switzerland.

Subscribe

© 2024 MDPI (Basel, Switzerland) unless otherwise stated