Submitted:
15 June 2023
Posted:
16 June 2023
You are already at the latest version
Abstract
Keywords:
1. Introduction
- RQ1 [Acceptability of SAEF] How do students and educators accept SAEF to develop audiometric examination procedural competencies and skills?
- RQ2 [Functional Validity of SAEF] How does SAEF functional validation allow the development of procedural competencies and skills with the audiometric examination?
2. Audiometry Simulator SAEF
2.1. Procedure for the Search for hearing thresholds
2.2. SAEF
3. Methodology
3.1. Study characteristics
3.2. Population and sample
3.3. Data collection instruments
3.4. Analysis procedure
4. Results
5. Discussion
6. Conclusions
- SAEF is compliant from the user’s perspective, and users accept all of its features, including the output quality, demonstrability of results, subjective norm, perceived utility, perceived ease of use, image, and work relevance.
- After some time of usage, the SAEF’s most notable features point to the software’s easy-to-understand interface. The SAEF system is simple to use and doesn’t need much thought, and users may readily explain how it works to other users.
- According to the evaluation by subject-matter experts, SAEF accurately replicates the audiometry technique by international standards and adheres to the learning outcomes of the topic.
- The new SAEF v.2 has functional and interface upgrades that give even more striking parallels to the instrument.
- SAEF represents a sustainable open-source Java application currently applied for developing speech and language therapy competencies in students in Chile and Ecuador. Due to its open-source nature, SAEF does not require special permissions, and we can massify its use without restrictions.
References
- Morgan, S.D.; Zeng, F.G.; Clark, J. Adopting change and incorporating technological advancements in audiology education, research, and clinical practice. American Journal of Audiology 2022, 31, 1052–1058. [Google Scholar] [CrossRef]
- Sharma, A.; Glick, H. Cortical Neuroplasticity in Hearing Loss: Why It Matters in Clinical Decision-Making for Children and Adults: Observing changes in brain processing–and adjusting our intervention strategies accordingly. The Hearing Review 2018, 25, 20–25. [Google Scholar]
- Idstad, M.; Engdahl, B. Childhood sensorineural hearing loss and educational attainment in adulthood: Results from the HUNT study. Ear and Hearing 2019, 40, 1359–1367. [Google Scholar] [CrossRef] [PubMed]
- Jung, D.; Bhattacharyya, N. Association of hearing loss with decreased employment and income among adults in the United States. Annals of Otology, Rhinology & Laryngology 2012, 121, 771–775. [Google Scholar]
- Linszen, M.M.; Brouwer, R.M.; Heringa, S.M.; Sommer, I.E. Increased risk of psychosis in patients with hearing impairment: review and meta-analyses. Neuroscience & Biobehavioral Reviews 2016, 62, 1–20. [Google Scholar]
- Shukla, A.; Harper, M.; Pedersen, E.; Goman, A.; Suen, J.J.; Price, C.; Applebaum, J.; Hoyer, M.; Lin, F.R.; Reed, N.S. Hearing loss, loneliness, and social isolation: a systematic review. Otolaryngology–Head and Neck Surgery 2020, 162, 622–633. [Google Scholar] [CrossRef]
- WHO. World Health Organization. https://www.who.int/, 2022. Accessed: 2023-05-27.
- Corvalan, C.; Villalobos Prats, E.; Sena, A.; Campbell-Lendrum, D.; Karliner, J.; Risso, A.; Wilburn, S.; Slotterback, S.; Rathi, M.; Stringer, R.; others. Towards climate resilient and environmentally sustainable health care facilities. International Journal of Environmental Research and Public Health 2020, 17, 8849. [Google Scholar] [CrossRef]
- Ghanbari, M.K.; Behzadifar, M.; Doshmangir, L.; Martini, M.; Bakhtiari, A.; Alikhani, M.; Bragazzi, N.L. Mapping research trends of universal health coverage from 1990 to 2019: bibliometric analysis. JMIR Public Health and Surveillance 2021, 7, e24569. [Google Scholar] [CrossRef]
- Sandoval-Barrientos, S.; Arntz-Vera, J.; Flores-Negrin, C.; Trunce-Morales, S.; Pérez-Carrasco, A.; López-Uribe, J.; Velásquez-Scheuch, J. Propuesta de formación interprofesional en 4 programas de licenciatura de profesionales sanitarios. Educación Médica 2019, 20, 25–32. [Google Scholar] [CrossRef]
- Vila, L.E.; Dávila Quintana, D.; Mora, J.G. Competências para a inovação nas universidades da América Latina: uma análise empírica. Revista Iberoamericana de Educación Superior 2010, 1, 5–23. [Google Scholar]
- Villca, S. Simulación clínica y seguridad de los pacientes en la educación médica. Revista Ciencia, Tecnología e Innovación 2018, 16, 75–88. [Google Scholar] [CrossRef]
- Vega Rodríguez, Y.E.; Torres Rodríguez, A.M.; del Campo Rivas, M.N. Análisis del Rol del Fonoaudiólogo (a) en el Sector Salud en Chile. Ciencia & trabajo 2017, 19, 76–80. [Google Scholar]
- Angelopoulou, E.; Papachristou, N.; Bougea, A.; Stanitsa, E.; Kontaxopoulou, D.; Fragkiadaki, S.; Pavlou, D.; Koros, C.; Değirmenci, Y.; Papatriantafyllou, J.; others. How Telemedicine Can Improve the Quality of Care for Patients with Alzheimer’s Disease and Related Dementias? A Narrative Review. Medicina 2022, 58, 1705. [Google Scholar] [CrossRef] [PubMed]
- Orellana, A.M.; Oyarzún-Díaz, P.A.; Briones-Rojas, C.; Vidal-Silva, C.L. Prototipo de simulador de audiometría para estudiantes de fonoaudiología de la Universidad Santo Tomás, Chile. Formación universitaria 2020, 13, 3–10. [Google Scholar] [CrossRef]
- Campbell, J.; Graley, J.; Meinke, D.; Vaughan, L.; Aungst, R.; Madison, T. Guidelines for manual pure-tone threshold audiometry. Rockville, MD: American Speech-Language-Hearing Association (ASHA) 2005, 20, 297–301. [Google Scholar]
- Katz, J. Handbook of clinical audiology, 2015.
- Larsen, K.R.; Lukyanenko, R.; Mueller, R.M.; Storey, V.C.; VanderMeer, D.; Parsons, J.; Hovorka, D.S. Validity in design science research. Designing for Digital Transformation. Co-Creating Services with Citizens and Industry: 15th International Conference on Design Science Research in Information Systems and Technology, DESRIST 2020, Kristiansand, Norway, December 2–4, 2020, Proceedings 15. Springer, 2020, pp. 272–282.
- Narang, P.; Mittal, P. Software Development Methodologies: Trending from Traditional to DOSE-An Empirical Study. 2022 IEEE Delhi Section Conference (DELCON). IEEE, 2022, pp. 1–6.
- Rosli, M.S.; Saleh, N.S.; Ali, A.M.; Abu Bakar, S.; Mohd Tahir, L. A Systematic Review of the Technology Acceptance Model for the Sustainability of Higher Education during the COVID-19 Pandemic and Identified Research Gaps. Sustainability 2022, 14, 11389. [Google Scholar] [CrossRef]
- AlQudah, A.A.; Al-Emran, M.; Shaalan, K. Technology acceptance in healthcare: A systematic review. Applied Sciences 2021, 11, 10537. [Google Scholar] [CrossRef]
- Sukendro, S.; Habibi, A.; Khaeruddin, K.; Indrayana, B.; Syahruddin, S.; Makadada, F.A.; Hakim, H. Using an extended Technology Acceptance Model to understand students’ use of e-learning during Covid-19: Indonesian sport science education context. Heliyon 2020, 6, e05410. [Google Scholar] [CrossRef] [PubMed]
- Guo, Y.; Chen, J.; Liu, Z. Government responsiveness and public acceptance of big-data technology in urban governance: Evidence from China during the COVID-19 pandemic. Cities 2022, 122, 103536. [Google Scholar] [CrossRef]
- ASHA. American Speech-Language-Hearing Association (ASHA). https://www.asha.org/, 2022. Accessed: 2022-12-27.
- Kouriati, A.; Moulogianni, C.; Kountios, G.; Bournaris, T.; Dimitriadou, E.; Papadavid, G. Evaluation of Critical Success Factors for Enterprise Resource Planning Implementation Using Quantitative Methods in Agricultural Processing Companies. Sustainability 2022, 14, 6606. [Google Scholar] [CrossRef]
- Luna-Krauletz, M.D.; Juárez-Hernández, L.G.; Clark-Tapia, R.; Súcar-Súccar, S.T.; Alfonso-Corrado, C. Environmental education for sustainability in higher education institutions: design of an instrument for its evaluation. Sustainability 2021, 13, 7129. [Google Scholar] [CrossRef]
- Pereira, D.G.; Afonso, A.; Medeiros, F.M. Overview of Friedman’s test and post-hoc analysis. Communications in Statistics-Simulation and Computation 2015, 44, 2636–2653. [Google Scholar] [CrossRef]
- Pacces, A.M. Will the EU Taxonomy Regulation Foster Sustainable Corporate Governance? Sustainability 2021, 13, 12316. [Google Scholar] [CrossRef]
- Ashraf, H.; Waris, A.; Jamil, M.; Gilani, S.O.; Niazi, I.K.; Kamavuako, E.N.; Gilani, S.H.N. Determination of optimum segmentation schemes for pattern recognition-based myoelectric control: a multi-dataset investigation. IEEE Access 2020, 8, 90862–90877. [Google Scholar] [CrossRef]
- Coskun, S. Zero Waste Management Behavior: Conceptualization, Scale Development and Validation—A Case Study in Turkey. Sustainability 2022, 14, 12654. [Google Scholar] [CrossRef]
- Abbas, J.; Aman, J.; Nurunnabi, M.; Bano, S. The impact of social media on learning behavior for sustainable education: Evidence of students from selected universities in Pakistan. Sustainability 2019, 11, 1683. [Google Scholar] [CrossRef]
- Alamri, M.M.; Almaiah, M.A.; Al-Rahmi, W.M. Social media applications affecting Students’ academic performance: A model developed for sustainability in higher education. Sustainability 2020, 12, 6471. [Google Scholar] [CrossRef]
- Lozano-Díaz, A.; Fernández-Prados, J.S. Educating digital citizens: An opportunity to critical and activist perspective of sustainable development goals. Sustainability 2020, 12, 7260. [Google Scholar] [CrossRef]
- Orellana, A.M.; Oyarzún-Díaz, P.A.; Briones-Rojas, C.; Vidal-Silva, C.L. Validation and optimization of the prototype of audiometry simulator for speech therapy students ASST in pandemic times. Formación universitaria 2023, 16, 3–12. [Google Scholar]
- Venkatesh, V.; Bala, H. Technology acceptance model 3 and a research agenda on interventions. Decision sciences 2008, 39, 273–315. [Google Scholar] [CrossRef]
- Lim, T.L.; Lee, A.S.H. Extended TAM and TTF Model: A Framework for the 21 st Century Teaching and Learning. 2021 International Conference on Computer & Information Sciences (ICCOINS). IEEE, 2021, pp. 339–334.
- Crawford, J.; Cifuentes-Faura, J. Sustainability in higher education during the COVID-19 pandemic: A systematic review. Sustainability 2022, 14, 1879. [Google Scholar] [CrossRef]
- Imran, M.; Hina, S.; Baig, M.M. Analysis of Learner’s Sentiments to Evaluate Sustainability of Online Education System during COVID-19 Pandemic. Sustainability 2022, 14, 4529. [Google Scholar] [CrossRef]
- Faura-Martínez, U.; Lafuente-Lechuga, M.; Cifuentes-Faura, J. Sustainability of the Spanish university system during the pandemic caused by COVID-19. Educational Review 2022, 74, 645–663. [Google Scholar] [CrossRef]
- Avendaño, W.R.; Luna, H.O.; Rueda, G. Educación virtual en tiempos de COVID-19: percepciones de estudiantes universitarios. Formación universitaria 2021, 14, 119–128. [Google Scholar] [CrossRef]
- Rahimi, B.; Nadri, H.; Afshar, H.L.; Timpka, T. A systematic review of the technology acceptance model in health informatics. Applied clinical informatics 2018, 9, 604–634. [Google Scholar] [CrossRef]
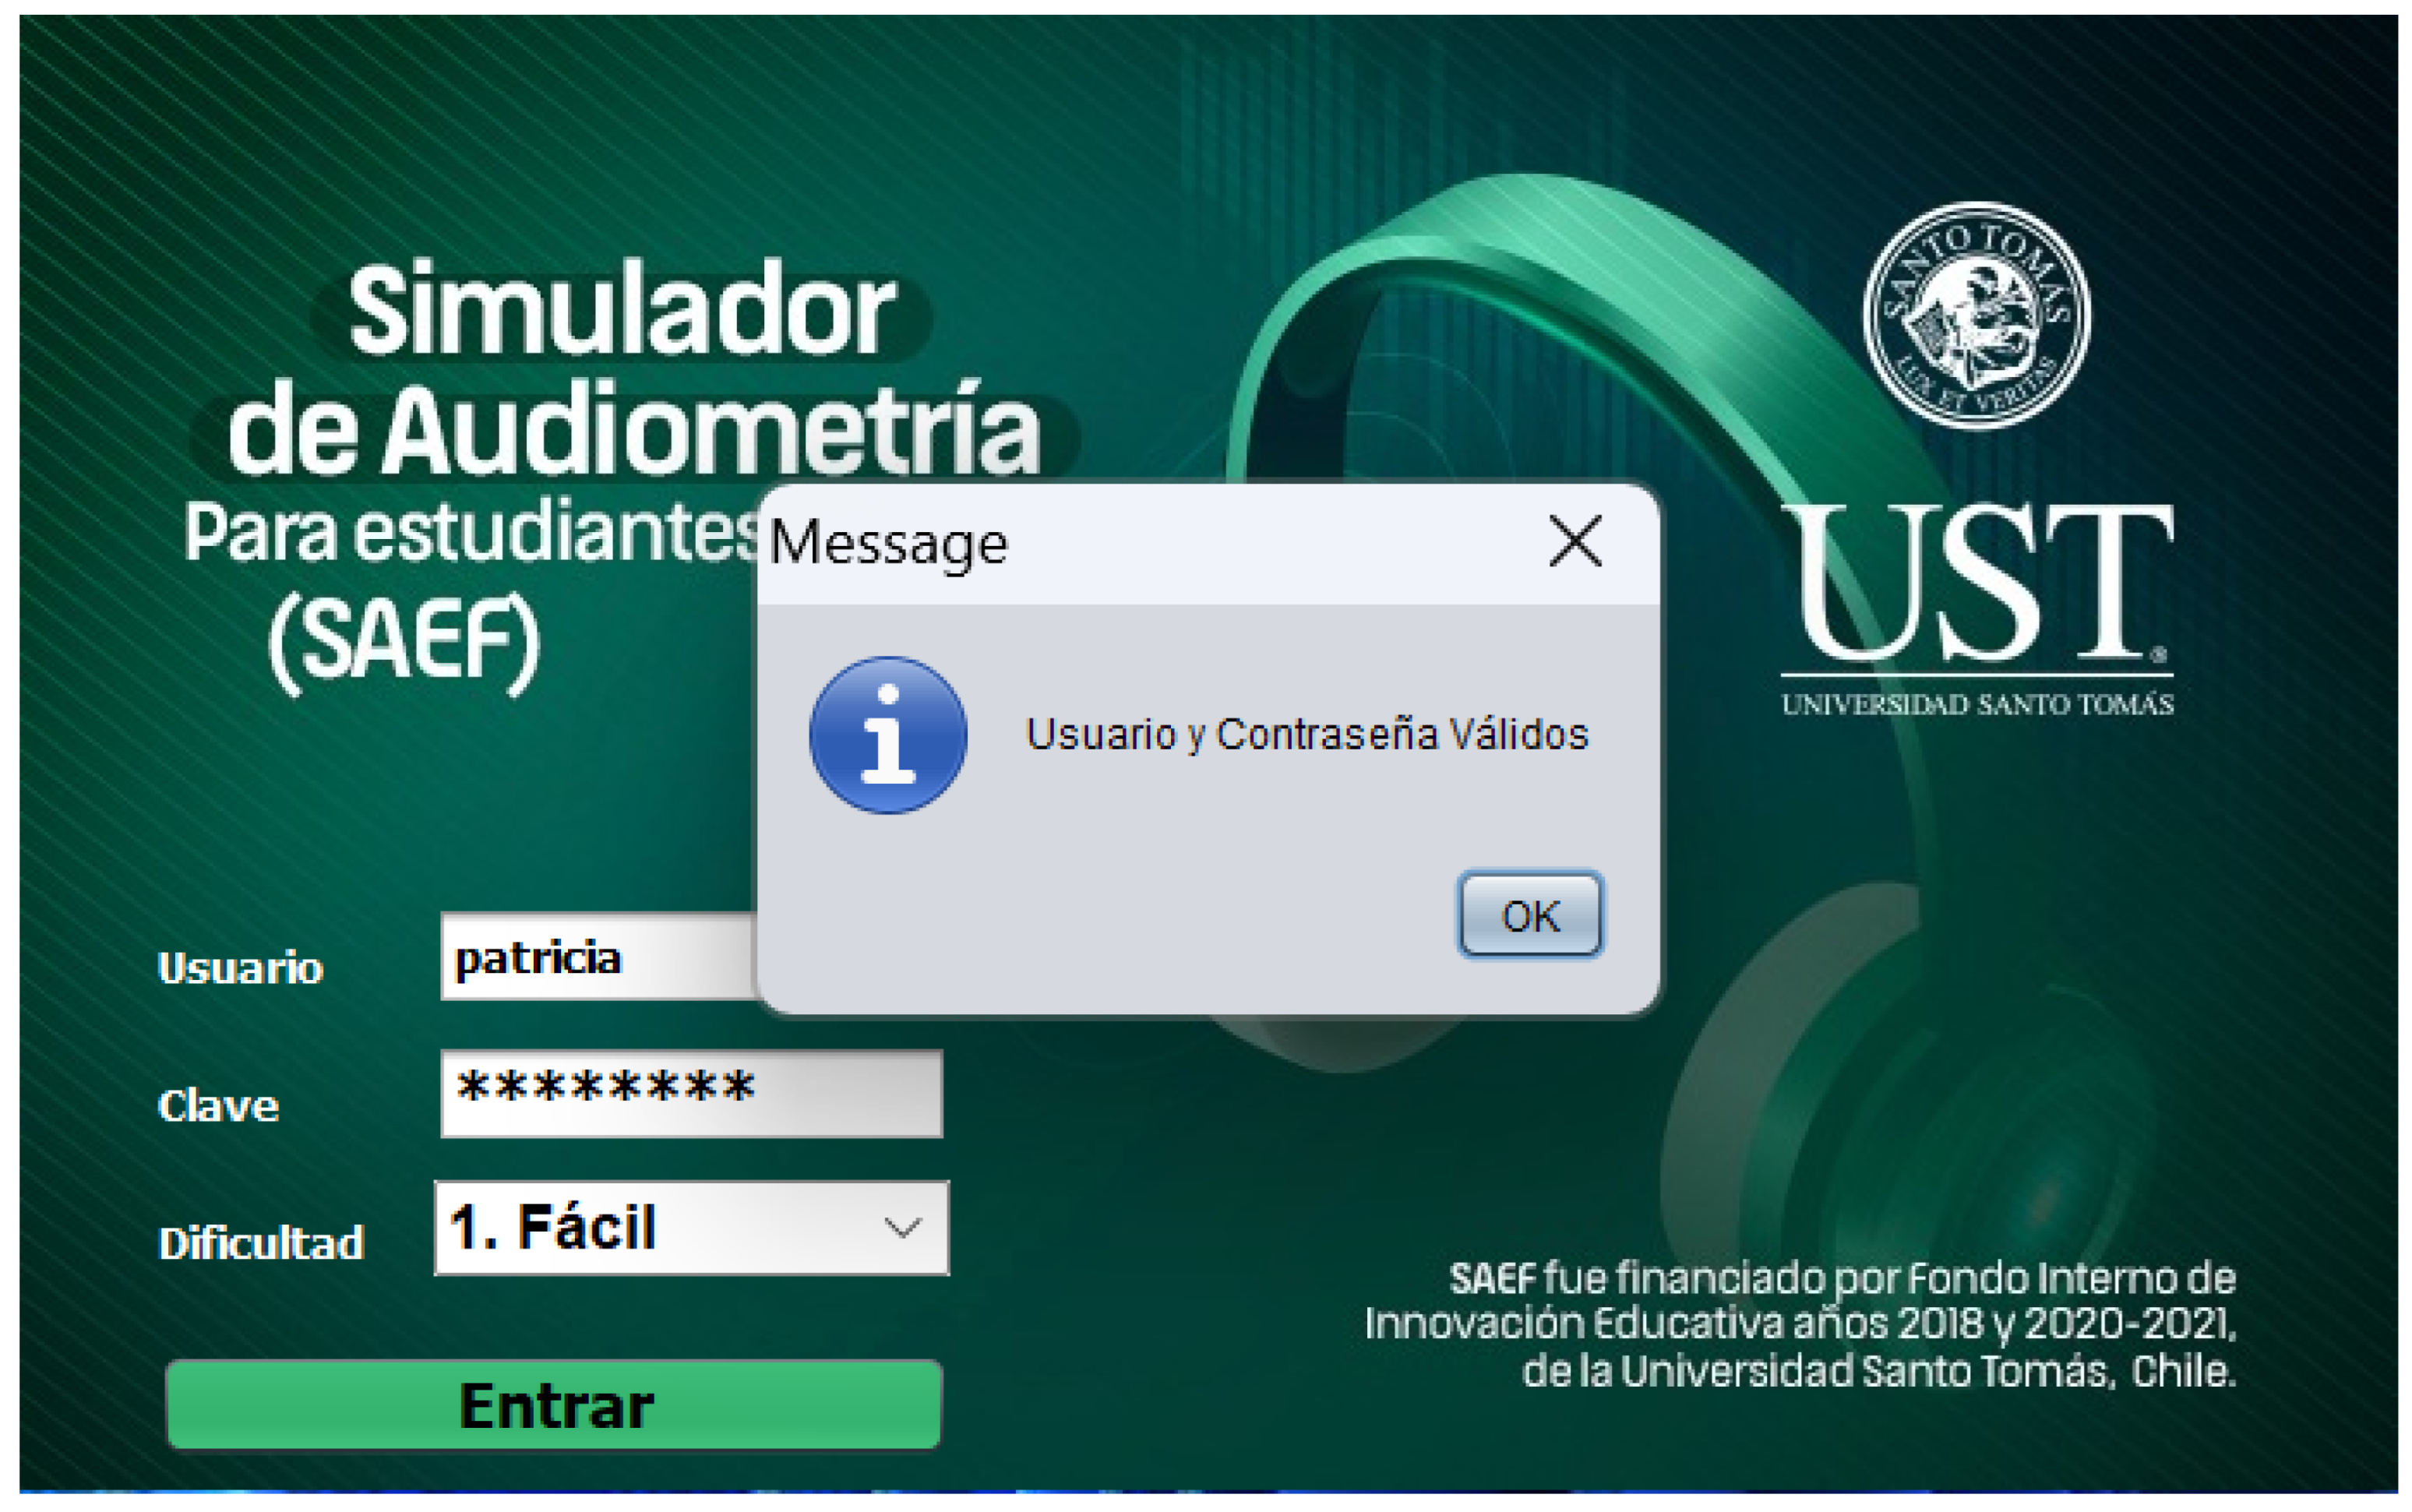
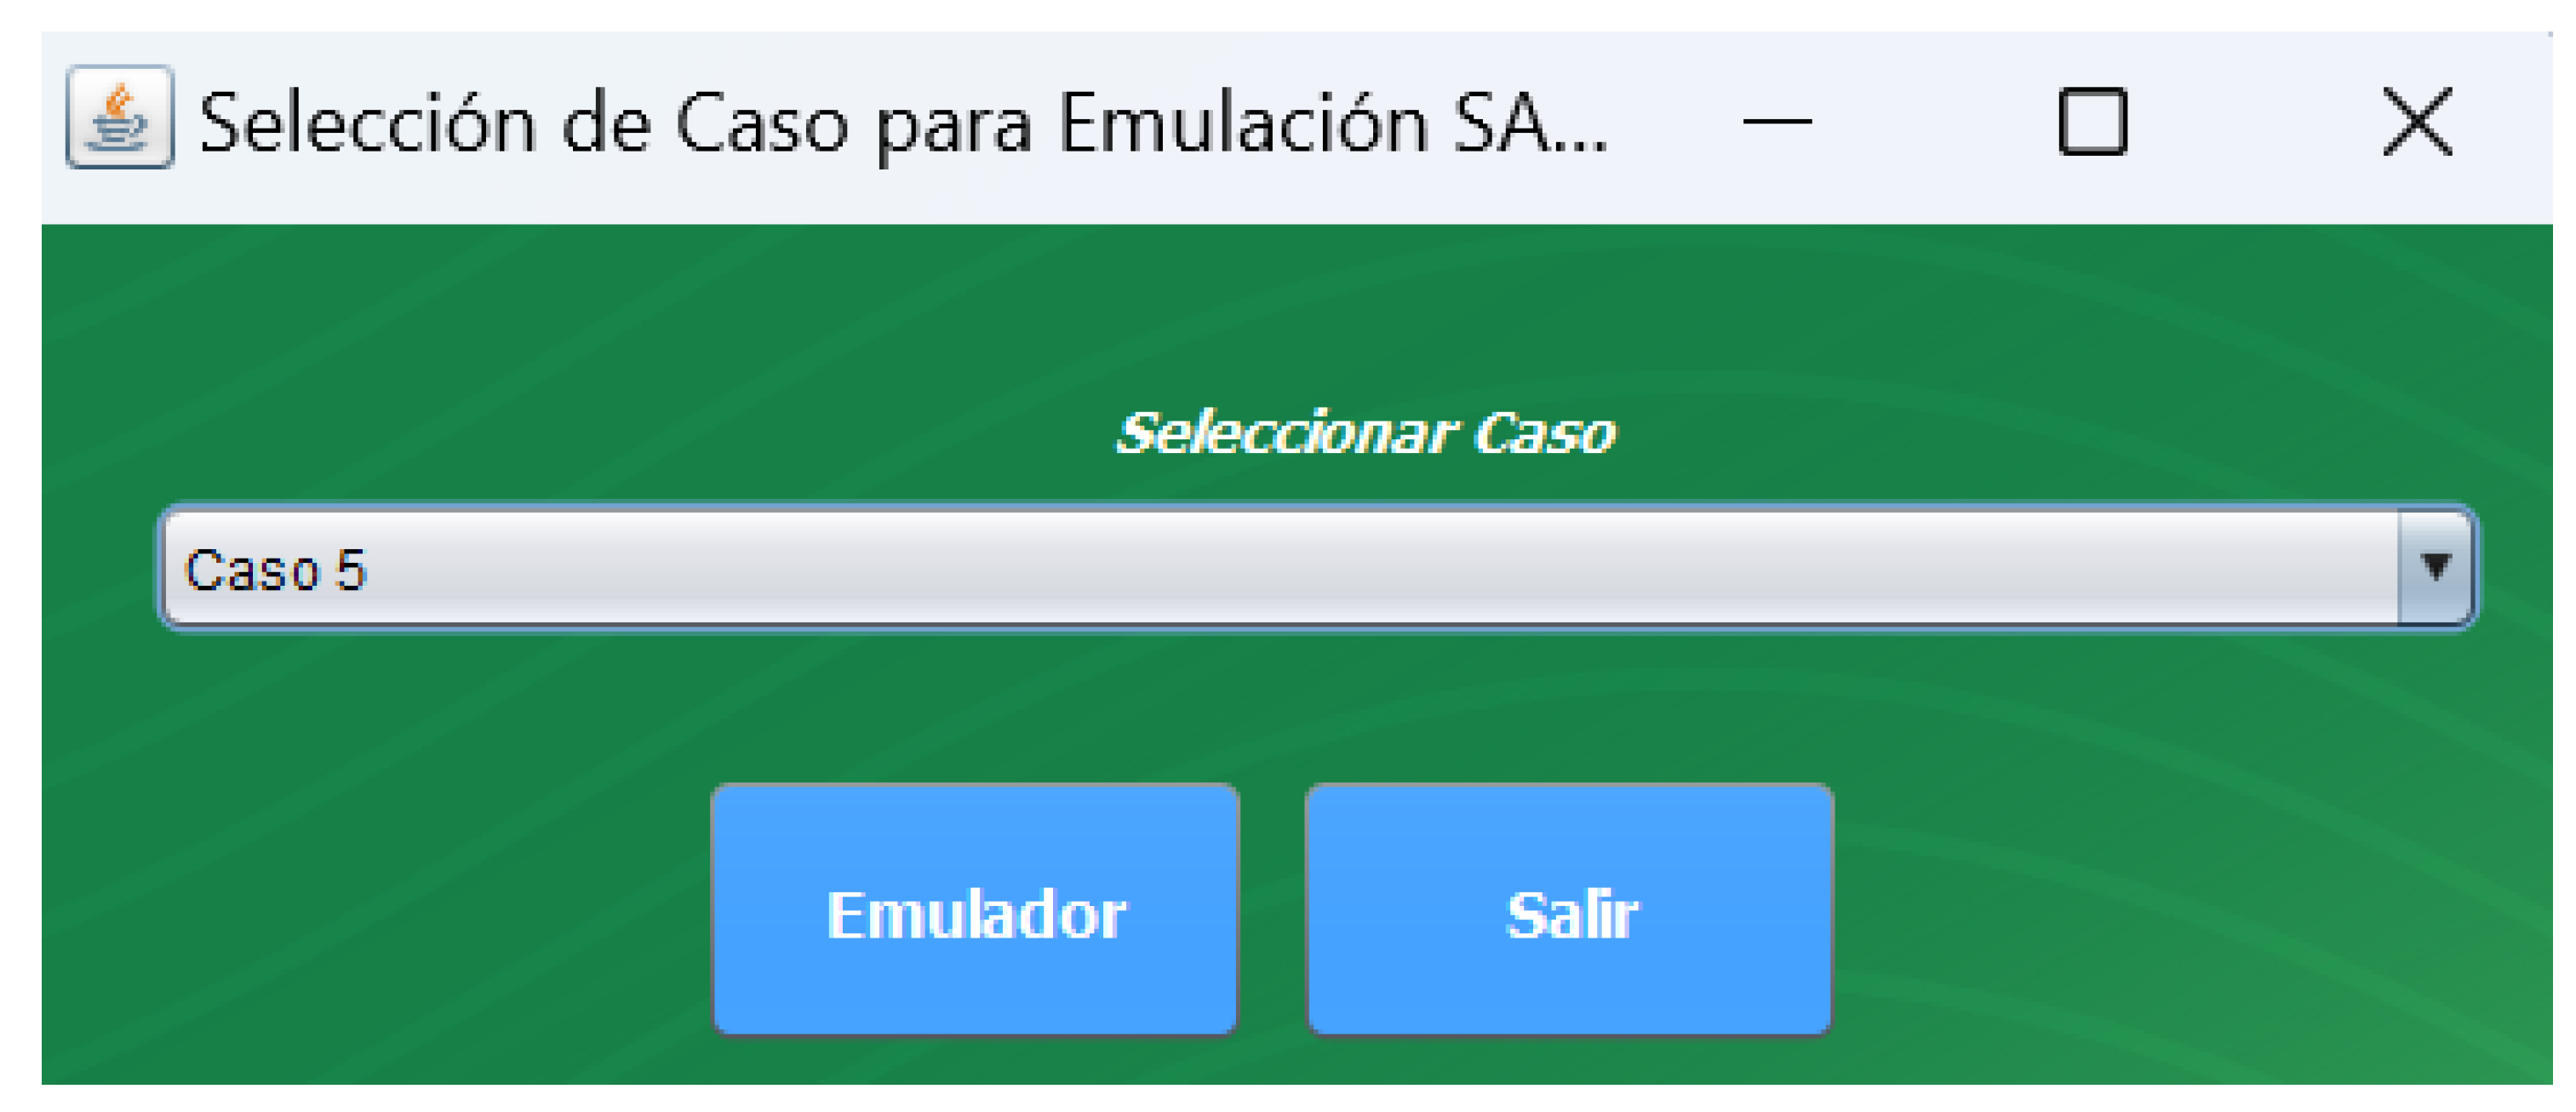
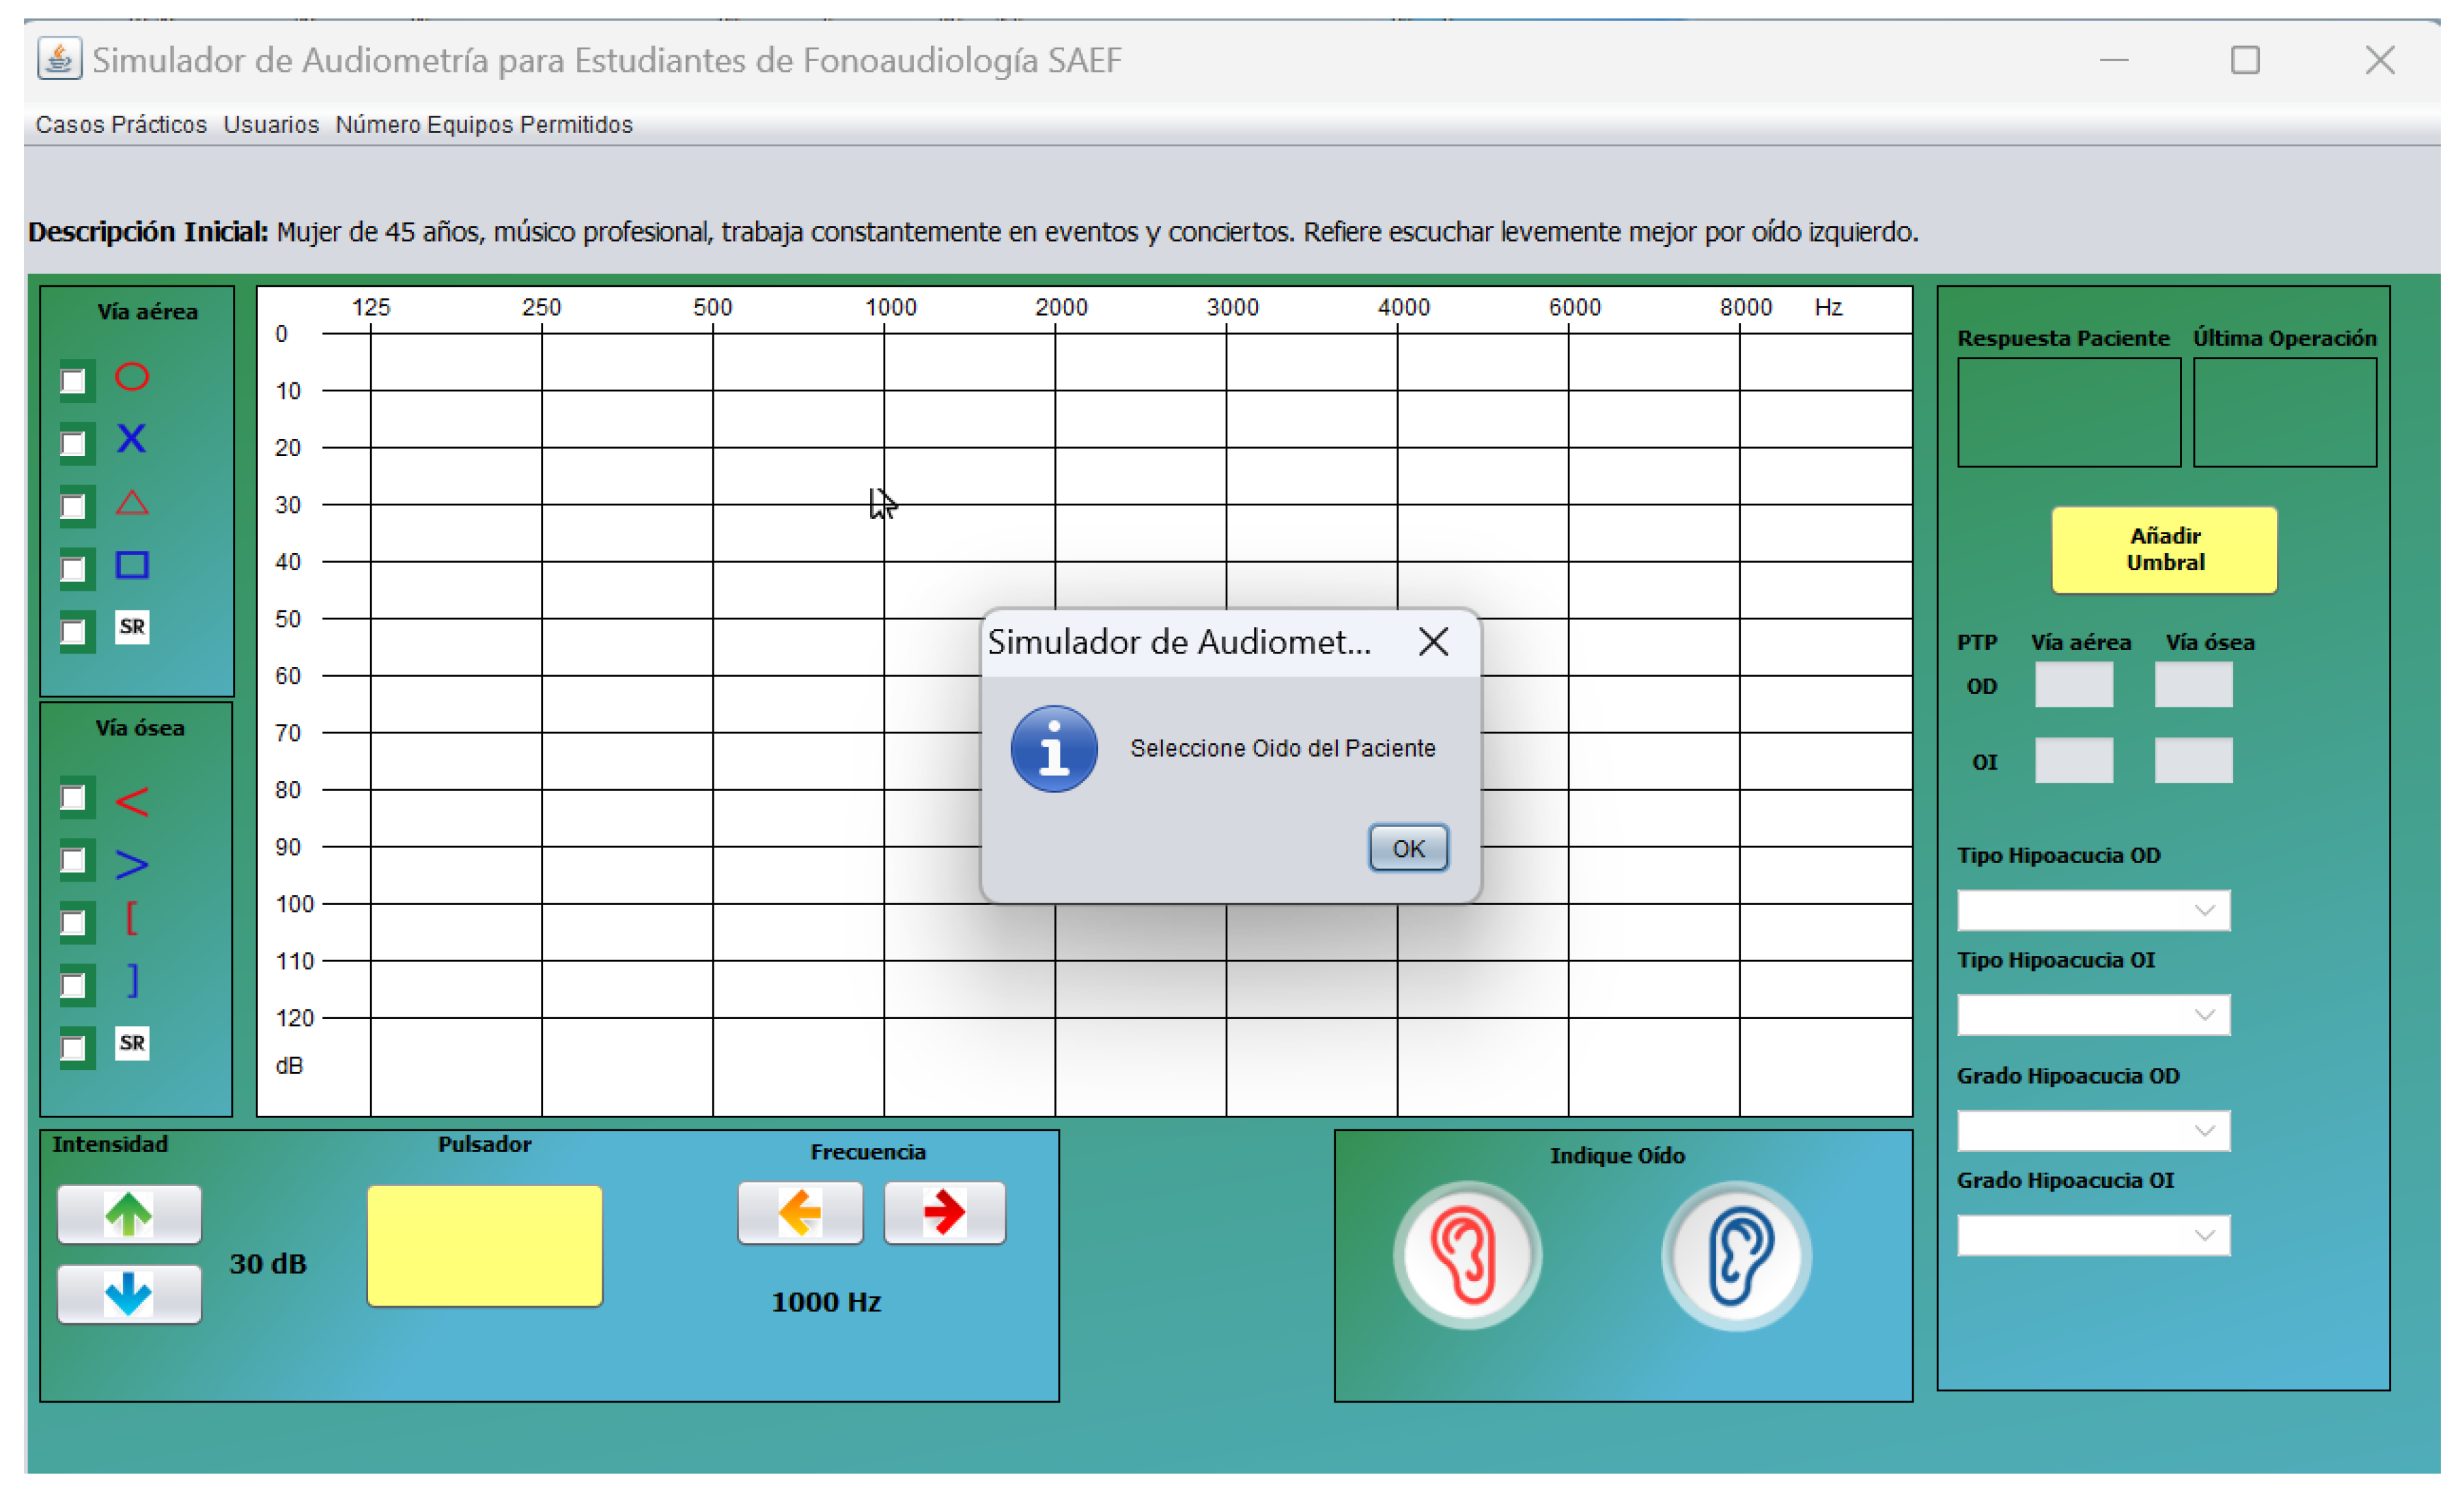
| Ítems | 1 | 2 | 3 | 4 | 5 | 6 | 7 |
|---|---|---|---|---|---|---|---|
| Intent of use | |||||||
| 1. Assuming I have access to the system, I intend to use it. | |||||||
| 2. Since I have access to the system, I predict I will use it. | |||||||
| Perceived utility | |||||||
| 3. Using the system improves my performance at work. | |||||||
| 4. Using the system at work increases my productivity. | |||||||
| 5. Using the system improves my effectiveness in my work. | |||||||
| 6. I find the system useful in my work. | |||||||
| Perceived ease of use | |||||||
| 7. My interaction with the system is clear and understandable. | |||||||
| 8. Interacting with the system does not require much mental effort. | |||||||
| 9. I find the system easy to use. | |||||||
| 10. I find it easy to make the system do what I want it to do. | |||||||
| Subjective norm | |||||||
| 11. The people who influence my behavior think that I should use the system. |
|||||||
| 12. People who are important to me think that I should use the system. |
|||||||
| Volunteering | |||||||
| 13. My use of the system is voluntary. | |||||||
| 14. My supervisor does not require me to use the system. | |||||||
| 15. Although it can be useful, the use of the system is certainly not mandatory in my work. |
|||||||
| User interface | |||||||
| 16. People in my organization who use the system have more prestige than those who don’t. |
|||||||
| 17. The people in my organization who use the system are high profile. |
|||||||
| 18. Having the system is a symbol of rank (status) in my organization. |
|||||||
| Job relevance | |||||||
| 19. In my work, the use of the system is important. | |||||||
| 20. In my work, the use of the system is relevant. | |||||||
| Output quality | |||||||
| 21. The output of the system is of high quality. | |||||||
| 22. I have no problem with the quality of the system output. | |||||||
| Demonstrability of results | |||||||
| 23. I have no difficulty telling others about the results of using the system. |
|||||||
| 24. I think that I could communicate to others the consequences of using the system. |
|||||||
| 25. The results of using the system are evident to me. | |||||||
| 26. You would have difficulty explaining why using the system may or may not be beneficial. |
| Items | 1 | 2 | 3 | 4 | 5 |
|---|---|---|---|---|---|
| Hearing threshold search procedure | |||||
| 1. It allows starting with the best ear self-reported by the patient or, if both ears are believed to be identical, starting by convention in the right ear. |
|||||
| 2. It allow you to perform a "Down-up" procedure or descending method to search for hearing thresholds. |
|||||
| 3. It allows starting the threshold search procedure by presenting a tone at 30 dB HL at the frequency of 1000 Hz. |
|||||
| 4. As there is no response to the initial tone, it allows the intensity of the stimulus to be increased by 20 dB HL until a response is obtained (action only valid for the frequency of 1000 Hz). |
|||||
| 5. If the patient responds, it allows you to reduce the tone level by 10 dB until the patient no longer responds. |
|||||
| 6. When there is no response, it allows the examiner to increase the tone level by 5 dB until a response is obtained. |
|||||
| 7. The hearing threshold is obtained from 2 responses in ascending runs. |
|||||
| 8. After evaluating 1000 Hz, the software allows you to continue with the evaluation of the following frequencies (125 to 8000 Hz), evaluating the highest frequencies and later the low frequencies. |
|||||
| 9. It allows starting the procedure at the next frequency, increasing 30 dB to the threshold obtained at the next frequency. |
|||||
| 10. Once the evaluation of the airway of the better ear is completed, it is possible to continue with the contralateral airway. Subsequently, the bone pathway of the worst ear resulting from the airways is already evaluated; and finally, evaluate the contralateral bone pathway. |
|||||
| Student performance feedback. | |||||
| 11. The program provides information on student performance. | |||||
| 12. The information provided is useful for individual feedback. | |||||
| 13. The program provides feedback to the student on her performance at different stages of the procedure. |
|||||
| 14. The program allows the student to make diagnostic decisions regarding the results obtained in the audiometry. |
|||||
| 15. The analysis of the information delivered by the program helps to identify general aspects of the group/course that must be reinforced. |
|||||
| 16. In general, the program is useful for the professors regarding feedback on student performance |
|||||
| Procedures carried out based on learning results | |||||
| 17. The program is a useful tool to achieve learning outcomes: Apply descending audiometric technique to obtain hearing thresholds. |
|||||
| 18. The program is a useful tool to achieve the following learning outcome: Classify hearing loss according to audiometric findings. |
|||||
| 19. In general, the program is a useful complement to the development of the subject. |
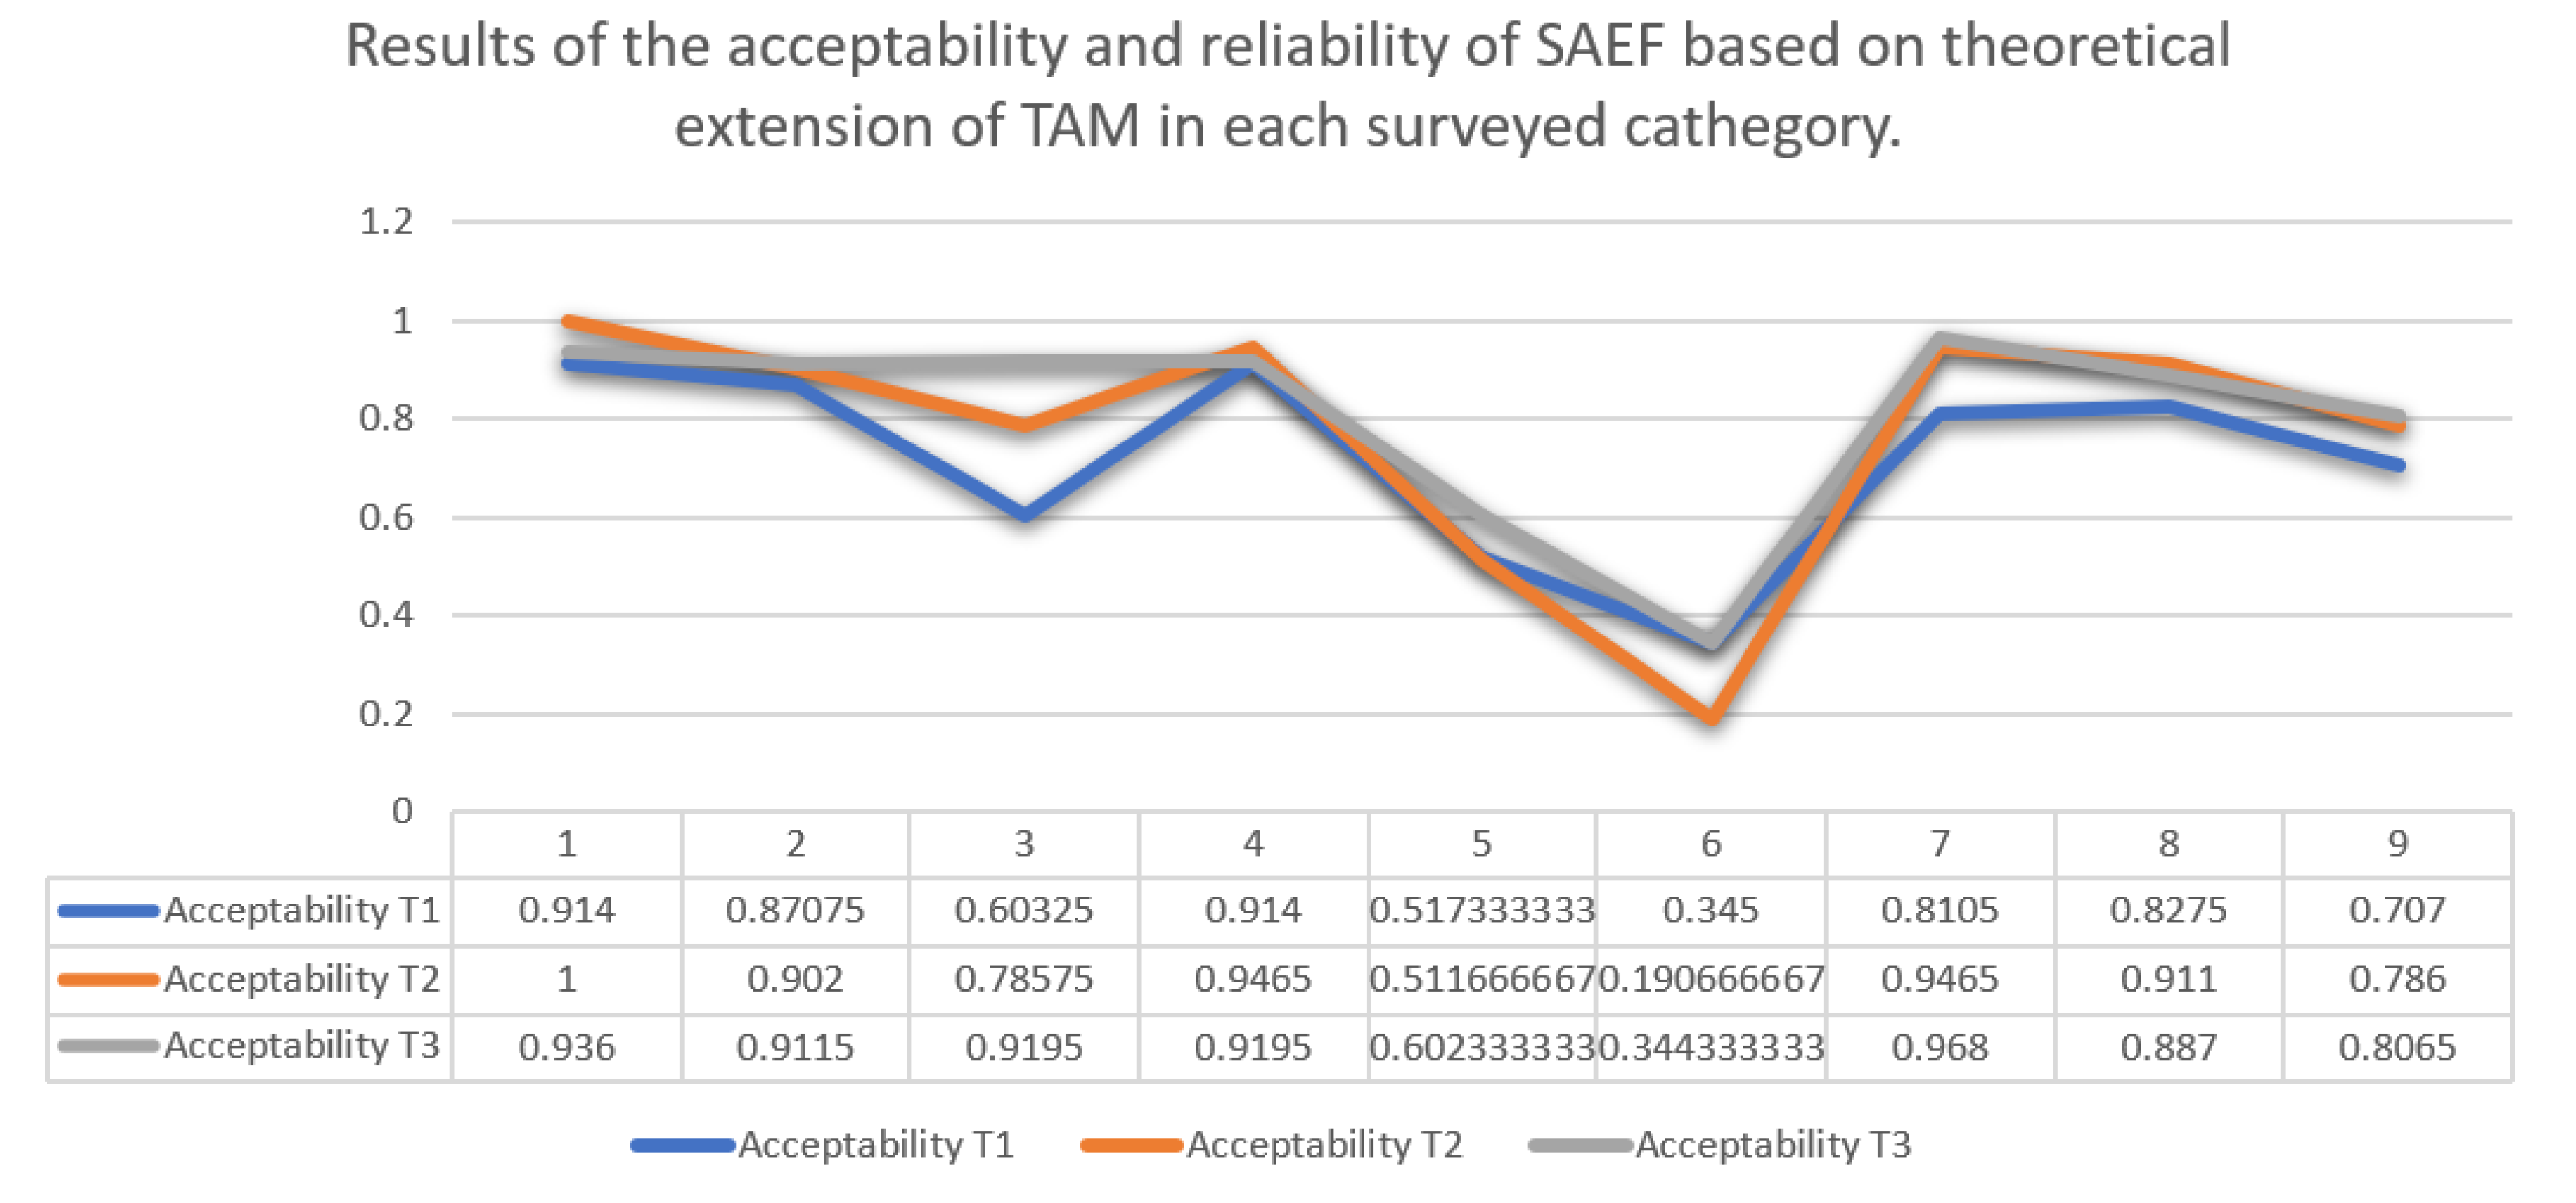
| Question | Acceptability T1 | Acceptability T2 | Acceptability T3 |
|---|---|---|---|
| 1 | .931 | 1 | .936 |
| 2 | .897 | 1 | .936 |
| 3 | .862 | .929 | .903 |
| 4 | .793 | .786 | .839 |
| 5 | .931 | .964 | .936 |
| 6 | .897 | .929 | .968 |
| 7 | .793 | .964 | .968 |
| 8 | .586 | .786 | .968 |
| 9 | .586 | .786 | .903 |
| 10 | .448 | .607 | .839 |
| 11 | .966 | .964 | .936 |
| 12 | .862 | .929 | .903 |
| 13 | .966 | .964 | .903 |
| 14 | .172 | .214 | .355 |
| 15 | .414 | .357 | .549 |
| 16 | .345 | .286 | .323 |
| 17 | .345 | .143 | .323 |
| 18 | .345 | .143 | .387 |
| 19 | .828 | 1 | 1 |
| 20 | .793 | .893 | .936 |
| 21 | .862 | .929 | .903 |
| 22 | .793 | .893 | .871 |
| 23 | .862 | .929 | 1 |
| 24 | .793 | .929 | .903 |
| 25 | .828 | .857 | .968 |
| 26 | .345 | .429 | .355 |
| Item | n | gl | p | |
|---|---|---|---|---|
| 7. My interaction with the system is clear and understandable. | 28 | 7.253 | 2 | .027 |
| 8. Interacting with the system does not require much mental effort. | 28 | 9.172 | 2 | .010 |
| 9. I find the system easy to use. | 28 | 6.090 | 2 | .048 |
| 23. I have no difficulty telling others about the results of using the system. | 28 | 7.014 | 2 | .030 |
| Mean | 0.701653846 | 0.754230769 |
| Variance | 0.058437835 | 0.085445145 |
| Observations | 26 | 26 |
| Pearson Correlation | 0.943311282 | |
| Hypothesized Mean Difference | 0 | |
| df | 25 | |
| t Stat | -2.607746847 | |
| P(T=t) one-tail | 0.007577472 | |
| t Critical one-tail | 1.708140761 | |
| P(T=t) two-tail | 0.015154944 | |
| t Critical two-tail | 2.059538553 |
| Acceptability T2 | Acceptability T3 | |
|---|---|---|
| Mean | 0.754230769 | 0.800423077 |
| Variance | 0.085445145 | 0.057671454 |
| Observations | 26 | 26 |
| Pearson Correlation | 0.950741471 | |
| Hypothesized Mean Difference | 0 | |
| df | 25 | |
| t Stat | -2.399369238 | |
| P(T=t) one-tail | 0.012099974 | |
| t Critical one-tail | 1.708140761 | |
| P(T=t) two-tail | 0.024199948 | |
| t Critical two-tail | 2.059538553 |
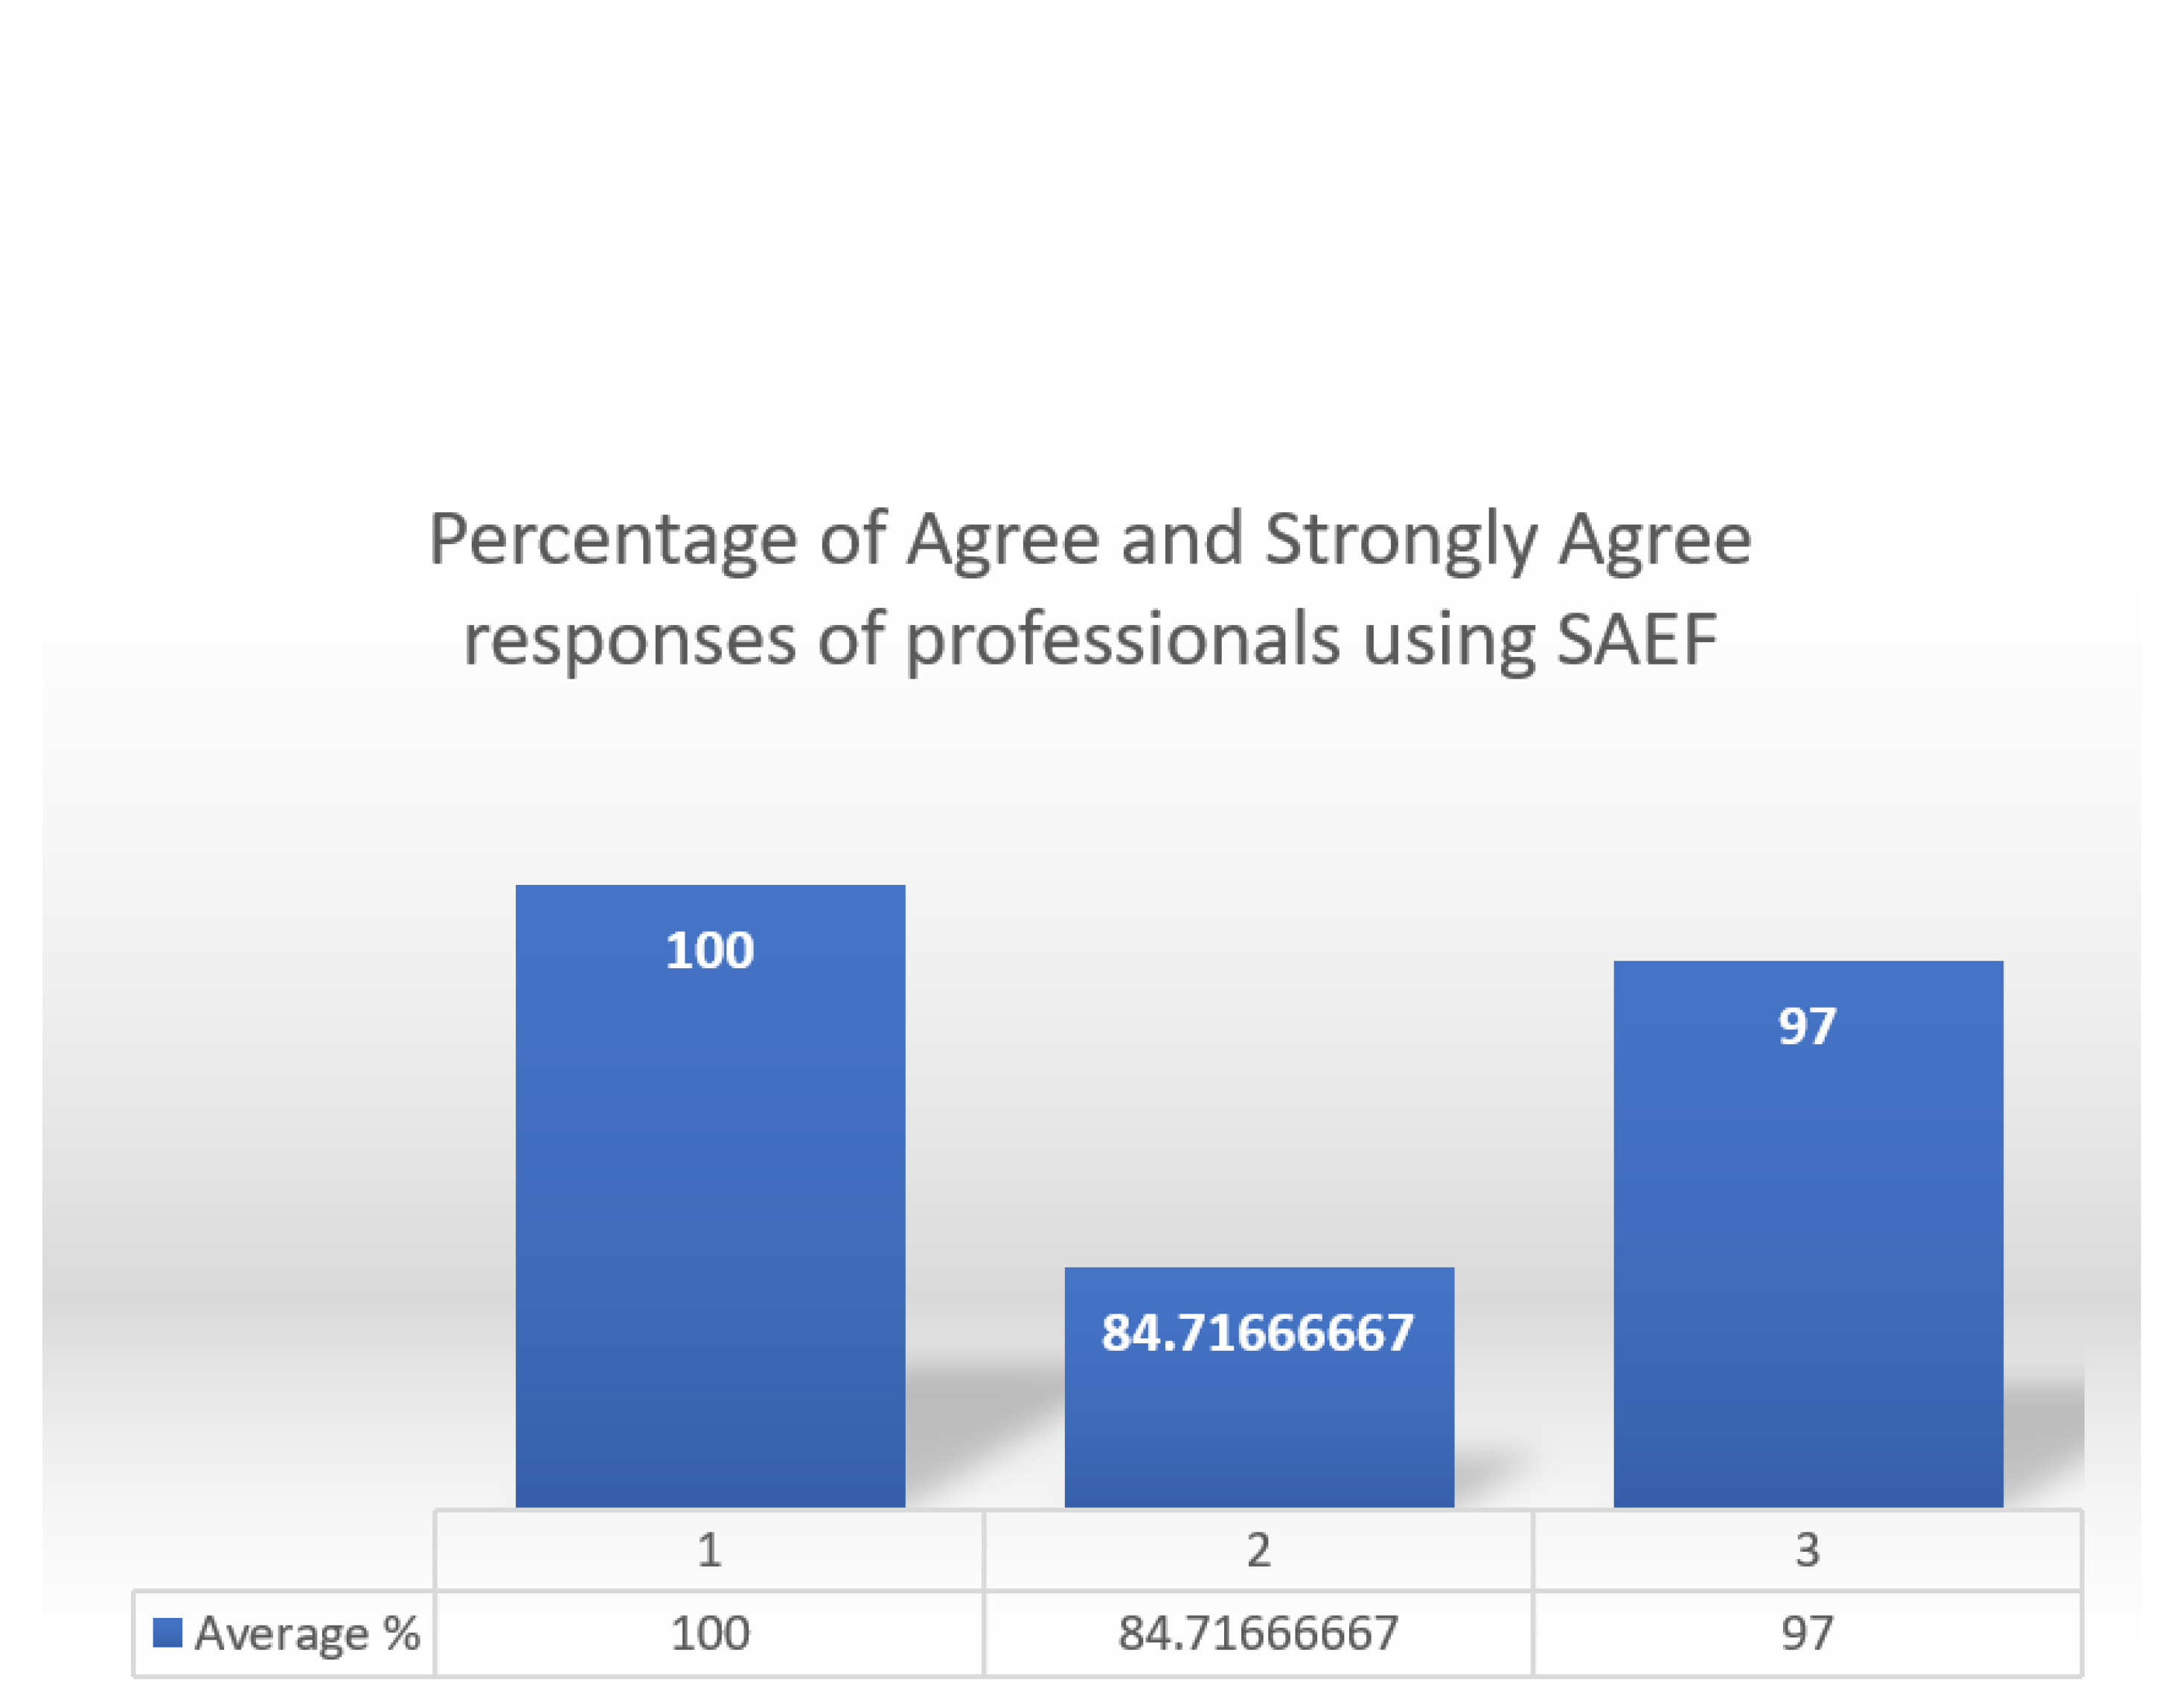
| Developed aspect by SAEF procedure | Validated aspect | Percentage |
|---|---|---|
| - It lets start for better hearing. | 1 | 100 |
| - It allows descending method. | 1 | 100 |
| - It lets start with 30 dB at 1000 Hz frequency. | 1 | 100 |
| - It allows increasing 20 dB HL if there is no initial response. | 1 | 100 |
| - Allows you to reduce the tone level by 10 dB when there is a response. |
1 | 100 |
| - Allows increasing by 5 dB until response is obtained. | 1 | 100 |
| - It allows to obtain from 2 answers in ascending races. | 1 | 100 |
| - It allows you to continue with the following frequencies. | 1 | 100 |
| - It allows starting the next frequency by adding 30 dB to the previous threshold. |
1 | 100 |
| - It allows continuing with the contralateral airway. | 1 | 100 |
| - It provides information on student performance. | 2 | 83.3 |
| - The information provided is useful for individual feedback. | 2 | 83.3 |
| - It allows feedback to the student on the performance of it. | 2 | 83.3 |
| - It allows the student to make diagnostic decisions. | 2 | 91.7 |
| - It makes it possible to identify general aspects of the group/course that must be reinforced. |
2 | 91.7 |
| - It is useful for the professor regarding feedback to students. | 2 | 75 |
| - Allows to achieve learning outcome: Apply descending audiometric technique to obtain hearing thresholds. |
3 | 100 |
| - It allows to achieve learning results: Classify hearing loss according to audiometric findings. |
3 | 91 |
| - It is a useful complement for the development of the subject. | 3 | 100 |
Disclaimer/Publisher’s Note: The statements, opinions and data contained in all publications are solely those of the individual author(s) and contributor(s) and not of MDPI and/or the editor(s). MDPI and/or the editor(s) disclaim responsibility for any injury to people or property resulting from any ideas, methods, instructions or products referred to in the content. |
© 2020 by the authors. Licensee MDPI, Basel, Switzerland. This article is an open access article distributed under the terms and conditions of the Creative Commons Attribution (CC BY) license (https://creativecommons.org/licenses/by/4.0/).


