Submitted:
15 June 2023
Posted:
16 June 2023
You are already at the latest version
Abstract

Keywords:
1. Introduction
2. Materials and Methods
2.1. Glass and Target Synthesis, Pulsed Laser Deposition
2.2. XRD and DSC Characterization
2.3. Optical and Electrical Measurements
2.4. High-Energy X-ray Diffraction Measurements
2.5. First-Principles Simulation Details
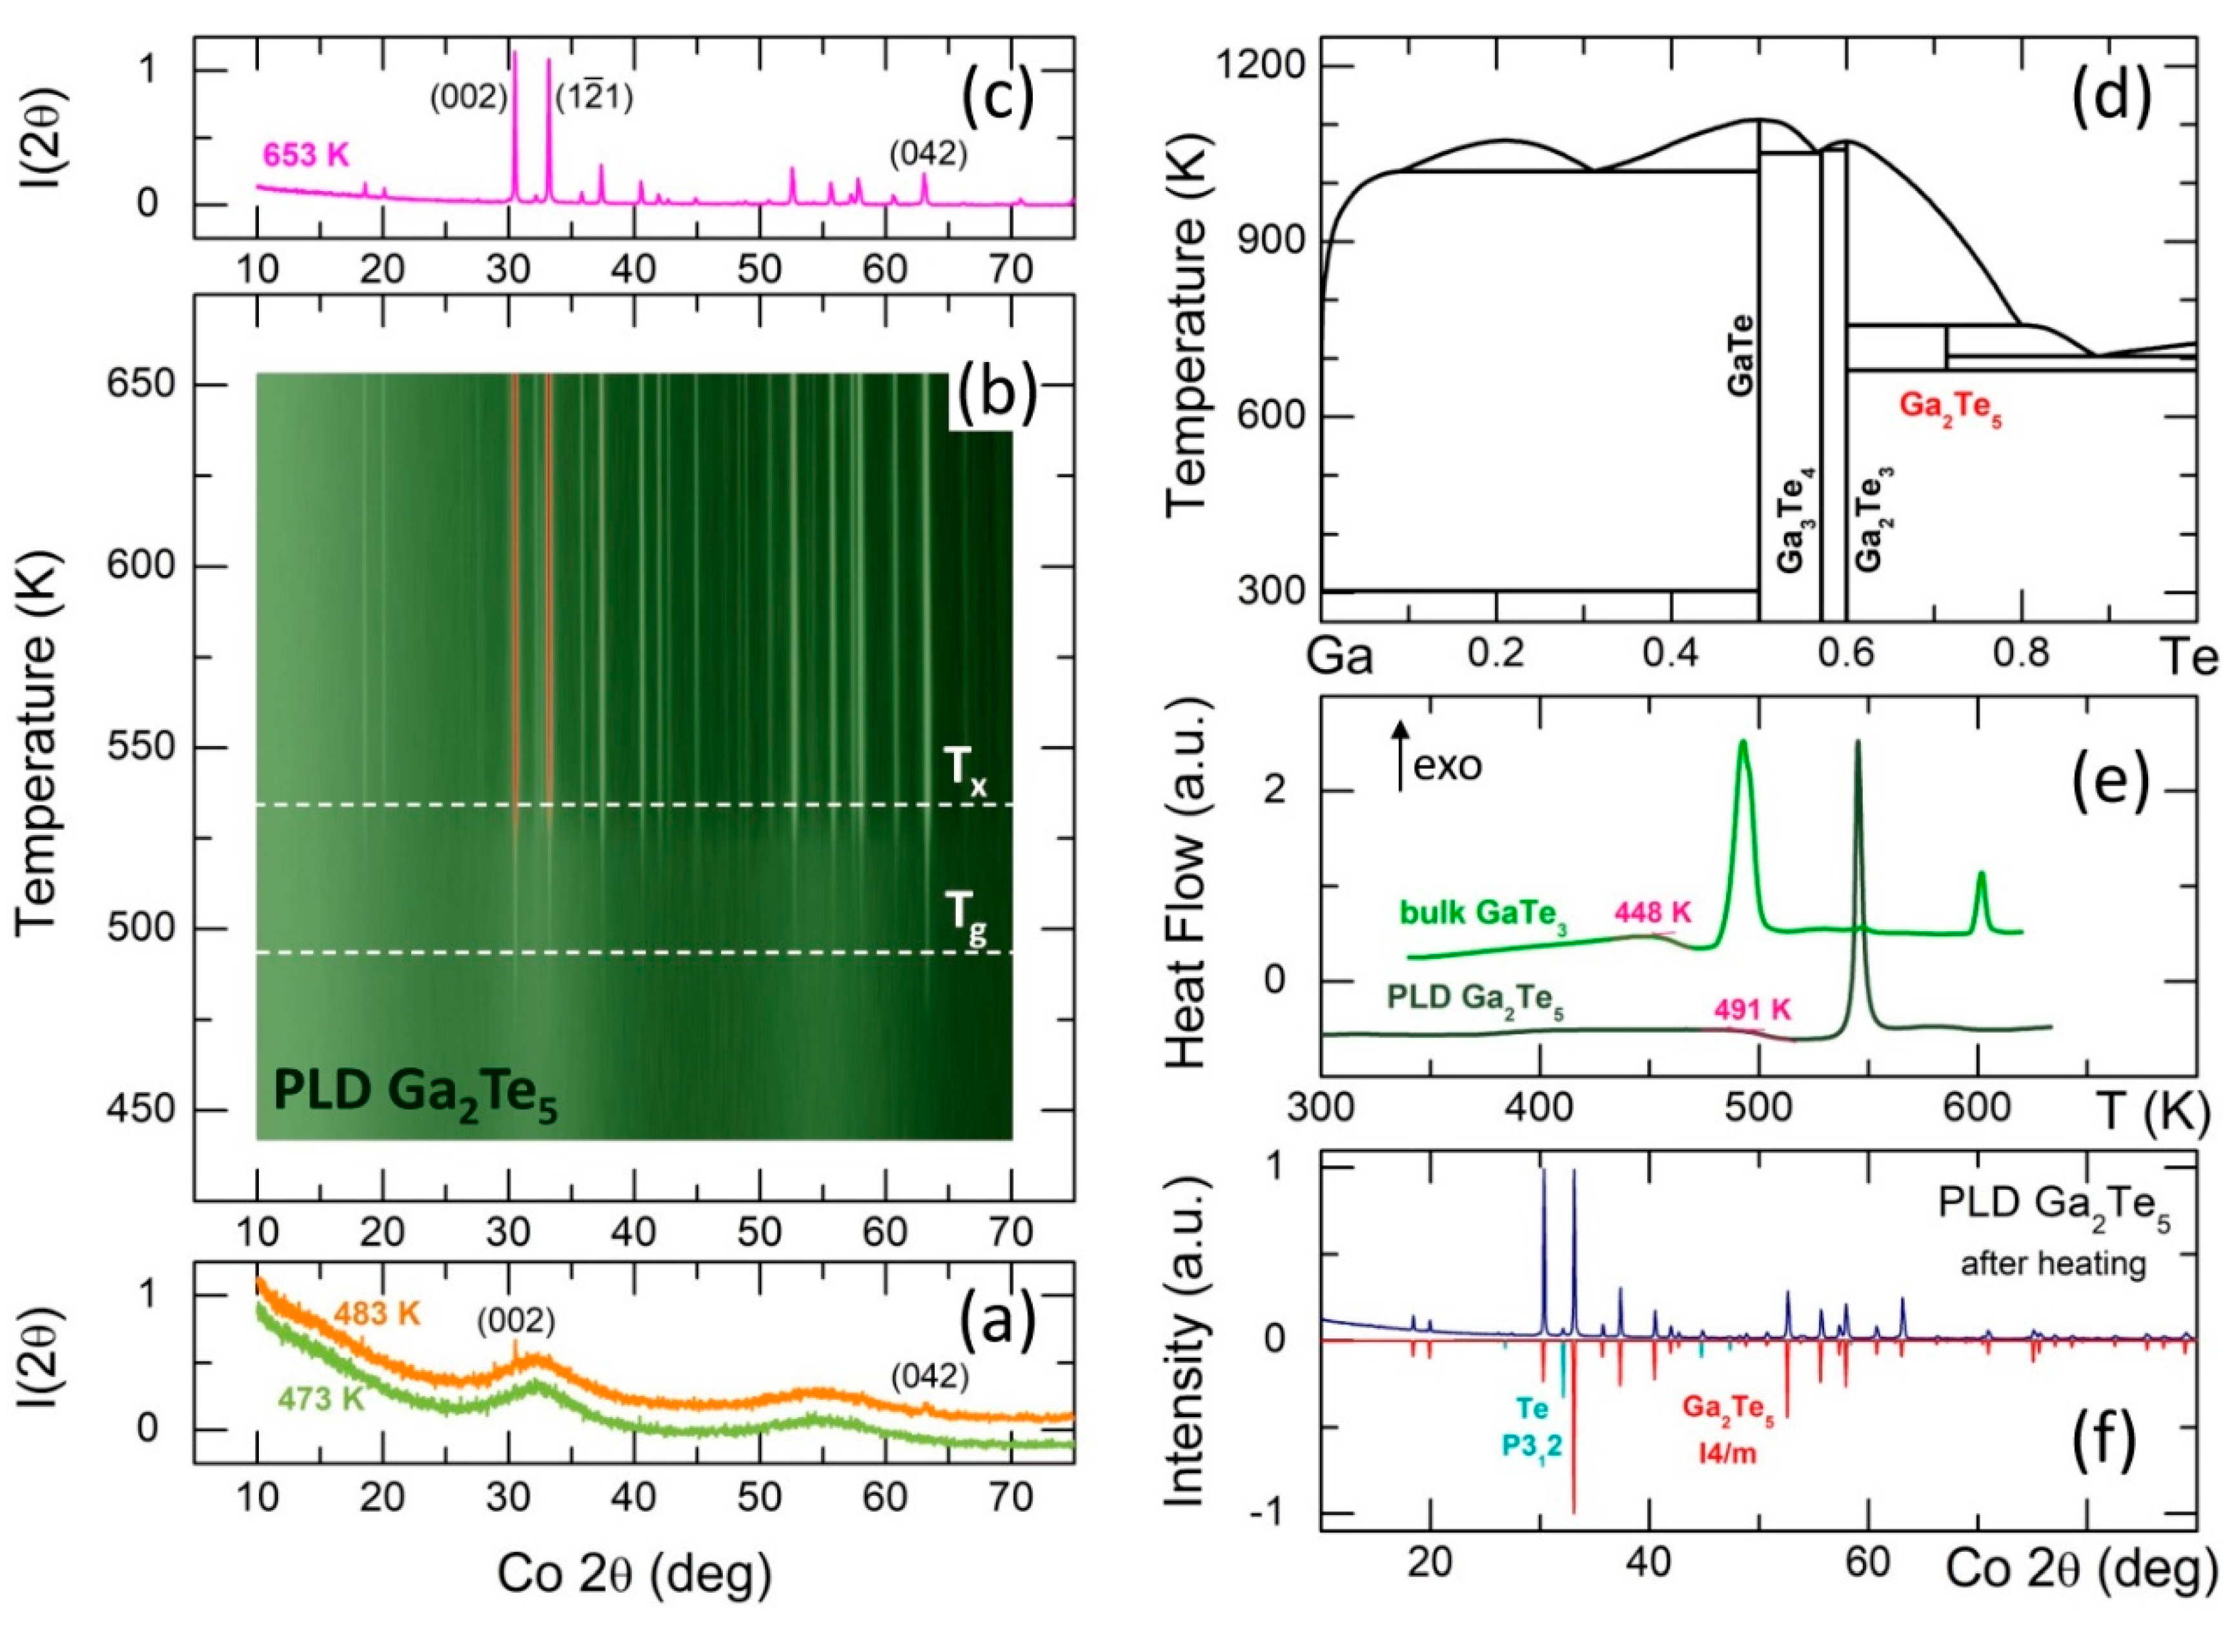
3. Thermal Properties and Crystallization on Heating
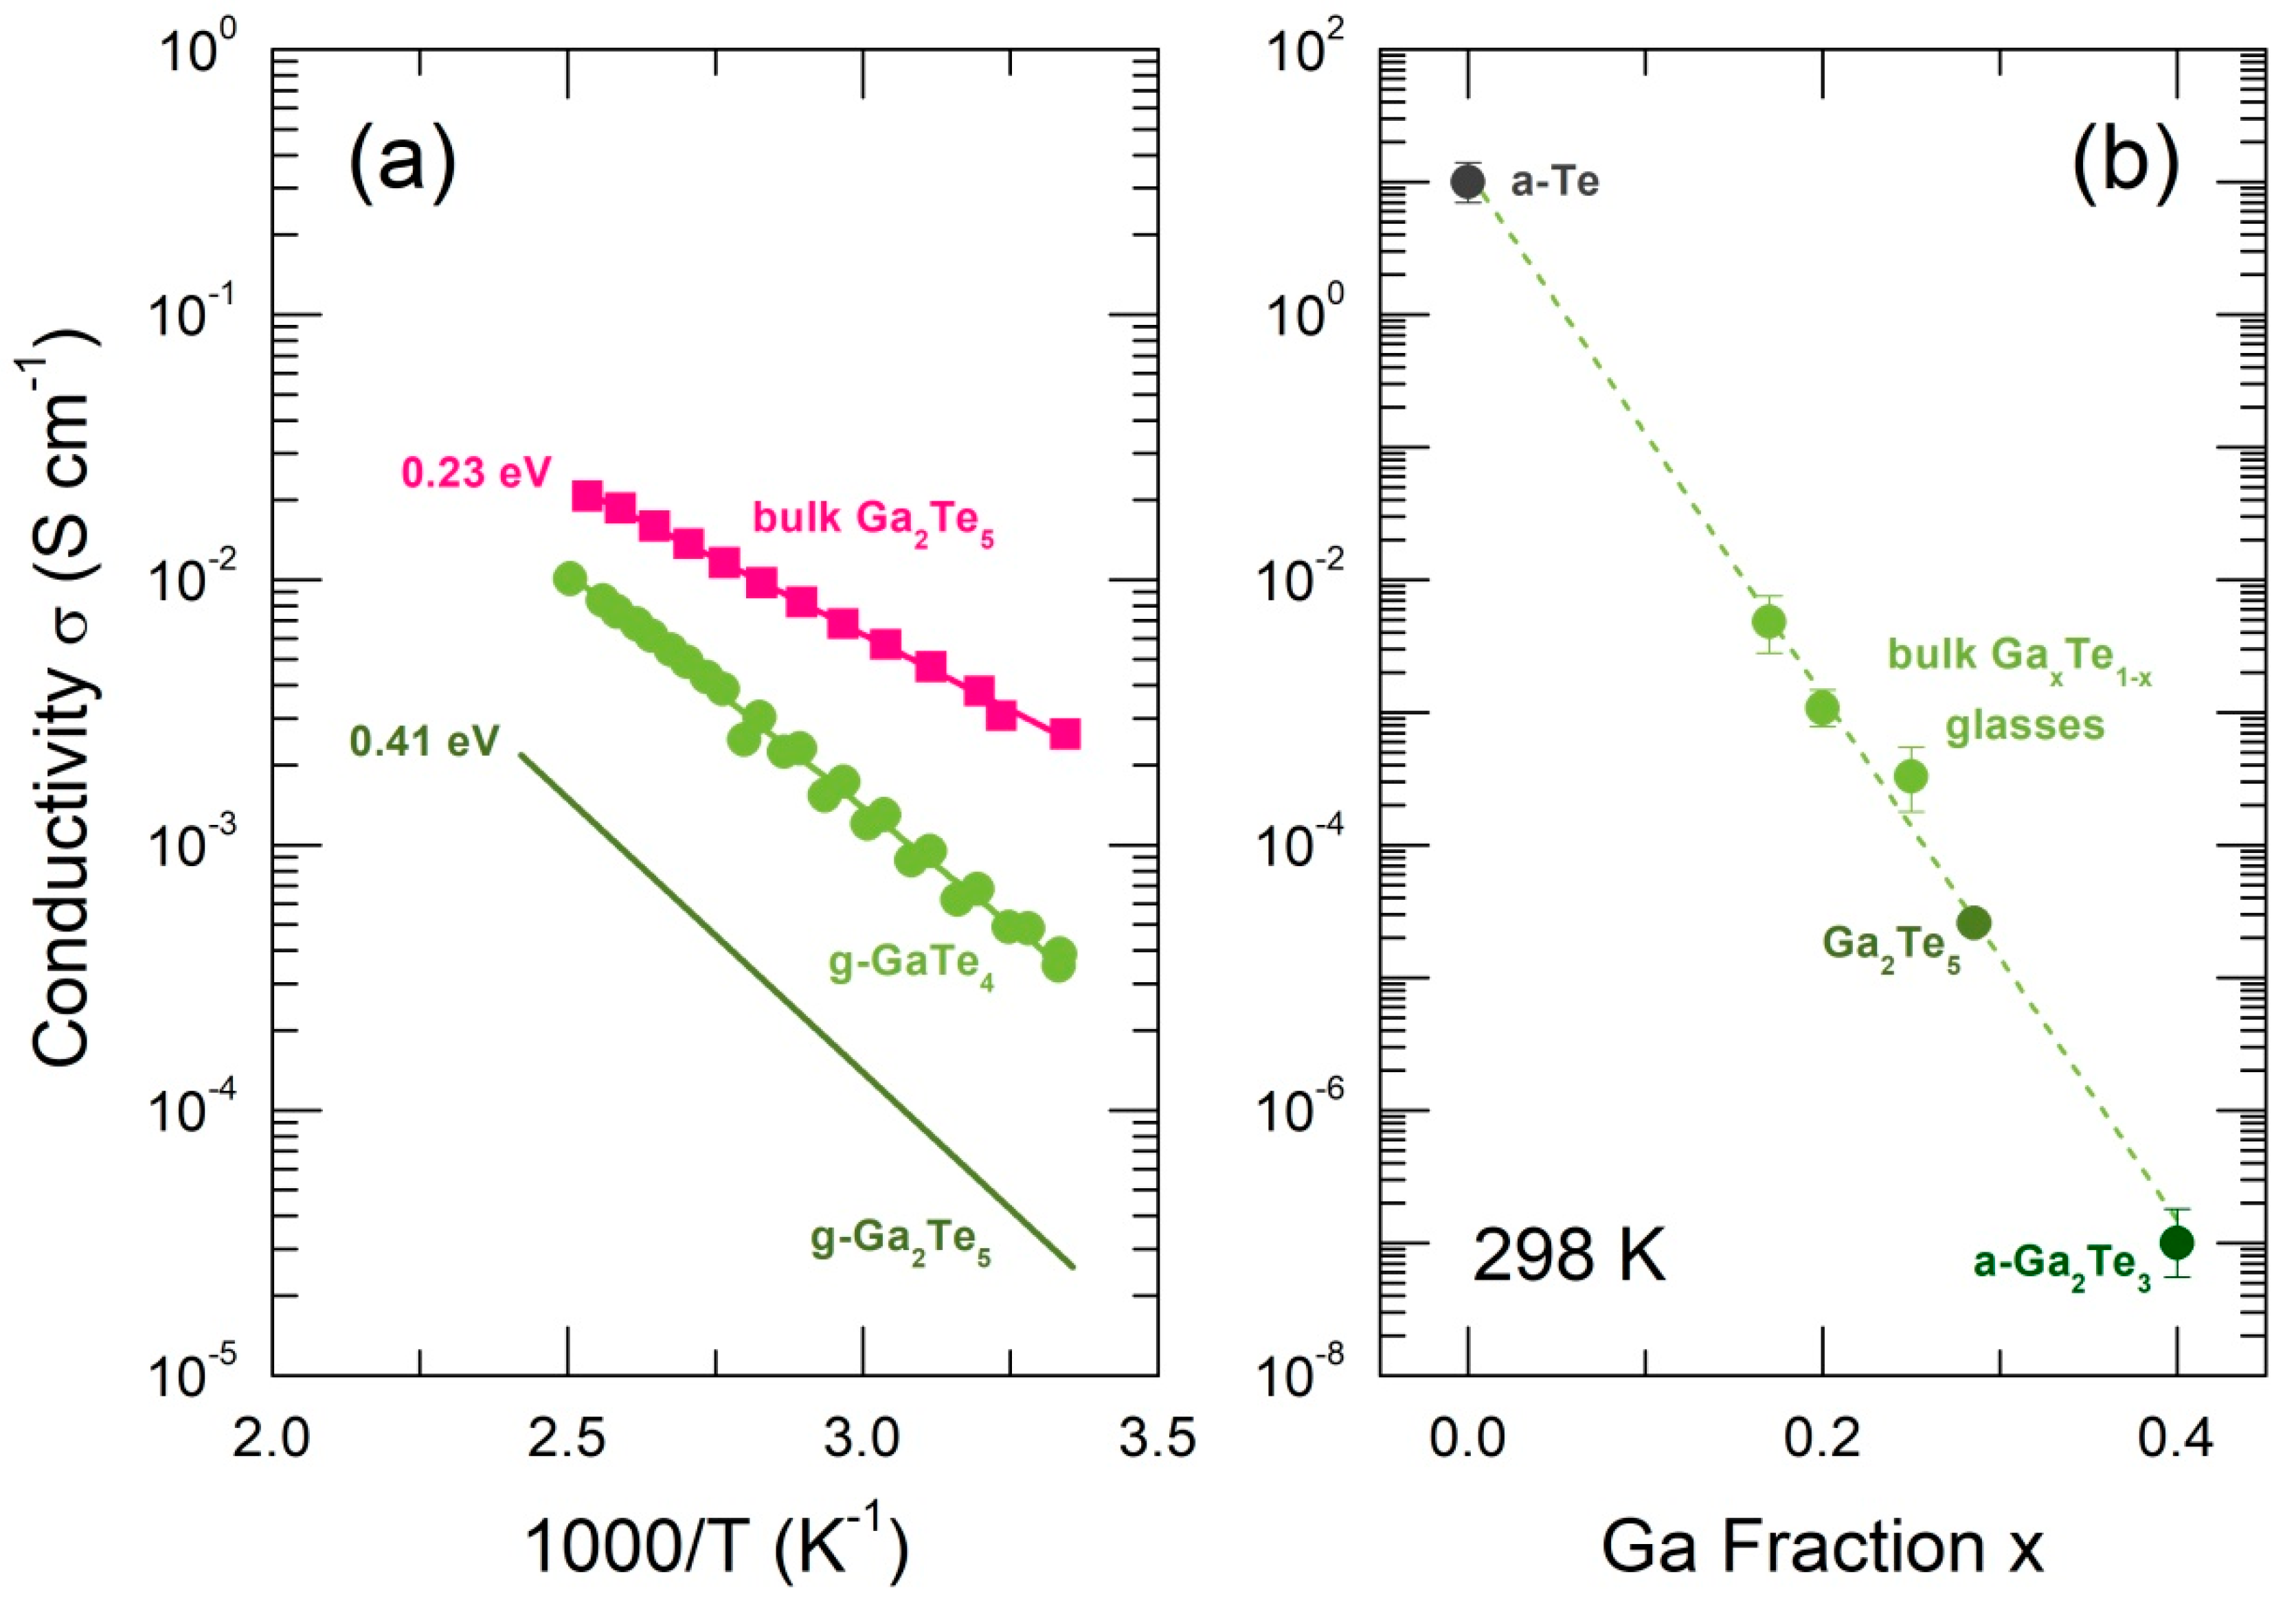
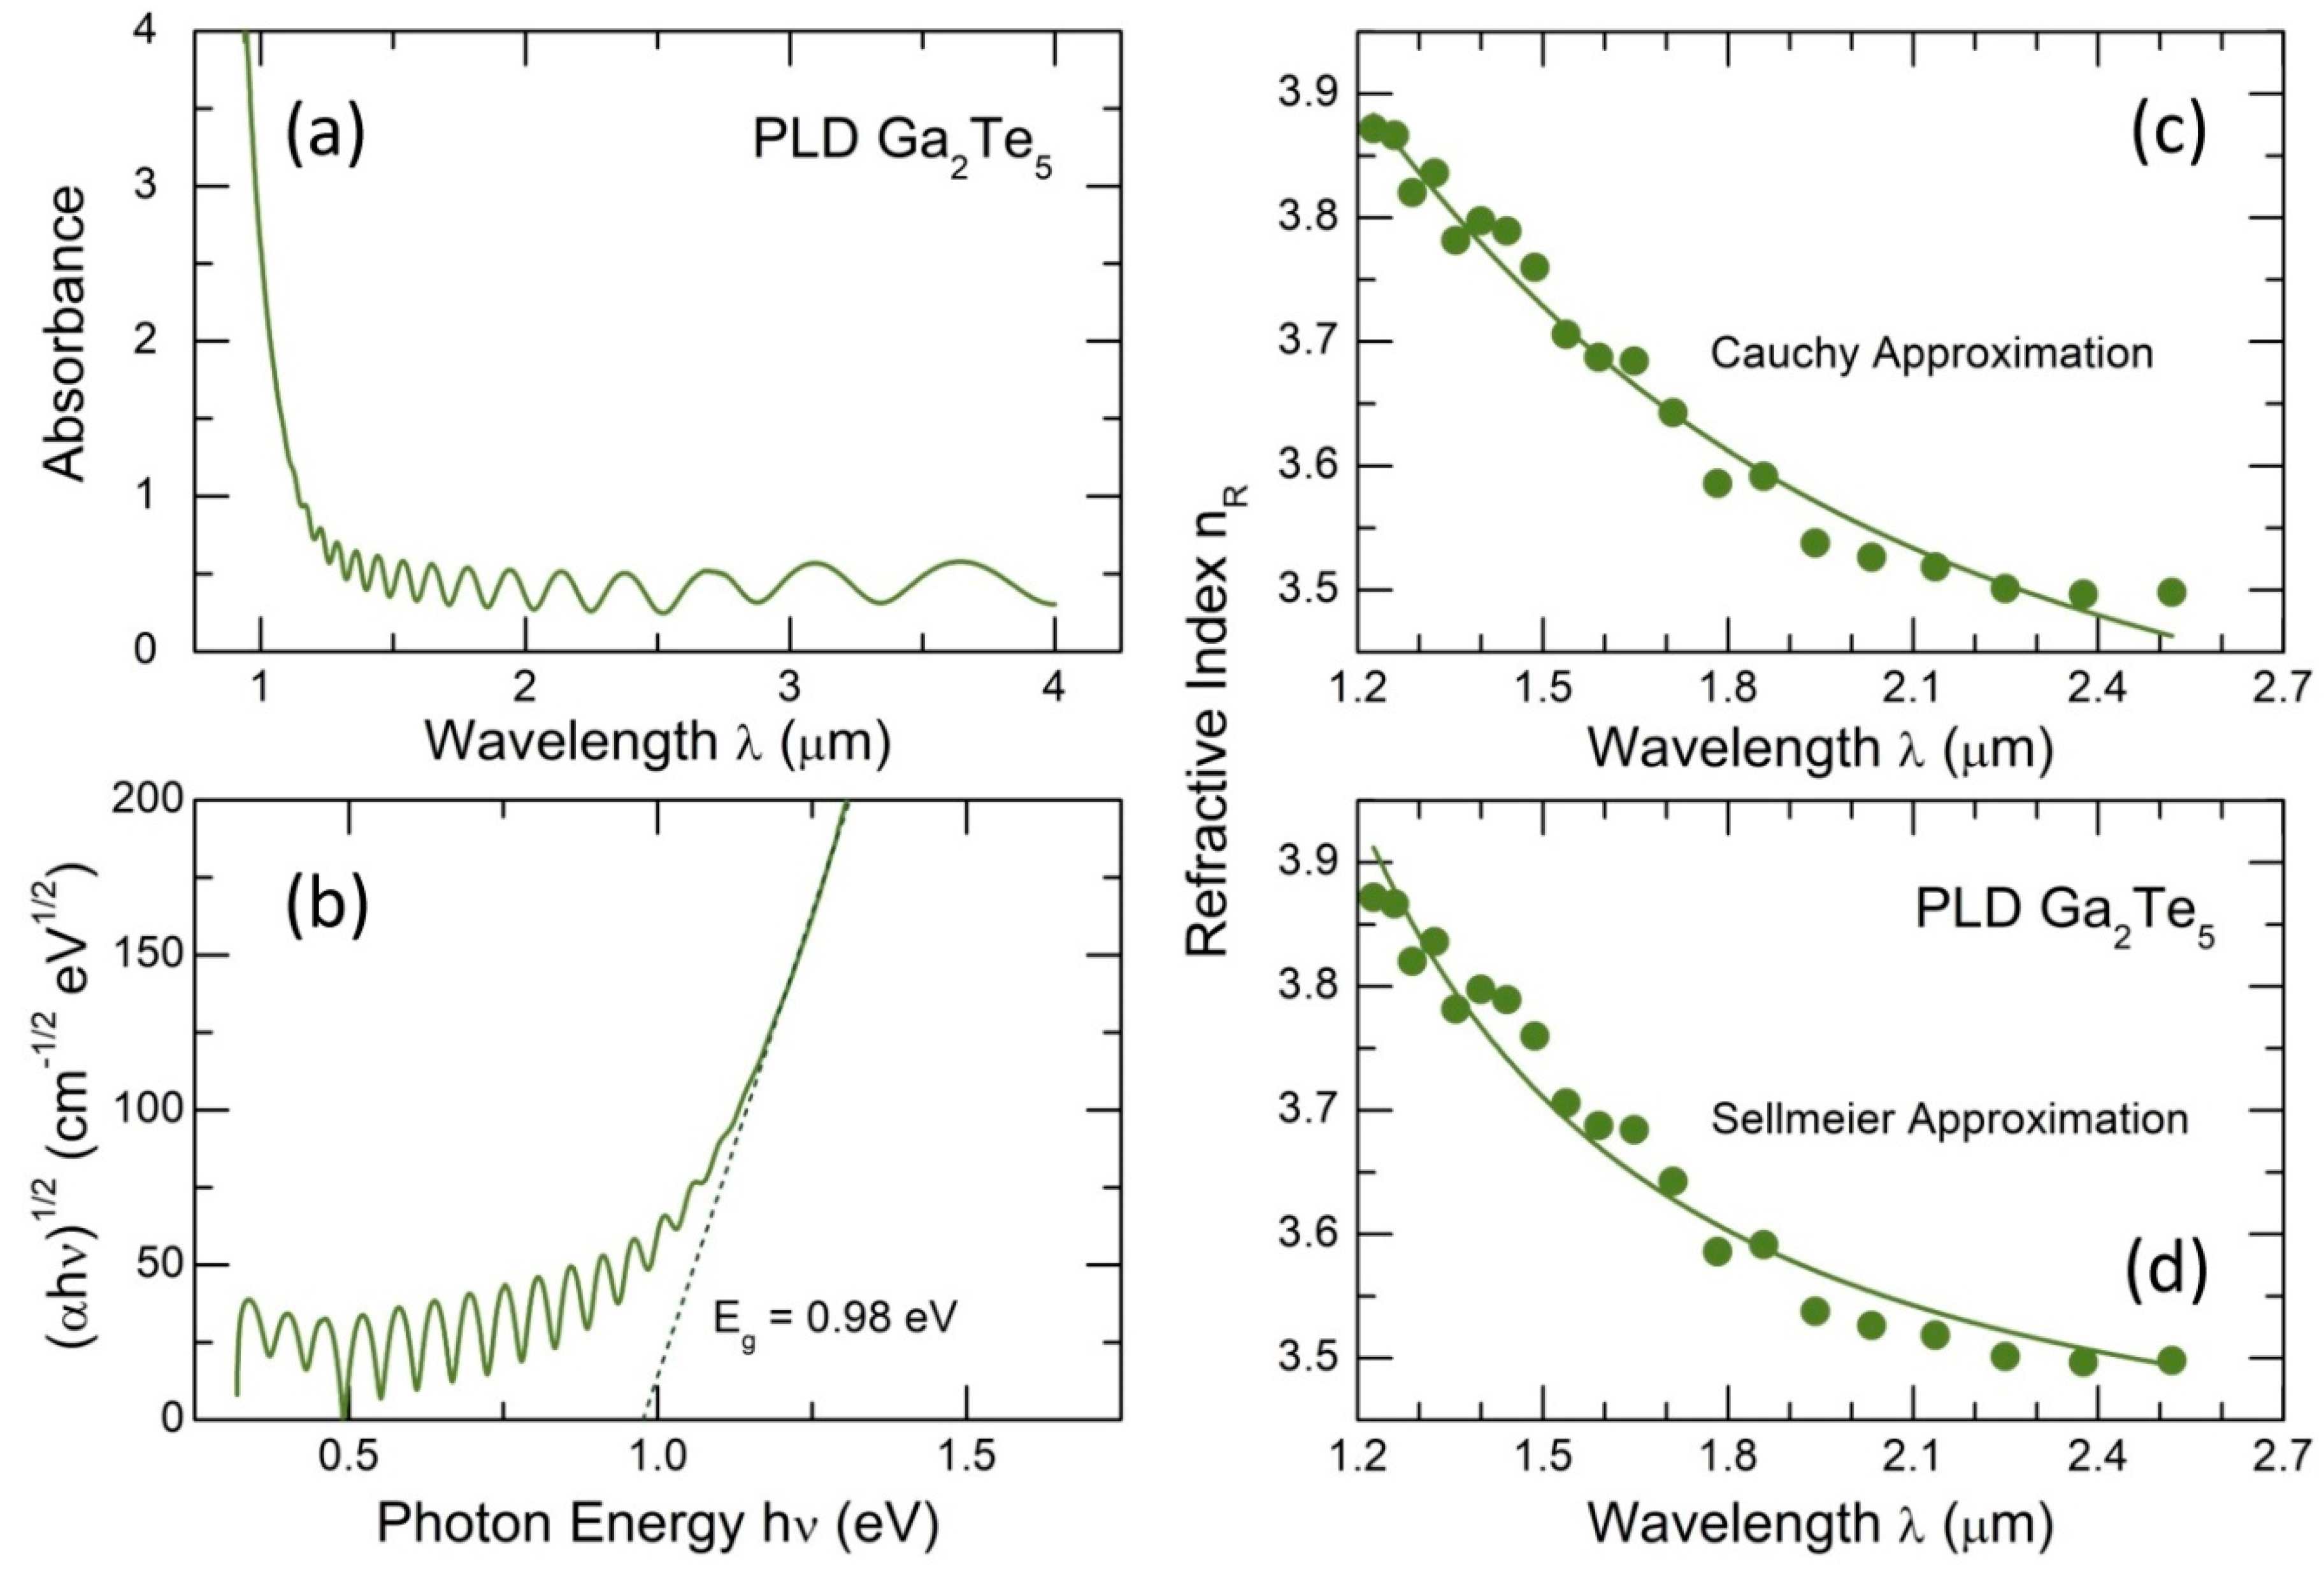
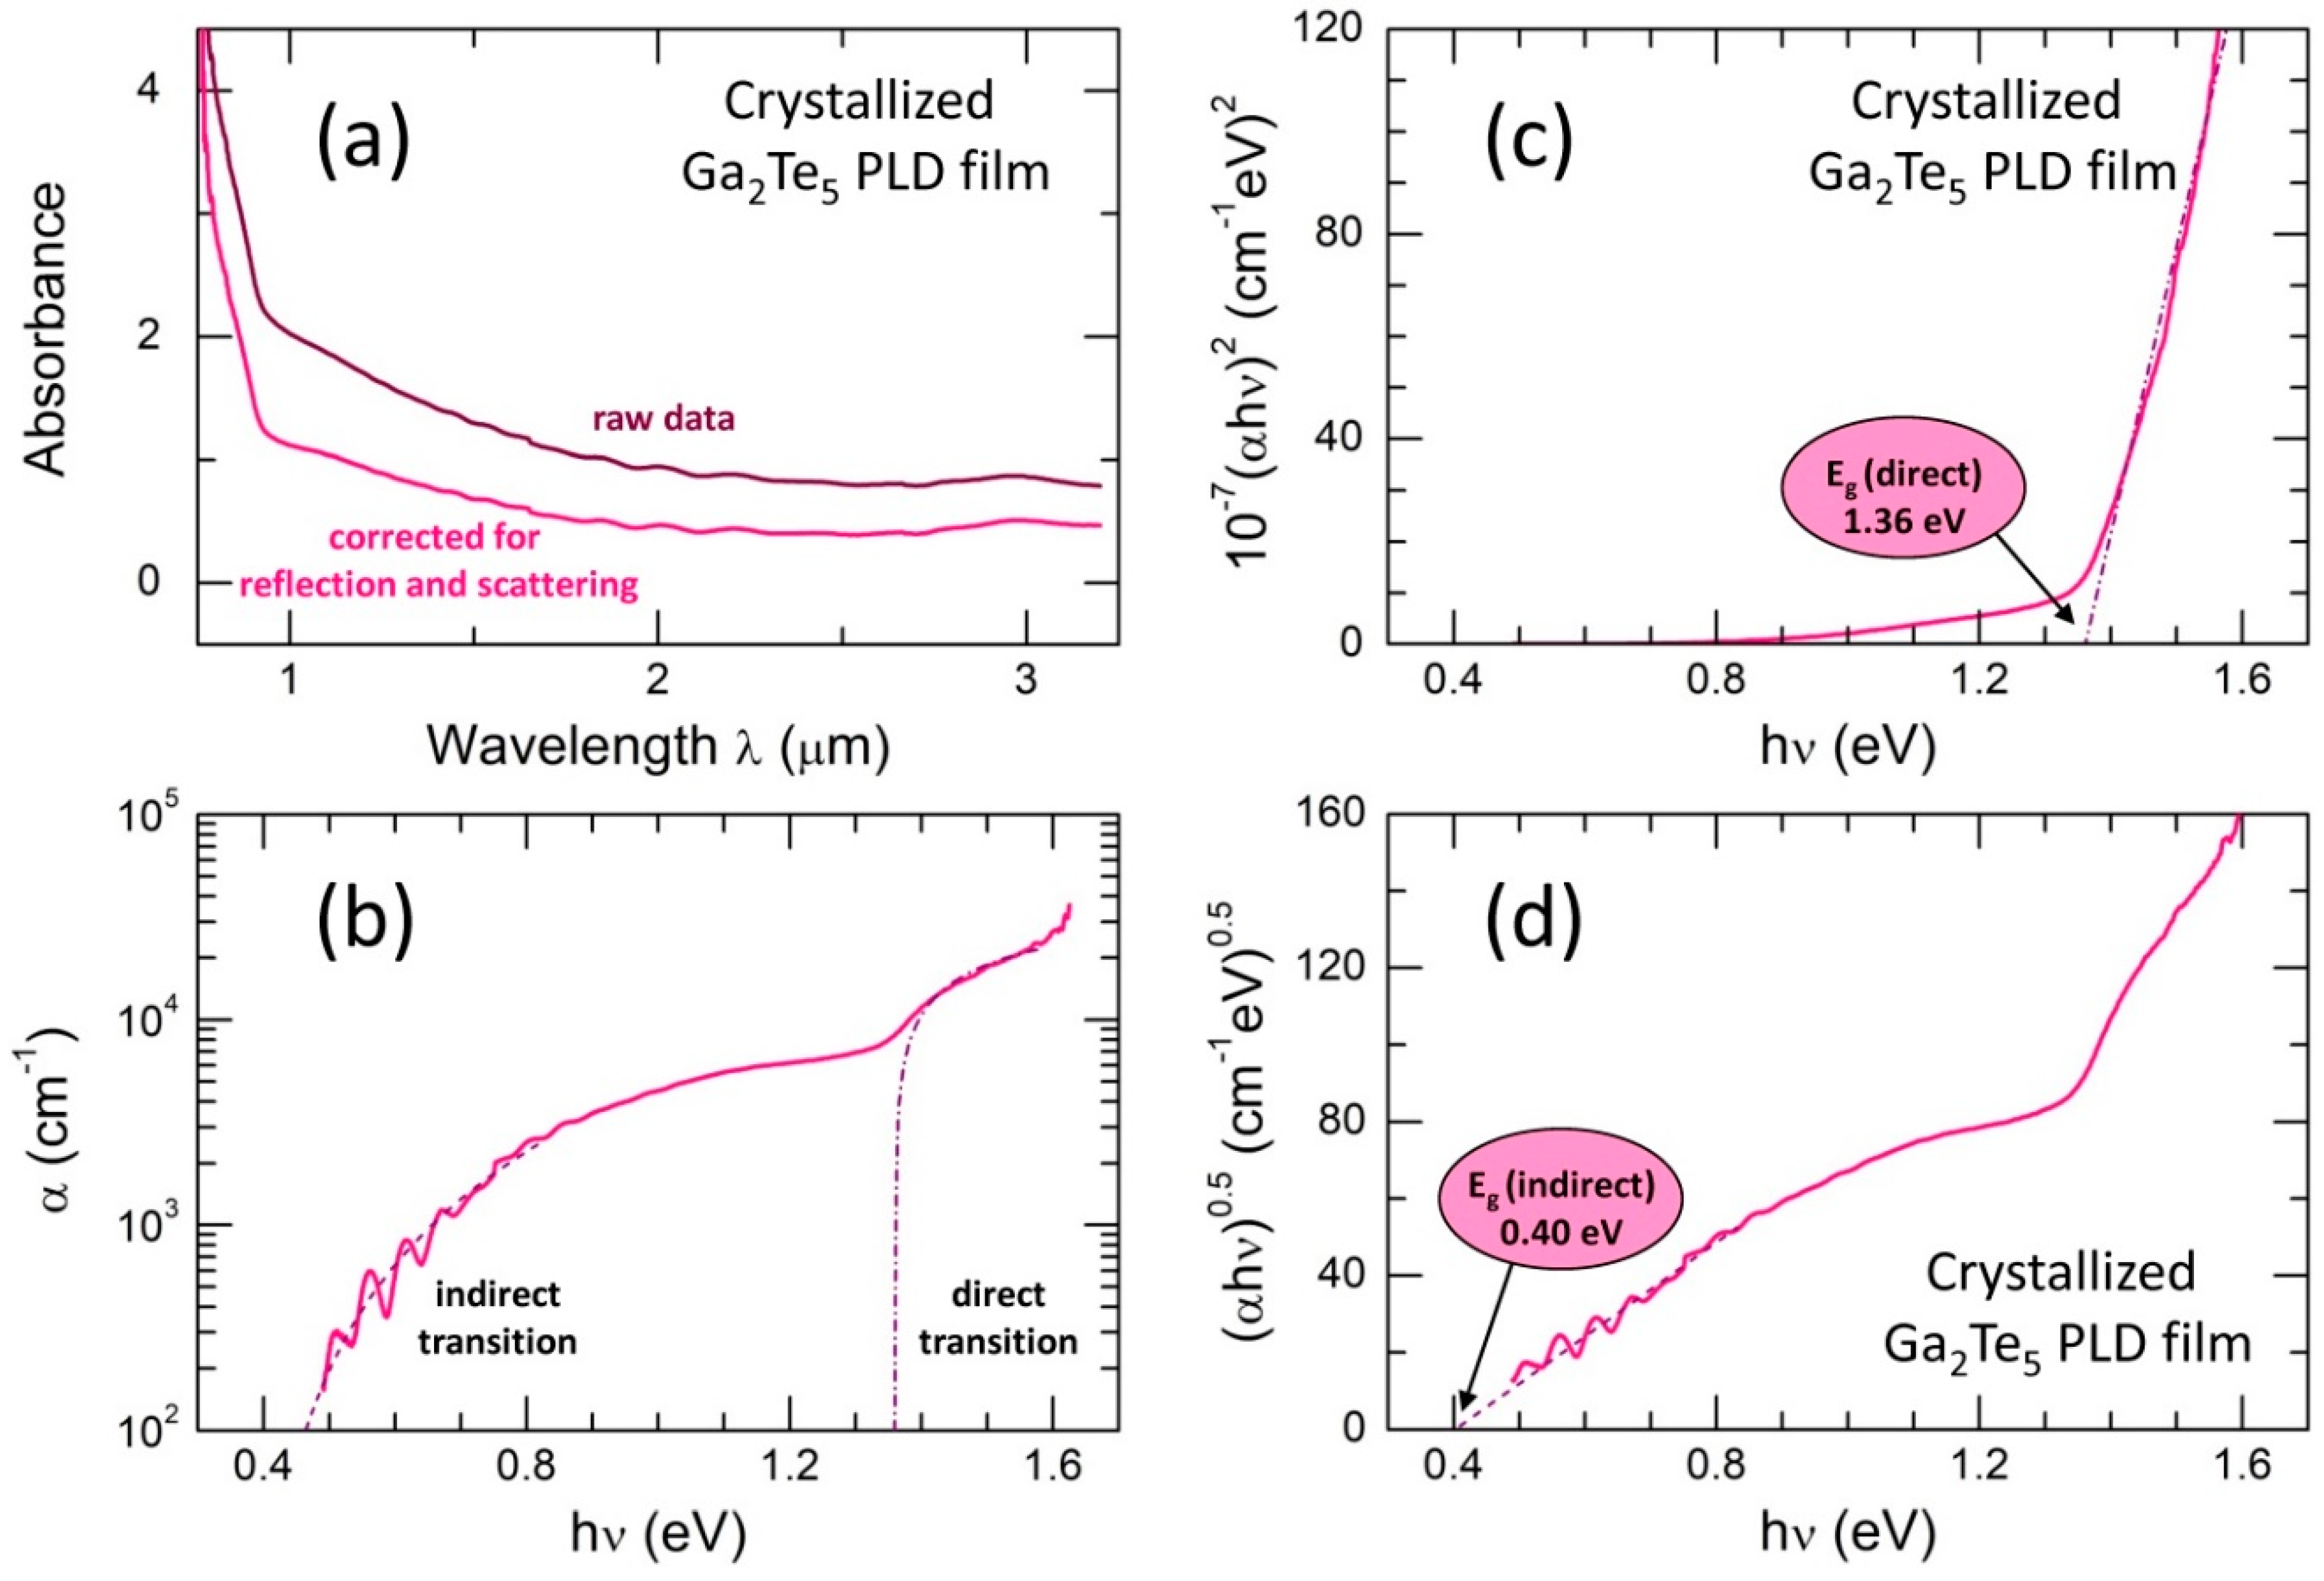
4. Electric and Optical Properties
5. High-Energy X-Ray Diffraction
6. First-Principles Molecular Dynamics
7. Conclusions
Supplementary Materials
Author Contributions
Funding
Data Availability Statement
Conflicts of Interest
References
- Zhang, W.; Mazzarello, R.; Wuttig, M.; Ma, E. Designing crystallization in phase-change materials for universal memory and neuro-inspired computing. Nat. Rev. Mater. 2019, 4, 150–168. [Google Scholar]
- Xu, M.; Mai, X.; Lin, J.; Zhang, W.; Li, Y.; He, Y.; Tong, H.; Hou, X.; Zhou, P.; Miao, X. Recent advances on neuromorphic devices based on chalcogenide phase-change materials. Adv. Funct. Mater. 2020, 30, 2003419. [Google Scholar] [CrossRef]
- Feldmann, J.; Youngblood, N.; Karpov, M.; Gehring, H.; Li, X.; Stappers, M.; Le Gallo, M.; Fu, X.; Lukashchuk, A.; Raja, A.S.; Liu, J.; Wright, C.D.; Sebastian, A.; Kippenberg, T.J.; Pernice, W.H.P.; Bhaskaran, H. Parallel convolutional processing using an integrated photonic tensor core. Nature 2021, 589, 52–61. [Google Scholar] [CrossRef]
- Wang, Q.; Rogers, E.T.F.; Gholipour, B.; Wang, C.-M.; Yuan, G.; Teng, J.; Zheludev, N.I. Optically reconfigurable metasurfaces and photonic devices based on phase change materials. Nature Photon 2016, 10, 60–66. [Google Scholar]
- Shalaginov, M.Y.; An, S.; Zhang, Y.; Yang, F.; Su, P.; Liberman, V.; Chou, J.B.; Roberts, C.M.; Kang, M.; Rios, C.; Du, Q.; Fowler, C.; Agarwal, A.; Richardson, K.A.; Rivero-Baleine, C.; Zhang, H.; Hu, J.; Gu, T. Reconfigurable all-dielectric metalens with diffraction-limited performance. Nature Commun. 2021, 12, 1225. [Google Scholar] [CrossRef]
- Konnikova, M.R.; Khomenko, M.D.; Tverjanovich, A.S.; Bereznev, S.; Mankova, A.A.; Parashchuk, O.D.; Vasilevsky, I.S.; Ozheredov, I.A.; Shkurinov, A.P.; Bychkov, E.A. GeTe2 phase change material for terahertz devices with reconfigurable functionalities using optical activation. ACS Appl. Mater. Interfaces 2023, 15, 9638–9648. [Google Scholar] [CrossRef]
- Dong, W.; Liu, H.; Behera, J.K.; Lu, L.; Ng, R.J.H.; Sreekanth, K.V.; Zhou, X.; Yang, J.K.W.; Simpson, R.E. Wide bandgap phase change material tuned visible photonics. Adv. Funct. Mater. 2018, 1806181. [Google Scholar] [CrossRef]
- Liu, H.; Dong, W.; Wang, H.; Lu, L.; Ruan, Q.; Tan, Y.S.; Simpson, R.E.; Yang, J.K.W. Rewritable color nanoprints in antimony trisulfide films. Sci. Adv. 2020, 6, eabb7171. [Google Scholar] [CrossRef]
- Delaney, M.; Zeimpekis, I.; Lawson, D.; Hewak, D.W.; Muskens, O.L. A new family of ultralow loss reversible phase-change materials for photonic integrated circuits: Sb2S3 and Sb2Se3. Adv. Funct. Mater. 2020, 2002447. [Google Scholar] [CrossRef]
- Ilie, S.T.; Faneca, J.; Zeimpekis, I.; Domínguez Bucio, T.; Grabska, K.; Hewak, D.W.; Chong, H.M.H.; Gardes, F.Y. Thermo-optic tuning of silicon nitride microring resonators with low loss non-volatile Sb2S3 phase change material. Sci. Rep. 2022, 12, 17815. [Google Scholar]
- Zhu, H.; Yin, J.; Xia, Y.; Liu, Z. Ga2Te3 Phase change material for low-power phase change memory application. Appl. Phys. Lett. 2010, 97, 083504. [Google Scholar] [CrossRef]
- Lee, D.; Kim, T.; Sohn, H. Highly reliable threshold switching behavior of amorphous Ga2Te3 films deposited by RF sputtering. Appl. Phys. Express 2019, 12, 085504. [Google Scholar] [CrossRef]
- Lee, D.; Kim, T.; Kim, J.; Sohn, H. Effect of nitrogen doping on threshold voltage in amorphous Ga2Te3 for application of selector devices. Phys. Status Solidi A 2020, 217, 2000478. [Google Scholar] [CrossRef]
- Kolobov, A.V.; Fons, P.; Krbal, M.; Mitrofanov, K.; Tominaga, J.; Uruga, T. Local structure of the crystalline and amorphous states of Ga2Te3 phase-change alloy without resonant bonding: A combined X-ray absorption and ab initio study. Phys. Rev. B 2017, 95, 054114. [Google Scholar] [CrossRef]
- Bokova, M.; Tverjanovich, A.; Benmore, C.J.; Fontanari, D.; Sokolov, A.; Khomenko, M.; Kassem, M.; Ozheredov, I.; Bychkov, E. Unraveling the atomic structure of bulk binary Ga-Te glasses with surprising nanotectonic features for phase-change memory applications. ACS Appl. Mater. Interfaces 2021, 13, 37363–37379. [Google Scholar] [CrossRef]
- Tverjanovich, A.; Khomenko, M.; Benmore, C.J.; Bereznev, S.; Sokolov, A.; Fontanari, D.; Kiselev, A.; Lotin, A.; Bychkov, E. Atypical phase-change alloy Ga2Te3: Atomic structure, incipient nanotectonic nuclei, and multilevel writing. J. Mater. Chem. C 2021, 9, 17019–17032. [Google Scholar] [CrossRef]
- Guymont, M.; Tomas, A.; Guittard, M. The structure of Ga2Te3. An X-ray and high-resolution electron microscopy study. Philos. Mag. A 1992, 66, 133–139. [Google Scholar] [CrossRef]
- Glazov, V.M.; Chizhevskaya, S.N.; Glagoleva, N.N. Liquid Semiconductors; Plenum: New York, 1969; pp. 142–150. [Google Scholar]
- Chizhevskaya, S.N.; Glazov, V.M. A study of chemical interactions between gallium and tellurium in molten state. Zh. Neorg. Khim. 1962, 7, 1933–1937. [Google Scholar]
- Ito, K.; Moynihan, C.T.; Angell, C.A. Thermodynamic determination of fragility in liquids and a fragile-to-strong liquid transition in water. Nature 1999, 398, 492–495. [Google Scholar] [CrossRef]
- Wei, S.; Lucas, P.; Angell, C.A. Phase change alloy viscosities down Tg using Adam-Gibbs-equation fittings to excess entropy data: A fragile-to-strong transition. J. Appl. Phys. 2015, 118, 034903. [Google Scholar]
- Orava, J.; Hewak, D.W.; Greer, A.L. Fragile-to-strong crossover in supercooled liquid Ag-In-Sb-Te studied by ultrafast calorimetry. Adv. Funct. Mater. 2015, 25, 4851–4858. [Google Scholar] [CrossRef]
- Zhu, W.; Gulbiten, O.; Aitken, B.; Sen, S. Viscosity, enthalpy relaxation and liquid-liquid transition of the eutectic liquid Ge15Te85. J. Non-Cryst. Solids 2021, 554, 120601. [Google Scholar] [CrossRef]
- Kassem, M.; Benmore, C.J.; Usuki, T.; Ohara, K.; Tverjanovich, A.; Bokova, M.; Brazhkin, V.V.; Bychkov, E. Transient mesoscopic immiscibility, viscosity anomaly and high internal pressure at the semiconductor-metal transition in liquid Ga2Te3. J. Phys. Chem. Lett. 2022, 13, 10843–10850. [Google Scholar] [CrossRef] [PubMed]
- Taylor, G.I. The viscosity of a fluid containing small drops of another fluid. Proc. R. Soc. London, Ser. A 1932, 138, 41–48. [Google Scholar]
- Julien-Pouzol, M.; Jaulmes, S.; Alapini, F. Tellurure de gallium. Acta Crystallogr. B 1977, 33, 2270–2272. [Google Scholar] [CrossRef]
- Deiseroth, H.J.; Amann, P. Die Pentatelluride M2Te5 (M = Al, Ga, In): Polymorphie, Struktur-beziehungen und Homogenitätsbereiche. Z. Anorg. Allg. Chem. 1996, 622, 985–993. [Google Scholar] [CrossRef]
- Alapini, F.; Flahaut, J.; Guittard, M.; Jaulmes, S.; Julien-Pouzol, M. Système gallium–tellure. Diagramme de phases, étude structurale de GaTe, Ga2Te5 et de Ga6SnTe10. J. Solid State Chem. 1979, 28, 309–319. [Google Scholar] [CrossRef]
- Blachnik, R.; Irle, E. Das System Gallium–Tellur. J. Less-Common Metals 1985, 113, L1–L3. [Google Scholar] [CrossRef]
- Oh, C.-S.; Lee, D.N. Thermodynamic assessment of the Ga-Te system. CALPHAD 1992, 16, 317–330. [Google Scholar]
- Ogugua, S.N.; Ntwaeaborwa, O.M.; Swart, H.C. Latest development on pulsed laser deposited thin films for advanced luminescence applications. Coatings 2020, 10, 1078. [Google Scholar] [CrossRef]
- Aydoğan, Ş.; Karacali, T.; Yoğurtçu, Y.K. Investigation of the switching phenomena in Ga2Te3 single crystals. J. Cryst. Growth 2005, 279, 110–113. [Google Scholar] [CrossRef]
- Fu, H.; Ying, P.; Cui, J.; Zhang, X.; Yan, Y. Thermoelectric properties of p-type Ga2Te5 based compounds. Rare Metal Mater. Eng. 2012, 41, 767–771. [Google Scholar] [CrossRef]
- Fuku, X.; Baker, P.; Iwuoha, E. Influence of quantum dot surface on electrochemical DNA sensing mechanism. ChemElectroChem 2020, 7, 770–781. [Google Scholar] [CrossRef]
- Siddique, S.; Gowda, C.C.; Tromer, R.; Demiss, S.; Singh Gautam, A.R.; Femi, O.E.; Kumbhakar, P.; Galvao, D.S.; Chandra, A.; Tiwary, C.S. Scalable synthesis of atomically thin gallium telluride nanosheets for supercapacitor applications. ACS Appl. Nano Mater. 2021, 4, 4829–4838. [Google Scholar] [CrossRef]
- Hoang Huy, V.P.; Kim, I.T.; Hur, J. Gallium-telluride-based composite as promising lithium storage material. Nanomaterials 2022, 12, 3362. [Google Scholar] [CrossRef]
- Guan, J.; Sun, C.; Zhang, C.; Guan, Q.; Kan, E. First-principles calculations of monolayered Al2Te5: a promising 2D donor semiconductor with ultrahigh visible light harvesting. Nanoscale 2023, 15, 2578–2585. [Google Scholar] [CrossRef]
- Tverjanovich, A.; Khomenko, M.; Bereznev, S.; Fontanari, D.; Sokolov, A.; Usuki, T.; Ohara, K.; Le Coq, D.; Masselin, P.; Bychkov, E. Glassy GaS: Transparent and unusually rigid thin films for visible to mid-IR memory applications. Phys. Chem. Chem. Phys. 2020, 22, 25560–25573. [Google Scholar] [CrossRef]
- Hammersley, A.P.; Svensson, S.O.; Hanfland, M.; Fitch, A.N.; Häusermann, D. Two-dimensional detector software: from real detector to idealised image or two-theta scan. High Pressure Res. 1996, 14, 235–248. [Google Scholar] [CrossRef]
- Skinner, L.B.; Benmore, C.J.; Parise, J.B. Area detector corrections for high quality synchrotron X-ray structure factor measurements. Nucl. Instrum. Methods Phys. Res. 2012, 662, 61–70. [Google Scholar] [CrossRef]
- Kühne, T.D.; Iannuzzi, M.; Del Ben, M.; Rybkin, V.V.; Seewald, P.; Stein, F.; Laino, T.; Khaliullin, R.Z.; Schütt, O.; Schiffmann, F.; Golze, D.; Wilhelm, J.; Chulkov, S.; Bani-Hashemian, M.H.; Weber, V.; Borštnik, U.; Taillefumier, M.; Jakobovits, A.S.; Lazzaro, A.; Pabst, H.; Müller, T.; Schade, R.; Guidon, M.; Andermatt, S.; Holmberg, N.; Schenter, G.K.; Hehn, A.; Bussy, A.; Belleflamme, F.; Tabacchi, G.; Glöß, A.; Lass, M.; Bethune, I.; Mundy, C.J.; Plessl, C.; Watkins, M.; VandeVondele, J.; Krack, M.; Hutter, J. CP2K: An electronic structure and molecular dynamics software package − Quickstep: Efficient and accurate electronic structure calculations. J. Chem. Phys. 2020, 152, 194103. [Google Scholar] [CrossRef]
- Perdew, J.P.; Ernzerhof, M.; Burke, K. Rationale for mixing exact exchange with density functional approximations. J. Chem. Phys. 1996, 105, 9982–9985. [Google Scholar] [CrossRef]
- Adamo, C.; Barone, V. Toward reliable density functional methods without adjustable parameters: The PBE0 model. J. Chem. Phys. 1999, 110, 6158–6170. [Google Scholar] [CrossRef]
- Tverjanovich, A.; Khomenko, M.; Benmore, C.J.; Bokova, M.; Sokolov, A.; Fontanari, D.; Kassem, M.; Usuki, T.; Bychkov, E. Bulk glassy GeTe2: A missing member of the netrahedral GeX2 family and a precursor for the next generation of phase-change materials. Chem. Mater. 2021, 33, 1031–1045. [Google Scholar] [CrossRef]
- Kassem, M.; Bounazef, T.; Sokolov, A.; Bokova, M.; Fontanari, D.; Hannon, A.C.; Alekseev, I.; Bychkov, E. Deciphering fast ion transport in glasses: a case study of sodium and silver vitreous sulfides. Inorg. Chem. 2022, 61, 12870–12885. [Google Scholar] [CrossRef]
- Kassem, M.; Benmore, C.J.; Tverjanovich, A.; Usuki, T.; Khomenko, M.; Fontanari, D.; Sokolov, A.; Ohara, K.; Bokova, M.; Kohara, S.; Bychkov, E. Glassy and liquid Sb2S3: insight into the structure and dynamics of a promising functional material. J. Mater. Chem. C 2023, 11, 4654–4673. [Google Scholar] [CrossRef]
- Grimme, S.; Ehrlich, S.; Goerigk, L. Effect of the damping function in dispersion corrected density functional theory. J. Comput. Chem. 2011, 32, 1456–1465. [Google Scholar] [CrossRef]
- Micoulaut, M. Communication: Van der Waals corrections for an improved structural description of telluride based materials. J. Chem. Phys. 2013, 138, 061103. [Google Scholar] [PubMed]
- Bouzid, A.; Massobrio, C.; Boero, M.; Ori, G.; Sykina, K.; Furet, E. Role of the van der Waals interactions and impact of the exchange-correlation functional in determining the structure of glassy GeTe4. Phys. Rev. B 2015, 92, 134208. [Google Scholar] [CrossRef]
- Gereben, O.; Pusztai, L. RMC_POT, a computer code for reverse Monte Carlo modeling the structure of disordered systems containing molecules of arbitrary complexity. J. Comput. Chem. 2012, 33, 2285–2291. [Google Scholar] [CrossRef] [PubMed]
- Hartwigsen, C.; Goedecker, S.; Hutter, J. Relativistic separable dual-space Gaussian pseudo-potentials from H to Rn. Phys. Rev. B 1998, 58, 3641. [Google Scholar] [CrossRef]
- Nosé, S. A Molecular dynamics method for simulations in the canonical ensemble. Mol. Phys. 1984, 52, 255–268. [Google Scholar] [CrossRef]
- Hoover, W.G. Canonical dynamics: Equilibrium phase-space distributions. Phys. Rev. A 1985, 31, 1695. [Google Scholar] [CrossRef] [PubMed]
- Le Roux, S.; Jund, P. Ring statistics analysis of topological networks: New approach and application to amorphous GeS2 and SiO2 systems. Comput. Mater. Sci. 2010, 49, 70–83. [Google Scholar] [CrossRef]
- Kohara, S.; Ohno, H.; Takata, M.; Usuki, T.; Morita, H.; Suzuya, K.; Akola, J.; Pusztai, L. Lead silicate glasses: Binary network-former glasses with large amounts of free volume. Phys. Rev. B 2010, 82, 134209. [Google Scholar] [CrossRef]
- Heimbach, I.; Rhiem, F.; Beule, F.; Knodt, D.; Heinen, J.; Jones, R.O. pyMolDyn: Identification, structure, and properties of cavities/vacancies in condensed matter and molecules. J. Comput. Chem. 2017, 38, 389–394. [Google Scholar] [CrossRef]
- Cherin, P.; Unger, P. Two-dimensional refinement of the crystal structure of tellurium. Acta Crystallogr. 1967, 23, 670–671. [Google Scholar] [CrossRef]
- Nassary, M.M.; Gerges, M.K.; Shaban, H.T.; Salwa, A.S. Some physical properties of Ga2Te5 single crystals. Physica B 2003, 337, 130–137. [Google Scholar] [CrossRef]
- Mott, N.F.; Davis, E.A. Electronic Processes in Non-Crystalline Materials, 2nd ed.; Clarendon Press: Oxford, 1979; pp. 5–64, 491−497. [Google Scholar]
- Ray, A.K.; Swan, R.; Hogarth, C.A. Conduction mechanisms in amorphous tellurium films. J. Non-Cryst. Solids 1994, 168, 150–156. [Google Scholar] [CrossRef]
- Bekheet, A.E. Electrical and optical properties of amorphous Ga2Te3 films. Eur. Phys. J.: Appl. Phys. 2001, 16, 187–193. [Google Scholar]
- Swanepoel, R. Determination of the thickness and optical constants of amorphous silicon. J. Phys. E: Sci. Instrum. 1983, 16, 1214–1222. [Google Scholar] [CrossRef]
- Jenkins, F.A.; White, H.E. Fundamentals of Optics, 4th ed.; McGraw-Hill: New York, 2001; pp. 479–485. [Google Scholar]
- Tauc, J. Optical properties of amorphous semiconductors. In Amorphous and Liquid Semiconductors, ed. J. Tauc; Plenum: London, 1974; pp. 159–220. [Google Scholar]
- Heller, W.; Bhatnagar, H.L.; Nakagaki, M. Theoretical investigations on the light scattering of spheres. XIII. The ''wavelength exponent'' of differential turbidity spectra. J. Chem. Phys. 1962, 36, 1163–1170. [Google Scholar] [CrossRef]
- Melik, D.H.; Fogler, H.S. Turbidimetric determination of particle size distributions of colloidal systems. J. Colloid Interface Sci. 1983, 92, 161–180. [Google Scholar] [CrossRef]
- Green, M.A.; Keevers, M.J. Optical properties of intrinsic silicon at 300 K. Prog. Photovolt.: Res. Appl. 1995, 3, 189–192. [Google Scholar] [CrossRef]
- Zacharias, M.; Feliciano Giustino, F. One-shot calculation of temperature-dependent optical spectra and phonon-induced band-gap renormalization. Phys. Rev. B 2016, 94, 075125. [Google Scholar] [CrossRef]
- Koughia, K.; Singh, J.; Kasap, S.O.; Ruda, H.E. Fundamental optical properties of materials II. In Optical Properties of Condensed Matter and Applications, ed. J. Singh; Wiley: Chichester, UK, 2006; pp. 27–46. [Google Scholar]
- Noffsinger, J.; Kioupakis, E.; Van de Walle, C.G.; Louie, S.G.; Cohen, M.L. Phonon-assisted optical absorption in silicon from first principles. Phys. Rev. Lett. 2012, 108, 167402. [Google Scholar] [CrossRef]
- Zacharias, M.; Patrick, C.E.; Giustino, F. Stochastic approach to phonon-assisted optical absorption. Phys. Rev. Lett. 2015, 115, 177401. [Google Scholar] [CrossRef]
- Kangsabanik, J.; Svendsen, M.K.; Taghizadeh, A.; Crovetto, A.; Thygesen, K.S. Indirect band gap semiconductors for thin-film photovoltaics: High-throughput calculation of phonon-assisted absorption. J. Am. Chem. Soc. 2022, 144, 19872–19883. [Google Scholar] [CrossRef]
- Bullett, D.W. Square-planar coordinated tellurides – The electronic structures of Re2Te5, Ga2Te5 and K2SnTe5. Solid State Commun. 1984, 51, 51–53. [Google Scholar] [CrossRef]
- Bychkov, E.; Benmore, C.J.; Price, D.L. Compositional changes of the first sharp diffraction peak in binary selenide glasses. Phys. Rev. B 2005, 72, 172107. [Google Scholar] [CrossRef]
- Bytchkov, A.; Cuello, G.J.; Kohara, S.; Benmore, C.J.; Price, D.L.; Bychkov, E. Unraveling the atomic structure of Ge-rich sulfide glasses. Phys. Chem. Chem. Phys. 2013, 15, 8487–8494. [Google Scholar] [CrossRef]
- Hannon, A.C. XTAL: a Program for Calculating Interatomic Distances and Coordination Numbers for Model Structures; Rutherford-Appleton Laboratory Report RAL-93−063, 1993. Available online: http://wwwisis2.isis.rl.ac.uk/disordered/ACH/Software/xtal.htm.
- Voleská, I.; Akola, J.; Jóvári, P.; Gutwirth, J.; Wágner, T.; Vasileiadis, T.; Yannopoulos, S.N.; Jones, R.O. Structure, electronic, and vibrational properties of glassy Ga11Ge11Te78: Experimentally constrained density functional study. Phys. Rev. B 2012, 86, 094108. [Google Scholar] [CrossRef]
- Pethes, I.; Piarristeguy, A.; Pradel, A.; Michalik, S.; Nemausat, R.; Darpentigny, J.; Jóvári, P. Short range order and topology of GexGaxTe100-2x glasses. J. Alloys Compd. 2020, 834, 155097. [Google Scholar] [CrossRef]
- Ichikawa, T. Electron diffraction study of the local atomic arrangement in amorphous tellurium films. Phys. Stat. Solidi B 1973, 56, 707–715. [Google Scholar] [CrossRef]
- Brazhkin, V.V.; Bychkov, E.; Tsiok, O.B. As2Te3 glass under high hydrostatic pressure: Polyamorphism, relaxation, and metallization. Phys. Rev. B 2017, 95, 054205. [Google Scholar] [CrossRef]
- Chau, P.-L.; Hardwick, A.J. A new order parameter for tetrahedral configurations. Mol. Phys. 1998, 93, 511–518. [Google Scholar] [CrossRef]
- Errington, J.R.; Debenedetti, P.G. Relationship between structural order and the anomalies of liquid water. Nature 2001, 409, 318–321. [Google Scholar] [CrossRef] [PubMed]
- Caravati, S.; Bernasconi, M.; Kühne, T.D.; Krack, M.; Parrinello, M. Coexistence of tetrahedral- and octahedrallike sites in amorphous phase change materials, Appl. Phys. Lett., 2007, 91, 171906. [Google Scholar]
- Jones, C.Y.; Bryan, J.C.; Kirschbaum, K.; Edwards, J.G. Refinement of the crystal structure of digallium trisulfide, Ga2S3, Z. Kristallogr. NCS 2001, 216, 327–328. [Google Scholar] [CrossRef]
- Serebryanaya, N.R. The crystal structure of pressure-induced phases of In2Te3 and Ga2Te3. Powder Diffr. 1992, 7, 99–102. [Google Scholar] [CrossRef]
- Blaineau, S.; Jund, P. Electronic structure of amorphous germanium disulfide via density-functional molecular dynamics simulations, Phys. Rev. B 2004, 70, 184210. [Google Scholar] [CrossRef]
- Akola, J.; Jones, R.O. Structural phase transitions on the nanoscale: The crucial pattern in the phase-change materials Ge2Sb2Te5 and GeTe, Phys. Rev. B 2007, 76, 235201. [Google Scholar] [CrossRef]
- Dragoni, D.; Gabardi, S.; Bernasconi, M. First-principles study of the liquid and amorphous phases of In2Te3. Phys. Rev. Mater., 2017, 1, 035603. [Google Scholar] [CrossRef]
- Kalikka, J.; Akola, J.; Jones, R.O.; Kohara, S.; Usuki, T. Amorphous Ge15Te85: density functional, high-energy X-ray and neutron diffraction study. J. Phys.: Condens. Matter 2012, 24, 015802. [Google Scholar] [CrossRef] [PubMed]
- Caravati, S.; Bernasconi, M.; Parrinello, M. First-principles study of liquid and amorphous Sb2Te3, Phys. Rev. B 2010, 81, 014201. [Google Scholar] [CrossRef]
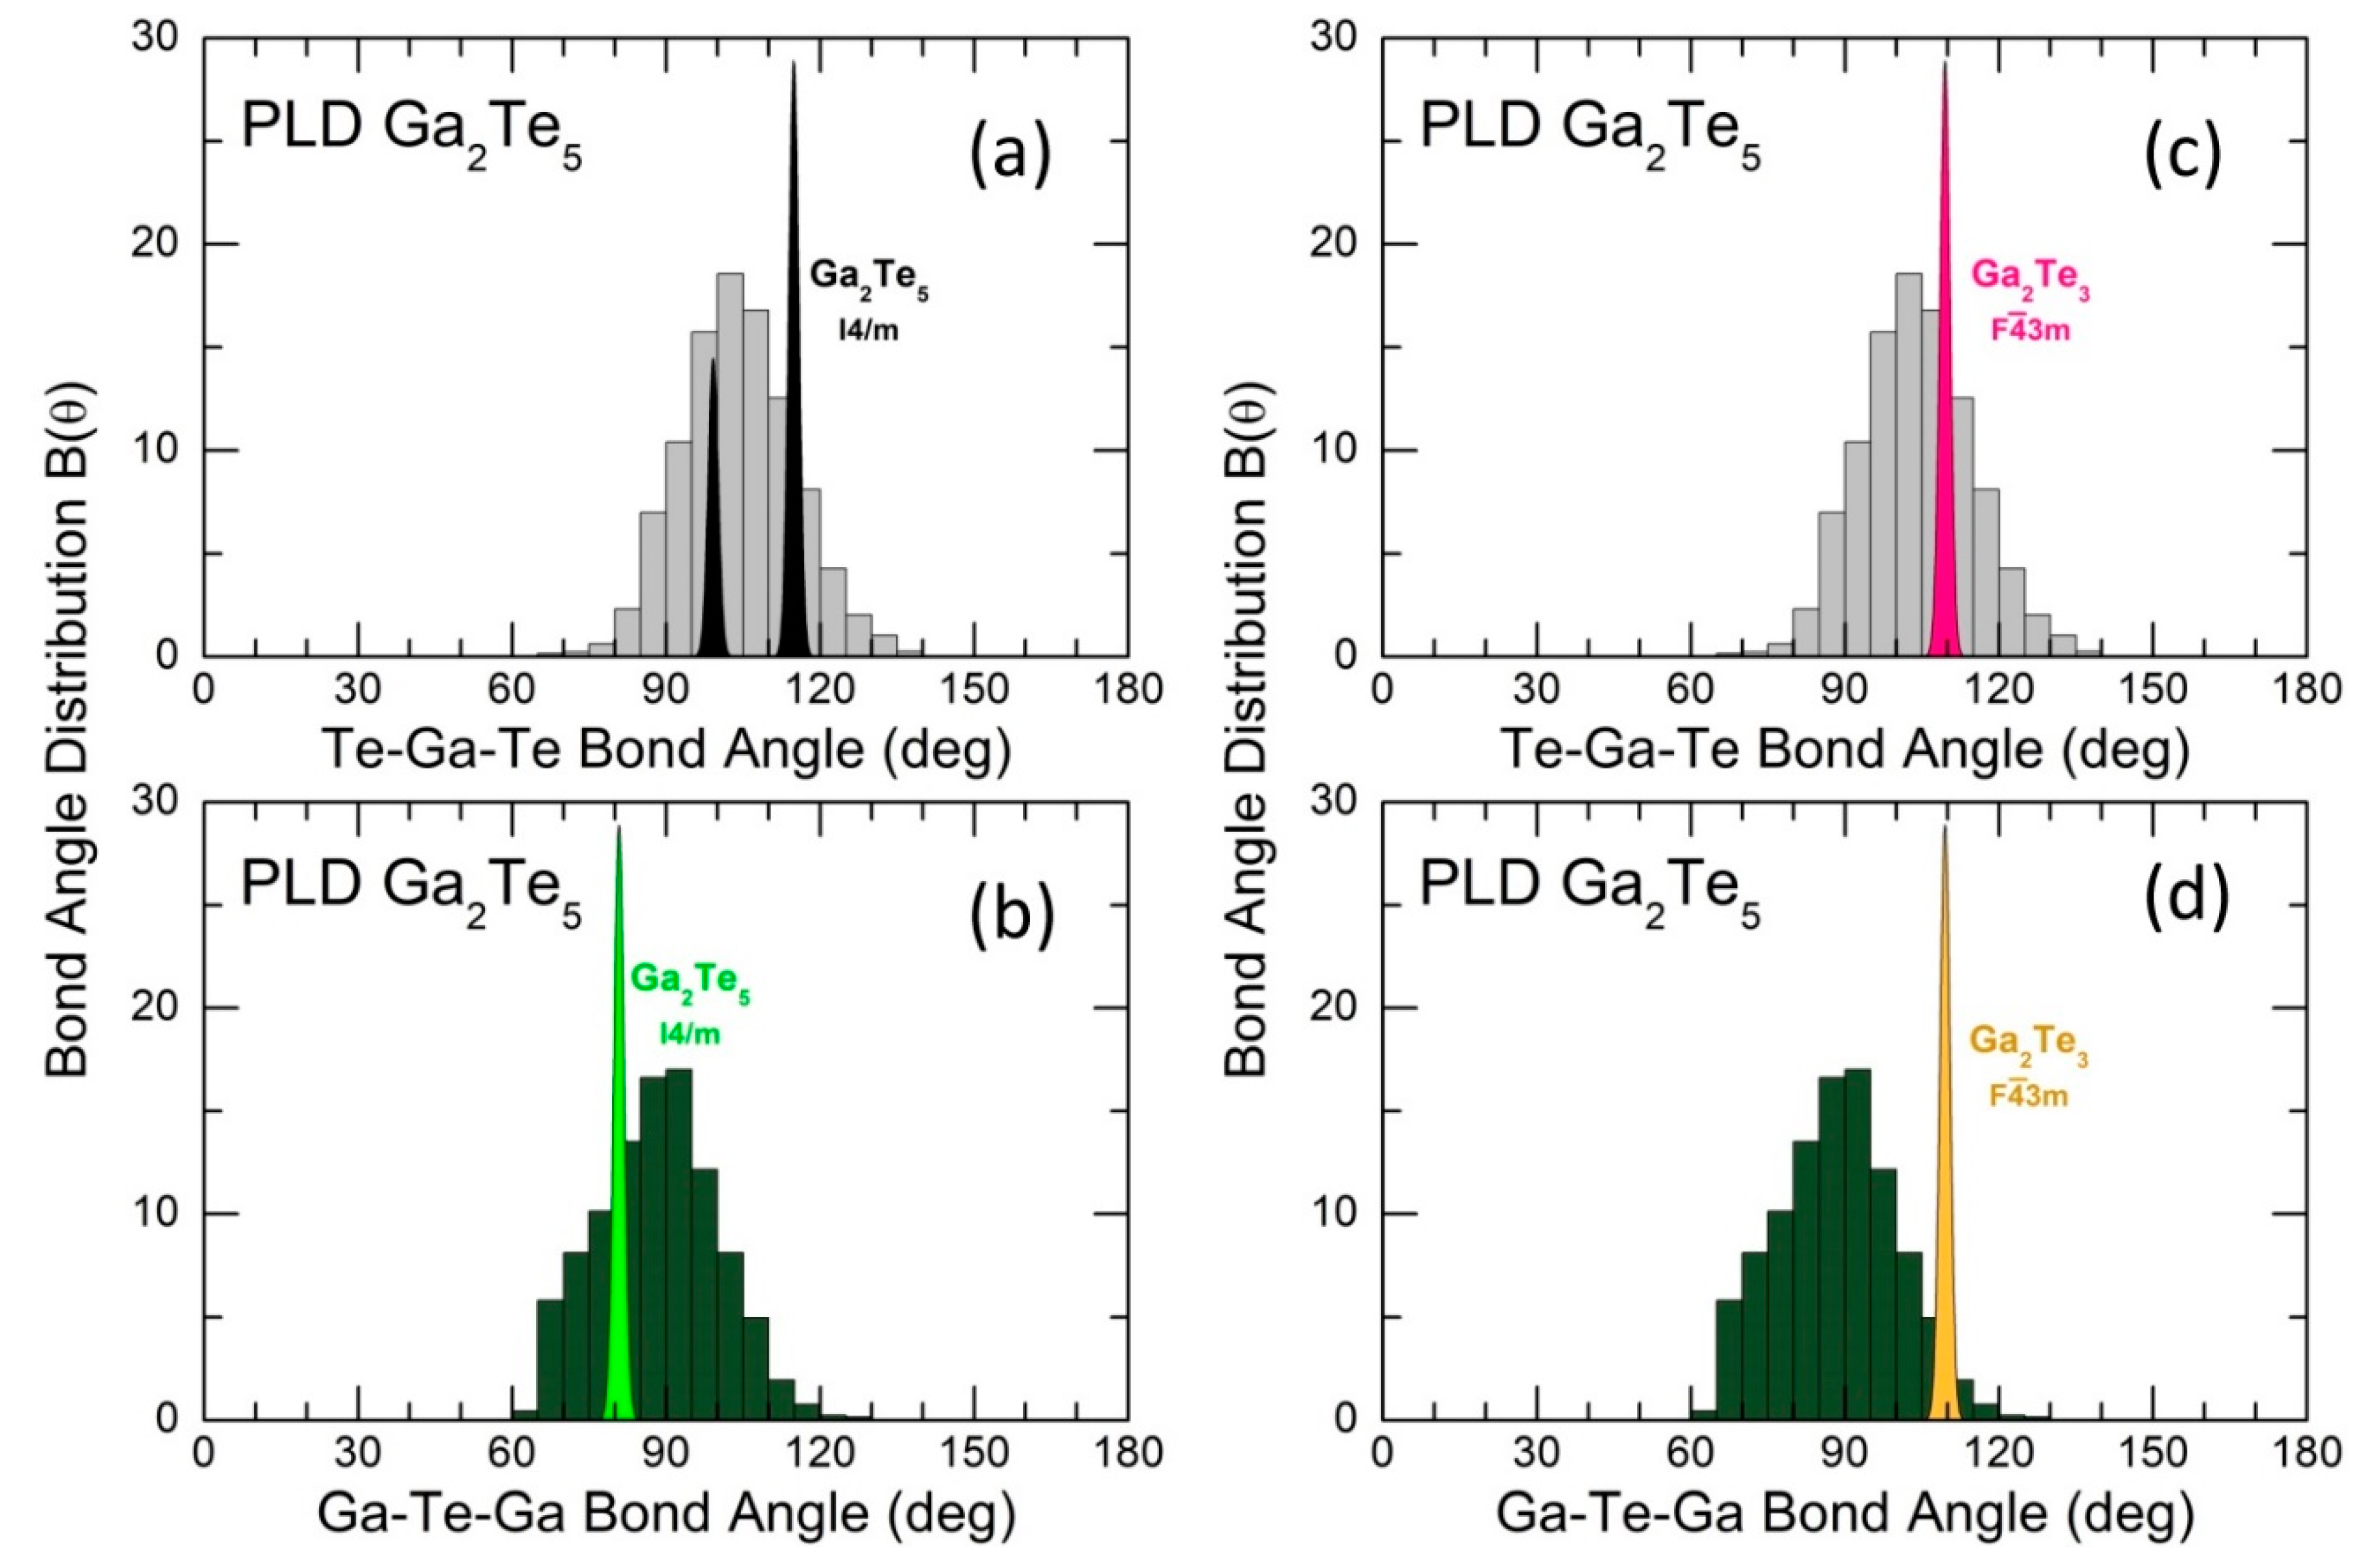
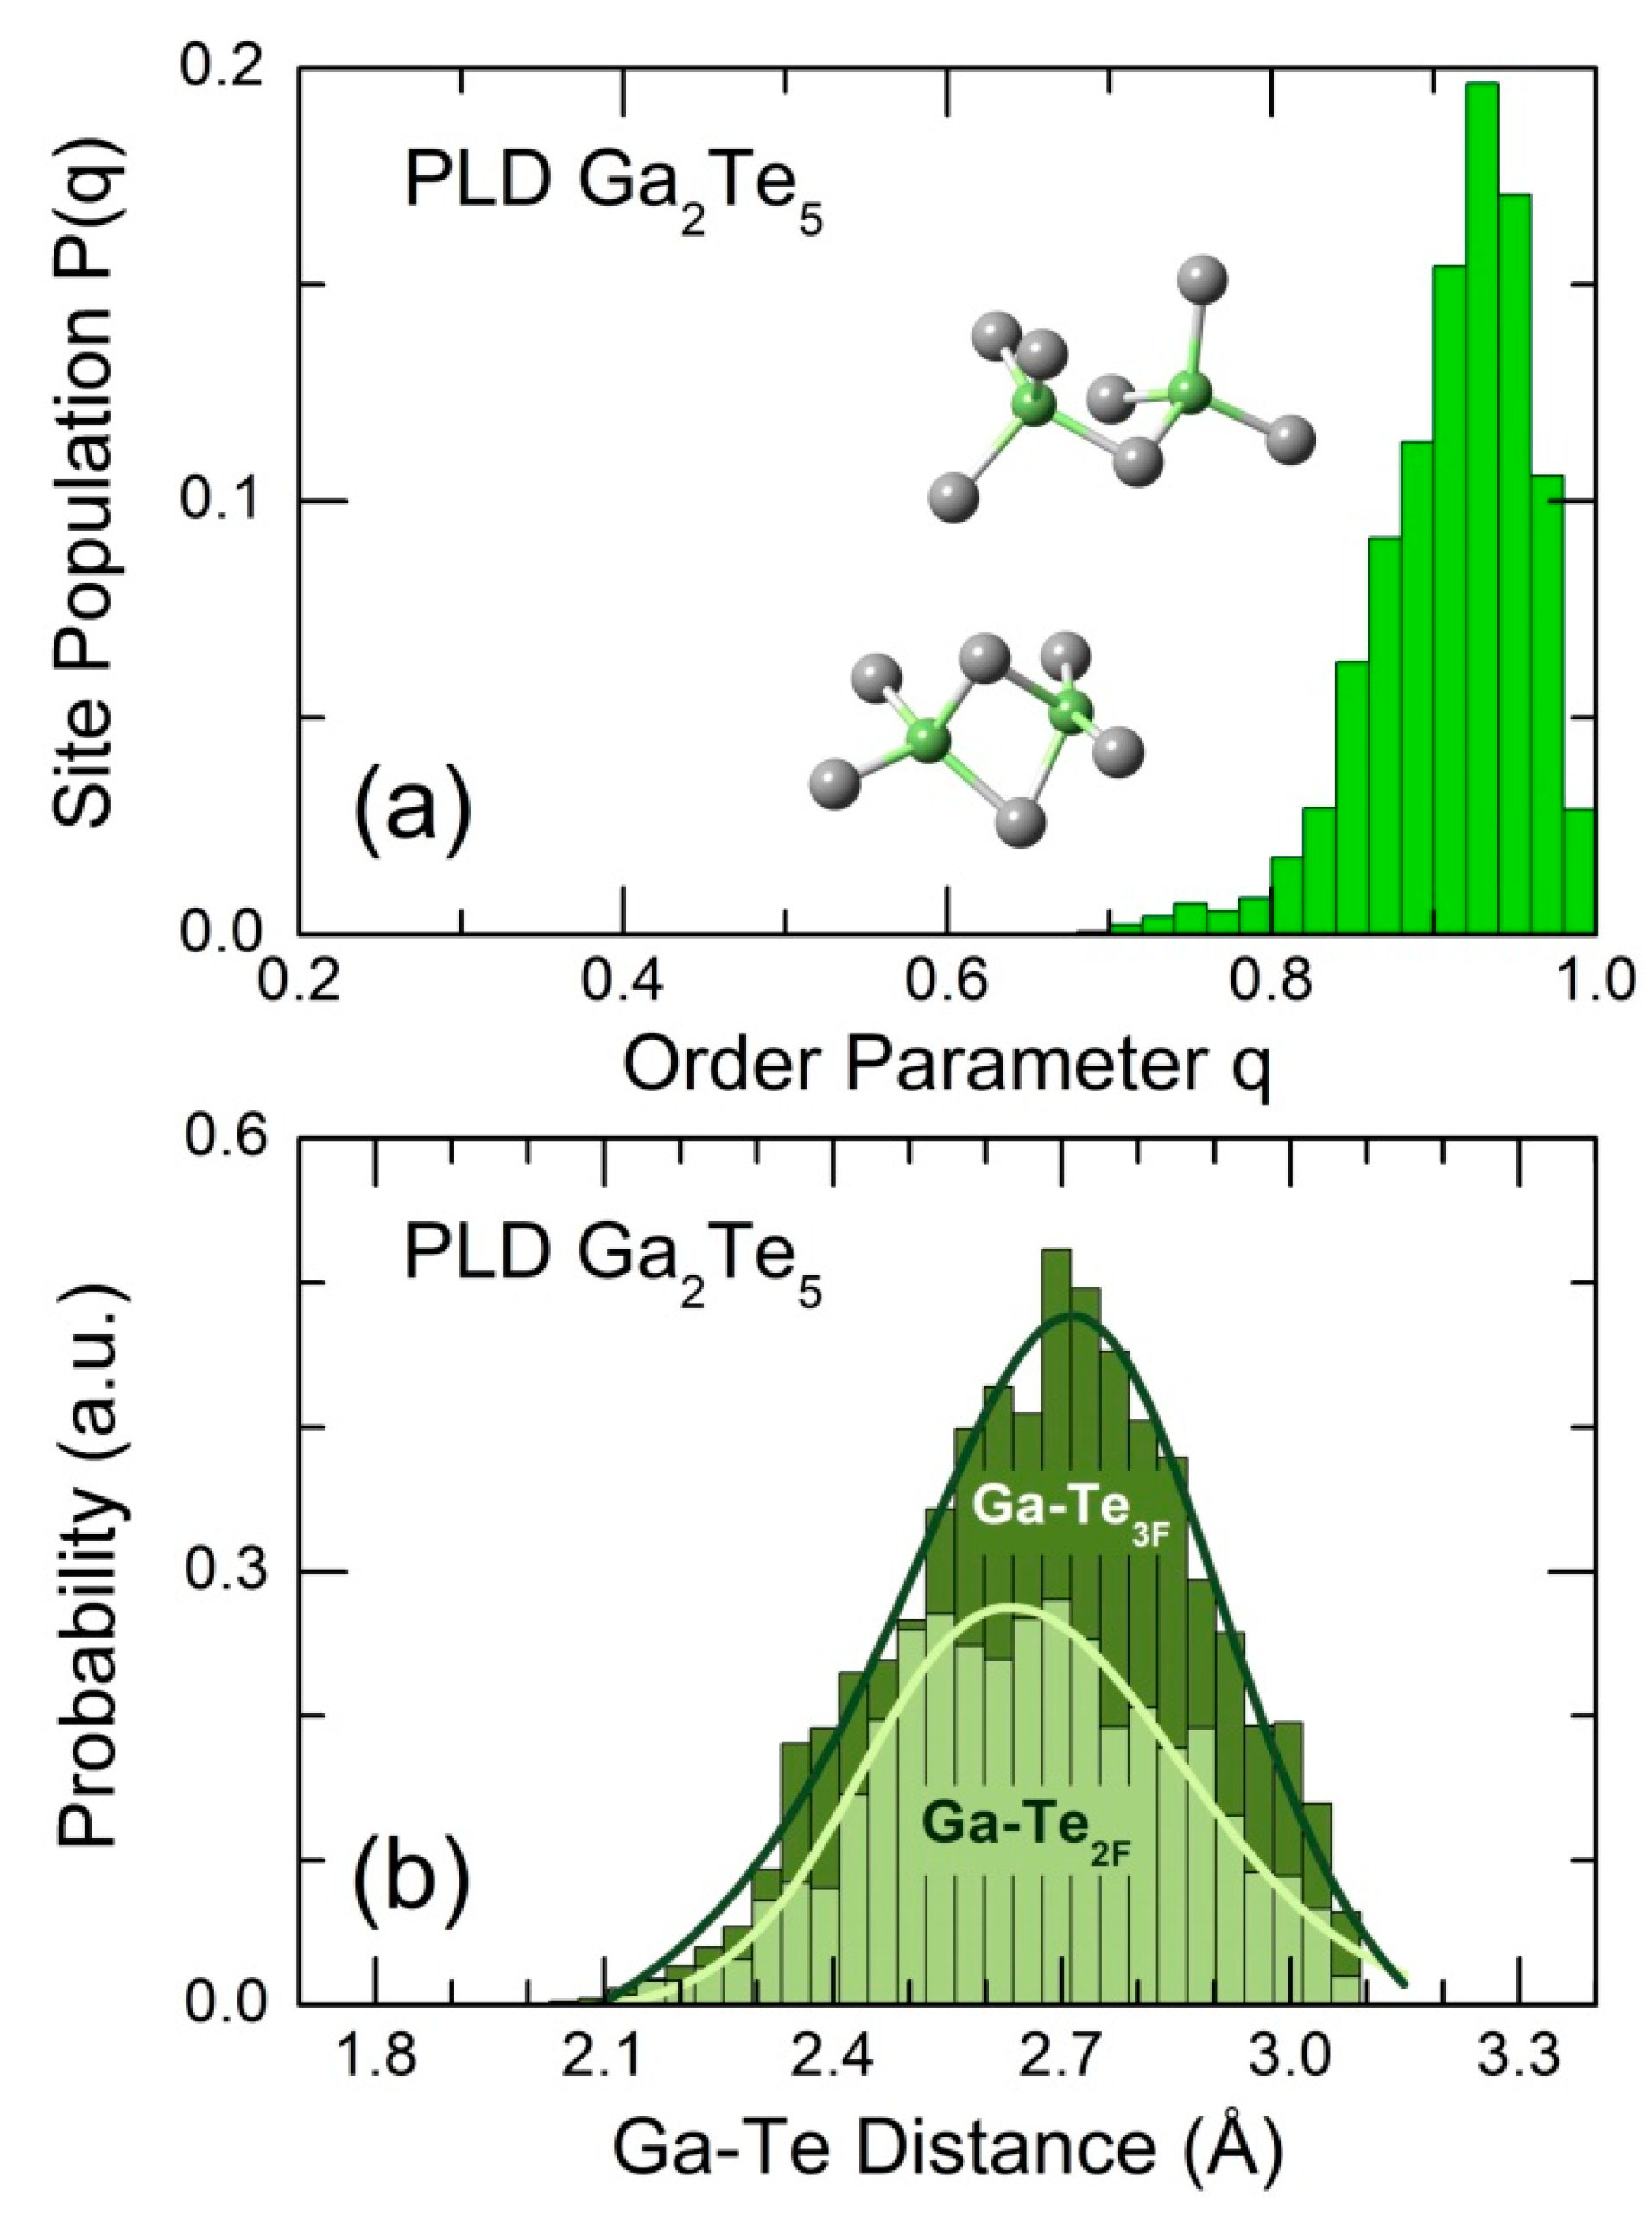

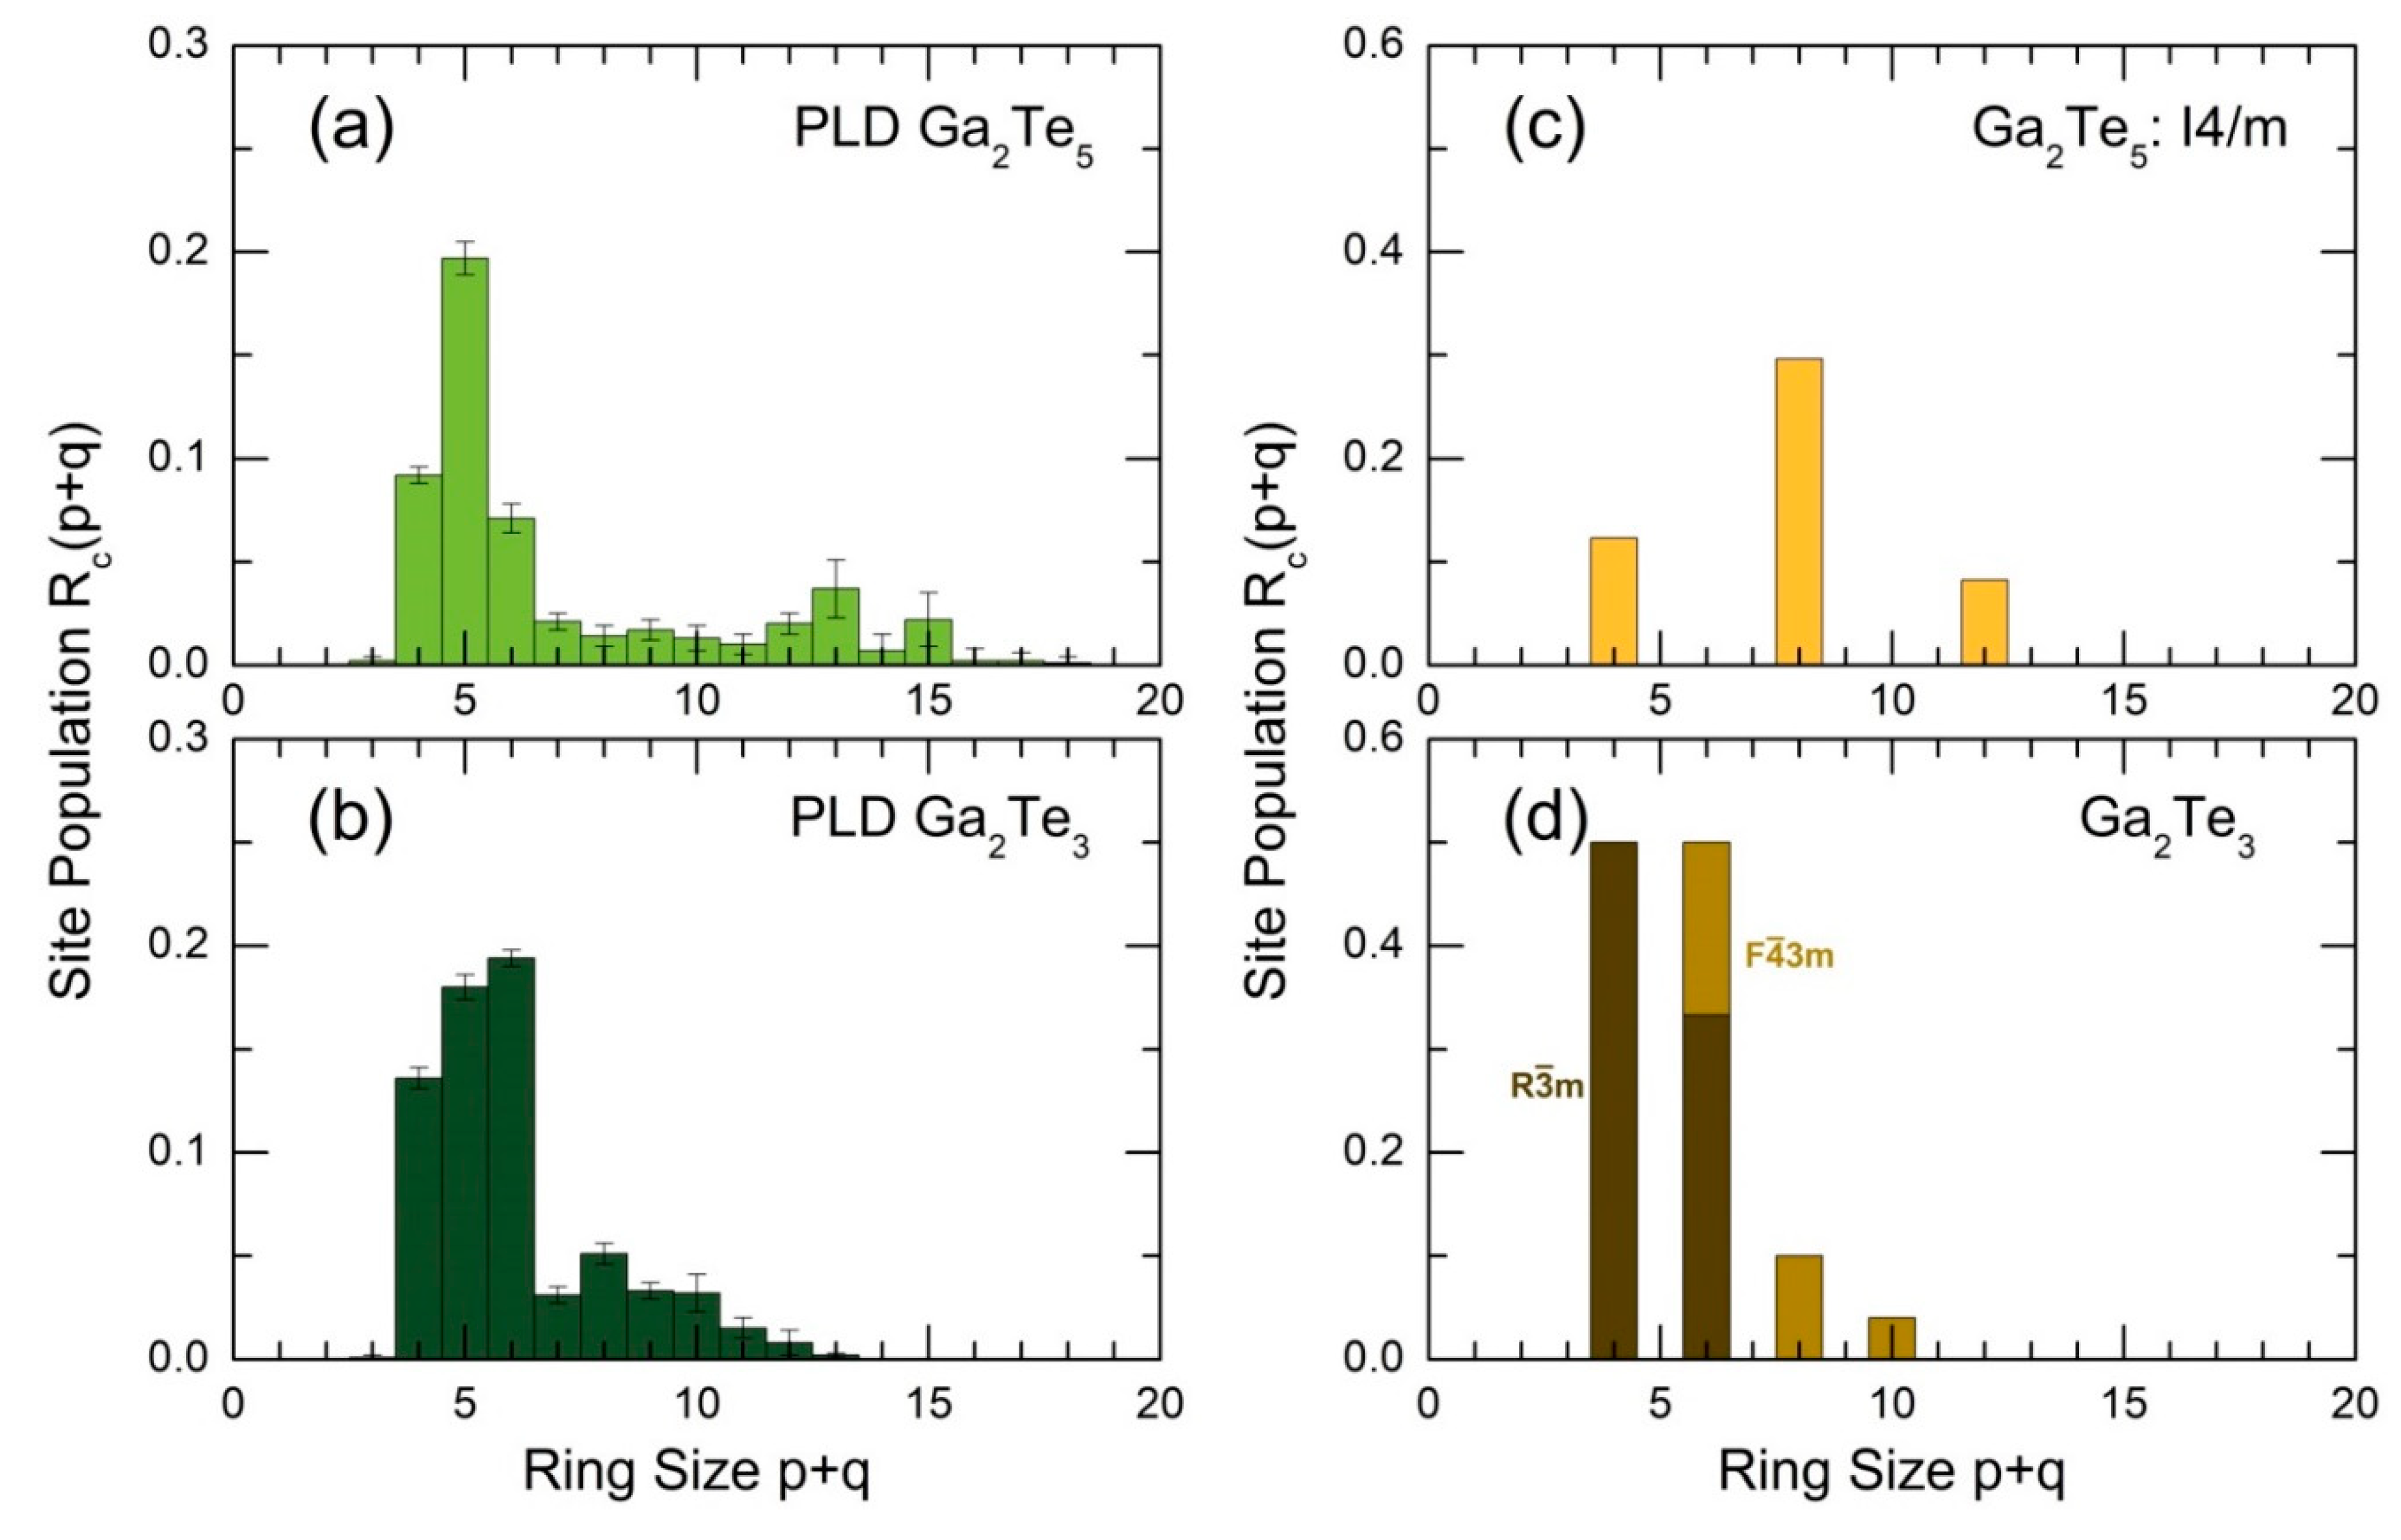
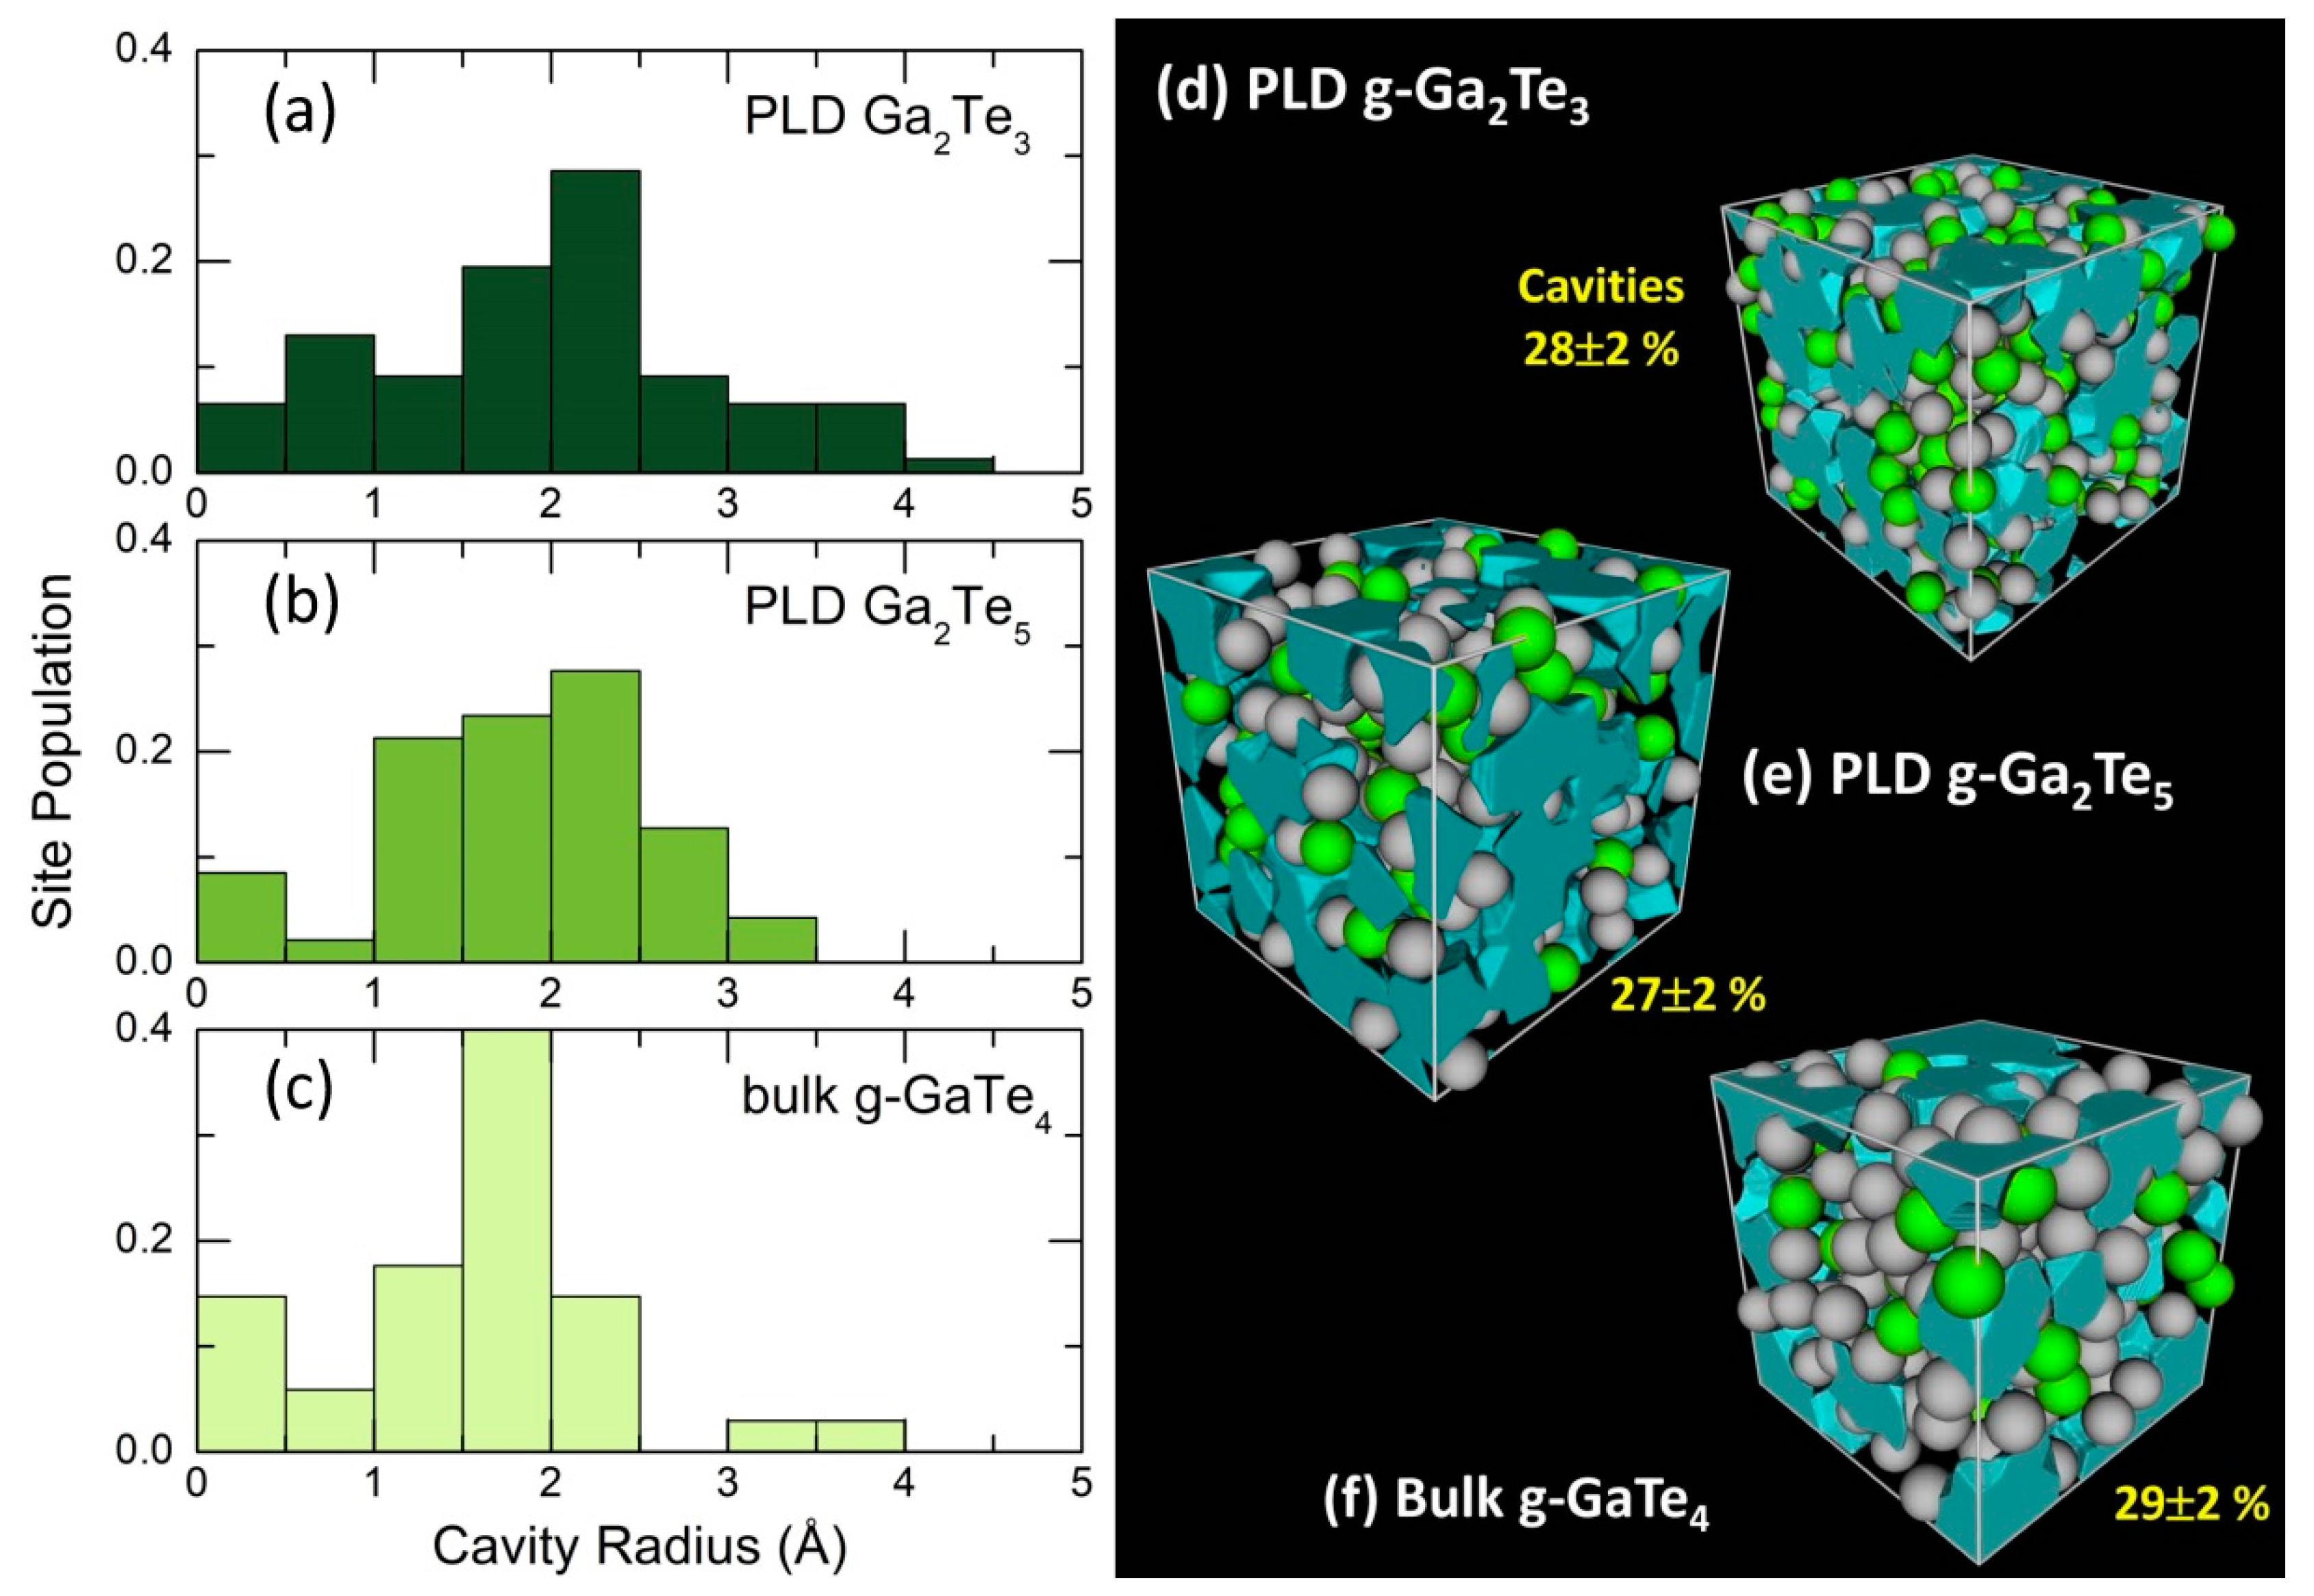
| Ga-Ga | Ga-Te | Te-Te | ||||
|---|---|---|---|---|---|---|
| High-energy X-ray diffraction | ||||||
| − | − | 2.637(3) | 3.98(5) | 2.796(5) | 1.01(8) | 3.98(5) |
| First-principles molecular dynamics (GGA/PBE0) | ||||||
| 2.417 | 0.03 | 2.615* | 3.97 | 2.802* | 0.93 | 4.00 |
Disclaimer/Publisher’s Note: The statements, opinions and data contained in all publications are solely those of the individual author(s) and contributor(s) and not of MDPI and/or the editor(s). MDPI and/or the editor(s) disclaim responsibility for any injury to people or property resulting from any ideas, methods, instructions or products referred to in the content. |
© 2023 by the authors. Licensee MDPI, Basel, Switzerland. This article is an open access article distributed under the terms and conditions of the Creative Commons Attribution (CC BY) license (http://creativecommons.org/licenses/by/4.0/).


