1. Introduction
Loop-mediated isothermal amplification (LAMP) is a high specificity, rapid nucleic acid amplification mechanism (Notomi et al. 2000). LAMP provides faster time to results, lower complexity, and lower cost compared to Polymerase Chain Reaction (PCR) tests while providing higher accuracy than rapid antigen tests (RAT) (Zhao et al. 2020; Li et al. 2010; Hayasaka, Aoki, and Morita 2013; Mannier and Yoon 2022; Sreejith et al. 2021). During the present pandemic, diagnostics were shown to be crucial for an efficient response, population health surveillance, and optimization of patient management. Diagnosis was mainly based on two types of technologies: molecular and antigen. Within the former category, a variety of POC/near-POC technologies were successfully produced, accelerating the path to POC solutions. These are based on a variety of functional principles e.g., RT-PCR, LAMP assays, streamlined nucleic acid amplification, CRISPR, etc. The herein system presents distinct advantages compared to some of the existing solutions including: i) reporting qualitative and quantitative results, ii) proven better performance in environmental samples, iii) automated signal processing, and iv) small and cost-effective components to enhance portability and accessibility.
Accurate detection of COVID-19 remains relevant during the transition from pandemic response to control for a variety of reasons, e.g., identifying new outbreaks, re-infections, and the emergence of variants of concern (VOCs) and understanding their impact. Thus, a continuous surveillance for SARS-CoV-2 not only safeguards individuals with enhanced risk of infection or clinically vulnerable, but also ensures social safety, and enables economic recovery.
The ideal biosensor system is a fully POC device that can take a primary sample from a patient, perform nucleic acid extraction and sample preparation by mixing the sample with the LAMP master mix, then have the system perform the nucleic acid amplification and interpret the results with high sensitivity and specificity. Many recent studies have successfully developed POC devices that rely on the naked eye to interpret qualitative assay results (Deng et al. 2021; Vural Kaymaz et al. 2021) or complex read-out systems to analyze the assay (Yang et al. 2021; Hu et al. 2022). Other recent studies have used a digital camera to evaluate the result of the assay but rely on the sample being prepared into PCR tubes prior to amplification (Tharmakulasingam et al. 2021; Sreejith et al. 2021; Staples et al. 2022), or a complex and expensive amplification process such as the use of a centrifugal device, or droplet microfluidics (Malic et al. 2022; Prakash et al. 2015). As shown by (Tharmakulasingam et al. 2021), artificial intelligence (AI) can be used to augment the sensitivity and specificity of LAMP assays but requires images to train and classify features and patterns (Tharmakulasingam et al. 2021). Moving towards a POC device that uses AI to maximize the assay’s sensitivity and specificity, system alignment between the integrated camera, the laser, and the droplet becomes critical. Microfluidics can be used to maintain alignment, however the mitigation of evaporation and thermocapillary effects becomes paramount to the design of the microfluidic channels such that the full volume of the assay has phase and spatial stability (Jiao, Nguyen, and Huang 2007). Sample lysis and preparation has also been performed using a variety of microfluidic techniques (Deng et al. 2021; Hu et al. 2022; Malic et al. 2022; Yang et al. 2021; Prakash et al. 2016).
In this work, we demonstrate a miniaturized LAMP optical biosensor setup for the detection of COVID-19 gene sequences suitable for point-of-care (POC) adaptation. Two small footprint systems were designed and tested for detecting extracted RNA of various SARS-CoV-2 strains. Moving towards a POC system, the later system required improvements in automated analysis, footprint size, and the ability to incorporate automated sample preparation. This augmented small-footprint system aligned an integrated camera and the laser with a soft microfluidic chip to achieve the desired optical alignment for automated data collection. The mitigation of evaporation and thermocapillary effects were paramount considerations in the design of the microfluidic chips such that the droplet position and size remained fixed during automated image sampling. The system used a negative template control to establish a baseline florescence threshold and viral detection was incurred when fluorescence amplification occurred. Successful detection of clinically extracted human and environment RNA samples over a broad CT range was performed.
2. Materials
2.1. Microfluidic Chip Design & Fabrication
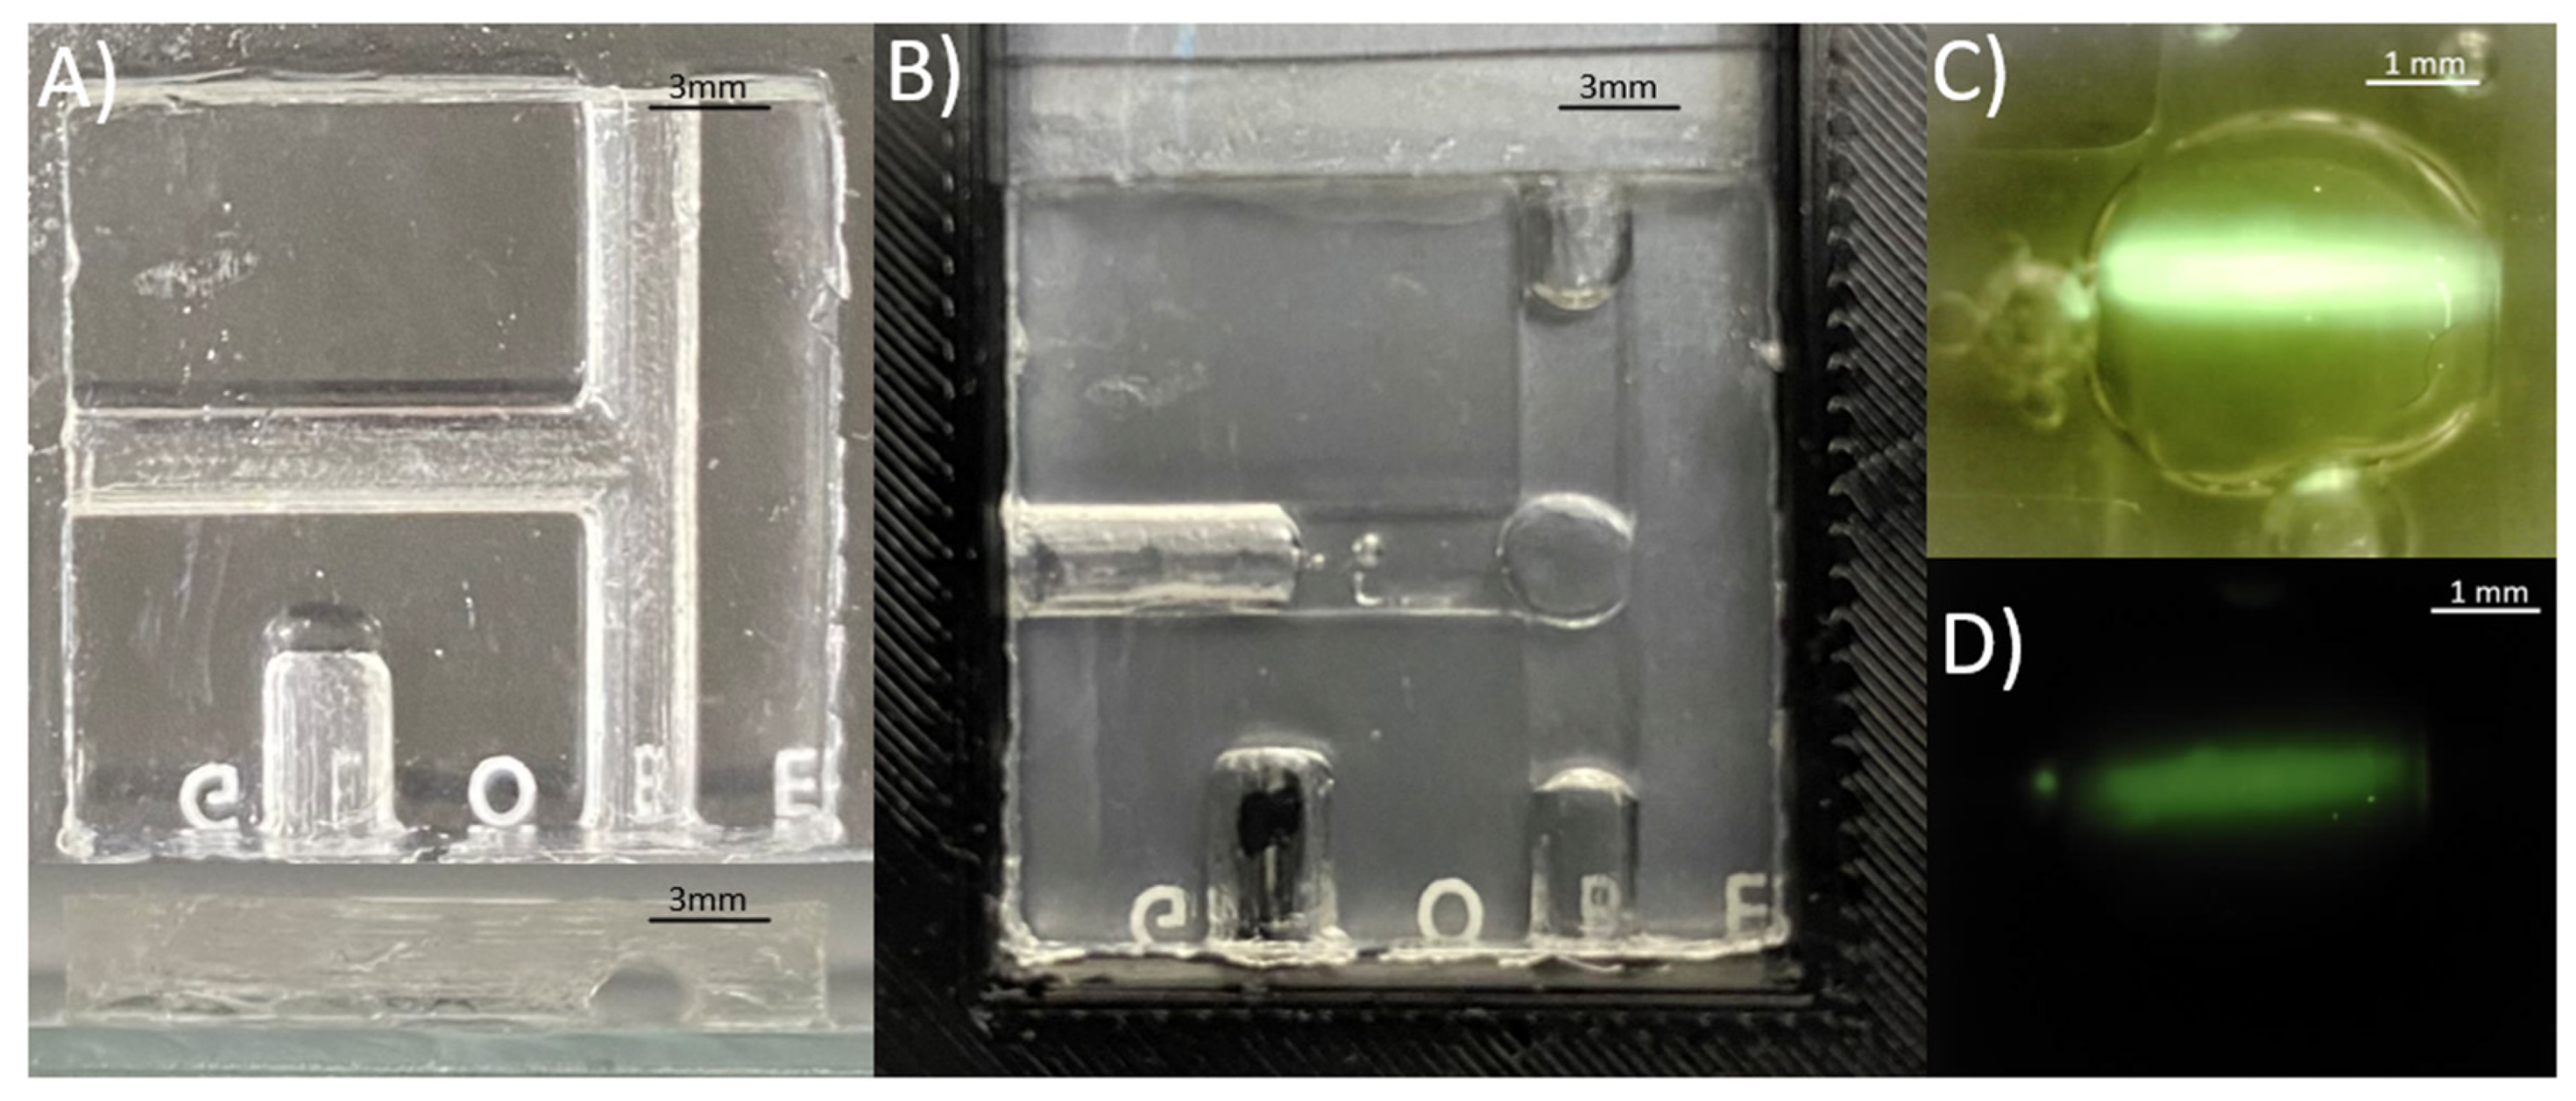
To mitigate thermocapillary effects and evaporative sample losses, a soft microfluidic device was fabricated using Sylgard 184 silicone elastomer to suspend the LAMP assay droplet (
Figure 1). Mineral oil was chosen as an immiscible carrier liquid to surround the droplet in the channel prevent evaporation of the droplet (Jiao, Nguyen, and Huang 2007). The microfluidic channel shape was designed to minimize thermal gradients that cause inadvertent thermocapillary actuation within the microfluidic channel (Jiao, Nguyen, and Huang 2007; Karbalaei, Kumar, and Cho 2016). The channel ends were left open such that there is no net force in the x-y horizontal plane of the microfluidic chip caused by localized temperature gradients. Thus, the capillary effect at the channel-oil interface is relied on to prevent outward flow of liquid. A T-shaped channel was designed to balance the thermocapillary forces at the oil-air interfaces (
Figure 1 (a)). Any existing thermal gradient was minimized by partially wetting the droplet to the surface of the capillary at the back of the T-junction (Jiao, Nguyen, and Huang 2007). The channel was designed to be small such that there is a strong capillary force between the channel and the oil, and such that the droplet is large enough in the channel to wet the back surface of the T-junction. The spherical geometry of the droplet maintains its thermal stability in the semi-cylindrical channel if such a thermal gradient were to cause thermocapillary actuation of the oil plug. The mold for the microfluidic structure was fabricated using a Prusa i3 mk3s+ 3D printer using Polyethylene terephthalate glycol (PETG) with a layer height of 0.05 mm. The structure also contains a semi-cylindrical cavity used for the insertion of a thermistor for in-situ temperature measurement (
Figure 1 (b)). The microfluidic chips are prepared by mixing Sylgard 184 silicone elastomer and curing agent 1:10 and desiccated until air bubbles are completely removed. The Sylgard 184 silicone elastomer is poured inside the designed mold then cured for 24 hours. Once desiccated, it is then layered on a glass slide using a blade coater to achieve a thickness ~ 100 μm. The cured microfluidic structure is inserted onto the Sylgard 184 silicone elastomer layered glass slide then desiccated together until air bubbles are removed. The glass, uncured Sylgard 184 silicone elastomer and cured microfluidic structure are then cured at 100 °C for 15 minutes to form the microfluidic chip.
2.2. Optical assembly
The thermal stability of the droplet allowed sustained alignment between the RT-LAMP droplet and the 450 nm laser (Thorlabs, USA) to be captured by a CMOS camera chip. The Arducam 5MP Plus OV5642 Mini Module SPI Camera was chosen to replace the Edmund Optics EO-0413C CCD camera from preliminary setup design due to its small footprint, low-cost, and integrability with the ATmega-328p microcontroller allowing system-on-board automation of the image sensor read-out. The camera was fitted with a 1/1.8” 4K 12mm low distortion M12 Lens, as the 1/1.8” (14.11 mm) optical format is large compared to the 2.74 mm sensor size of the CMOS camera, making it suitable for the low light detection of the LAMP assay droplet. The thin lens approximation of Snell’s Law was used to determine the focus plane of the image at the desired magnification. The camera could be controlled through script and user interface to capture images in both lit and low-light conditions (
Figure 1 (c) & (d)).
2.3. System-on-Board Automation for Temperature Control & Sensor Read-Out
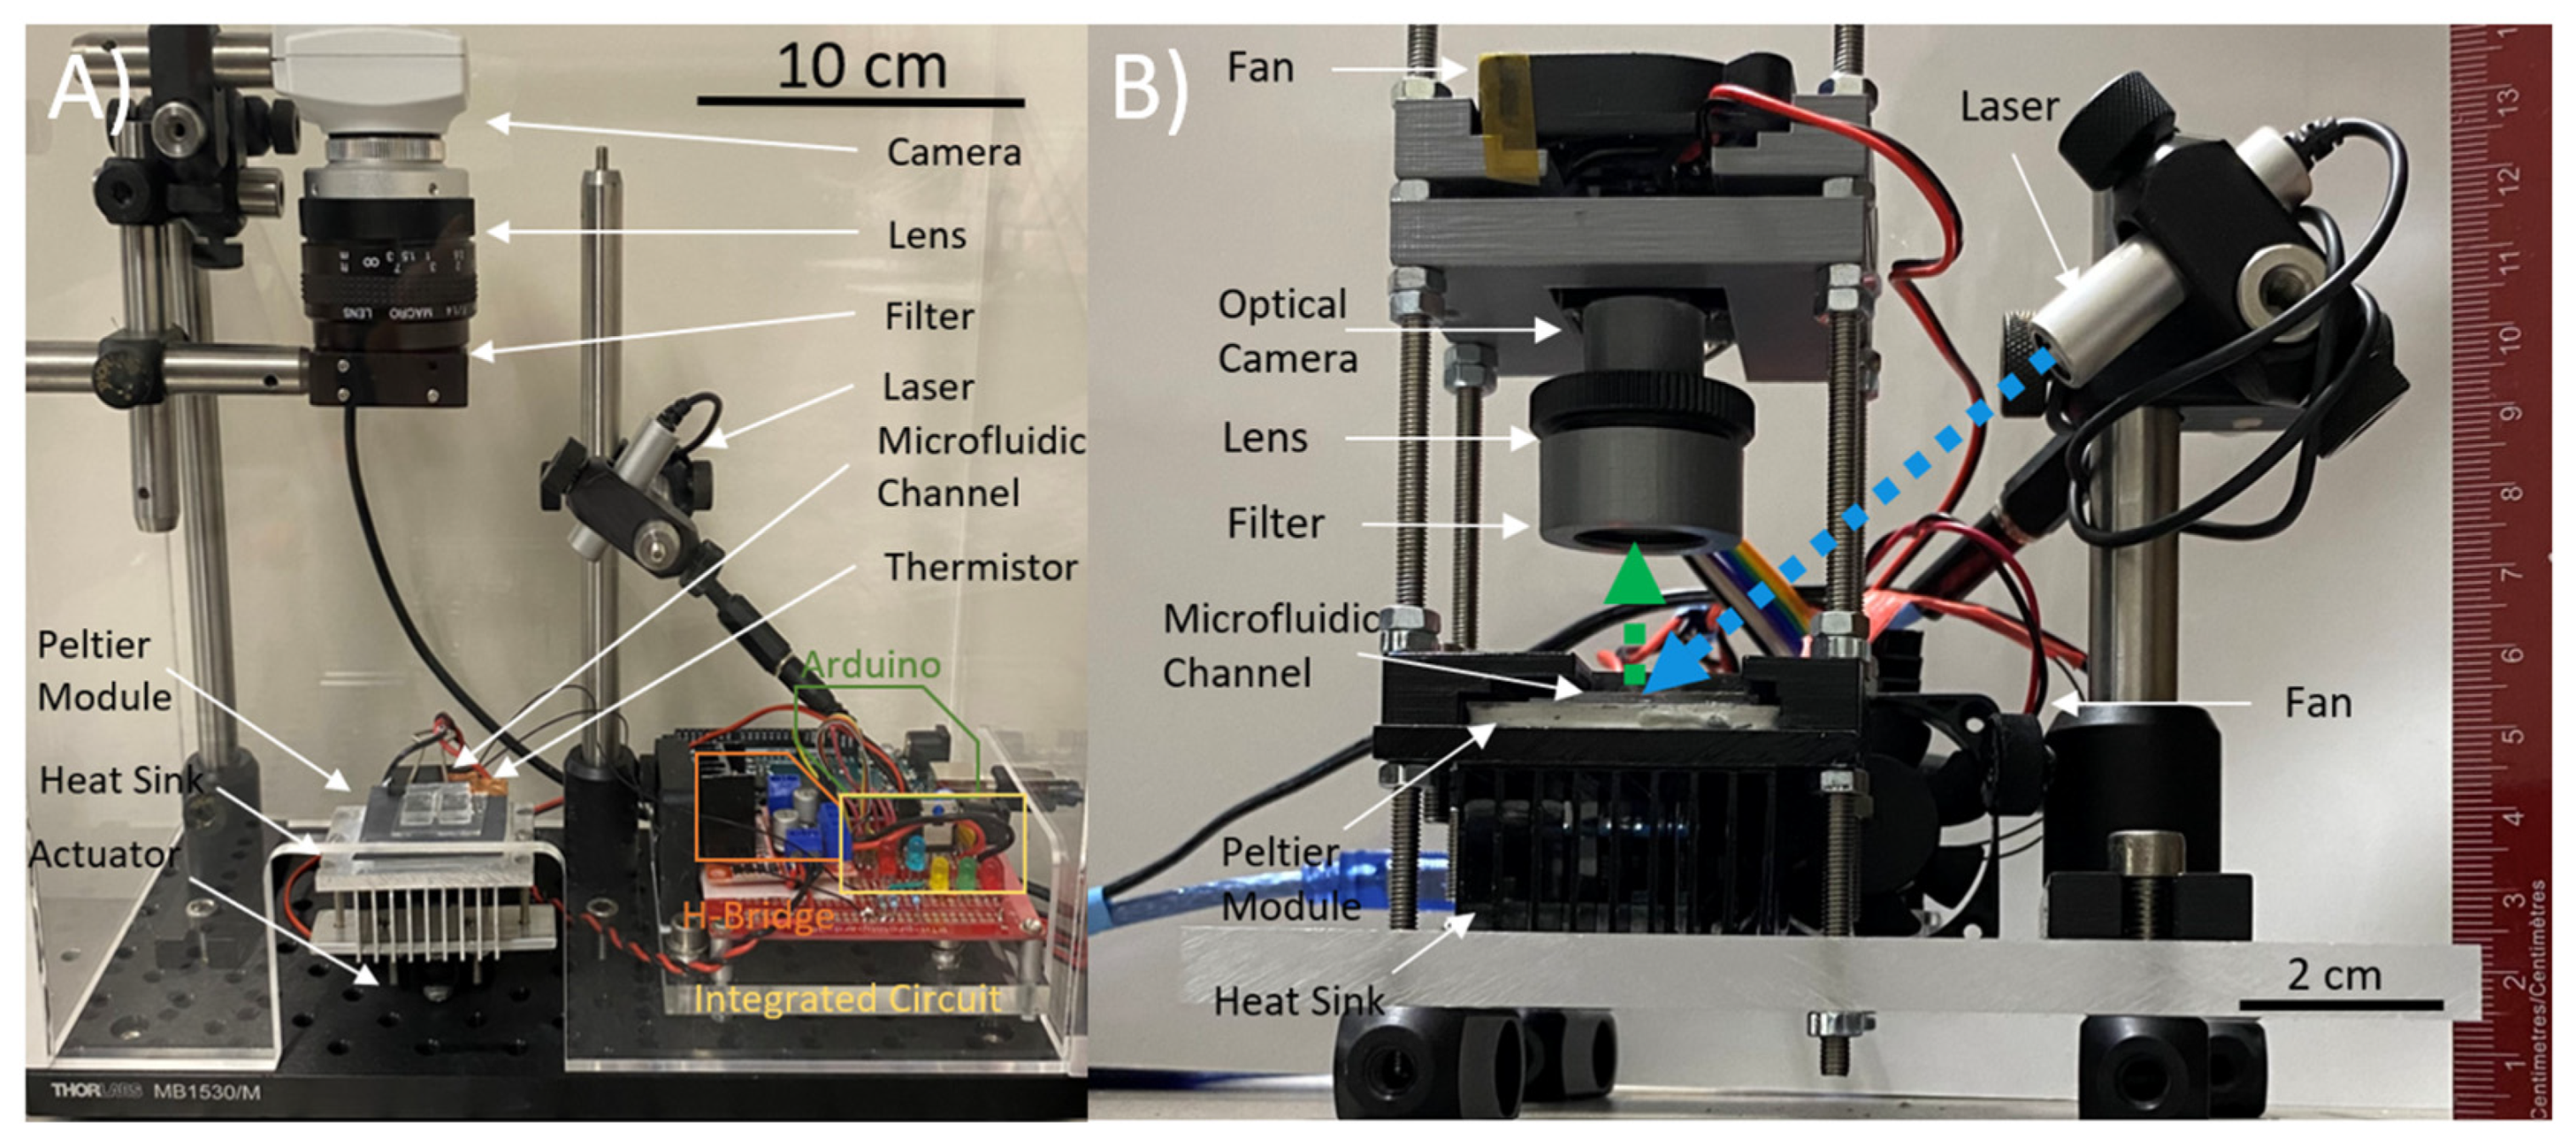
The temperature controller was designed using an ATmega-328p (Arduino) microcontroller board which regulated a Peltier module originally via an LN298N motor driver but was then augmented to modulation through an N-channel power MOSFET (
Figure 2 (a)) & b)). The temperature controller used thermistor feedback, and a modified PI controller to maintain a temperature of 67°C throughout the reaction. The system-on-board was integrated through USB with a graphics user interface (GUI) which allowed temperature setpoint control, laser control, and enabled camera capture. The camera button enabled a predefined time-lapse camera capture sequence, which while enabled, illuminated the 450 nm laser that excited a fluorescence from the droplet which was captured and stored by the OV5642 camera as digital photographs on an SD card. The capture sequence was automatically repeated every 1 minute until the end of the experiment when the contents of the SD card were then transferred for data analysis.
3. Methods
3.1. SARS-CoV-2 Clinical Samples: PCR & Whole Genome Sequencing
Patient diagnostic samples and data were collected from the Kingston Health Sciences Center clinical laboratory. Swabs, either nasopharyngeal, nasal and/or oral, were tested using a laboratory-developed dual-target [E-gene, 5’UTR] PCR assay that was clinically validated at KHSC (Corman et al. 2020).
Whole genome sequencing (WGS) was performed using the COVIDSeq Test library preparation kit 10 (Illumina) and ARTIC V4.1 primers. Libraries were loaded at 9pM for 2 x 150 bp sequencing on the MiSeq instrument (Illumina). Sequencing files were de-multiplexed using the native instrument software for downstream analytics. The analysis of the WGS data, including dehosting, generation of a consensus sequence, and variant calling with freebayes, were performed using a Nextflow pipeline for running the ARTIC field bioinformatics tools (
https://github.com/jts/ncov2019-artic-nf). Viral lineages were assigned using pangolin version 4.06, Scorpio version 0.3.17, and constellations version v0.1.9. Data was analyzed using PRISM 9.0 and R Studio.
3.2. Experimental Procedure
In addition to the clinical samples, six environmental RNA extract samples with mixed SARS-CoV-2 lineages were supplied by the COVID-19 in the Urban Built Environment (CUBE) team in Ottawa, Canada. These samples were collected by swabbing healthcare facilities across Ontario, Canada during 2021-22, both before and after the emergence of the BA.2 Omicron variant.
LAMP assay solutions were prepared by aliquoting WarmStart LAMP Master Mix (New England Biolabs, USA), novel LAMP primers and probes designed in-house by BioCoS, and nuclease free water. SARS-CoV-2 RNA from all clinical and environmental samples was added to the mix and aliquoted into the oil pre-filled microfluidic chip, and the assay droplet was positioned at the T-junction of the microfluidic chip.
3.3. LAMP Primer Design
The novel SARS-CoV-2 LAMP primers were designed by BioCoS P.C. (Chania 73134, Crete, Greece) using their innovative bioinformatics tool, the Biomarkers Computational System. The tool facilitates rapid and accurate identification of novel biomarkers (genomic loci) with high species-specificity, reducing de novo sequencing needs and bypassing whole genome alignments (Arhondakis and Dourou 2020). The biomarker, upon which LAMP primers were designed, selectively detect SARS CoV-2 RNA regardless of lineage specificity. The aim was to support development of molecular solutions to accurately detect the virus and enhance its monitoring. The LAMP primers were designed using the processes described by Notomi et al. 2015. This included ensuring stability at the end of primers, attaining a GC nucleotide content between 50% and 60%, and limiting complementarity at the 3' end (Notomi et al. 2015). The herein LAMP primers were designed upon the novel biomarker (length 245 bases, at the ORF1ab gene) which was identified in late 2020 on the SARS-CoV-2 isolate Wuhan-Hu-1 (NC_045512.2) before the emergence of new strains, by processing a dataset of 10011 non-SARS-CoV-2 viral genomes.
3.4. Real-Time Detection & Image Analysis
In the preliminary experiments, images were captured using a packaged CCD camera (see
Figure 2a), with maximum pixel intensities recorded and plotted to detect the exponential increase in photocurrent. In the miniaturized automated setup, an automated sequence of images is taken using the Arducam 5MP Plus OV5642 Mini Module SPI Camera at an interval following the initial amplification period (
Figure 3). These images were imported to MATLAB for automated analysis and curve generation of the maximum pixel cluster. The MATLAB algorithm used a morphological grayscale opening of the green components of the RGB image with a structuring element of radius 4 pixels. A grayscale opening preforms an erosion then dilation of the image to find the maximum of the minimum value within the neighborhood defined by the structuring element, effectively smoothening the pixel intensities at the boundary of the fluorescing droplet. The Otsu thresholding technique is then used to identify the florescent droplet against the background. A grayscale opening was again used to smoothen the pixels of the thresholded droplet. The maximum pixel intensity of the droplet, and the total fluorescence emitted by the droplet is calculated and recorded for each captured image in the time-lapse sequence and a plot of these two values was generated as the images were processed.
4. Results & Discussion
4.1. Real-Time Detection of Clinical & Environmental Samples
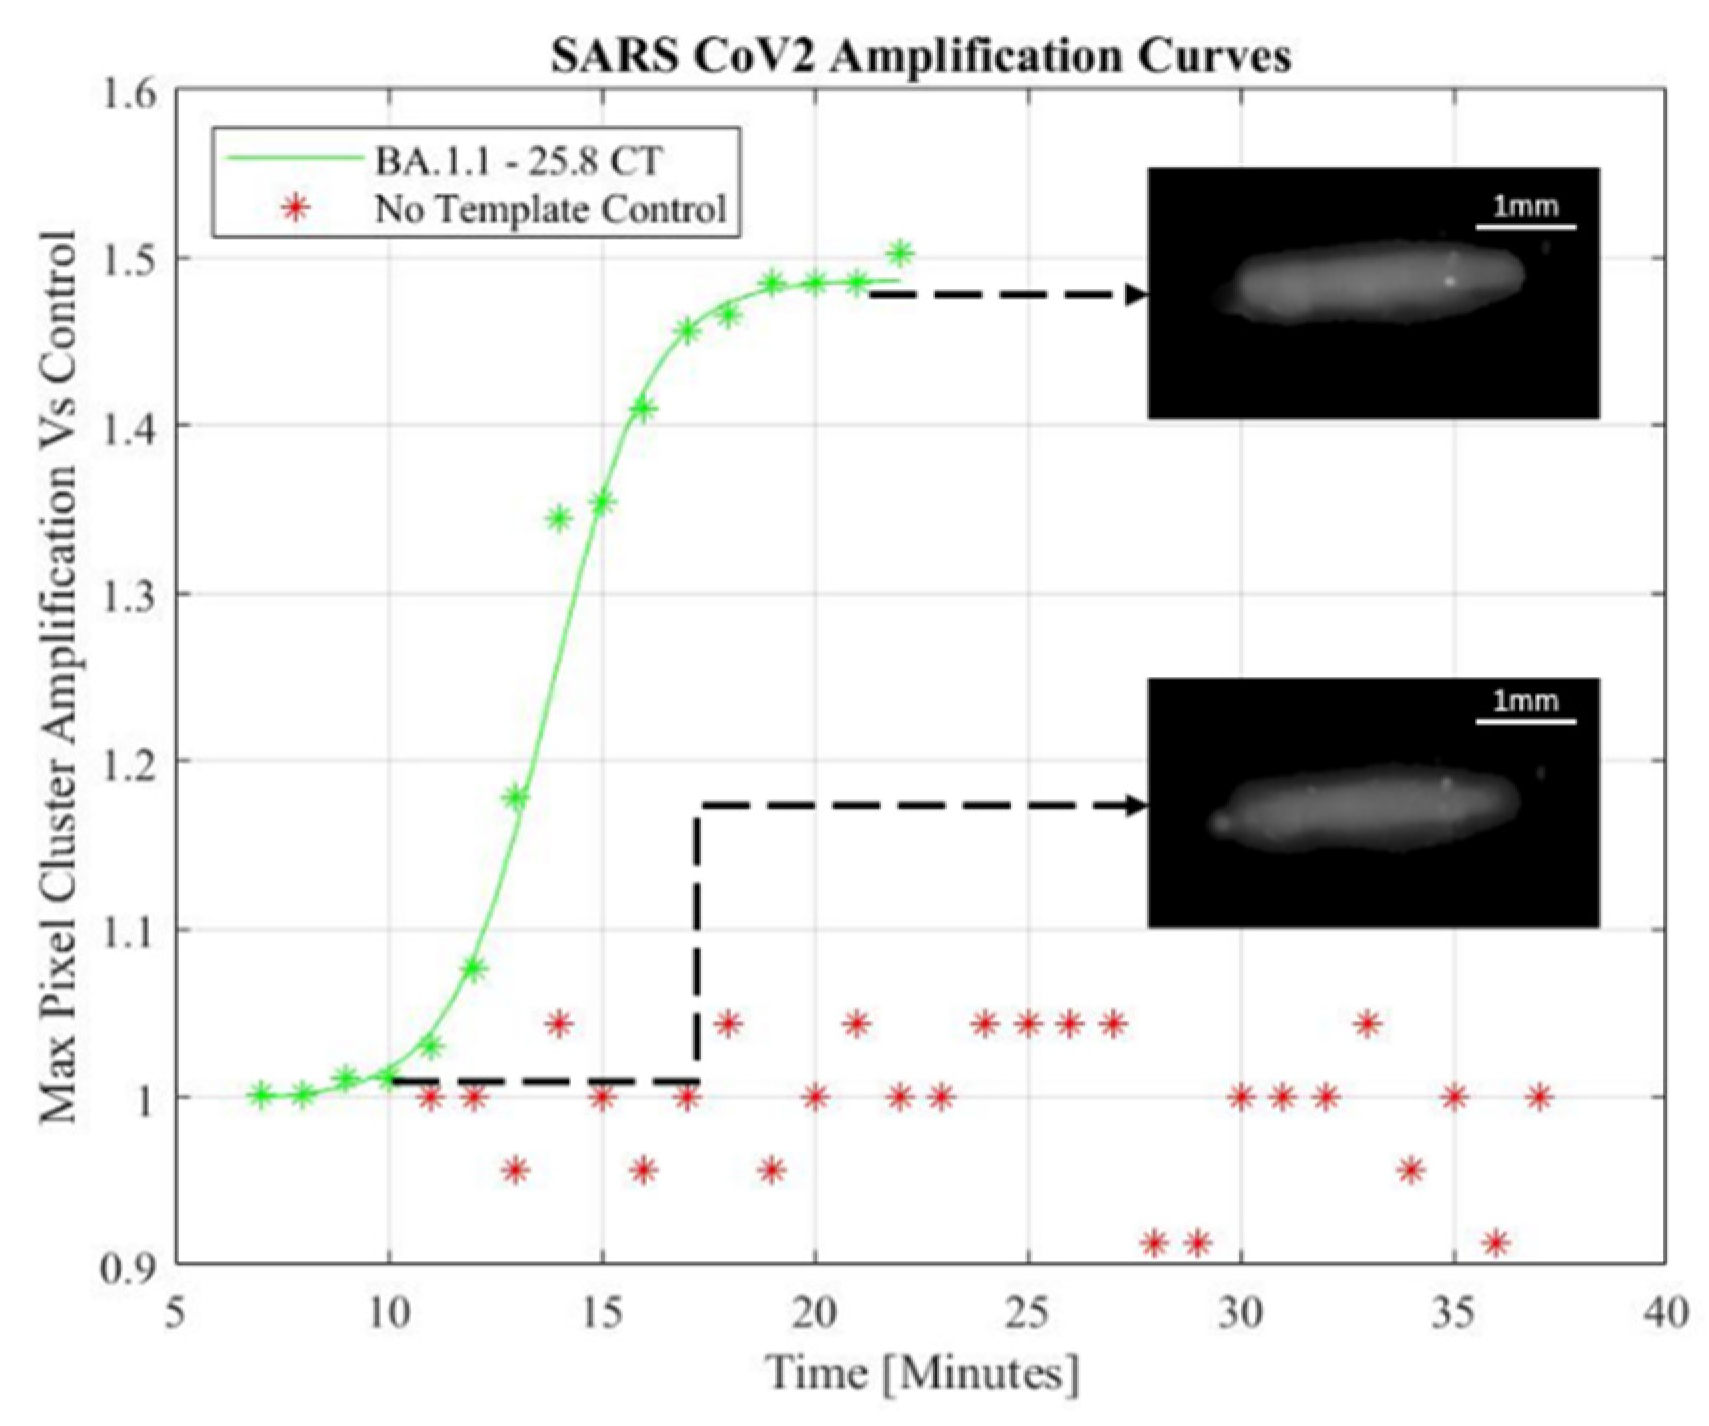
A miniaturized microfluidic biosensor using LAMP is demonstrated as a small footprint rapid molecular test system. An exponential increase photocurrent indicated detection of SARS-CoV-2. The addition of image processing to the automated setup allowed for the mitigation of noisy pixels. Sigmoidal functions were used to model the maximum pixel intensity amplification of the processed images captured in one-minute intervals following an initial annealing period. The pixel intensities were normalized to the fluorescence baseline established by the first image captured. Despite the low-cost camera, a 4X smaller footprint than the previous design, and a lowering of the droplet’s fluorescence intensities due to the grayscale opening operation, the augmented system’s microfluidic droplet alignment and image analysis was able to generate qualitative amplification curves indicative of positive SARS-CoV-2 assays.
Figure 3 shows the sigmoidal model through the data of a positive LAMP sample while a negative template control sample (NTC) experiences no detectable signal amplification.
Figure 3.
SARS-Cov-2 fitted amplification curve and data with NTC data processed from low-cost setup.
Figure 3.
SARS-Cov-2 fitted amplification curve and data with NTC data processed from low-cost setup.
4.2. Overall Performance of LAMP based Miniaturized Platform
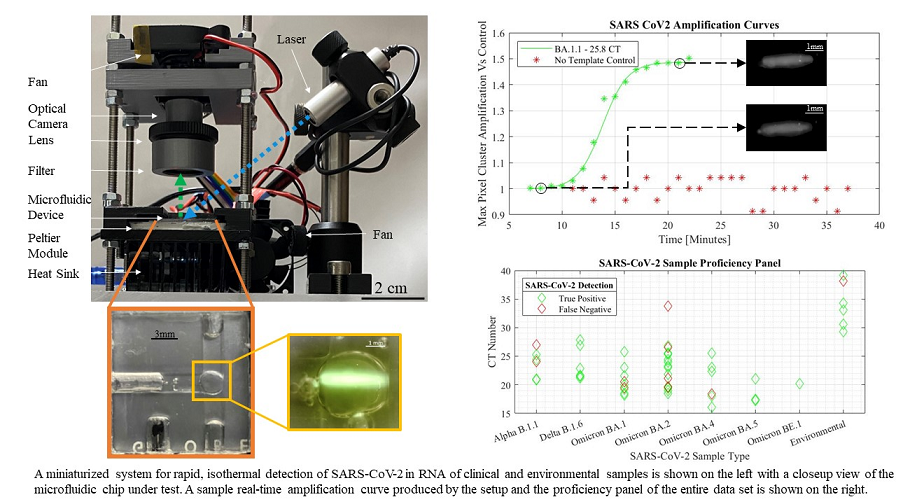
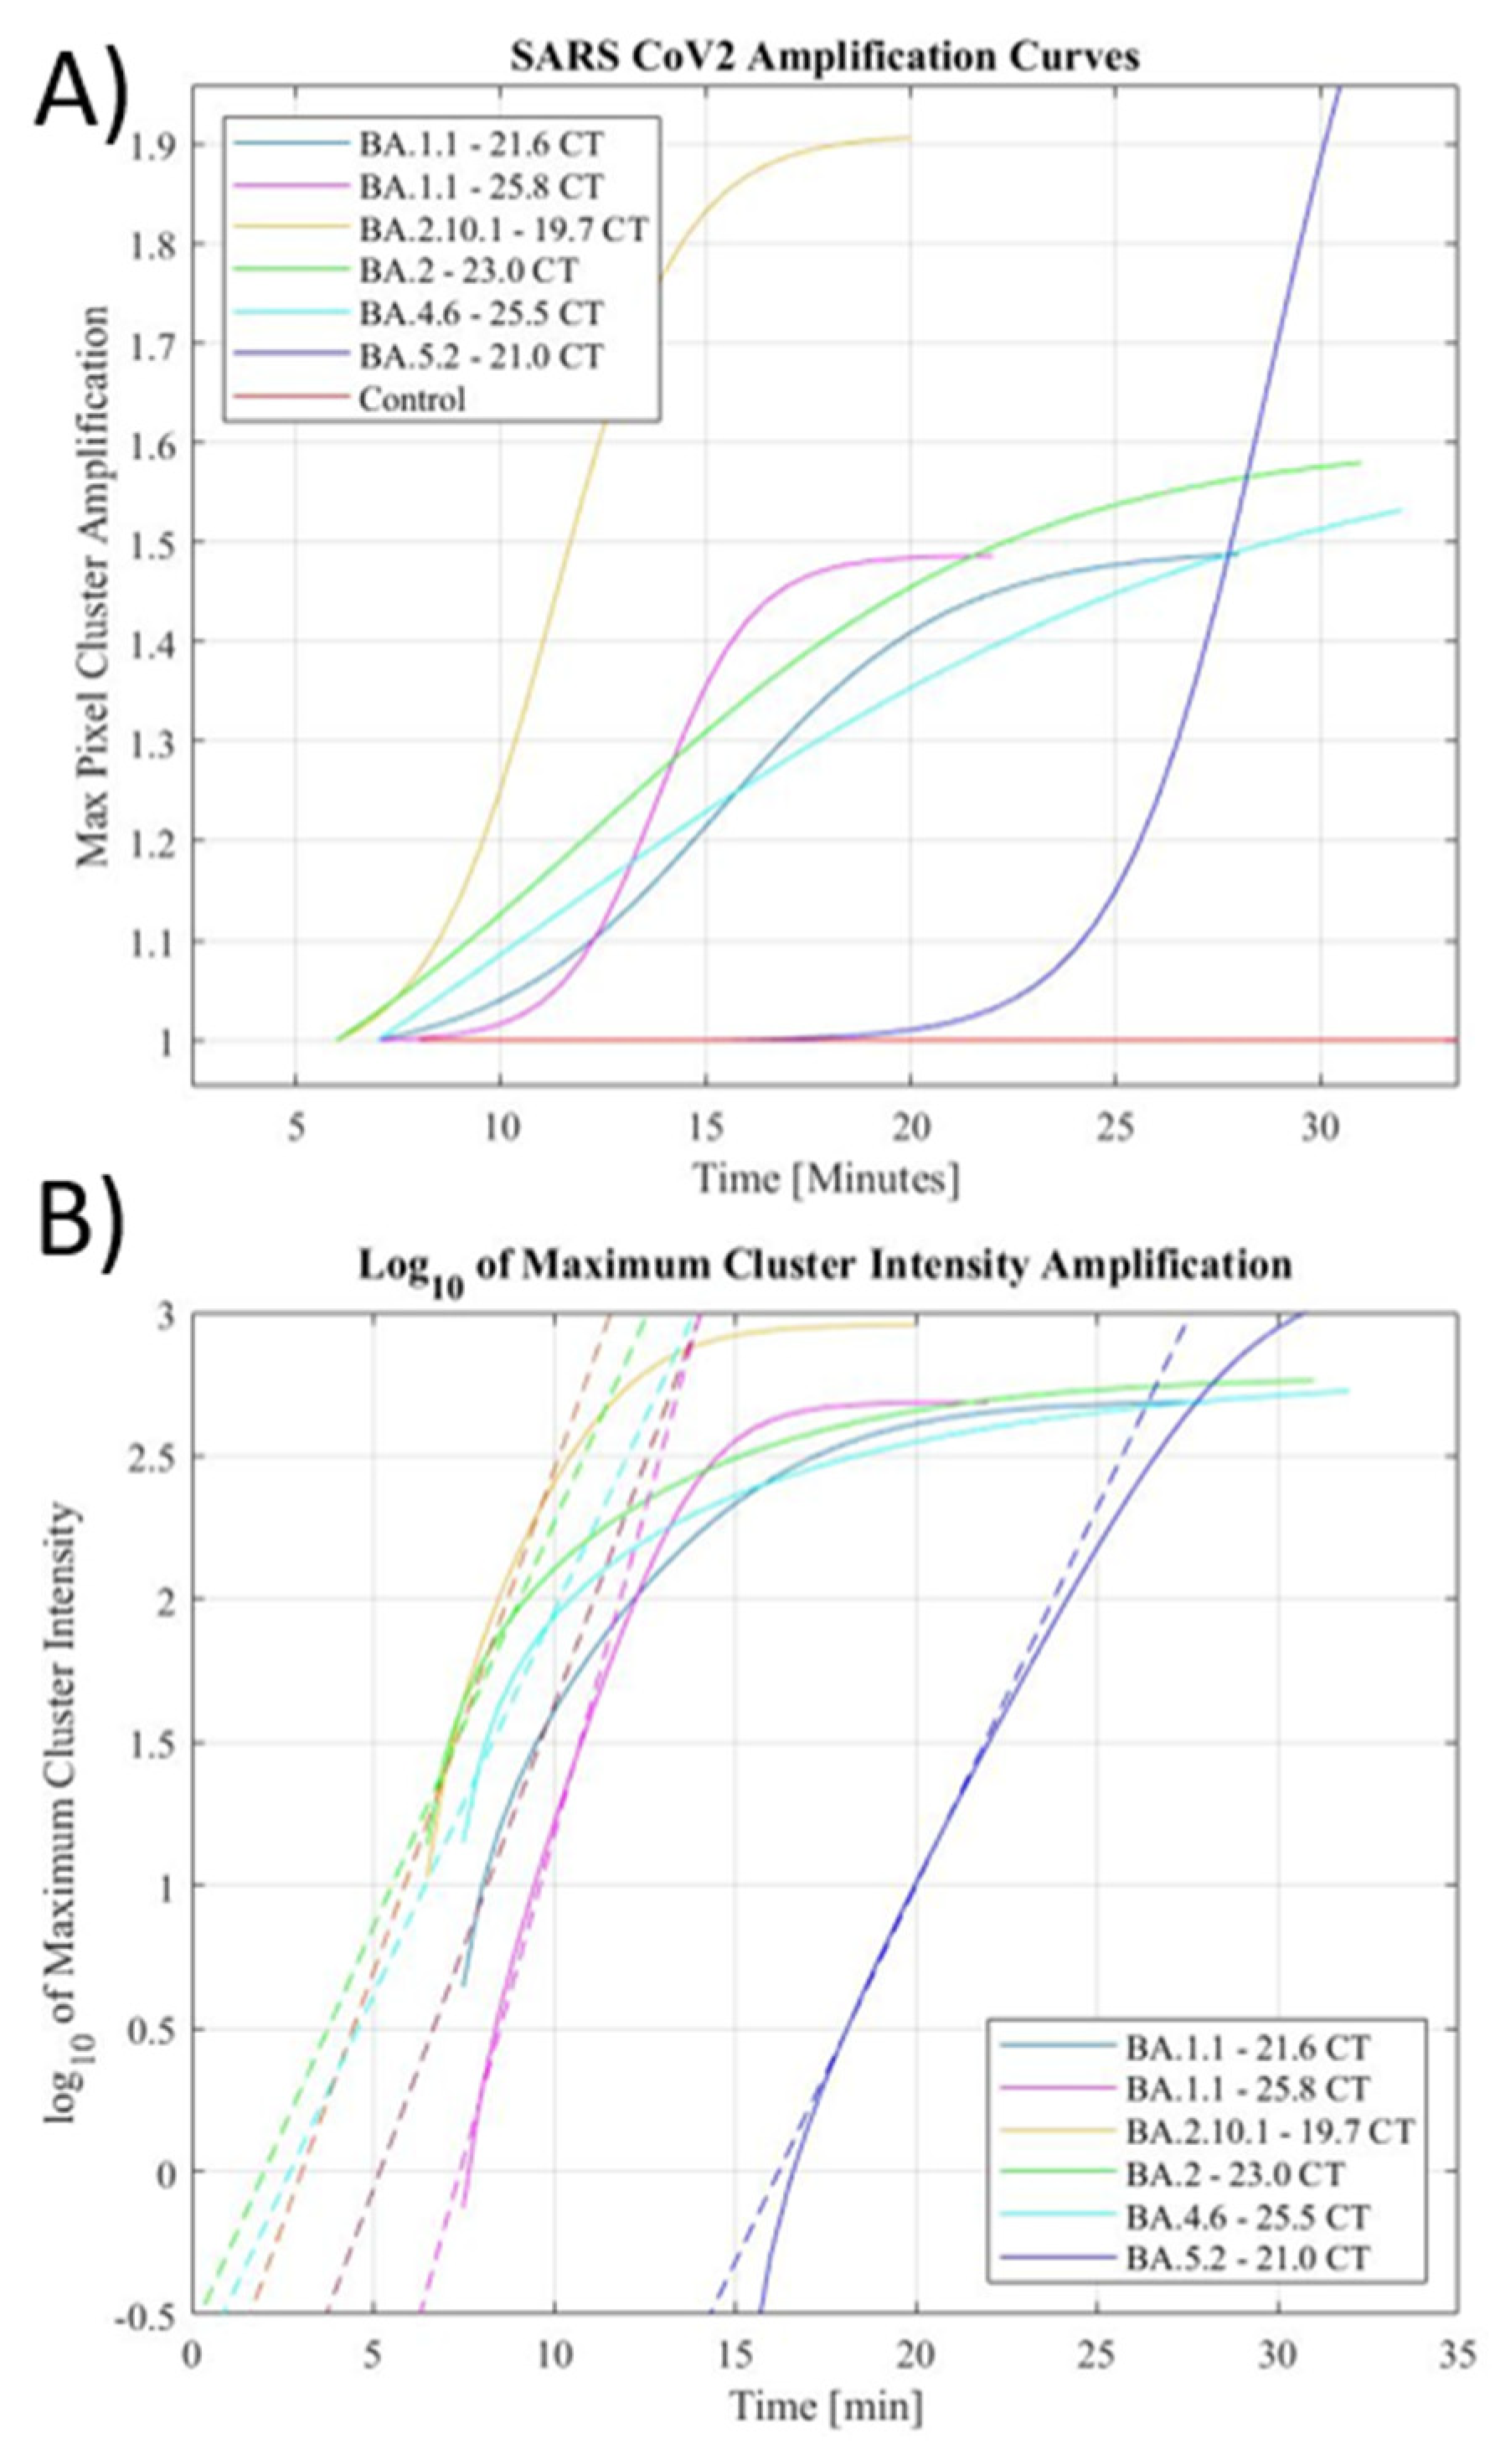
Our novel LAMP primers successfully detected several emerging SARS-CoV-2 strains in both clinical and environmental extracted RNA samples. Both the preliminary and augmented automated setup were effective in the detection of SARS-CoV-2 extracted RNA. These curves were extracted from the data of many samples (figure 4 (a)). Furthermore, to determine the release of fluorescent dye by a positive reaction, the summation of foreground pixel intensities was also performed to evaluate the increase in fluorescence throughout the droplet. The summation of fluorescence of the droplet followed similar trends to the maximum intensity tracking without the limitations set by the grayscale opening operation. Sigmoidal curves were also able to model the summed fluorescence reliably, while the no-template control sample showed negligible increase in total fluorescence from its initial annealing through the entire amplification period.
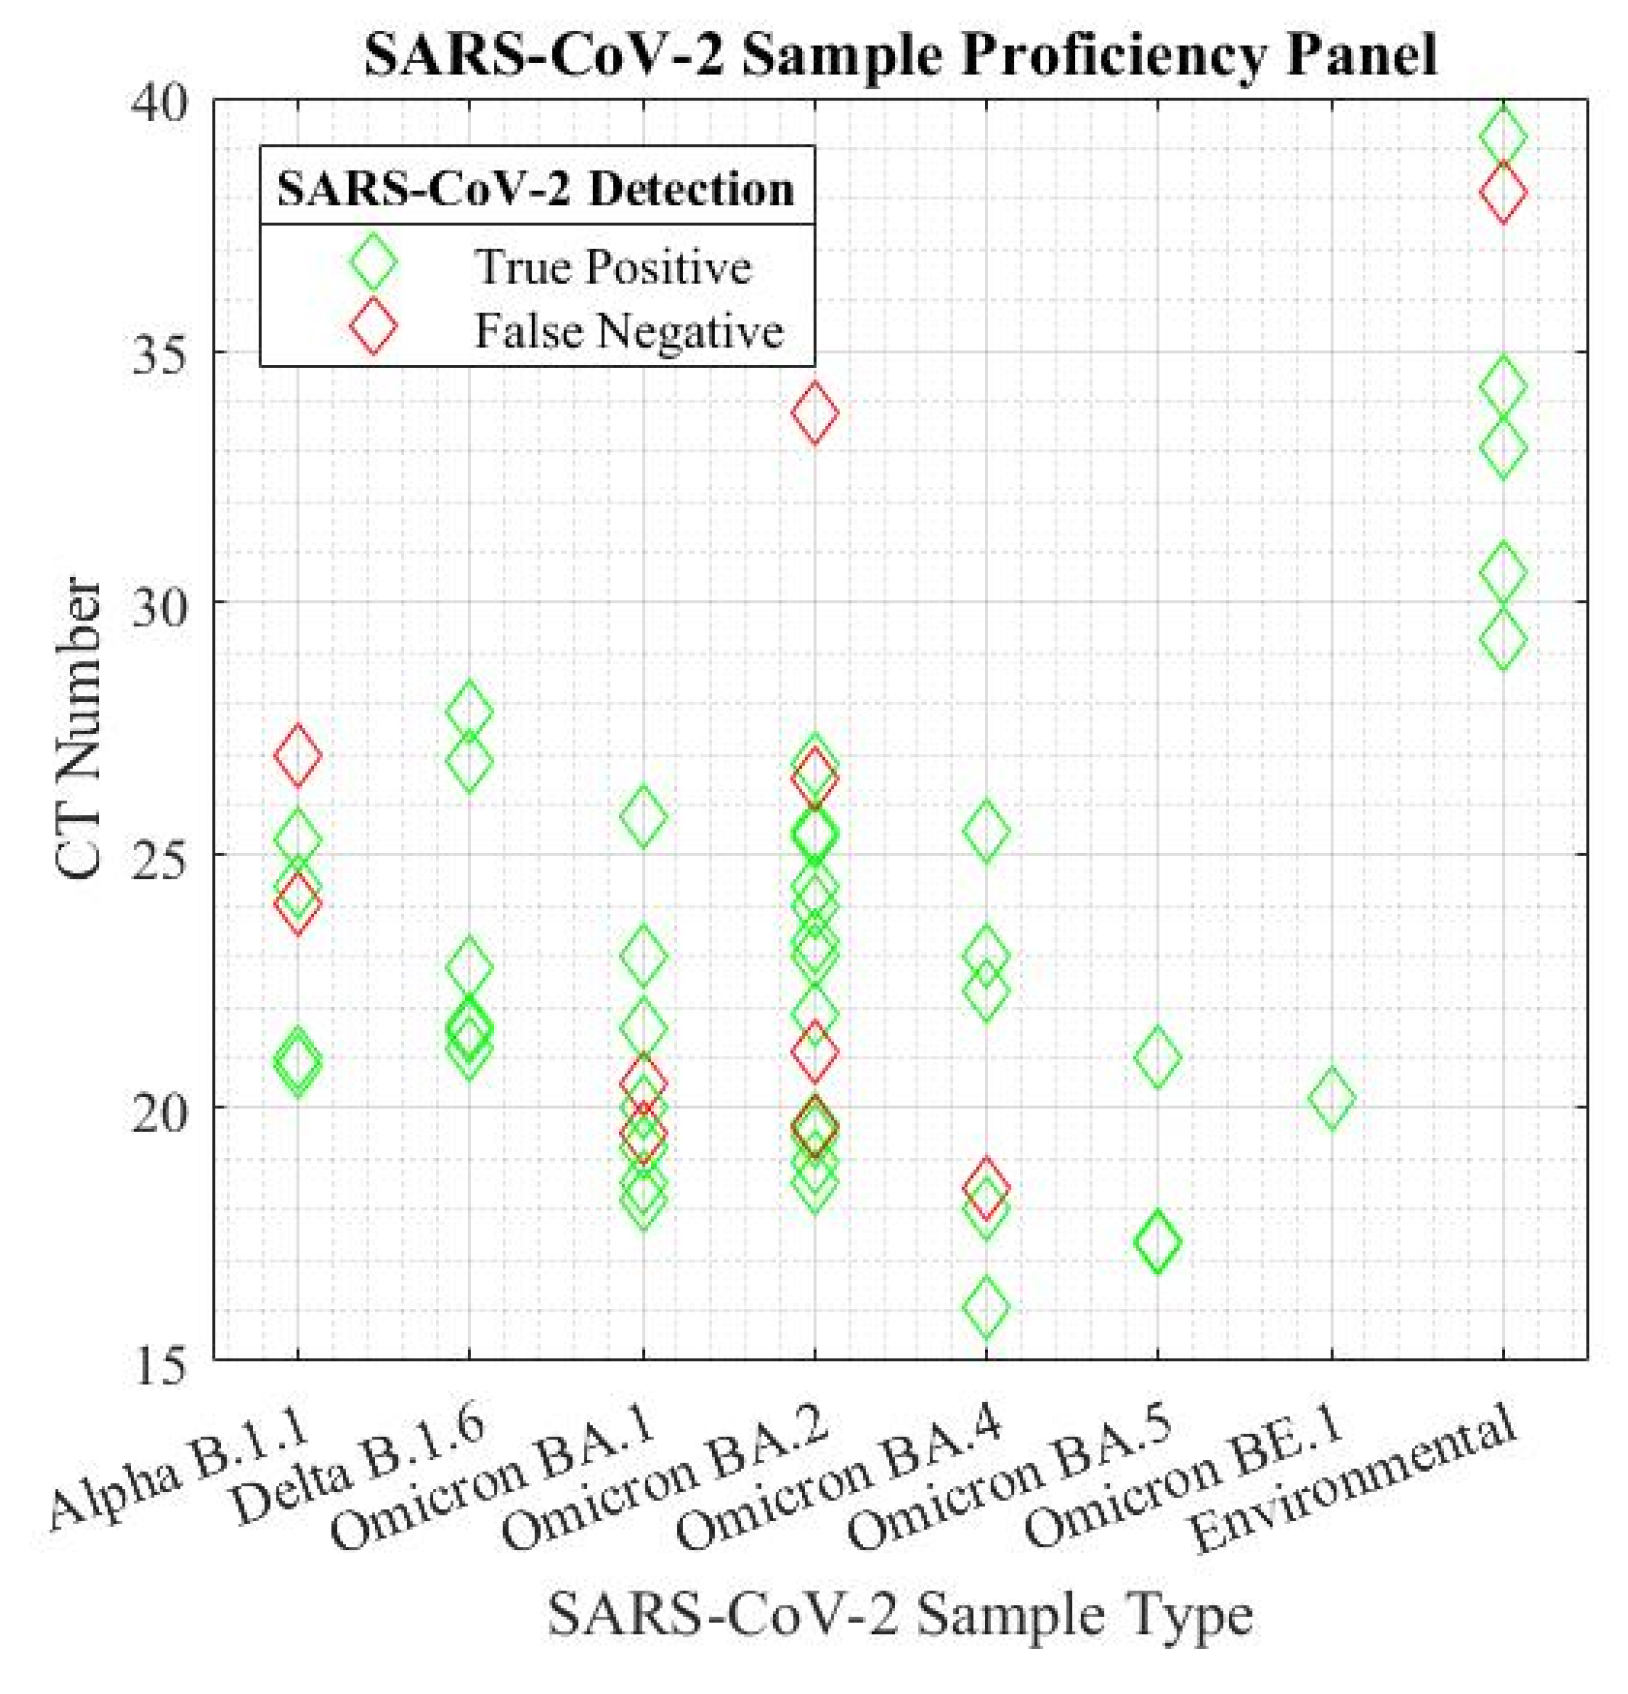
The sensitivity of the system was verified by strain and viral load. The sensor produced an overall sensitivity of 81.48% across the 54 tested samples and the sensitivity of the biosensor was not affected by new strains of SARS-CoV-2. Cyclic threshold (CT) values were verified using a benchtop RT-PCR system, and the sensitivity was determined in a proficiency panel across all strains of SARS-CoV-2 (figure 5). The shorthand notation for human collected viral lineage samples represent a multitude of SARS-CoV-2 strains in both human and environmental samples. The full viral lineages are detailed in appendix A (Supplementary file). The environmental data represents a combination of lineages collected in healthcare facilities across Ontario, Canada before and after the emergence of the BA.2 omicron variant.
Reliable detection was established using both the maximum pixel cluster intensity amplification and the summation amplification of the total fluorescence. The sigmoidal fits of these amplification curves were also considered when determining the outcomes of the reactions. The logarithmic plot of the maximum pixel cluster (
Figure 4. (b)) displays a linear fit to the positive exponential portion of the sigmoidal which appears as a linear slope in the logarithmic curve. Extraction of the x-intercept of the logarithmically transformed plots corresponds to the time to amplification, like cycle number in an RT-PCR system. The anticipated time of amplification was expected to mirror the CT values of the samples, however, due to the low-cost nature of the setup, perfect RT-PCR curves were not achieved in all circumstances. Thus, the extracted shape of the curve is used as supporting evidence along with maximum pixel amplification and summed fluorescence amplification to evaluate the detection of SARS-CoV-2 in the performed assays.
4.3. Current capabilities and limitations
The low-cost integrated setup offers many benefits towards making the biosensor portable, compact, and accessible. However, the low-cost components contribute to lower quality signal capture and low signal-to-background ratio. The low-cost camera assigns a broad spectrum of wavelengths contributing to red, green, and blue signal components despite physical filtration with an optical bandpass filter. The camera contained embedded automatic gain and white balance requiring significant optimization to obtain high-fidelity image sequences. Further limitations included the automated setup which sampled part of the droplet by only illuminating a portion of the droplet with the laser upon image capture by the camera. Unlike during manual capture, the image capture and analysis relied on the LAMP assay droplet fluorescing homogenously. These qualities are limitations to a quantitative LAMP bioassay system. However, in the qualitative system demonstrated, these limitations can be mitigated, and high sensitivity of detection can be maintained.
5. Conclusion
A portable miniaturized LAMP biosensor system, suitable to be developed into a POC system, is presented for the detection of SARS-CoV-2 viral RNA in clinical and environmental extract samples on a thermally stable soft microfluidic chip. The LAMP assay utilized novel primers designed to detect a broad range of SARS-CoV-2 viral lineages. The system was able to detect low-level fluorescence signal from the isothermal amplification reaction of SARS-CoV-2 viral RNA using a low-cost board integrable camera, modified commercial lens, and wavelength specific bandpass filter. The system captured time-lapsed images of the thermally stable droplet and processed the images upon completion of the amplification for the end point detection of the virus. Further augmentations to the system remain to be carried out for improved sensitivity and POC applicability. These augmentations include the addition of on-board computational power that allows for real-time processing of the LAMP biosensor that can be coupled with AI assisted detection to improve sensitivity and specificity of the device. Furthermore, addition of a magnetic bead based soft-microfluidic system for total nucleic extraction and sample purification is envisioned as the next step to realize a POC-ready SARS-CoV-2 biosensor.
Author Contributions
J.S., R.P., S.A., A-M.D., and P.S. wrote the main manuscript text; J.S. designed the setup and microfluidic chip; J.S. prepared all manuscript figures and tables; S.A., A-M.D., I.L. designed and synthesized the LAMP primers; P.S., H.W., E.M., and C.S., created anonymized clinical RNA extract samples, conducted sequencing for lineage identification and RT-PCR validation of sample CT values.
Funding
This work was funded by the Natural Science and Engineering Council of Canada Discovery Grant.
Acknowledgments
The authors acknowledge the financial support from the Natural Science and Engineering Council of Canada (NSERC). The authors are thankful to COVID-19 in the Urban Built Environment (CUBE) study team in Ottawa, Mr. Aaron Hinz (Carleton University) and Dr. Alex Wong (Texas A&M) for assistance with extracted SARS-CoV-2 RNA samples from environmental specimens.
Competing interests
This declaration is not applicable.
Ethical Approval
This declaration is not applicable.
Availability of data and materials
This declaration is not applicable.
References
- Arhondakis, Stilianos, and Athanasia-Maria Dourou. (2020). [CrossRef]
- Corman, Victor M. et al. Euro Surveil. (2020). [CrossRef]
- Deng, Hao et al. Sci. Rep. (2021). [CrossRef]
- Hayasaka, Daisuke et al. Virol J. (2013). [CrossRef]
- Hu, Siyi et al. Biosens (2022). [CrossRef]
- Jiao, Zhenjun et al. J Micromech Microeng (2007). [CrossRef]
- Karbalaei, Alireza et al. Micromachines (2016). [CrossRef]
- Li, Qiong et al. J Virol Methods (2010). [CrossRef]
- Malic, Lidija et al. Lab Chip (2022). [CrossRef]
- Mannier, Cassidy, and Jeong-Yeol Yoon. Biosens 12, 7 (2022).
- Notomi, Tsugunori et al. J Microbiol (2015). [CrossRef]
- Notomi, Tsugunori et al. Nucleic Acids Res 28, 12 (2000). [CrossRef]
- Prakash, Ravi et al. Biomedical Microdevices (2016). [CrossRef]
- Sreejith, Kamalalayam Rajan et al. Micromachines (2021). [CrossRef]
- Staples, Jake et al. (2022) In Proc. of the IEEE Engineering in Medicine and Biology Society Micro and Nanotechnology in Medicine Conference (MNM 2022), Hawaii, December 2022.
- Tharmakulasingam, Mukunthan et al. Electronics (Switzerland) (2021). [CrossRef]
- Vural Kaymaz et al. Biotechnol Bioeng (2021). [CrossRef]
- Yang, Jianing et al. Infect Dis Rep. (2021). [CrossRef]
- Zhao, Victoria Xin Ting et al. Materials Science for Energy Technologies (2020). [CrossRef]
|
Disclaimer/Publisher’s Note: The statements, opinions and data contained in all publications are solely those of the individual author(s) and contributor(s) and not of MDPI and/or the editor(s). MDPI and/or the editor(s) disclaim responsibility for any injury to people or property resulting from any ideas, methods, instructions or products referred to in the content. |
© 2023 by the authors. Licensee MDPI, Basel, Switzerland. This article is an open access article distributed under the terms and conditions of the Creative Commons Attribution (CC BY) license (http://creativecommons.org/licenses/by/4.0/).
