Preprint
Article

Mechanism of Low Frequency Oscillation When EMUs Passing Neutral Zone and Suppression Method

Altmetrics

Downloads

109

Views

25

Comments

0

A peer-reviewed article of this preprint also exists.

Submitted:

13 June 2023

Posted:

19 June 2023

You are already at the latest version

Alerts
Abstract
This article addresses the problem of contact voltage increase caused by the low frequency oscillation of the train-grid system in the phase-separation process of the EMU. The article establishes the EMU-contact line-traction substation model, reveals the mechanism of low-frequency oscillation, and obtains the relationship between the separation phase angle of the pantograph with line and low-frequency oscillations. Methods to suppress the over-voltage during the low-frequency oscillation are proposed. The study shows that when the power phase angle of the pantograph-line separation is within the range of 60°~90° and 240°~270°, the voltage amplitude in the neutral zone is larger, the maximum amplitude can reach 52.2kV, and low-frequency oscillation will occur in the neutral zone. When low frequency oscillation occurs, the contact line voltage in the neutral zone is mainly 1/3 power frequency (16.7Hz). After installing an RC suppression device in the neutral zone, when the EMU enters the neutral zone, the absolute value of the voltage peak drops to below 20 kV. Compared with the situation where the suppression device is not connected, the absolute value of the voltage peak is reduced by nearly 60%. The study provides a basis for the design of the neutral zone of the contact line and the selection of the high-voltage equipment of the EMU.
Keywords: 
Subject: Engineering  -   Electrical and Electronic Engineering

1. Introduction

When the EMU is in the neutral zone, during the switching process of the electric circuit, there is electromagnetic energy in the equipment such as voltage transformer inductance and the ground capacitance of the vehicle line. This energy is converted between the inductance element and the equivalent capacitance to form the low frequency oscillation. The oversaturation of ferromagnetism components, the increase of terminal voltage and the abnormal increase of the line voltage in the neutral zone pose a serious threat to the safety of EMUs and contact line electrical neutral zone equipment.
To solve the problem of low–frequency oscillation and overvoltage suppression in the power supply system, industry experts and scholars have carried out extensive and in–depth modeling study and characteristic analysis, and proposed methods for low–frequency oscillation suppression. As for the mechanism of low–frequency oscillation, Ruifeng Zhang and others have studied the power–side oscillation combined with the system impedance characteristics [26,27,28,29,30]. They proposed a method to adjust the power supply control strategy to reduce the low–frequency oscillation amplitude and oscillation time. For the problem of low–frequency oscillation caused by line–side faults, Lingling Fan et al. obtained the influence of line capacitance parameters on the ferromagnetic resonance in the system, and calculated the transient process. The influence of the selection of inductance, capacitance and resistance parameters on the ferromagnetic resonance phenomenon is analyzed [31,32,33,34,35]. For the problem of low–frequency oscillation suppression, Haitao Hu and others combined the matching relationship between the impedance of the power supply line of the traction power supply system and the impedance of the locomotive, and proposed a strategy to reduce the oscillation by adding active filtering on the power control side. The method focused on the analysis of the input impedance characteristics of electric locomotives. The stability direction of the system is determined according to the coupling relationship between the input impedance and the impedance of the power supply line [36,37,38,39,40]. For the operating system, combining the characteristics of system impedance and low – frequency oscillation characteristics, a parallel RC device is proposed to reduce the oscillation process [41,42,43,44,45]. The above research provides a reference for the analysis of the low–frequency oscillation process of the EMU passing through the neutral zone and the formulation of suppression strategies in the traction power supply system.
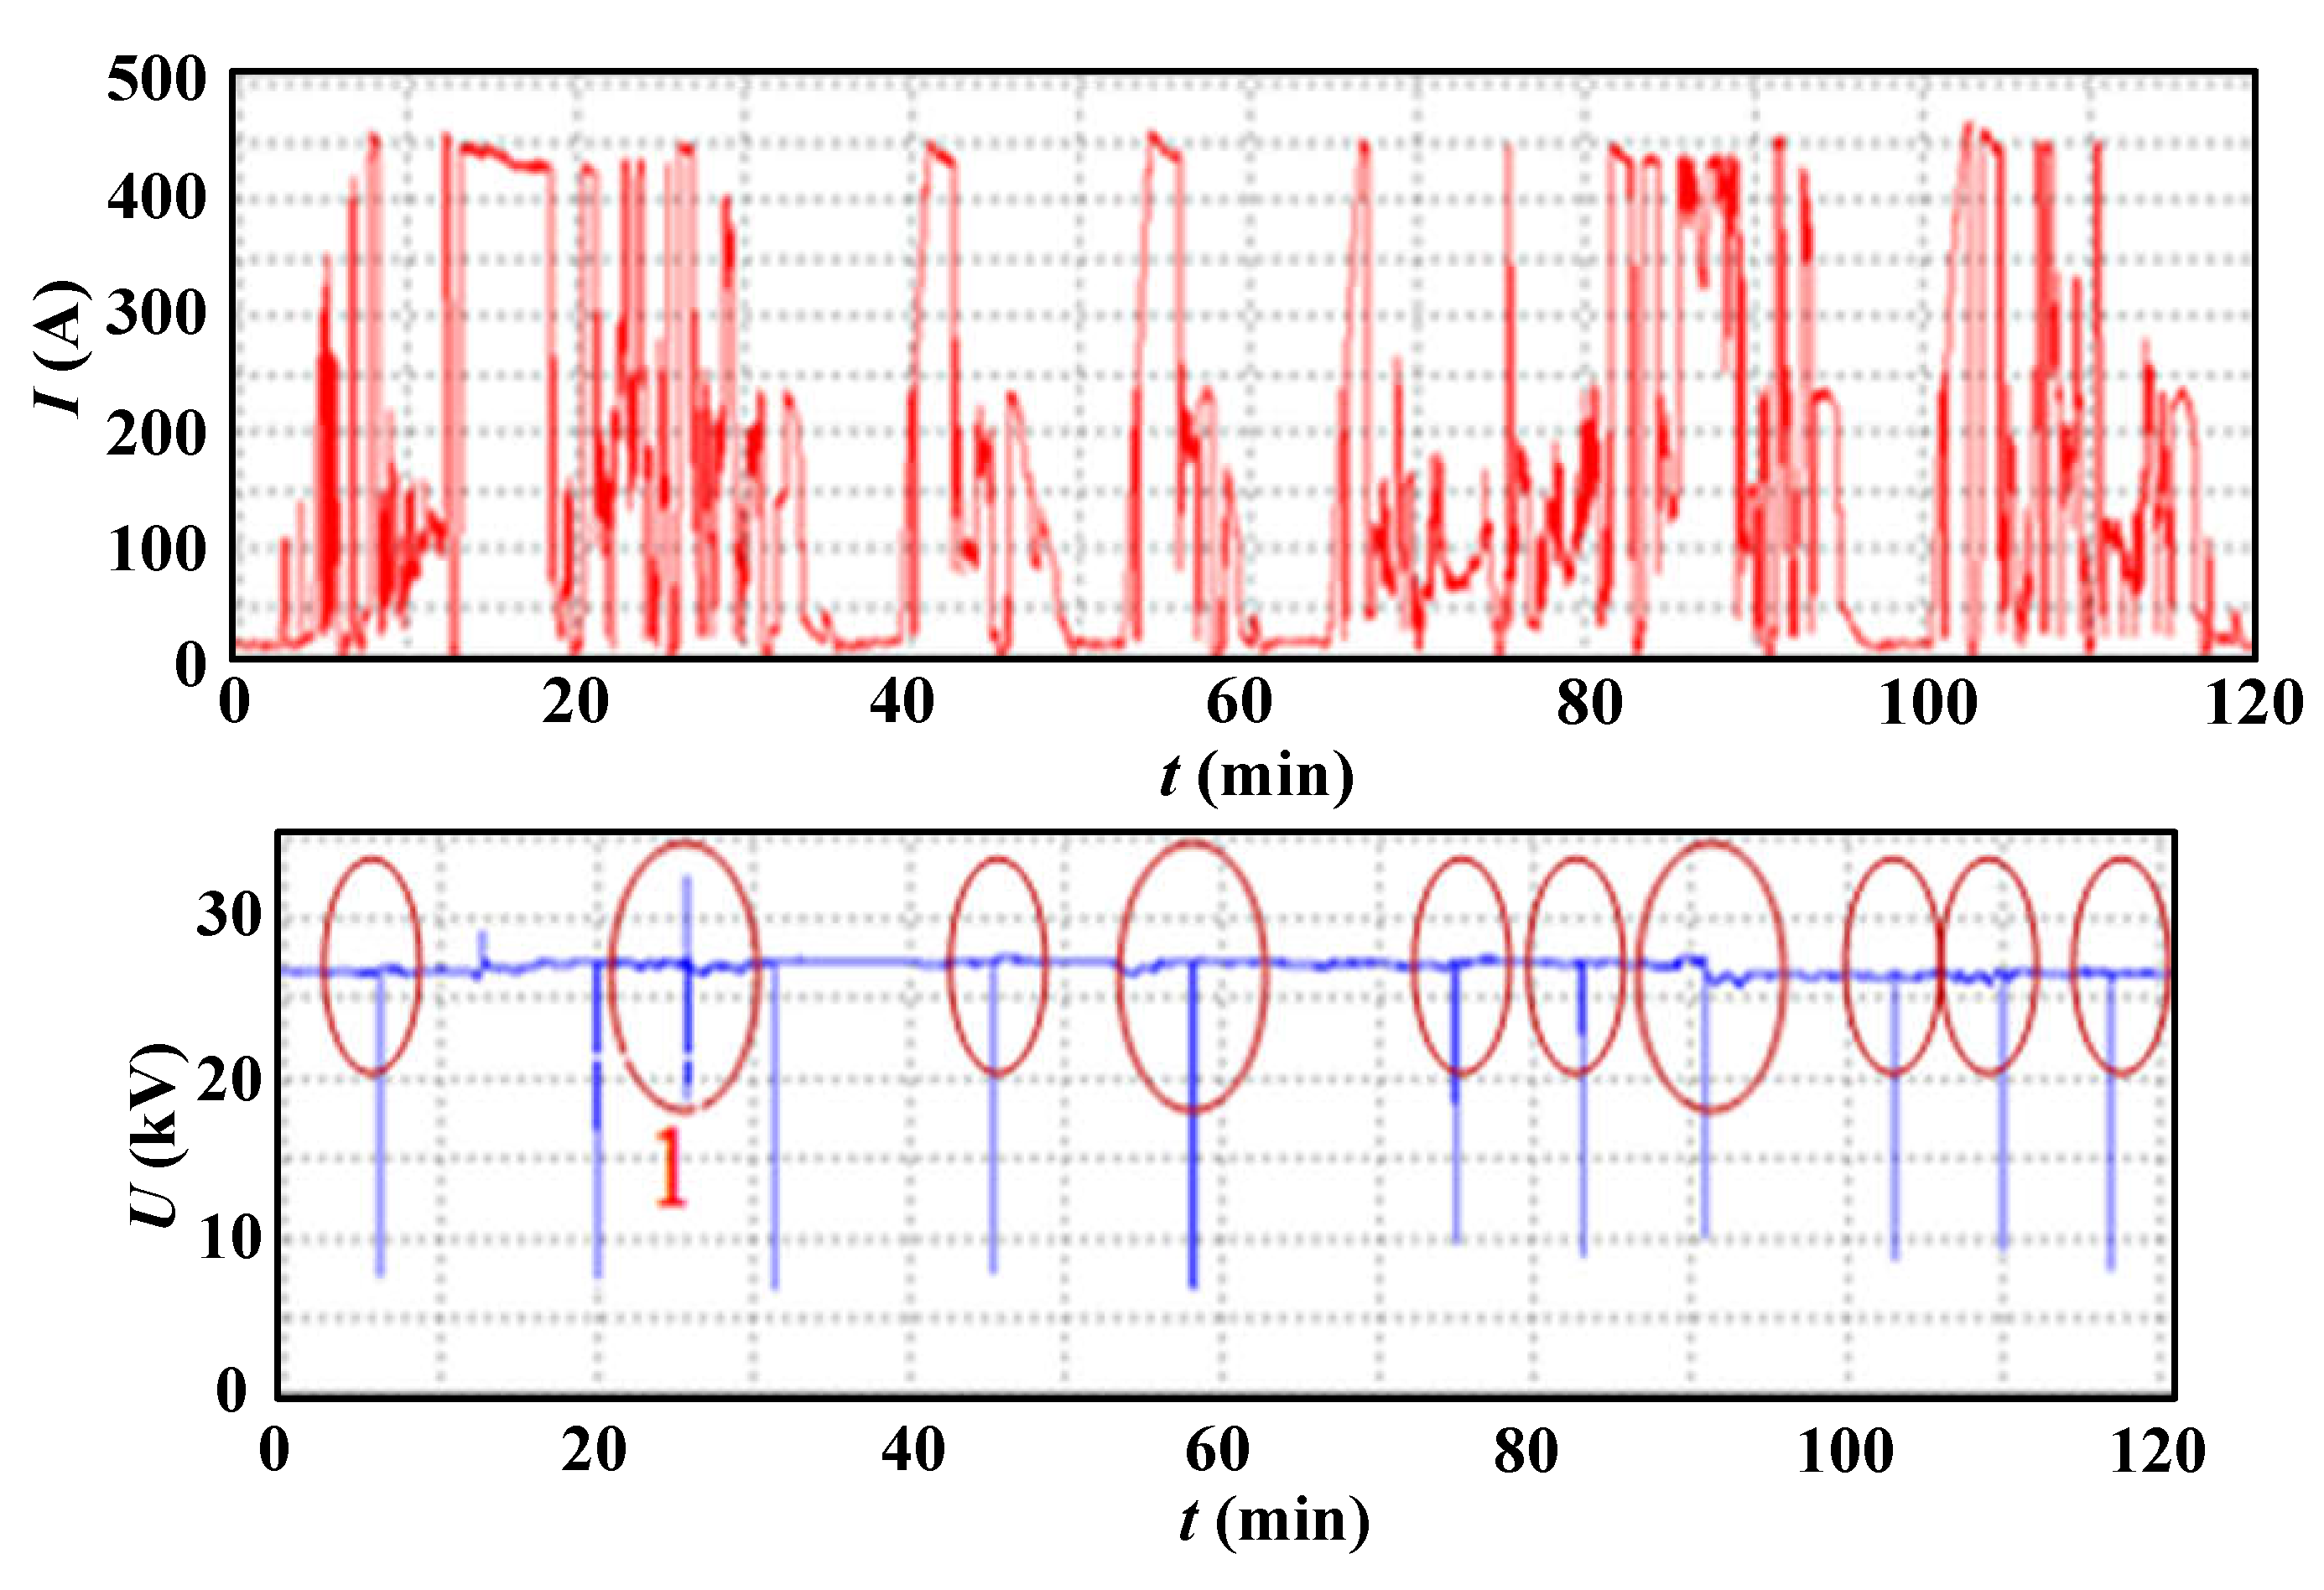
However, the distance of the neutral zone in the contact line is short (200m), the EMU will experience disconnecting the traction motor load, entering the neutral zone and the intersection of the feeding section, and separating the pantograph from the line. This process is complicated, at the same time, the neutral zone has a short distance, the distributed capacitance and the circuit resistance is small, the oscillation process is complicated, as shown in Figure 1.
If there is a low–frequency oscillation in the vehicle line system when EMU passing the neutral zone, the magnetic field of the excitation circuit of the voltage transformer and other equipment will increase, the terminal voltage will rise, and the high–voltage coil insulation of the equipment will be damaged. Using the existing research conclusions will have greater limitation. In response to this problem, this article combines the operating conditions of the existing lines to test the line voltage characteristics and the oscillation process of the EMU during the neutral zone process, establishes the EMU–contact line–traction substation model, reveals the low–frequency oscillation mechanism. The study obtains the relationship between the separation phase angle of the pantograph and the low–frequency oscillation, the low–frequency oscillation overvoltage suppression methods are proposed. The research provides a basis for the design of the contact line neutral zone and the selection of high–voltage equipment for the EMU.

2. Low–Frequency Oscillation and Overvoltage Characteristics of the Contact Line

2.1. Test method and test process

For on–line low–frequency oscillations, field tests are carried out. The test system consists of a voltage divider, a current sensor, and data acquisition. The data acquisition system uses a 20 kHz sampling frequency and can analyze 100th harmonics. The recording method is continuous interval recording, that is, store once in every 1000ms, and store 100ms data each time, so that the transient process can be recorded. The specific parameters of the test system design are shown in Table 1.
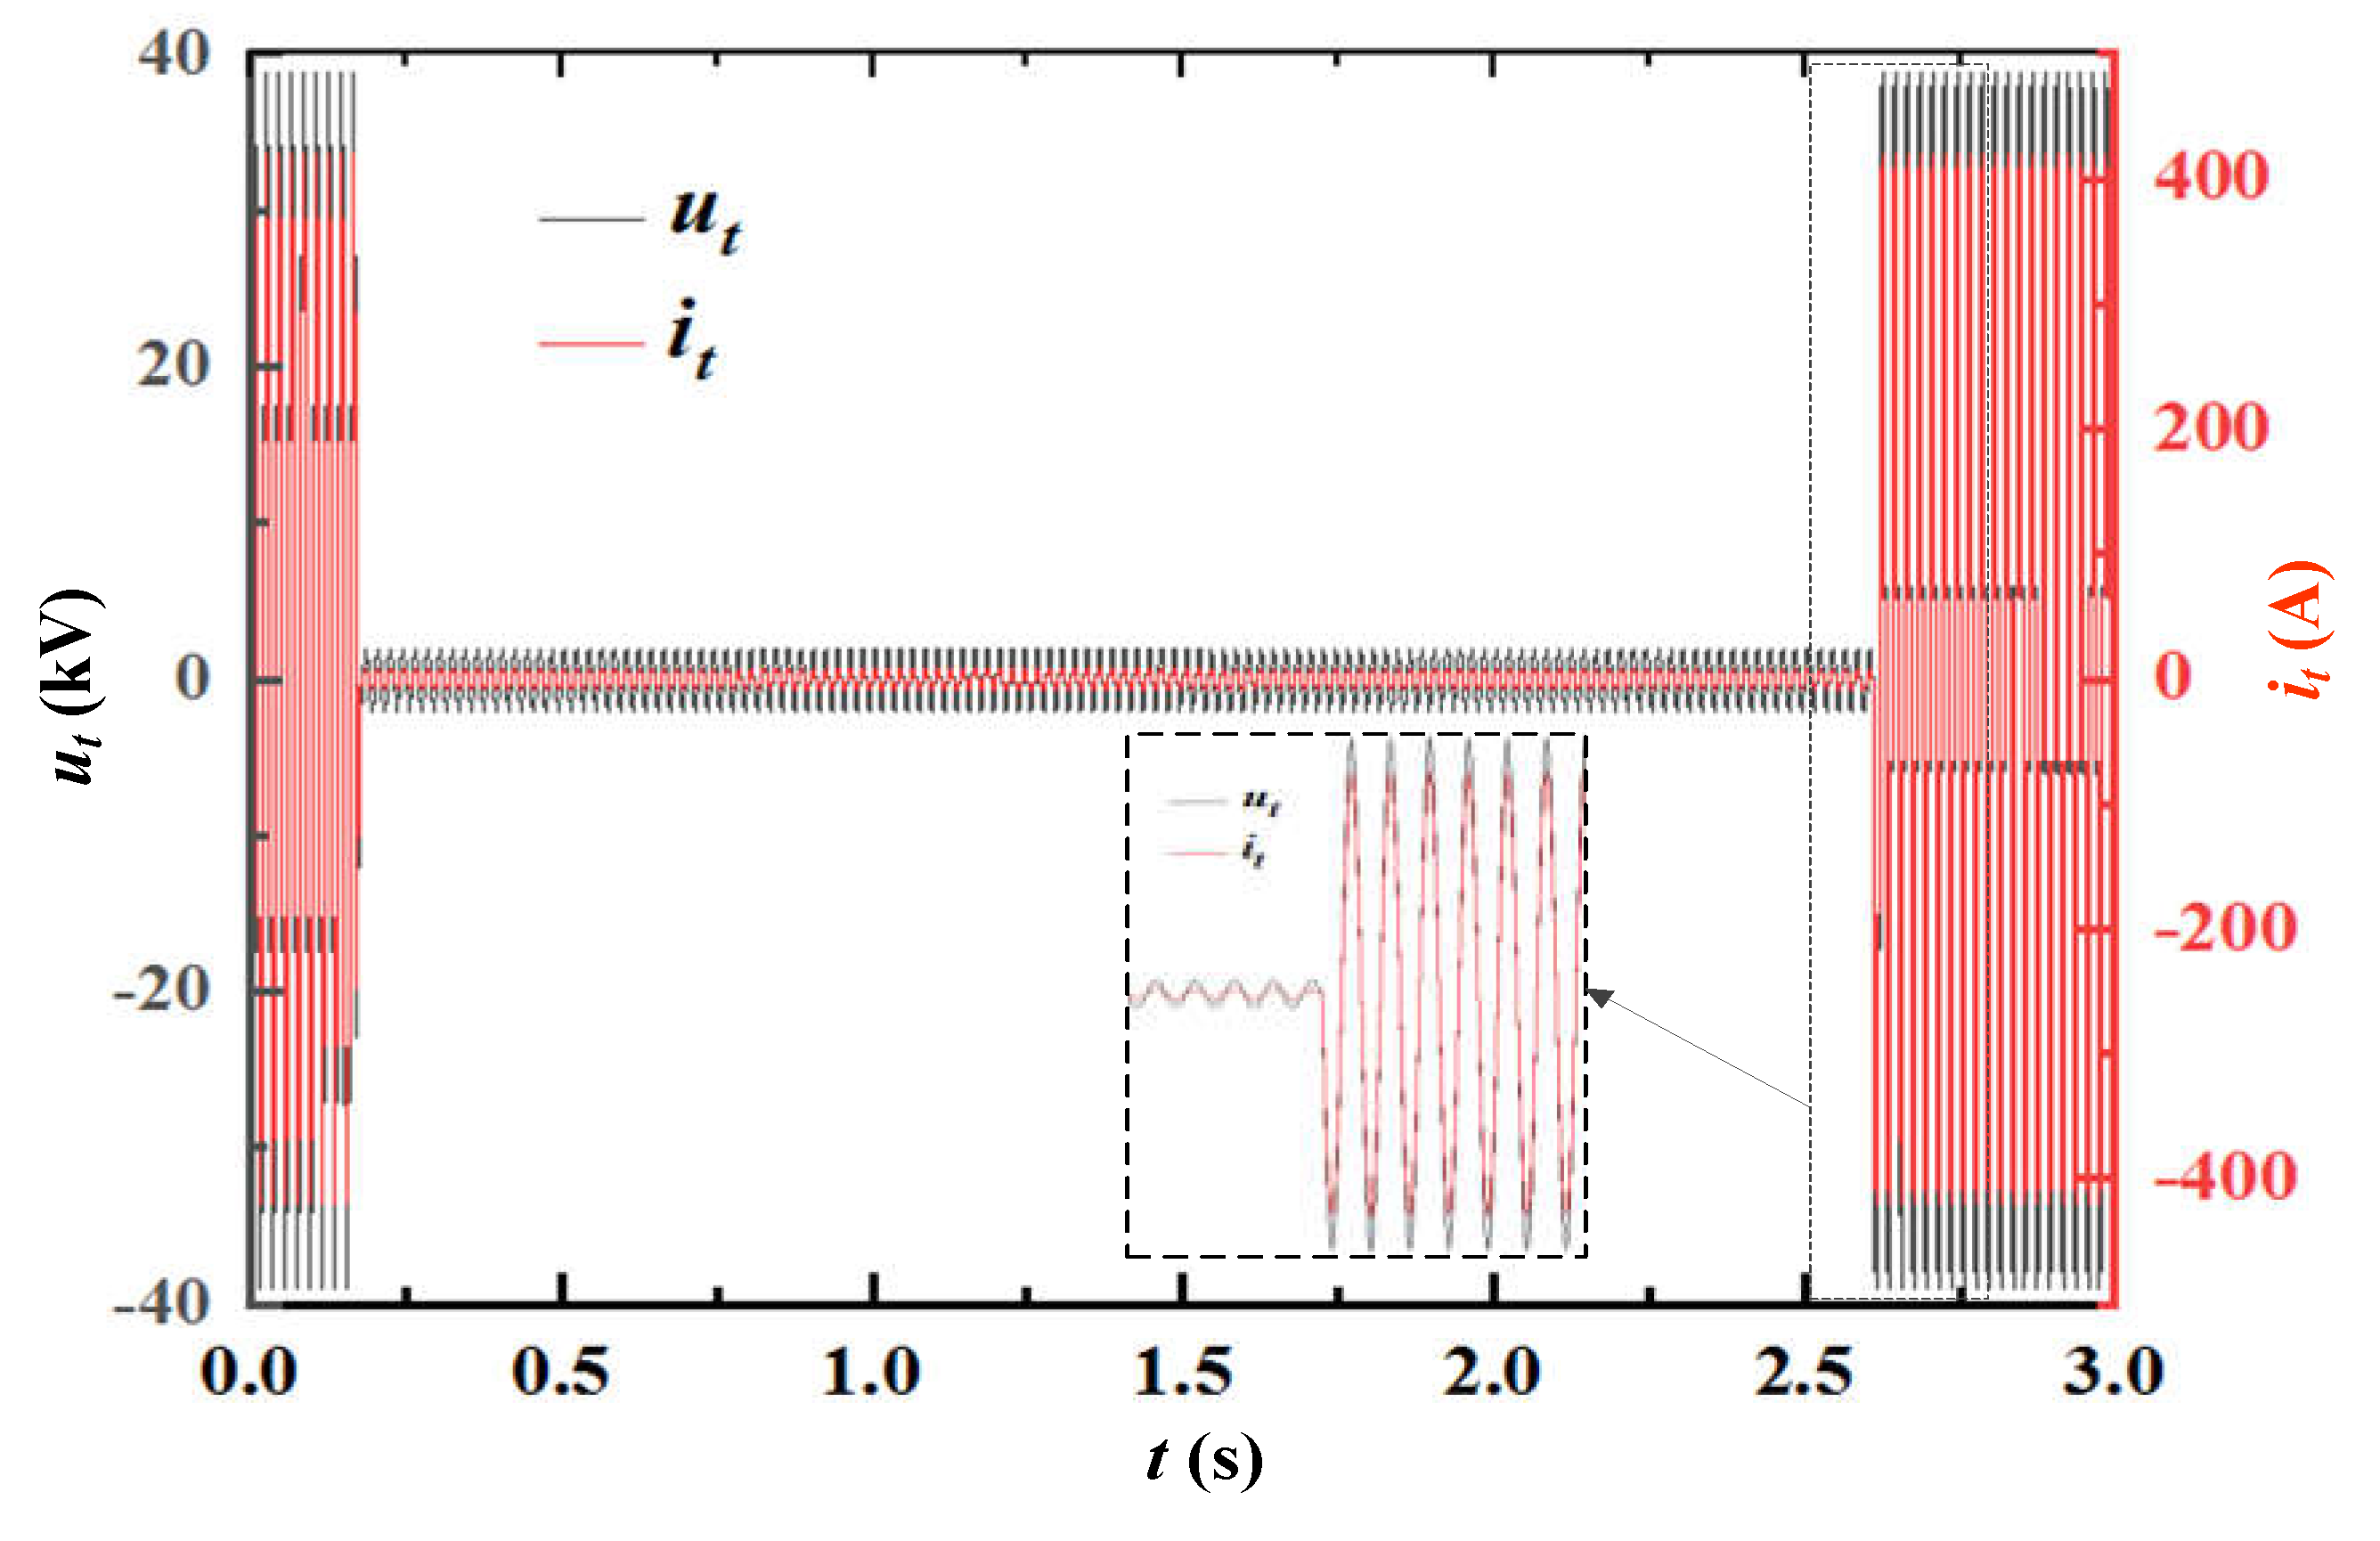
During the test, the voltage and current signals are respectively obtained on the secondary terminals of the on–board voltage transformer and the current transformer. When the train is running on the line, the voltage waveform obtained is shown in Figure 2. The line voltage when passing through the neutral zone (i.e. the position A shown in Figure 1) is shown in Figure 2. At this position, there is an instantaneous drop in line voltage, but a higher amplitude overvoltage appears at the position2.

2.2. Wave characteristics and laws

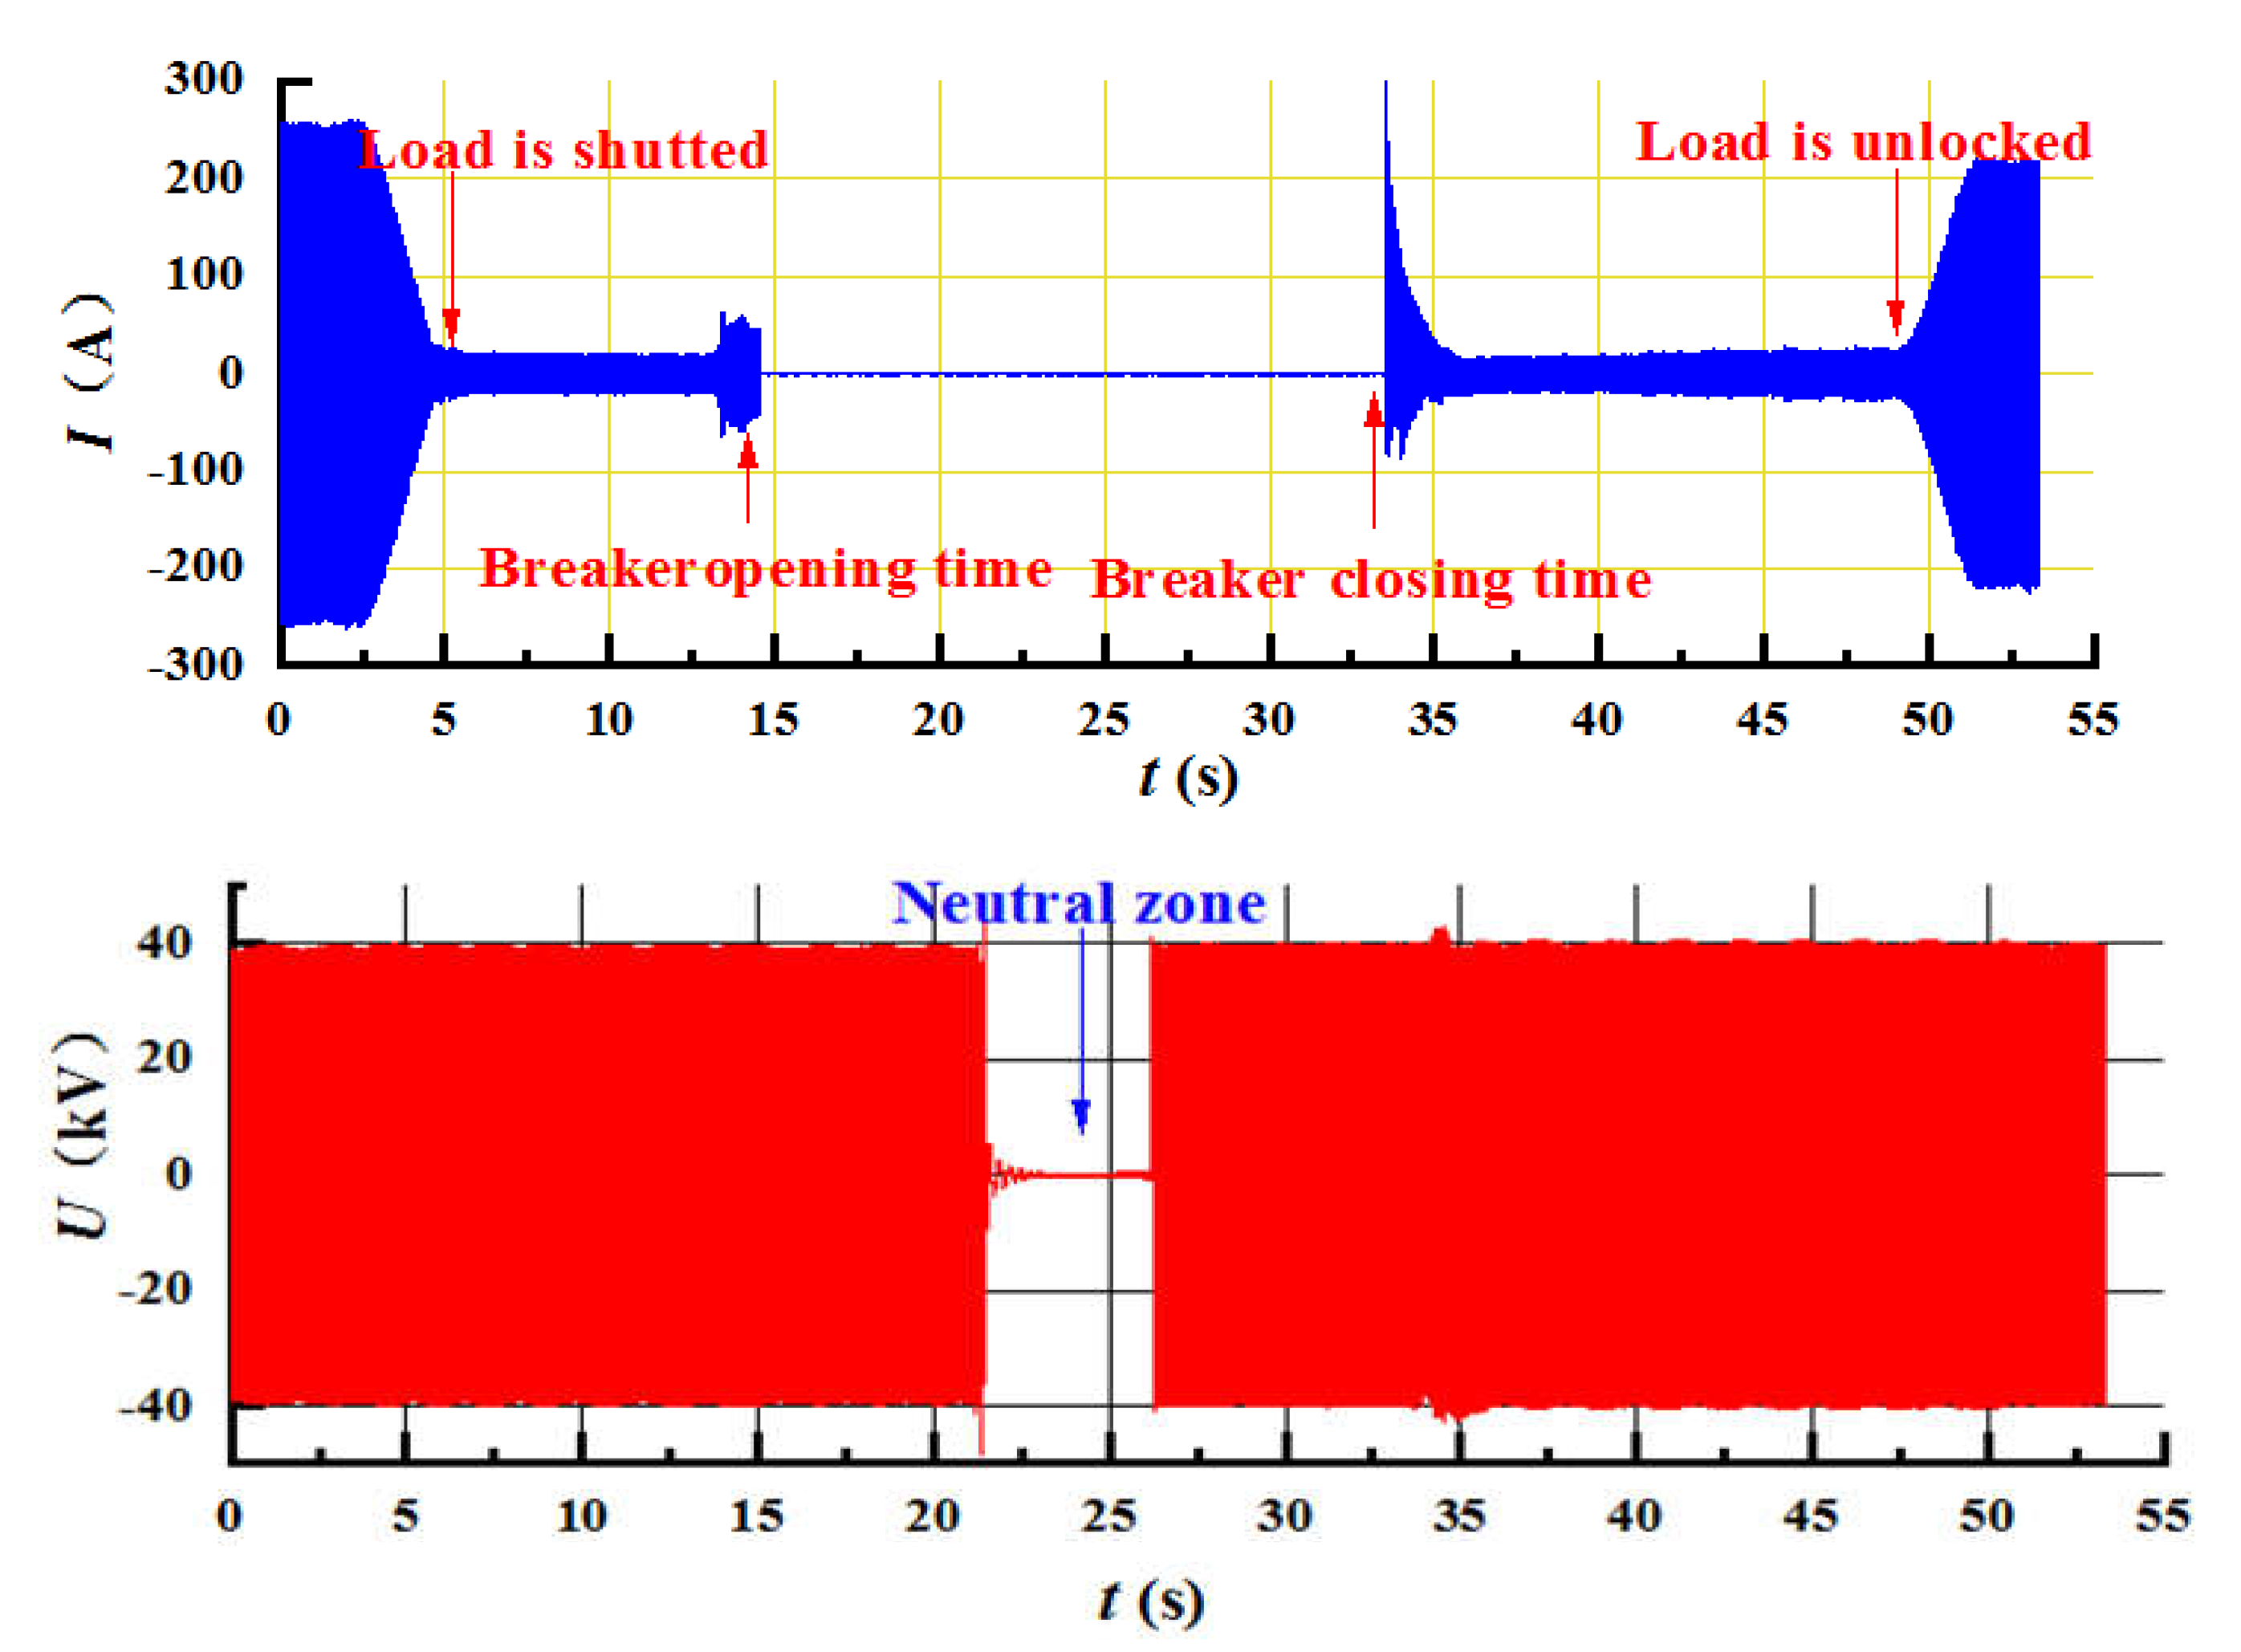
When the train passes through the electrical neutral zone, the voltage waveform should be as shown in Figure 3 because the electrical separation belongs to the no–power zone.
When the train is separated from the feeding section at stage A, a brief pantograph arcing will appear. In the neutral zone, although the voltage is affected by the induced voltage of the feeding section and the voltage should be below 5kV and 50Hz power frequency normally.
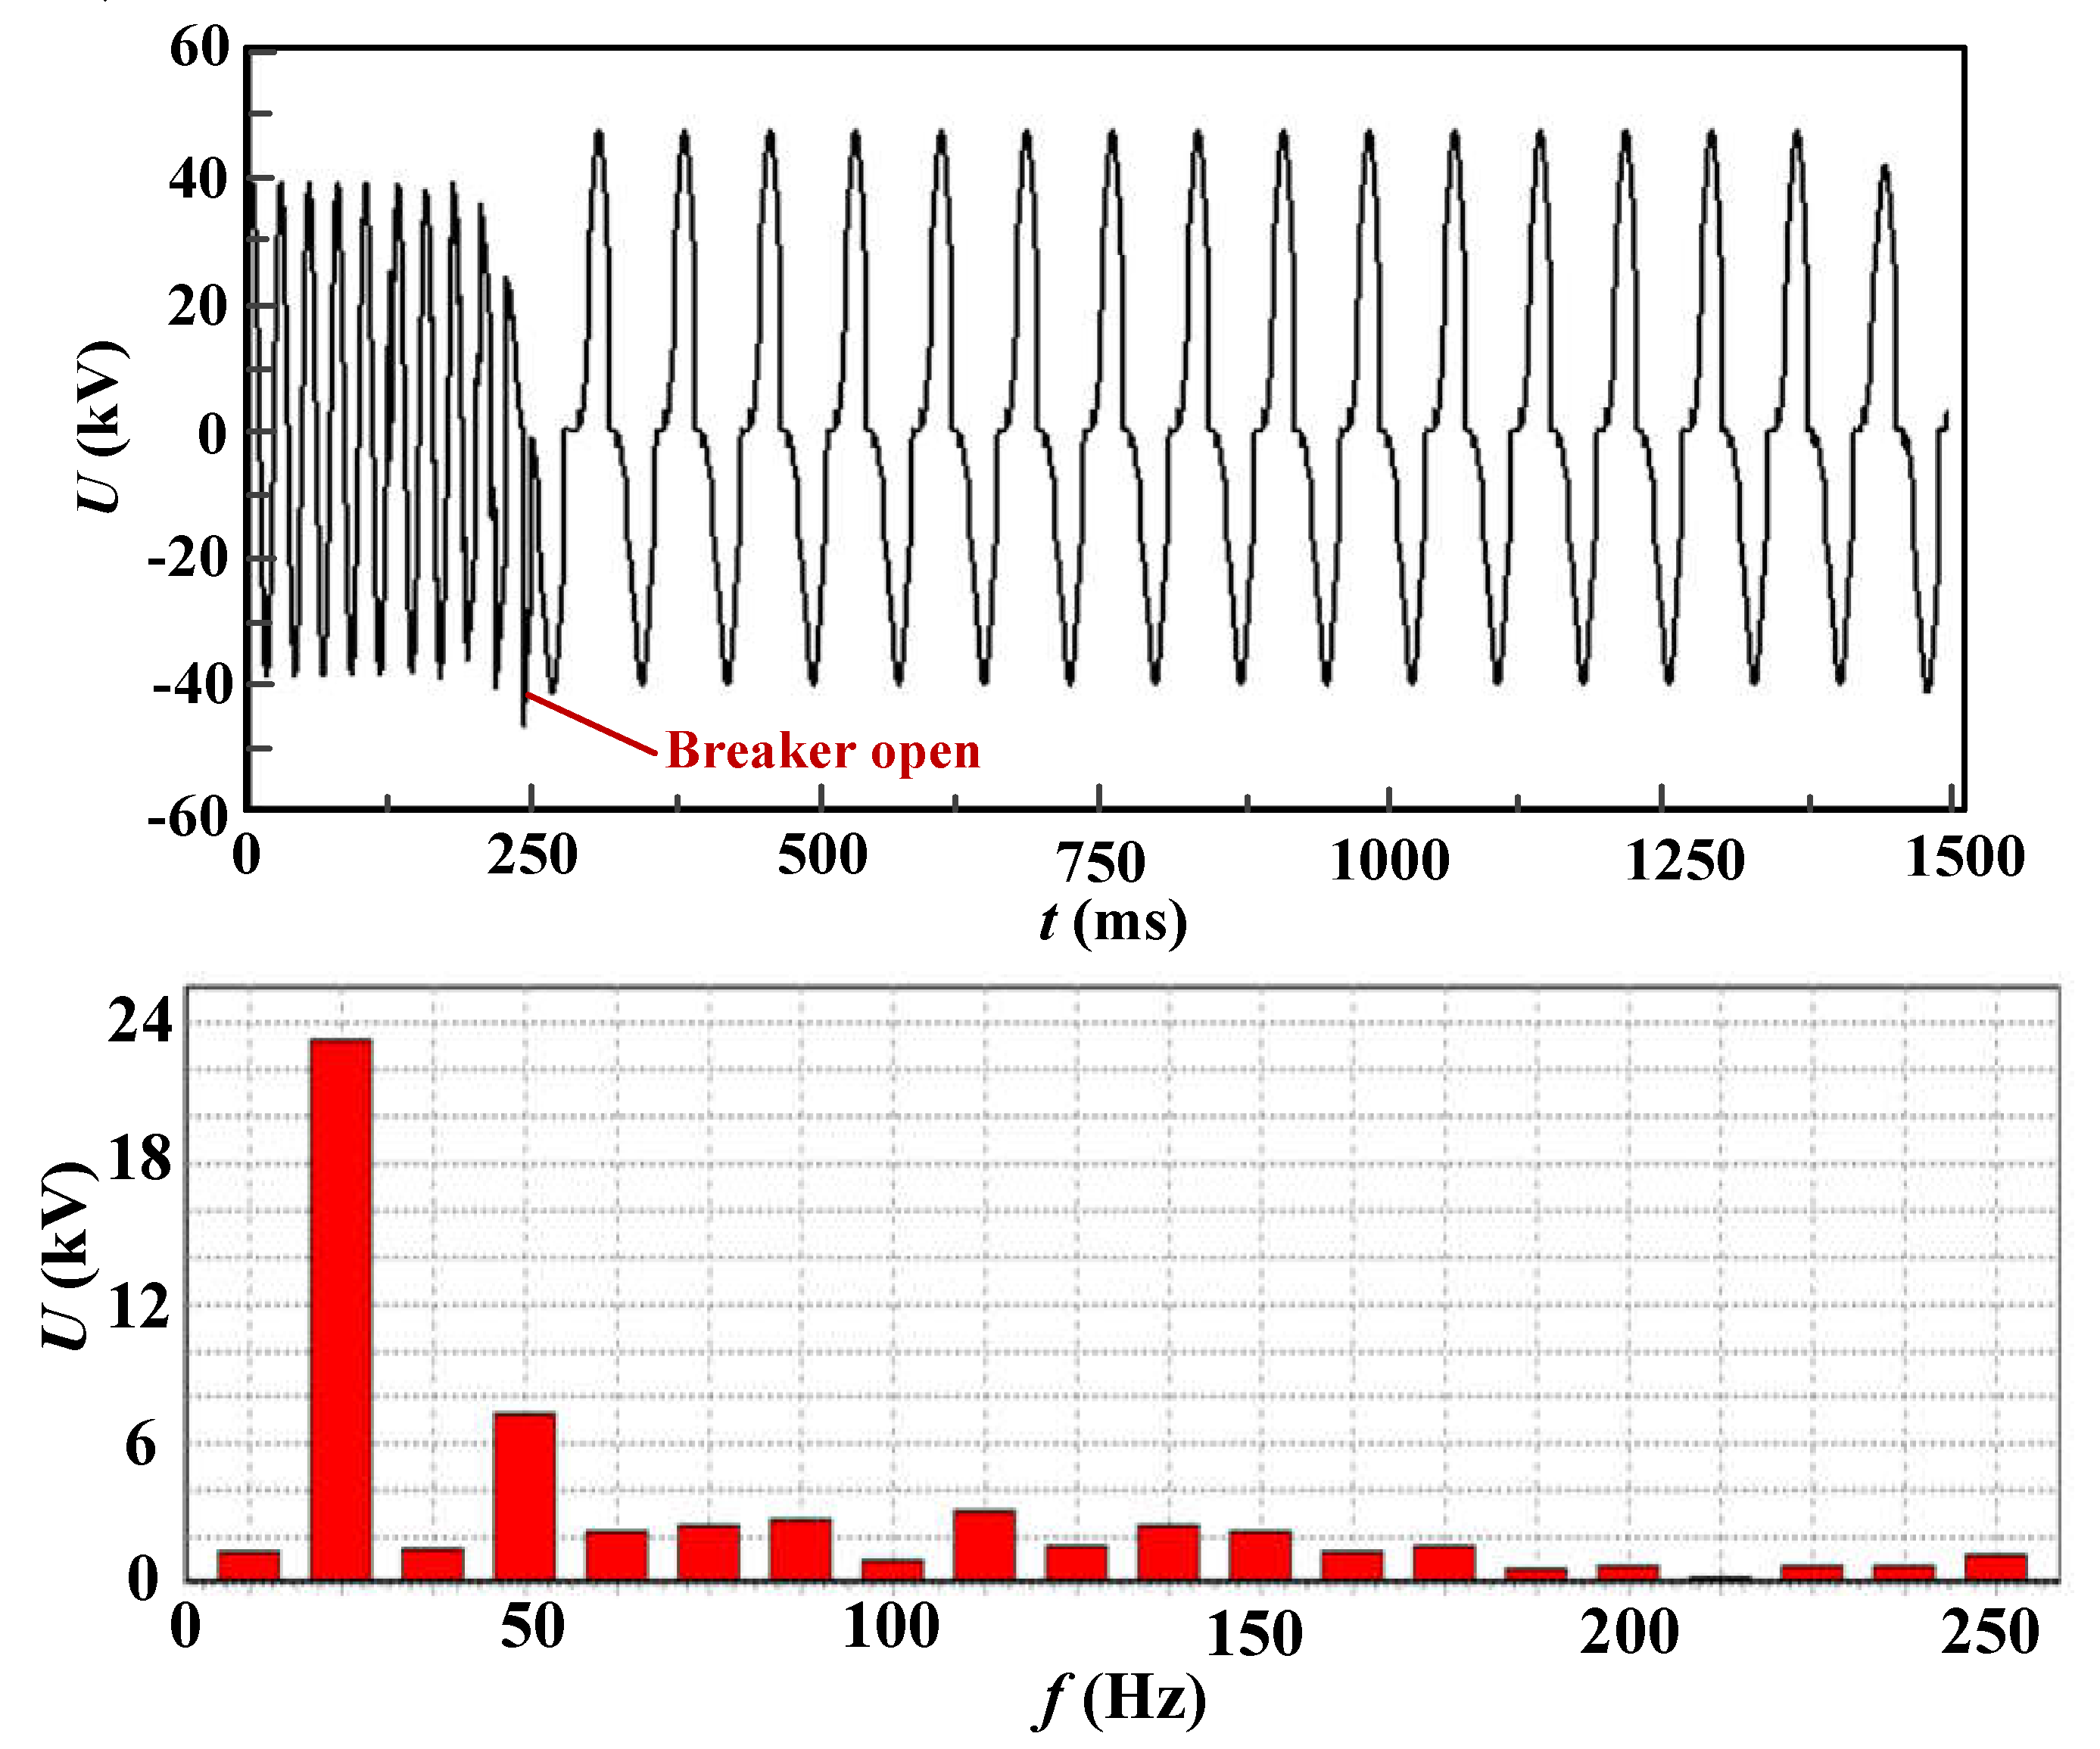
When the EMU produces low–frequency oscillations in the neutral zone, the voltage transformer on the secondary side of the EMU voltage transformer will increase abnormally. If the EMU enters the neutral zone at position 34, besides the line over voltage due to the separation of the pantograph and the grid, the grid voltage waveform in the neutral zone will also have obvious low–frequency oscillation characteristics. When the amplitude of the oscillation voltage is obvious, it can reach 52.0kV. The neutral zone of the contact line mainly occurs low–frequency oscillation of 1/3 power frequency (16.7Hz).
Through the analysis of the harmonic proportion, the amplitude of the generated 1/3 power frequency harmonic is about 3 times of the induced voltage in the neutral zone, and the overvoltage after the voltage superposition will affect the safety of the EMU.

3. Vehicle–Line–Institute Model and Oscillation Characteristics

3.1. Research on the model of train passing through the neutral zone

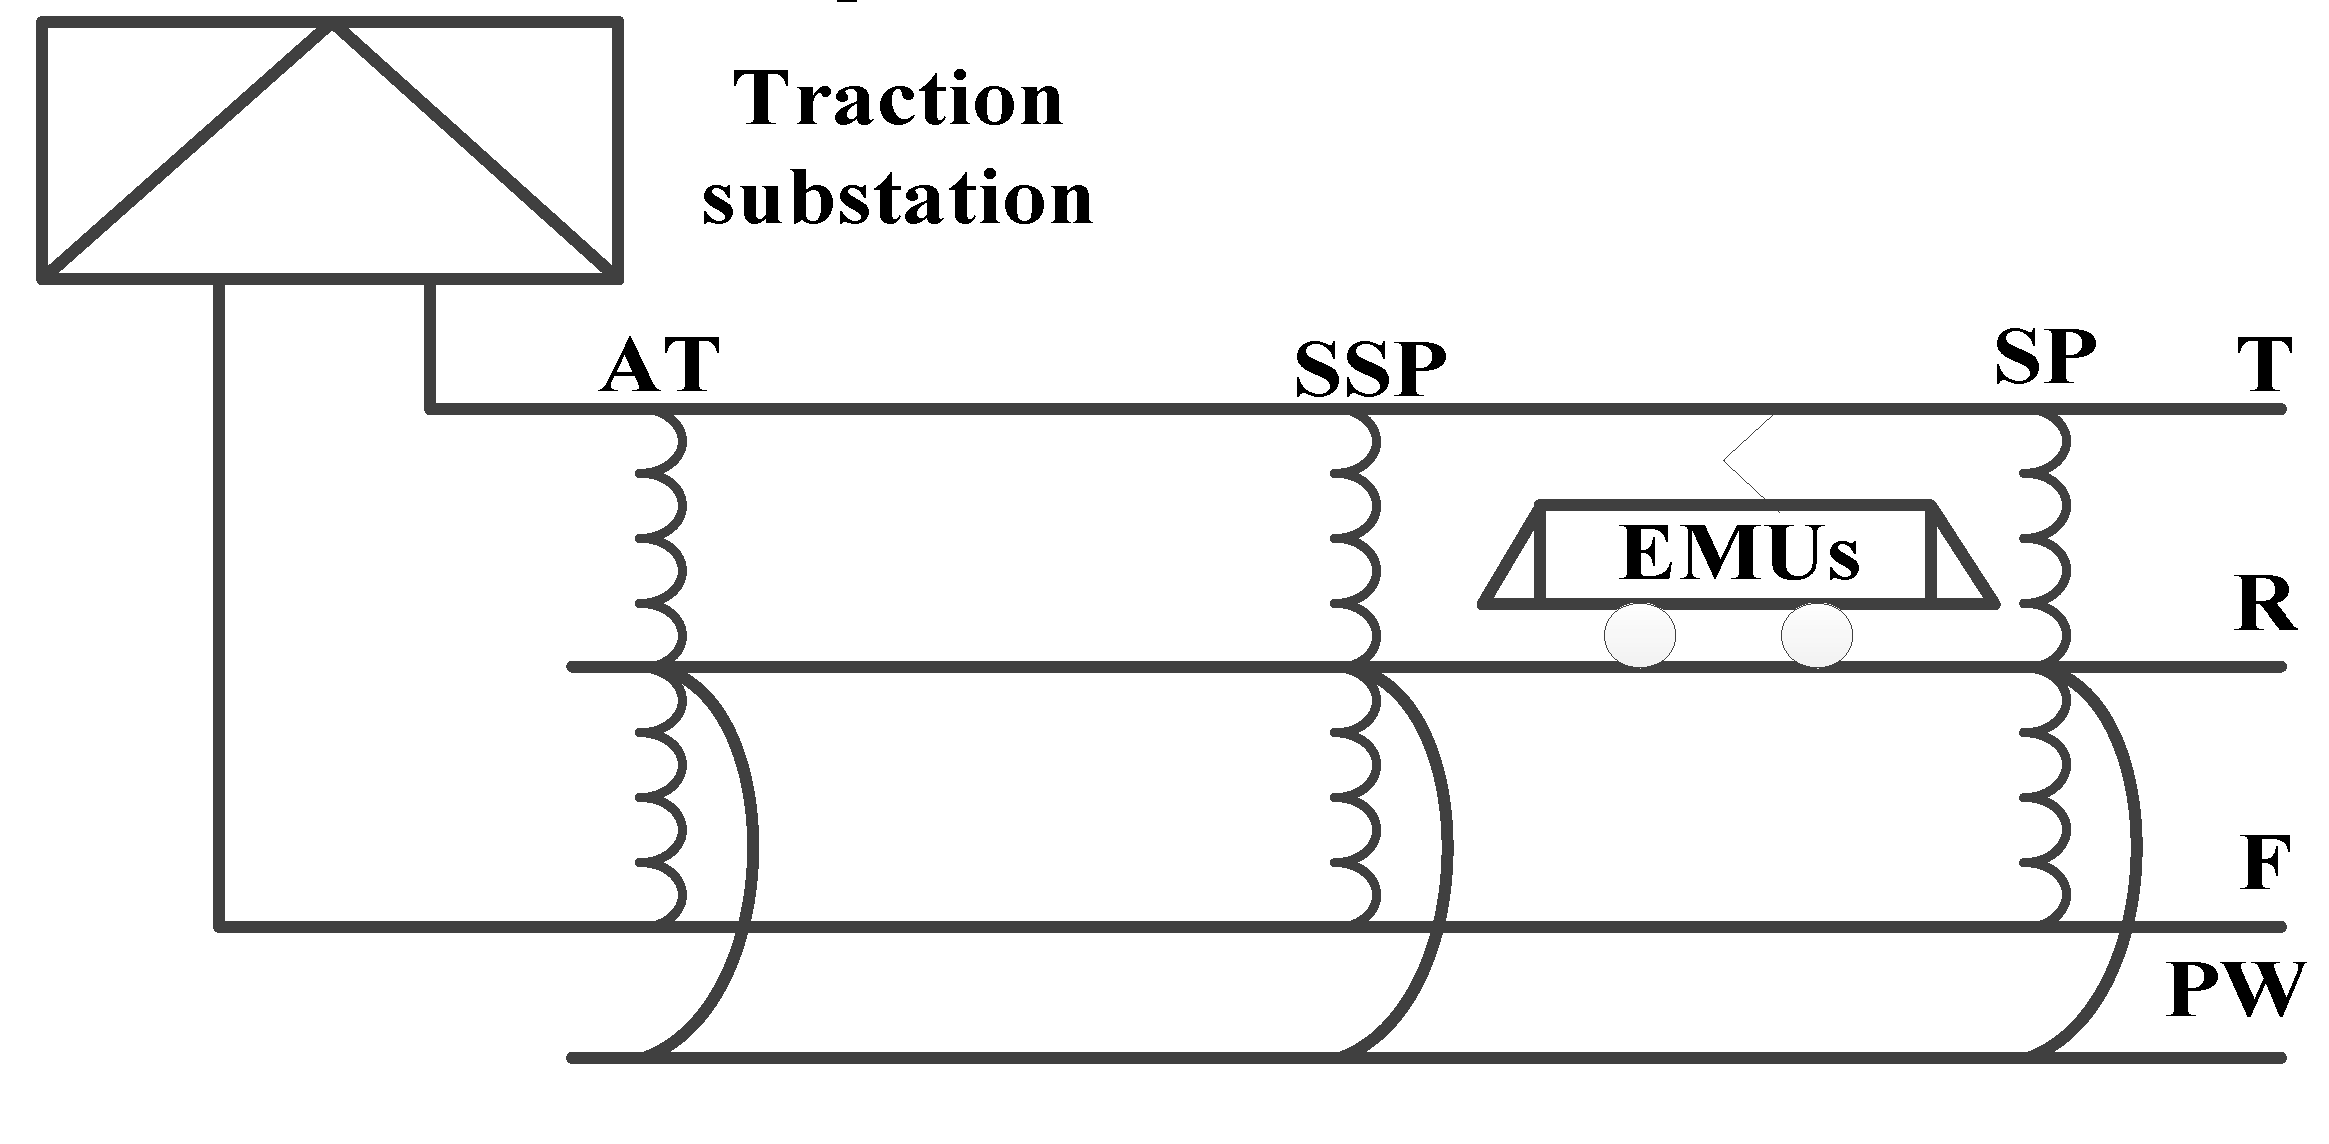
In the tested Beijing–Zhangjiakou railway line, the AT power supply mode is adopted, and an autotransformer is installed every 10–15km. One terminal is connected to the contact line, the other terminal is connected to the positive feeder, and the neutral point is directly connected to the rail. As shown in Figure 5, the AT power supply mode is equipped with a protection wire (PW), which is directly connected in parallel with the rail (R); a connector of protective wire (CPW) is added to connect the rail and the midpoint of the autotransformer with the protection wire. In order to reduce the impedance of the traction power system, increase the voltage at the end of the feeding section, and reduce the power loss, the downstream contact lines, positive feeders, and steel rails of the double–track traction line are connected in parallel at each AT.
Table 4. Equivalent circuit distributed capacitance calculation results.
c T1 R1 P1 F1 T2 R2 P2 F2
T1 13.12 –0.83 –1.74 –2.04 –2.00 –0.41 –0.36 –0.56
R1 –0.83 20.12 –0.63 –0.23 –0.41 –0.44 –0.12 –0.09
P1 –1.74 –0.63 8.42 –1.12 –0.36 –0.12 –0.08 –0.11
F1 –2.04 –0.23 –1.12 8.28 –0.56 –0.09 –0.11 –0.26
T2 –2.00 –0.41 –0.36 –0.56 13.12 –0.83 –1.74 –2.04
R2 –0.41 –0.44 –0.12 –0.09 –0.83 20.12 –0.63 –0.23
P2 –0.36 –0.12 –0.08 –0.11 –1.74 –0.63 8.42 –1.12
F2 –0.56 –0.09 –0.11 –0.26 –2.04 –0.23 –1.12 8.28
The electrical parameters of the voltage transformer are shown in Table 5
Table 5. Voltage transformer inductance parameters.
Serial Number JDZXW5–25J JDZXW5A –25J JDZXW7–25D
EMU Type CRH3X CRH5X CR400XF
Primary DC Resistance 20℃ 43160Ω 46488Ω 43160Ω
Primary inductance 11000H–12000H 11000–12000H 11000H–12000H
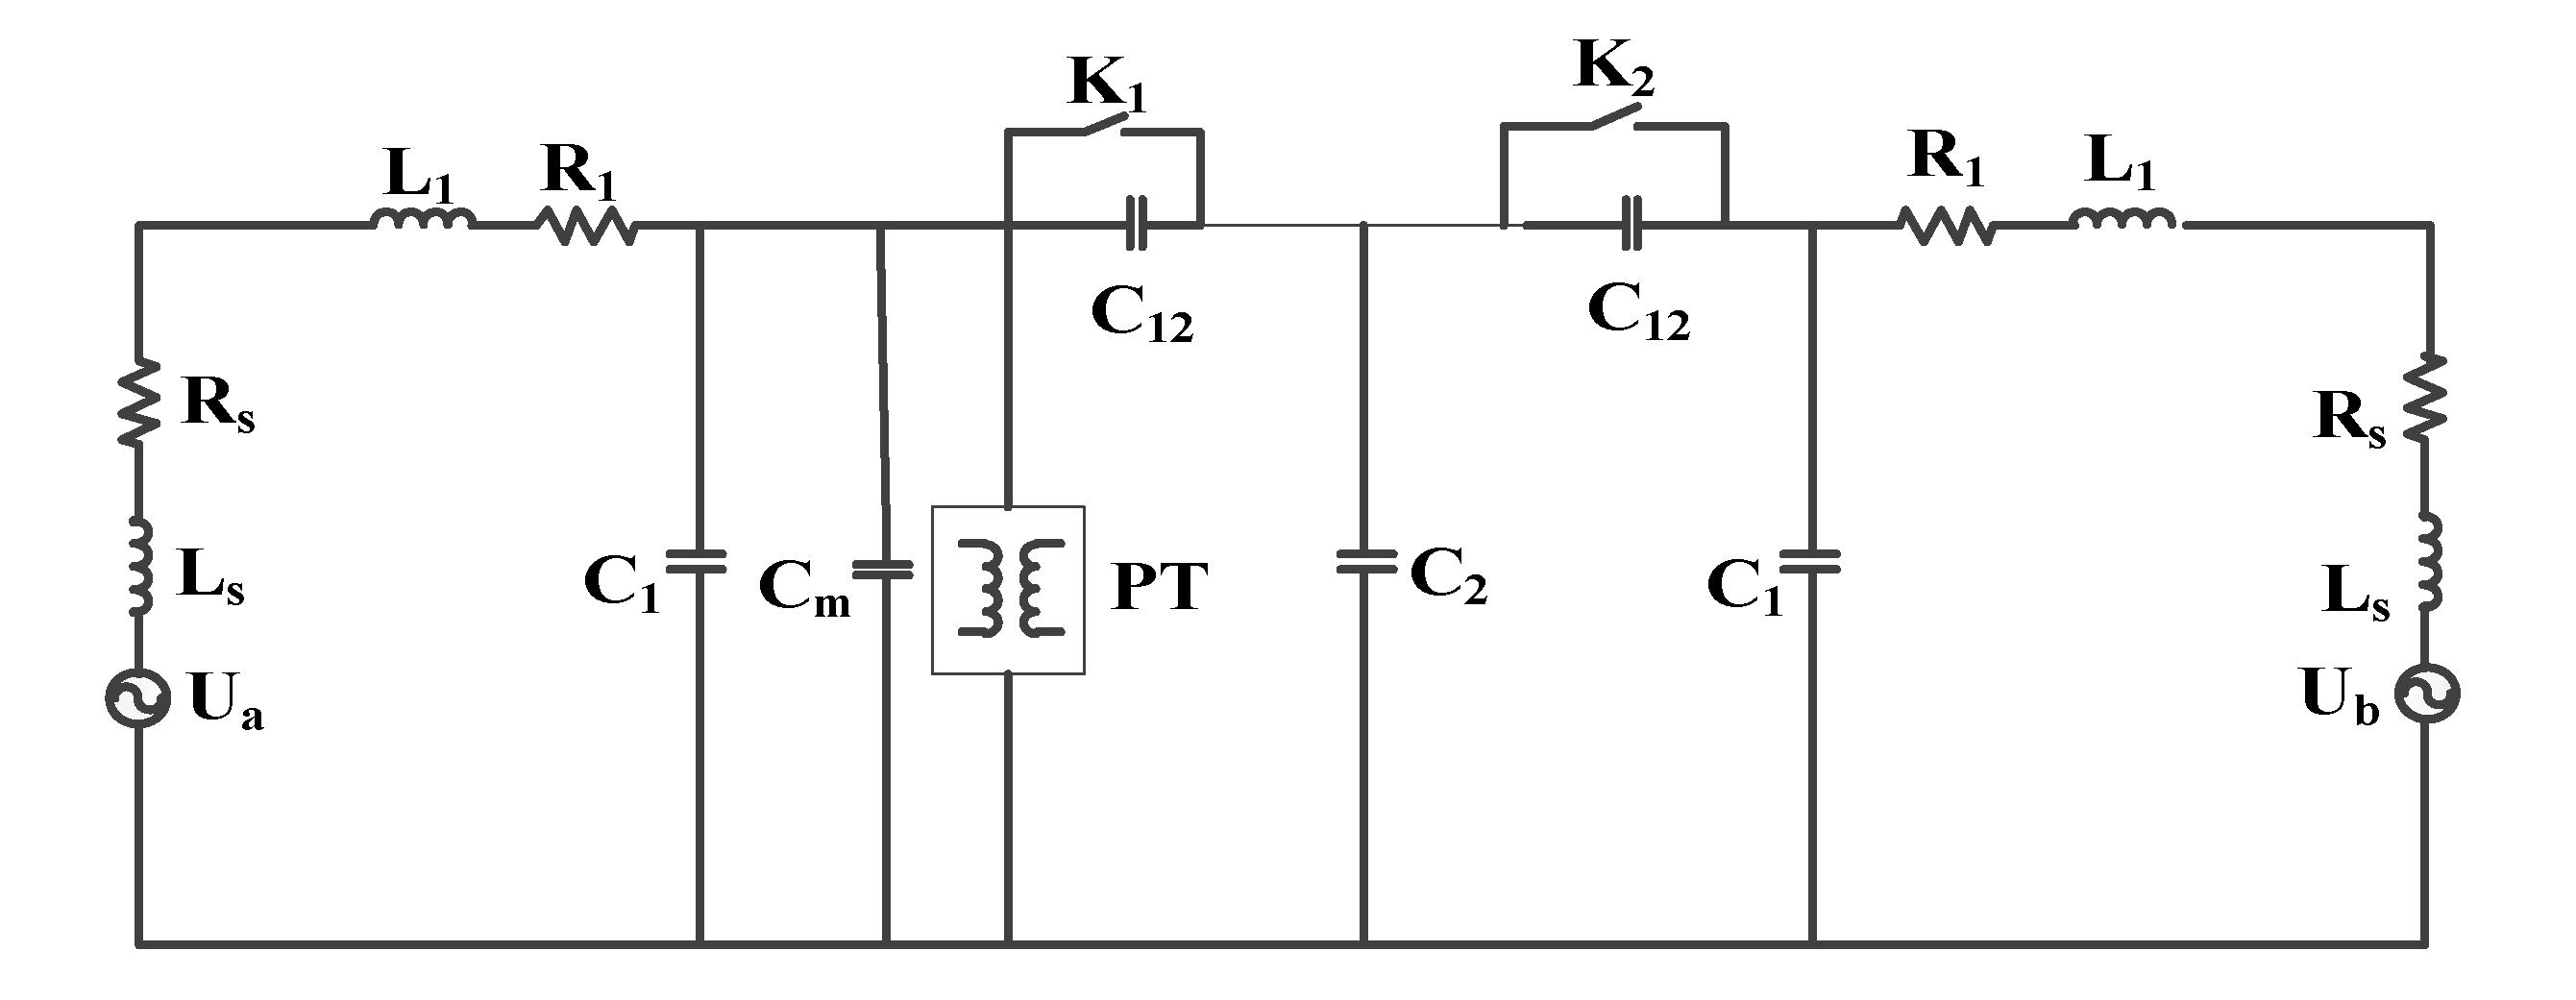
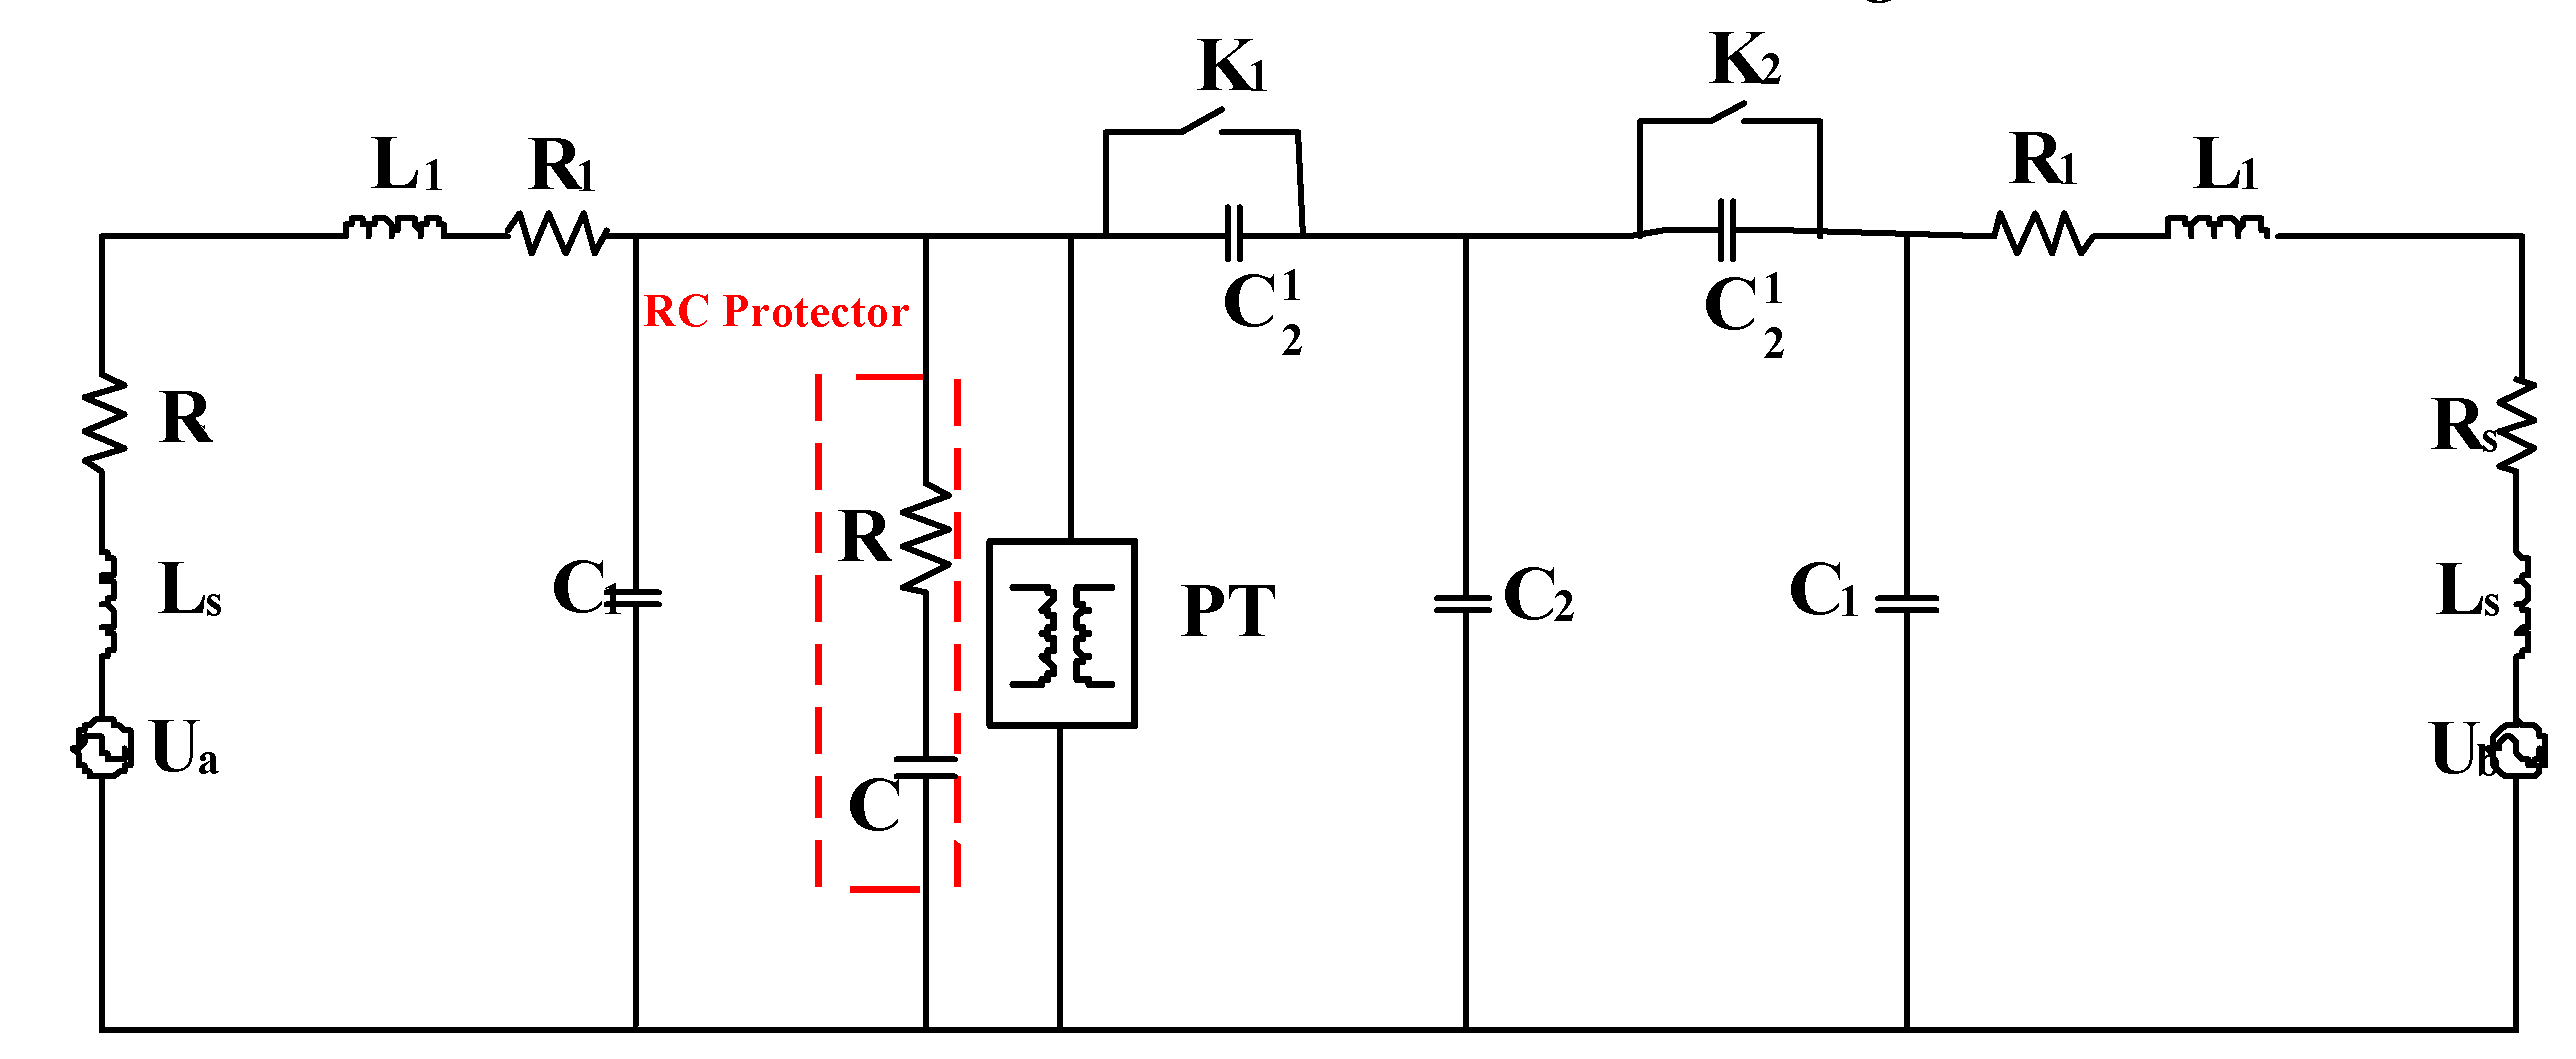
In the entire EMU, only the pantograph and the roof voltage transformer are connected to the contact line and the articulated electrical split. This main circuit can be equivalent to a high–level circuit composed of resistance, inductance and capacitance. The equivalent circuit is shown in Figure 6.
In Figure 6, Ua and Ub are traction power supplies; RS and LS are the resistance and inductance of the traction transformer converted according to the Thevenin circuit equivalent; R1 and L1 are the equivalent resistance and reactance of the contact line feeding section; C1 is the feeding section ground capacitance; C2 is the neutral zone–to–ground capacitance; C12 is the coupling capacitance between the neutral zone and the power supply zone; PT is the roof voltage transformer; Cm is the EMU pantograph–to–ground capacitance; K1 and K2 are equivalent switch. The initial state is the off state, which is used to simulate the circuit conversion process of the over–phase division of the EMU.
When the EMU enters the neutral zone, the equivalent switch K2 remains open, and the equivalent switch K1 quickly changes from the open state to the closed state. The neutral zone voltage in this transient process can be determined by the differential equation. Since the core inductances Lm and Rm of the roof voltage transformer are relatively large, and C1 and Cm are relatively small compared to C2, the neutral zone and the power supply zone coupling capacitor C12 are short–circuited after the switch K1 is closed, so in the differential equation expression, the influence of the parameters Lm, Rm, C1, Cm, and C12 can be ignored. If L=Ls+L1, R=Rs+R1, C=C2 according to the equivalent circuit of the EMU after the equivalent switching action, the loop equation can be listed:
u L + u C + u R = u s
Among them us is the power supply voltage, the inductor voltage uL=Ldi/dt, the resistance voltage uR=R·i, and the loop current i=CduC/dt. Substituting them into equation (1), the differential equation can be obtained:
L C d 2 u C d t 2 + R C d u C d t + u C = u s
Since the impedance of the contact line in the neutral zone is very small, the voltage drop of the contact line impedance in the neutral zone can be ignored. Then the voltage uc at both ends of the neutral zone–to–ground capacitance C2 in the equation (2) is the voltage of the neutral zone on the joint–type electrical split.
Equation (2) is a second–order linear non–homogeneous differential equation with constant coefficients, and its full response can be decomposed into zero input response and zero state response.
The induced voltage of the neutral zone–to–ground capacitance C2 on the electric neutral zone, after the switch K1 is closed, the capacitance C2 discharges to the R–L circuit. The differential equation is:
L C d 2 u C d t 2 + R C d u C d t + u C = 0
The zero input expression of the effective circuit is:
u C = p 2 U 0 p 1 p 2 e p 1 t + p 1 U 0 p 1 p 2 e p 2 t = U 0 p 1 p 2 ( p 1 e p 2 t p 2 e p 1 t )
Due to the different circuit parameters, the characteristic root may have three different situations. The neutral zone–to–ground voltage in these three situations will be discussed:
1) When α=ω0, that is R > 2 L / C , p1 and p2 are two unequal negative real numbers.
u C = U 0 p 1 p 2 ( p 1 e p 2 t p 2 e p 1 t )
This situation is called aperiodic discharge or non–oscillating discharge process.
2) When α=ω0, that is R<2(L/C)0.5, p1 and p2 are equal, then the equivalent circuit has only one frequency, and the neutral voltage to ground is:
u C = U 0 ( 1 + α t ) e α t
It can be seen from equation (6) that there is no oscillating change, and it has a non–oscillating nature, but this is the dividing line between an oscillating circuit and a non–oscillating circuit, so the situation when R<2(L/C)0.5 is called a critical non–oscillating process.
3) When α < ω0, that is R<2(L/C)0.5, p1 and p2 are a pair of conjugate complex roots, and the neutral voltage to ground is:
u C = U 0 ω 0 ω d e α t sin ( ω d t + β )
This is an oscillating discharge situation. During the whole process, the waveform will periodically change direction, and the energy storage element will also periodically exchange energy.
When us=Umsin(ωt+Φ) in formula (2), where ω is the angular frequency of the power supply and Φ is the initial phase angle of the power supply voltage. At this time equation (2) becomes:
L C d 2 u C d t 2 + R C d u C d t + u C = U m sin ( ω t + ϕ )
1) If it is a non–oscillating circuit, the neutral voltage to ground can be expressed as:
u C = U m Z X C sin ( ω t + ϕ φ π 2 ) + A 1 e p 1 t + A 2 e p 2 t
Substituting formula (5) into the formula, the expression of Uc and i is:
u C = U m Z X C [ sin ( ω t + ϕ φ π 2 ) + cos ( ϕ φ ) p 1 p 2 ( p 1 e p 2 t p 2 e p 1 t ) + sin ( ϕ φ ) p 2 p 1 ( p 1 e p 1 t p 2 e p 2 t ) ]
2) If the circuit is in a critical state, in the same initial state, the same as above can be obtained:
u C = U m Z X C { sin ( ω t + ϕ φ π 2 ) + e α t [ ( 1 + α t ) cos ( ϕ φ ) + t ω sin ( ϕ φ ) ] }
3) If it is an oscillating circuit, at this time p 1 and p 2 are a pair of conjugate complex numbers, p1=–α+d, p2=–αd, which can be obtained under the same initial state:
u C = U m Z X C { sin ( ω t + ϕ φ π 2 ) + e α t ω d [ ω 0 sin ( ω d t + β ) cos ( ϕ φ ) + t ω sin ω d sin ( ϕ φ ) ] }
When the EMU enters the neutral zone and low–frequency oscillation occurs, the equivalent circuit is obviously oscillating. According to the principle of circuit superposition, add equations (7) and (6) with equations (12) and (11) respectively, and then we can get the mathematical expression of electric current when the EMU enters the electrical neutral zone.
u C ( t ) = U m Z X C sin ( ω t + ϕ φ π 2 ) + U m e α t Z ω d C sin ω d t sin ( ϕ φ ) + [ U 0 ω 0 ω d + U m X C Z sin β cos ( ϕ φ ) ] e α t sin ( ω d t + β )
Combining equation (13) at the moment when the EMU enters the articulated electrical neutral zone, the magnitude of the neutral zone's ground voltage is related to the phase angle of the contact line power supply of the traction substation. The neutral zone structure affects the ground capacitance parameter C, it will also determine the voltage oscillation process in the neutral zone. Since the time when the pantograph enters the neutral zone is random, the instantaneous phase angle of the system power supply voltage is different each time the EMU enters the neutral zone. Therefore, when the EMU enters the electrical neutral zone at different times, different electromagnetic transient processes will be generated, resulting in different excitation levels for the roof voltage transformer. The oscillation angular frequency of the circuit ω0 is higher than the oscillation frequency of the free component ωd. The oscillation frequency of the free component ωd decays exponentially. The speed of the decay depends on the attenuation coefficient α=R/2L. Obviously, the larger the value α, the faster the amplitude decays, and the shorter time it takes to decay to zero. Taking into account the contact line impedance
Z = 0.05 + j 0.145 lg D d
The resistance part is 0.05Ω/km, and the resistance value is about 0.01Ω when the length of the neutral zone is 200m.
Comparing the inductance and resistance parameters of the oscillating system, it can be seen that α=0.001/10000, the damping in the oscillation process is extremely small, and there is almost no attenuation process.

3.2. Oscillation process and overvoltage characteristics

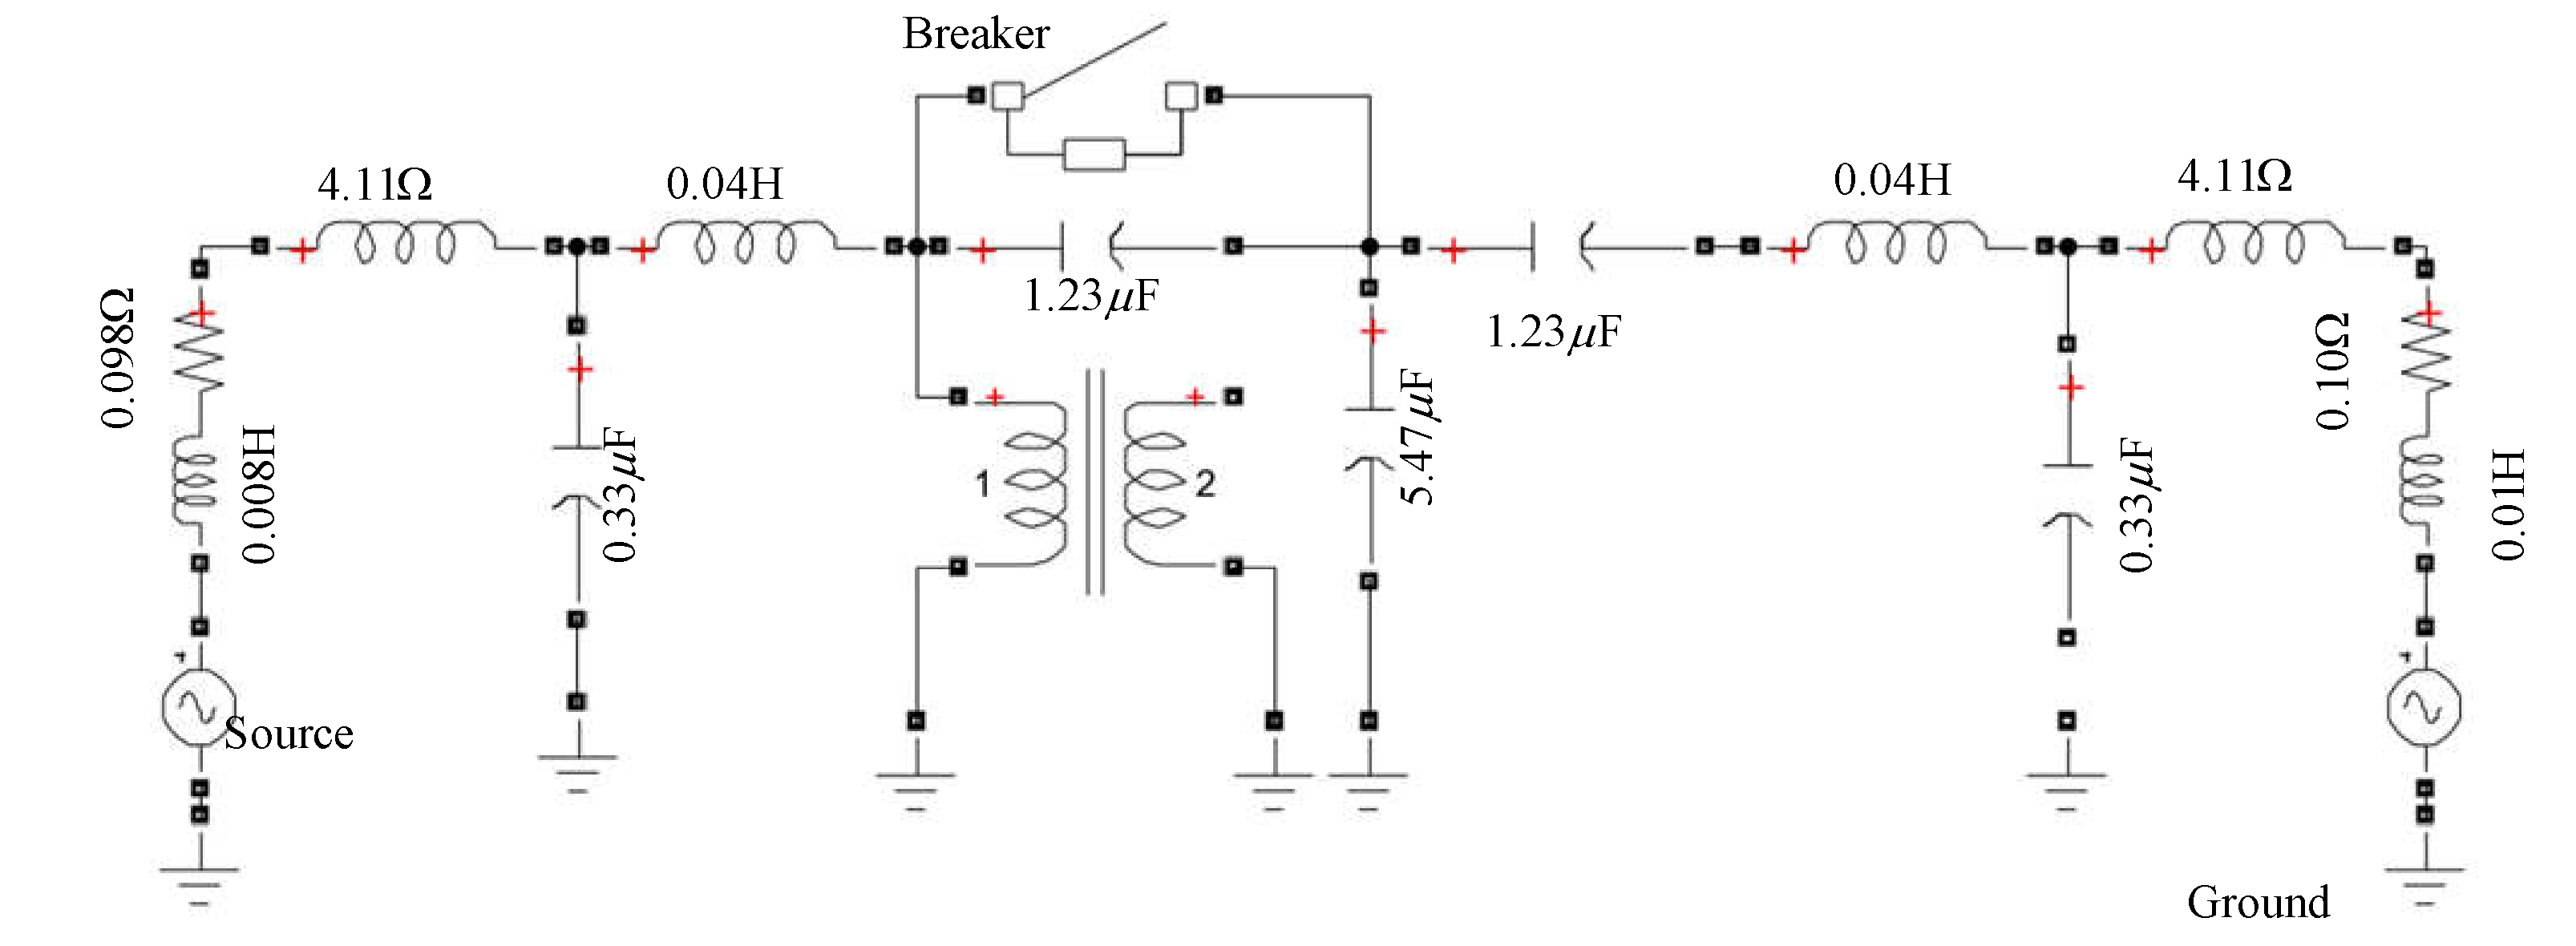
According to the power supply line percenters and the operation status of the train, a source, power supply line and train system model was established, shown in Figure 7. By changing the on–off state of the time–controlled breaker and the position of the PT in the model, the pantograph–net contact state of the over–phase division of the EMU is simulated. The control breaker is in the open state, and switch quickly to the closed state when entering, and the time control switch controls the closing time and then opens.
In order to explore the influence of the power phase angle on the occurrence of low–frequency oscillation at the moment of separation of the pantograph and the line, the fixed time–controlled switch is adopted to control the closing and opening time. The power phase angle is changed, the occurrence of low–frequency oscillation in the neutral zone is observed, and the power phase angle range is recorded. The maximum voltage amplitude in the neutral zone is corresponding to different phase angles. Under different phase angle conditions, the maximum amplitude of the voltage of the EMU through the neutral zone is shown in Table 6.
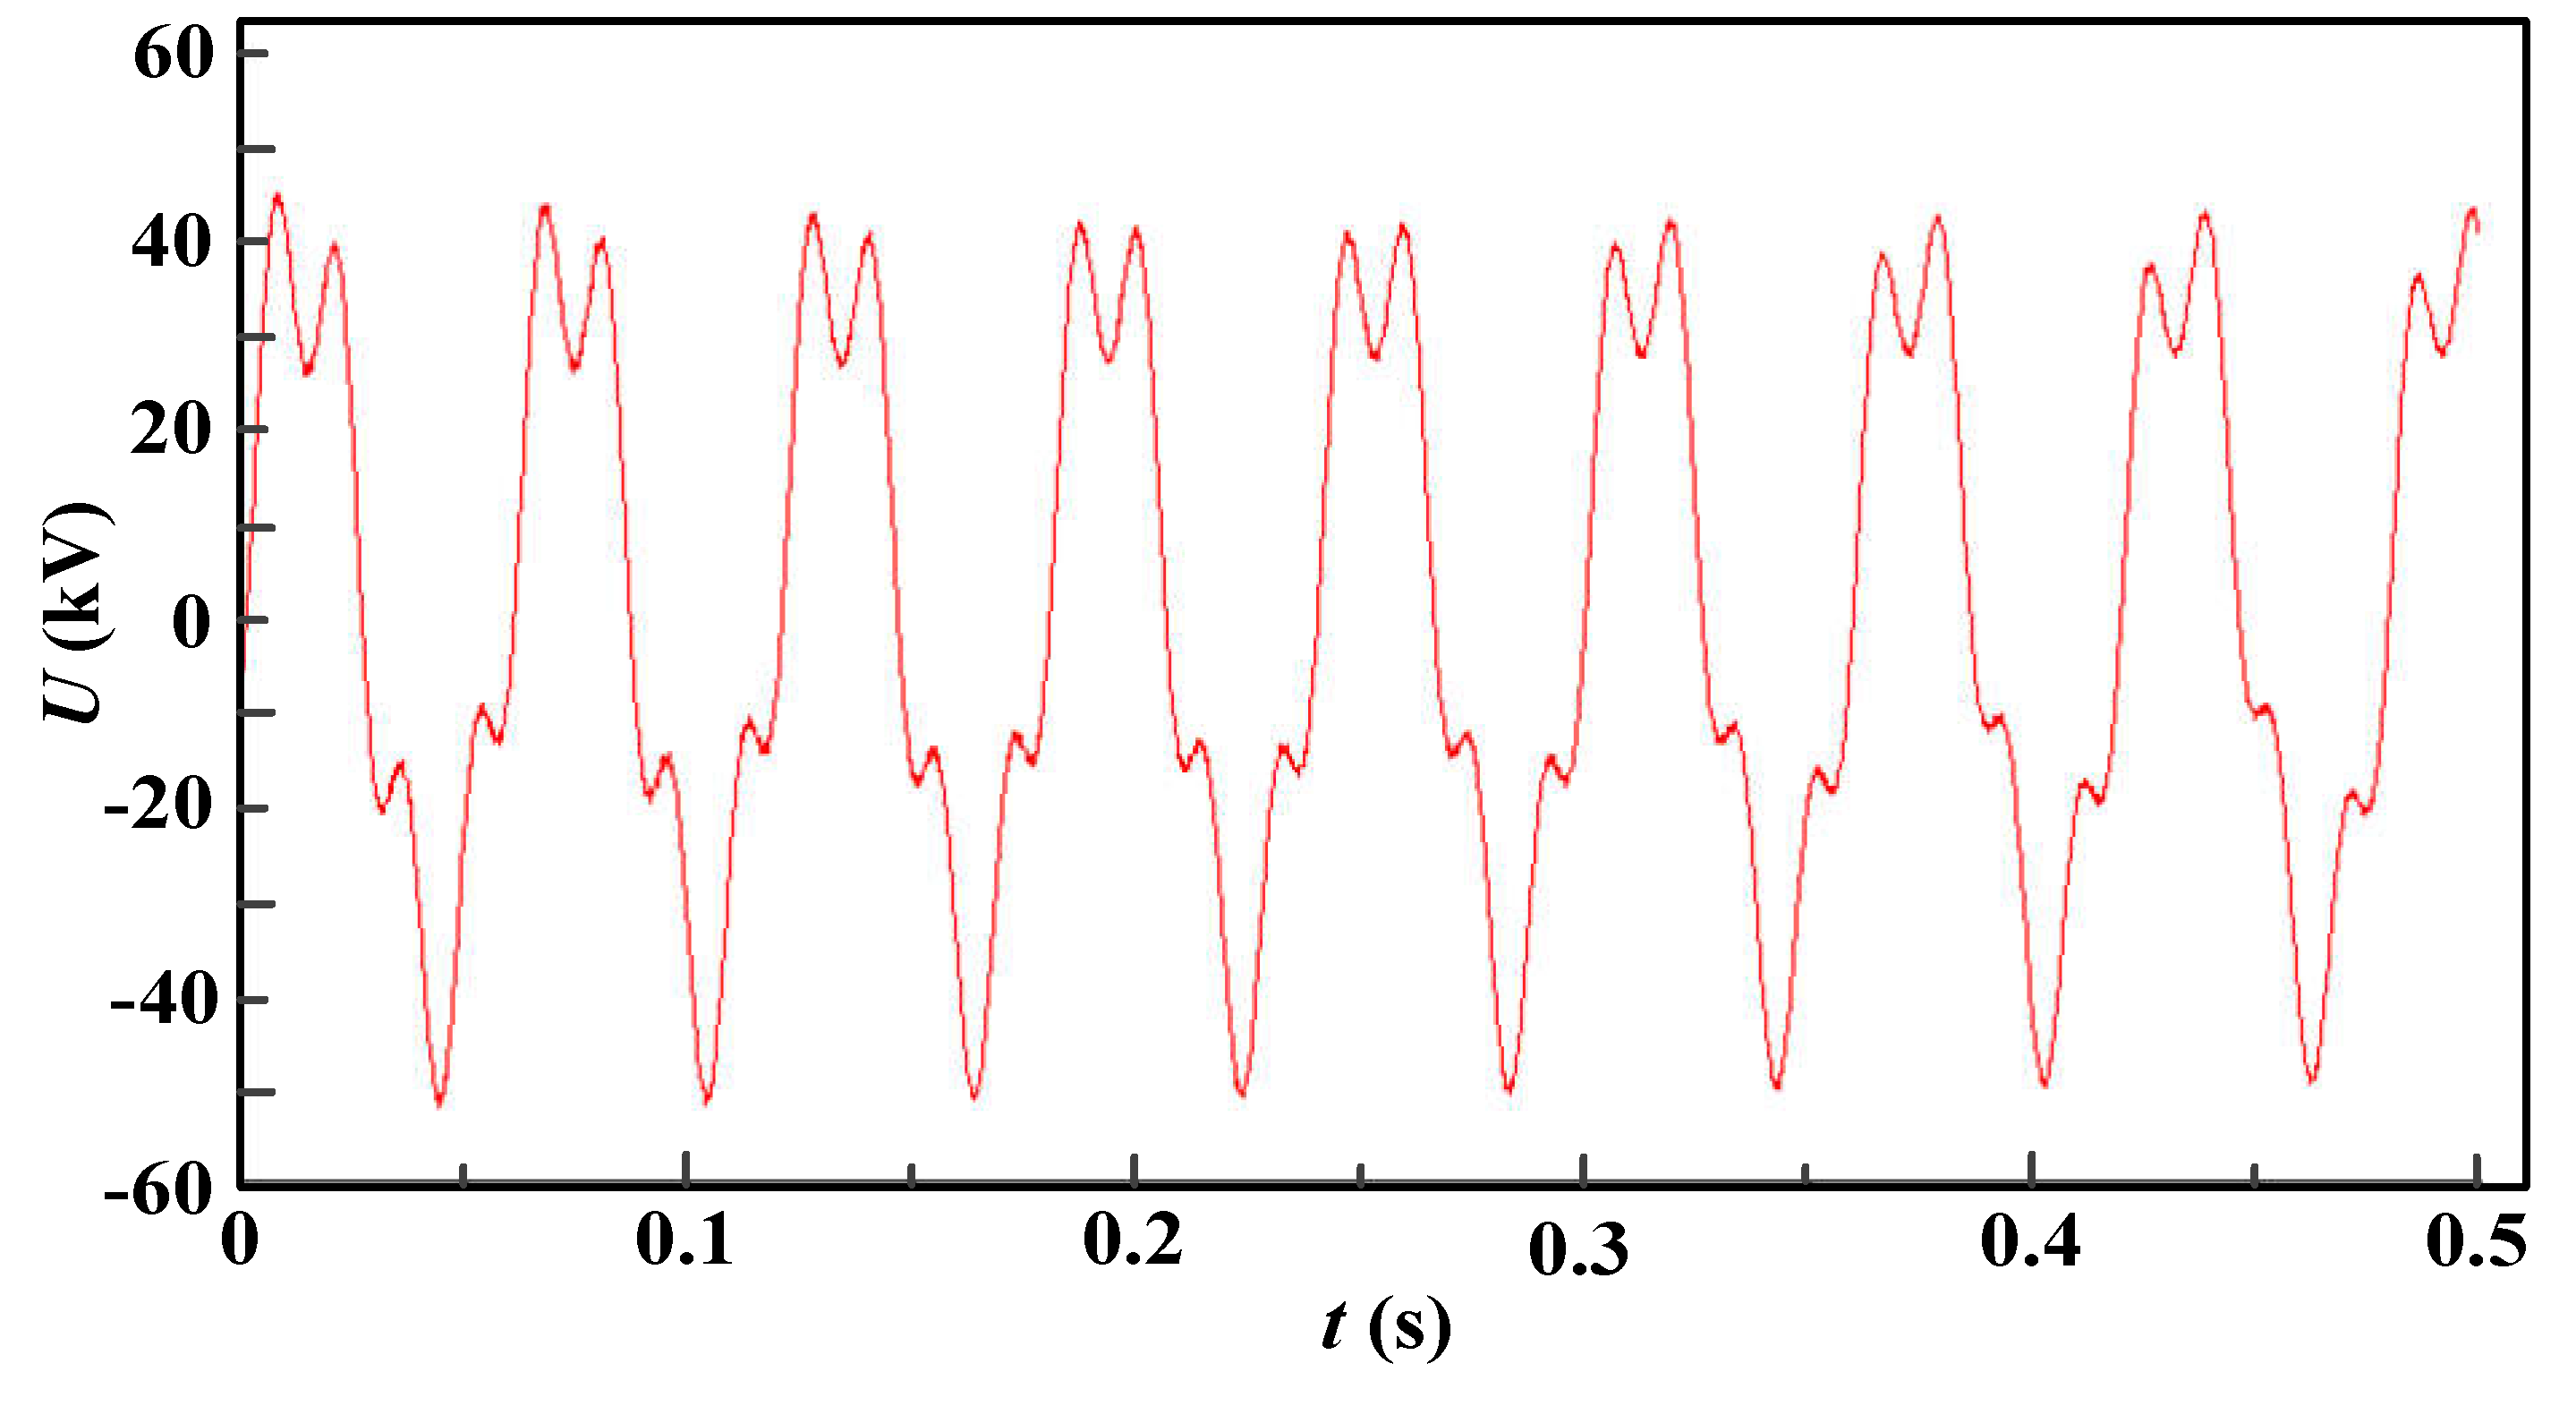
When the phase angle of the power supply is at 60°~90° and 240°~270°, it has a large amplitude. The phenomenon of low frequency oscillation in the neutral zone is most obvious in these phase angle ranges under the simulation conditions. Under the condition of the same power phase angle, the typical waveform of the low–frequency oscillation of the EMU through the electrical neutral zone is shown in Figure 8.
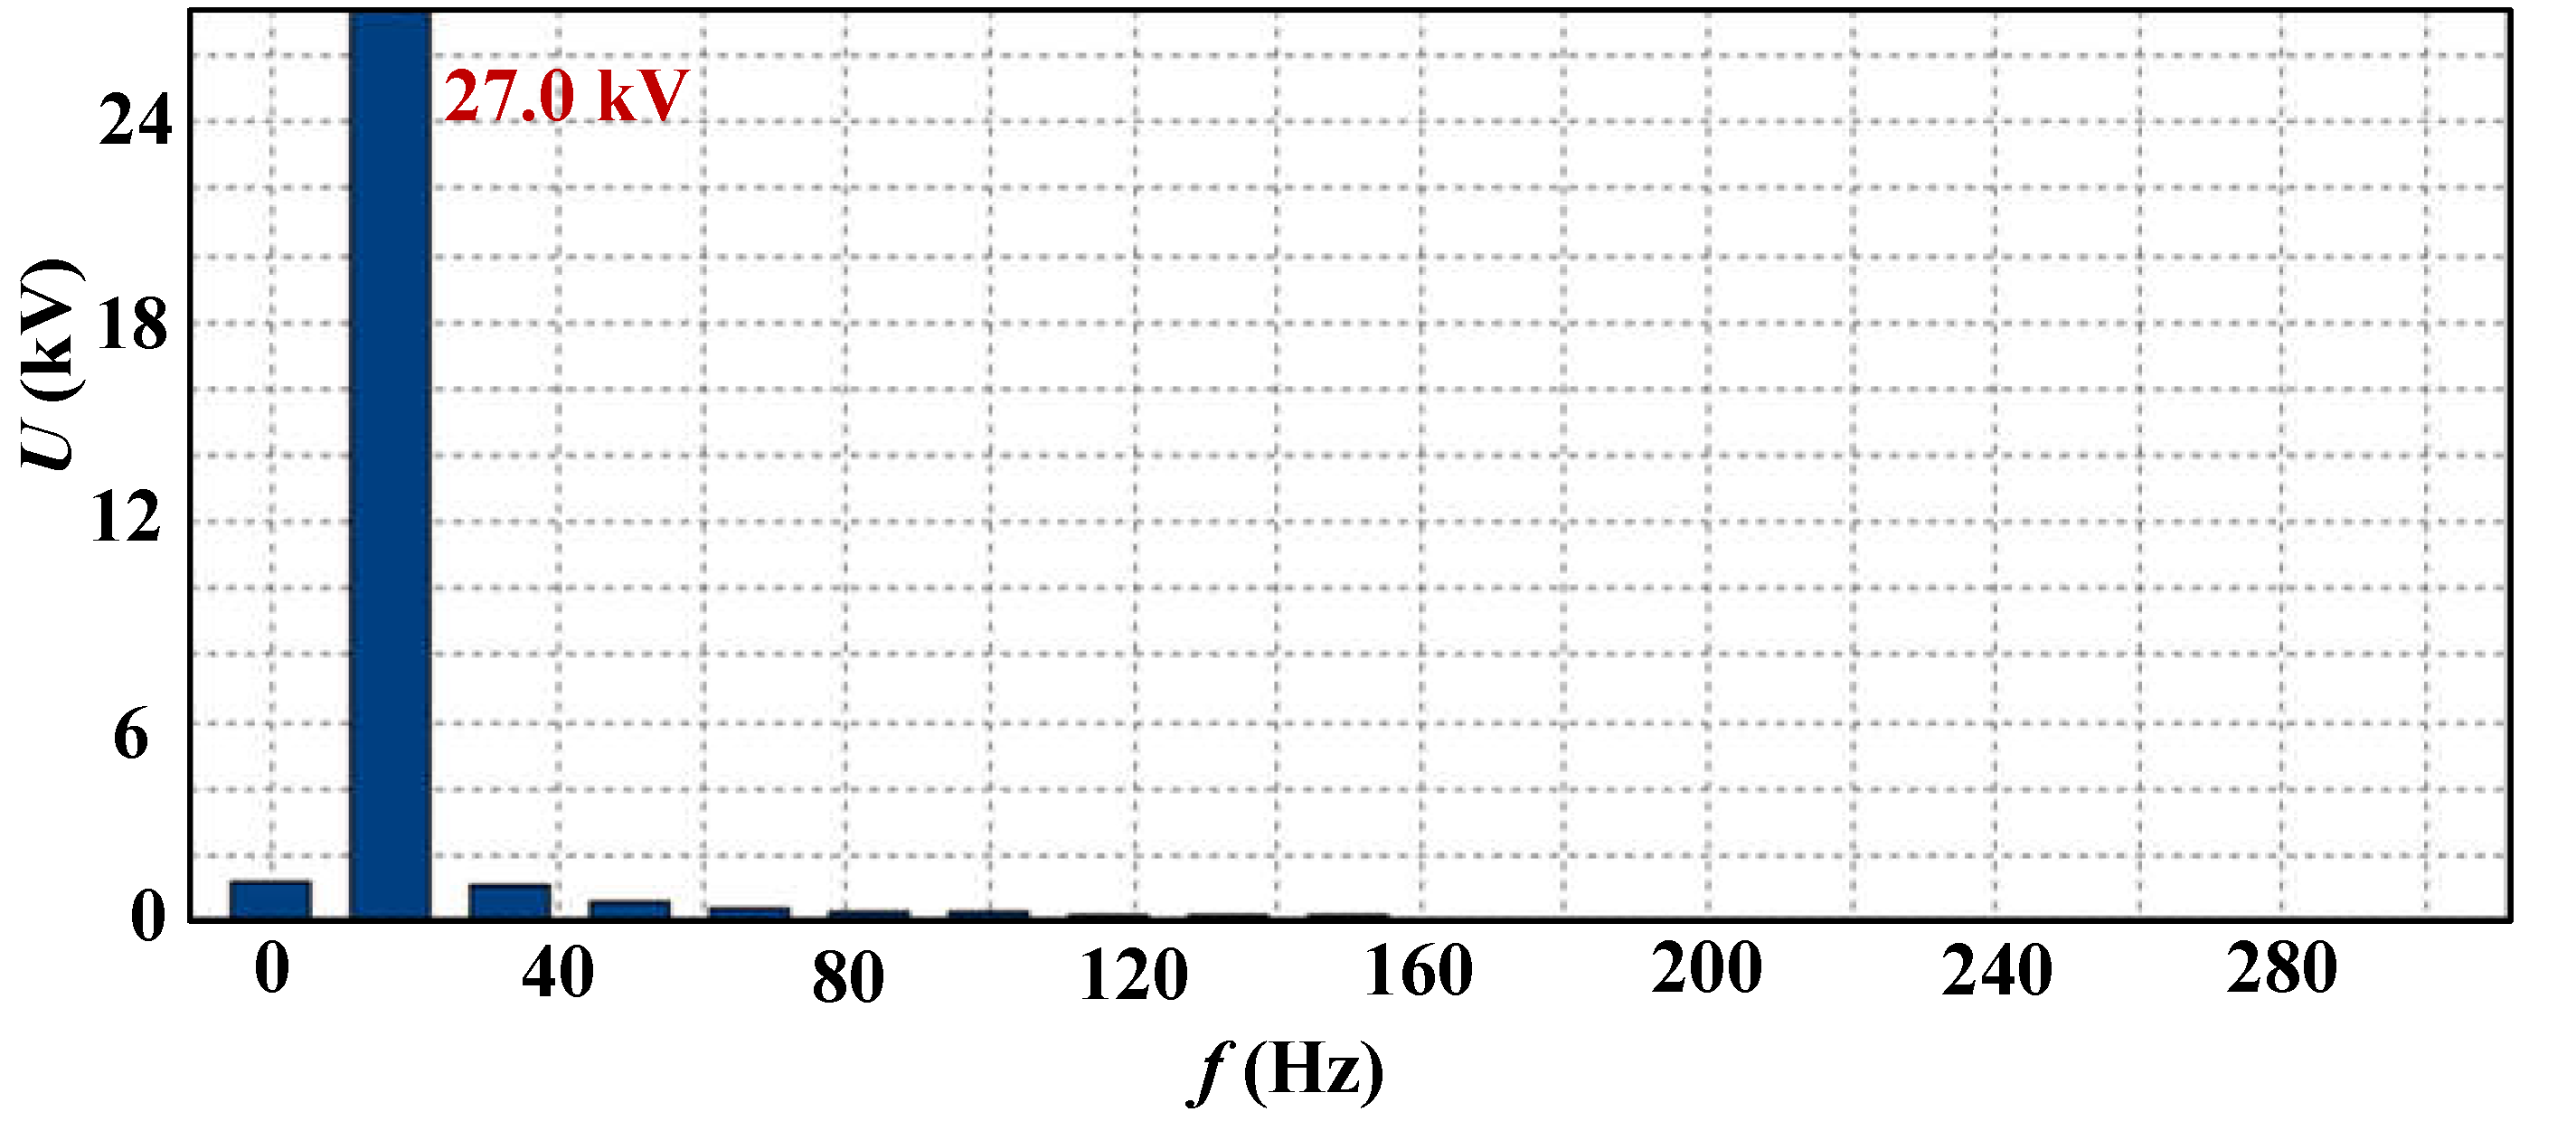
The frequency spectrum of the low–frequency oscillation line voltage in the neutral zone is analyzed, taking 50Hz as the fundamental frequency. When the low–frequency oscillation phenomenon occurs, the contact line voltage in the neutral zone is mainly 1/3 power frequency (16.7Hz) harmonics. Figure 9 shows the spectrum analysis graph of the simulation waveform of abnormal line voltage in the neutral zone area.
In the simulation, the low–frequency oscillation voltage waveform is a periodic oscillation waveform, and there is no non–periodic oscillation phenomenon. The occurrence of abnormal grid voltage is mainly determined by the excitation factor (p=ωE) and damping factor (q=1/RC) in the oscillation loop. When the excitation factor is a fixed value, increasing the capacitance or resistance value can reduce the damping factor, which may cause malfunction in the oscillation circuit. The method of increasing the coupling capacitance between the feeding section and the neutral zone is adopted to simulate the abnormal grid voltage phenomenon of the oscillation circuit, as shown in Figure 10.
The above simulation results show that:
1) The voltage in the neutral zone when the EMU entering the neutral zone is related to the phase angle at the moment when the pantograph separated with the line. If the phase angle when the pantograph separated with the line is between 60°~90° and 240°~270°, the voltage in the neutral zone is large, the maximum amplitude can reach 69.75kV, and low–frequency oscillation will occur in the neutral zone of the electrical neutral zone. The analysis shows that the process of EMU entering the neutral zone has low–frequency oscillation characteristics in the circuit of capacitor voltage and inductance current. Because the phase angle at the time of the separation of the pantograph and the line has randomness, the oscillation process is also random. Therefore, it is verified that within a certain range of power phase angle, the neutral zone will produce a higher overvoltage. The over voltage will stimulate the roof voltage transformer to produce low–frequency oscillation, indicating that the occurrence of low–frequency oscillation is related to power source phase angle when the EMU enters the neutral zone.
2) According to spectrum analysis, when low–frequency oscillation occurs, the voltage of the contact line in the neutral zone is mainly 1/3 power frequency (16.7 Hz) harmonics. This is the same as the frequency characteristics of the measured case of low–frequency oscillation when EMU passes the neutral zone. This match verifies the accuracy of the simulation model.
3) The simulation waveform of the low–frequency oscillation voltage in the neutral zone of the EMU is a periodic oscillation waveform, and there is no non–periodic oscillation. If the length of the feeding section is appropriately increased or the coupling capacitance in the neutral zone is changed, the low–frequency oscillation line voltage in the neutral zone can be slightly suppressed.

3.3. Methods of Suppressing Oscillation Process

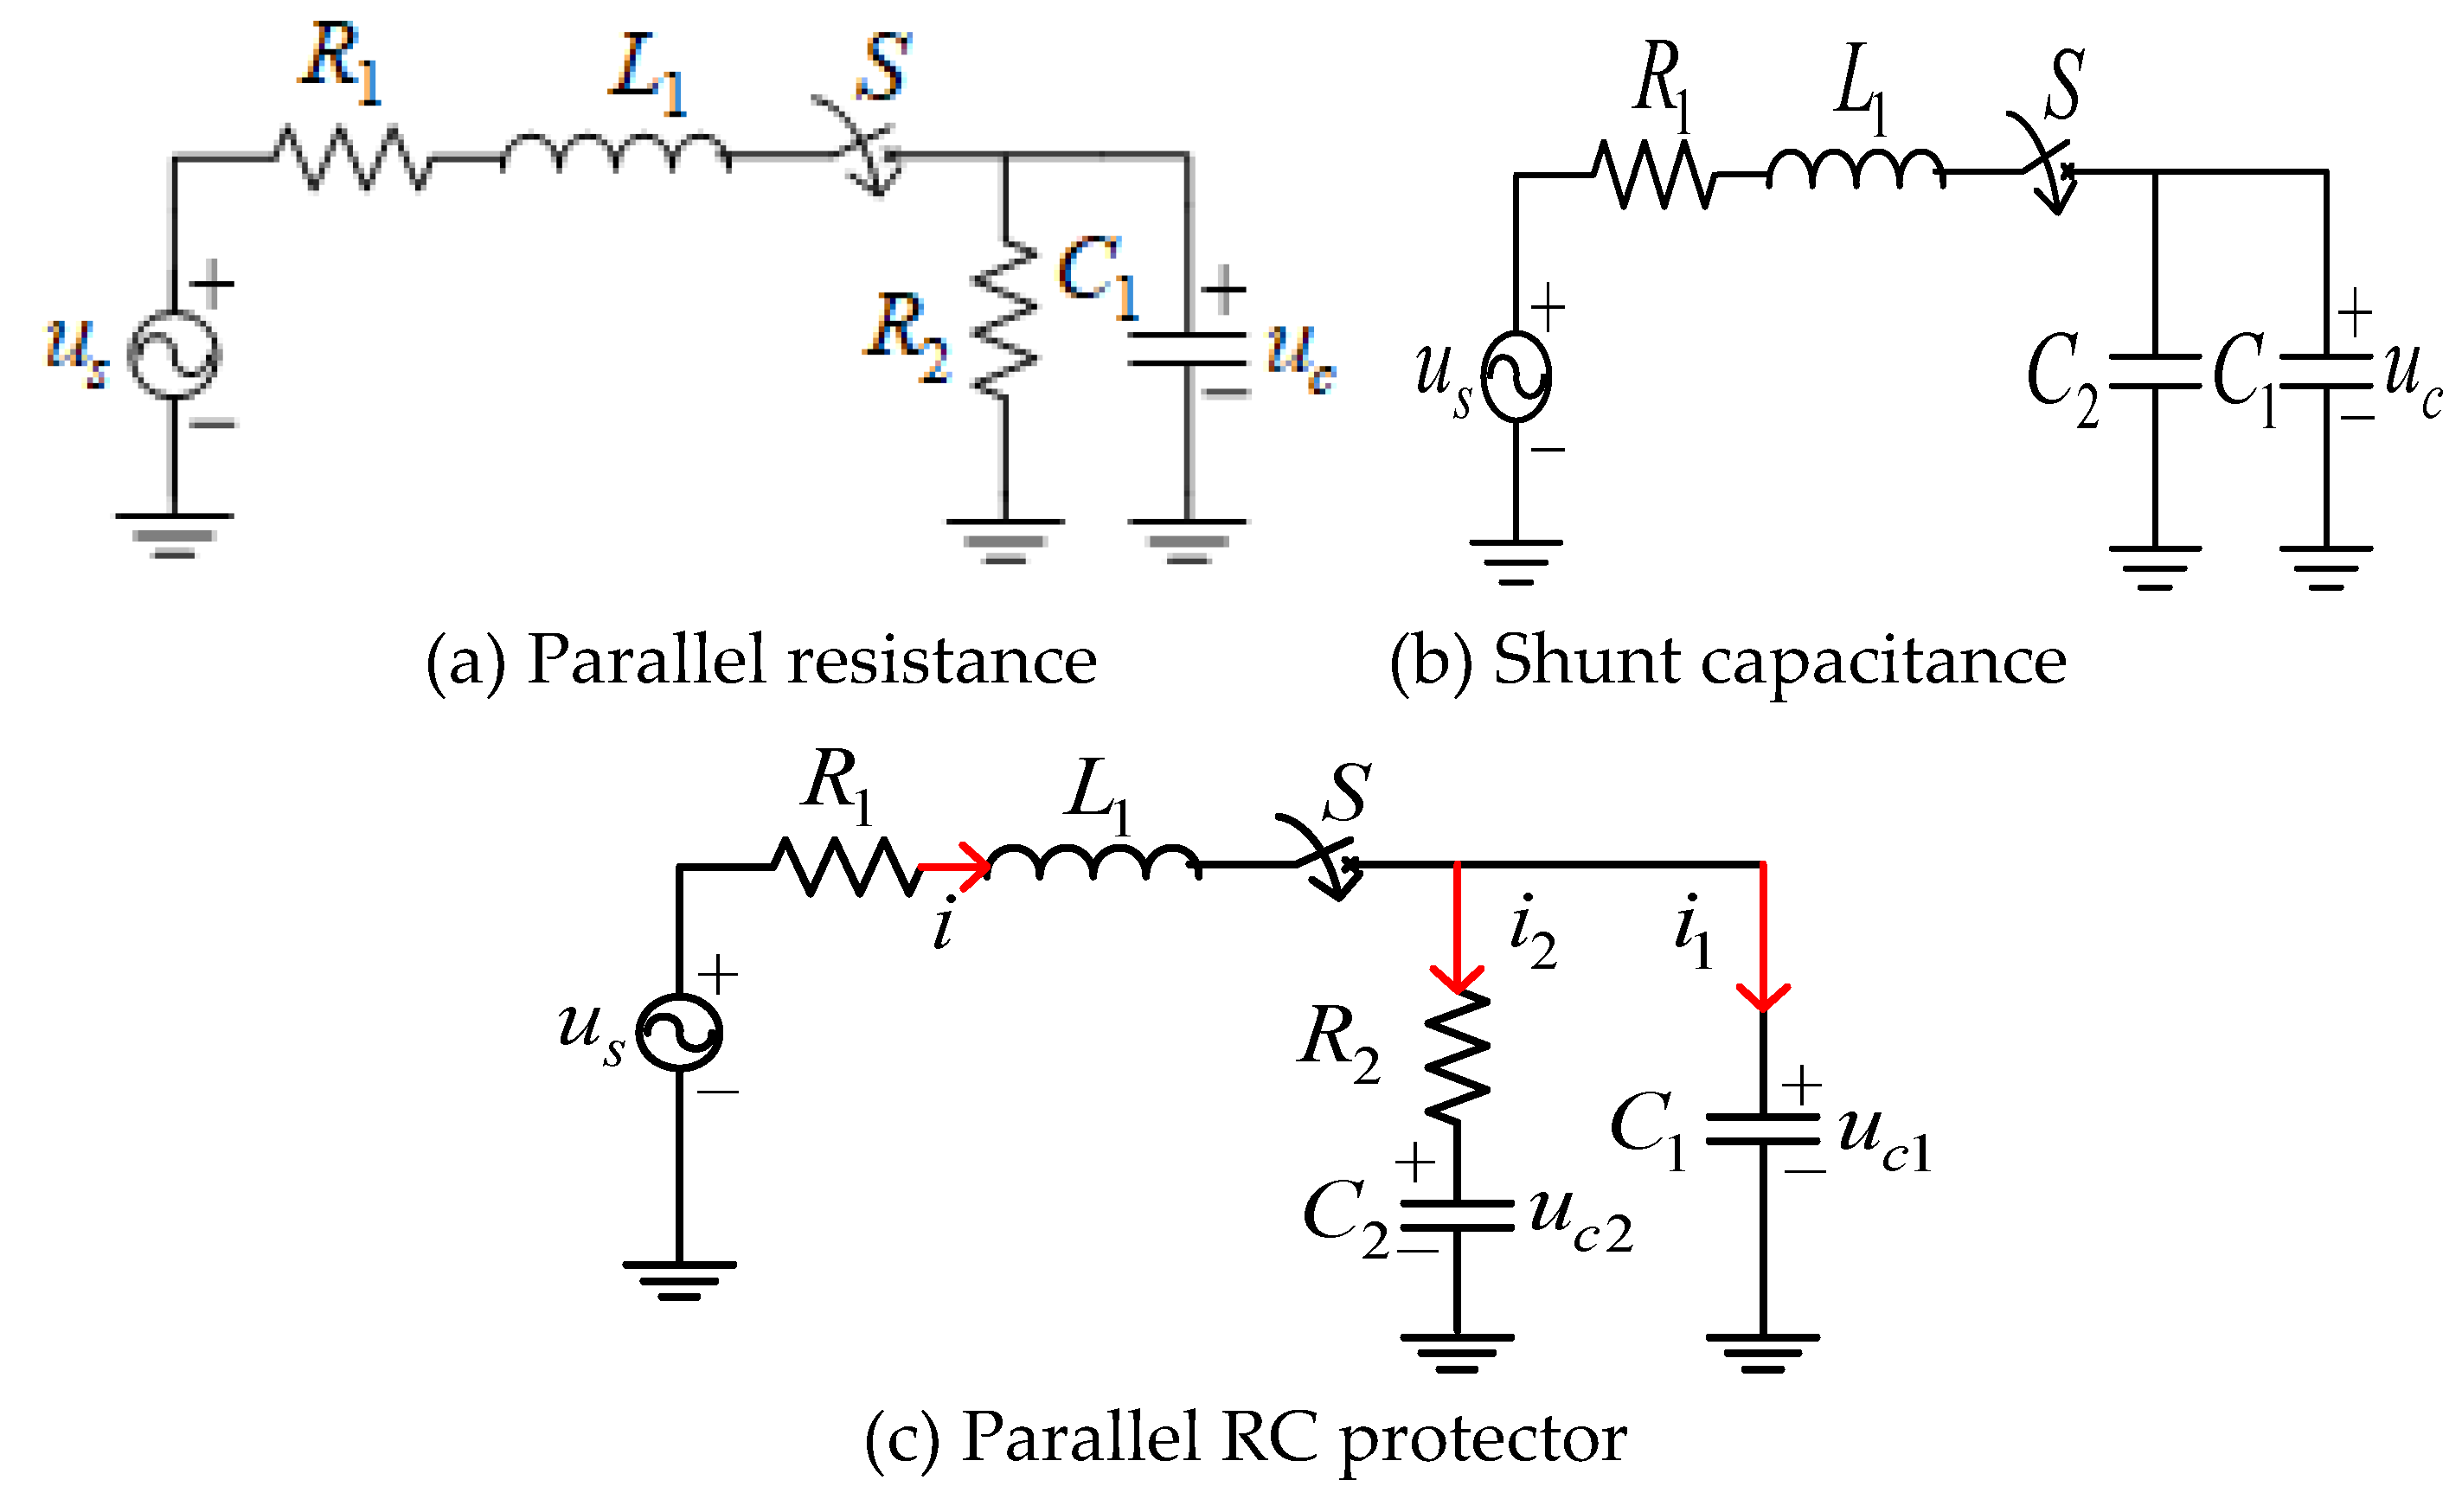
As shown in Figure 10, R1 and L1 are the equivalent impedance of the contact line power supply, C1 is the equivalent capacitance of the traction power system, R2 and C2 represent the resistance and capacitance in the protection device, respectively. Figure 11(a) only considers the case of parallel resistance. Analysis of this second–order circuit shows that the increase in parallel resistance reduces the damping of the system, and the overvoltage value decreases. Figure 11(b) only considers the case of parallel capacitors. The same analysis of the second–order circuit shows that the parallel capacitors increase the damping of the system and reduce the overvoltage value. The following equation mainly analyzes the situation in Figure 11(c). After the switch S is closed, the differential equation about the capacitor voltage uc1 can be listed:
R 1 ( i 1 + i 2 ) + L d ( i 1 + i 2 ) d t + u C 1 ( t ) = u S ( t )
R 2 i 2 + u C 2 = u C 1
i 1 = C 1 d u C 1 d t
i 2 = C 2 d u C 2 d t
Using Laplace transform, we can obtain:
Φ ( s ) = u C 1 ( s ) u s ( s ) = 1 + R 2 C 2 s L R 2 C 1 C 2 s 3 + ( L C 1 + L C 2 + R 1 R 2 C 1 C 2 ) s 2 + ( R 1 C 1 + R 1 C 2 + R 2 C 2 ) s + 1
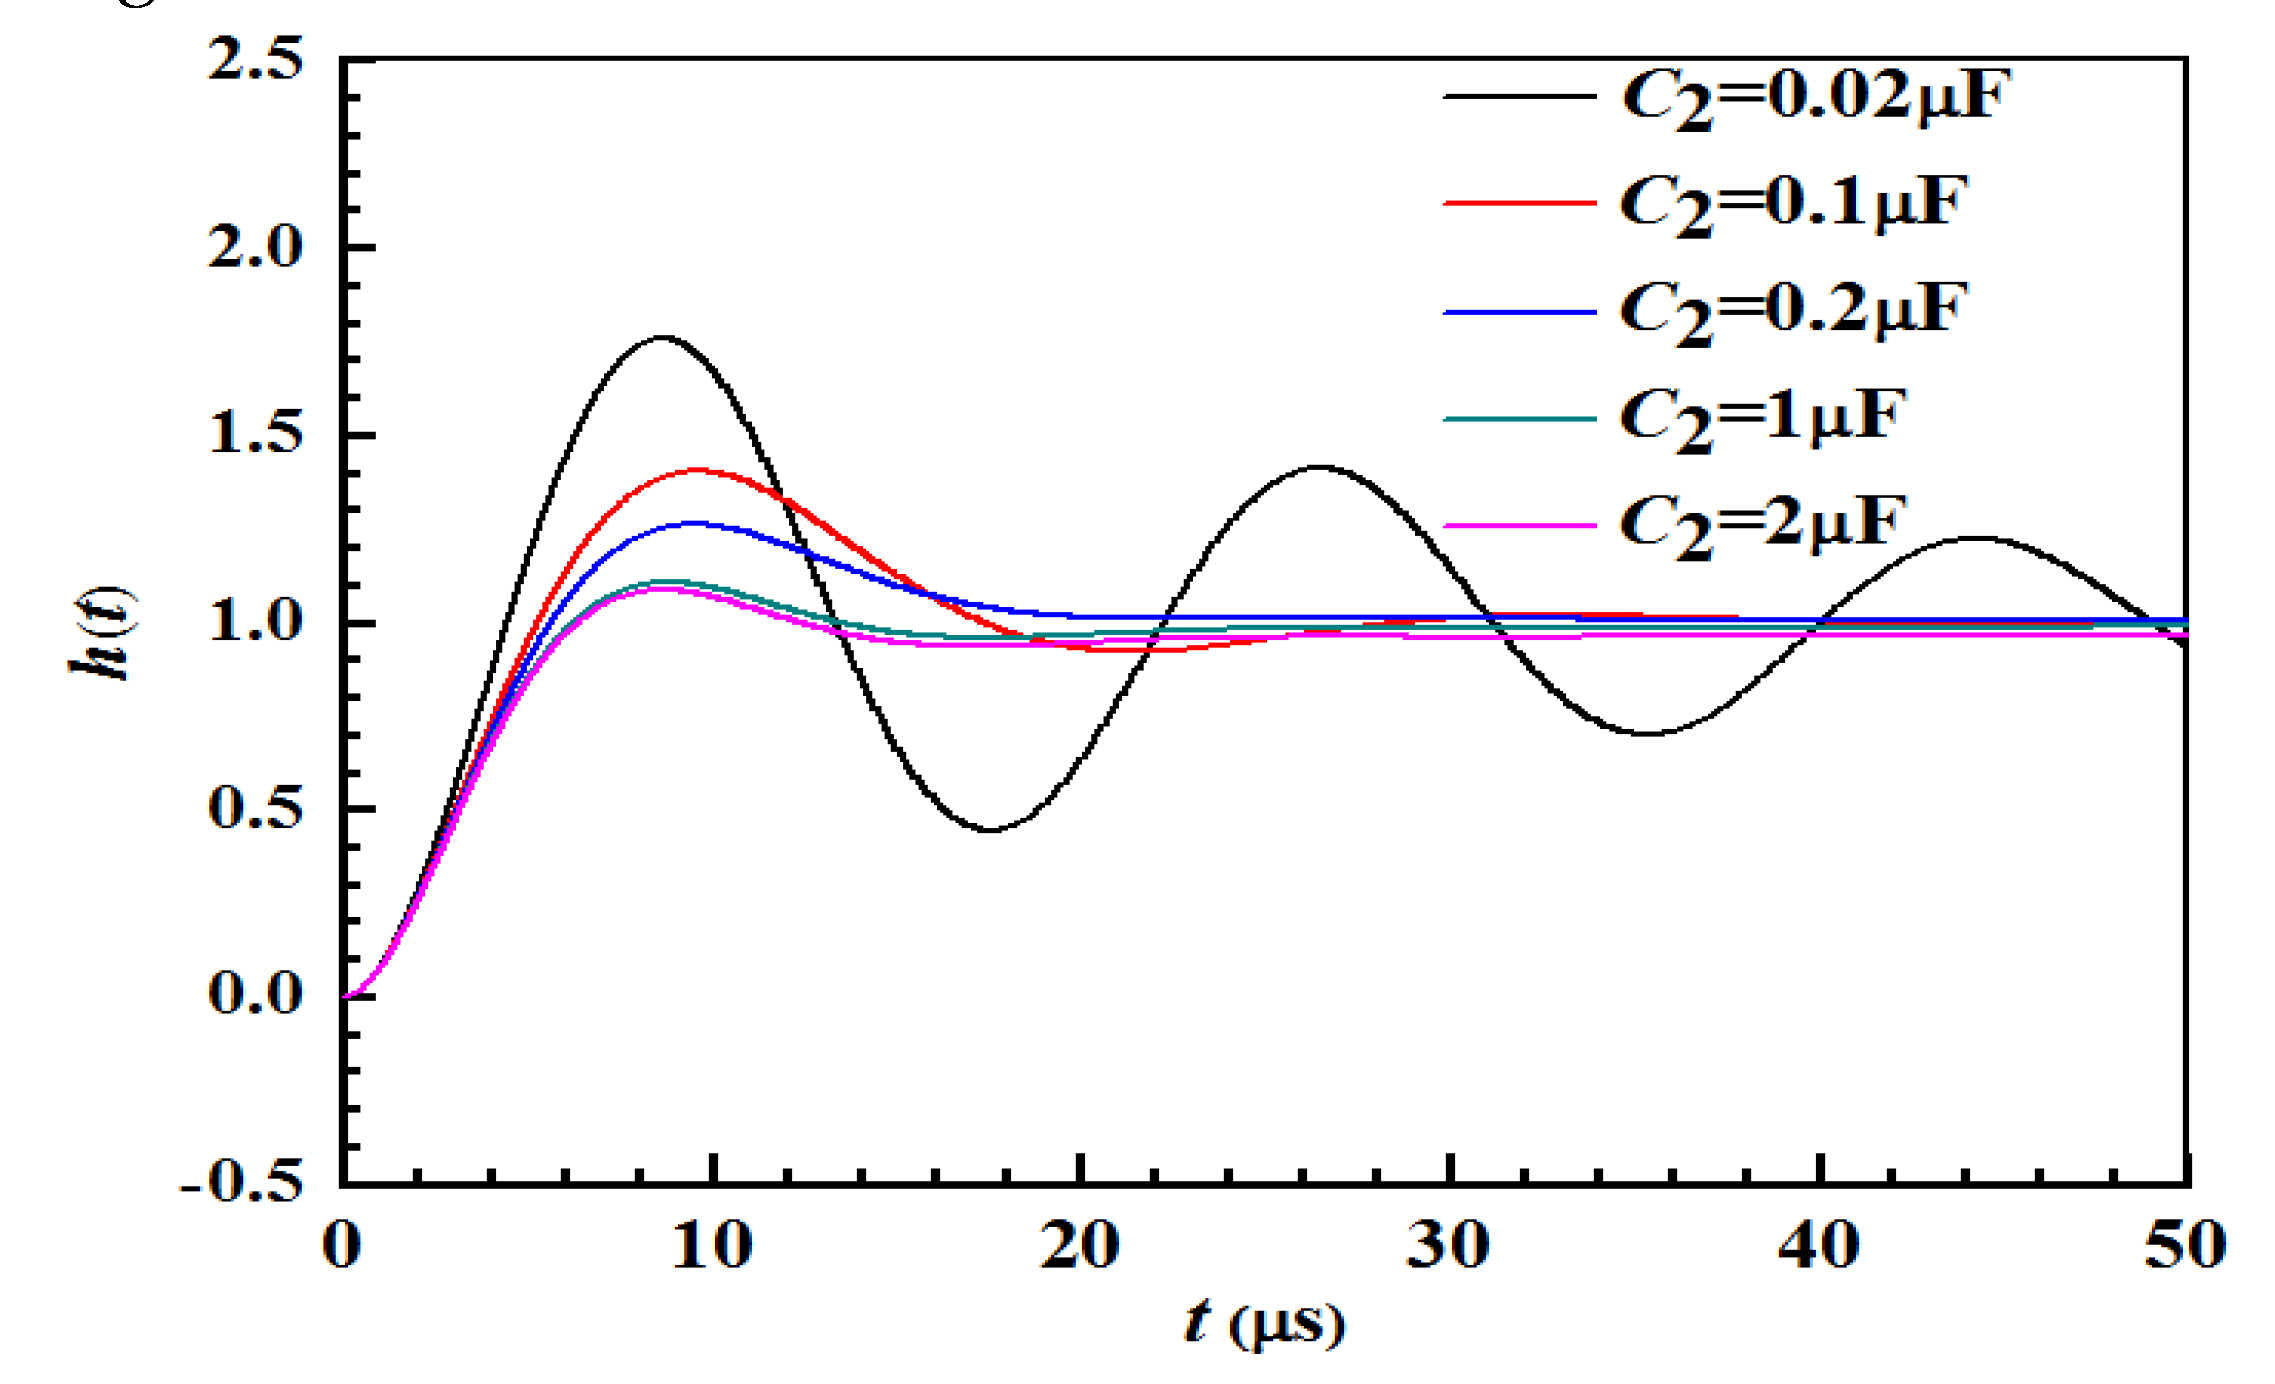
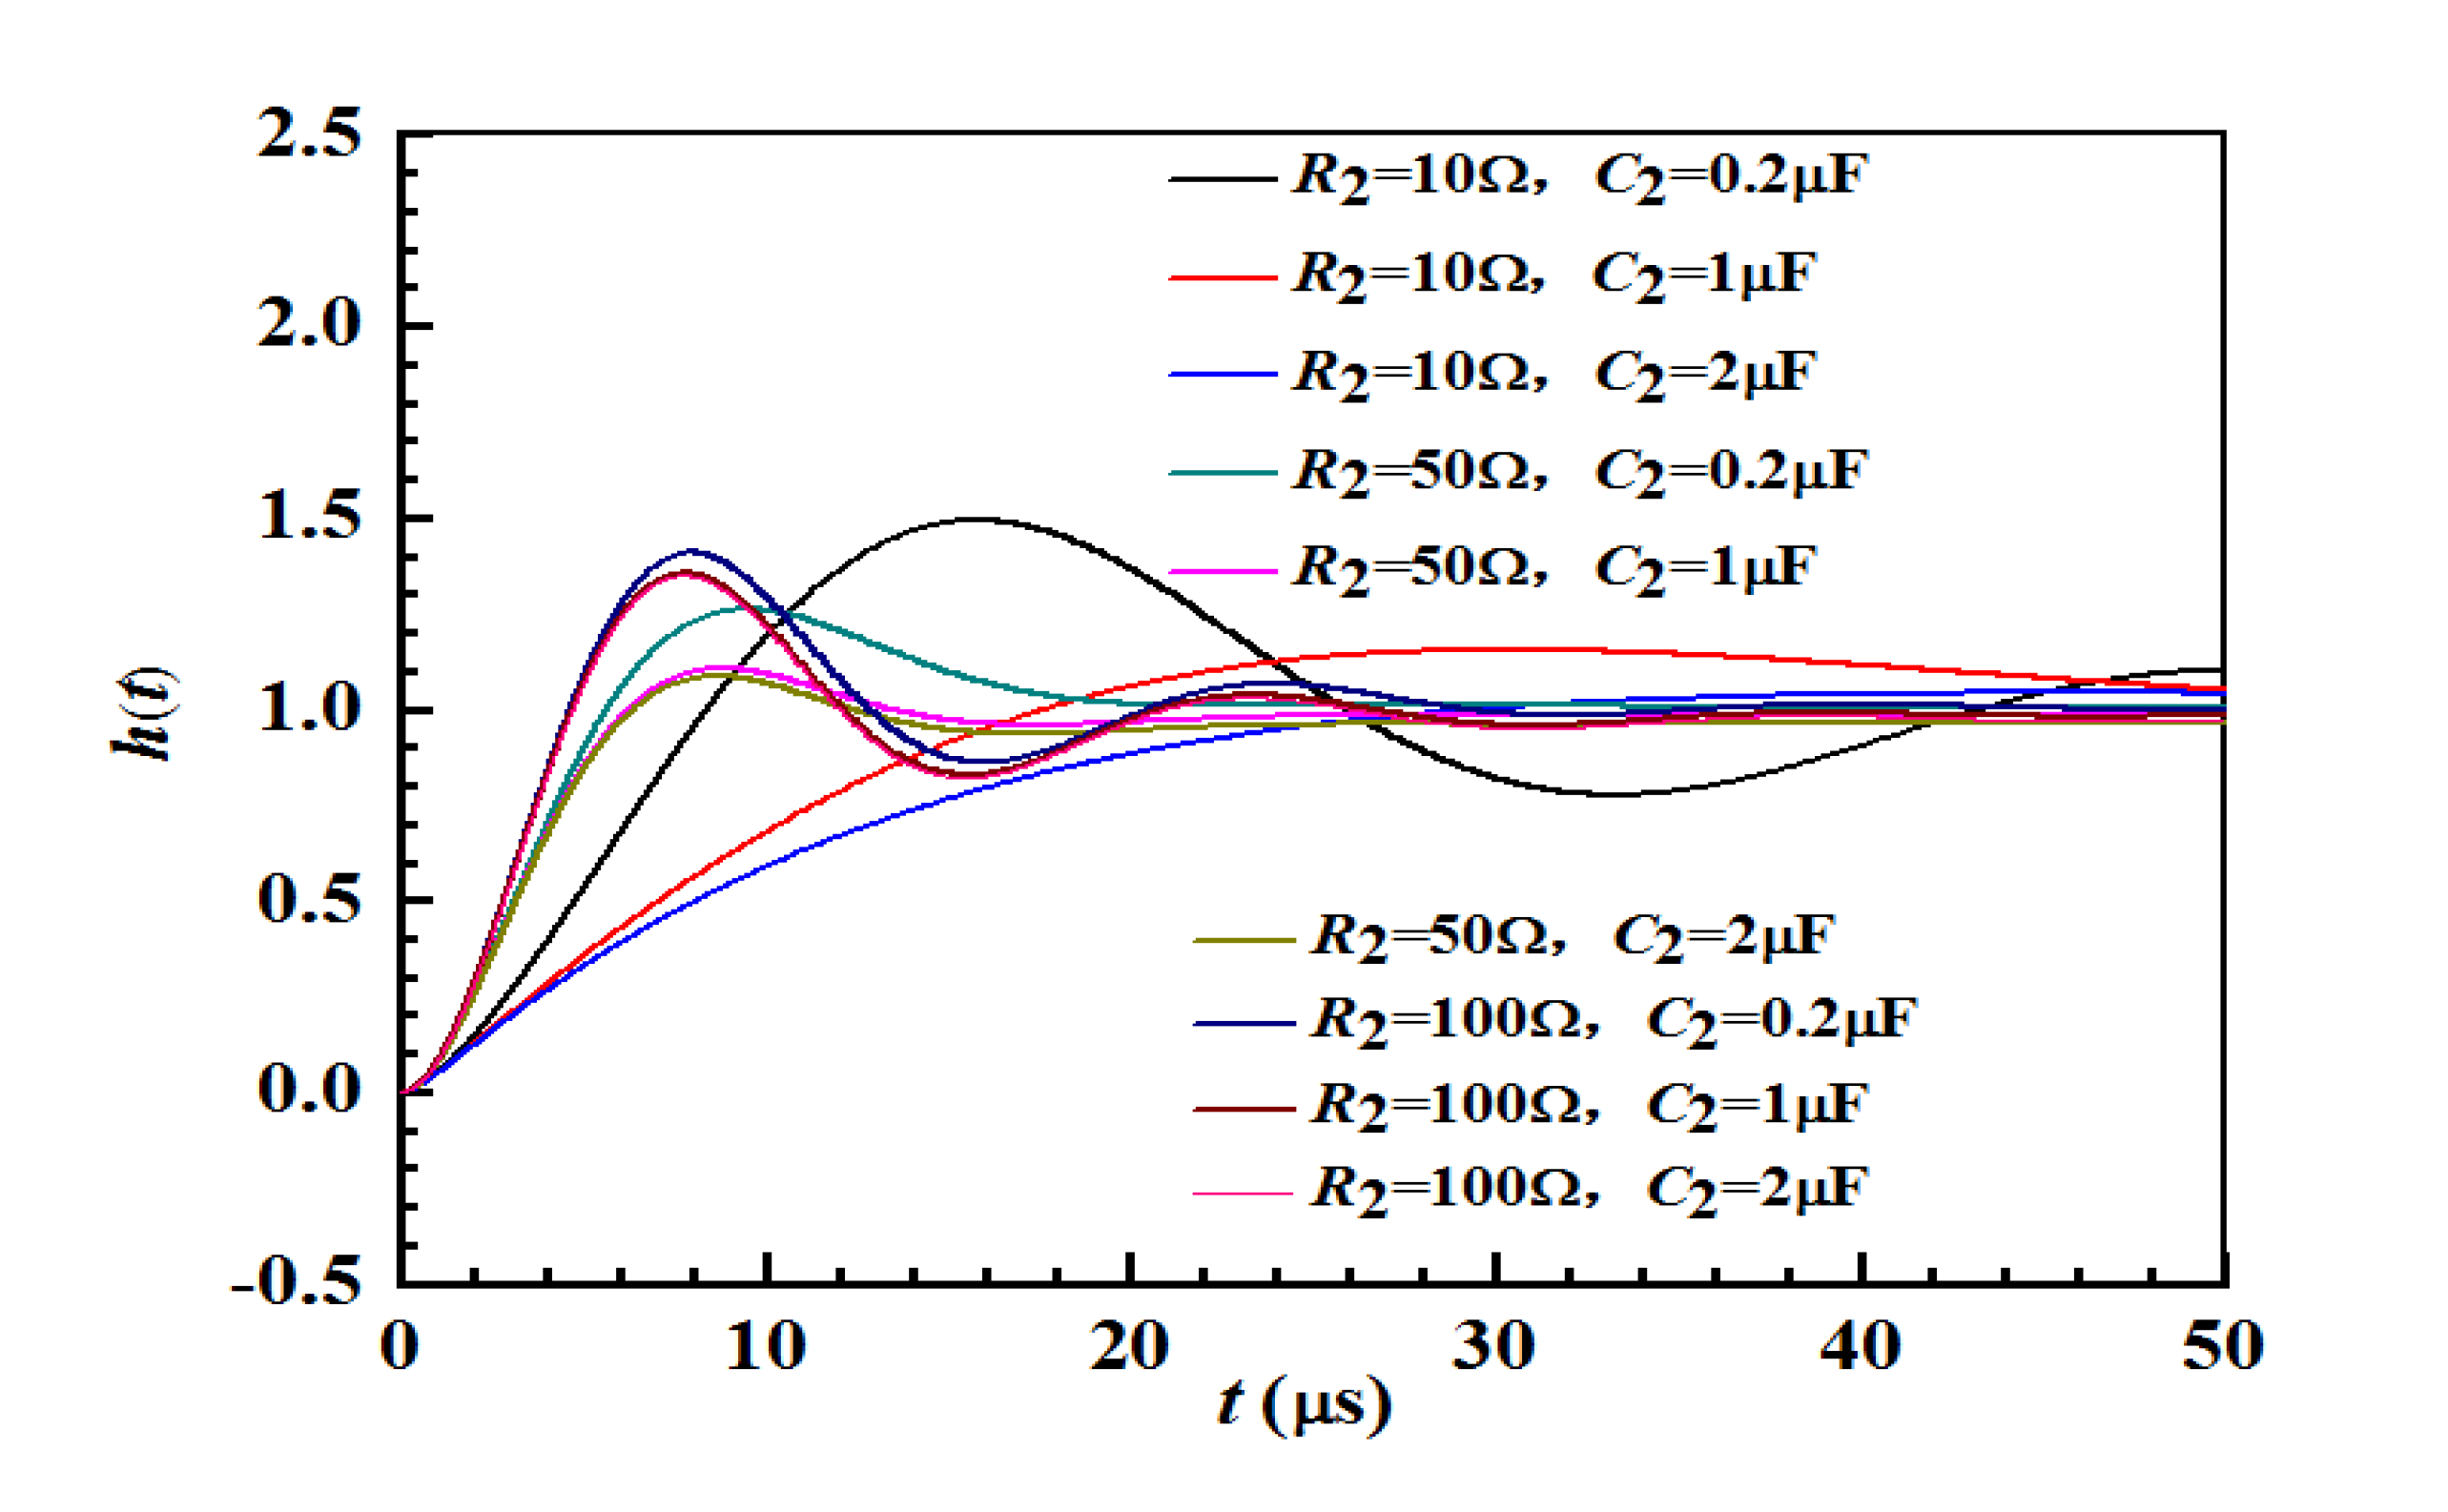
MATLAB is used to analyze the unit step response of the transfer function, and the results are shown in Figure 12 to Figure 13.
According to the low frequency oscillation excitation characteristic test of the voltage transformer, the equivalent circuit of the neutral zone after installing RC protection device is shown in Figure 13. The transient process of the EMU passing the neutral zone is simulated with PSCAD/EMTDC software, and the simulation model is shown in Figure 14.
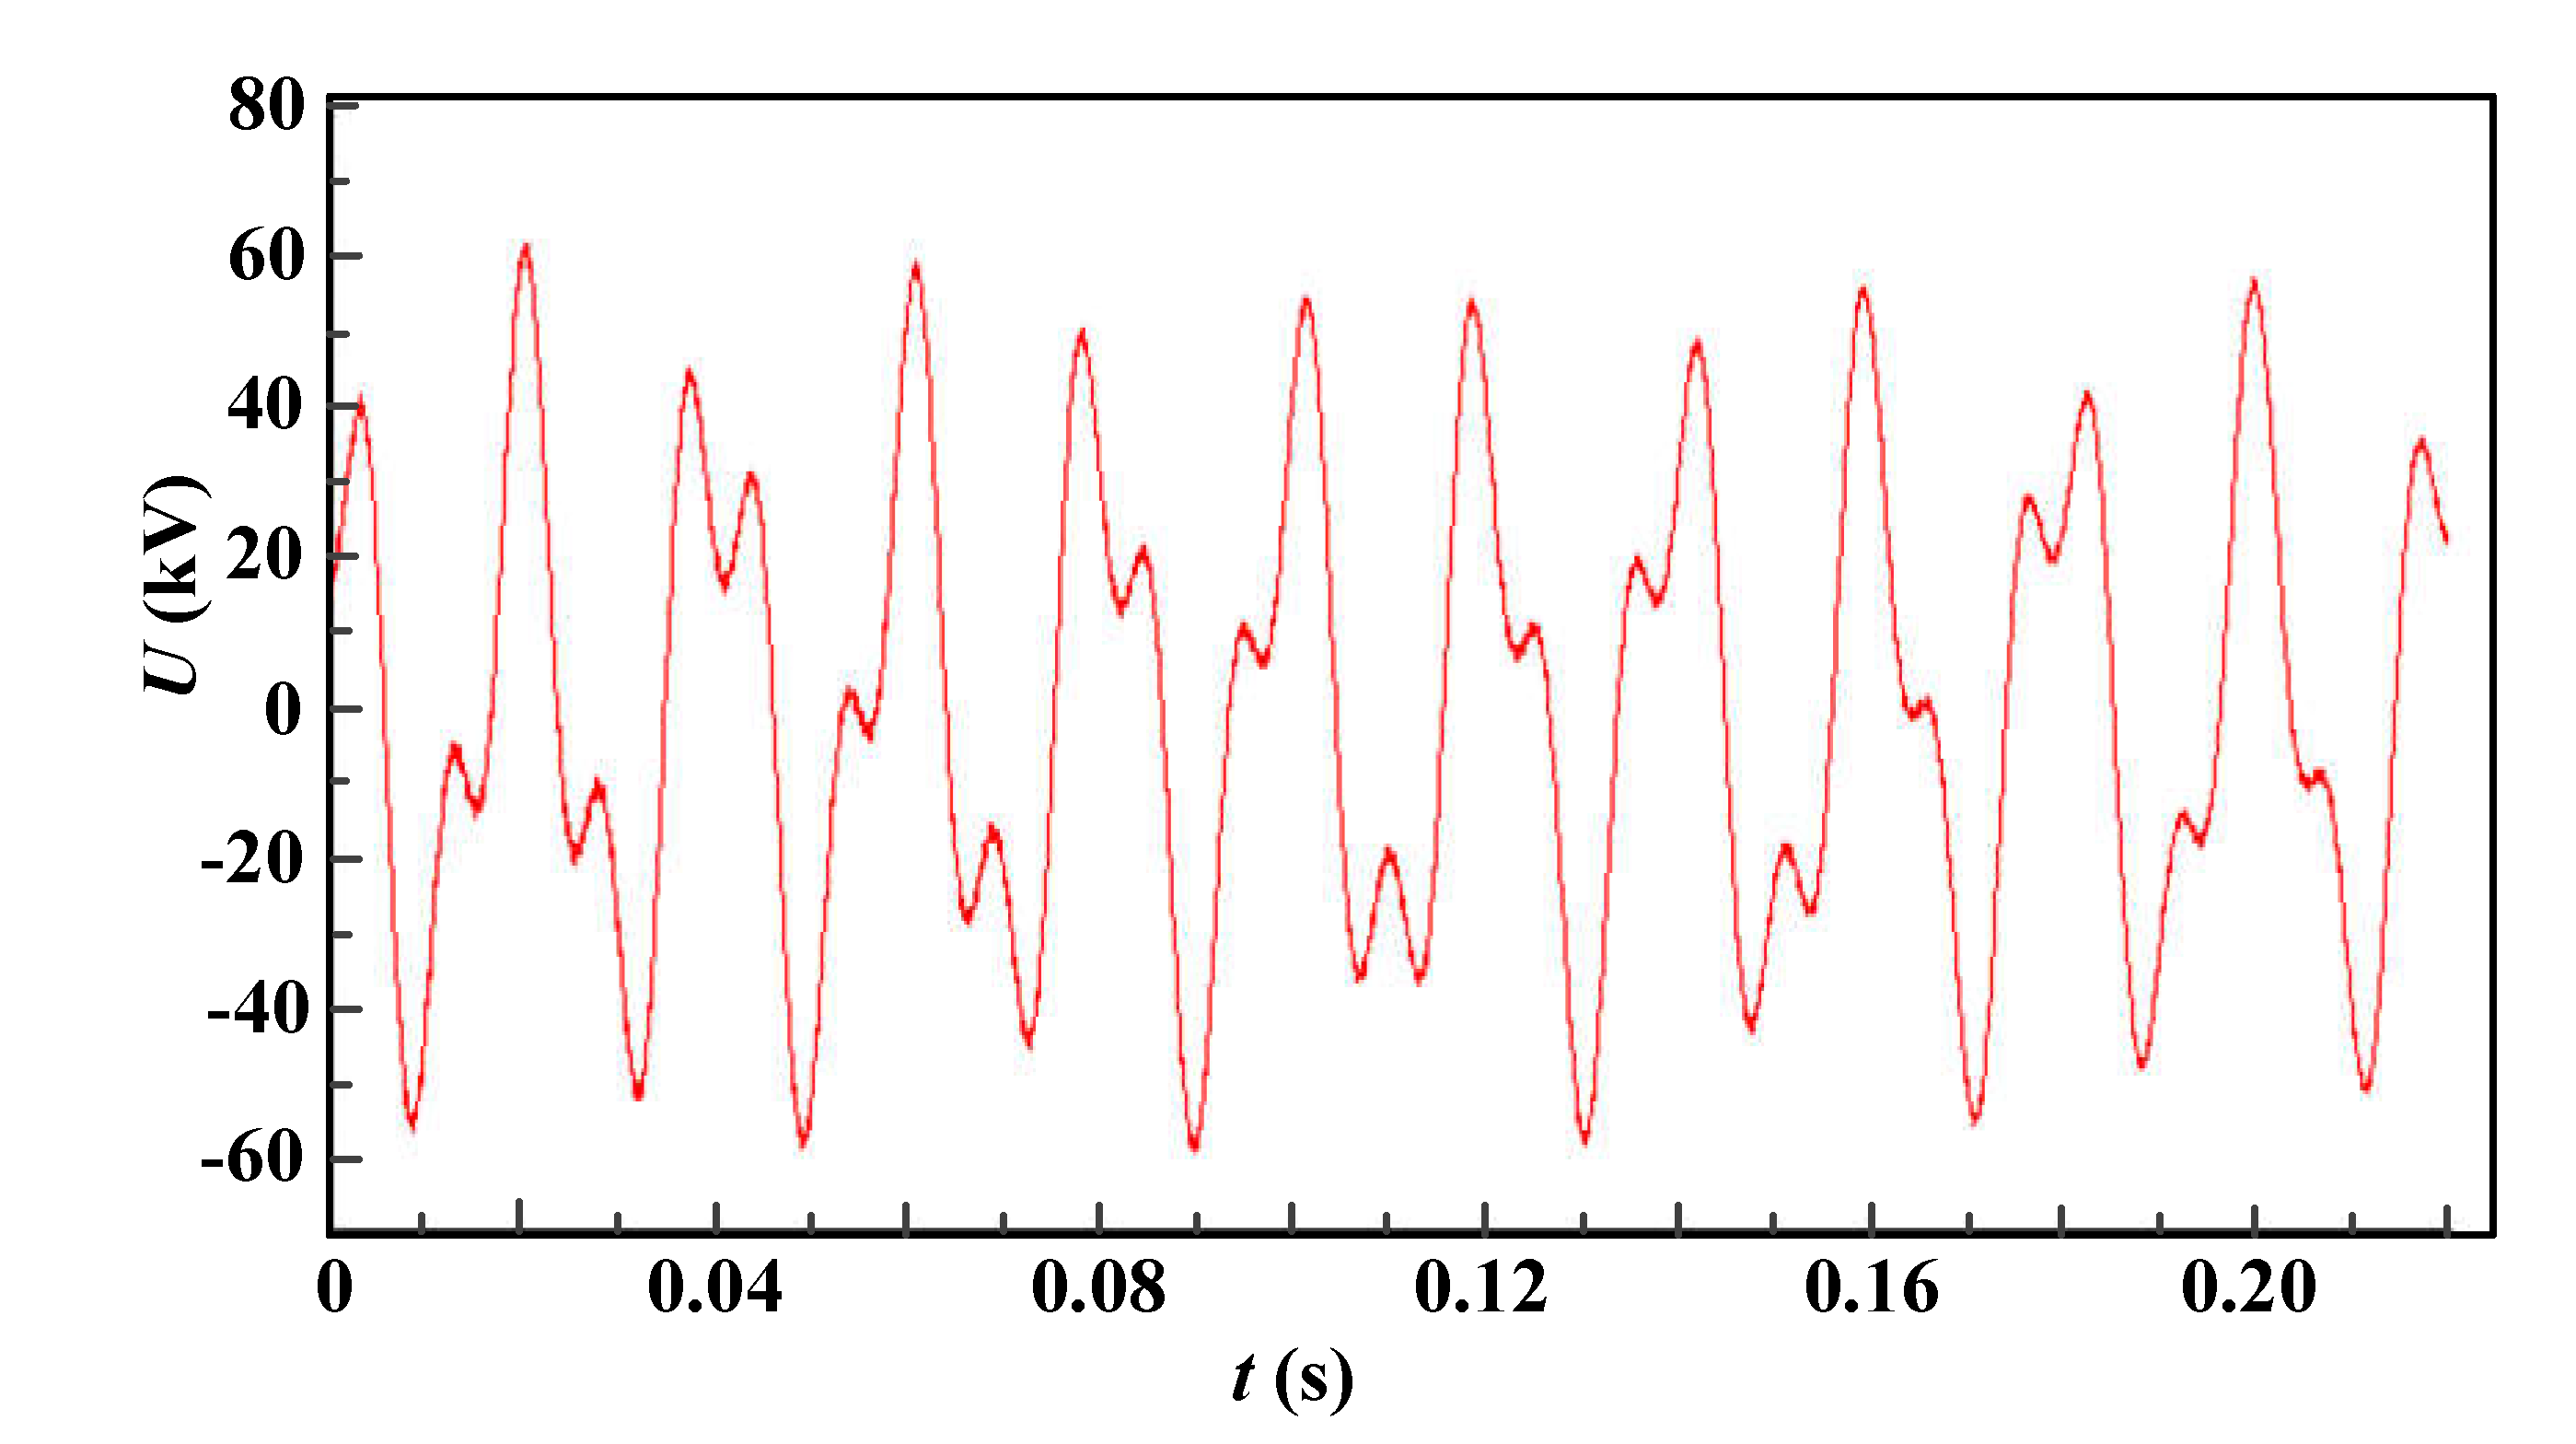
Under the same simulation conditions as the original low–frequency oscillation, an RC device was installed in the neutral zone, and the voltage waveform of the contact line in the neutral zone is shown in Figure 15.
It can be seen from the simulation waveform that after the suppression device is installed, when the EMU enters the electrical neutral zone and the time–controlled switch in the simulation model is closed, the absolute value of the voltage peak drops to below 20 kV. Compared with the situation without the suppression device, the absolute value of the peak voltage has been reduced by nearly 30%, and the low frequency oscillation has been effectively suppressed. In the simulation, the equivalent circuit of the RC protection device connected in parallel to the roof voltage transformer or the neutral zone of the electric neutral zone is the same, and the suppression effect on the low frequency oscillation is also the same.

4. Conclusions

The article combines model calculation and field test analysis to study the mechanism of low–frequency oscillation when the EMU passes the neutral zone and proposes suppression methods. The detailed conclusions of the study are as follows:
(1)
Under normal operating conditions when the EMU enters the neutral zone, due to the opening and closing of the circuit breaker, the change of the equivalent circuit of the vehicle line leads to obvious operating overvoltage, while the neutral zone line voltage is very small. When there is an abnormal increase in the grid voltage in the neutral zone, the grid voltage waveform has obvious low frequency oscillation characteristics. When the amplitude of the oscillation voltage is obvious, it can reach 51.8kV, which is 1/3 power frequency low–frequency oscillation.
(2)
The voltage in the neutral zone of the EMU during the electrical separation is related to the power phase angle at the moment when the EMU enters the electrical neutral zone. When the phase angle of the power supply separation between the pantograph and the line is within the range of 60°~90° and 240°~270°, the voltage amplitude in the neutral zone is relatively large, and the maximum amplitude can reach 69.75kV. Low–frequency oscillation will also occur in the neutral zone. When low–frequency oscillation occurs, the contact line voltage in the neutral zone is mainly 1/3 power frequency (16.7 Hz).
(3)
After installing the RC suppression device in the neutral zone, when the EMU enters the electrical neutral zone, the absolute value of the voltage peak drops to below 20 kV. Compared with the case where the suppression device is not connected, the absolute value of the voltage peak is reduced by nearly 60%. And the low–frequency oscillation phenomenon can be effectively suppressed.

Author Contributions

Conceptualization, J.S.; Investigation, J.S.; Writing—original draft, J.S., K.H., Y.F., J.L., S.Y. and Y.Z.; Writing—review & editing, J.S., K.H., Y.F., J.L., S.Y. and Y.Z. All authors have read and agreed to the published version of the manuscript.

Funding

This work was supported by Fundamental Research Funds for the Central Universities (2021JBM025), the National Natural Science Foundation of China (51907003) and Science and Technology Project of National Energy Group (SHTL–21–08).

Data Availability Statement

The data in the paper is availability and can be posted by Preprint.org.

Acknowledgments

The authors would like to thank reviewers for their pertinent comments that helped to improve the quality of this paper.

Conflicts of Interest

The authors have no conflict whither in the research field or to post the paper on Preprint.org.

References

  1. Chen L, Lu X, Min Y, et al. Optimization of governor parameters to prevent frequency oscillations in power systems. IEEE Transactions on Power Systems 2018, 33, 4466–4474. [Google Scholar] [CrossRef]
  2. Chen G, Tang F, Shi H, et al. Optimization strategy of hydro–governors for eliminating ultra–low frequency oscillations in hydro–dominant power systems. IEEE Journal of Emerging and Selected Topics in Power Electronics, 2017, 6, 1086–1094. [Google Scholar]
  3. Demello F P, Koessler R J, Agee J, et al. Hydraulic turbine and turbine control models for system dynamic studies. IEEE Transactions on Power Systems, 1992, 7, 167–179. [Google Scholar] [CrossRef]
  4. Yu X, Zhang J, Fan C, et al. Stability analysis of governor turbine hydraulic system by state space method and graph theory. Energy 2016, 114, 613–622. [Google Scholar] [CrossRef]
  5. Liu Z, Yao W, Wen J, et al. Effect analysis of generator governor system and its frequency mode on inter–area oscillations in power systems. Int J Elect Power Energy Syst, 2018, 96, 1–10. [Google Scholar] [CrossRef]
  6. Schleif F R, Martin G E, Angell R R, et al. Damping of system oscillations with a hydrogenerating unit. IEEE Transactions on Power Apparatus and Systems, 1967, 86, 438–442. [Google Scholar]
  7. Martinez JA, Mork BA. Transformer Modeling for Low– and Mid–Frequency Transients—A Review. IEEE Transactions on Power Delivery. 2005, 20, 1625–1632. [Google Scholar] [CrossRef]
  8. Leon F, Farazmand A, Joseph P. Comparing the T and pi Equivalent Circuits for the Calculation of Transformer Inrush Currents. IEEE Transactions on Power Delivery. 2012, 27, 2390–2398. [Google Scholar] [CrossRef]
  9. Jazebi S, Zirka SE, Lambert M, Rezaei–Zare A, Chiesa N, Moroz Y, et al. Duality Derived Transformer Models for Low–Frequency Electromagnetic Transients—Part I: Topological Models. IEEE Transactions on Power Delivery. 2016, 31, 2410–2419. [Google Scholar] [CrossRef]
  10. Mork BA, Gonzalez F, Ishchenko D, Stuehm DL, Mitra J. Hybrid Transformer Model for Transient Simulation—Part I: Development and Parameters. IEEE Transactions on Power Delivery. 2007, 22, 248–255. [Google Scholar] [CrossRef]
  11. Monteiro TC, Martinz FO, Matakas L, Komatsu W. Transformer Operation at Deep Saturation: Model. M: Transformer Operation at Deep Saturation.
  12. and Parameter Determination. IEEE Transactions on Industry Applications. 2012, 48, 1054–1063.
  13. Casoria S, Sybille G, Brunelle P. Hysteresis modeling in the MATLAB/Power System Blockset. Mathematics and Computers in Simulation. 2003, 63, 237–248. [Google Scholar] [CrossRef]
  14. Moses PS, Masoum MAS, Toliyat HA. Dynamic Modeling of Three–Phase Asymmetric Power Transformers With Magnetic Hysteresis: No–Load and Inrush Conditions, IEEE Transactions on Energy Conversion. 2010, 25, 1040–1047.
  15. Hassani V, Tjahjowidodo T, Do TN. A survey on hysteresis modeling, identification and control. Mechanical Systems and Signal Processing. 2014,49(1–2):209–233.
  16. Leite Jv, Benabou A, Sadowski N, da Luz Mvf. Finite Element Three–Phase Transformer Modeling Taking Into Account a Vector Hysteresis Model, IEEE Transactions on Magnetics. 2009, 45 (3): 1716 – 1719.
  17. Sun J, Mehrotra V. Orthogonal winding structures and design for planar integrated magnetics, In: Proc IEEE APEC; USA: Anaheim 2004, 933 – 938.
  18. Sun Y, Zheng W, Xu, W, A new method to model the harmonic generation characteristics of the thyristor controlled reactors, Proceedings of the Power Tech, Lausanne, 1–5 July, 2007, New York: IEEE, 2007, 1785–1790.
  19. TYLAVSKY D J, BROWN K A,MA T T Closed form solution for underground impedance calculations, Proceedings of the IEEE, 1986, 74, 1290–1292.
  20. TYLAVSKY D, J. Conductor impedance approximations for deep underground mines, IEEE Transactions on Industry Applications, 1987, 23, 723–730.
  21. WAITJR, Quasi–Static Limit for the Propagating Mode along a Thin Wire in a Circular Tunnel, IEEE Transactions on Antennas and Propagation, 1977, 25, 441–443.
  22. Zhou Hongyi,Liu Zhigang,Cheng Ye,et al.Extended black–box model of pantograph arcing considering varying pantograph detachment distance, Proceedings of 2017 IEEE Transportation Electrification Conference and Expo, Asia–Pacific. Harbin: IEEE, 2017.
  23. Liu Y J, CHang G W, Huang H M. Mayr’s equation–based model for pantograph arc of high–speed railway traction system, IEEE Transactions on Power Delivery, 2010, 25, 2025–2027.
  24. Qu Zhijian, Liu Yuxin, Zhou Min, et al. Over–voltage suppression of electric railway articulated neutral insulator, Advanced Materials Research, 2013, 791–793, 1837–1840.
  25. Wang Ying, Liu Zhigang, Mu Xiuqing, et al. Research on electromagnetic transient process in articulated split–phase insulator of high–speed railway considering viaduct’s electrical coupling, International Transactions on Electrical Energy Systems, 2017, 27, e2376.
  26. Zhang Ruifeng, Bai Yihui, Huang Ruyun, Fu Yu. Cause Analysis and preventive measures of low frequency oscillation in power supply side of power supply terminal, Guizhou Electric Power Technology. 2013, 16, 15–17.
  27. Wang Yun, Chang Peak, Chang Xi, Guo Xiaolong. Study on the key technology of identifying the type of low frequency oscillation and locating the disturbance source in power grid, Xinjiang Electric Power Technology. 2015,2:1–7.
  28. Li Yanghai, Pan Jian, Yang Tao, Huang Shuhong, Gao Wei. Status and development of low frequency oscillation monitoring and suppression technology in Power Grid. Hubei Electric Power. 2014, 38, 8–16. [Google Scholar]
  29. Zhang Xinyu, Chen Jie, Zhang Gang, Wang Lei, Qiu Ruichang, Liu Zhigang. An active oscillation compensation method to mitigate high–frequency harmonic instability and low–frequency oscillation in railway traction power supply system, IEEE. 6:70359–70367.
  30. Chen Feng, Yang Xiaonan, Liu Liang, Ma Xiaochen, Zhang Lei, Yu Yiping. Study on the influence of HVDC to low frequency oscillation in interconnected power system[C]. 2018 2nd IEEE Conference on Energy Internet and Energy System Integration (EI2), Beijing, China, 2018, 1–5.
  31. Fan Lingling, Li Naihu, Wang Haifeng. Analysis of low frequency oscillation of damping power system with controllable series capacitor compensation device, Power Grid Technology, 1998, 22, 35–39.
  32. Zhang Fang, Fang Dazhong, Song Wennan, Chen Jiarong. Study on a novel two–stage control method for UPFC with damping tie–line low–frequency Oscillation. Proceedings of the twenty–one th annual conference of power system automation, 2005, 1039–1044.
  33. Li Hairong, Penk, Chen Yu, Nick Clegg, Allen Lee, Li Xialin. Analysis of low frequency oscillation mechanism of DC voltage control time scale in DC distribution system, High voltage technology, 2021, 1–16.
  34. Chen He, Huang He, Zhang Yong, Su Yinsheng. Researches on DC modulation to damp low frequency oscillation in China Southern Power Grid. IEEE Power & Energy Society General Meeting, 2015, 1–6.
  35. Gao Hongliang, Zhan Xisheng, Jiang Xiaowei, Wu Jie, Yang Qingsheng. Research on mechanism of power system low frequency oscillation based on damping coefficient, 2017 4th International Conference on Electrical and Electronics Engineering, 2017, 99–103.
  36. Yang Jie, Hu Haitao, Zhou Yi, Tao Haidong, Zhao Chaopeng, he zhengyou. Analysis of low frequency Oscillation suppression in Traction Power Supply System [ J ]. Electrified Railways, 2018, 29, 15–28. [Google Scholar]
  37. Zhou Yi, Hu Haitao, Yang Xiaowei, he zhengyou. Railway Electrification System, Chinese Journal of Electrical Engineering, 2017, 37, 72–80.
  38. Zha Wei, Yuan Yue. Mechanism of active–power–PSS low–frequency oscillation suppression and characteristic of anti–regulation[C]. 2011 Third International Conference on Measuring Technology and Mechatronics Automation, Shanghai, China, 2011, 538–541. 2011.
  39. Lu Shengyang, Zhang Wuyang, Wang Tong, Cai Yupeng, Li Huan, Zhu Tianyi, Gang Yining, Yu Yongliang. Parameter Tuning and simulation analysis of PSS function in excitation system with suppression of low frequency oscillation[C]. 2019 IEEE 8th International Conference on Advanced Power System Automation and Protection , Xi'an, China, 2019, 474–479.
  40. Pan Yiwei, Yang Yongheng, He Jinwei, Ariya Sangwongwanich, Frede Blaabjerg. Low–frequency oscillation suppressi–bregeon in series resonant dual–active–bridge converters under fault tolerant operation, 2019 IEEE energy conversion congress and exposition, Baltimore, MD, USA, 2019, 1499–1505.
  41. Zhou Yi, Hu Haitao, Lei Ke, Meng Zhaofei, he zhengyou. Low frequency constant amplitude oscillation mechanism of railway electrification system, Chinese Journal of Electrical Engineering, 2020, 1–13.
  42. Zhou Yi, Hu Haitao, Jiang Xiaofeng, he Zhengyou, Zhao Chaopeng. Study on voltage resonance of Low Frequency Power Supply Network for Traction Power Supply. Grid Technology, 2016, 40, 1830–1838. [Google Scholar]
  43. Yao Chao, Wang Xiaojun, Bi Chengjie, Zhang Yizhi, Jin Cheng. An approach to suppress low–frequency oscillation in electrification railway based on TCSC impedance control, 2018 IEEE 2nd International Electrical and Energy Conference (CIEEC), Beijing, China, 2018, 110–113.
  44. Bi Chengjie, Wang Xiaojin, Yao Chao, Pang Kexin, Jin Cheng. Analysis and evaluation of suppression methods on low–frequency oscillation in electric railways, 2018 IEEE 2nd International Electrical and Energy Conference (CIEEC), Beijing, China, 2018, pp. 56–63.
  45. Zhou Guohua, Tan Wei, Zhou Shuhan, Wang Yue, Ye Xin. Analysis of Pulse Train Controlled PCCM Boost Converter With Low Frequency Oscillation Suppression, IEEE, 2018, 6, 68795–68803.
Figure 1. Transient process of EMU passing phase division zone.
Preprints 76457 g001
Figure 2. Train operating current and voltage (RMS value).
Preprints 76457 g002
Figure 3. Train overcurrent split–phase voltage waveform.
Preprints 76457 g003
Figure 4. Harmonic frequency analysis of voltage in neutral zone.
Preprints 76457 g004
Figure 5. Structure of double–wire full parallel AT traction net.
Preprints 76457 g005
Figure 6. Equivalent circuit diagram of overphase division of EMU.
Preprints 76457 g006
Figure 7. A source, power supply line and train system simulation model.
Preprints 76457 g007
Figure 8. EMU enters the electric split–phase simulation model.
Preprints 76457 g008
Figure 9. Frequency spectrum of low–frequency oscillation network voltage in phase–separated neutral zone.
Preprints 76457 g009
Figure 10. Abnormal network pressure phenomenon in the neutral zone.
Preprints 76457 g010
Figure 11. Simple equivalent circuit diagram.
Preprints 76457 g011
Figure 12. Step response under different capacitance values (keep the resistance R2 at 200Ωunchanged).
Preprints 76457 g012
Figure 13. Step response under different resistance and capacitance.
Preprints 76457 g013
Figure 14. Equivalent circuit diagram of over–phase division of EMU. (additional RC device in the neutral zone).
Preprints 76457 g014
Figure 15. Voltage waveform of the neutral zone.
Preprints 76457 g015
Table 1. Main Test Equipment.
Serial number Name Model Test standard, accuracy
1 Data acquisition HS4 0.1%(12 bit)
5 Voltage probe —— 100V/2V,1%
6 Current Sensor PQ5(U.S. Fluke) 0~5A,40~2kHz,2%
Table 2. Harmonic frequency analysis data of grid voltage waveform in neutral zone.
Frequency (Hz) Percentage
(%)
Frequency (Hz) Percentage
(%)
0 6.04 133.33 13.36
16.67 100 150 6.86
33.33 6.29 166.67 10.89
50 31.34 183.33 9.81
66.67 9.53 200 6.12
83.33 10.73 216.67 6.88
100 12.07 233.33 2.81
116.67 4.60 250 3.17
Table 6. Maximum voltage in neutral zone of electrical split.
Phase angle(°) Voltage (kV) Phase angle (°) Voltage (kV) Phase angle (°) Voltage (kV)
0 46.70 120 51.78 240 69.75
10 52.25 130 48.37 250 68.85
20 56.15 140 45.10 260 67.61
30 58.80 150 40.53 270 64.44
40 60.64 160 41.80 280 62.25
50 62.30 170 45.39 290 61.29
60 66.22 180 50.11 300 57.81
70 66.12 190 55.04 310 53.40
80 64.11 200 59.57 320 48.50
90 64.98 210 62.00 330 44.55
100 59.25 220 65.17 340 43.84
110 57.01 230 67.84 350 42.74
Disclaimer/Publisher’s Note: The statements, opinions and data contained in all publications are solely those of the individual author(s) and contributor(s) and not of MDPI and/or the editor(s). MDPI and/or the editor(s) disclaim responsibility for any injury to people or property resulting from any ideas, methods, instructions or products referred to in the content.
Copyright: This open access article is published under a Creative Commons CC BY 4.0 license, which permit the free download, distribution, and reuse, provided that the author and preprint are cited in any reuse.
Prerpints.org logo

Preprints.org is a free preprint server supported by MDPI in Basel, Switzerland.

Subscribe

© 2024 MDPI (Basel, Switzerland) unless otherwise stated