
You are currently viewing a beta version of our website. If you spot anything unusual, kindly let us know.
Preprint
Article
Test-Retest Repeatability of Human Gestures in Manipulation Tasks
Altmetrics
Downloads
91
Views
39
Comments
0
A peer-reviewed article of this preprint also exists.


This version is not peer-reviewed
Abstract
The importance of performance excellence and operator’s safety is fundamental not only when operators perform repetitive and controlled industrial tasks, but also in case of abrupt gestures due to inattention and unexpected circumstances. Since optical systems work at too low frequencies and they are not able to detect gestures as early as possible, combining the use of wearable magneto-inertial measurement units (MIMUs) with the adoption of deep learning techniques can be useful to instruct the machine about human motion. To improve the initial training phase of neural networks for high classification performance, gestures repeatability over time has to be verified. Since test-retest approach has been poorly applied based on MIMUs signals in a context of human-machine interaction, the aim of this work was to evaluate the repeatability of pick-and-place gestures composed of both normal and abrupt movements. Overall, results demonstrated an excellent test-retest repeatability for normal movements and a fair-to-good test-retest repeatability for abrupt movements. Moreover whereas the reduction of time between test and retest sessions increased repeatability indices.. In detail, results of the test suggested how to improve the reinforcement learning for the identification of gestures onset, whereas results of the retest gave important information about the time necessary to retrain the network.
Keywords:
Subject: Engineering - Mechanical Engineering
1. Introduction
The concept of collaborative robotics, introduced by Industry 4.0 and reinforced by Industry 5.0, involves different levels of human-machine interaction. The most demanding case in terms of safety occurs if human and robot simultaneously share the same workspace [1]. Two different approaches can be exploited to guarantee safety, the power and force limiting (PFL) and the speed and separation monitoring (SSM). PFL combines methods of passive safety design with an energy control of mobile robotic components, limiting force, torques, and velocity. On the contrary, SSM imposes a protection distance between the robot and the operator, without specifying any limitations for the robotic system. In detail, when the operator is inside the shared workspace, SSM approach implies an online control of the robot to generate alternative paths without collisions. In this case, systems for the human motion tracking must be adopted to monitor the minimum distance. Moreover, algorithms for the collision avoidance have to be implemented to update the robot trajectory in real-time.
Many literature works [2,3,4,5] have already exploited different technologies to track the human motion and recognize human gestures in case of repetitive and controlled industrial tasks such as assembly [6] and pick-and-place [2]. However, the operators can perform abrupt gestures different from normal movements due to inattention and unexpected circumstances not directly related to the job task. When these situations occur, it is essential to detect abnormal gestures at their onset avoiding collisions between the human and the machine while maintaining a high efficiency of execution [7]. Some literature works have studied the characteristics of abrupt movements, their effects on the performance of tasks execution, and the methods for identifying their occurrence [8,9,10,11]. Optical systems are not adequate for this purpose, because they work at too low frequencies and they are not able to detect abrupt gestures as early as possible. The problem of frequency can be solved by adopting wearable magneto-inertial measurement units (MIMUs), which collect data from the triaxial accelerometer, gyroscope, and magnetometer embedded in each sensor [12]. Instead, the problem of early detection of abrupt movements can be approached through deep learning techniques, which are useful to extract and learn features directly from raw data and hence to instruct the machine about human motion [13,14,15]. To guarantee high classification performance, deep learning neural networks need an initial training phase. Considering this scenario, repeatability of the gesture over time has to be verified to understand whether and after how long it is necessary to retrain the network.
Therefore, a consistency evaluation referring to both the degree of correlation and the correspondence between measurements has to be assessed through a test-retest. The estimation of test-retest repeatability based on MIMUs signals has been approached in different contexts such as the classification of construction activities in the industrial field [16], the biomechanical 3D investigation of gait [17], or the improvement of sport training load quantification [18]. However, since this approach has been poorly applied in a context of human-machine interaction, the aim of this work was to evaluate the test-retest repeatability in a typical industrial gesture. In detail, twenty-six participants performed a pick-and-place task composed of normal and regularly paced movements interspersed with abrupt movements caused by randomly generated visual or acoustic alarms. Since the present work was thought for the industrial context and specifically for identifying suitable training and testing modalities of deep learning techniques, the time between test and retest sessions (between 20 and 65 days) was higher than the one typical of other literature studies [18, 19]. Results represent the first step for the optimization of a procedure enabling the real-time human activities recognition and hence the improvement of human-machine interaction in terms of safety and effectiveness when abrupt movements occur.
2. Materials and Methods
2.1. Participants, experimental set-up, and protocol
Twenty-six healthy participants (fourteen males and twelve females) with no musculoskeletal or neurological diseases were recruited for the experiment. Twenty-three subjects were right-handed, three subjects were left-handed. Their main anthropometric data (mean ± standard deviation) are reported in the following: age = 27.7 ± 2.3 years, BMI = 22.2 ± 2.0 kg/m2, forearm length = 0.29 ± 0.01 m, upper arm length = 0.34 ± 0.01 m. The study was conducted in accordance with the Declaration of Helsinki and the informed consent was obtained from all involved subjects.
Two wireless MIMUs (OpalTM APDM, USA) containing tri-axial accelerometer (range ± 200 g), gyroscope (range ± 2000 deg/s), and magnetometer (range ± 8 Gauss) were exploited during the test. As shown in Figure 1a, these units were positioned on participants’ right (RFA) and left (LFA) forearms aligning their x-axes with the longitudinal axes of the corresponding human segments. The communication between MIMUs and a PC was guaranteed via Bluetooth. The proprietary software Motion StudioTM (APDM, USA) was used to acquire data at 200 Hz.
A typical industrial task of pick-and-place was realized through the workstation illustrated in Figure 1b. It was composed of a table, a chair, a box containing 30 golf balls, and four stations: S0, S1, S2, and S3. Due to the heterogeneity of the tested group in terms of anthropometric characteristics, it was necessary to adapt the experimental set-up to each participant. To this purpose, a board with thirty holes (diameter of 6 cm) was realized to choose the more appropriate distances for S0, S1, and S2 stations. Moreover, a second board with just one hole (diameter of 6 cm) corresponding to S3 station was added to the set-up at a fixed height of 30 cm from the table and an adjustable distance from the participants.
The task was the same proposed in a previous pilot study [11]. In detail, it was composed of 30 pick-and-place gestures identified as normal movements. Each of these gestures consisted in picking a ball at a time from the box and placing it into a specific hole corresponding to one of the four stations. In detail, participants were asked to place the balls in the holes following a lighting sequence of green LEDs positioned near each station. In addition, during the task, sudden visual alarms or acoustic alarm were randomly produced by lighting red LEDs positioned near each station or switching on a sound buzzer, respectively.
In both cases, participants were asked to perform an abrupt movement as fast as possible, placing the ball inside the hole corresponding to the activated red LED or vertically extending the arm in case of the sound buzzer [11]. An Arduino Nano microcontroller (Arduino, Italy) with the following characteristics was exploited to generate both the visual and acoustic alarms: processor = ATmega328, clock speed = 16 MHz, operating voltage = 5 V. The periodic lighting of the green LEDs (every 3 seconds = 20 bpm) and the random lighting of the red LEDs or of the buzzer were controlled by a code written through an integrated development environment. The Arduino microcontroller was also used to send a voltage trigger of 5V to Opal sensors for systems synchronization.
The experimental protocol involved two different sessions, the test and the retest. Both sessions were performed under the same conditions by all subjects with an intercurrent period between 20 and 65 days (42.2 ± 11.2 days) depending on the subject. In detail, two main groups can be identified based on a threshold of 45 days. Fourteen participants (four males and ten females) performed the retest after less than 45 days from the test: age = 27.8 ± 2.3 years, BMI = 21.9 ± 2.3 kg/m2, forearm length = 0.28 ± 0.01 m, upper arm length = 0.33 ± 0.01 m. Twelve participants (ten males and two females) performed the retest after at least 45 days from the test: age = 27.6 ± 2.5 years, BMI = 22.5 ± 1.5 kg/m2, forearm length = 0.30 ± 0.01 m, upper arm length = 0.35 ± 0.02 m. In both sessions, each participant repeated the pick-and-place task in three different modalities: (i) with the right hand and with the trunk frontal with respect to the table (rFR); (ii) with the left hand and with the trunk frontal with respect to the table (lFR); (iii) with the left hand and with the trunk lateral with respect to the table (lLA). Inside each repetition, four random alarms were emitted, two visuals and two acoustics.
2.2. Data analysis
Data analysis was conducted with custom Matlab® (MathWorks, USA) routines. Raw data of linear accelerations were processed to obtain the accelerations magnitude, after removing the gravitational acceleration. Single gestures were extracted from the entire acquisition by means of windows with a length of three seconds, which was imposed by the regular pace of the green LEDs at 20 bpm. In addition, gestures were distinguished between abrupt and normal movements based on the occurrence of the visual and acoustic alarms. Subsequently, values of acceleration Root Mean Square (RMS) were estimated for each signal considering all the windows within the same movement type. Accordingly, the analysis differentiated movements into three groups: normal movements, abrupt movements caused by a visual alarm and abrupt movements generated by the acoustic buzzer. Since the application of the Shapiro–Wilk test (2-tails, significance level: α=0.05) demonstrated a non-normal distribution of data, a non-parametric statistical analysis was performed on acceleration RMS values with the following tests:
- Mann–Whitney U test (2-tails, significance level: α = 0.05) to verify the eventual presence of differences between males and females;
- Mann–Whitney U test (2-tails, significance level: α = 0.05) to verify the eventual presence of differences among the three test modalities (rFR, lFR, lLA);
- Wilcoxon test (2-tails, significance level: α = 0.05) to investigate the eventual presence of statistical differences among normal movements, visual – abrupt movements, and acoustic – abrupt movements for each modality.
As suggested in literature [20], the test-retest modality can be applied to study the repeatability of the proposed task over time. Test-retest repeatability was evaluated using SPSS® (IBM, USA) statistical package. Accordingly, in this analysis, acceleration RMS values of test and retest were used for the estimation of repeatability. A common measure of repeatability is represented by the Intraclass Correlation Coefficient (ICC), which is calculated as the ratio between the true variance and the total variance of the variable of interest [21]. This dimensionless index assumes values inside the range [-1, 1], highlighting a higher repeatability the closer it gets to 1. In general, two slightly different models of ICC are adopted as measures of relative repeatability of a single measurement [22]. The ICC (3,1) does not consider the effect of any systematic bias as part of the measurement error. On the contrary, the ICC (1,1) assumes all within-subject variability to be part of the measurement error. These two models produce the same result if no systematic error is present [19]. Another common measure of repeatability is represented by the Coefficient of Variation (CV), which is the percentage ratio between the standard deviation and the mean of a values distribution [23]. The repeatability improves the lower the CV is.
In this work, the test-retest repeatability was evaluated in four conditions:
- considering all participants (all);
- excluding the outliers, automatically identified as participants with acceleration RMS values exceeding 1.5 times the interquartile range above the 75th quartile or below the 25th quartile (no_o);
- considering only the participants who performed the retest after less than 45 days from the test (u_45);
- considering only the participants who performed the retest after at least 45 days from the test (o_45).
Hence, for each of these four conditions, the test-retest repeatability was assessed through ICC (1,1), ICC (3,1), and CV estimated for each group of movements (normal, abrupt – visual alarm, abrupt – acoustic alarm) and for each modality (rFR, lFR, lLA).
3. Results
Since acceleration RMS values of males and females did not produce statistically significant differences for both test and retest of all modalities (p-value > 0.05), the analysis was conducted without any gender distinctions. On the contrary, the three modalities (rFR, lFR, lLA) showed statistically significant differences (p-value ≤ 0.05). Hence, the following analyses continued keeping the three modes separated. Figure 2 represents the comparison of averaged RMS values for the three modalities separately for the three types of movements. Single asterisks are related to 0.01 < p-values ≤ 0.05, whereas double asterisks represent p-values ≤ 0.01.
Statistically significant differences among the three types of movements (normal, visual – abrupt, acoustic – abrupt) were found for both test and retest of the three modalities (p-value ≪ 0.001). Accordingly, the following repeatability analysis was conducted considering the three types of movements separately. Figure 3 shows RMS values of forearm acceleration magnitude recorded during the rFR modality, as an example. The three groups of movements (normal, abrupt – visual alarm, abrupt – acoustic alarm) are compared. The scatterplot is with test values on the x-axis vs retest values on the y-axis. Each point is related to one participant.
Figure 4 represents the outliers identification based on the interquartile range. The upper and lower values of the colored bands correspond to 1.5 times the 75th quartile and 1.5 times the 25th quartile, respectively. Figure 4 is composed of nine panels related to the combination of the three types of movements (rows) and the three modalities (columns). Each panel shows the scatterplot of acceleration RMS obtained with test values on the x-axis and the difference between test and retest values on the y-axis. Each participant is represented by a single point. Outliers are the elements not included in the colored band.
Test-retest repeatability based on the evaluation of ICC and CV is showed in Table 1, Table 2 and Table 3. ICC (3,1) and ICC (1,1) results are reported in the tables including their 95% confidence intervals. For each type of movements, the three trials are investigated considering all subjects together (all), subjects after the removal of outliers (no_o), subjects who performed the retest after less than 45 days from the test (u_45), and subjects who performed the retest after at least 45 days from the test (o_45). Since for both normal and abrutp_visual movements no outliers were identified, repeatability results are coincident when considering all participants (all) and participants without outliers (no_o).
4. Discussions
Since abrupt movements are randomly caused by involuntary reactions, their accelerations are greater than the ones of normal movements, as shown by the comparison between the green and the other two clusters presented in Fig. 3. Moreover, abrupt movements generated by the acoustic alarm (blue cluster) produce greater accelerations than abrupt movements generated by the visual alarm (red cluster). This trend can be explained considering the specific protocol of this study, because the movement required in response of an acoustic alarm was wider than the one associated to a visual alarm. Overall, the distribution of the three groups follows the principal diagonal, suggesting a repeatability between test and retest RMS values (Fig. 3).
The definition of a band based on the interquartile range of RMS values allowed the identification of a number of outliers between 0 and 3 for each combination of the three types of movements and the three modalities (Fig. 4). As reported in Table 1, Table 2 and Table 3, the removal of outliers (no_o) before the evaluation of test-retest repeatability did not produce a significant improvement with respect to the analysis involving all participants (all). On average, it is possible to note a minimum increase in both ICC (3,1) (normal +0.07, abrupt_visual +0.10, abrupt_acoustic +0.13) and ICC (1,1) (normal +0.07, abrupt_visual +0.10, abrupt_acoustic +0.11). Coherently, CV values are interested by a slight reduction (normal −0.75%, abrupt_visual −1.56%, abrupt_acoustic −2.08%). In industrial scenarios, real-time should be a key feature for performance optimization. Indeed, an online risk assessment is suitable to evaluate the biomechanical load in repetitive efforts [24] or manual material handling [25], to build a warning system for the prevention of musculoskeletal disorders [26], and to improve assembly workstations [27].
Considering scenarios of human-machine interaction, a real-time exchange of information between the operator and the robot improves both the interaction [28, 29] and the robotic control [30, 31]. Accordingly, the similarity of repeatability with and without the outliers (all vs no_o) represents a positive aspect to approach real-time conditions. Indeed, the possibility of avoiding the post-elaboration of data guarantees the reduction of time.
Another important aspect highlighted from results is the influence of the time occurring between test and retest sessions. Indeed, when this time was < 45 days (u45), the test-retest repeatability was higher with respect to the analysis related to a test-retest time ≥ 45 days (o45). On average, a general strong increase can be noticed in both ICC (3,1) (normal +0.67, abrupt_visual +0.13, abrupt_acoustic +0.35) and ICC (1,1) (normal +0.68, abrupt_visual +0.14, abrupt_acoustic +0.35). Coherently, an evident reduction involved CV values (normal −8.03%, abrupt_visual −4.06%). The only exception is represented by abrupt movements generated by the acoustic alarm with an average increment of CV (+2.27%) from u45 to o45 despite a strong increase of both ICCs.
In industrial scenarios, deep learning techniques can be involved to provide the robot with important information about the human motion in real-time. Consequently, these results suggest updating the network training within around 45 days. Indeed, as reported in literature [19], repeatability can be considered poor if ICC < 0.4, fair-to-good if 0.4 ≤ ICC < 0.75, and excellent if ICC ≥ 0.75. Observing results related to u45 condition, average values of ICCs are 0.78 for normal movements, 0.48 for abrupt movements generated by the visual alarm, and 0.68 for abrupt movements generated by the acoustic alarm. As expected, normal movements are characterized by an excellent repeatability because they are repetitive and predictable. Accordingly, when abrupt gestures occur, the involved higher accelerations cause less controlled movements and hence produce lower ICCs values. In particular, even if both values are fair-to-good, the lighting of visual alarms occurred in different stations whereas the lighting of the sound buzzer caused always the same abrupt movement. Consequently, ICCs values related to the abrupt_acoustic movements are higher than the ones associated with abrupt_visual movements. In general, these values of ICCs also highlight the suitability of MIMUs to conduct this kind of analysis.
The main limit of this study is represented by the specific task required to participants, although one of the most common in the industrial field. In this regard, current activities consist in investigating other typical industrial tasks also from other MIMUs positioned on upper arms and trunk. In order to have a wider and more homogeneous sample of subjects, the same experimental campaign is going to be extended to around 100 participants. Considering the importance of unexpected situations in terms of safety in human-machine interaction, current efforts also aim exploiting deep learning techniques to distinguish between normal and abrupt movements. Moreover, great attention is dedicated to the achievement of real-time processes.
5. Conclusions
The present study aimed at evaluating the test-retest repeatability of a typical industrial pick-and-place gesture composed of both normal and regularly paced movements and abrupt movements caused by randomly generated visual or acoustic alarms. Acceleration RMS values obtained from MIMUs on forearms were exploited for conducting this analysis. The proposed study is a first step in optimizing the real-time human activities recognition and hence improving human-machine interaction in terms of safety and effectiveness. Overall, results demonstrated an excellent test-retest repeatability for normal movements and a fair-to-good test-retest repeatability for abrupt movements. In detail, the removal of outliers did not produce significant improvements in repeatability, whereas the reduction of time between test and retest sessions increased repeatability indices. The general test-retest repeatability highlighted that the proposed procedure and the selected instruments are promising for improving the human gestures recognition in industrial scenarios of human-machine interaction.
Author Contributions
Conceptualization, E.D., E.C, M.P., L.G. and S.P.; methodology, E.D., E.C, M.P., L.G. and S.P.; investigation and data collection, E.D., M.P and E.C.; data post-processing, E.D. and E.C.; writing—original draft preparation, E.D., E.C. and M.A.; writing—review and editing, E.D., E.C, M.A, L.G. and S.P.; supervision, L.G. and S.P.; funding acquisition, L.G. and S.P. All authors have read and agreed to the published version of the manuscript.
Funding
This research received no external funding.
Conflicts of Interest
The authors declare no conflict of interest.
References
- ISO/TS 15066:2016 (2016) Robots and robotic devices - Collaborative robots. Geneva.
- Digo E, Antonelli M, Cornagliotto V, Pastorelli S, Gastaldi L (2020) Collection and analysis of human upper limbs motion features for collaborative robotic applications. Robotics 9:33. [CrossRef]
- Digo E, Gastaldi L, Antonelli M, Pastorelli S, Cereatti A, Caruso M (2022) Real-time estimation of upper limbs kinematics with IMUs during typical industrial gestures. Procedia Comput Sci 200:1041–1047. [CrossRef]
- Boldo M, Bombieri N, Centomo S, De Marchi M, Demrozi F, Pravadelli G, Quaglia D, Turetta C (2022) Integrating Wearable and Camera Based Monitoring in the Digital Twin for Safety Assessment in the Industry 4.0 Era. Lecture Notes in Computer Science (including subseries Lecture Notes in Artificial Intelligence and Lecture Notes in Bioinformatics) 13704 LNCS:184–194. [CrossRef]
- De Feudis I, Buongiorno D, Grossi S, Losito G, Brunetti A, Longo N, Di Stefano G, Bevilacqua V (2022) Evaluation of Vision-Based Hand Tool Tracking Methods for Quality Assessment and Training in Human-Centered Industry 4.0. Applied Sciences 2022, Vol 12, Page 1796 12:1796. [CrossRef]
- Cohen Y, Faccio M, Galizia FG, Mora C, Pilati F (2017) Assembly system configuration through Industry 4.0 principles: the expected change in the actual paradigms. IFAC-PapersOnLine 50:14958–14963. [CrossRef]
- Meziane R, Li P, Otis MJD, Ezzaidi H, Cardou P (2014) Safer hybrid workspace using human-robot interaction while sharing production activities. ROSE 2014 - 2014 IEEE International Symposium on RObotic and SEnsors Environments, Proceedings 37–42. [CrossRef]
- Kirschner RJ, Burr L, Porzenheim M, Mayer H, Abdolshah S, Haddadin S (2021) Involuntary motion in human-robot interaction: Effect of interactive user training on the occurrence of human startle-surprise motion. ISR 2021 - 2021 IEEE International Conference on Intelligence and Safety for Robotics 28–32. [CrossRef]
- Görür OC, Rosman B, Sivrikaya F, Albayrak S (2018) Social Cobots: Anticipatory Decision-Making for Collaborative Robots Incorporating Unexpected Human Behaviors. ACM/IEEE International Conference on Human-Robot Interaction 398–406. [CrossRef]
- Rosso V, Gastaldi L, Pastorelli S (2022) Detecting Impulsive Movements to Increase Operators’ Safety in Manufacturing. Mechanisms and Machine Science 108 MMS:174–181. [CrossRef]
- Polito M, Digo E, Pastorelli S, Gastaldi L (2023) Deep Learning Technique to Identify Abrupt Movements in Human-Robot Collaboration. 73–80. [CrossRef]
- Digo E, Pastorelli S, Gastaldi L (2022) A Narrative Review on Wearable Inertial Sensors for Human Motion Tracking in Industrial Scenarios. Robotics 11:. [CrossRef]
- Añazco EV, Han SJ, Kim K, Lopez PR, Kim TS, Lee S (2021) Hand gesture recognition using single patchable six-axis inertial measurement unit via recurrent neural networks. Sensors (Switzerland) 21:1–14. [CrossRef]
- Rivera P, Valarezo E, Choi M-T, Kim T-S Recognition of Human Hand Activities Based on a Single Wrist IMU Using Recurrent Neural Networks. [CrossRef]
- Sopidis G, Haslgrübler M, Azadi B, Anzengruber-Tánase B, Ahmad A, Ferscha A, Baresch M, Baresch M 2022 Micro-activity recognition in industrial assembly process with IMU data and deep learning. [CrossRef]
- Bangaru SS, Wang C, Aghazadeh F (2020) Data quality and reliability assessment of wearable emg and IMU sensor for construction activity recognition. Sensors (Switzerland) 20:1–24. [CrossRef]
- Teufl W, Miezal M, Taetz B, Fröhlich M, Bleser G (2018) Validity, test-retest reliability and long-term stability of magnetometer free inertial sensor based 3D joint kinematics. Sensors (Switzerland) 18:. [CrossRef]
- Wilmes E, Bastiaansen BJC, de Ruiter CJ, Vegter RJK, Brink MS, Weersma H, Goedhart EA, Lemmink KAPM, Savelsbergh GJP (2023) Construct Validity and Test-Retest Reliability of Hip Load Compared With Playerload During Football-Specific Running, Kicking, and Jumping Tasks. Int J Sports Physiol Perform 18:3–10. [CrossRef]
- Henriksen M, Lund H, Moe-Nilssen R, Bliddal H, Danneskiod-Samsøe B (2004) Test-retest reliability of trunk accelerometric gait analysis. Gait Posture 19:288–297. [CrossRef]
- Weir JP (2005) QUANTIFYING TEST-RETEST RELIABILITY USING THE INTRACLASS CORRELATION COEFFICIENT AND THE SEM.
- Moe-Nilssen R (1998) Test-Retest Reliability of Trunk Accelerometry During Standing and Walking.
- Koo TK, Li MY (2016) A Guideline of Selecting and Reporting Intraclass Correlation Coefficients for Reliability Research. J Chiropr Med 15:155–163. [CrossRef]
- Shechtman O (2013) The Coefficient of Variation as an Index of Measurement Reliability. pp 39–49.
- Peppoloni L, Filippeschi A, Ruffaldi E (2014) Assessment of task ergonomics with an upper limb wearable device. In: 22nd Mediterranean Conference on Control and Automation (MED 2014). IEEE, pp 340–345.
- Giannini P, Bassani G, Avizzano CA, Filippeschi A (2020) Wearable sensor network for biomechanical overload assessment in manual material handling. Sensors (Switzerland) 20:1–29. [CrossRef]
- Yan X, Li H, Li AR, Zhang H (2017) Wearable IMU-based real-time motion warning system for construction workers’ musculoskeletal disorders prevention. Autom Constr 74:2–11. [CrossRef]
- Li J, Lu Y, Nan Y, He L, Wang X, Niu D (2018) A Study on Posture Analysis of Assembly Line Workers in a Manufacturing Industry. Advances in Intelligent Systems and Computing 820:380–386. [CrossRef]
- Al-Yacoub A, Buerkle A, Flanagan M, Ferreira P, Hubbard EM, Lohse N (2020) Effective Human-Robot Collaboration through Wearable Sensors. IEEE Symposium on Emerging Technologies and Factory Automation (ETFA 2020) 2020-Septe:651–658. [CrossRef]
- Resende A, Cerqueira S, Barbosa J, Damasio E, Pombeiro A, Silva A, Santos C (2021) Ergowear: An ambulatory, non-intrusive, and interoperable system towards a Human-Aware Human-robot Collaborative framework. In: 2021 IEEE International Conference on Autonomous Robot Systems and Competitions (ICARSC). IEEE, pp 56–61.
- Škulj G, Vrabič R, Podržaj P (2021) A Wearable IMU System for Flexible Teleoperation of a Collaborative Industrial Robot. Sensors (Switzerland) 21:5871.
- Chico A, Cruz PJ, Vásconez JP, Benalcázar ME, Álvarez R, Barona L, Valdivieso ÁL (2021) Hand Gesture Recognition and Tracking Control for a Virtual UR5 Robot Manipulator. In: 2021 IEEE Fifth Ecuador Technical Chapters Meeting (ETCM). IEEE, pp 1–6.
Figure 1.
a) MIMUs positioning on forearms; b) experimental set-up.
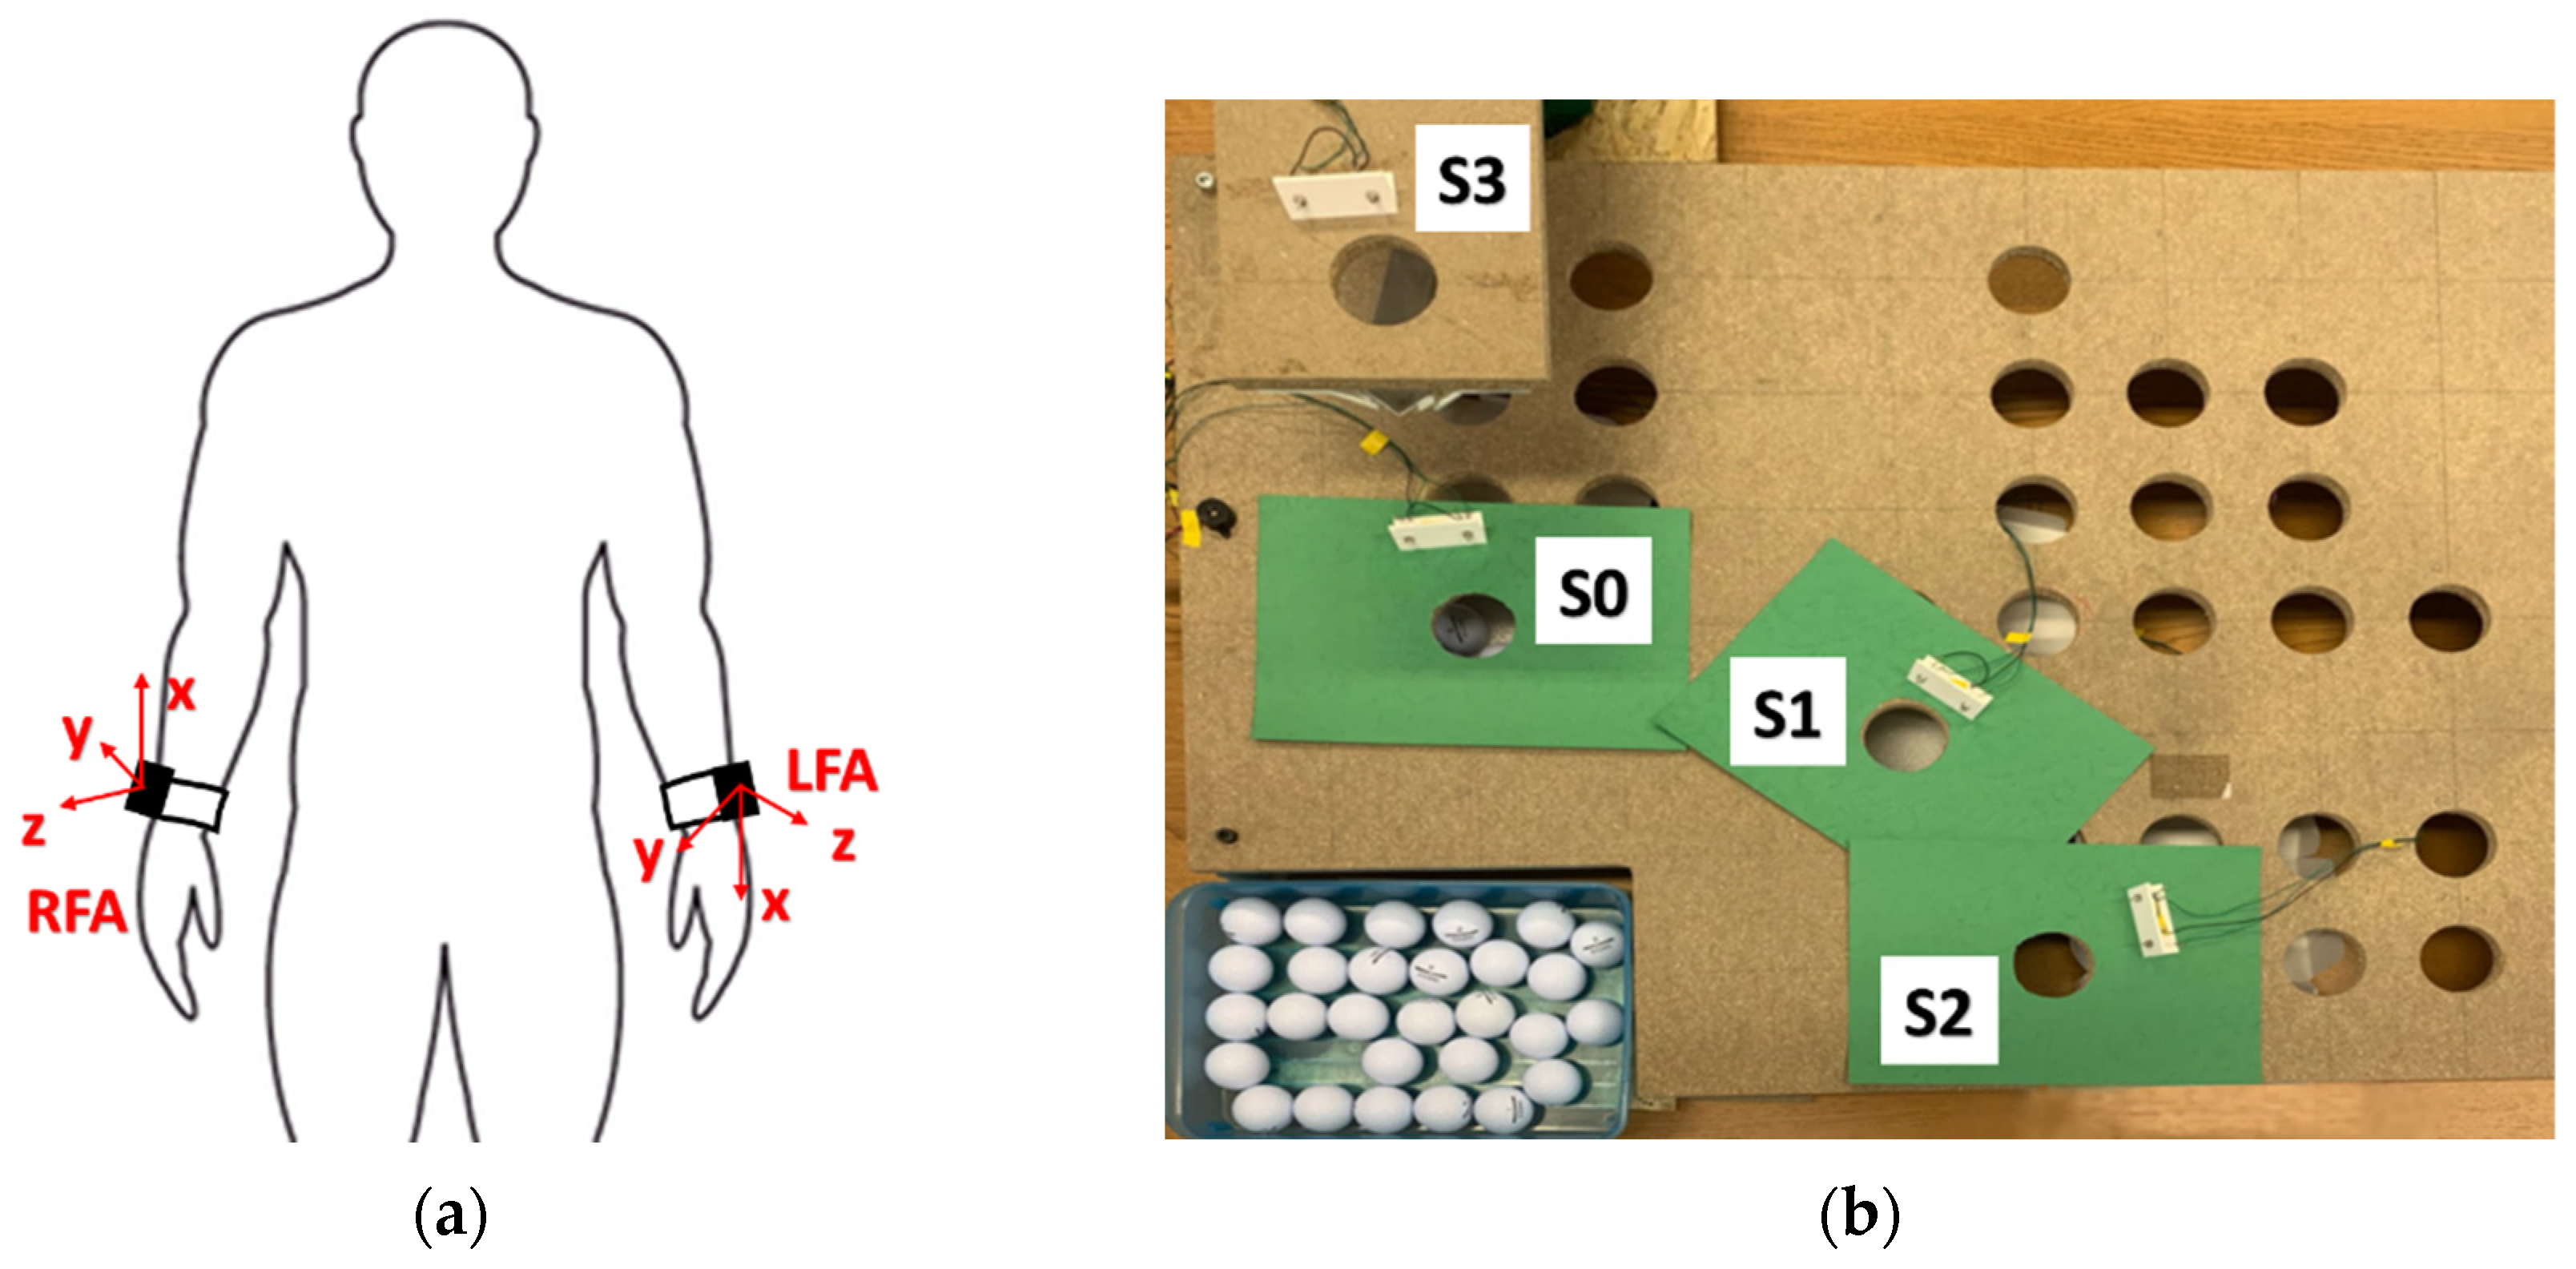
Figure 2.
Averaged RMS values of forearm acceleration for the three modalities of each type of movements.
Figure 2.
Averaged RMS values of forearm acceleration for the three modalities of each type of movements.
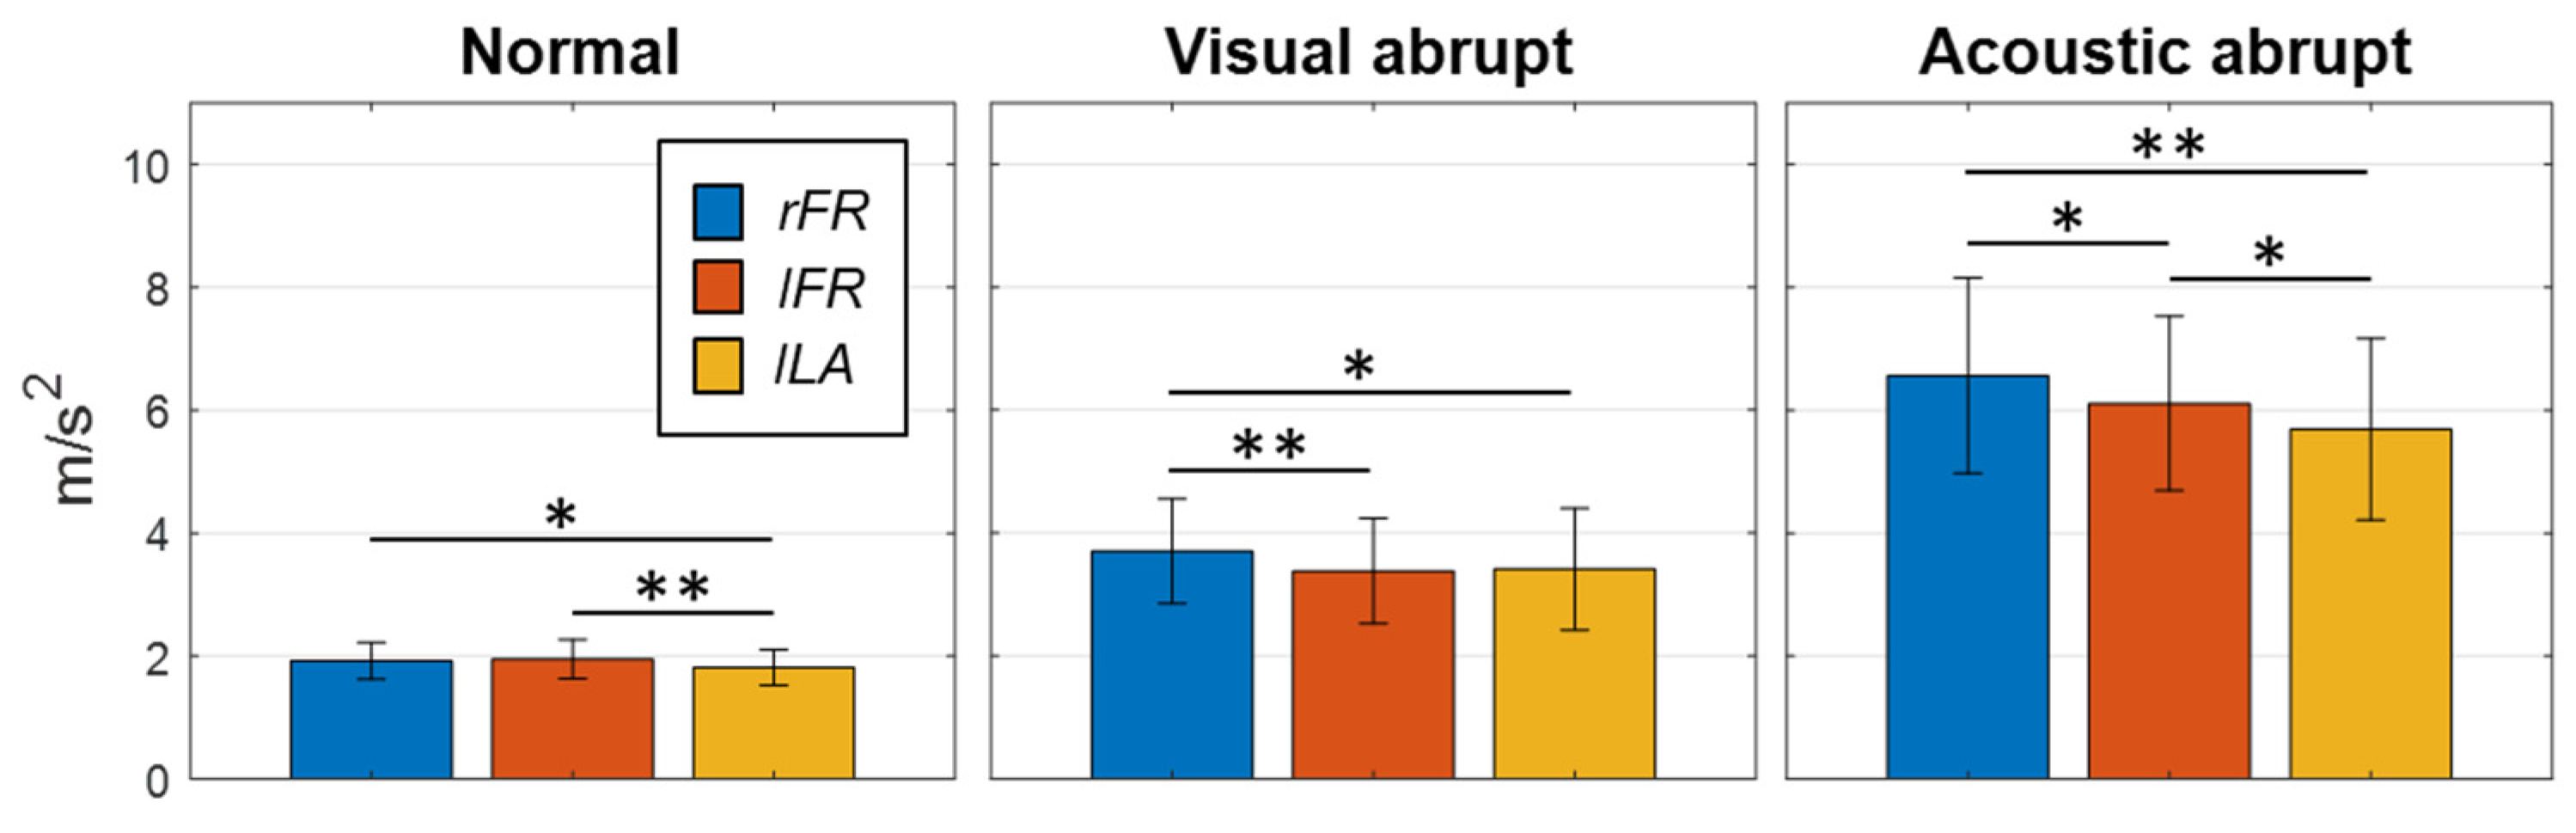
Figure 3.
Acceleration RMS value for all subjects comparing test and retest in rFR modality, as an example.
Figure 3.
Acceleration RMS value for all subjects comparing test and retest in rFR modality, as an example.
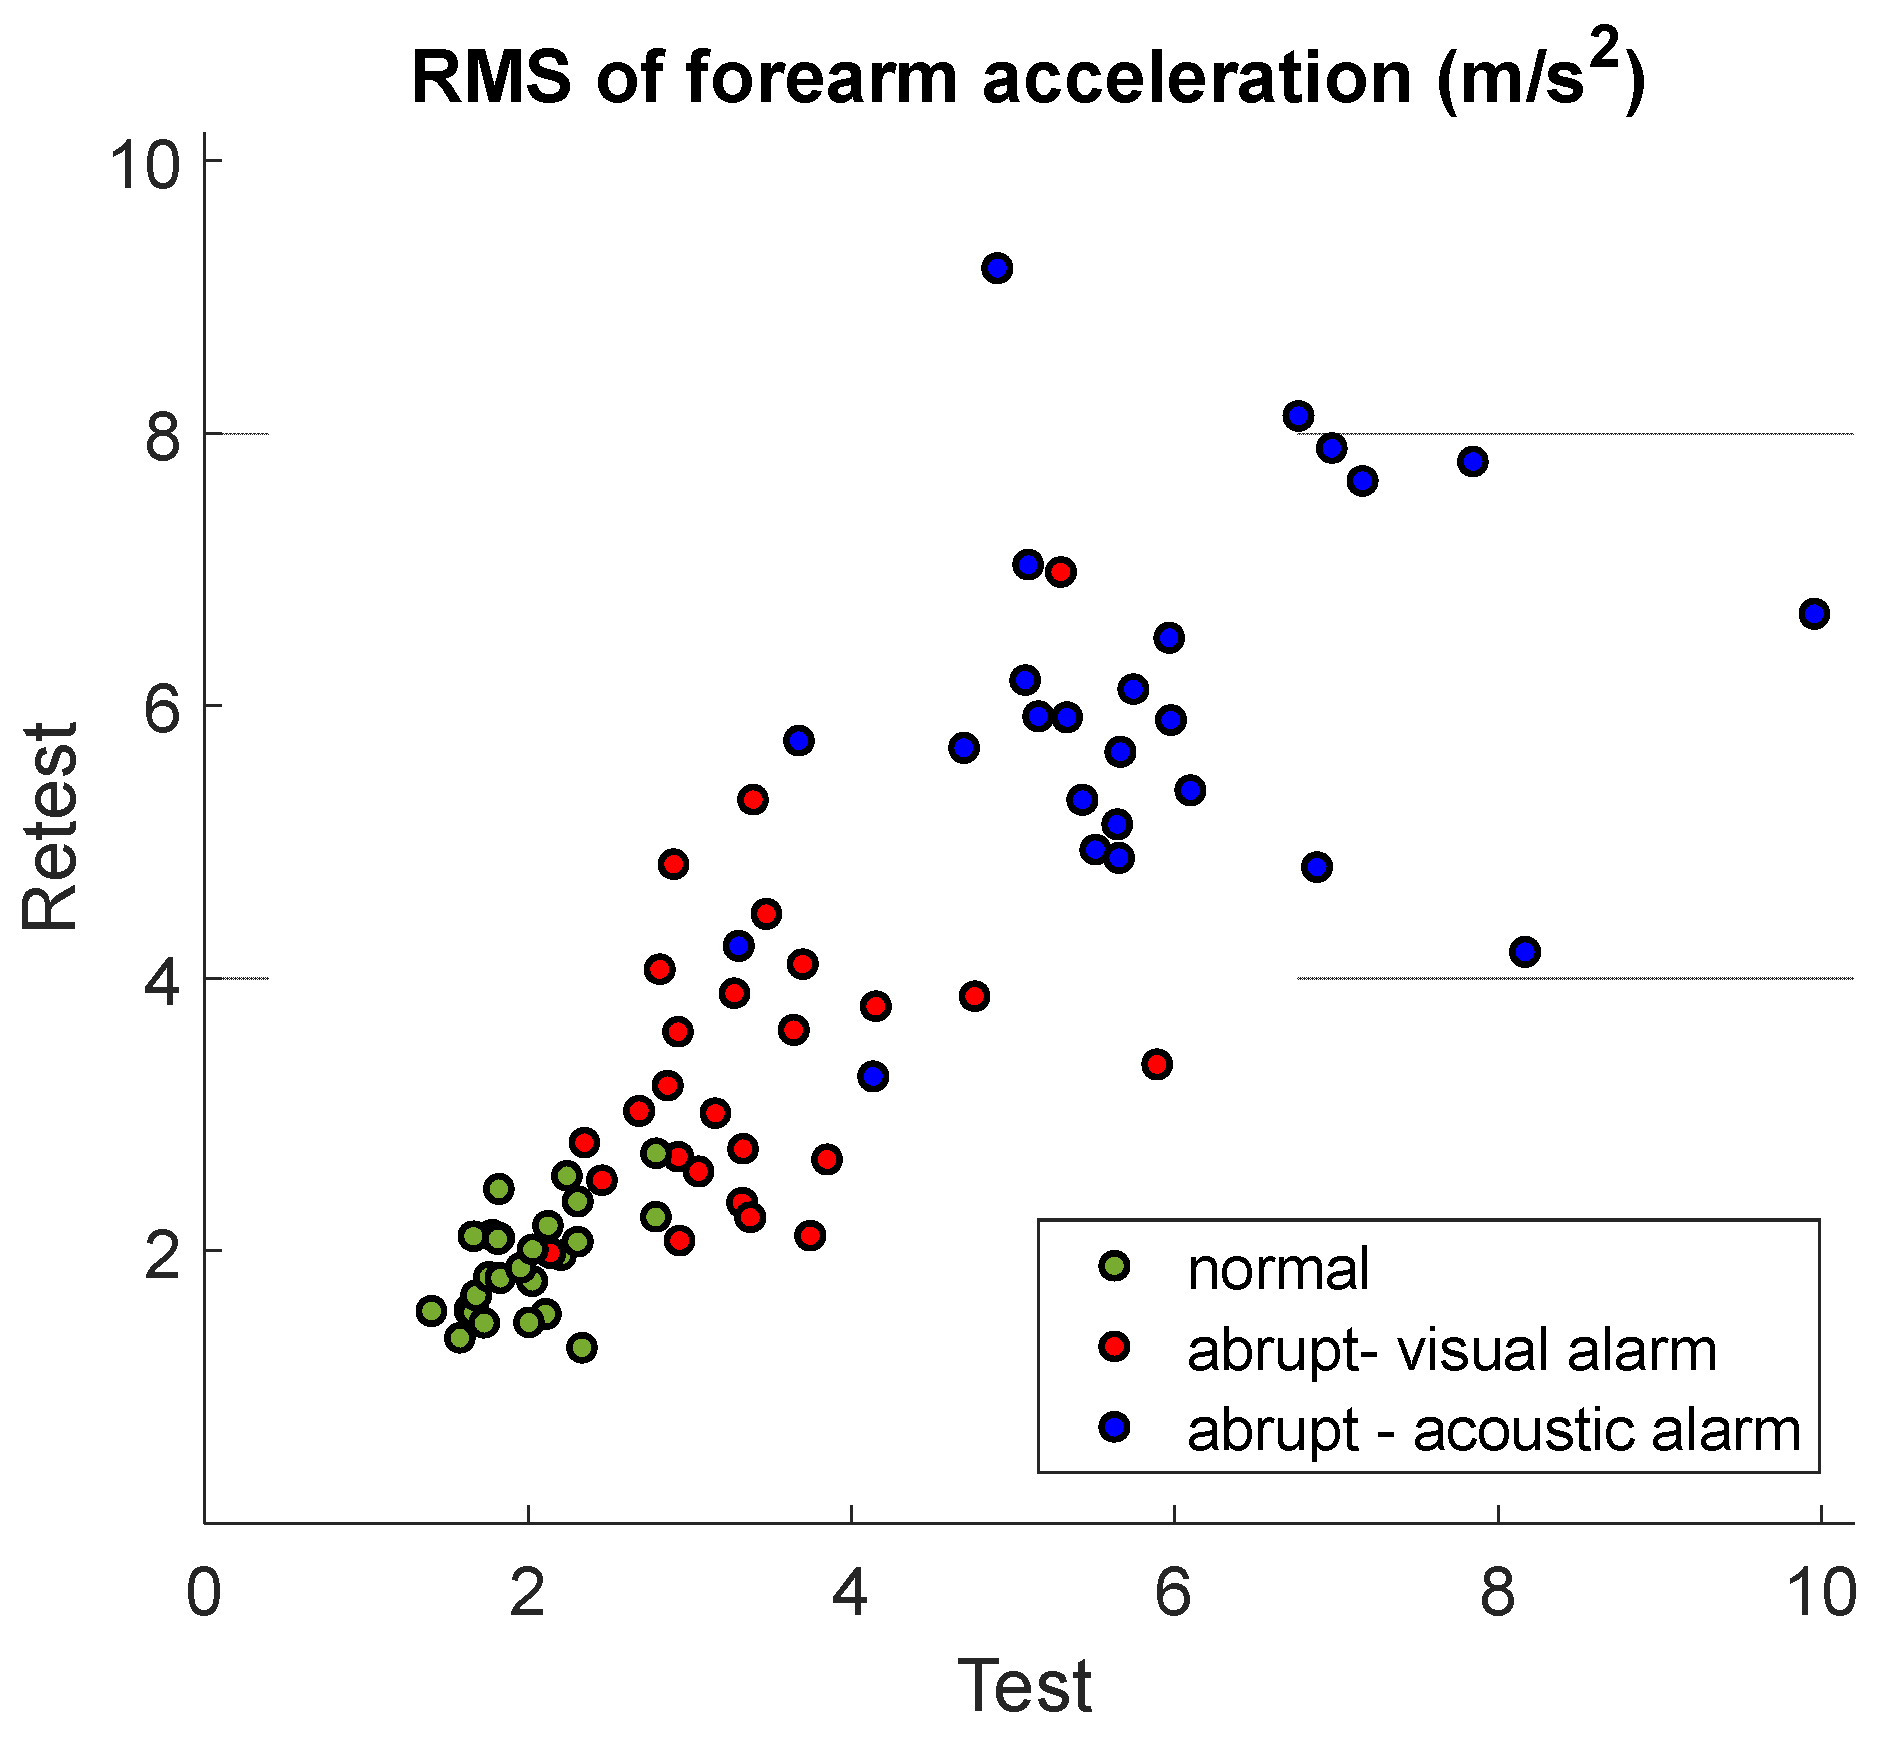
Figure 4.
Outliers identification for each trial and for all groups of movements.
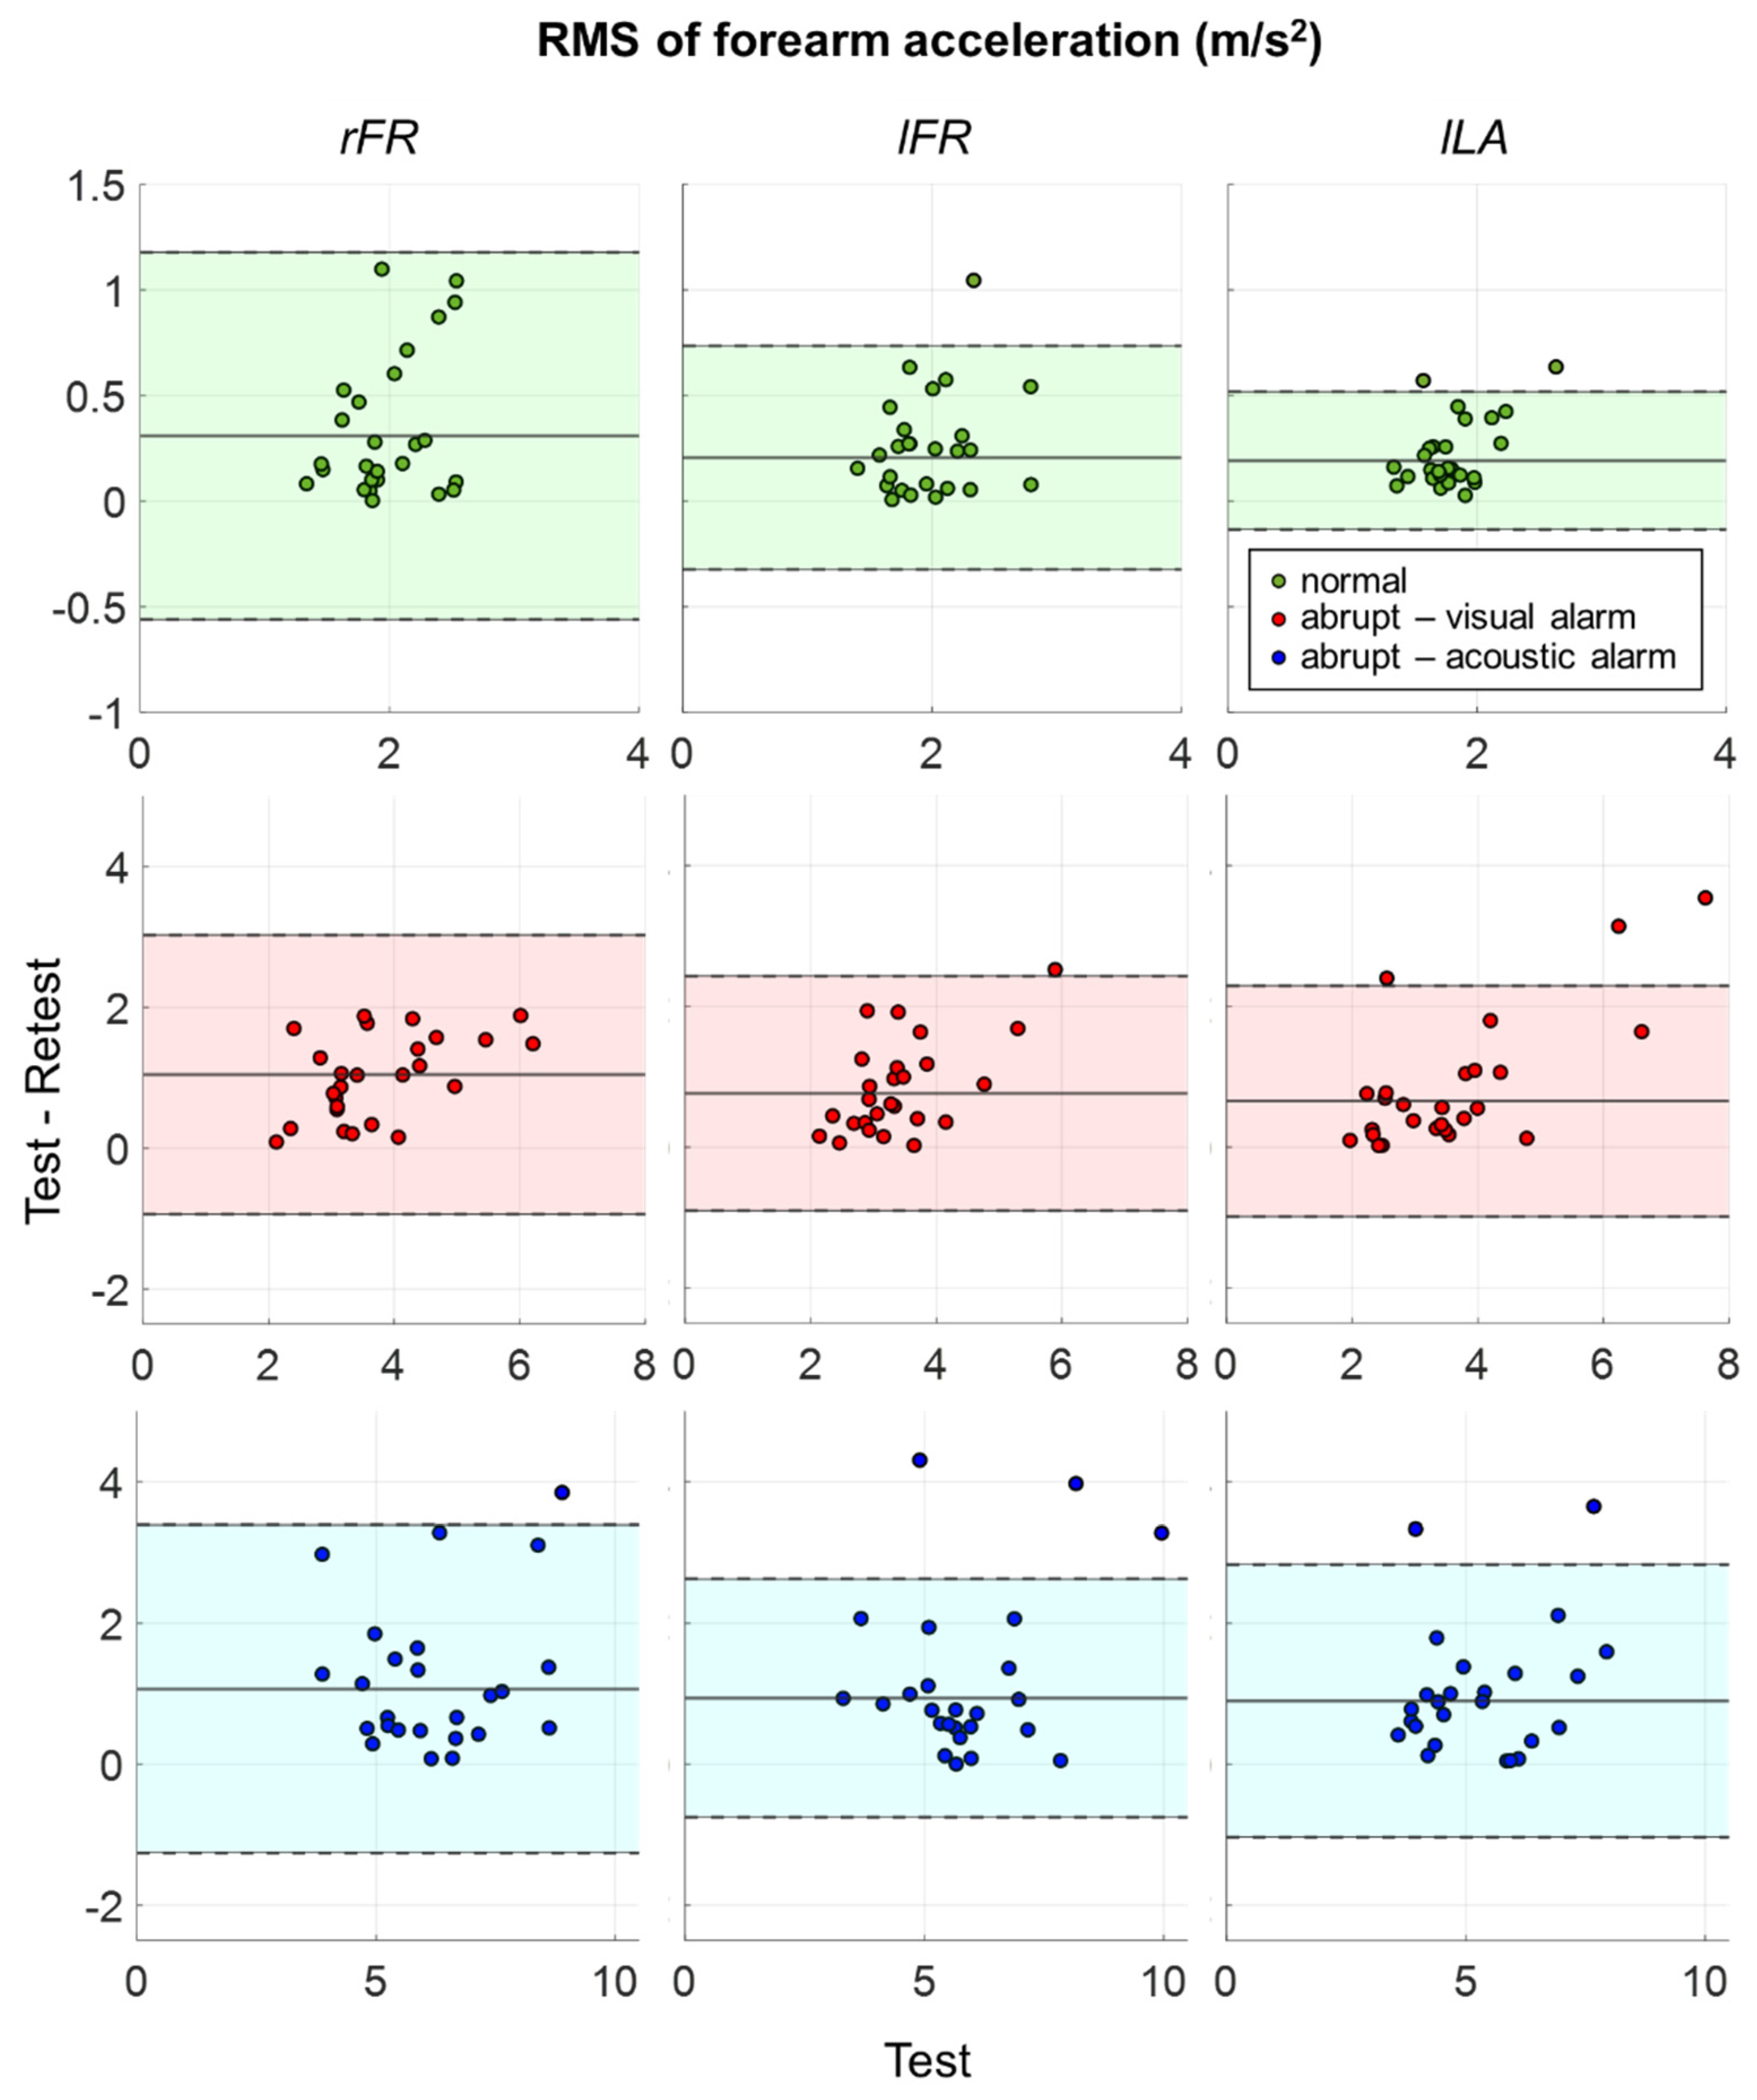

Table 1.
ICC (3,1), ICC (1,1) and CV results of normal movements.
| ICC (3,1) | Lower limit 95% CI for ICC (3,1) |
Upper limit 95% CI for ICC (3,1) |
ICC (1,1) | Lower limit 95% CI for ICC (1,1) |
Upper limit 95% CI for ICC (1,1) |
CV (%) | ||
|---|---|---|---|---|---|---|---|---|
| rFR | all | 0.37 | -0.02 | 0.66 | 0.34 | -0.05 | 0.63 | 11.31 |
| no_o | 0.37 | -0.02 | 0.66 | 0.34 | -0.05 | 0.63 | 11.31 | |
| u45 | 0.81 | 0.51 | 0.94 | 0.82 | 0.55 | 0.94 | 5.64 | |
| o45 | -0.20 | -0.68 | 0.40 | -0.27 | -0.71 | 0.32 | 17.92 | |
| lFR | all | 0.52 | 0.17 | 0.75 | 0.52 | 0.18 | 0.75 | 9.85 |
| no_o | 0.64 | 0.33 | 0.82 | 0.65 | 0.35 | 0.83 | 8.60 | |
| u45 | 0.77 | 0.43 | 0.92 | 0.78 | 0.47 | 0.93 | 6.43 | |
| o45 | 0.09 | -0.49 | 0.61 | 0.11 | -0.46 | 0.62 | 13.83 | |
| lLA | all | 0.63 | 0.33 | 0.82 | 0.64 | 0.34 | 0.82 | 8.54 |
| no_o | 0.72 | 0.45 | 0.87 | 0.72 | 0.47 | 0.87 | 7.54 | |
| u45 | 0.75 | 0.38 | 0.91 | 0.75 | 0.39 | 0.91 | 6.50 | |
| o45 | 0.44 | -0.15 | 0.80 | 0.47 | -0.09 | 0.81 | 10.92 | |
Table 2.
ICC and CV results of abrupt movements generated by the visual alarm.
| ICC (3,1) | Lower limit 95% CI for ICC (3,1) |
Upper limit 95% CI for ICC (3,1) |
ICC (1,1) | Lower limit 95% CI for ICC (1,1) |
Upper limit 95% CI for ICC (1,1) |
CV (%) | ||
|---|---|---|---|---|---|---|---|---|
| rFR | all | 0.34 | -0.05 | 0.64 | 0.36 | -0.02 | 0.65 | 19.08 |
| no_o | 0.34 | -0.05 | 0.64 | 0.36 | -0.02 | 0.65 | 19.08 | |
| u45 | 0.53 | 0.03 | 0.82 | 0.54 | 0.06 | 0.82 | 15.00 | |
| o45 | 0.14 | -0.45 | 0.64 | 0.18 | -0.40 | 0.66 | 23.33 | |
| lFR | all | 0.45 | 0.08 | 0.71 | 0.46 | 0.10 | 0.72 | 16.31 |
| no_o | 0.51 | 0.16 | 0.75 | 0.52 | 0.18 | 0.76 | 15.44 | |
| u45 | 0.62 | 0.15 | 0.86 | 0.64 | 0.20 | 0.87 | 12.86 | |
| o45 | 0.11 | -0.48 | 0.62 | 0.15 | -0.42 | 0.64 | 20.33 | |
| lLA | all | 0.46 | 0.09 | 0.71 | 0.43 | 0.06 | 0.70 | 16.04 |
| no_o | 0.71 | 0.43 | 0.87 | 0.68 | 0.39 | 0.85 | 12.22 | |
| u45 | 0.25 | -0.30 | 0.68 | 0.27 | -0.27 | 0.68 | 17.71 | |
| o45 | 0.77 | 0.37 | 0.93 | 0.69 | 0.25 | 0.90 | 14.08 | |
Table 3.
ICC and CV results of abrupt movements generated by the acoustic alarm.
| ICC (3,1) | Lower limit 95% CI for ICC (3,1) |
Upper limit 95% CI for ICC (3,1) |
ICC (1,1) | Lower limit 95% CI for ICC (1,1) |
Upper limit 95% CI for ICC (1,1) |
CV (%) | ||
|---|---|---|---|---|---|---|---|---|
| rFR | all | 0.57 | 0.25 | 0.78 | 0.58 | 0.25 | 0.78 | 13.42 |
| no_o | 0.52 | 0.17 | 0.76 | 0.53 | 0.19 | 0.76 | 12.96 | |
| u45 | 0.62 | 0.16 | 0.86 | 0.59 | 0.12 | 0.85 | 15.64 | |
| o45 | 0.53 | -0.03 | 0.84 | 0.55 | 0.02 | 0.84 | 10.83 | |
| lFR | all | 0.50 | 0.14 | 0.74 | 0.51 | 0.16 | 0.74 | 13.65 |
| no_o | 0.78 | 0.55 | 0.90 | 0.78 | 0.71 | 0.95 | 10.34 | |
| u45 | 0.69 | 0.27 | 0.89 | 0.71 | 0.32 | 0.89 | 13.64 | |
| o45 | 0.08 | -0.50 | 0.60 | 0.11 | -0.46 | 0.62 | 13.67 | |
| lLA | all | 0.61 | 0.30 | 0.81 | 0.62 | 0.31 | 0.81 | 13.19 |
| no_o | 0.77 | 0.54 | 0.89 | 0.77 | 0.54 | 0.89 | 10.71 | |
| u45 | 0.68 | 0.26 | 0.89 | 0.70 | 0.31 | 0.89 | 14.14 | |
| o45 | 0.34 | -0.26 | 0.75 | 0.30 | -0.28 | 0.73 | 12.08 | |
Disclaimer/Publisher’s Note: The statements, opinions and data contained in all publications are solely those of the individual author(s) and contributor(s) and not of MDPI and/or the editor(s). MDPI and/or the editor(s) disclaim responsibility for any injury to people or property resulting from any ideas, methods, instructions or products referred to in the content. |
© 2023 by the authors. Licensee MDPI, Basel, Switzerland. This article is an open access article distributed under the terms and conditions of the Creative Commons Attribution (CC BY) license (http://creativecommons.org/licenses/by/4.0/).
Copyright: This open access article is published under a Creative Commons CC BY 4.0 license, which permit the free download, distribution, and reuse, provided that the author and preprint are cited in any reuse.
Submitted:
19 June 2023
Posted:
20 June 2023
You are already at the latest version
Alerts
A peer-reviewed article of this preprint also exists.
This version is not peer-reviewed
Submitted:
19 June 2023
Posted:
20 June 2023
You are already at the latest version
Alerts
Abstract
The importance of performance excellence and operator’s safety is fundamental not only when operators perform repetitive and controlled industrial tasks, but also in case of abrupt gestures due to inattention and unexpected circumstances. Since optical systems work at too low frequencies and they are not able to detect gestures as early as possible, combining the use of wearable magneto-inertial measurement units (MIMUs) with the adoption of deep learning techniques can be useful to instruct the machine about human motion. To improve the initial training phase of neural networks for high classification performance, gestures repeatability over time has to be verified. Since test-retest approach has been poorly applied based on MIMUs signals in a context of human-machine interaction, the aim of this work was to evaluate the repeatability of pick-and-place gestures composed of both normal and abrupt movements. Overall, results demonstrated an excellent test-retest repeatability for normal movements and a fair-to-good test-retest repeatability for abrupt movements. Moreover whereas the reduction of time between test and retest sessions increased repeatability indices.. In detail, results of the test suggested how to improve the reinforcement learning for the identification of gestures onset, whereas results of the retest gave important information about the time necessary to retrain the network.
Keywords:
Subject: Engineering - Mechanical Engineering
1. Introduction
The concept of collaborative robotics, introduced by Industry 4.0 and reinforced by Industry 5.0, involves different levels of human-machine interaction. The most demanding case in terms of safety occurs if human and robot simultaneously share the same workspace [1]. Two different approaches can be exploited to guarantee safety, the power and force limiting (PFL) and the speed and separation monitoring (SSM). PFL combines methods of passive safety design with an energy control of mobile robotic components, limiting force, torques, and velocity. On the contrary, SSM imposes a protection distance between the robot and the operator, without specifying any limitations for the robotic system. In detail, when the operator is inside the shared workspace, SSM approach implies an online control of the robot to generate alternative paths without collisions. In this case, systems for the human motion tracking must be adopted to monitor the minimum distance. Moreover, algorithms for the collision avoidance have to be implemented to update the robot trajectory in real-time.
Many literature works [2,3,4,5] have already exploited different technologies to track the human motion and recognize human gestures in case of repetitive and controlled industrial tasks such as assembly [6] and pick-and-place [2]. However, the operators can perform abrupt gestures different from normal movements due to inattention and unexpected circumstances not directly related to the job task. When these situations occur, it is essential to detect abnormal gestures at their onset avoiding collisions between the human and the machine while maintaining a high efficiency of execution [7]. Some literature works have studied the characteristics of abrupt movements, their effects on the performance of tasks execution, and the methods for identifying their occurrence [8,9,10,11]. Optical systems are not adequate for this purpose, because they work at too low frequencies and they are not able to detect abrupt gestures as early as possible. The problem of frequency can be solved by adopting wearable magneto-inertial measurement units (MIMUs), which collect data from the triaxial accelerometer, gyroscope, and magnetometer embedded in each sensor [12]. Instead, the problem of early detection of abrupt movements can be approached through deep learning techniques, which are useful to extract and learn features directly from raw data and hence to instruct the machine about human motion [13,14,15]. To guarantee high classification performance, deep learning neural networks need an initial training phase. Considering this scenario, repeatability of the gesture over time has to be verified to understand whether and after how long it is necessary to retrain the network.
Therefore, a consistency evaluation referring to both the degree of correlation and the correspondence between measurements has to be assessed through a test-retest. The estimation of test-retest repeatability based on MIMUs signals has been approached in different contexts such as the classification of construction activities in the industrial field [16], the biomechanical 3D investigation of gait [17], or the improvement of sport training load quantification [18]. However, since this approach has been poorly applied in a context of human-machine interaction, the aim of this work was to evaluate the test-retest repeatability in a typical industrial gesture. In detail, twenty-six participants performed a pick-and-place task composed of normal and regularly paced movements interspersed with abrupt movements caused by randomly generated visual or acoustic alarms. Since the present work was thought for the industrial context and specifically for identifying suitable training and testing modalities of deep learning techniques, the time between test and retest sessions (between 20 and 65 days) was higher than the one typical of other literature studies [18, 19]. Results represent the first step for the optimization of a procedure enabling the real-time human activities recognition and hence the improvement of human-machine interaction in terms of safety and effectiveness when abrupt movements occur.
2. Materials and Methods
2.1. Participants, experimental set-up, and protocol
Twenty-six healthy participants (fourteen males and twelve females) with no musculoskeletal or neurological diseases were recruited for the experiment. Twenty-three subjects were right-handed, three subjects were left-handed. Their main anthropometric data (mean ± standard deviation) are reported in the following: age = 27.7 ± 2.3 years, BMI = 22.2 ± 2.0 kg/m2, forearm length = 0.29 ± 0.01 m, upper arm length = 0.34 ± 0.01 m. The study was conducted in accordance with the Declaration of Helsinki and the informed consent was obtained from all involved subjects.
Two wireless MIMUs (OpalTM APDM, USA) containing tri-axial accelerometer (range ± 200 g), gyroscope (range ± 2000 deg/s), and magnetometer (range ± 8 Gauss) were exploited during the test. As shown in Figure 1a, these units were positioned on participants’ right (RFA) and left (LFA) forearms aligning their x-axes with the longitudinal axes of the corresponding human segments. The communication between MIMUs and a PC was guaranteed via Bluetooth. The proprietary software Motion StudioTM (APDM, USA) was used to acquire data at 200 Hz.
A typical industrial task of pick-and-place was realized through the workstation illustrated in Figure 1b. It was composed of a table, a chair, a box containing 30 golf balls, and four stations: S0, S1, S2, and S3. Due to the heterogeneity of the tested group in terms of anthropometric characteristics, it was necessary to adapt the experimental set-up to each participant. To this purpose, a board with thirty holes (diameter of 6 cm) was realized to choose the more appropriate distances for S0, S1, and S2 stations. Moreover, a second board with just one hole (diameter of 6 cm) corresponding to S3 station was added to the set-up at a fixed height of 30 cm from the table and an adjustable distance from the participants.
The task was the same proposed in a previous pilot study [11]. In detail, it was composed of 30 pick-and-place gestures identified as normal movements. Each of these gestures consisted in picking a ball at a time from the box and placing it into a specific hole corresponding to one of the four stations. In detail, participants were asked to place the balls in the holes following a lighting sequence of green LEDs positioned near each station. In addition, during the task, sudden visual alarms or acoustic alarm were randomly produced by lighting red LEDs positioned near each station or switching on a sound buzzer, respectively.
In both cases, participants were asked to perform an abrupt movement as fast as possible, placing the ball inside the hole corresponding to the activated red LED or vertically extending the arm in case of the sound buzzer [11]. An Arduino Nano microcontroller (Arduino, Italy) with the following characteristics was exploited to generate both the visual and acoustic alarms: processor = ATmega328, clock speed = 16 MHz, operating voltage = 5 V. The periodic lighting of the green LEDs (every 3 seconds = 20 bpm) and the random lighting of the red LEDs or of the buzzer were controlled by a code written through an integrated development environment. The Arduino microcontroller was also used to send a voltage trigger of 5V to Opal sensors for systems synchronization.
The experimental protocol involved two different sessions, the test and the retest. Both sessions were performed under the same conditions by all subjects with an intercurrent period between 20 and 65 days (42.2 ± 11.2 days) depending on the subject. In detail, two main groups can be identified based on a threshold of 45 days. Fourteen participants (four males and ten females) performed the retest after less than 45 days from the test: age = 27.8 ± 2.3 years, BMI = 21.9 ± 2.3 kg/m2, forearm length = 0.28 ± 0.01 m, upper arm length = 0.33 ± 0.01 m. Twelve participants (ten males and two females) performed the retest after at least 45 days from the test: age = 27.6 ± 2.5 years, BMI = 22.5 ± 1.5 kg/m2, forearm length = 0.30 ± 0.01 m, upper arm length = 0.35 ± 0.02 m. In both sessions, each participant repeated the pick-and-place task in three different modalities: (i) with the right hand and with the trunk frontal with respect to the table (rFR); (ii) with the left hand and with the trunk frontal with respect to the table (lFR); (iii) with the left hand and with the trunk lateral with respect to the table (lLA). Inside each repetition, four random alarms were emitted, two visuals and two acoustics.
2.2. Data analysis
Data analysis was conducted with custom Matlab® (MathWorks, USA) routines. Raw data of linear accelerations were processed to obtain the accelerations magnitude, after removing the gravitational acceleration. Single gestures were extracted from the entire acquisition by means of windows with a length of three seconds, which was imposed by the regular pace of the green LEDs at 20 bpm. In addition, gestures were distinguished between abrupt and normal movements based on the occurrence of the visual and acoustic alarms. Subsequently, values of acceleration Root Mean Square (RMS) were estimated for each signal considering all the windows within the same movement type. Accordingly, the analysis differentiated movements into three groups: normal movements, abrupt movements caused by a visual alarm and abrupt movements generated by the acoustic buzzer. Since the application of the Shapiro–Wilk test (2-tails, significance level: α=0.05) demonstrated a non-normal distribution of data, a non-parametric statistical analysis was performed on acceleration RMS values with the following tests:
- Mann–Whitney U test (2-tails, significance level: α = 0.05) to verify the eventual presence of differences between males and females;
- Mann–Whitney U test (2-tails, significance level: α = 0.05) to verify the eventual presence of differences among the three test modalities (rFR, lFR, lLA);
- Wilcoxon test (2-tails, significance level: α = 0.05) to investigate the eventual presence of statistical differences among normal movements, visual – abrupt movements, and acoustic – abrupt movements for each modality.
As suggested in literature [20], the test-retest modality can be applied to study the repeatability of the proposed task over time. Test-retest repeatability was evaluated using SPSS® (IBM, USA) statistical package. Accordingly, in this analysis, acceleration RMS values of test and retest were used for the estimation of repeatability. A common measure of repeatability is represented by the Intraclass Correlation Coefficient (ICC), which is calculated as the ratio between the true variance and the total variance of the variable of interest [21]. This dimensionless index assumes values inside the range [-1, 1], highlighting a higher repeatability the closer it gets to 1. In general, two slightly different models of ICC are adopted as measures of relative repeatability of a single measurement [22]. The ICC (3,1) does not consider the effect of any systematic bias as part of the measurement error. On the contrary, the ICC (1,1) assumes all within-subject variability to be part of the measurement error. These two models produce the same result if no systematic error is present [19]. Another common measure of repeatability is represented by the Coefficient of Variation (CV), which is the percentage ratio between the standard deviation and the mean of a values distribution [23]. The repeatability improves the lower the CV is.
In this work, the test-retest repeatability was evaluated in four conditions:
- considering all participants (all);
- excluding the outliers, automatically identified as participants with acceleration RMS values exceeding 1.5 times the interquartile range above the 75th quartile or below the 25th quartile (no_o);
- considering only the participants who performed the retest after less than 45 days from the test (u_45);
- considering only the participants who performed the retest after at least 45 days from the test (o_45).
Hence, for each of these four conditions, the test-retest repeatability was assessed through ICC (1,1), ICC (3,1), and CV estimated for each group of movements (normal, abrupt – visual alarm, abrupt – acoustic alarm) and for each modality (rFR, lFR, lLA).
3. Results
Since acceleration RMS values of males and females did not produce statistically significant differences for both test and retest of all modalities (p-value > 0.05), the analysis was conducted without any gender distinctions. On the contrary, the three modalities (rFR, lFR, lLA) showed statistically significant differences (p-value ≤ 0.05). Hence, the following analyses continued keeping the three modes separated. Figure 2 represents the comparison of averaged RMS values for the three modalities separately for the three types of movements. Single asterisks are related to 0.01 < p-values ≤ 0.05, whereas double asterisks represent p-values ≤ 0.01.
Statistically significant differences among the three types of movements (normal, visual – abrupt, acoustic – abrupt) were found for both test and retest of the three modalities (p-value ≪ 0.001). Accordingly, the following repeatability analysis was conducted considering the three types of movements separately. Figure 3 shows RMS values of forearm acceleration magnitude recorded during the rFR modality, as an example. The three groups of movements (normal, abrupt – visual alarm, abrupt – acoustic alarm) are compared. The scatterplot is with test values on the x-axis vs retest values on the y-axis. Each point is related to one participant.
Figure 4 represents the outliers identification based on the interquartile range. The upper and lower values of the colored bands correspond to 1.5 times the 75th quartile and 1.5 times the 25th quartile, respectively. Figure 4 is composed of nine panels related to the combination of the three types of movements (rows) and the three modalities (columns). Each panel shows the scatterplot of acceleration RMS obtained with test values on the x-axis and the difference between test and retest values on the y-axis. Each participant is represented by a single point. Outliers are the elements not included in the colored band.
Test-retest repeatability based on the evaluation of ICC and CV is showed in Table 1, Table 2 and Table 3. ICC (3,1) and ICC (1,1) results are reported in the tables including their 95% confidence intervals. For each type of movements, the three trials are investigated considering all subjects together (all), subjects after the removal of outliers (no_o), subjects who performed the retest after less than 45 days from the test (u_45), and subjects who performed the retest after at least 45 days from the test (o_45). Since for both normal and abrutp_visual movements no outliers were identified, repeatability results are coincident when considering all participants (all) and participants without outliers (no_o).
4. Discussions
Since abrupt movements are randomly caused by involuntary reactions, their accelerations are greater than the ones of normal movements, as shown by the comparison between the green and the other two clusters presented in Fig. 3. Moreover, abrupt movements generated by the acoustic alarm (blue cluster) produce greater accelerations than abrupt movements generated by the visual alarm (red cluster). This trend can be explained considering the specific protocol of this study, because the movement required in response of an acoustic alarm was wider than the one associated to a visual alarm. Overall, the distribution of the three groups follows the principal diagonal, suggesting a repeatability between test and retest RMS values (Fig. 3).
The definition of a band based on the interquartile range of RMS values allowed the identification of a number of outliers between 0 and 3 for each combination of the three types of movements and the three modalities (Fig. 4). As reported in Table 1, Table 2 and Table 3, the removal of outliers (no_o) before the evaluation of test-retest repeatability did not produce a significant improvement with respect to the analysis involving all participants (all). On average, it is possible to note a minimum increase in both ICC (3,1) (normal +0.07, abrupt_visual +0.10, abrupt_acoustic +0.13) and ICC (1,1) (normal +0.07, abrupt_visual +0.10, abrupt_acoustic +0.11). Coherently, CV values are interested by a slight reduction (normal −0.75%, abrupt_visual −1.56%, abrupt_acoustic −2.08%). In industrial scenarios, real-time should be a key feature for performance optimization. Indeed, an online risk assessment is suitable to evaluate the biomechanical load in repetitive efforts [24] or manual material handling [25], to build a warning system for the prevention of musculoskeletal disorders [26], and to improve assembly workstations [27].
Considering scenarios of human-machine interaction, a real-time exchange of information between the operator and the robot improves both the interaction [28, 29] and the robotic control [30, 31]. Accordingly, the similarity of repeatability with and without the outliers (all vs no_o) represents a positive aspect to approach real-time conditions. Indeed, the possibility of avoiding the post-elaboration of data guarantees the reduction of time.
Another important aspect highlighted from results is the influence of the time occurring between test and retest sessions. Indeed, when this time was < 45 days (u45), the test-retest repeatability was higher with respect to the analysis related to a test-retest time ≥ 45 days (o45). On average, a general strong increase can be noticed in both ICC (3,1) (normal +0.67, abrupt_visual +0.13, abrupt_acoustic +0.35) and ICC (1,1) (normal +0.68, abrupt_visual +0.14, abrupt_acoustic +0.35). Coherently, an evident reduction involved CV values (normal −8.03%, abrupt_visual −4.06%). The only exception is represented by abrupt movements generated by the acoustic alarm with an average increment of CV (+2.27%) from u45 to o45 despite a strong increase of both ICCs.
In industrial scenarios, deep learning techniques can be involved to provide the robot with important information about the human motion in real-time. Consequently, these results suggest updating the network training within around 45 days. Indeed, as reported in literature [19], repeatability can be considered poor if ICC < 0.4, fair-to-good if 0.4 ≤ ICC < 0.75, and excellent if ICC ≥ 0.75. Observing results related to u45 condition, average values of ICCs are 0.78 for normal movements, 0.48 for abrupt movements generated by the visual alarm, and 0.68 for abrupt movements generated by the acoustic alarm. As expected, normal movements are characterized by an excellent repeatability because they are repetitive and predictable. Accordingly, when abrupt gestures occur, the involved higher accelerations cause less controlled movements and hence produce lower ICCs values. In particular, even if both values are fair-to-good, the lighting of visual alarms occurred in different stations whereas the lighting of the sound buzzer caused always the same abrupt movement. Consequently, ICCs values related to the abrupt_acoustic movements are higher than the ones associated with abrupt_visual movements. In general, these values of ICCs also highlight the suitability of MIMUs to conduct this kind of analysis.
The main limit of this study is represented by the specific task required to participants, although one of the most common in the industrial field. In this regard, current activities consist in investigating other typical industrial tasks also from other MIMUs positioned on upper arms and trunk. In order to have a wider and more homogeneous sample of subjects, the same experimental campaign is going to be extended to around 100 participants. Considering the importance of unexpected situations in terms of safety in human-machine interaction, current efforts also aim exploiting deep learning techniques to distinguish between normal and abrupt movements. Moreover, great attention is dedicated to the achievement of real-time processes.
5. Conclusions
The present study aimed at evaluating the test-retest repeatability of a typical industrial pick-and-place gesture composed of both normal and regularly paced movements and abrupt movements caused by randomly generated visual or acoustic alarms. Acceleration RMS values obtained from MIMUs on forearms were exploited for conducting this analysis. The proposed study is a first step in optimizing the real-time human activities recognition and hence improving human-machine interaction in terms of safety and effectiveness. Overall, results demonstrated an excellent test-retest repeatability for normal movements and a fair-to-good test-retest repeatability for abrupt movements. In detail, the removal of outliers did not produce significant improvements in repeatability, whereas the reduction of time between test and retest sessions increased repeatability indices. The general test-retest repeatability highlighted that the proposed procedure and the selected instruments are promising for improving the human gestures recognition in industrial scenarios of human-machine interaction.
Author Contributions
Conceptualization, E.D., E.C, M.P., L.G. and S.P.; methodology, E.D., E.C, M.P., L.G. and S.P.; investigation and data collection, E.D., M.P and E.C.; data post-processing, E.D. and E.C.; writing—original draft preparation, E.D., E.C. and M.A.; writing—review and editing, E.D., E.C, M.A, L.G. and S.P.; supervision, L.G. and S.P.; funding acquisition, L.G. and S.P. All authors have read and agreed to the published version of the manuscript.
Funding
This research received no external funding.
Conflicts of Interest
The authors declare no conflict of interest.
References
- ISO/TS 15066:2016 (2016) Robots and robotic devices - Collaborative robots. Geneva.
- Digo E, Antonelli M, Cornagliotto V, Pastorelli S, Gastaldi L (2020) Collection and analysis of human upper limbs motion features for collaborative robotic applications. Robotics 9:33. [CrossRef]
- Digo E, Gastaldi L, Antonelli M, Pastorelli S, Cereatti A, Caruso M (2022) Real-time estimation of upper limbs kinematics with IMUs during typical industrial gestures. Procedia Comput Sci 200:1041–1047. [CrossRef]
- Boldo M, Bombieri N, Centomo S, De Marchi M, Demrozi F, Pravadelli G, Quaglia D, Turetta C (2022) Integrating Wearable and Camera Based Monitoring in the Digital Twin for Safety Assessment in the Industry 4.0 Era. Lecture Notes in Computer Science (including subseries Lecture Notes in Artificial Intelligence and Lecture Notes in Bioinformatics) 13704 LNCS:184–194. [CrossRef]
- De Feudis I, Buongiorno D, Grossi S, Losito G, Brunetti A, Longo N, Di Stefano G, Bevilacqua V (2022) Evaluation of Vision-Based Hand Tool Tracking Methods for Quality Assessment and Training in Human-Centered Industry 4.0. Applied Sciences 2022, Vol 12, Page 1796 12:1796. [CrossRef]
- Cohen Y, Faccio M, Galizia FG, Mora C, Pilati F (2017) Assembly system configuration through Industry 4.0 principles: the expected change in the actual paradigms. IFAC-PapersOnLine 50:14958–14963. [CrossRef]
- Meziane R, Li P, Otis MJD, Ezzaidi H, Cardou P (2014) Safer hybrid workspace using human-robot interaction while sharing production activities. ROSE 2014 - 2014 IEEE International Symposium on RObotic and SEnsors Environments, Proceedings 37–42. [CrossRef]
- Kirschner RJ, Burr L, Porzenheim M, Mayer H, Abdolshah S, Haddadin S (2021) Involuntary motion in human-robot interaction: Effect of interactive user training on the occurrence of human startle-surprise motion. ISR 2021 - 2021 IEEE International Conference on Intelligence and Safety for Robotics 28–32. [CrossRef]
- Görür OC, Rosman B, Sivrikaya F, Albayrak S (2018) Social Cobots: Anticipatory Decision-Making for Collaborative Robots Incorporating Unexpected Human Behaviors. ACM/IEEE International Conference on Human-Robot Interaction 398–406. [CrossRef]
- Rosso V, Gastaldi L, Pastorelli S (2022) Detecting Impulsive Movements to Increase Operators’ Safety in Manufacturing. Mechanisms and Machine Science 108 MMS:174–181. [CrossRef]
- Polito M, Digo E, Pastorelli S, Gastaldi L (2023) Deep Learning Technique to Identify Abrupt Movements in Human-Robot Collaboration. 73–80. [CrossRef]
- Digo E, Pastorelli S, Gastaldi L (2022) A Narrative Review on Wearable Inertial Sensors for Human Motion Tracking in Industrial Scenarios. Robotics 11:. [CrossRef]
- Añazco EV, Han SJ, Kim K, Lopez PR, Kim TS, Lee S (2021) Hand gesture recognition using single patchable six-axis inertial measurement unit via recurrent neural networks. Sensors (Switzerland) 21:1–14. [CrossRef]
- Rivera P, Valarezo E, Choi M-T, Kim T-S Recognition of Human Hand Activities Based on a Single Wrist IMU Using Recurrent Neural Networks. [CrossRef]
- Sopidis G, Haslgrübler M, Azadi B, Anzengruber-Tánase B, Ahmad A, Ferscha A, Baresch M, Baresch M 2022 Micro-activity recognition in industrial assembly process with IMU data and deep learning. [CrossRef]
- Bangaru SS, Wang C, Aghazadeh F (2020) Data quality and reliability assessment of wearable emg and IMU sensor for construction activity recognition. Sensors (Switzerland) 20:1–24. [CrossRef]
- Teufl W, Miezal M, Taetz B, Fröhlich M, Bleser G (2018) Validity, test-retest reliability and long-term stability of magnetometer free inertial sensor based 3D joint kinematics. Sensors (Switzerland) 18:. [CrossRef]
- Wilmes E, Bastiaansen BJC, de Ruiter CJ, Vegter RJK, Brink MS, Weersma H, Goedhart EA, Lemmink KAPM, Savelsbergh GJP (2023) Construct Validity and Test-Retest Reliability of Hip Load Compared With Playerload During Football-Specific Running, Kicking, and Jumping Tasks. Int J Sports Physiol Perform 18:3–10. [CrossRef]
- Henriksen M, Lund H, Moe-Nilssen R, Bliddal H, Danneskiod-Samsøe B (2004) Test-retest reliability of trunk accelerometric gait analysis. Gait Posture 19:288–297. [CrossRef]
- Weir JP (2005) QUANTIFYING TEST-RETEST RELIABILITY USING THE INTRACLASS CORRELATION COEFFICIENT AND THE SEM.
- Moe-Nilssen R (1998) Test-Retest Reliability of Trunk Accelerometry During Standing and Walking.
- Koo TK, Li MY (2016) A Guideline of Selecting and Reporting Intraclass Correlation Coefficients for Reliability Research. J Chiropr Med 15:155–163. [CrossRef]
- Shechtman O (2013) The Coefficient of Variation as an Index of Measurement Reliability. pp 39–49.
- Peppoloni L, Filippeschi A, Ruffaldi E (2014) Assessment of task ergonomics with an upper limb wearable device. In: 22nd Mediterranean Conference on Control and Automation (MED 2014). IEEE, pp 340–345.
- Giannini P, Bassani G, Avizzano CA, Filippeschi A (2020) Wearable sensor network for biomechanical overload assessment in manual material handling. Sensors (Switzerland) 20:1–29. [CrossRef]
- Yan X, Li H, Li AR, Zhang H (2017) Wearable IMU-based real-time motion warning system for construction workers’ musculoskeletal disorders prevention. Autom Constr 74:2–11. [CrossRef]
- Li J, Lu Y, Nan Y, He L, Wang X, Niu D (2018) A Study on Posture Analysis of Assembly Line Workers in a Manufacturing Industry. Advances in Intelligent Systems and Computing 820:380–386. [CrossRef]
- Al-Yacoub A, Buerkle A, Flanagan M, Ferreira P, Hubbard EM, Lohse N (2020) Effective Human-Robot Collaboration through Wearable Sensors. IEEE Symposium on Emerging Technologies and Factory Automation (ETFA 2020) 2020-Septe:651–658. [CrossRef]
- Resende A, Cerqueira S, Barbosa J, Damasio E, Pombeiro A, Silva A, Santos C (2021) Ergowear: An ambulatory, non-intrusive, and interoperable system towards a Human-Aware Human-robot Collaborative framework. In: 2021 IEEE International Conference on Autonomous Robot Systems and Competitions (ICARSC). IEEE, pp 56–61.
- Škulj G, Vrabič R, Podržaj P (2021) A Wearable IMU System for Flexible Teleoperation of a Collaborative Industrial Robot. Sensors (Switzerland) 21:5871.
- Chico A, Cruz PJ, Vásconez JP, Benalcázar ME, Álvarez R, Barona L, Valdivieso ÁL (2021) Hand Gesture Recognition and Tracking Control for a Virtual UR5 Robot Manipulator. In: 2021 IEEE Fifth Ecuador Technical Chapters Meeting (ETCM). IEEE, pp 1–6.
Figure 1.
a) MIMUs positioning on forearms; b) experimental set-up.
Figure 2.
Averaged RMS values of forearm acceleration for the three modalities of each type of movements.
Figure 2.
Averaged RMS values of forearm acceleration for the three modalities of each type of movements.
Figure 3.
Acceleration RMS value for all subjects comparing test and retest in rFR modality, as an example.
Figure 3.
Acceleration RMS value for all subjects comparing test and retest in rFR modality, as an example.
Figure 4.
Outliers identification for each trial and for all groups of movements.
Table 1.
ICC (3,1), ICC (1,1) and CV results of normal movements.
| ICC (3,1) | Lower limit 95% CI for ICC (3,1) |
Upper limit 95% CI for ICC (3,1) |
ICC (1,1) | Lower limit 95% CI for ICC (1,1) |
Upper limit 95% CI for ICC (1,1) |
CV (%) | ||
|---|---|---|---|---|---|---|---|---|
| rFR | all | 0.37 | -0.02 | 0.66 | 0.34 | -0.05 | 0.63 | 11.31 |
| no_o | 0.37 | -0.02 | 0.66 | 0.34 | -0.05 | 0.63 | 11.31 | |
| u45 | 0.81 | 0.51 | 0.94 | 0.82 | 0.55 | 0.94 | 5.64 | |
| o45 | -0.20 | -0.68 | 0.40 | -0.27 | -0.71 | 0.32 | 17.92 | |
| lFR | all | 0.52 | 0.17 | 0.75 | 0.52 | 0.18 | 0.75 | 9.85 |
| no_o | 0.64 | 0.33 | 0.82 | 0.65 | 0.35 | 0.83 | 8.60 | |
| u45 | 0.77 | 0.43 | 0.92 | 0.78 | 0.47 | 0.93 | 6.43 | |
| o45 | 0.09 | -0.49 | 0.61 | 0.11 | -0.46 | 0.62 | 13.83 | |
| lLA | all | 0.63 | 0.33 | 0.82 | 0.64 | 0.34 | 0.82 | 8.54 |
| no_o | 0.72 | 0.45 | 0.87 | 0.72 | 0.47 | 0.87 | 7.54 | |
| u45 | 0.75 | 0.38 | 0.91 | 0.75 | 0.39 | 0.91 | 6.50 | |
| o45 | 0.44 | -0.15 | 0.80 | 0.47 | -0.09 | 0.81 | 10.92 | |
Table 2.
ICC and CV results of abrupt movements generated by the visual alarm.
| ICC (3,1) | Lower limit 95% CI for ICC (3,1) |
Upper limit 95% CI for ICC (3,1) |
ICC (1,1) | Lower limit 95% CI for ICC (1,1) |
Upper limit 95% CI for ICC (1,1) |
CV (%) | ||
|---|---|---|---|---|---|---|---|---|
| rFR | all | 0.34 | -0.05 | 0.64 | 0.36 | -0.02 | 0.65 | 19.08 |
| no_o | 0.34 | -0.05 | 0.64 | 0.36 | -0.02 | 0.65 | 19.08 | |
| u45 | 0.53 | 0.03 | 0.82 | 0.54 | 0.06 | 0.82 | 15.00 | |
| o45 | 0.14 | -0.45 | 0.64 | 0.18 | -0.40 | 0.66 | 23.33 | |
| lFR | all | 0.45 | 0.08 | 0.71 | 0.46 | 0.10 | 0.72 | 16.31 |
| no_o | 0.51 | 0.16 | 0.75 | 0.52 | 0.18 | 0.76 | 15.44 | |
| u45 | 0.62 | 0.15 | 0.86 | 0.64 | 0.20 | 0.87 | 12.86 | |
| o45 | 0.11 | -0.48 | 0.62 | 0.15 | -0.42 | 0.64 | 20.33 | |
| lLA | all | 0.46 | 0.09 | 0.71 | 0.43 | 0.06 | 0.70 | 16.04 |
| no_o | 0.71 | 0.43 | 0.87 | 0.68 | 0.39 | 0.85 | 12.22 | |
| u45 | 0.25 | -0.30 | 0.68 | 0.27 | -0.27 | 0.68 | 17.71 | |
| o45 | 0.77 | 0.37 | 0.93 | 0.69 | 0.25 | 0.90 | 14.08 | |
Table 3.
ICC and CV results of abrupt movements generated by the acoustic alarm.
| ICC (3,1) | Lower limit 95% CI for ICC (3,1) |
Upper limit 95% CI for ICC (3,1) |
ICC (1,1) | Lower limit 95% CI for ICC (1,1) |
Upper limit 95% CI for ICC (1,1) |
CV (%) | ||
|---|---|---|---|---|---|---|---|---|
| rFR | all | 0.57 | 0.25 | 0.78 | 0.58 | 0.25 | 0.78 | 13.42 |
| no_o | 0.52 | 0.17 | 0.76 | 0.53 | 0.19 | 0.76 | 12.96 | |
| u45 | 0.62 | 0.16 | 0.86 | 0.59 | 0.12 | 0.85 | 15.64 | |
| o45 | 0.53 | -0.03 | 0.84 | 0.55 | 0.02 | 0.84 | 10.83 | |
| lFR | all | 0.50 | 0.14 | 0.74 | 0.51 | 0.16 | 0.74 | 13.65 |
| no_o | 0.78 | 0.55 | 0.90 | 0.78 | 0.71 | 0.95 | 10.34 | |
| u45 | 0.69 | 0.27 | 0.89 | 0.71 | 0.32 | 0.89 | 13.64 | |
| o45 | 0.08 | -0.50 | 0.60 | 0.11 | -0.46 | 0.62 | 13.67 | |
| lLA | all | 0.61 | 0.30 | 0.81 | 0.62 | 0.31 | 0.81 | 13.19 |
| no_o | 0.77 | 0.54 | 0.89 | 0.77 | 0.54 | 0.89 | 10.71 | |
| u45 | 0.68 | 0.26 | 0.89 | 0.70 | 0.31 | 0.89 | 14.14 | |
| o45 | 0.34 | -0.26 | 0.75 | 0.30 | -0.28 | 0.73 | 12.08 | |
Disclaimer/Publisher’s Note: The statements, opinions and data contained in all publications are solely those of the individual author(s) and contributor(s) and not of MDPI and/or the editor(s). MDPI and/or the editor(s) disclaim responsibility for any injury to people or property resulting from any ideas, methods, instructions or products referred to in the content. |
© 2023 by the authors. Licensee MDPI, Basel, Switzerland. This article is an open access article distributed under the terms and conditions of the Creative Commons Attribution (CC BY) license (http://creativecommons.org/licenses/by/4.0/).
Copyright: This open access article is published under a Creative Commons CC BY 4.0 license, which permit the free download, distribution, and reuse, provided that the author and preprint are cited in any reuse.
EMG-Based 3D Hand Motor Intention Prediction for Information Transfer from Human to Robot
Aberham Feleke
et al.
Sensors,
2021
Deep Vibro-Tactile Perception for Simultaneous Texture Identification, Slip Detection, and Speed Estimation
Yerkebulan Massalim
et al.
Sensors,
2020
Gaining a Sense of Touch Object Stiffness Estimation Using a Soft Gripper and Neural Networks
Michal Bednarek
et al.
Electronics,
2021


MDPI Initiatives
Important Links
© 2024 MDPI (Basel, Switzerland) unless otherwise stated