1. Introduction
Hot rolling is a process of metal forming performed above the recrystallization temperature. In the industry, there are two typical hot rolling mills. The first option is the reverse hot rolling mill, often replaced with the tandem rolling mill as the second option [
1]. Compared hot rolled aluminium alloy EN AW-8021B on the mentioned two mill types results in the differences in microstructure, texture and mechanical properties. The diverse average grain size and homogeneity throw the cross-section of microstructure and the intensity of texture produced with the hot rolling was transferred to the cold rolling down to the final foil thickness. The performance of the hot rolling process is essential for further metal forming processing and desired properties [
2,
3].
Numerical simulations of hot rolling for aluminium alloys assume various technological and operational parameters [
4]. The interestingness is often focused on the temperature, stress, strain or rolling force predictions. The influences can be observed with the number variation of the rolling passes [
5]. More detailed analyses of hot rolling simulations were performed by A. R. Shahani et al. [
6], where the workpiece geometry, rolling force, rolling speed, reduction (strain), initial thickness and friction coefficient were systematically changed and influentially evaluated.
The change of rolling temperature from 250 °C to 450 °C for the EN AW-7075 increased elongation (more than 10 %) and ultimate tensile stress (more than 150 MPa). The described improvements are confirmed with the 50 % as well with the 80 % of reduction [
7]. Besides the temperature and reduction’s influence on the mechanical properties, the changed chemical compositions of EN AW-6063 were performed for hot rolling and studied by B. Byra Reddy et al. [
8]
In this paper, the importance of microstructure, texture, mechanical and formability properties for hot rolled EN AW-8011 aluminium alloy are studied in detail. The influence of temperature and reduction changes are compared between simulated and industrially produced hot rolling. Analyzing the hot-rolled band (HRB) with the optical microscope (OM) and scanning electron microscope (SEM) contributes to the understanding of correlations between fractions of random texture components and recrystallized grains according to the changing hot-rolling parameters. At the same time, mechanical testing realizes the connection between divergent elongations (A) and earing (Ea) measurements.
2. Experimental Procedure
The slabs of aluminium alloy EN AW-8011 with dimensions 490x1150x5000 mm
3 were reverse hot rolled to the different thicknesses of the hot-rolled band (HRB). With the HRB thickness decrease also, the surface temperature of HRB after the last pass was reduced. For the HRB 6 mm, the measured temperature after hot rolling was 356 °C. The hot rolling of HRB 3.25 mm finished with a surface temperature of 320 °C. Homogenization of slabs before the hot rolling was performed with the same regime.
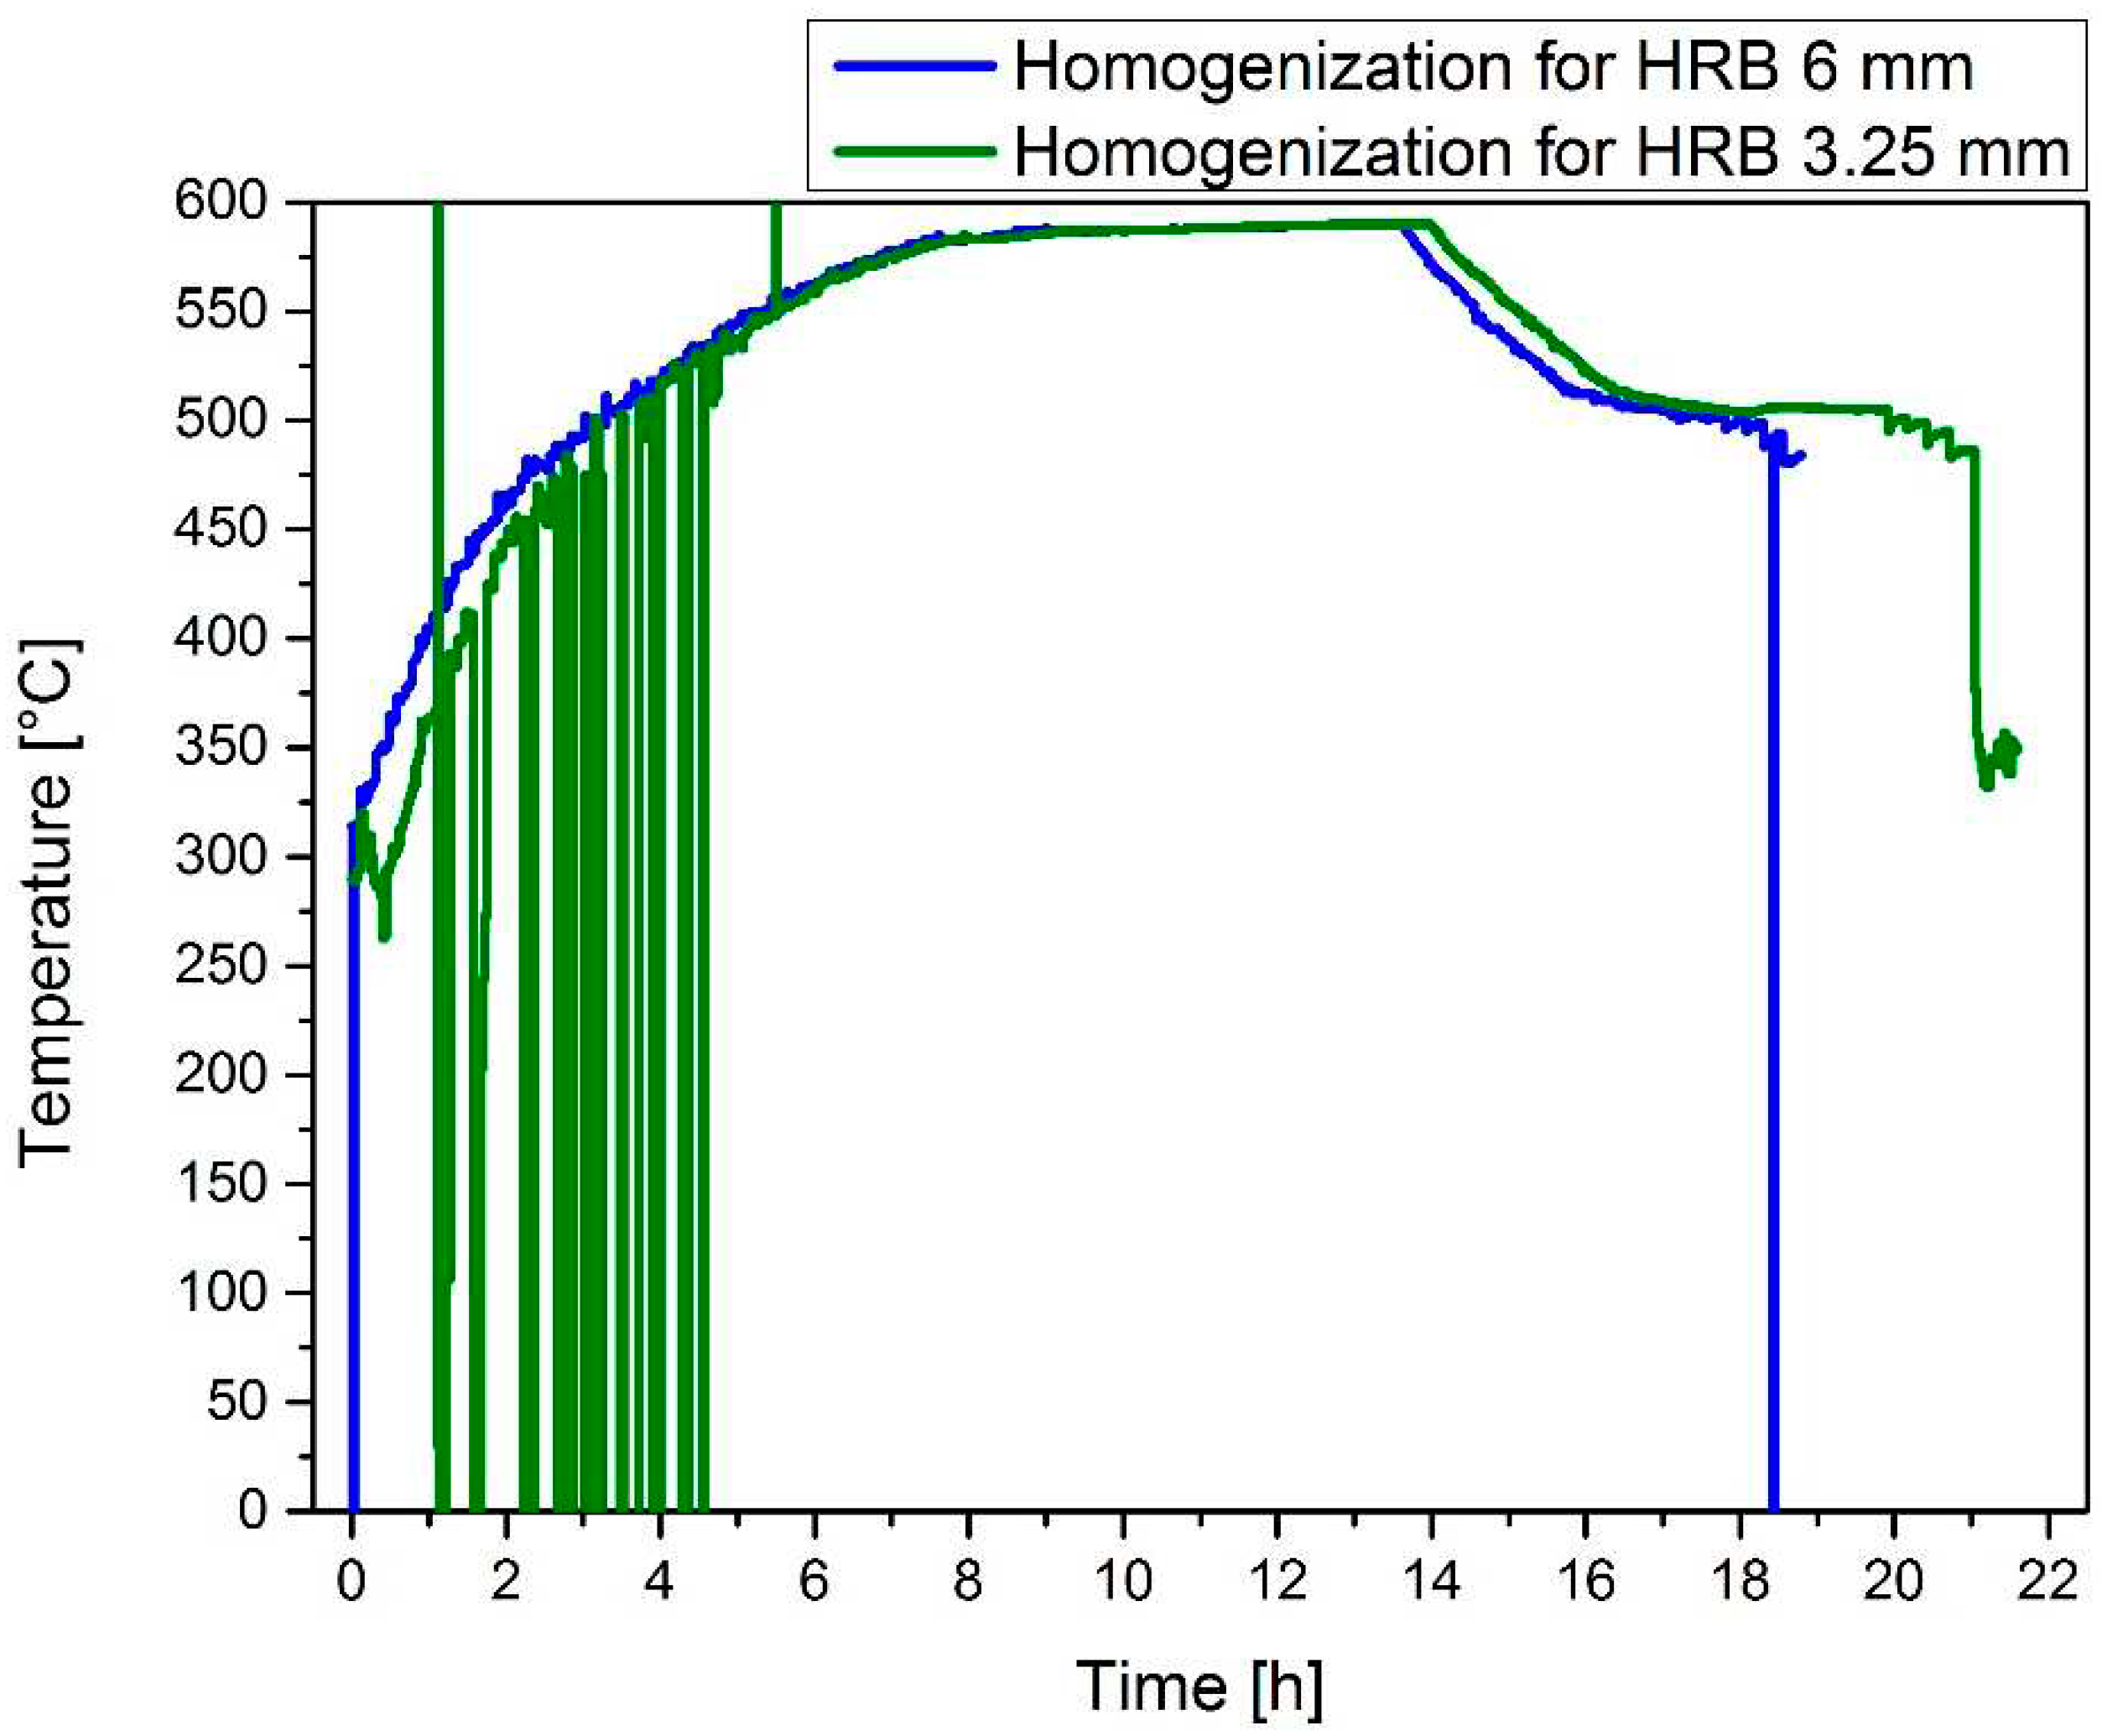
Figure 1 presents that both slabs were treated with the same heating and cooling rate. Similar to the homogenization, minor differences can be observed for the chemical compositions of HRB 6 mm and HRB 3.25 mm (
Table 1). Both HRBs’ chemical compositions correspond to the standard aluminium alloy EN AW-8011.
The simulations set-up contained data on the work roll diameter, the width of a workpiece and the rolling schedule with the number of rolling passes and reduction per pass to the final (exit) thickness. The number of coiling passes with unwind and rewind tension was also considered. The heat-transfer model functions according to the used rolled material (alloy composition). The results of simulations were presented as a comparison of rolling force and surface temperature to the measured values during industrial hot rolling. The roll-gap visualization was used to present the last pass of hot rolling compared to HRB 6 mm and HRB 3.25 mm final thicknesses.
The metallographic preparation of samples captures the grinding, polishing and etching. For the optical microscopy (OM) observation, all three preparation steps were executed, unlike that for the scanning electron microscopy (SEM) analyses, the etching step was replaced with the short time (120 s) of oxide polishing. The average grain size determination was in accordance with the ASTM E112-10. SEM analyses based on the electron backscatter diffraction (EBSD) were the inverse pole figures in the Z direction (IPF-Z), and the grain average misorientation (GAM) figures were obtained. The mentioned figures enabled the detailed texture components arrangement analysis and the microstructure’s recrystallized, substructured and deformed grains proportions. Mechanical properties were measured according to ISO 6892-1:2016 (tensile test in rolling direction RD and transverse direction TD) and ISO 11531:2015 (earing test – anisotropy).
3. Results
3.1. Simulations
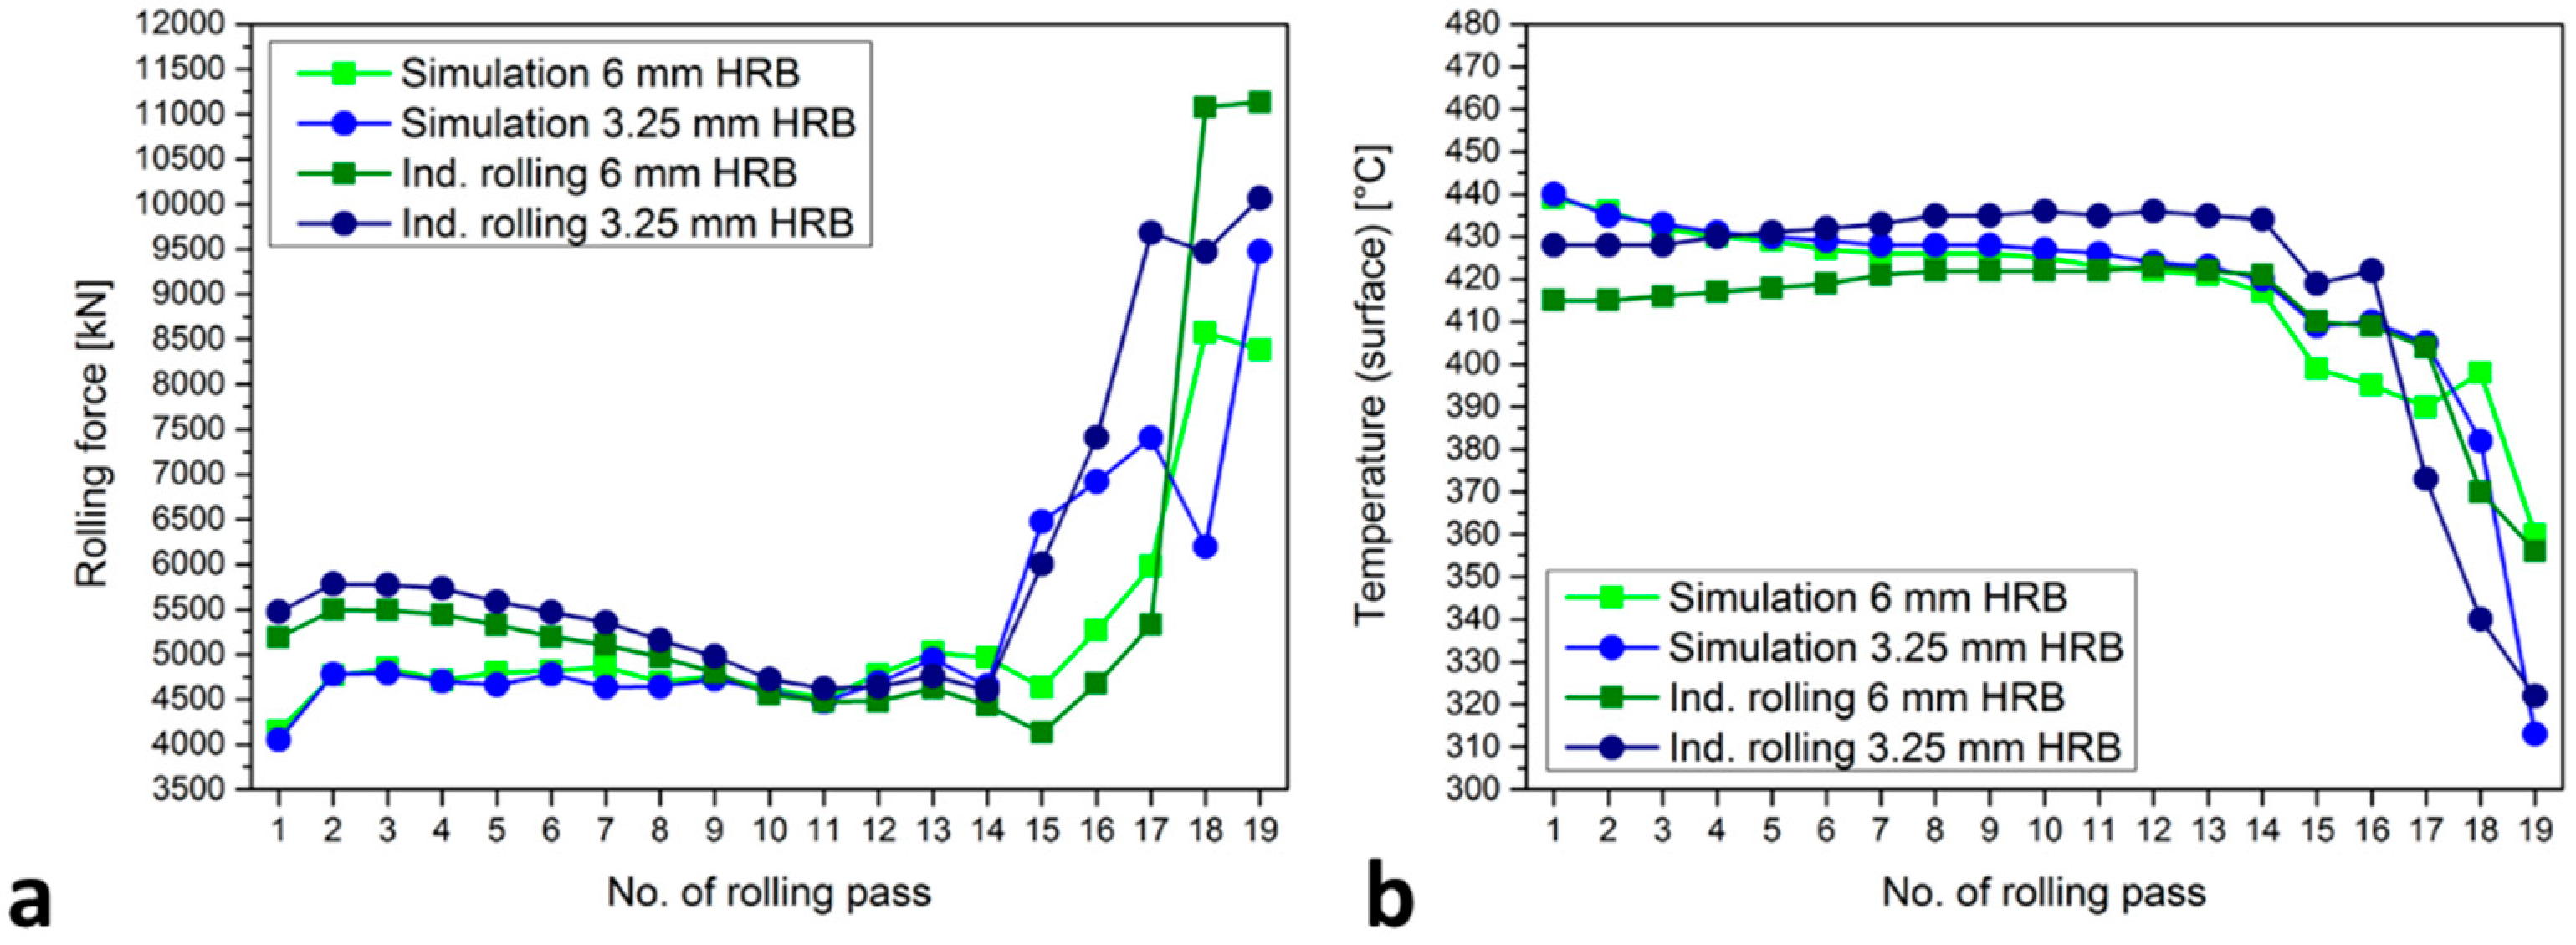
The simulated and industry-measured results of rolling force (
Figure 2a) and surface temperature (
Figure 2b) are compared between two rolling schedules for the final thicknesses of 6 mm and 3.25 mm. The deviation (around 1000 kN) on begin is observed, where the predicted forces with the simulations are lower than measured forces in industrial hot rolling. The difference between measured and predicted forces is that each pass is smaller, from the 7
th pass in the majority matching up to the 15
th pass. In the industrial rolling of HRB 3.25 mm, the drop of the force is observed between the last three passes. The same is also predicted with the simulation for HRB 3.25 mm hot rolling. The rolling force is in both final thicknesses higher at the measured values. For the HRB 3.25 mm, the difference in rolling force for the last 19
th pass is much smaller between the measured and predicted rolling force than for compared HRB 6 mm values and simulation results. In a similar path as rolling forces, the surface’s temperature differs at the beginning of hot rolling. In the comparison of temperatures, there is a deviation of 25 °C, where predicted temperatures are higher than measured. During the passes of hot rolling, the differences between measured and simulated temperatures are reduced, and after the 14
th pass reach, the overlapping of temperatures in both cases of industrial hot rolling and simulations. For the 19
th pass, the predicted temperatures perfectly match with the measured. The stated is observed for HRB 6 mm and HRB 3.25 mm, where the temperatures are lower as in the compared cases.
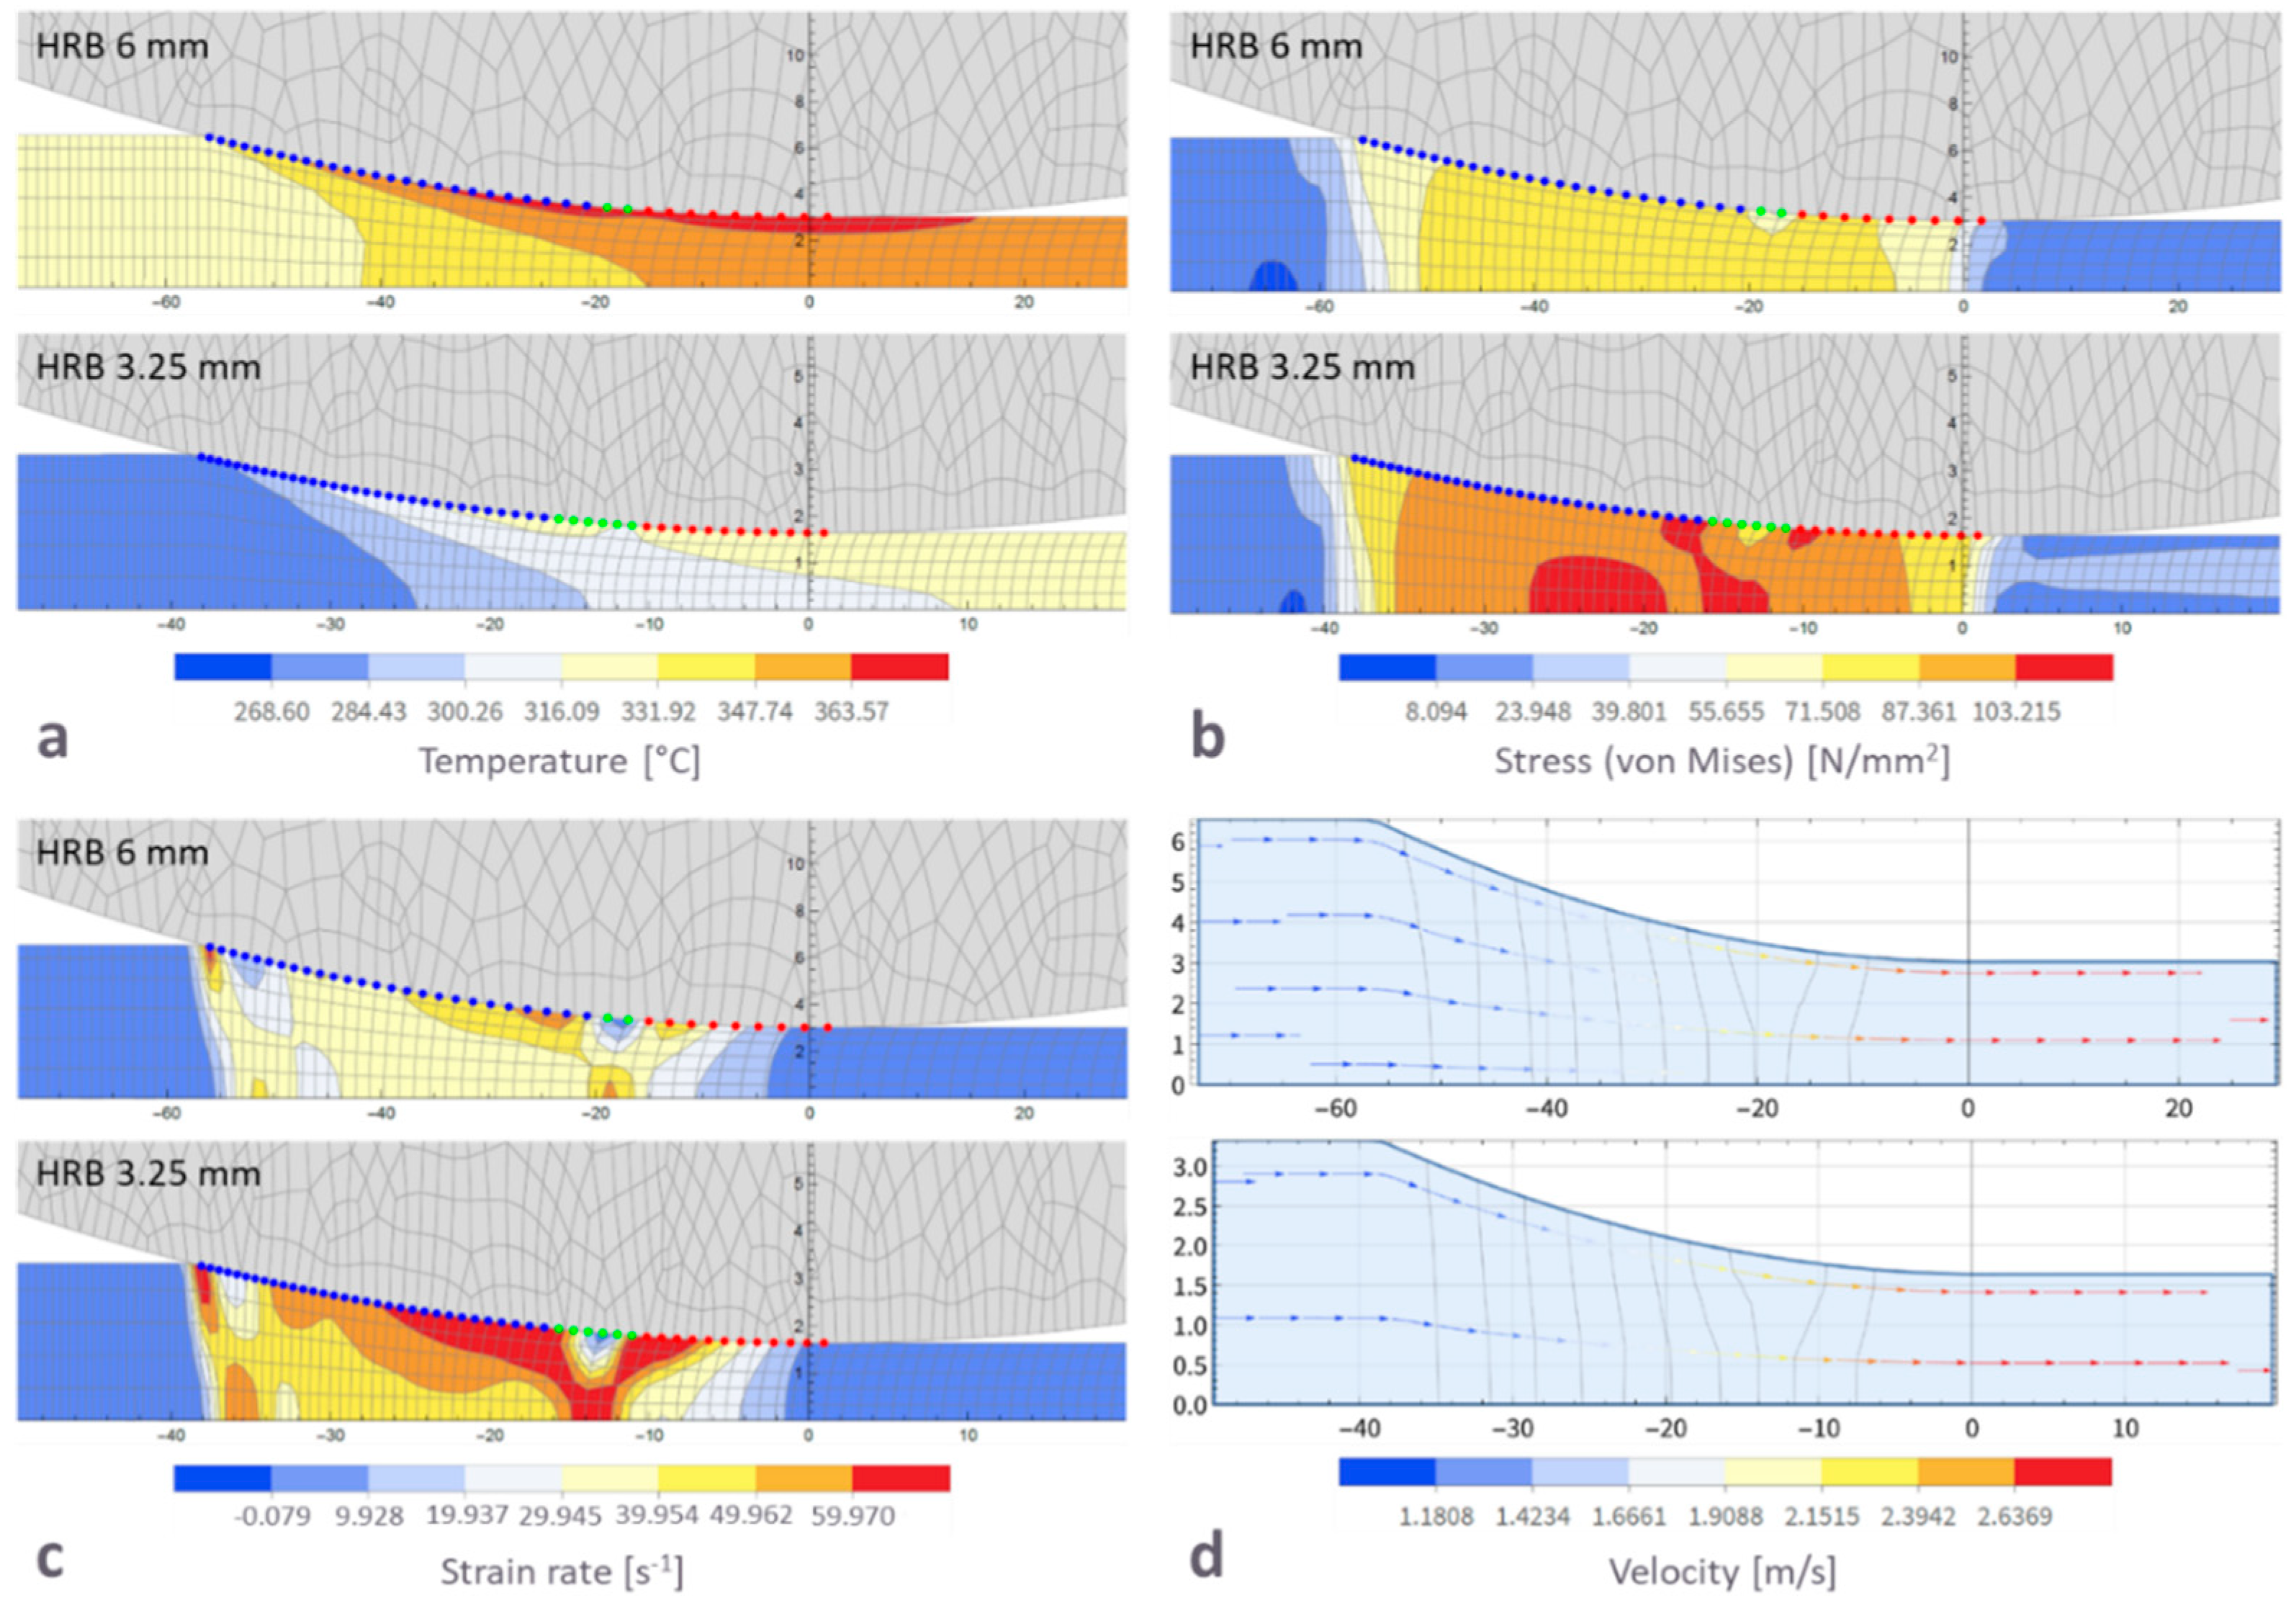
The simulation results also visualize rolling gaps (half of the workpiece). In
Figure 3a the visualization of the temperature of rolling gaps for the last hot-rolling pass is presented. It is visible that the final temperature at HRB 6 mm is higher (around 370 °C) than at HRB 3.25 mm (about 320 °C). Comparing the mentioned visualizations of rolling gaps, the entry temperature of HRB 6 mm is similar to the exit temperature of HRB 3.25 mm.
Figure 3b shows us the comparison of stress distribution during the last pass of hot rolling. In the center of HRB 3.25 mm, stresses are higher than 100 N/mm
2. The expected stresses for the HRB 6 mm in the center are similar to those for the 3.25 mm before the exit of a rolling gap. Furthermore, there are strain rate visualizations of rolling gaps in
Figure 3c. Higher strain rate values were observed at the HRB 3.25 mm compared to the HRB 6 mm. The maximum strain rate at the HRB 6 mm is higher than 50 s
-1 but in three small spots. For the HRB 3.25 mm, the majority strain rate is higher than 40 s
-1. For mentioned simulation (HRB 3.25 mm) strain rate in the center of the rolling gap is higher than 60 s
-1. The velocity of the workpiece is for both compared HRBs even (
Figure 3d). On the entry of the rolling gap, the velocity is 1.12 m/s. The velocity of the workpiece on the exit of a rolling gap is 2.63 m/s.
3.2. Metallography
The cross-section LM microstructures of compared HRBs are presented in
Figure 4. In general, the microstructures of the HRB 3.25 mm have more homogeneous distributed crystal grains than at HRB 6 mm. The shape and size of crystal grains at HRB 3.25 mm are more even from the upper to the bottom sample cross-section. It is also remarkable that at HRB 6 mm in edge 2 sample are crystal grains in the center significantly bigger than at sample’s edge 1 and center.
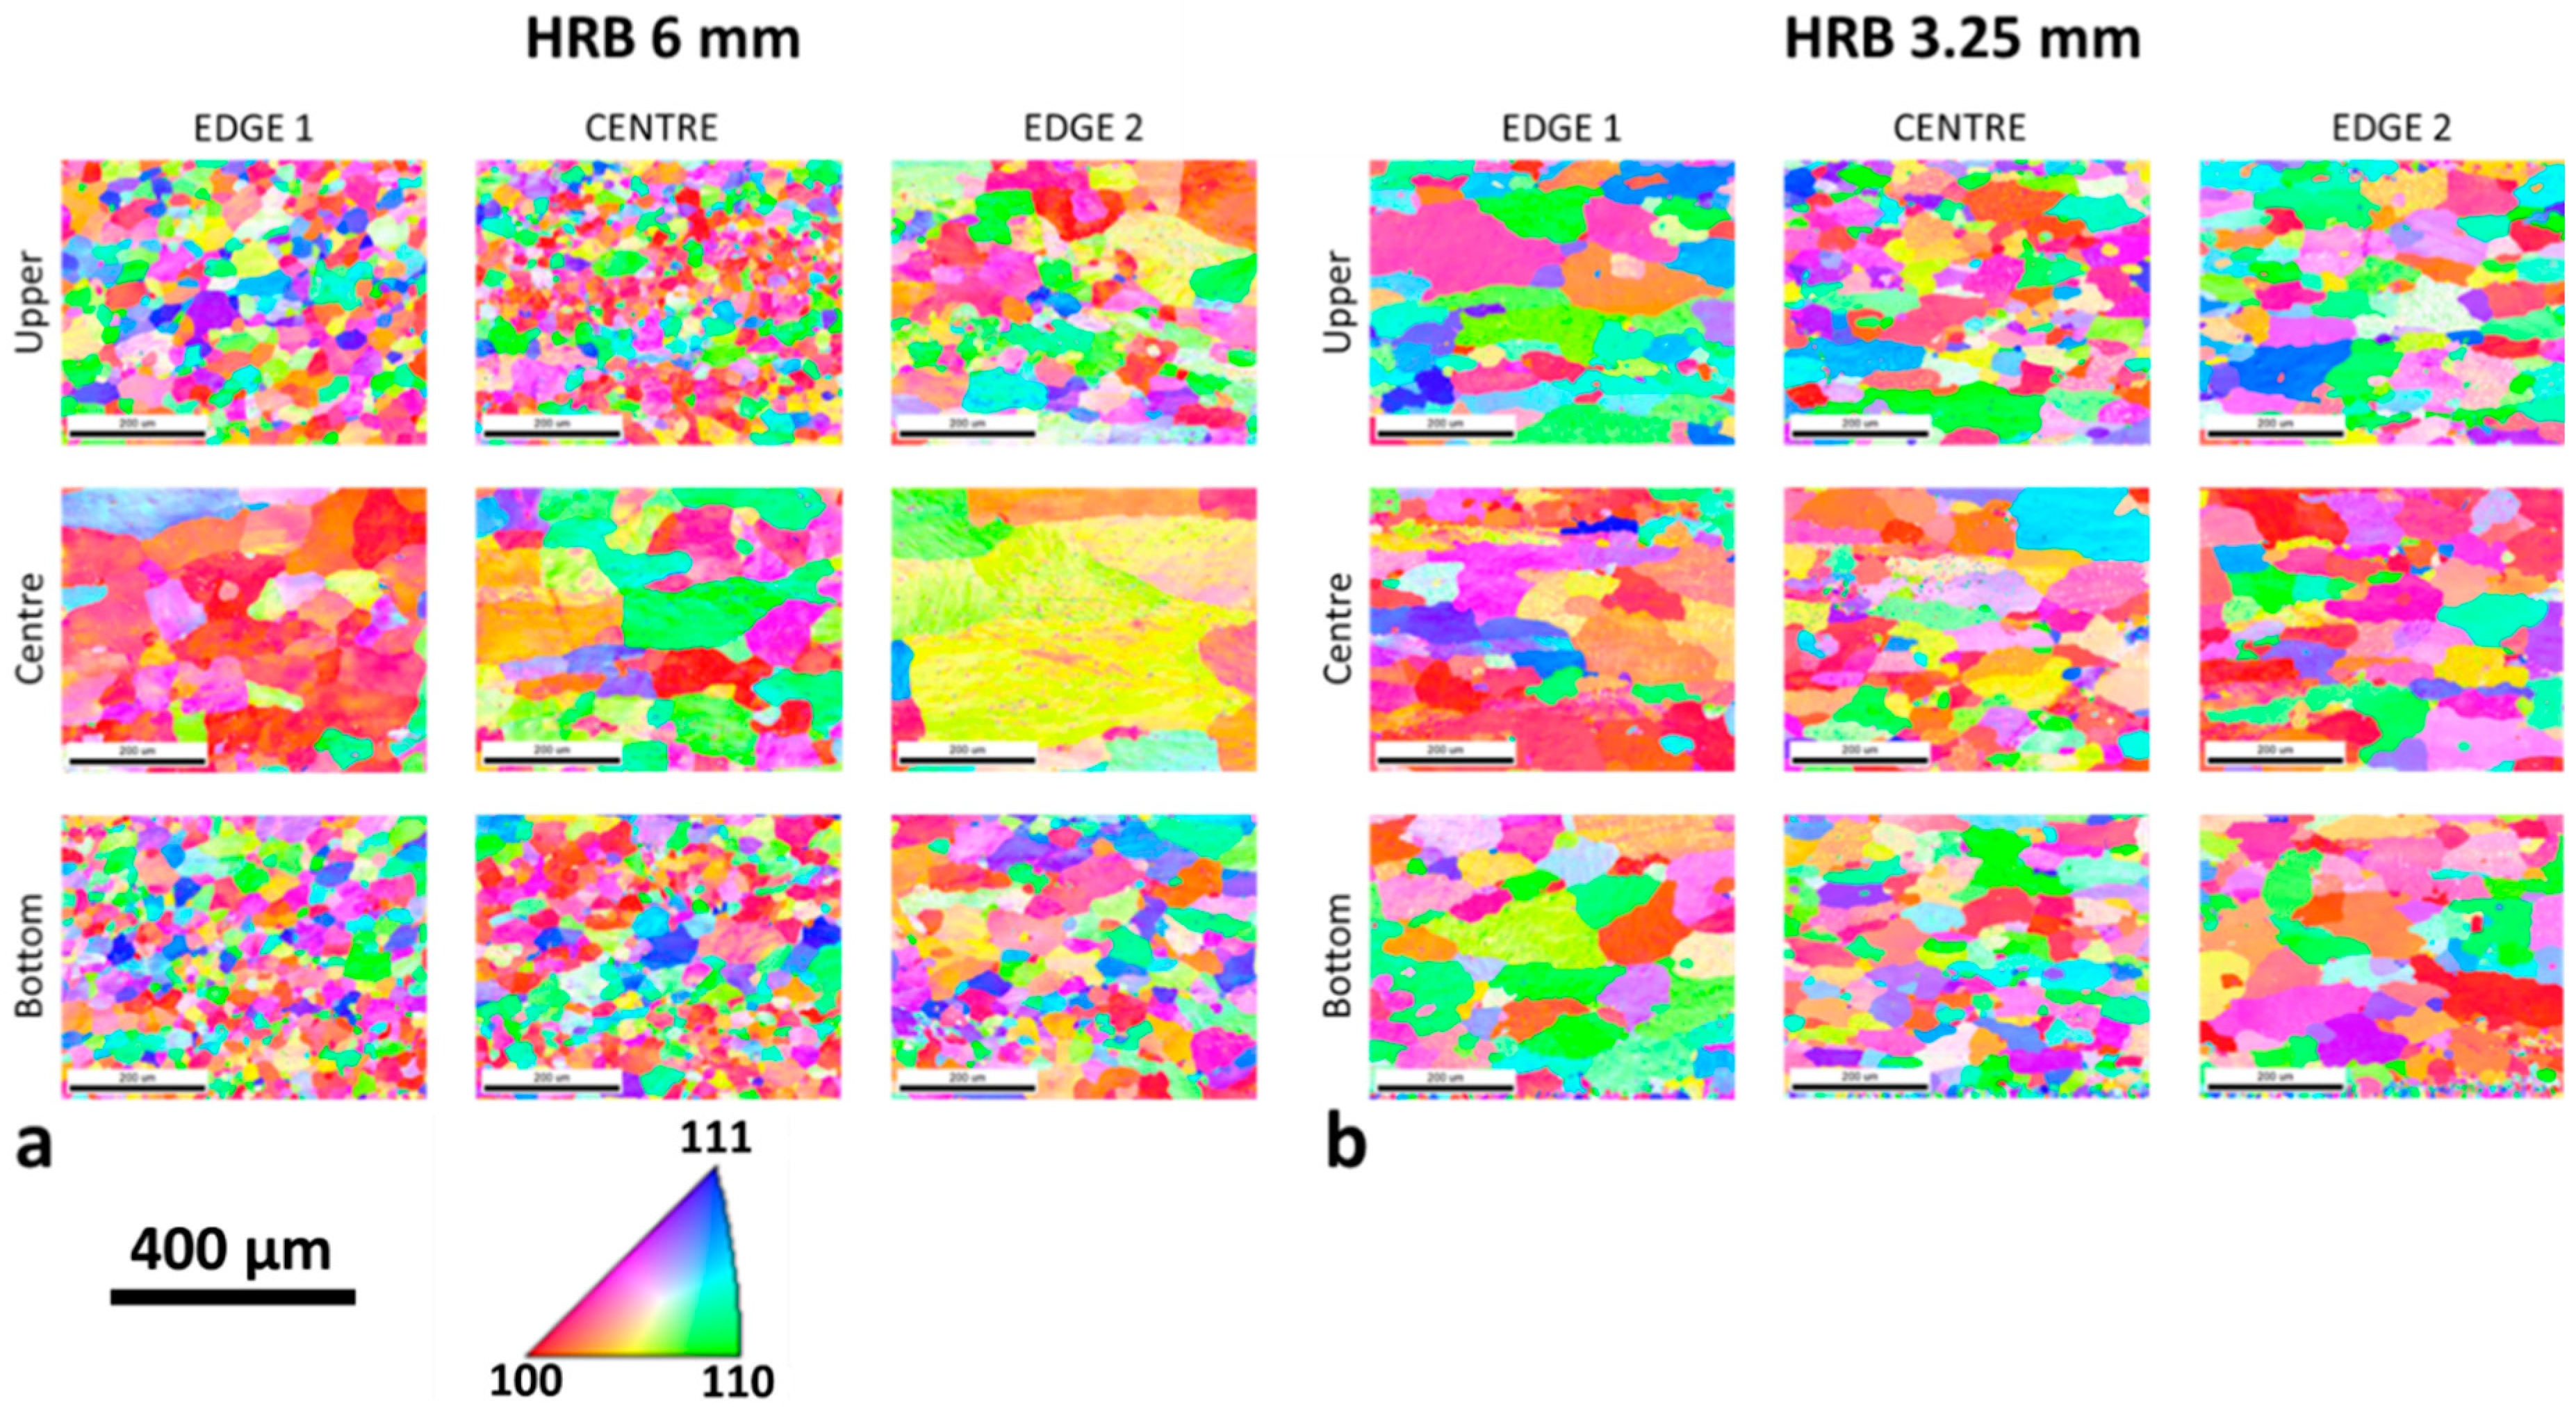
Mentioned deviation of grain size in the center of the edge 2 sample at HRB 6 mm is recognized in
Figure 5. IPF-Z figures from EBSD maps confirm the visual observations of LM microstructures. The upper and bottom locations with finer grain microstructure of cross-sections are more typical for the HRB 6 mm samples. At the same time, the grains in the center of the cross-section of the thicker HRB are larger than on the edges and in the center of the thinner HRB. It is important to mention that reduction of HRB final thickness (from 6 mm to 3.25 mm) has also resulted in some longitudinal (deformed) crystal grains in the center of all three cross-sections among the width of HRB 3.25 mm.
The detailed results of the crystal grains’ average size are presented in
Table 2. The values of measurements with the LM and SEM-EBSD techniques are comparable and in major deviate less than 10 µm. For the HRB 6 mm, the biggest grains (213.7 µm) are in the center position of the edge 2 sample. For the HRB 3.25 mm, the biggest grains (89.8 µm) were measured at the center position of the edge 1 sample. The smallest crystal grains are present at the center sample for both analyzed samples. The lowest value (28.3 µm) for HRB 6 mm, confirms the larger heterogeneity among the cross-section of the thicker HRB than at the thinner HRB, where the smallest grains were 45.5 µm.
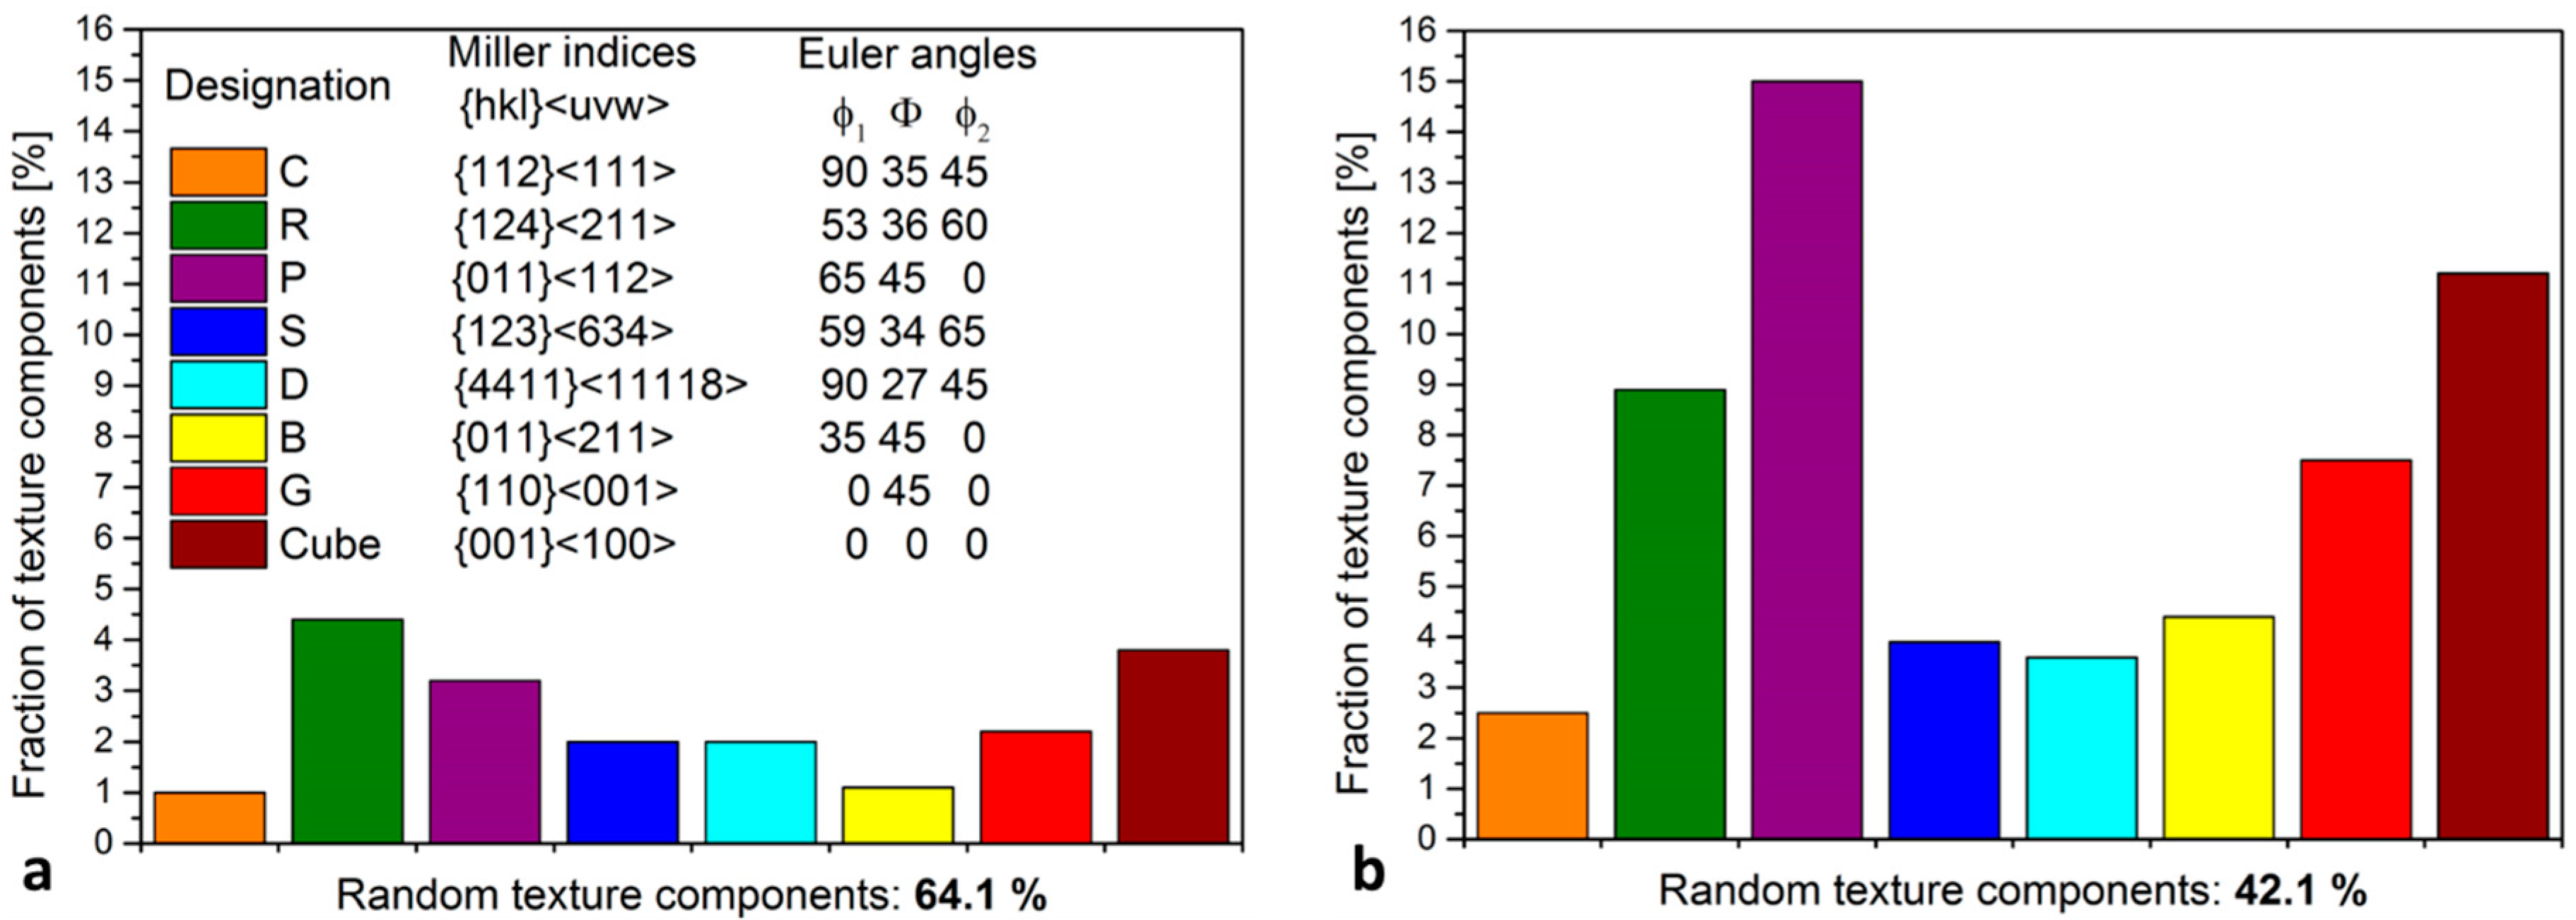
For the crystal orientation analysis, the fraction of the eight most common texture components of aluminium rolled textures were compared for the HRB 6 mm (
Figure 6a) and HRB 3.25 mm (
Figure 6b). The texture components R and Cube (more than 4 %) have the largest fraction at the HRB 6 mm sample. There is a smaller percentage of all other six analyzed texture components, but with the smaller percent, what explain the 64.1 % of random texture components. The random texture components value is defined and calculated as difference of 100 % and sum of all eight analyzed texture components percentage. Compared to the HRB 3.25 mm, the sample of the random texture components is reduced by more than 20 %. The increased fraction of all eight analyzed texture components contribute to this trend. There are just texture components C and D with a lower fraction of 4 %. Same as at the HRB 6 mm, also at the HRB 3.25 mm, the texture components R and Cube are dominant. Despite the above, it is necessary to point out that at the texture of HRB 3.25 mm, the component P with around 15 % is predominant.
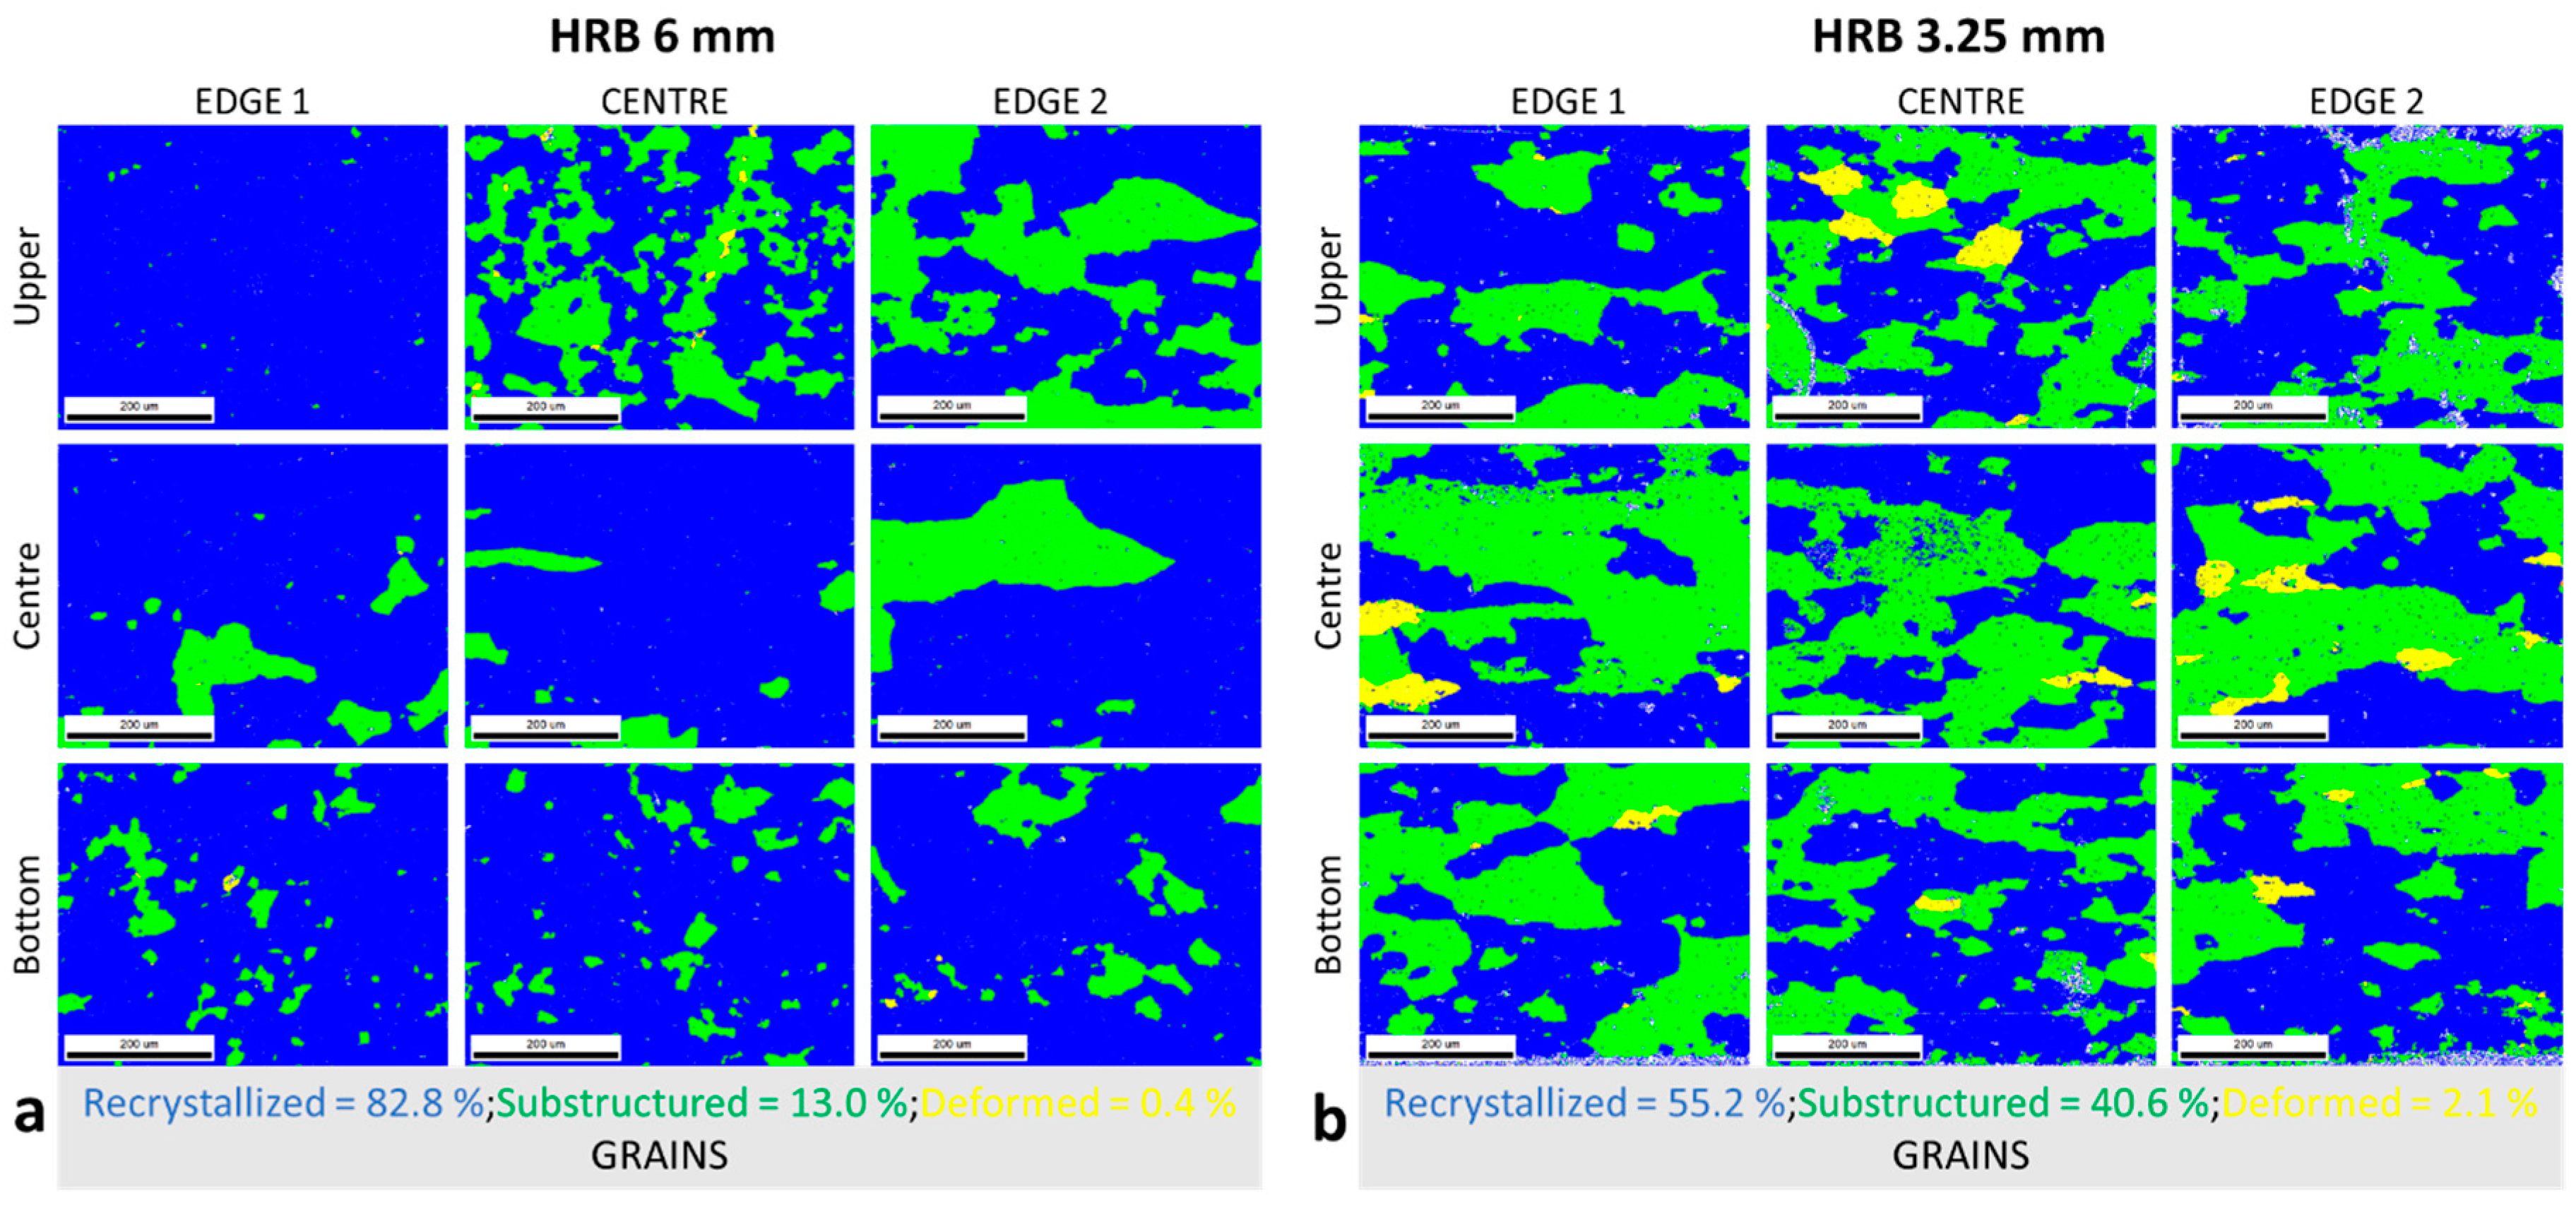
The share of recrystallized grains is reduced in correlation to the reduction of the random texture components with the decrease of HRB thickness from 6 mm to 3.25 mm. This is shown with the grain average misorientation (GAM) maps, where
Figure 7a presented the ratio of recrystallized, substructured and deformed grains for HRB 6 mm and the
Figure 7b the ratio of the same grains (microstructure) condition for the HRB 3.25 mm. The share of recrystallized grains is for the HRB 6 mm, around 82.8 %. The percentage of substructured grains is for the same sample 13.0 %, and 0.4 % of grains are in the deformed condition. As already mentioned, the share of recrystallized grains is decreased with the reduction of HRB thickness. At the same time, the percentage of substructured and deformed grains is increased. For the HRB 3.25 mm, the share of recrystallized grains is 55.2 %, a percentage of 40.6 % presents the substructured grains, and 2.1 % in the microstructure belongs to the deformed condition of grains.
3.3. Mechanical Properties and Formability
The major differences in mechanical properties between HRB 6 mm and 3.25 mm were observed in the elongation (A) in the transverse direction (TD) according to the rolling direction (RD). There is a difference of more than 6 % on the sample of edge 2, the A value is 41.0 % for the HRB 6 mm and 25.8 % for the HRB 3.25 mm. The interval of measured A is for the thicker HRB from 40.0 % to 41.0 %, although the interval of thinner HRB is from 41.6 % to the already mentioned value of 25.8 %, observed the both RD and TD directions of testing. There are also differences between Rm and Rp0.2 for compared HRB with different thicknesses, but the values of mentioned properties don’t differ more than 6 MPa (
Table 3).
In connection to the microstructure and mechanical properties (A) heterogeneity, the values of earing (Ea) confirm the findings. The anisotropy of HRB 6 mm is significantly lower compared to HRB 3.25 mm. The highest Ea values (2.58 % and 2.63 %) are presented on edge 1 and 2 positions of the HRB 3.25 mm. The trend of the higher Ea is also visible at the center position of HRB 3.25 mm. The extreme, even (±0.02) and drastically lower (for around 0.80 %) are Ea values for the HRB 6 mm, which shows the lower anisotropy and homogeneity of the material (
Table 3).
4. Discussion
Reducing HRB’s final thickness from 6 mm to 3.25 mm contributes to fewer cold rolling passes, which decreases the operation and the wear of rolling mills. As a result, the shorter operating time of rolling mills generally allows higher productivity. The environmental protection, besides the possibility of rolling force reduction, is also recognized with the reduced energy consumption comparing the further cold rolling to the final foil thickness of 90 µm [
9]. Comparing the technologies of cold rolling from an energy point of view were for cold rolling from 3.25 mm HRB spend 53.2 kWh less than cold rolling from 6 mm HRB to the foil of 90 µm.
The already mentioned decrease of rolling force is also possible with asymmetric rolling [
10]. Performing any option of asymmetry during cold rolling has peculiar microstructural, texture and technological advantages [
11]. However, the changes and adjustments of hot rolling are easier to implement in industrial plants due to the suitability of the rolling mill for asymmetric rolling. Further, the appearance of the ski effect with the asymmetric rolling demand to the additional operation of tensile stretch or cutting off a larger share of the rolled product reduces productivity.
For the special trendy foil products like coffee caps or battery foils, the characterization encompassing SEM with the EBSD technique slowly passes from merely researching and scientific approaches to the standard control techniques in the industry. The requirements for the specific formability properties, less anisotropic or certain share of cube texture component in rolled material indicate the inability for control with the LM techniques [
12]. The detailed SEM-EBSD analyses have been proven to be extremely useful with the results of random texture components and the percentage of recrystallized grains. Those results for the HRBs enable the planning of suitable technology for cold rolling. The desired mechanical and metallographic properties of foil were possible only with the acquaintance of HRB’s properties and changes caused during hot rolling adjustments.
The major focus of properties for aluminium special rolled products is most often on the formability, deep-drawability and anisotropy, which can be connected and explained with the microstructure (grain size) and texture of material [
13]. The reduction of the final hot-rolling temperature and thickness of HRB for the Rm and Rp0.2 measured values does not represent a key influence. On the other hand, the mentioned two changed parameters have effect on the A in TD and Ea values. The decrease of hot rolling temperature helped by producing in average of the smaller crystal grains, but in the same time the increase of the share of deformed and substructured grains has the greater influence on the reduction of A values in TD [
14]. The decrease of recrystallized grains with the smaller HRB final thickness has a contribution also to the higher anisotropy shown by Ea values [
15]. The drop of recrystallized grains and especially random texture components share for lower HRB thickness finished with lower hot-rolling temperature are reason and in the same time the explanation for the higher and among width of rolled products heterogenic Ea values [
16].
5. Conclusions
The influences of the thickness reduction and the surface temperature after the last pass of industrial hot rolling were studied on the EN AW-8011 aluminium alloy. The chemical compositions and homogenization regimes of analyzed 6 mm and 3.25 mm hot-rolled bands (HRB) material were the same. From the combination of simulation calculations, industrial hot rolling and materials characterization analysis, it can be concluded:
The hot rolling simulations predicted the rolling force and temperature on the surface of the workpiece for each rolling pass. Compared to the measured values of industrial hot rolling, the simulation results match to a greater extent and predict the possible intermediate deviations from increasing and decreasing trends.
The thickness and, consequently, the temperature reduction of HRBs provide microstructure with more evenly distributed (homogeneous) grains of similar size through the cross-section. For the HRB 3.25 mm, the smaller grains appeared in the center of the cross-section, unlike for the HRB 6 mm, where the smaller grains were detected on the upper and bottom positions of the cross-section.
HRB 6 mm has 64 % random texture components and 83 % recrystallized grains. The effect of temperature and thickness reduction causes the proportional adjustment for HRB 3.25 mm, where 42 % are random texture components and 55 % of grains are recrystallized.
Elongation (A) values in rolling (RD) and transverse (TD) directions significantly differ, just in the case of HRB 3.25 mm. Consequently, the earing results (Ea) are more than 1.5 % higher for HRB 3.25 mm compared to HRB 6 mm.
The reduction of HRB thickness partially affects the microstructure and mechanical properties, which was also confirmed with HRB samples of intermediate 4 mm thickness. Therefore, implementing the desire for increased production must adapt the technology of further cold rolling with considering the microstructure, mechanical and thermal deviated effects.
Author Contributions
Conceptualization, J.K. and P.C.; methodology, J.K.; software, P.Š. and T.Š.; validation, J.K.; formal analysis, T.Š., P.C., I.P. and Č.D.; investigation, J.K., I.P. and Č.D.; writing—original draft preparation, J.K. and K.I.K.; writing—review and editing, ; visualization, J.K. and K.I.K.; supervision, S.K.K and K.I.K.; funding acquisition, K.I.K. All authors have read and agreed to the published version of the manuscript.
Funding
This research was supported by Ansan-Si hidden champion fostering and supporting funded by Ansan city (South Korea). This work was financially supported by the Slovenian Research Agency (core funding No. P2-0132).
Data Availability Statement
The data that supports the findings of this study are available within the paper.
Acknowledgments
The tool for simulating heating, hot and cold rolling was developed within the framework of the MARTINA AND MARTIN projects, which were co-financed by the Ministry of Education, Science and Sports.
Conflicts of Interest
The authors declare no conflict of interest.
References
- Kraner, J.; Smolar, T.; Volšak, D.; Lažeta, M.; Skrbinek, R.; Fridrih, D.; Cvahte, P.; Godec, M.; Paulin, I. Influence of the Hot-Rolling Technique for En Aw-8021B Aluminium Alloy on the Microstructural Properties of a Cold-Rolled Foil. Mater. Tehnol. 2021, 55, 773–779. [Google Scholar] [CrossRef]
- Zhao, Q.; Liu, Z.; Li, S.; Huang, T.; Xia, P.; Lu, L. Evolution of the Brass texture in an Al-Cu-Mg alloy during hot rolling. J. Alloys Compd. 2017. [Google Scholar] [CrossRef]
- Maurice, C.; Driver, J.H. Hot rolling textures of aluminum. Mater. Sci. Forum 1994, 157–6, 807–812. [Google Scholar] [CrossRef]
- Neumann, L.; Kopp, R.; Ludwig, A.; Wu, M.; Bührig-Polaczek, A.; Schneider, M.; Crumbach, M.; Gottstein, G. Simulation of casting, homogenization, and hot rolling: Consecutive process and microstructure modelling for aluminium sheet production. Model. Simul. Mater. Sci. Eng. 2004, 12. [Google Scholar] [CrossRef]
- Bruni, C.; El Mehtedi, M.; Forcellese, A.; Gabrielli, F.; Simoncini, M. Simulation of multipass hot rolling of AA6082 aluminium alloy. J. Steel Relat. Mater. 2004, 2, 109–114. [Google Scholar]
- Shahani, A.R.; Setayeshi, S.; Nodamaie, S.A.; Asadi, M.A.; Rezaie, S. Prediction of influence parameters on the hot rolling process using finite element method and neural network. J. Mater. Process. Technol. 2009, 209, 1920–1935. [Google Scholar] [CrossRef]
- Abolhasani, A.; Zarei-Hanzaki, A.; Abedi, H.R.; Rokni, M.R. The room temperature mechanical properties of hot rolled 7075 aluminum alloy. Mater. Des. 2012, 34, 631–636. [Google Scholar] [CrossRef]
- Byra Reddy, B.; Bharathesh, T.P.; D, S.P. Effect of Hot rolling on Microstructure and Mechanical behaviour of B 4 C nano particulates reinforced Al6063alloy Composites. J. Mech. Civ. Eng. 2021, 18, 53–62. [Google Scholar]
- Kraner, J.; Fajfar, P.; Palkowski, H.; Kugler, G.; Godec, M.; Paulin, I. Microstructure and texture evolution with relation to mechanical properties of compared symmetrically and asymmetrically cold rolled aluminum alloy. Metals (Basel). 2020, 10. [Google Scholar] [CrossRef]
- Kraner, J.; Fajfar, P.; Palkowski, H.; Godec, M.; Paulin, I. Asymmetric cold rolling of an aa 5xxx aluminium alloy. Mater. Tehnol. 2020, 54. [Google Scholar] [CrossRef]
- Kraner, J.; Smolar, T.; Volsak, D.; Cvahte, P.; Godec, M.; Paulin, I. A REVIEW OF ASYMMETRIC ROLLING OSNOVNI PREGLED ASIMETRIČNEGA VALJANJA. Mater. Tehnol. 2020. [Google Scholar] [CrossRef]
- Kraner, J.; Kevorkijan, V.; Godec, M.; Paulin, I. Metallographic Methods For Determining The Quality Of Aluminium Alloys. Mater. Tehnol. 2021, 55, 541–547. [Google Scholar] [CrossRef]
- Zhang, L.; Wang, Y.; Yang, X.; Li, K.; Ni, S.; Du, Y.; Song, M. Texture, microstructure and mechanical properties of 6111 aluminum alloy subject to rolling deformation. Mater. Res. 2017, 20, 1360–1368. [Google Scholar] [CrossRef]
- Wang, B.B.; Xie, G.M.; Wu, L.H.; Xue, P.; Ni, D.R.; Xiao, B.L.; Liu, Y.D.; Ma, Z.Y. Grain size effect on tensile deformation behaviors of pure aluminum. Mater. Sci. Eng. A 2021, 820. [Google Scholar] [CrossRef]
- Hirsch, J. Texture evolution during rolling of aluminium alloys. TMS Light Met. 2008, 1071–1077. [Google Scholar]
- Yoshida, K.; Ishizaka, T.; Kuroda, M.; Ikawa, S. The effects of texture on formability of aluminum alloy sheets. Acta Mater. 2007, 55, 4499–4506. [Google Scholar] [CrossRef]
|
Disclaimer/Publisher’s Note: The statements, opinions and data contained in all publications are solely those of the individual author(s) and contributor(s) and not of MDPI and/or the editor(s). MDPI and/or the editor(s) disclaim responsibility for any injury to people or property resulting from any ideas, methods, instructions or products referred to in the content. |
© 2023 by the authors. Licensee MDPI, Basel, Switzerland. This article is an open access article distributed under the terms and conditions of the Creative Commons Attribution (CC BY) license (http://creativecommons.org/licenses/by/4.0/).
