Submitted:
19 June 2023
Posted:
20 June 2023
You are already at the latest version
Abstract
Keywords:
1. Introduction
2. Previous Work
3. Case-Study Solution Tailoring
3.1. Water treatment facility revisited. Challenges
- -
- The close to minimal room for energy reduction. The operators are selecting the water sources choosing the best available options according to previous research and observations. Depending on the season and the weather, some situations allow minimal number of well selection (e.g. the test scenario within the current work covered a situation when only 2 water sources were able to assure the necessary water for normal expected demand, using flow set-points that determine close to optimal frequencies for the drives).
- -
- The number of selected wells are functioning all day at the same flow set-point regardless of the water demand. This behavior benefits energy consumption pricing due to lower night tariffs. But, the manual water well selection regime will not cover situations of varying water demand, nor situations where faults occur. The outcome would be either wasted water (usually water is wasted) or lack of water for the population (later accumulation of water can be difficult in some periods of time).
- -
- The manual regime cannot distribute the functioning time correctly for the water sources. This may lead to faulty behavior or defects within the well. Currently, the first water source cannot function on flow-based control loops anymore because of slower provision of water, and the fourth water well is not able to keep the flow set-point, having large fluctuations. This leads to an even more limited room for energy efficiency improvement, but considerable necessity for a complete automatic regime.
- -
- To assure the automatic selection of water wells according to accumulated data with the energy efficiency increase as primary objective function but considering also functioning hours of the water wells.
- -
- To assure the automatic activation of the water wells according to varying current water demands, but considering the accumulation perspective for peak hours, the varying flow set-points in the local control loops of the water sources, and other constraints as the upper, lower and optimal limits in pumps driving frequencies.
- -
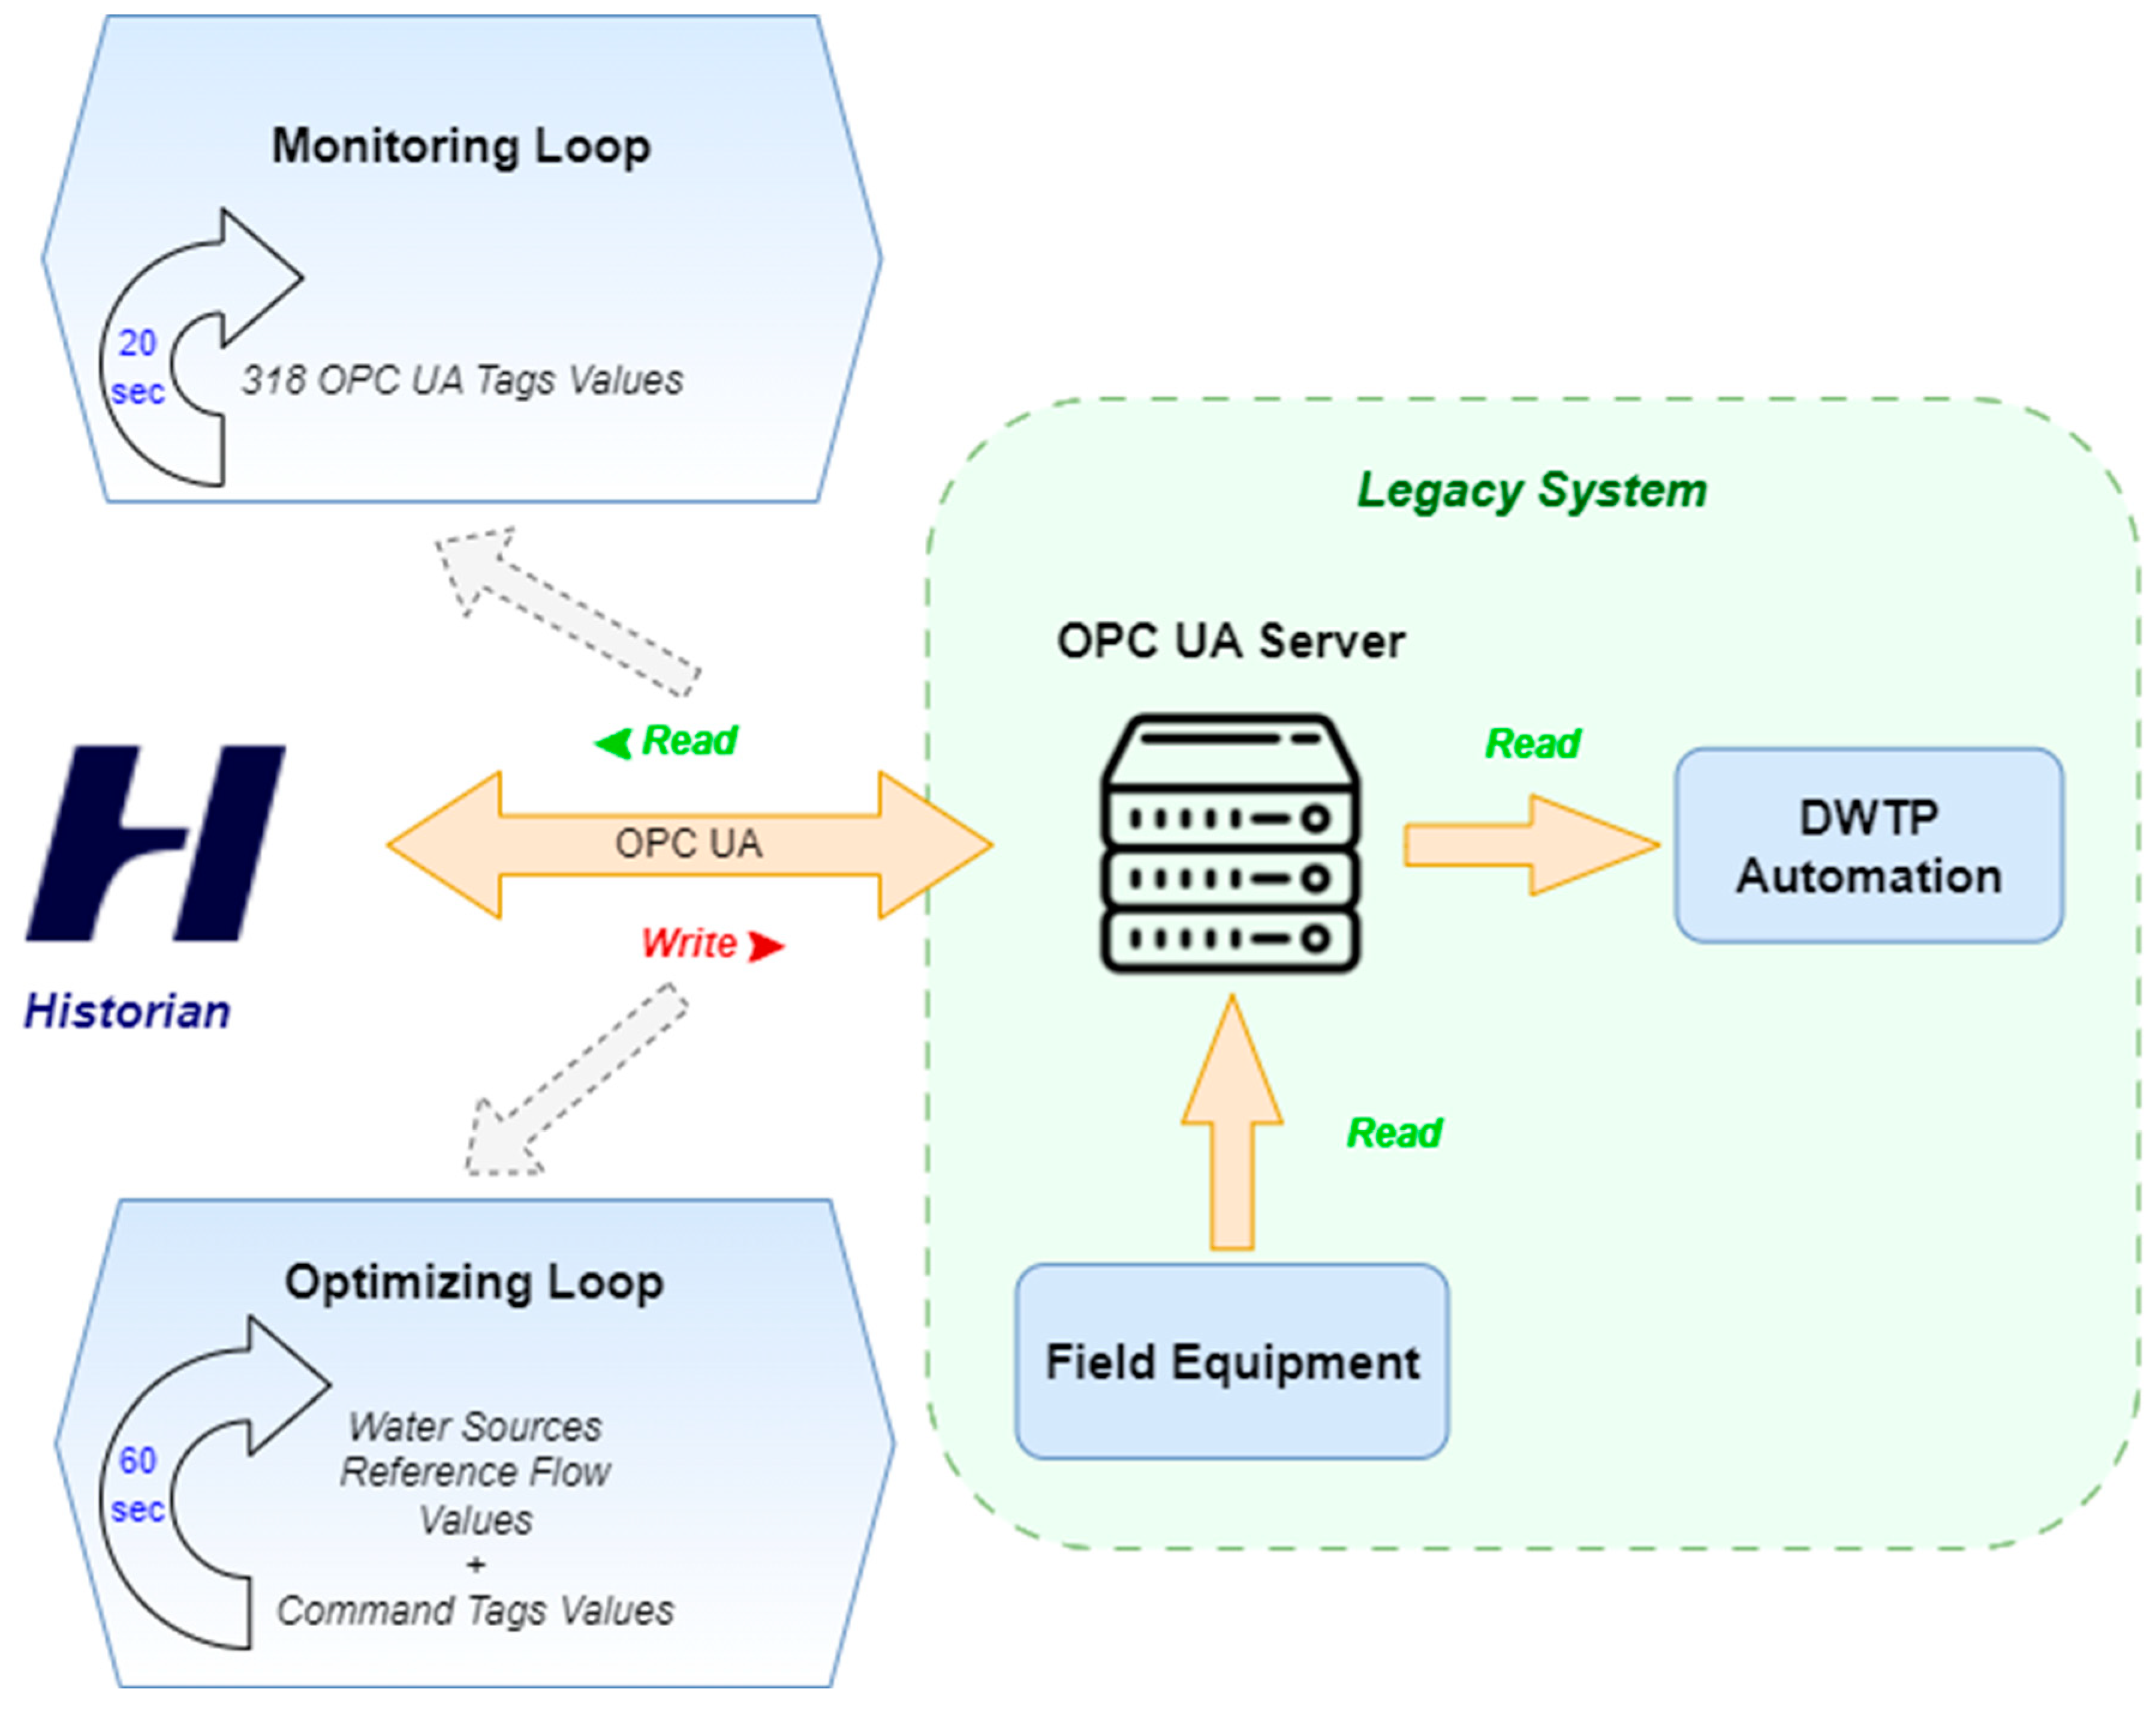
- To interoperate with the legacy system in order to set the flow references and to start/stop the pumps. These task assumes multiple checking and protection functions according to the current manual regime and other functioning regimes at the water source level (e.g. steps in starting and stopping the pumps, level-based regime check, faulty behavior check, faults detected in the local systems, interoperation sampling periods proper setting, etc.).
- -
- To generate general safety procedures to deactivate properly the historian-based interference that provides the automatic regime in case of malfunction signs or on operator demand, with an option to reestablish the previous settings within the local system before decoupling.
- -
- To evaluate the overall performance in the current suboptimal regime and longer-term functioning.
3.2. Architecture and Solution Deployment
4. Results and discussion
4.1. Energy consumption related considerations
4.2. Other considerations
5. Conclusion
Author Contributions
Funding
Institutional Review Board Statement
Informed Consent Statement
Conflicts of Interest
References
- Bansal, M.; Goyal, A.; Choudhary, A. Industrial Internet of Things (IIoT): A Vivid Perspective. Inventive Systems and Control. Lecture Notes in Networks and Systems. 2021, 204, 939–949. [Google Scholar] [CrossRef]
- Meindl, B.; Ayala, N. F.; Mendonca, J.; Frank, A. G. The four smarts of Industry 4.0: Evolution of ten years of research and future perspectives. Technological Forecasting and Social Change 2021, 168, 120784. [Google Scholar] [CrossRef]
- Jamwal, A.; Agrawal, R.; Sharma, M.; Giallanza, A. Industry 4.0 Technologies for Manufacturing Sustainability: A Systematic Review and Future Research Directions. Appl. Sci. 2021, 11, 5725. [CrossRef]
- Ching, N. T.; Ghobakhloo, M.; Iranmanesh, M.; Maroufkhani, P.; Asadi, S. Industry 4.0 applications for sustainable manufacturing: A systematic literature review and a roadmap to sustainable development. Journal of Cleaner Production 2022, 334, 130133. [Google Scholar] [CrossRef]
- Nicolae, A.; Korodi, A.; Silea, I. An Overview of Industry 4.0 Development Directions in the Industrial Internet of Things Context. Rom. J. Inf. Sci. Tech. 2019, 22, 183–201. [Google Scholar]
- Cakir, M.; Guvenc, M. A.; Mistikoglu, S. The experimental application of popular machine learning algorithms on predictive maintenance and the design of IIoT based condition monitoring system. Computers & Industrial Engineering 2021, 151. [Google Scholar] [CrossRef]
- Latif, S.; Driss, M.; Boulila, W.; Huma, Z.e.; Jamal, S.S.; Idrees, Z.; Ahmad, J. Deep Learning for the Industrial Internet of Things (IIoT): A Comprehensive Survey of Techniques, Implementation Frameworks, Potential Applications, and Future Directions. Sensors. 2021, 21, 7518. [Google Scholar] [CrossRef] [PubMed]
- Tidrea, A.; Korodi, A.; Silea, I. Elliptic Curve Cryptography Considerations for Securing Automation and SCADA Systems. Sensors 2023, 23, 2686. [Google Scholar] [CrossRef] [PubMed]
- Xu, D.; Yu, K.; Ritcey, J. A. Cross-Layer Device Authentication With Quantum Encryption for 5G Enabled IIoT in Industry 4.0. IEEE Transactions on Industrial Informatics. 2022, 18, 6368–6378. [Google Scholar] [CrossRef]
- Zhu, S.; Ota, K.; Dong, M. Green AI for IIoT: Energy Efficient Intelligent Edge Computing for Industrial Internet of Things. IEEE Transactions on Green Communications and Networking. 2022, 6, 79–88. [Google Scholar] [CrossRef]
- Ladegourdie, M.; Kua, J. Performance Analysis of OPC UA for Industrial Interoperability towards Industry 4.0. IoT 2022, 3, 507–525. [Google Scholar] [CrossRef]
- Ioana, A.; Korodi, A. DDS and OPC UA Protocol Coexistence Solution in Real-Time and Industry 4.0 Context Using Non-Ideal Infrastructure. Sensors 2021, 21, 7760. [Google Scholar] [CrossRef] [PubMed]
- Javaid, M.; Haleem, A.; Singh, R. P.; Suman, R. Significant Applications of Big Data in Industry 4.0. Journal of Industrial Integration and Management. 2021, 6, 429–447. [Google Scholar] [CrossRef]
- Papadopoulos, T.; Singh, S. P.; Spanaki, K.; Gunasekaran, A.; Dubey, R. Towards the next generation of manufacturing: implications of big data and digitalization in the context of industry 4.0. Production Planning & Control 2022, 33, 101–104. [Google Scholar] [CrossRef]
- Goh, K. H.; See, K. F. Twenty years of water utility benchmarking: A bibliometric analysis of emerging interest in water research and collaboration. Journal of Cleaner Production. 2021, 284, 124711. [Google Scholar] [CrossRef]
- Kesari, K. K.; Soni, R.; Jamal, Q. M. S.; Tripathi, P.; Lal, J. A.; Jha, N. K.; Siddiqui, M. H.; Kumar, P.; Tripathi, V.; Ruokolainen, J. Wastewater Treatment and Reuse: a Review of its Applications and Health Implications. Water, Air, & Soil Pollution 2021, 232, 208. [Google Scholar] [CrossRef]
- Nicolae, A.; Korodi, A. Node-Red and OPC UA Based Lightweight and Low-Cost Historian with Application in the Water Industry. In Proceedings of the IEEE 16th International Conference on Industrial Informatics (INDIN), Porto, Portugal, 18-20 July 2018; pp. 1012–1017. [Google Scholar]
- Nicolae, A.; Korodi, A.; Silea, I. Identifying Data Dependencies as First Step to Obtain a Proactive Historian: Test Scenario in the Water Industry 4.0. Water. 2019, 11, 1144. [Google Scholar] [CrossRef]
- Nicolae, A.; Korodi, A.; Silea, I. Weather-Based Prediction Strategy inside the Proactive Historian with Application in Wastewater Treatment Plants. Applied Sciences. 2020, 10, 3015. [Google Scholar] [CrossRef]
- Korodi, A.; Crisan, R.; Nicolae, A.; Silea, I. Industrial Internet of Things and Fog Computing to Reduce Energy Consumption in Drinking Water Facilities. Processes. 2020, 8, 282. [Google Scholar] [CrossRef]
- Nicolae, A.; Korodi, A.; Silea, I. Complete Automation of an Energy Consumption Reduction Strategy from a Water Treatment and Distribution Facility, Inside an Industrial Internet of Things-Compliant Proactive Historian Application. Sensors. 2021, 21, 2569. [Google Scholar] [CrossRef] [PubMed]


| December 2022 | January 2023 | February 2023 01.02 - 27.02 (before test) |
|
|---|---|---|---|
| Energy index start (kWh) | 1252010,25 | 1266546,5 | 1281298,75 |
| Energy index end (kWh) | 1266546,25 | 1281298,625 | 1293673,25 |
| Total energy consumed (kWh) | 14536 | 14752,125 | 12374,5 |
| Energy per day (kWh) | 468,90 | 475,875 | 475,942 |
| Energy per day (kWh) during test | 454,38 | ||
| Comparison | - 14,52 kWh/day - 3,1% |
- 21,495 kWh/day - 4,51% |
- 21,562 kWh/day - 4,53% |
| 30.01.2023 13:30 - 01.02.2023 15:30 (Monday – Wednesday) |
06.02.2023 13:30 - 08.02.2023 15:30 (Monday – Wednesday) |
13.02.2023 13:30 - 15.02.2023 15:30 (Monday – Wednesday) |
22.02.2023 13:30 - 24.02.2023 15:30 (Wednesday – Friday) |
01.03.2023 15:30 - 03.03.2023 17:30 (Wednesday – Friday) |
||
|---|---|---|---|---|---|---|
| Energy index start (kWh) | 1280569,5 | 1283990,5 | 1287399 | 1291612,875 | 1294833 | |
| Energy index end (kWh) | 1281572,5 | 1284977 | 1288386,5 | 1292580,5 | 1295789,5 | |
| Total energy consumed (kWh) | 1003 | 986,5 | 987,5 | 967,625 | 956,5 | |
| During test (27.02.2023 13:30 - 01.03.2023 15:30 Monday - Wednesday) | ||||||
| Energy index start (kWh) | 1293886,25 | |||||
| Energy index end (kWh) | 1294832,875 | |||||
| Total energy consumed (kWh) | 946,625 | |||||
| Comparison | - 56,375 kWh - 5,95% |
- 39,875 kWh - 4,21% |
- 40,875 kWh - 4,31% |
- 21 kWh - 2,22% |
- 9,875 kWh - 1,03% |
|
| 20.02.2023 00:00:00 – 27.02.2023 00:00:00 (the week before test) |
22.02.2023 13:30 – 24.02.2023 15:30 |
||
|---|---|---|---|
| Total energy consumed (kWh) | 3156,125 | 967,625 | |
| Total water volume entering DWTP (m3) | 2813,8 | 816 | |
| Total energy consumed per water volume (kWh / m3) | 1,121 | 1,186 | |
| During test (27.02.2023 13:30 - 01.03.2023 15:30) | |||
| Total energy consumed (kWh) | 946,625 | ||
| Total water volume entering DWTP (m3) | 882,9 | ||
| Total energy consumed per water volume (kWh / m3) | 1,072 | ||
| Comparison | - 0,049 kWh/m3 - 4,37% |
- 0,114 kWh/m3 - 9,61% |
|
| Week before test interval 20.02.2023 13:30:00 – 22.02.2023 15:30:00 Monday – Wednesday |
During test 27.02.2023 13:30 – 01.03.2023 15:30 Monday – Wednesday |
|
|---|---|---|
| Total energy consumed (kWh) | 914,75 | 946,625 |
| Total water volume offered by water sources (m3) | 881,25 | 936,25 |
| Total energy consumed per water volume (kWh / m3) | 1,038 | 1,011 |
| Comparison | - 0,027 kWh/m3 - 2,60% |
Disclaimer/Publisher’s Note: The statements, opinions and data contained in all publications are solely those of the individual author(s) and contributor(s) and not of MDPI and/or the editor(s). MDPI and/or the editor(s) disclaim responsibility for any injury to people or property resulting from any ideas, methods, instructions or products referred to in the content. |
© 2023 by the authors. Licensee MDPI, Basel, Switzerland. This article is an open access article distributed under the terms and conditions of the Creative Commons Attribution (CC BY) license (http://creativecommons.org/licenses/by/4.0/).


