Preprint
Article

Comparing Life Expectancy Determinants between Saudi Arabia and United Arab Emirates from 1980-2020

Altmetrics

Downloads

278

Views

194

Comments

0

A peer-reviewed article of this preprint also exists.

Submitted:

19 June 2023

Posted:

20 June 2023

You are already at the latest version

Alerts
Abstract
Despite marked advancements, life expectancy (LE) growth in Saudi Arabia and the United Arab Emirates (UAE) has remained stagnant compared to other developed nations. This study aims to investigate the significant correlation between macroeconomic (ME), sociodemographic (SD), and health status-resources (HSR) factors and LE to formulate an explanatory model for Saudi Arabia and the UAE – a previously unexplored area. Utilizing an ecological, retrospective, time-series study design, we delved into secondary data on SD, ME, HSR, and LE of the UAE population spanning three decades (1980-2020). We employed the partial least squares-structural equation modeling for statistical analysis. Our analysis revealed significant direct impacts of HSR on LE for Saudi Arabia (Beta=0.958, p<0.001) and the UAE (Beta=0.716, p<0.001). Furthermore, we discerned a notable indirect influence of ME on LE, mediated through SD and HSR for Saudi Arabia (Beta=0.507, p<0.001) and UAE (Beta=0.509, p<0.001), along with a considerable indirect effect of SD on LE through HSR (Saudi Arabia: Beta=0.529, p<0.001; UAE: Beta=0.711, p<0.001). This study underscores the mediating role of a nexus of ME-SD-HSR factors on LE in Saudi Arabia and the UAE. Consequently, these findings signal an imperative need for holistically policy interventions addressing ME, SD, and HSR factors, aiming to alter health behaviors and improve LE projections for Saudi Arabia and the UAE in the long run.
Keywords: 
Subject: Public Health and Healthcare  -   Public Health and Health Services

1. Introduction

In the aftermath of the pandemic and anticipating the global energy crisis from the Russo-Ukrainian war, the 21st century has ushered in a grim reality and an uncertain future. Indeed, some nations are already grappling with repeated recessions, catalyzing a multifaceted crisis that encapsulates health output [1]. A critical method for assessing the health sphere is to analyze life expectancy (LE) projections, particularly at birth [2,3]. The intriguing subject of "Social Determinants of Health" (SDoH) has been extensively researched within the public health domain [4,5]. Many studies have scrutinized the correlation between SDoH and LE, yielding insightful results. To comprehend the long-term influences on LE, it is imperative to understand the interplay of macroeconomic (ME), sociodemographic (SD), and health status-resources (HSR) factors [6].
LE projection has always been strongly linked positively to income factors, but some developed countries are still stagnating in their LE improvement [3,7]. According to the World Health Organization (WHO), global LE at birth had increased from 66.8 years in 2000 to 73.4 years in 2019 [7,8]. Meanwhile, according to OECD iLibrary, life expectancy has increased in all OECD countries over the past 50 years, but progress has slowed over the last decade [9,10]. The COVID-19 pandemic led to LE falling in most OECD countries in 2020 [10]. Other collective nations or groups need to pay attention to this phenomenon and learn from it including the Gulf Cooperation Council (GCC). As a network of mainly high-income countries [11], GCC members may fall into the same trap of LE stagnation or reduction, just like some other major countries in the last decade [7]. Among all six members of the GCC, Saudi Arabia and the United Arab Emirates (UAE) are the two major powers representing the region [11,12]. According to the latest WHO data published in 2020, the total LE in Saudi Arabia is 74.3 years, with male LE at 73.1 years and female LE at 76.1 years [13]. LE at birth in Saudi Arabia has improved by 3.79 years, from an average of 70.5 years in 2000 to 74.3 years in 2019 [13,14]. On the other hand, LE at birth in the United Arab Emirates (UAE) has improved by 2.9 years, from 73.2 years in 2000 to 76.1 years in 2019 [8]. The total LE at birth in the UAE saw no significant changes in 2021 compared to 2020 and remained at around 78.71 years [15]. Interestingly, the developed and high-income countries worldwide have an average LE over 81 years [9,16], and none of the GCC members have achieved it yet. This is something that Saudi and UAE can strive to achieve to put themselves as a country with high-class healthcare performance.
The GCC members' socioeconomic, cultural, and epidemiological attributes exhibit notable parallels [17]. The Gulf region witnessed unprecedented modernization, defining the socio-political landscape based on the subsequent global order [18,19]. Reliance on the oil industry became a common economic denominator for GCC members due to the substantial economic surge experienced from the 20th to the early 21st century [20,21]. The petrodollar industry considerably boosted the income level of the GCC population majority while concurrently fostering an advanced demographic infrastructure for its citizens [21]. The Gulf Arab ethnicities predominantly inhabit the region, maintaining a cultural homogeneity that cements their shared identity [22]. While similarities in both physical and spiritual lifestyles are evident [23], the expansive migrant worker population in urban areas must not be overlooked [24], as it affirms the comparability of the GCC countries' sociodemographic characteristics, including Saudi and the UAE [25].
The shared experience of the contemporary epidemiological shift further harmonizes GCC members as they confront similar health challenges. These challenges emanate from aging populations and the growing incidence of diseases tied to lifestyle habits [17]. Consequently, the foundation for valuable dialogues concerning the health determinants of these nations can be fortified through contextual comparisons utilizing the LE model. As notably developed GCC members, Saudi Arabia and the UAE enjoyed a steep macroeconomic ascent at the close of the 20th century. This upward trajectory was mirrored in their public health indicators, including LE, which exhibited substantial improvements [21,25]. Notwithstanding the appreciable strides made through concerted government initiatives, the early 21st-century global financial slowdown, particularly after the plunge and volatility in global oil prices, posed a significant hurdle [26]. Moreover, these nations are aligning with their Gulf counterparts, such as Bahrain, in the transition towards a post-oil era, a significant shift anticipated to undertake soon [27,28]. As such, it becomes paramount for policymakers and stakeholders in these nations to fully grasp the life expectancy model's intricacies and the factors influencing it. This understanding is crucial to devise effective health policies, prioritizing improved efficiency, and prepare for a future marked by health and prosperity.
Regarding macroeconomic (ME) considerations, such as foreign exchange rates and monetary policies, it is pertinent to consider broader variables like the Gross Domestic Product (GDP), Gini index, income level, unemployment rate, and inflation rate [6,29]. The economic vitality of a country can contribute to improved living conditions, which in turn elevates LE. For instance, a robust economy can afford to invest more in healthcare, which may lead to better health outcomes for the population [30]. However, the specific impacts of foreign exchange rates and monetary policies on LE are complex and can be influenced by many other factors. Economic and social factors may also influence LE in the UAE and Saudi Arabia. As one of the world's richest countries in per capita income, the UAE's economy is largely driven by its abundant natural resources, economic diversification, innovation, and the influx of foreign direct investment [31,32]. The country's robust economy has contributed to developing sectors such as tourism and real estate, facilitating the provision of advanced healthcare services and a high standard of living for its citizens [33,34]. Similarly, Saudi Arabia has also seen an improvement in its economy over the years due to various factors such as economic diversification and increased foreign investment. According to The Borgen Project, Saudi Arabia has worked on economic diversification, broadening exports and income possibilities from oil and gas to other necessary avenues [35]. The sectors expected to generate more than 60% of the growth and create jobs are Mining and Metals, Petrochemicals, Manufacturing, Retail and wholesale trade, Tourism and hospitality, Finance, Construction, and Health Care [35,36].
Sociodemographic (SD) factors, including infant mortality rate, literacy rate, education level, socioeconomic status, population growth, and gender inequality, also significantly shape LE [6,30]. In Saudi Arabia, demographic literature has been reviewed as a significant contributor to LE, and Saudi Arabia resides as one with a very high human developing index category. This situation was expected to provide a basis for being forward-looking and targeting positive gains in LE [37]. As for UAE, the population consists primarily of immigrants, with Emirati nationals constituting only about 20% of the total population [38,39]. This multicultural and cosmopolitan society has created a unique social environment that likely influences its residents' health outcomes and life expectancy [38]. However, social challenges such as a wealth gap, high cost of living, obesity, and drug abuse persist and may negatively impact LE. In the UAE, the reduction in rates of maternal deaths has been linked to improved care during and after pregnancy, better access to healthcare facilities, and increased patient awareness [38]. The influence of urbanization and Western culture in the modern era can lead to lifestyle changes for the UAE population, which may impact health outcomes, particularly LE. There is a lack of studies that puts a necessary concern on SD determinants in both Saudi Arabia and the UAE.
Health status resources (HSR), such as healthcare facilities, the number of healthcare professionals, public health expenditure, death rates, smoking rates, pollution, and vaccinations, form another crucial determinant of LE [40,41,42,43,44,45]. The UAE faces environmental threats such as invasive species, carbon footprints, limited water resources, overfishing, waste generation, air pollution, and land degradation [25]. This combination of threats strains the UAE's natural resources and quality of life, which could affect LE. The rise of preventive medicine and the establishment of government programs encouraging healthy lifestyles have notably increased life expectancy in the UAE to be the second highest in the WHO Eastern Mediterranean region [46]. On the other hand, Saudi Arabia has the highest healthcare expenditures and % of GDP allocated to healthcare among GCC countries [15]. The government has also invested in developing primary health care facilities (PHCCs), the main providers of preventive and curative services at the community level. There are 0.74 PHCCs per 10,000 population in Saudi Arabia, offering services such as immunization, maternal and child care, chronic disease management, and mental health care [47]. Unfortunately, despite all the expenses, Saudi's LE is not at the highest projection among countries in the Middle East [48]. Some environmental issues affecting public health in Saudi Arabia are air pollution, water scarcity and contamination, soil degradation, waste management, and biodiversity loss. These issues can negatively impact the population's health determinants, such as nutrition, hygiene, sanitation, and disease prevention. The Saudi government has taken various measures to protect the environment and improve environmental health, such as establishing environmental regulations and legislation, implementing renewable energy projects, rehabilitating natural ecosystems, and conducting environmental research [36,42,43]. Based on a simple observation, both Saudi and UAE have lower life expectancy than some high-income countries such as Japan (85.03 years), Switzerland (84.25 years), and Canada (82.96 years) [49]. Hence, a comprehensive understanding of the situation would necessitate more detailed data on factors such as healthcare accessibility, community health parameters like nutrition and disease burden, the number of hospitals and medical professionals, healthcare expenditure, mortality rates due to various diseases, vaccination coverage, and pollution level [38].
The future trajectory of life expectancy is far from certain and can be influenced by various drivers of health aspects [50]. Health risks that can be managed through medical care or addressed by broad, population-wide initiatives show the most significant variations between scenarios of current and improved health conditions [50]. This highlights the crucial role of strategies aimed at effectively changing modifiable risk factors to reduce early deaths [51]. LE does not exist in a vacuum; it is intertwined with macroeconomic circumstances, demographic factors, and the availability and quality of health resources [44,45]. Therefore, decision-makers must take a comprehensive approach, considering these elements as interconnected parts of a whole, and design interventions targeting the most impactful health determinants relevant to their specific situation [45,50]. The absence of research in this area, particularly in the Saudi and UAE region, implies a significant gap. Developing a comprehensive model at the population level could offer valuable insights to fill this void, especially for policymakers.
The primary objective of this research is to construct comparative structural models that encapsulate the influences of HSR, ME, and SD attributes on LE in Saudi Arabia and the UAE. The theoretical model under investigation posits six potential relationships among the three Latent Variables (LVs) - HSR, ME, and SD - and their impact on LE (H1, H2, H3, H4, H5, H6). These hypotheses are further elucidated in the conceptual model (Figure 1). By building upon previous country-specific studies [45,52], this research attempts a multi-comparative analysis at the international level. Such an approach could yield a more comprehensive understanding of the LE model in the context of Gulf Cooperation Council (GCC) countries and offer valuable insights for policy-making.

2. Materials and Methods

2.1. Study Design, Data Results, and Data Collection

This is an ecological retrospective time-series design. The study utilized publicly accessible secondary data from a reputable source, the World Bank database [53,54]. The dataset considers the related ME, SD, HSR, and LE indicators from the citizen of Saudi and UAE nationality. The observation span from 1980 to 2020, as this period has the most dataset available. Ethical approval exemption was obtained from the university's research ethics committee (XXX).

2.2. The Conceptual Model and Statistical Analysis

The Structural Equation Model (SEM) elucidates the relationships among SD, ME, and HSR latent variables (LVs) in this study. SEM delineates the pathways and relationships between LVs and their corresponding Manifest Variables (MVs). Given its ability to handle non-normal data, small sample sizes, and substantial missing data - as evidenced in prior research regarding Oman [52] - the Partial Least Square (PLS) SEM was favored over the Covariance-Based (CB) SEM. As this research leans towards exploration rather than confirmation, the PLS-SEM method aligns aptly with its nature [55].
The potency of this study derives from the relational matrix of all variables within the conceptual model (Figure 1). If each LV construct anticipates an R2 minimum of 0.25, the required sample size (years of observation) stands at a minimum of 30 years, adhering to the specific period assessed in this study. Such a sample size can achieve 80% power at a 5% significant level [55]. If the data does not support the conceptual and analytical model, relationship adjustments or exclusions are executed based on initial run results. Data imputation follows the PLS-SEM guideline for missing explanatory variables [56]. The criterion allows less than 15% missing data for imputation in the analysis. Regression imputation is used for values displaying a time-dependent trend, fulfilling the requisites of time-series imputation techniques [57]. For values with no discernible annual pattern, the grand mean is employed. The data cleaning process utilizes the R-package, and SEM analyses are performed using SmartPLS 4.0®. All analyses adhere to a 5% significance level.
The conceptual model, built on the theoretical framework [45,58] and preceding systematic review [6], is outlined in Figure 1. Detailed insights into the MVs and LVs are furnished in Table 1. The model encompasses item indicators or MVs, which reflect their associated LVs. Based on the systematic review, all items affect LE significantly. The structural or inner model scrutinizes the relationships between the indicated LVs, as portrayed in Figure 1. The model also provides indirect and total effects, accessible automatically through SmartPLS 4.0®.
Negative loading MVs in the PLS algorithm transform according to PLS-SEM guidelines. The indicator reliability for each MV maintains the loading at a significant value of 5% [59]. In contrast, the internal consistency reliability for each LV takes into account Cronbach’s Alpha (CA), Composite Reliability (CR), and Rhô-Alpha (Rhô-A) at a minimum of 0.7 [59]. Convergent validity for each LV is measured using the Average Variance Extracted (AVE) with a cut-off minimum of 0.50 [59]. Discriminant validity between two reflective constructs (the LVs in this study) is established when the upper bound of the Confidence Interval (CI) of the HTMT criterion is < 1 [60]. R2 and Q2 denote the model's predictability, with an R2 score > 0.25 being recommended and a Q2 > 0.35 considered strong [61]. The f2 also measures the direct effect's significance if the result is > 0.35 [60]. A radar chart is utilized for comparative visualization of the results, displaying the visual comparison of the total effects from both countries (H1 to H6).

3. Results

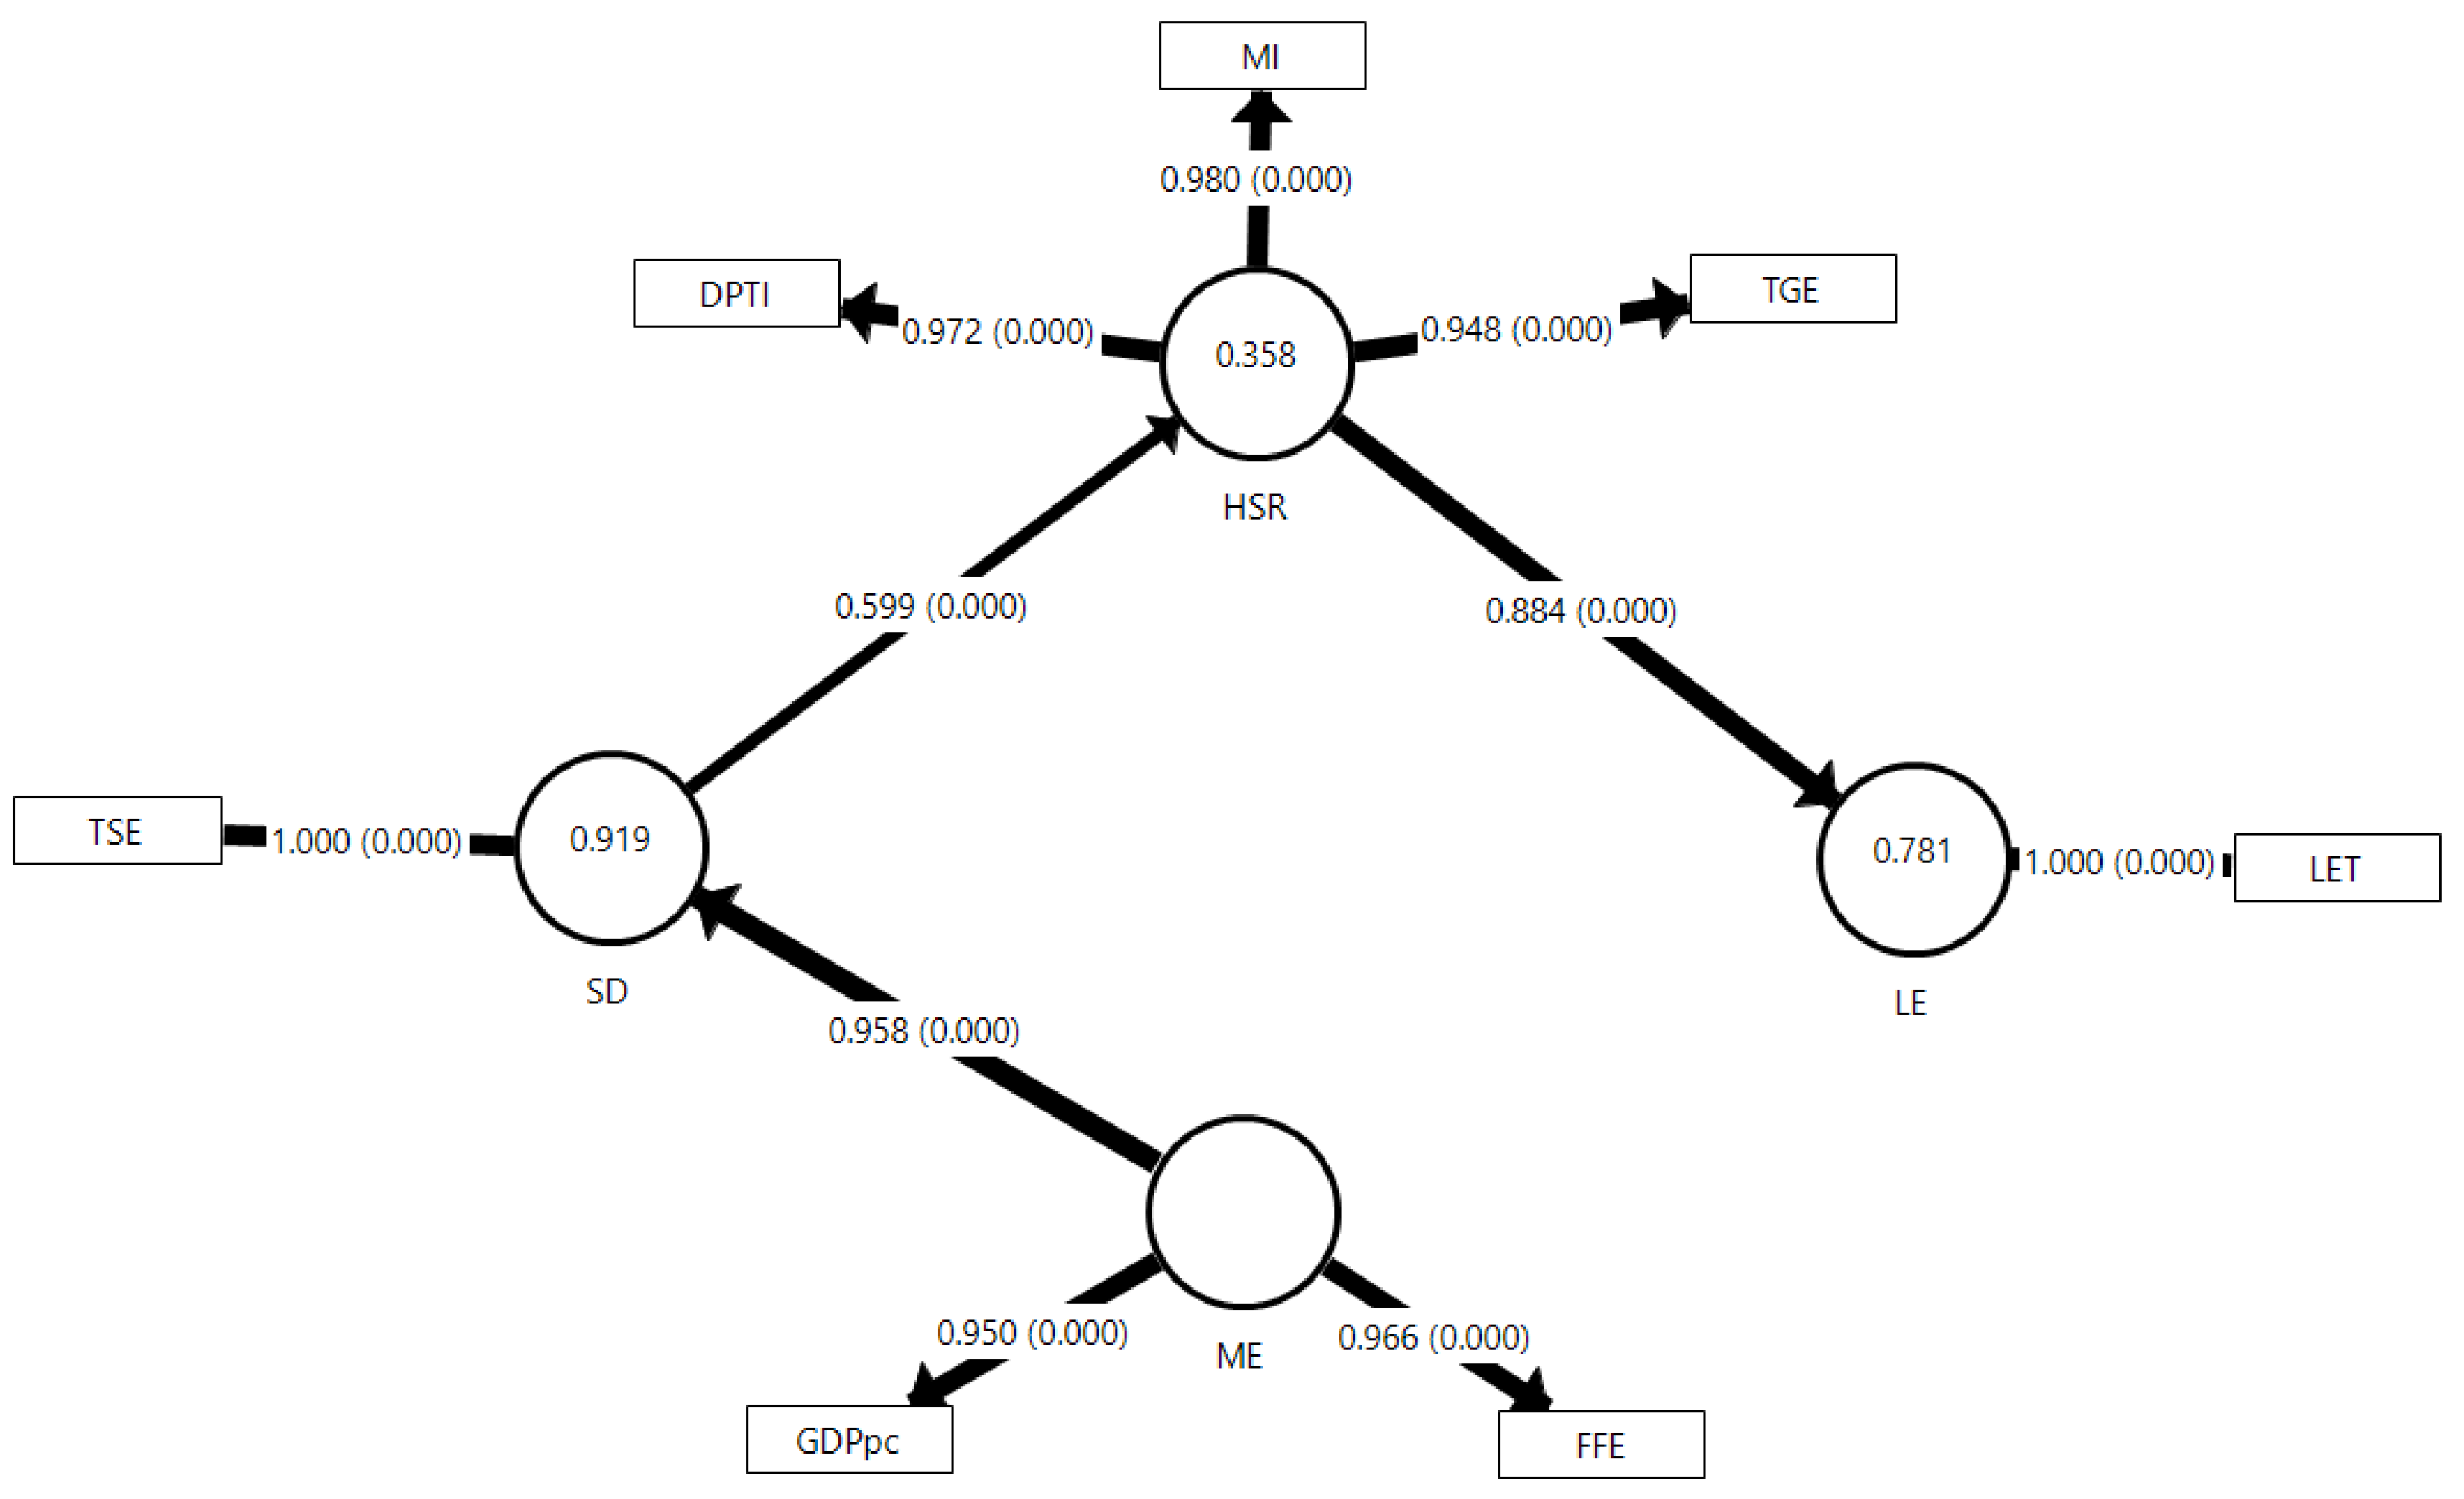
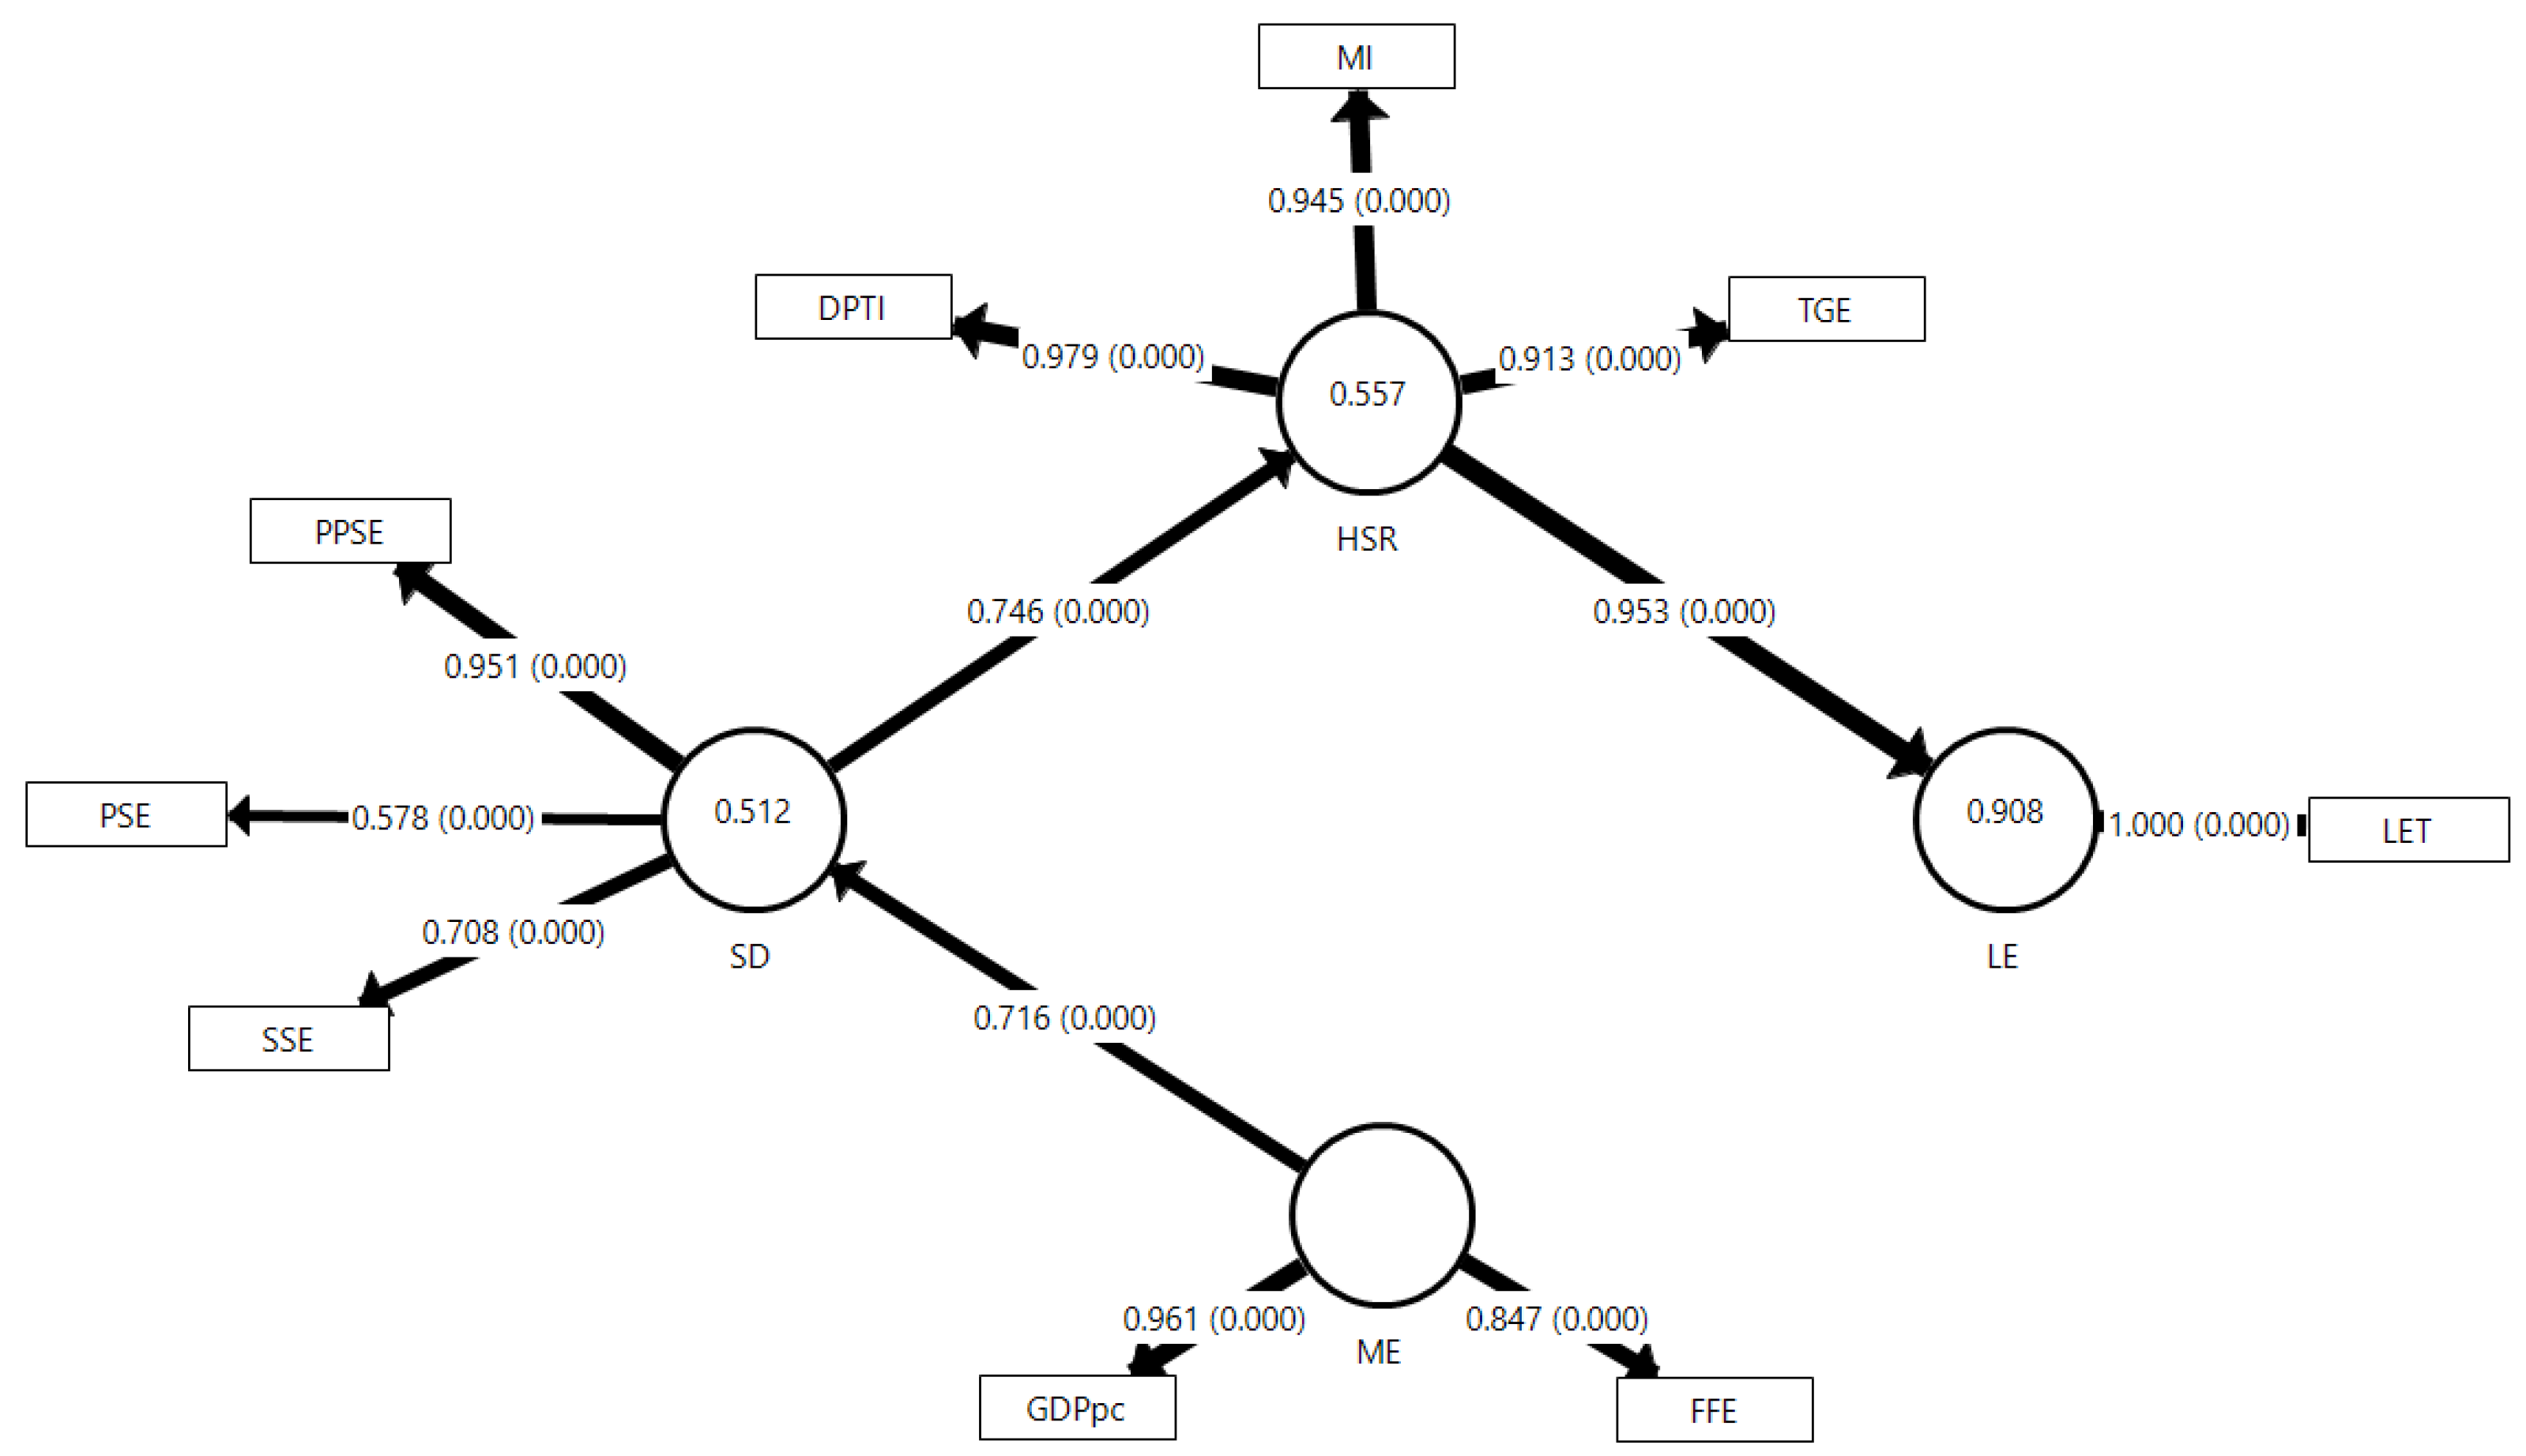
The final model of the study presents a varied number of MVs for the SD), ME, and HSR LVs in both Saudi Arabia and UAE, as well as for the LE in the two models. Table 1, Figure 2 and Figure 3 display each MV, showing significant loadings for each model.
Table 2 shows the final models' reliability, validity, and predictability for each LV. All LVs demonstrate a Cronbach's Alpha (CA), Composite Reliability (CR), Rhô-Alpha (Rhô-A), and Average Variance Extracted (AVE) that meet or exceed their respective thresholds. In the Saudi model, ME's measures are as follows: CA = 0.930, CR = 0.952, Rhô-A = 0.957, and AVE = 0.775. For UAE's model, ME metrics are CA = 0.800, CR = 0.901, Rhô-A = 0.914, and AVE = 0.734. Concerning the SD metric, Saudi's model demonstrates a score of 1.000 across CA, CR, Rhô-A, and AVE, while for UAE, these values are 0.644, 0.799, 0.953, and 0.523, respectively. The HSR parameter for Saudi is CA = 0.965, CR = 0.977, Rhô-A = 0.972, and AVE = 0.934, and for UAE, CA = 0.952, CR = 0.965, Rhô-A = 0.943, and AVE = 0.843. The LE metric for both nations scores 1.0 in all areas.
The models' Q2 value indicates strong predictive relevance for each LV in both countries, with R2 values explaining a substantial percentage of variance in each LV for both Saudi and UAE models. The Q2 value of the Saudi model spans 0.590 for SD, 0.640 for HSR, and 0.864 for LE, while for UAE, it spans 0.740 for SD, 0.720 for HSR, and 0.969 for LE. Saudi's model elucidates 91.9% of the SD variance, 35.8% of HSR, and 78.1% of LE, while UAE's model explicates 51.2% of SD, 55.7% of HSR, and 90.8% of LE variances.
The HTMT criterion for each relationship in the final models falls below 1.0, confirming discriminant validity. Details of these values are in Table 2 for each model and LV. The HTMT for Saudi's model ranges from 0.524 to 0.921, while for UAE's model, it ranges from 0.783 to 0.978.
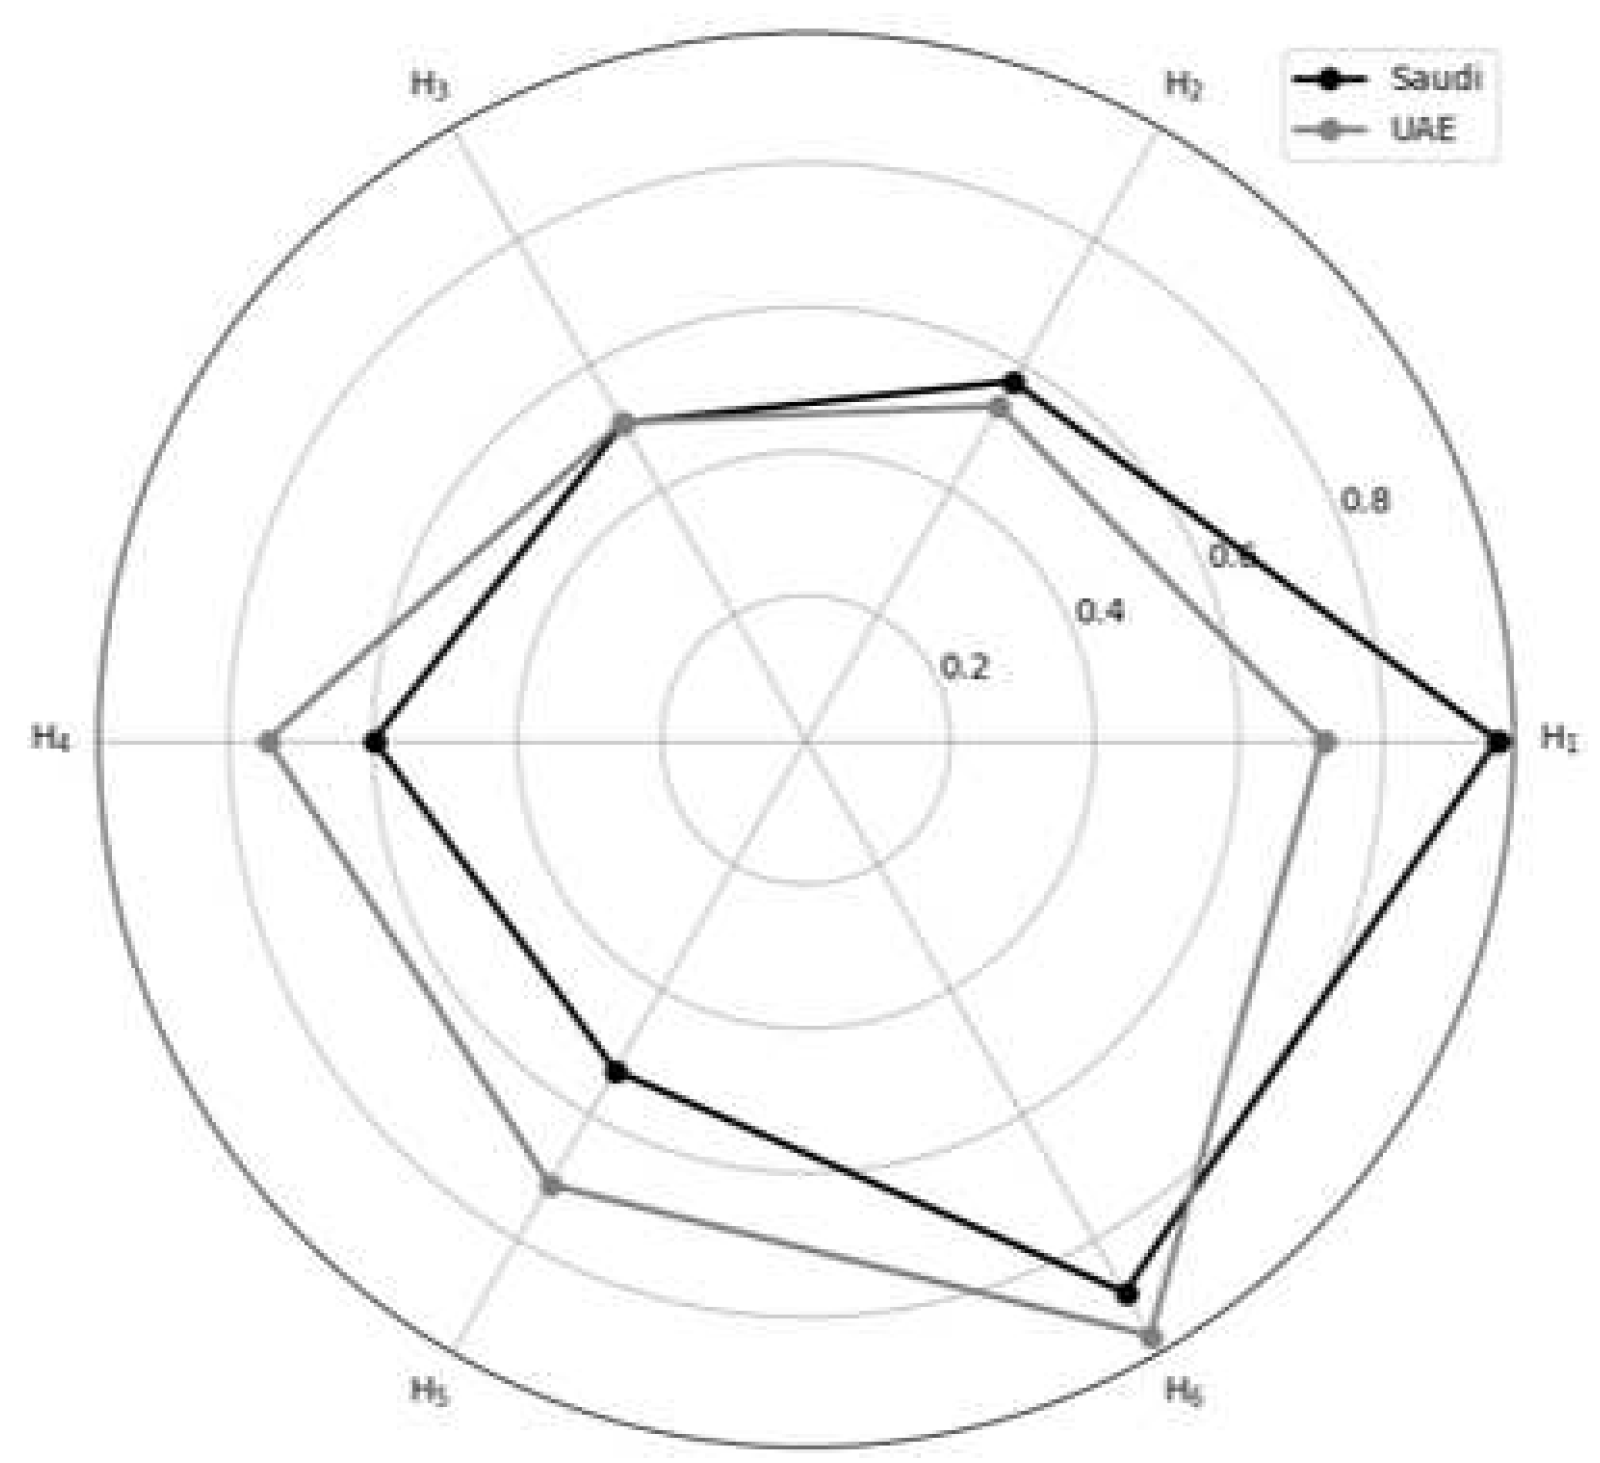
Table 3 summarizes all information regarding direct, indirect, and total effects, and each effect demonstrates significance as the f2 value of each provided direct effect exceeds 0.35. Figure 4 visually portrays the general differences in total effects between the two countries according to the hypothesized relationships (H1 to H6) via a radar chart. Regarding Saudi's model, the H1: ME→SD, H2: ME→HSR, and H3: ME→LE hypotheses have direct and indirect effects ranging from 0.507 to 0.958 (p < 0.001), and the f2 ranging from 11.293 for H1 to 0.529 for H5. The H4: SD→HSR and H6: HSR→LE hypotheses indicate direct effects of 0.599 and 0.884, respectively, with f2 values of 0.559 and 3.558, respectively. For UAE's model, the H1: ME→SD, H2: ME→HSR, and H3: ME→LE hypotheses yield direct and indirect effects ranging from 0.509 to 0.716 (p < 0.001), with f2 values of 1.051 for H1 and 0.711 for H5. The H4: SD→HSR and H6: HSR→LE hypotheses indicate direct effects of 0.746 and 0.953, respectively, and f2 values of 1.256 and 9.870, respectively.

4. Discussion

4.1. Comparison between the Two Models

All the models' performances are satisfying according to the PLS-SEM principle. For SD of Saudi Arabia, only TSE or tertiary school enrollment was used for the modeling because of the heavy missing data on the pre-primary, primary, and secondary school enrollment within the source database. Logically, any enrolled student who enters the tertiary level must have passed the previous level, so the LV can still be represented as such. On the other hand, the TSE for the UAE model also suffers from heavy missing data, so the LV of SD in the UAE's model is best represented by PPSE (pre-primary school enrollment), PSE (primary school enrollment), and SSE (secondary school enrollment) in order to make both countries' SD comparable in the study.
For Saudi Arabia's model, all hypotheses (H1 to H6) show significant direct or indirect effects, with f2 values indicating a strong impact. The path ME to SD (H1) displays the strongest effect, while the path HSR to LE (H6) shows the strongest effect on the LE as the endpoint. For UAE's model, similar significant direct or indirect effects are found for all hypotheses (H1 to H6), with the path ME to SD (H1) demonstrating a significant direct effect. The path HSR to LE (H6) shows the strongest direct effect, echoing the findings in the Saudi Arabia model.
Contemplating the major pattern of the two final models (Figure 2 and Figure 3), as is also shown in the radar chart (Figure 4), we can see the nexus of ME→SD→HSR→LE as the mediating pattern of the effect within the model. This mediating pattern can provide wisdom by revealing the causal processes that underlie health disparities and by suggesting potential interventions that target the mediators to improve health outcomes [62], which is shown by comparing H3, H5, and H6 altogether, as these are the main relationships that affect LE in this study. We can figure that both countries have not utilized their SD and ME optimally to affect LE, while they are exemplifying the direct effect of HSR on LE more substantially. We can see this by also comparing how ME and SD impact HSR (H2 and H4), which are not as strong as ME affecting SD directly (H1), especially in Saudi's case. This may imply that the SD and ME determinants can still be improved to integrate the effect well within the complete model. This might be one of the reasons why Saudi and UAE are still relatively slow in their LE projection compared to other high-income countries, despite all their healthcare expenditures and advancements [15,49].
Each model incorporates two macroeconomic indicators: Gross Domestic Product per capita (GDPpc) and Fossil Fuel Electricity production (FFE), all of which have been found to influence ME and LE significantly. GDPpc is an important economic development indicator positively correlated with LE [30,63,64]. This is also obvious from previous studies in Oman [52] and Bahrain [45]. GDP per capita can show how the economic growth performs while considering the population growth, which is more reliable in terms of inter-countries comparison. Electricity production, which utilizes UAE fossil fuel to a certain degree, is also positively correlated with LE as it indicates a country's infrastructure and technological development [45,65,66]. It is also notable that the Saudi's and UAE's efforts to diversify their economy away from oil could have important implications for life expectancy by potentially leading to broader economic development, improved living standards, and increased investments in social sectors such as health and education [33,67]. The sole total effect of ME is more substantial than the other key determinants, such as SD and HSR. Also, the results indicate that healthcare directly impacts life expectancy and is significantly affected by macroeconomic and sociodemographic factors. The model suggests that while economic growth can initially elevate life expectancy, further growth is fostered by sociocultural and healthcare aspects, which was also noted by other literature [68,69,70,71].
The SD determinants have plenty of indicators from the educational aspects. All the pre-primary education (PPSE), primary education (PSE), secondary education (SSE), and tertiary education (TSE) may elevate the prospect of longevity. It highlights the importance of essential education to the complete LE model [4,6].
For HSR determinants, vaccination can classically be referred to as the most important factor that boosted LE in the last century, along with nutrition and antibiotic invention [72]. DPT immunization (DPTI) and Measles immunization (MI) are significant aspects of the complete model. Total Greenhouse Emission (TGE) can be seen as one environmental indicator within the complete model [40]. TGE may act as a reminder to reduce carbon emissions to improve human life expectancy, even globally [40].
The study emphasizes the importance of considering a broad range of factors when developing strategies to improve health outcomes and extend life expectancy. The results suggest that focusing solely on disease and morbidity, without considering broader economic and sociodemographic variables, can impair health outcomes in the long run. Cultivating health literacy and sociocultural tactics to foster healthier habits is paramount, particularly in the face of the ubiquity of obesity and other non-communicable diseases in regions like Saudi Arabia and the UAE. Assimilating these aspects into public health strategies can help ensure a comprehensive and effective approach to improving health outcomes at a population level.
However, it is crucial to note that while this model provides valuable insights, it is inherently observational, and the inference from the final model should consider how each Latent Variable (LV) can affect the others. Also, the relevance of certain factors might change over time due to changes in the population or how variables are measured. Therefore, the model's applicability may need to be reassessed periodically to ensure its continued relevance.
Finally, while the study provides an in-depth analysis of the factors influencing life expectancy in Saudi Arabia and UAE, it is important to note that these findings may not be generalizable to other contexts, as life expectancy determinants can vary widely between different countries and regions due to differences in socioeconomic conditions, healthcare systems, cultural factors, and other variables.

4.2. Limitations of this Study

This study's findings are based on an ecological and longitudinal approach with inherent limitations. Over long periods, changes in the population or how variables are measured could impact the results, and the importance of certain factors might shift over time. The inferences drawn from the final model should be tempered by the understanding that they are observational and shed light on potential causal relationships between the latent variables rather than definitively establishing causality [73].

5. Conclusions

The results of this analysis underscore the interplay of economic, sociodemographic, and health status and resources in shaping a population's health and behavior. As such, improvements and interventions must encompass ME conditions, SD, and HSR factors. Focusing solely on disease and morbidity while neglecting broader economic and sociodemographic variables could detrimentally affect health outcomes in the long run. The importance of fostering health literacy and sociocultural strategies to promote healthier habits cannot be overstated, especially given the prevalence of both communicable and non-communicable diseases in the regions. By incorporating these elements into public health strategies, we can develop a more holistic and effective approach to improving health outcomes at the population level. This comprehensive strategy should be flexible and adaptable to changes in the drivers of health, as these drivers may shift over time and under different circumstances. Thus, ongoing monitoring and evaluation of health determinants are essential for continually refining public health policies and interventions.

Author Contributions

Conceptualization, M.F.C.; methodology, M.F.C., and A.A.B.W.; formal analysis, A.A.B.W.; data curation, M.F.C., and A.A.B.W.; writing-original draft preparation: A.A.B.W. and M.F.C.; writing—review and editing, M.F.C., A.A.B.W., and A.M.; supervision, M.F.C., and A.M.; funding acquisition, M.F.C., and A.M. All authors have read and agreed to the published version of the manuscript.

Funding

This research was funded by the International Research Collaboration Co-Fund QU-SQU: CL/SQU-QU/MED/22/01.

Institutional Review Board Statement

Ethical approval was obtained from the Medical Ethics Committee of Sultan Qaboos University (MERC #XXXX).

Informed Consent Statement

Not applicable.

Data Availability Statement

The data used in this study can be found online.

Acknowledgments

The authors would like to acknowledge the comments from the reviewers.

Conflicts of Interest

The authors declare no conflict of interest.

References

  1. Guénette, J. D., Kose, M. A., & Sugawara, N. (2022). Is a Global Recession Imminent? Available at SSRN: https://ssrn.com/abstract=4223901 or http://dx.doi.org/10.2139/ssrn.4223901. [CrossRef]
  2. Ho, J. Y., & Hendi, A. S. (2018). Recent trends in life expectancy across high income countries: retrospective observational study. BMJ (Clinical research ed.), 362, k2562. [CrossRef]
  3. Roser, M., Ortiz-Ospina, E., & Ritchie, H. (2013). Life Expectancy. Our World in Data. Available online https://ourworldindata.org/life-expectancy.
  4. Braveman, P., & Gottlieb, L. (2014). The social determinants of health: it's time to consider the causes of the causes. Public health reports, 129(1_suppl2), 19-31.
  5. Mikkonen, J., Social determinants of health, Canadian Electronic Library. Canada. 2010. Available online: https://policycommons.net/artifacts/1204147/social-determinants-of-health/1757256/ on 18 Jun 2023. CID: 20.500.12592/mm0nz9.
  6. Wirayuda, A. A. B., & Chan, M. F. (2021). A Systematic Review of Sociodemographic, Macroeconomic, and Health Resources Factors on Life Expectancy. Asia Pacific Journal of Public Health, 33(4), 335-356. 4. [CrossRef]
  7. Heuveline, P. (2022). Global and National Declines in Life Expectancy: An End-of-2021 Assessment. Population and Development Review, 48(1), 31-50. [CrossRef]
  8. World Health Organization. Mortality and global health estimates. Geneva, Switzerland, 2023. Available online: https://www.who.int/data/gho/data/themes/mortality-and-global-health-estimates.
  9. OECD. (2019). OECD Economic Surveys: United States 2019. OECD Publishing. [CrossRef]
  10. OECD. (2021). Home. Health at a Glance 2021 : OECD Indicators | OECD iLibrary. https://www.oecd-ilibrary.org/sites/e0d509f9-en/index.html?itemId=%2Fcontent%2Fcomponent%2Fe0d509f9-en.
  11. Britannica, T. Editors of Encyclopaedia. (2023, January 13). Gulf Cooperation Council (GCC) | History, Member Countries, Purpose, & Summits. Encyclopedia Britannica. Available online: https://www.britannica.com/topic/Gulf-Cooperation-Council. 13 January.
  12. The National News. (2023, June 13). UAE and Saudi Arabia drive GCC's 'significant improvement' in economic diversification. Available online: https://www.thenationalnews.com/business/2023/06/13/uae-and-saudi-arabia-drive-gccs-significant-improvement-in-economic-diversification/. 13 June.
  13. Macrotrends. (2023). Saudi Arabia Life Expectancy 1950-2022. Available online: https://www.macrotrends.net/countries/SAU/saudi-arabia/life-expectancy (access on 1 June 2023).
  14. Statista. (2023). Share of gross domestic product expenditures on healthcare in the Gulf Cooperation Council from in 2019, by country. Available online: https://www.statista.com/statistics/672429/gcc-share-of-gdp-spending-on-health-sector-by-country/.
  15. Statista. (2022). Life expectancy at birth in the United Arab Emirates from 2000 to 2021. Available online: https://www.statista.com/statistics/297160/uae-life-expectancy/.
  16. World Health Organization. Health inequities and their causes. Geneva, Switzerland, 2018. Available online: https://www.who.int/news-room/facts-in-pictures/detail/health-inequities-and-their-causes.
  17. Mattke, S., Hunter, L. E., Magnuson, M., & Arifkhanova, A. (2015). Population health management and the second Golden age of Arab medicine: promoting health, localizing knowledge industries, and diversifying economies in the GCC countries. Rand Health Quarterly, 5(1), 3. [CrossRef]
  18. Fromkin, D. (1991). How the modern Middle East map came to be drawn. Smithsonian, 22(2), 132-146.
  19. Rogan, E. L. (2019). The emergence of the Middle East into the modern state system. International Relations of the Middle East, 5th ed, Chapter 2. 17-38. Politics Trove. [CrossRef]
  20. Callen, M. T., Cherif, R., Hasanov, F., Hegazy, M. A., & Khandelwal, P. (2014). Economic diversification in the GCC: Past, present, and future. International Monetary Fund. Available online: https://www.imf.org/external/pubs/ft/sdn/2014/sdn1412.pdf.
  21. Wilson, R. (2021) Economic development in the Middle East. Routledge.
  22. Goldschmidt, A., & Boum, A. (2018) A concise history of the Middle East. Routledge.
  23. Torstrick, R. & Faier, E. (2009). Culture and Customs of the Arab Gulf States. Available online: http://publisher.abc-clio.com/EGR3659.
  24. Rajan, S. I. (2018). Demography of the Gulf region. In South Asian migration in the Gulf (pp. 35-59). Palgrave Macmillan, Cham.
  25. Alrouh, H., Ismail, A., & Cheema, S. (2013). Demographic and health indicators in Gulf Cooperation Council nations with an emphasis on UAE. Journal of Local and Global Health Perspectives, 2013(1), 3. [CrossRef]
  26. Ben Hassen, T. (2022). The GCC Economies in the Wake of COVID-19: Toward Post-Oil Sustainable Knowledge-Based Economies? Sustainability, 14(18), 11251. [CrossRef]
  27. Abouzzohour, Y. (2021). One Year into His Reign, Saudi’s Sultan Must Renegotiate the Social Contract and Prioritize Diversification. Brookings Institution, January 13. Available online: https://www.brookings.edu/blog/order-from-chaos/2021/01/13/one-year-into-his-reign-omans-sultan-must-renegotiate-the-social-contract-and-prioritize-diversification/ (accessed on 14 May 2023).
  28. Besta, S. (2019, October 11). Top Five countries with the largest oil reserves in the Middle East. NS Energy. Available online: https://www.nsenergybusiness.com/features/countries-oil-reserves-middle-east/ (accessed on 19 January 2023).
  29. World Health Organization. GHE: Life expectancy and healthy life expectancy. Geneva, Switzerland, 2020. Available online: https://www.who.int/data/gho/data/themes/mortality-and-global-healthestimates/ghe-life-expectancy-and-healthy-life-expectancy.
  30. Miladinov, G. (2020). Socioeconomic development and life expectancy relationship: evidence from the EU accession candidate countries. Genus. 76(1), 2. [CrossRef]
  31. Siddiqui, S. A., & Afzal, M. N. I. (2022). Sectoral diversification of UAE toward a knowledge-based economy. Review of Economics and Political Science. 7(3), 177-193. [CrossRef]
  32. United Nations Conference on Trade and Development. (2022). World Investment Report 2022. UNCTAD. TD/63/Rev.2. Available online: https://unctad.org/system/files/official-document/td63rev2_en.pdf.
  33. Gulf News. (2011, November 28). Diversification raises non-oil share of UAE’s GDP to 71%. https://gulfnews.com/business/diversification-raises-non-oil-share-of-uaes-gdp-to-71-1.795268. 28 November.
  34. Gulf News. (2023, December 6). UAE healthcare sector in top shape. https://gulfnews.com/uae/health/uae-healthcare-sector-in-top-shape-1.1638787939625.
  35. The Borgen Project. (2020, July 29). Economic diversification in Saudi Arabia. https://borgenproject.org/economic-diversification-in-saudi-arabia/. 29 July.
  36. Al Naimi, S. M. (2021). Economic diversification trends in the Gulf: the case of Saudi Arabia. Circular Economy and Sustainability, 2(4), 221-230. [CrossRef]
  37. Bah, S. (2018). How feasible is the life expectancy target in the Saudi Arabian vision for 2030. East Mediterr Health J, 24(4), 401-404. [CrossRef]
  38. Koornneef, E., Robben, P., & Blair, I. (2017). Progress and outcomes of health systems reform in the United Arab Emirates: a systematic review. BMC health services research, 17, 1-13. [CrossRef]
  39. The Official Portal of the UAE Government. Population and demographic mix. 2022. Available online: https://u.ae/en/information-and-services/social-affairs/preserving-the-emirati-national-identity/population-and-demographic-mix (Access 18 Oct 2022).
  40. Chen, Z., Ma, Y., Hua, J., Wang, Y., & Guo, H. (2021). Impacts from economic development and environmental factors on life expectancy: A comparative study based on data from both developed and developing countries from 2004 to 2016. International Journal of Environmental Research and Public Health, 18(16), 8559. [CrossRef]
  41. The Official Portal of the UAE Government. Environment and climate change. 7 Feb 2023 Retrieved June 4, 2023, Available online: https://www.moccae.gov.ae/en/home.aspx (Access on 4 June 2023).
  42. Ministry of Environment, Water and Agriculture. (2023). Environmental protection in the Kingdom of Saudi Arabia. https://www.my.gov.sa/wps/portal/snp/aboutksa/environmentalProtection/.
  43. World Health Organization. (2022a). Environmental health Saudi Arabia 2022 country profile. https://www.who.int/publications/m/item/environmental-health-sau-2022-country-profile.
  44. Roffia, P., Bucciol, A., & Hashlamoun, S. (2023). Determinants of life expectancy at birth: a longitudinal study on OECD countries. International Journal of Health Economics and Management, 23(2), 189-212. [CrossRef]
  45. Wirayuda, A. A. B., Al-Mahrezi, A., & Chan, M. F. (2023). Factors Impacting Life Expectancy in Bahrain: Evidence from 1971 to 2020 Data. International Journal of Social Determinants of Health and Health Services, 53(1), 74-84. [CrossRef]
  46. Gulf Business. (2016, September 10). Revealed: 7 stats on the UAE’s healthcare and health insurance market. https://gulfbusiness.com/revealed-7-stats-uaes-healthcare-health-insurance-market/. 10 September.
  47. Al Saffer, Q., Al-Ghaith, T., Alshehri, A., Al-Mohammed, R., Al Homidi, S., Hamza, M. M., Herbst, C. H., & Alazemi, N. (2021). The capacity of primary health care facilities in Saudi Arabia: infrastructure, services, drug availability, and human resources. BMC Health Services Research, 21(365). [CrossRef]
  48. World Health Organization. (2021). Life expectancy at birth. https://www.who.int/data/gho/data/indicators/indicator-details/GHO/life-expectancy-at-birth-(years).
  49. Worldometer. (2022). Life expectancy by country and in the world (2023). https://www.worldometers.info/demographics/life-expectancy/.
  50. Cutler, D., Deaton, A., & Lleras-Muney, A. (2006). The determinants of mortality. Journal of economic perspectives, 20(3), 97-120. [CrossRef]
  51. World Health Organization. Non-communicable diseases. 16 September 2022. Available online: https://www.who.int/news-room/fact-sheets/detail/noncommunicable-diseases. 16 September.
  52. Wirayuda, A. A. B., Jaju, S., Alsaidi, Y., & Chan, M. F. (2022). A structural equation model to explore sociodemographic, macroeconomic, and health factors affecting life expectancy in Oman. The Pan African Medical Journal, 41.
  53. World Bank. Saudi Arabia. 2023. Available online: https://data.worldbank.org/country/SA (Accessed on 13 Jan 2023).
  54. World Bank. United Arab Emirates. 2023. Available online: https://data.worldbank.org/country/AE (Accessed on 11 Jan. 2023).
  55. Hair, J. F., Black, W. C., Babin, B. J., & Anderson, R. E. (2019). Multivariate Data Analysis. Andover. Hampshire, United Kingdom: Cengage.
  56. Hair Jr, J. F., Hult, G. T. M., Ringle, C. M., Sarstedt, M., Danks, N. P., & Ray, S. (2021). Partial least squares structural equation modeling (PLS-SEM) using R: A workbook.
  57. Zhang, Z. (2016). Multiple imputations for time series data with Amelia package. Annals of translational medicine, 4(3). [CrossRef]
  58. Chan, M. F., & Kamala Devi, M. (2015). Factors Affecting Life Expectancy: Evidence from 1980-2009 Data in Singapore, Malaysia, and Thailand. Asia Pacific Journal of Public Health, 27(2). [CrossRef]
  59. Chin, W. W. (2010). How to write up and report PLS analyses. In Handbook of partial least squares (pp. 655-690). Springer, Berlin, Heidelberg.
  60. Franke, G., & Sarstedt, M. (2019). Heuristics versus statistics in discriminant validity testing: a comparison of four procedures. Internet Research. [CrossRef]
  61. Henseler, J., Ringle, C. M., & Sarstedt, M. (2015). A new criterion for assessing discriminant validity in variance-based structural equation modeling. Journal of the Academy of marketing science, 43(1), 115-135. [CrossRef]
  62. Columbia University Mailman School of Public Health. (2023, March 13). Causal mediation. Columbia University Mailman School of Public Health. Available online: https://www.publichealth.columbia.edu/research/population-health-methods/causal-mediation.
  63. Kim, J. I., & Kim, G. (2018). Effects on inequality in life expectancy from a social ecology perspective. BMC Public Health, 18(1), 1-8. [CrossRef]
  64. Mondal, M. N. I., & Shitan, M. (2014). Relative importance of demographic, socioeconomic, and health factors on life expectancy in low-and lower-middle-income countries. Journal of Epidemiology, 24(2), 117-124. [CrossRef]
  65. Assadzadeh, A., & Nategh, H. (2015, November). The relationship between per capita electricity consumption and human development indices. In Proceedings of 6th IASTEM International Conference (pp. 1-7).
  66. Pasten, C., & Santamarina, J. C. (2012). Energy and quality of life. Energy Policy, 49, 468-476. [CrossRef]
  67. Ahmed, A. Z. E. (2015). The role of diversification strategies in the economic development for oil-depended countries:-the case of UAE. International Journal of Business and Economic Development (IJBED), 3(1).
  68. Euromonitor International. Economic growth and life expectancy: Do wealthier countries live longer? 24 Oct. 2019. Available online: https://www.euromonitor.com/article/economic-growth-and-life-expectancy-do-wealthier-countries-live-longer.
  69. Guo, J. The relationship between GDP and life expectancy isn’t as simple as you might think. The Washington Post. 18 Oct 2016. Available online: https://www.weforum.org/agenda/2016/10/the-relationship-between-gdp-and-life-expectancy-isnt-as-simple-as-you-might-think.
  70. Kunze, L. (2014). Life expectancy and economic growth. Journal of Macroeconomics, 39, 54-65. [CrossRef]
  71. Wang, Z., Asghar, M. M., Zaidi, S. A. H., Nawaz, K., Wang, B., Zhao, W., & Xu, F. (2020). The dynamic relationship between economic growth and life expectancy: Contradictory role of energy consumption and financial development in Pakistan. Structural Change and Economic Dynamics, 53, 257-266. [CrossRef]
  72. McKinsey & Company. Prioritizing health: A prescription for prosperity. 2020. Available online: https://www.mckinsey.com/industries/healthcare/our-insights/prioritizing-health-a-prescription-for-prosperity (Accessed on 12 Jan 2023).
  73. Luy, M., Di Giulio, P., Di Lego, V., Lazarevič, P., & Sauerberg, M. (2020). Life expectancy: frequently used but hardly understood. Gerontology, 66(1), 95-104. [CrossRef]
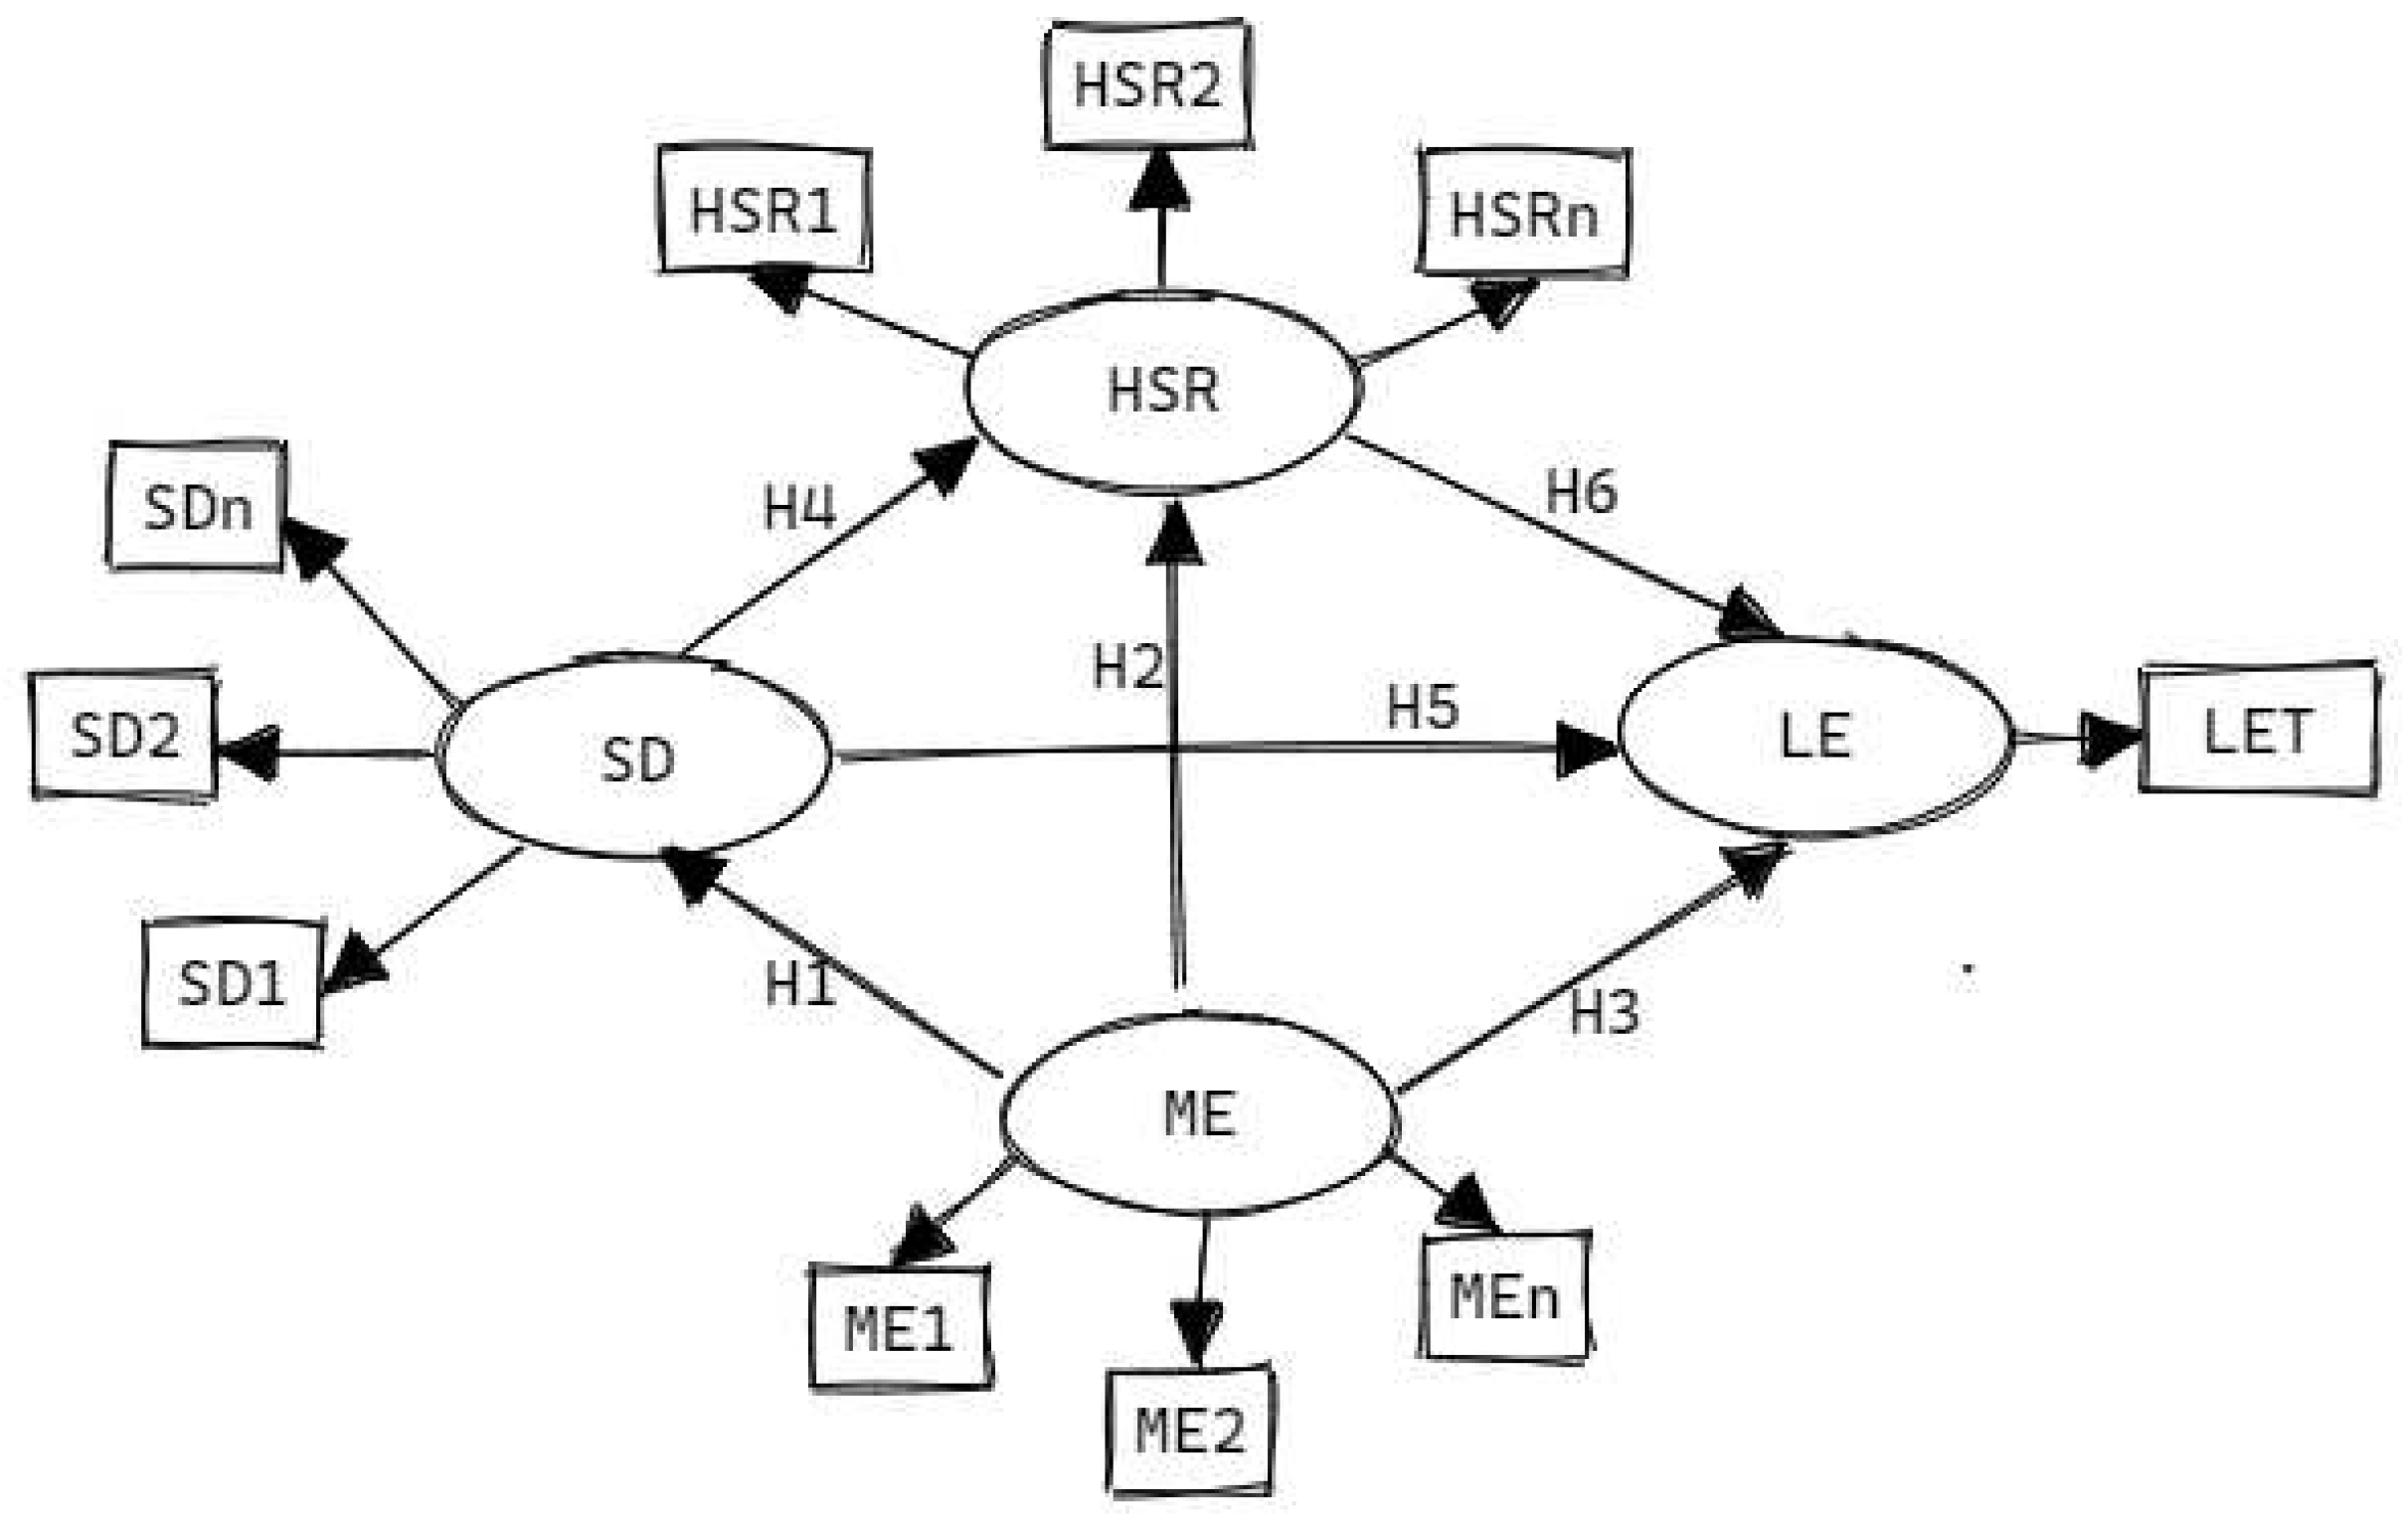
Figure 1. The Theoretical Model of Macroeconomic, Sociodemographic and Health Status - Resources on Life Expectancy in Saudi Arabia and the United Arab Emirates (1980-2020). LV: Latent Variable; MV: Manifest Variable SD: Sociodemographic; ME: Macroeconomic; HSR: Health Status and Resources; LE: Life Expectancy; LET: Life Expectancy at birth in total (male and female); H1,2,3,4,5,6 → the direct effect from one LV to the other corresponding LV.
Preprints 77044 g001
Figure 2. The Final Model of the Impact of Macroeconomic, Sociodemographic, and Health Status - Resources on Life Expectancy in Saudi Arabia (1980-2020). SD: Sociodemographic; ME: Macroeconomic; HSR: Health Status and Resources; LE: Life Expectancy; LET: Average Life Expectancy at birth (both males and females) in Saudi; GDPpc: Gross National Income per capita; FFE: Fossil Fuel Electricity; TSE: Tertiary School Enrollment; DPTI: DPT Immunization; MI: Measles Immunization; TGE: Total Greenhouse Emission; Numbers inside the LV circle indicate the R2 value. All the values inside the diagram above are significant at p< 0.05.
Preprints 77044 g002
Figure 3. The Final Model of the Impact of Macroeconomic, Sociodemographic, and Health Status - Resources on Life Expectancy in the United Arab Emirates (1980-2020). SD: Sociodemographic; ME: Macroeconomic; HSR: Health Status and Resources; LE: Life Expectancy; LET: Life Expectancy in Total (both males and females) in UAE; GDPpc: Gross Domestic Product per capita; FFE: Fossil Fuel Electricity; PPSE: Pre-Primary School Enrollment; PSE: Primary School Enrollment; SSE: Secondary School Enrollment; DPTI: DPT Immunization; MI: Measles Immunization; TGE: Total Greenhouse Emission; Numbers inside the LV circle indicate the R2 value. All the values inside the diagram above are significant at p< 0.05.
Preprints 77044 g003
Figure 4. Radar Chart for the Comparison of the Total Effects between Saudi Arabia and United Arab Emirates (UAE). The chart is drawn based on the hypothesis relationship (H1 to H6).
Preprints 77044 g004
Table 1. List of Latent and Manifest Variables with Their Respective Loadings.
LV MV Abbreviation Indicator (Unit) Loading
Saudi UAE
LE LET Life Expectancy in Total Life expectancy at birth, total (years) 1.000* 1.000*
ME GDPpc GDP per capita GDP per capita (Local Currency Unit) 0.950* 0.961*
FFE Fossil Fuel Electricity Fossil fuels electricity generation ( billion kilo-watthours) 0.966* -
Electricity production from natural gas sources (%) - 0.847*
SD PPSE Pre-Primary School Enrollment School enrollment, pre-primary (% gross) - 0.951*
PSE Primary School Enrollment School enrollment, primary (% gross) - 0.578*
SSE Secondary School Enrollment School enrollment, secondary (% gross) - 0.708*
TSE Tertiary School Enrollment School enrollment, tertiary (% gross) 1.000 -
HSR DPTI Diphtheria, Pertussis, and Tetanus (DPT) Immunization Immunization, DPT (% of children ages 12-23 months) 0.972* 0.979*
MI Measles Immunization Immunization, measles (% of children ages 12-23 months) 0.980* 0.945*
TGE Total Greenhouse Emission Total greenhouse gas emissions (kilotons of CO2) 0.948* 0.913*
*Significant at p<0.05. LV: Latent Variable. MV: Manifest Variable. SD: Sociodemographic; ME: Macroeconomic; HSR: Health Status and Resources. Source: World Bank [53,54]; UAE: United Arab Emirates; Saudi: Saudi Arabia.
Table 2. Reliability, Validity, and Predictability of the Latent Variables.
LV Country CA CR Rhô-A AVE HTMT (95%CI)
ME SD HSR
ME Saudi 0.930 0.952 0.957 0.775 - - - - -
UAE 0.800 0.901 0.914 0.734 - -
SD Saudi 1.000 1.000 1.000 1.000 0.590 0.919 0.668 (0.258-0.983) - -
UAE 0.644 0.799 0.953 0.523 0.740 0.512 0.783 (0.573-0.960) -
HSR Saudi 0.965 0.977 0.972 0.934 0.640 0.358 0.800 (0.702-0.988) 0.524 (0.274-0.803) -
UAE 0.952 0.965 0.943 0.843 0.720 0.557 0.847 (0.723-0.955) 0.822 (0.633-0.981)
LE Saudi 1.000 1.000 1.000 1.000 0.864 0.781 0.921 (0.821-0.975) 0.656 (0.293-0.913) 0.898 (0.852-0.964)
UAE 1.000 1.000 1.000 1.000 0.969 0.908 0.933 (0.849-0.993) 0.978 (0.945-0.998) 0.972 (0.946-0.990)
CA: Cronbach’s Alpha (>0.7); Rhô -A: Rhô-Alpha (>0.7); CR: Composite Reliability (>0.7); AVE: Average Variance Extraction (>0.50); R2: >0.25 recommended; Q2: <0.02 (weak), 0.15 (moderate), >0.35 (strong); SD: Sociodemographic; ME: Macroeconomic; HSR: Health Status and Resources; LE: Life Expectancy. LV, Latent variables; HTMT: Hetero-Trait and Mono-Trait ratio (95% CI <1.0); All estimates are significant at p<0.05; UAE: United Arab Emirates; Saudi: Saudi Arabia.
Table 3. Effect Size, Direct Effect, Indirect Effect, and Total Effect of the Latent Variables.
Hypothesis (Relationship) Country Direct
Effect (95% CI)
Indirect
Effect (95% CI)
Total
Effect (95%CI)
H1 (ME→ SD) Saudi 0.958 (0.943-0.972) - 0.958 (0.943-0.972) 11.293
UAE 0.716 (0.625-0.779) 0.716 (0.625-0.779) 1.051
H2 (ME→ HSR) Saudi - 0.574 (0.495-0.648) 0.574 (0.495-0.648) -
UAE - 0.534 (0.434-0.603) 0.534 (0.434-0.603) -
H3 (ME→ LE) Saudi - 0.507 (0.415-0.590) 0.507 (0.415-0.590) -
UAE - 0.509 (0.411-0.576) 0.509 (0.411-0.576) -
H4 (SD→ HSR) Saudi 0.599 (0.517-0.674) - 0.599 (0.517-0.674) 0.559
UAE 0.746 (0.627-0.823) 0.746 (0.627-0.823) 1.256
H5 (SD→ LE) Saudi - 0.529 (0.432-0.614) 0.529 (0.432-0.614) -
UAE - 0.711 (0.590-0.793) 0.711 (0.590-0.793) -
H6 (HSR→ LE) Saudi 0.884 (0.815-0.923) - 0.884 (0.815-0.923) 3.558
UAE 0.953 (0.928-0.970) 0.953 (0.928-0.970) 9.870
LV: Latent variable; SD: Sociodemographic; ME: Macroeconomic; HSR: Health Status and Resources; LE: Life Expectancy; f2: Effect size <0.02 (weak), 0.15 (moderate), >0.35 (strong); All effects are significant at p<0.05. UAE: United Arab Emirates; Saudi: Saudi Arabia.
Disclaimer/Publisher’s Note: The statements, opinions and data contained in all publications are solely those of the individual author(s) and contributor(s) and not of MDPI and/or the editor(s). MDPI and/or the editor(s) disclaim responsibility for any injury to people or property resulting from any ideas, methods, instructions or products referred to in the content.
Copyright: This open access article is published under a Creative Commons CC BY 4.0 license, which permit the free download, distribution, and reuse, provided that the author and preprint are cited in any reuse.
Prerpints.org logo

Preprints.org is a free preprint server supported by MDPI in Basel, Switzerland.

Subscribe

© 2024 MDPI (Basel, Switzerland) unless otherwise stated