1. Introduction
Mixed lineage leukemia 1 (MLL1), also known as MLL, KMT2A, HRX, HTRX and ALL1, is one of the six mixed lineage leukemia (MLL) family histone methyltransferases (HMT) in mammals (Dou et al., 2005; Milne et al., 2002; Nakamura et al., 2002). It mainly introduces 1-, 2- and 3-methylation into histone H3K4 through the evolutionarily conserved set domain. MLL1 and H3K4 methylation (H3K4me) are located in the promoter, transcription initiation site and 5’ transcription region of the target genes and promote transcription initiation, so they play an important role in transcriptional regulation, especially in the early development of zygotic gene activation (ZGA) and hematopoiesis (Guenther et al., 2005; Lauberth et al., 2013).
The H3K4 HMT activity of MLL1 is controlled by the core complex composed of MLL1 and WDR5. The activity of MLL1 alone is weak, but its H3K4 HMT activity is greatly enhanced with the formation of the core complex (Dou et al., 2006). The MLL1 core complex consists of WDR5 and MLL1 proteins (Dou and Hess, 2008; Dou et al., 2006). By disrupting the protein interaction between WDR5 and MLL1, the MLL1 core complex can be effectively dissociated and MLL1 activity can be inhibited (Patel et al., 2008). MM-102 is one of the compounds that can prevent the interaction between MLL1 and WDR5, inhibit MLL1 activity. When mouse bone marrow cells transfected with MLL1-AF9 fusion gene were cultured with MM-102, the expression of MLL1 target genes HoxA9 and Meis-1 was greatly reduced (Karatas et al., 2013). Furthermore, the down regulating H3K4me3 through MM-102 can improve ZGA and abnormal expression patterns of epigenetic chromatin modifying enzymes, pluripotency and apoptosis genes in the blastocyst stage, greatly improve the efficiency and embryo quality of porcine somatic cell nuclear transfer and make it closer to in vivo embryos (Zhang et al., 2018). Our latest research found that adding appropriate concentrations of MM-102 and 3i (MM-102, PD0325901 and CHIR99021) during the ZGA stage of mouse and bovine in vitro fertilization (IVF) embryo development can greatly improve the IVF blastocyst development without affecting the blastocyst quality (Han et al., 2020). MM-401 is another inhibitor of MLL1, which can transform mouse EpiSCs into naïve pluripotent state (Zhang et al., 2016). MLL1 inhibition cause the redistribution of H3K4me1 in enhancers, germline determinants and EpiSCs markers, to regulate the pluripotency regulatory network and regain the ability to participate in embryonic development and germline chimerism (Zhang et al., 2016). However, whether MLL1 inhibition by MM-102 or combined with other small molecule inhibitors can transform human or livestock prime ESCs into naïve state is still lack of relevant experimental study.
Cattle provide human with high-quality meat products and nutritious dairy products, which has important economic and research values. Establishment the bovine pluripotent stem cells (bPSCs) have great significance of germplasm conservation, gene editing breeding, and understanding the developmental specificity of ruminants. In 2018, Bogliotti et al. obtained bovine prime ESCs, known as CTFR-bESCs in a culture system supplemented with fibroblast growth factor 2 (FGF2) and WNT signaling pathway inhibitor IWR1, which exhibited characteristics of prime PSCs (Bogliotti et al., 2018). Recently, bovine expanded pluripotent stem cells were established from blastocysts or by reprogramming of bovine embryonic fibroblasts, which possess the embryonic and extraembryonic development potentials (Zhao et al., 2021). However, whether we can transform bovine prime ESCs to naïve state for bovine remains unsolved.
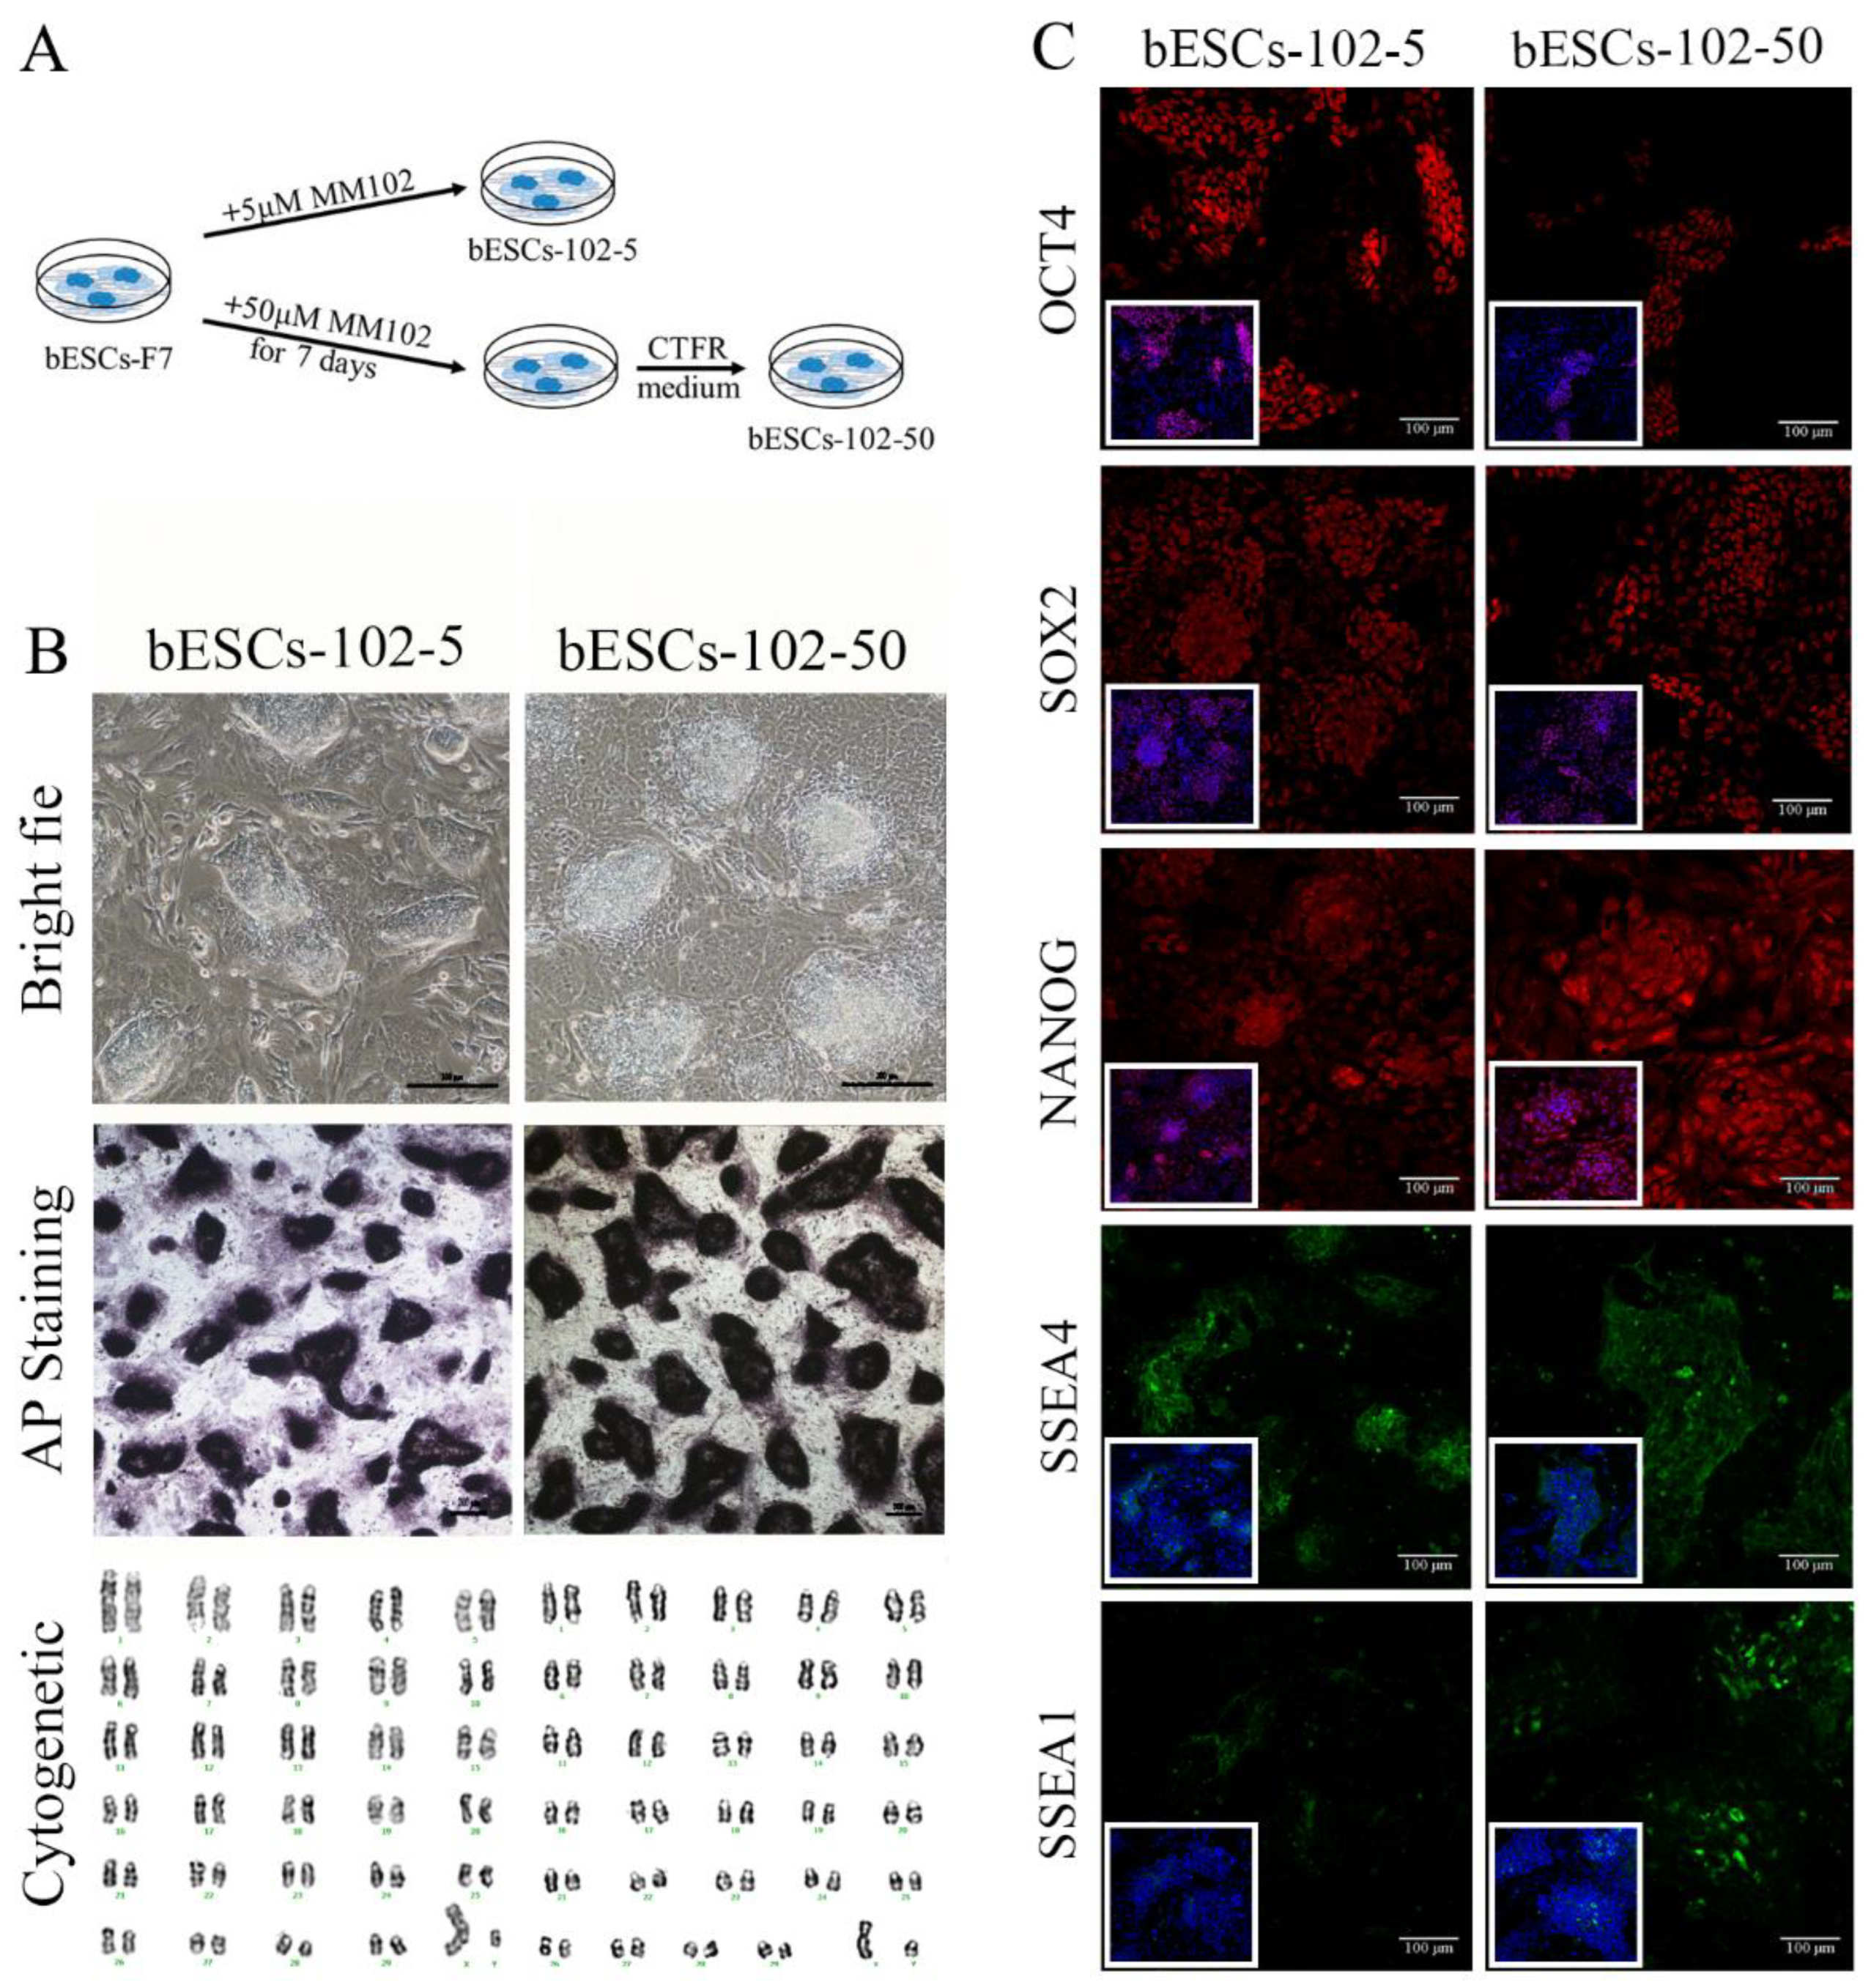
In this study, bovine prime ESCs were established from normal culture protocol IVF or MM-102 treated IVF embryos and MM-102 treated bESCs. MLL1 inhibitor enhanced the capacity of differentiation of bESCs. After addition of MM-102, bESCs could differentiate endoderm markers in vivo. And the signaling pathways of pluripotency was active by MM-102 treatment. The effects of MLL1 inhibition on H3K4 methylation were determined by RNA-sequencing, western blotting and ChIP-Seq analysis of H3K4me1. The modification pattern of H3K4me1 was altered by MM-102. In particular, we focused on the changes of H3K4me1 in the promoter region of genes, which decreased the quantity in the promoter region but significantly increased the proportion of the total modifications in the treated cells. The expression of DNMT3B was significantly increased. DNA methylation was comprehensively investigated by genome-wide DNA methylation sequencing. The analysis results showed that the pattern of DNA methylation modification was also significantly altered. The methylation level of promoter was reduced. This study will provide a new idea for stem cell state transformation by regulating epigenetic modification.
2. Materials and Methods
Animal Care and Use
All experiments with mice (generation of embryonic fibroblasts and teratoma formation) were conducted in accordance with the Guide for Care and Use of Laboratory Research Involving Animals and were approved by Inner Mongolia University’s Animal Care and Use Committee. C57 mice used in the production of mouse fibroblasts were provided by the laboratory animal breeding room of our laboratory. Teratoma nod-SCID mice used in differentiation test were purchased from Beijing Wetong Lihua Co., LTD., and tested in our laboratory temporary animal breeding room.
Bovine in vitro Fertilization
Bovine ovaries were obtained from a local abattoir, and oocytes were cultured between 22-24h after the maturation, and fertilized with the frozen cattle sperm. 6h after fertilization, the eggs transferred to the embryonic culture medium, and MM-102 was added after 48h cultivation. The embryos were cultured in fresh culture medium for 7-8 days to develop into blastocysts (Han et al., 2020).
Derivation of bESCs Cell Lines
The bovine blastocysts obtained by in vitro fertilization were removed from the zona pellucida and plated in 4-well plates, with mTeSR-E6 (05946, STEMCELL Technologies) added with 20 ng/mL FGF-2 (100-18B, STEMCELL Technologies), 2.5 μM IWR-1 (I0161, Sigma Aldrich) and 0.1328 g/mL low fatty acid BSA (219989925, MP Biomedicals NZ) and were incubated at 37 °C and 5% CO2. After 48-72 h, ICMs adhered to the feeder layer, and the medium was changed daily. Outgrowths (after 8–10 days in culture) were dissociated and passaged using TrypLE (12563011, Gibco) and were reseeded in the presence of 10 μM Rho kinase (ROCK) inhibitor Y-27632 (SCM075, Sigma). The established bESCs lines were grown in 12-wells and were passaged every 5 days at a 1:4-1:6 split ratio. To increase cell survival, the ROCK inhibitor Y-27632 (10 μM) was added to the wells 1 h before passaging and was also added to the newly prepared wells containing MEFs treated with mitomycin and fresh culture medium during the first 24h cultivation.
Alkaline Phosphatase (AP) Staining
Prior to AP staining, bESCs were cultured on feeder cells for 4 days. Following the removal of the culture medium, cells were washed with DPBS and fixed for 10 min at room temperature using 4% paraformaldehyde. The fixed cells were washed three times with DPBS and stained for 1-3 h at room temperature in the dark using the BCIP/NBT Color Development Substrate Kit (C3206, Biyuntian). Cells were washed with DPBS to terminate the staining reaction and were subsequently maintained in DPBS.
Karyotype Analysis
During the flourishing period of cell division, which is usually on the 4th day of culture, 2 mg/mL colchicine (64-86-8, Sigma) was added to the culture medium and incubated at 37°C for 2.5 h. Then, the cells were treated with 8 mL 0.075 mol KCl solution at 37°C water bath for 30 min. Collect the cells and 1mL fixing solution (acetic acid: methanol =1:3) was added to the cells and mixed. After centrifugation at 1500 rpm for 5 min, the supernatant was discarded, 10 mL fixing solution was added and mixed, and cells stood at room temperature for 15min. After three times of these fixing procedures, 50-200 μL fixing solution was added to the cells and mixed well according to the amount of precipitation. Then the cells were dropped from a height of about 1 m onto a pre-cooled slide at -20°C, and let to dry overnight. The prepared sample was immersed in 0.025% trypsin solution preheated at 37℃, digested for 10 s, then quickly washed in 0.85% NaCl solution 2 times, and dried. Dye in the Jimsa solution (48900, Sigma) for 15 min, slowly wash off the excess with water, and dry. Photographs were taken and analyzed using a cytogenetics workstation.
Quantitative Real-Time PCR (qRT-PCR)
The quantification of the mRNAs was conducted by real-time PCR using specific primers. Real-time PCR was performed using an Applied Biosystems 7500 sequence detection system (Thermo Fischer Scientific) and KAPA SYBR® FAST Universal qPCR master mix (Kapa Biosystems Pty). The PCR samples were analyzed in 96-well plates. Each reaction (20 mL) contained forward and reverse primer at 0.2 mM and 10 mL SYBR Green PCR master mix. The PCR steps included incubation for 5 min at 95℃, followed by 40 cycles of 95℃ for10 s, 60℃ for 20 s, and 72℃ for 30 s. All reactions were performed at least in triplicate, and product identity was confirmed by melting curve analysis. Relative expression levels were determined using the 2-ΔΔCT method and normalized against GAPDH levels.
RNA-seq Analysis
Transcriptome (RNA) sequencing was performed by Tianjin Nuohe Zhiyuan Biotechnology Co., LTD. PCA plot and volcano plot in this paper are all generated by ggplot2(3.3.5) in R software 4.1.0, and heatmap was generated by pheatmap (1.0.12); all tracks data (BS-seq, Chip-seq) was transformed to bigwig format used deeptools (3.4.3) (Ramirez et al., 2014) and then visualized with the Integrative Genomics Viewer (IGV,2.14.1) (Robinson et al., 2011).
Immunofluorescence Staining (IF)
Cells were cultured on the coverslips in the 4-well plate. When grown to a suitable density, the cells were fixed with 4% paraformaldehyde for 10min and then treated with Triton X-100 to penetrate the cell membrane. After three washes with PBS, the cells were incubated with the primary antibody at 4℃ overnight. Then, the cells were incubated with the second antibody at room temperature for 1 hour. After the removal of antibodies, the cells were incubated at room temperature with DAPI for 5 min. The slide was sealed after a microscopic examination. The antibodies used in this experiment include anti-OCT4 (sc-5279, Santa Cruz Biotechnology), anti-SOX2 (L1D6A2, Cell Signaling), anti-NANOG (500-P236, Peprotech), anti-SSEA-1 (MAB4301, Sigma), anti-SSEA-4 (MAB4304, Millipore), anti-TRA-1-60 (MAB4360, Millipore), anti-TRA-1-81 (MAB4381, Millipore), anti-AFP (AF5369, R&D Systems), anti-SMA (ab5694, Abcam), and anti-GFAP (I1044, DAKO).
Flow Cytometry Analysis
The cells were fixed with 4% paraformaldehyde for 10 min and permeabilized with 0.8% Triton X-100 for 10 min. Then, the cells were incubated with antibodies in 10% goat serum for 1h at room temperature. The primary antibody was incubated at 4℃ overnight and the secondary antibody was incubated at room temperature for 1 h. The DPBS was used to wash off antibodies between each step. After incubation, the cells were screened and analyzed by flow cytometry (Cytoflex LX) according to the corresponding fluorescence intensity. The antibodies used in this experiment include anti-SSEA-1 (MAB4301, Sigma) and anti-SSEA-4 (MAB4304, Millipore).
Western Blotting (WB)
Cells were collected and protein was extracted by Mammalian Protein Extraction Reagent (CWBIO, China) according to the manufacturer’s procedure. The cracking product is added to the Loading Buffer and boiled in boiling water for 5 minutes for denaturation. Put the same amount of protein sample into the hole of SDS-PAGE gel, and maintain the constant pressure of 90 - 120 V, 30 min - 3 h. After electrophoresis and maker separation, carry out mode transfer, constant current 200 mA, 30 min-1 h. After the transfer of the required strip is completed, place it in 5% sealing solution and place it at room temperature for 1 h. Transfer the membrane to the diluent of primary antibody at 4℃ overnight, and wash the membrane with TBST solution for 3 times. The second antibody was incubated at room temperature for 1 h, and TBST washed the membrane for 3 times; Expose after treatment with indicator. The antibodies used in this experiment include anti-H3 (4620S, Cell Signaling Technology), anti-H3K4me1 (ab8895, Abcam), anti-H3K4me2 (ab32356, Abcam), anti-H3K27me3 (ab6002, Abcam), anti-GAPDH (10494-1-AP, Proteintech), anti-PRDM14 (ab187881, Abcam), anti-P300 (ab54984, Abcam), and anti-G9A (ab18894, Abcam). Images were obtained using a Tanon 5200 Multi Automatic Fluorescence and Chemiluminescence Imaging System (Tanon, China).
Statistical Analysis
The differences in transcript levels were determined by the T-test. The blastocyst rates, TE, ICM and total cells of the blastocysts subjected to different treatments were analyzed via the chi-squared test with Yates’ correction. The analyses were performed using the statistical software GraphPad PRISM 6.0 (GraphPad Software, Inc., La Jolla, California, USA), and the results are presented as the means ± SD. Differences at P < 0.05 were considered statistically significant.ChIP-seq Analysis
The Simple ChIP
® Plus Enzymatic Chromatin IP Kit (Magnetic Beads) (9005, Cell Signaling) was utilized to extract DNA fragments from the cells. The sequencing was performed by Tianjin Nuohe Zhiyuan Biotechnology Co., LTD. Illumina reads were first mapped to the UCSC bosTau9 reference using bwa-mem (0.7.17) (Li and Durbin, 2009) with default parameters. Next Picard (
http://broadinstitute.github.io/picard/, version 2.23.1) was used to markup PCR duplicates. And then we used macs2 (v2.2.7.1, -nomodel-broad-broad-cutoff 0.1-shift 0-gsize 2.7e9-keep-dup auto) (Zhang et al., 2008) to call peaks. H3K4me1 signals were normalized using the MA norm (1.1.4) (Shao et al., 2012) method for quantitative comparison of ChIP-seq data, and the significant differential peaks were determined as log10(p-value) <0 and M-value> 1. Subsequently, the differential peaks were annotated to UCSC bosTau9 with R package ChIP seeker (1.28.3) (Yu et al., 2015) and TxDb. Btaurus. UCSC. bosTau9. refGene (3.10.0).
Bisulfite Genomic Sequencing Analysis
All cell lines of this experiment were used to analyze the promoter methylation of OCT4 and NANOG by bisulfite-sequencing PCR. DNA treatment and methylation-specific PCR were executed using the ZYMO EZ DNA Methylation-Gold Kit (ZYMO RESEARCH) and Takara Ex Taq (Hot Start Version) according to the associated manufacturer’s protocols. The PCR products were ligated into pEASY-T1 Cloning Vector (Trans Gen Biotech) for methylation sequencing. At least 10 clones per gene were sequenced and analyzed for each sample.
Whole Genome Methylation Sequencing
DNA methylation sequencing was performed by Tianjin Nuohe Zhiyuan Biotechnology Co., LTD. R package edge R (3.34.1) (McCarthy et al., 2012) was applied to analyze the difference between treatment and control. The read counts were tested for differential expression using the `exact test`. The differentially expressed genes (DEGs) in the data set with |log2 (fold change) |≥1.5 and adjusted P ≤ 0.05 were selected for the subsequent analyses. Next cluster profiler (4.0.5) (Yu et al., 2012) package was used to annotate and enrich the GO and KEGG pathways for DEGs. P ≤ 0.05 was determined as a cut-off criterion for significant enrichment.
4. Discussion
Epigenetics is an important type of gene regulation, which has a critical effect on all aspects of life activity. Given the highly accessible and hyperactive chromatin structures in ESCs, it is generally assumed that H3K4me plays an important ‘‘housekeeping’’ role in ESCs and is necessary for ESCs to maintain self-renewal and unlimited differentiation potential (De Los Angeles et al., 2015). Previous research shows that the mixed-lineage leukemia 1 (MLL1)/WD-40 repeat protein 5 (WDR5) complex is responsible for the H3K4me3 (Dou
et al., 2006; van Nuland et al., 2013). Hui et al. found that H3K4me1 was significantly different between ESCs and EpiSCs, but not H3K4me3. Interestingly, inhibition of MLL1 led to genome-wide change of H3K4me1 in EpiSCs and global redistribution of H3K4me1 at enhancers and represses lineage determinant factors and EpiSC markers, which indirectly regulate the transcription of mouse ESCs (Zhang et al., 2016). This is basically consistent with our conclusions. After MLLI inhibitor MM-102 was added into bESCs culture system, the expression of
MLL1 in bESCs-102-50 was significantly down-regulated, and ChIP results showed that H3K4me1 in bESC was down-regulated and lower than that in bESCs-102-5, while
MLL1 in 102-5 was not inhibited (
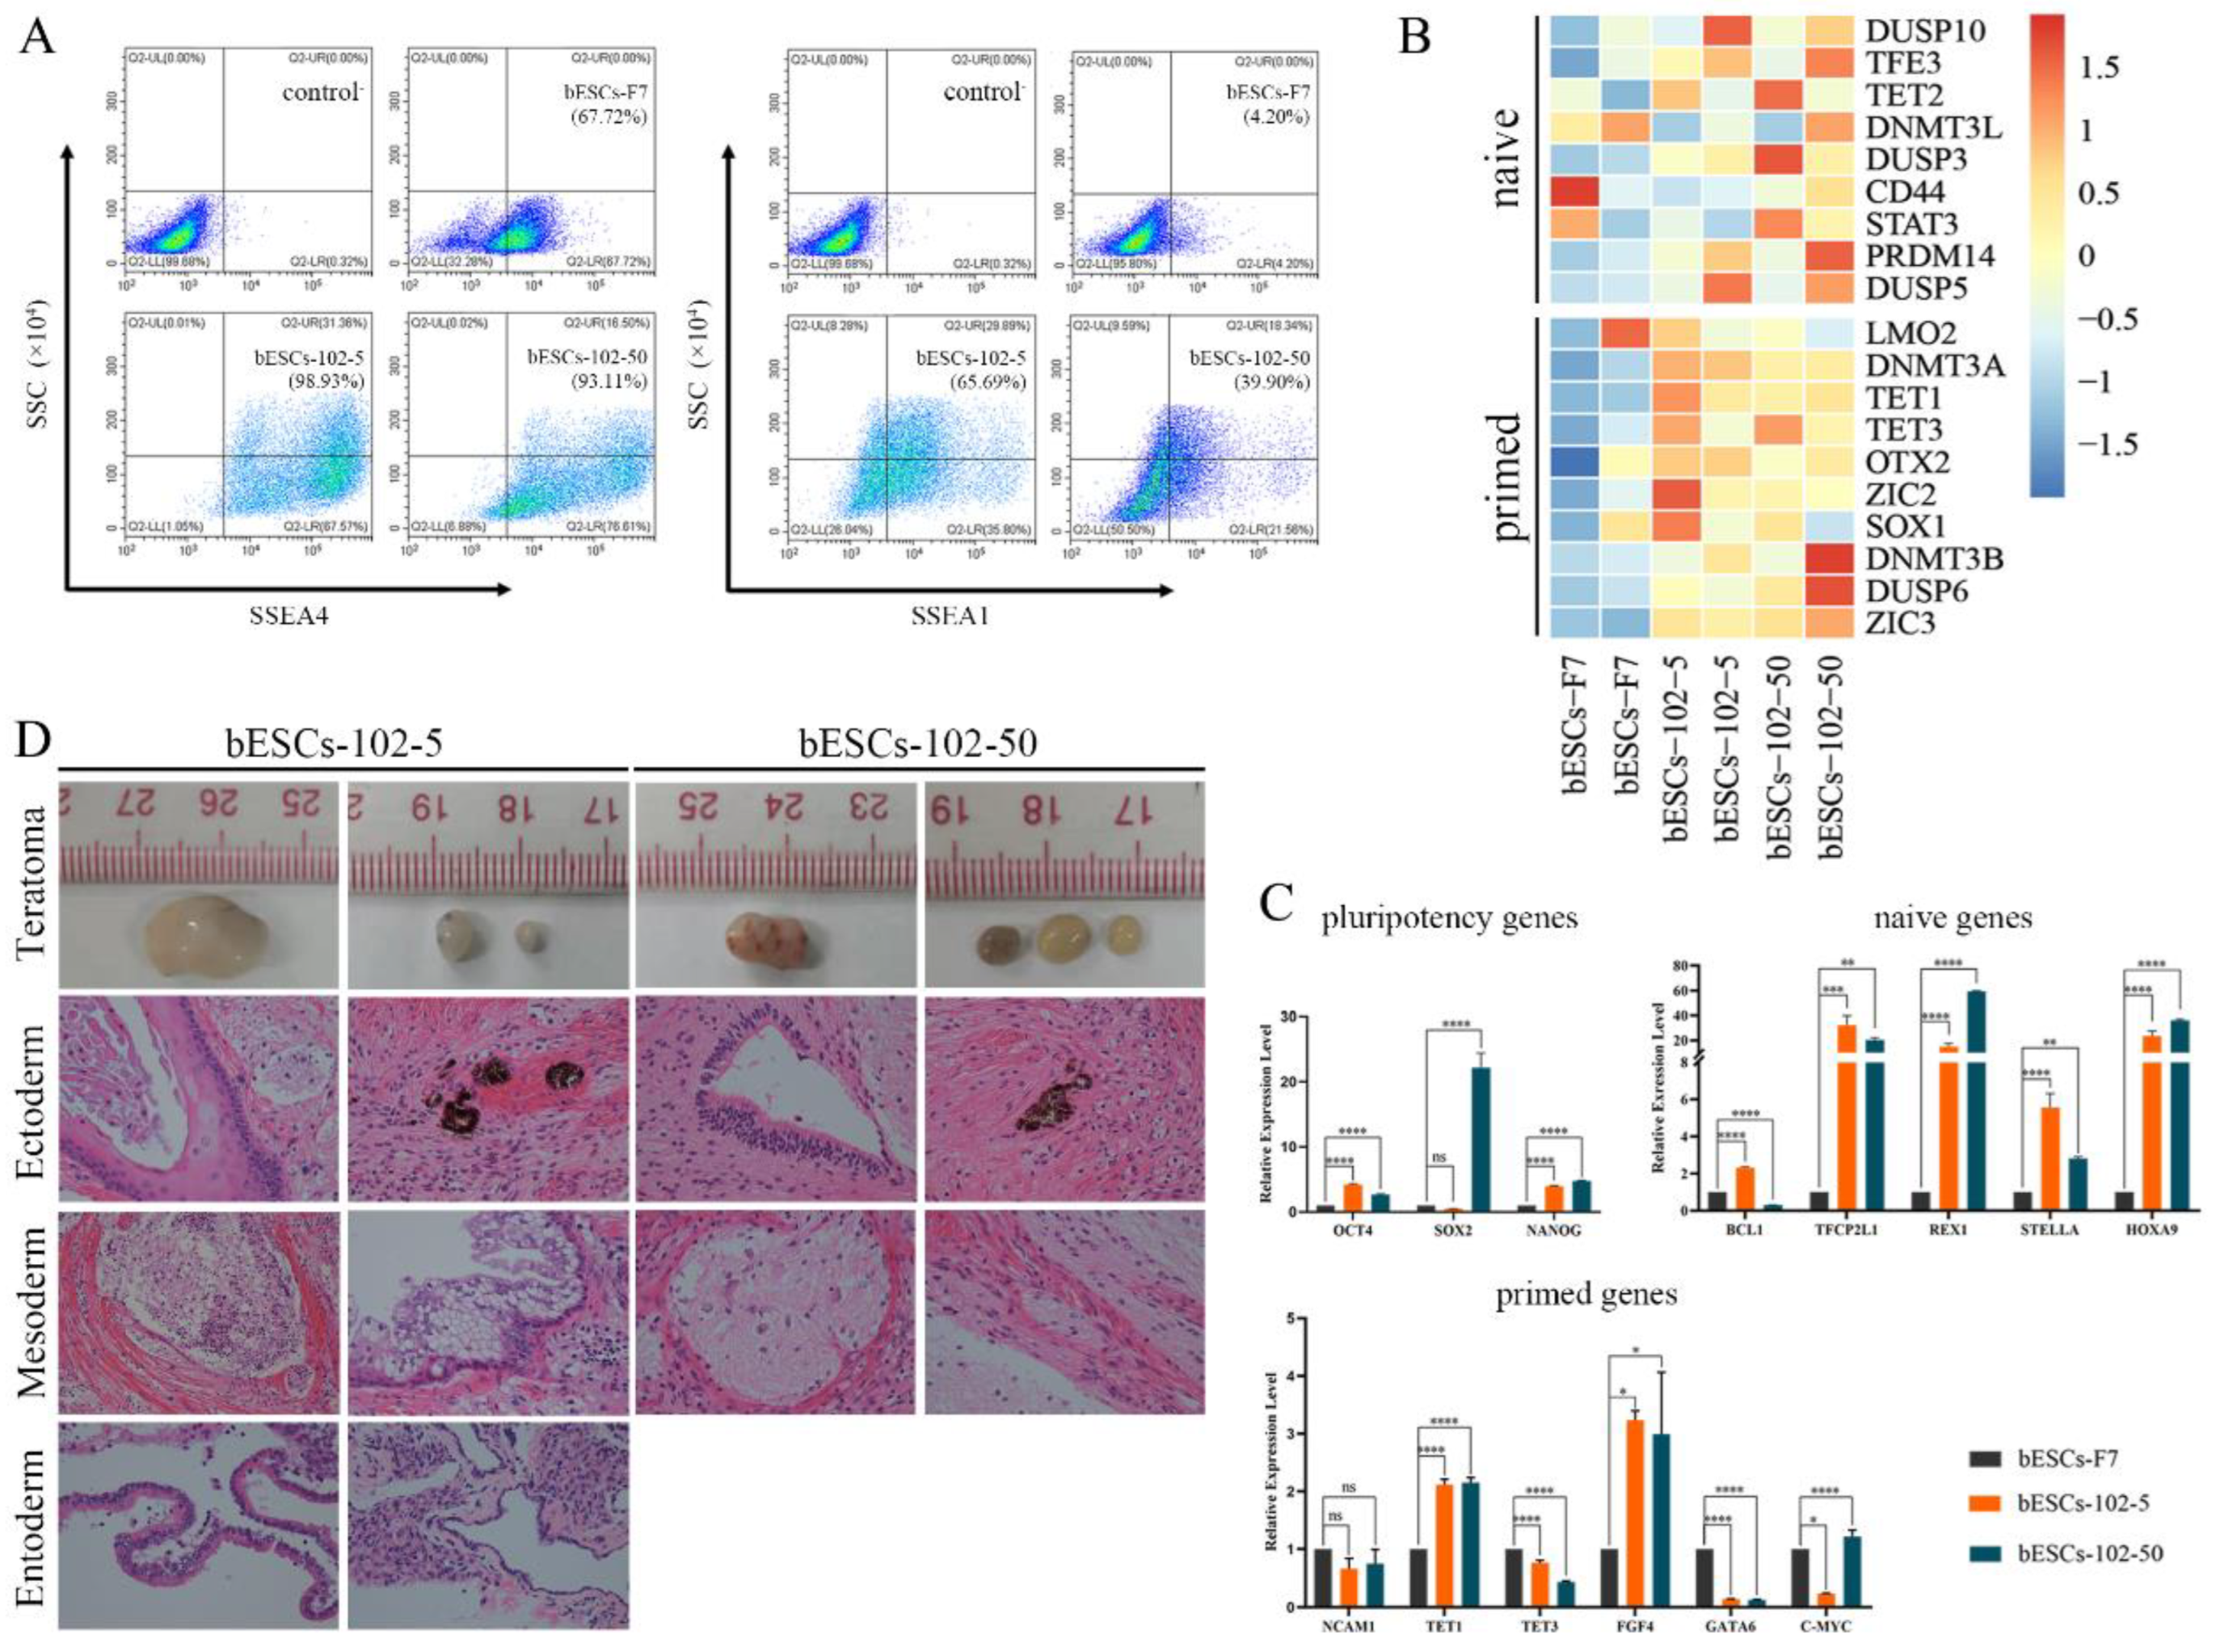
Figure 7A, 7D and 7F). But bESCs-102-5 shows higher pluripotency than bESCs-102-50 (
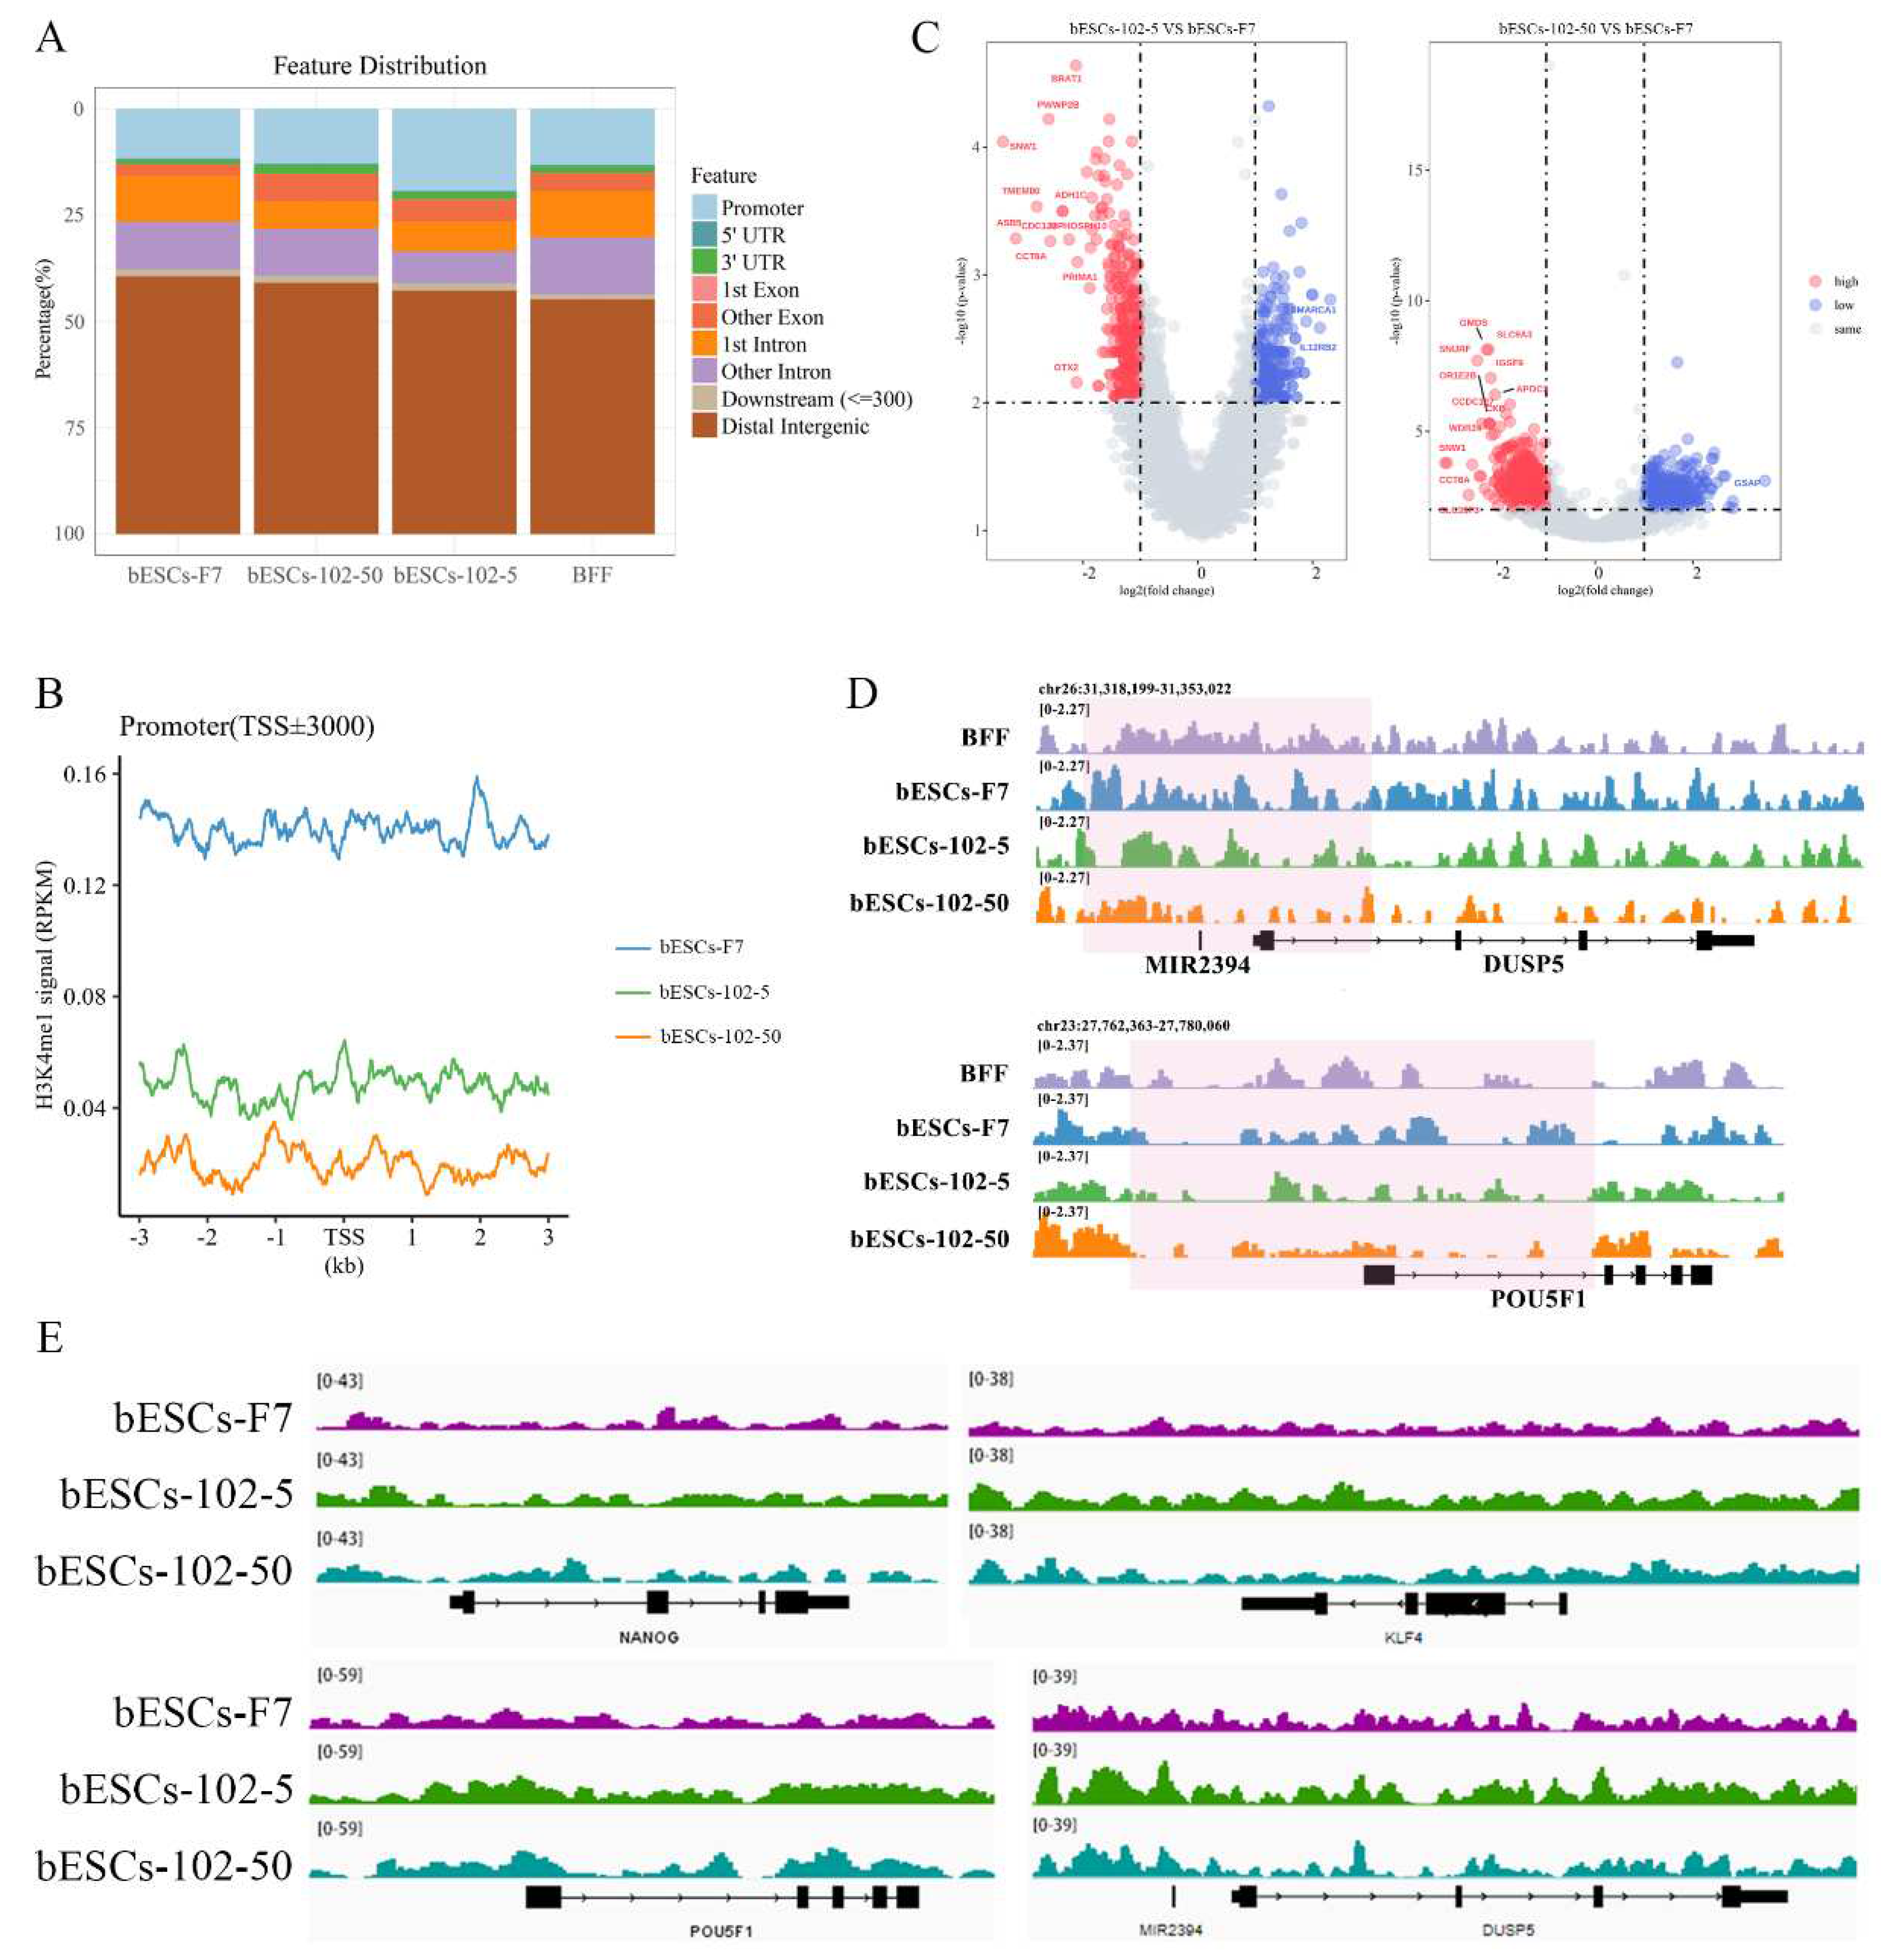
Figure 4 and S2A), and a higher proportion of H3K4me1 in the promoter region was found in bESCs-102-5 (
Figure 8A), and more H3K4me1 modifications were found in the promoter sites of the representative pluripotent genes DUSP5, KLF4, PRAM14 (
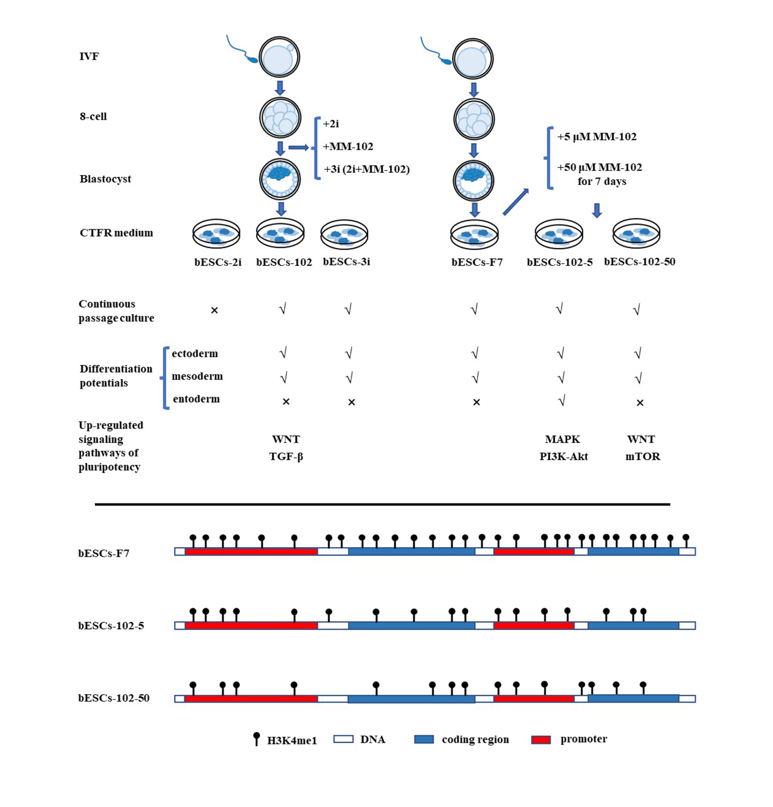
Figure 8D and S5D). In conclusion, the reduction of the total amount of H3K4me1 modification was related to the inhibition of MLL1, but the proportion of H3K4me1 in promoter was more important for the influence of pluripotent. The appropriate addition of MM-102 improved the pluripotency of bESCs by increasing H3K4me1 on the promoter of pluripotent genes.
In addition, in our results, the expression of histone lysine methyltransferase PRDM14 was significantly up-regulated after MM-102 treatment, although H3K4me1 was decreased. PRDM14 is also a common marker of primordial germ cells and pluripotent embryonic stem cells (Nady et al., 2015). In hESCs, knockdown studies have shown that loss of PRDM14 leads to the rapid downregulation of OCT4 and differentiation of hESCs (Chia et al., 2010; Tsuneyoshi et al., 2008). Accordingly, the overexpression of PRDM14 in hESCs prevents the upregulation of differentiation markers, including GATA6, GATA4, SOX7 (endoderm), T, MIXL1, FOXF1 (mesoderm), and PAX6 (ectoderm) (Tsuneyoshi et al., 2008). In our previous study, PRDM14 was highly expressed in embryos from 8-cell to blastocyst stage (Han et al., 2020). The up-regulation of PRDM14 by MM-102 may also be one of the reasons for the change of H3K4me1 distribution structure, and PRDM14 is closely related to the increase of pluripotency, which may be the reason for the change of bESCs status.
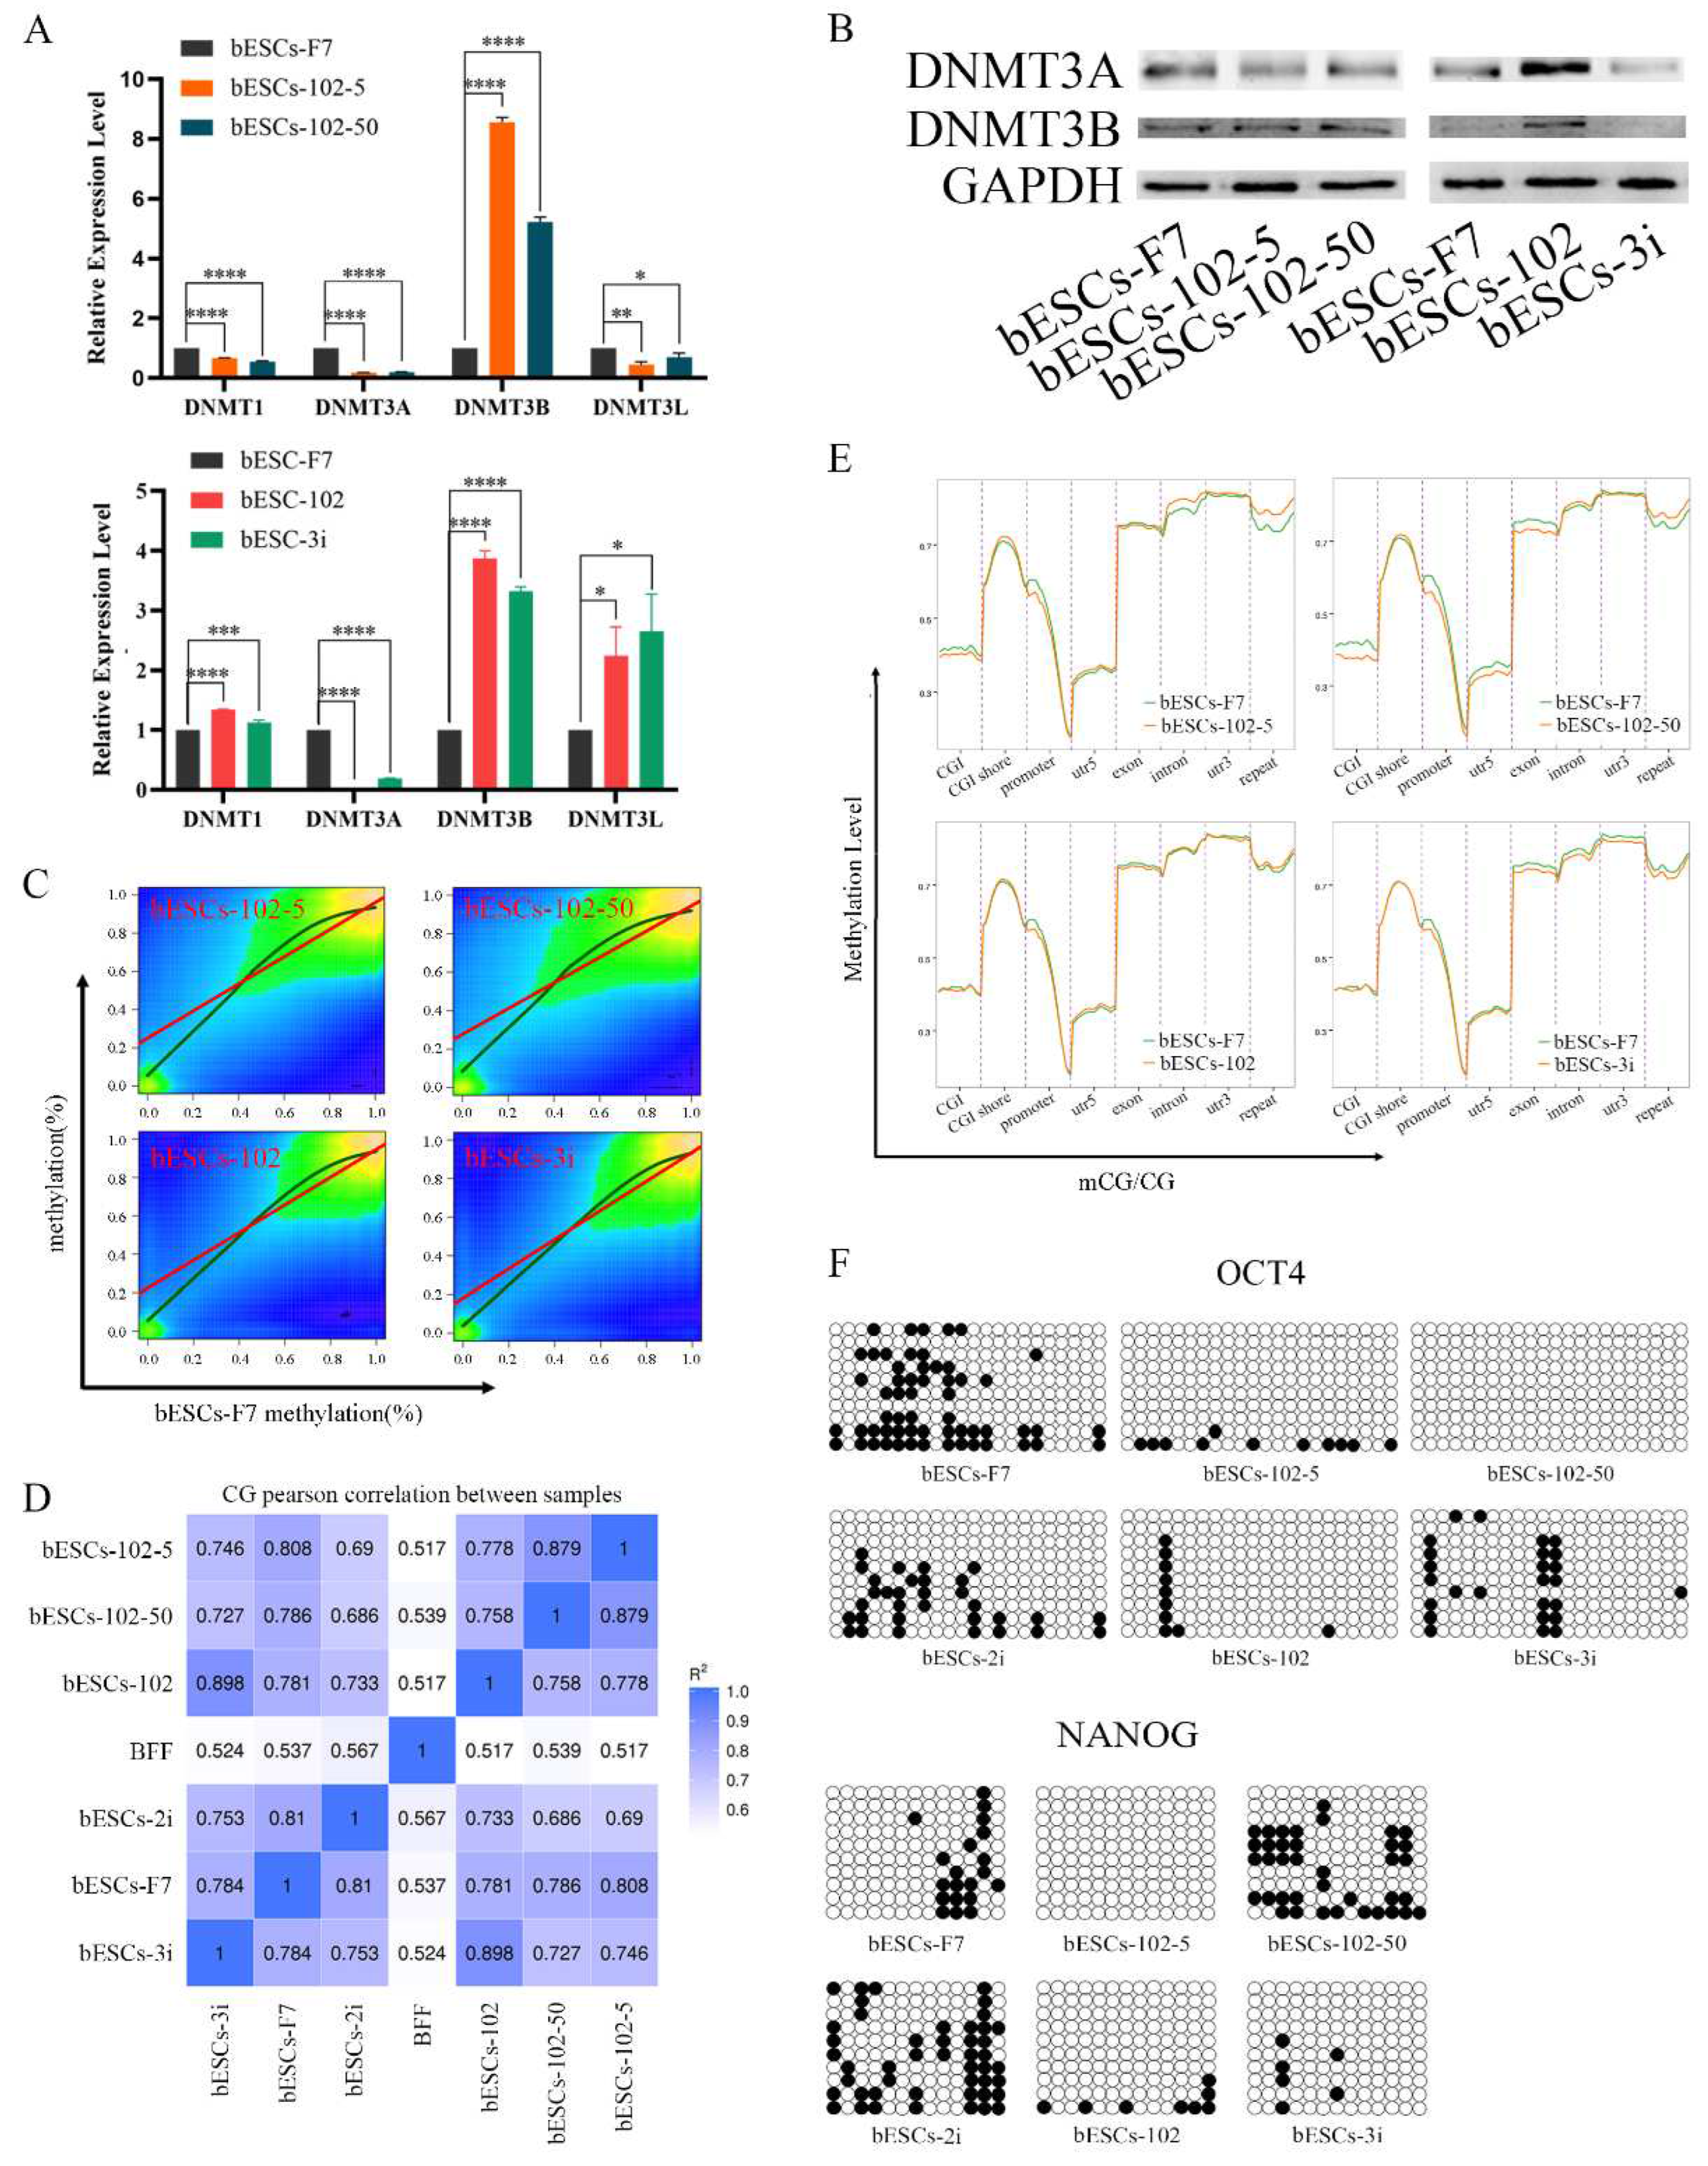
DNA methylation is a heritable and reversible enzyme-mediated modification of DNA. In vertebrate genomic DNA, the cytosine residues at the fifth position in CpG sequences are often methylated (F Antequera, 1993). Most CpG sequences are located in non-genic repeated sequences, whereas some CpGs are located in the promoter regions of housekeeping genes and tissue-specific genes, where they regulate gene expression (Bird, 1987; Gardiner-Garden and Frommer, 1987). Although there are some methods for controlling gene expression, CpG methylation is one of the epigenetic hallmarks determining chromatin structure and controlling gene expression (Horii and Hatada, 2016). DNA methyltransferases (DNMTs) have different functions. DNMT1 is mainly responsible for the maintenance of DNA methylation during replication, and DNMT3A and DNMT3B are also involved in the de novo methylation of unmethylated DNA (Jackson et al., 2004). DNMT3B is the primary driver of de novo DNA methylation on actively transcribed genes, while DNMT3A plays a minimal role in ESCs (Baubec et al., 2015). In zygotes, DNA is typically highly methylated but, during preimplantation, DNA methylation is erased globally. Then, at the start of post-implantation development in mouse embryos, DNA again becomes dramatically hypermethylated (Kubiura-Ichimaru et al., 2021). Increased expression of DNMT3B in bESCs is associated with increased DNA methylation (CpG) (
Figure 9A and S6C).
In conclusion, MLL1 inhibition enhances the pluripotency of bovine embryonic stem cells, which enriched the promoter of pluripotency genes with H3K4me1 to increase the expression of pluripotency genes, and MM-102 altered the global DNA methylation distribution of bESCs.
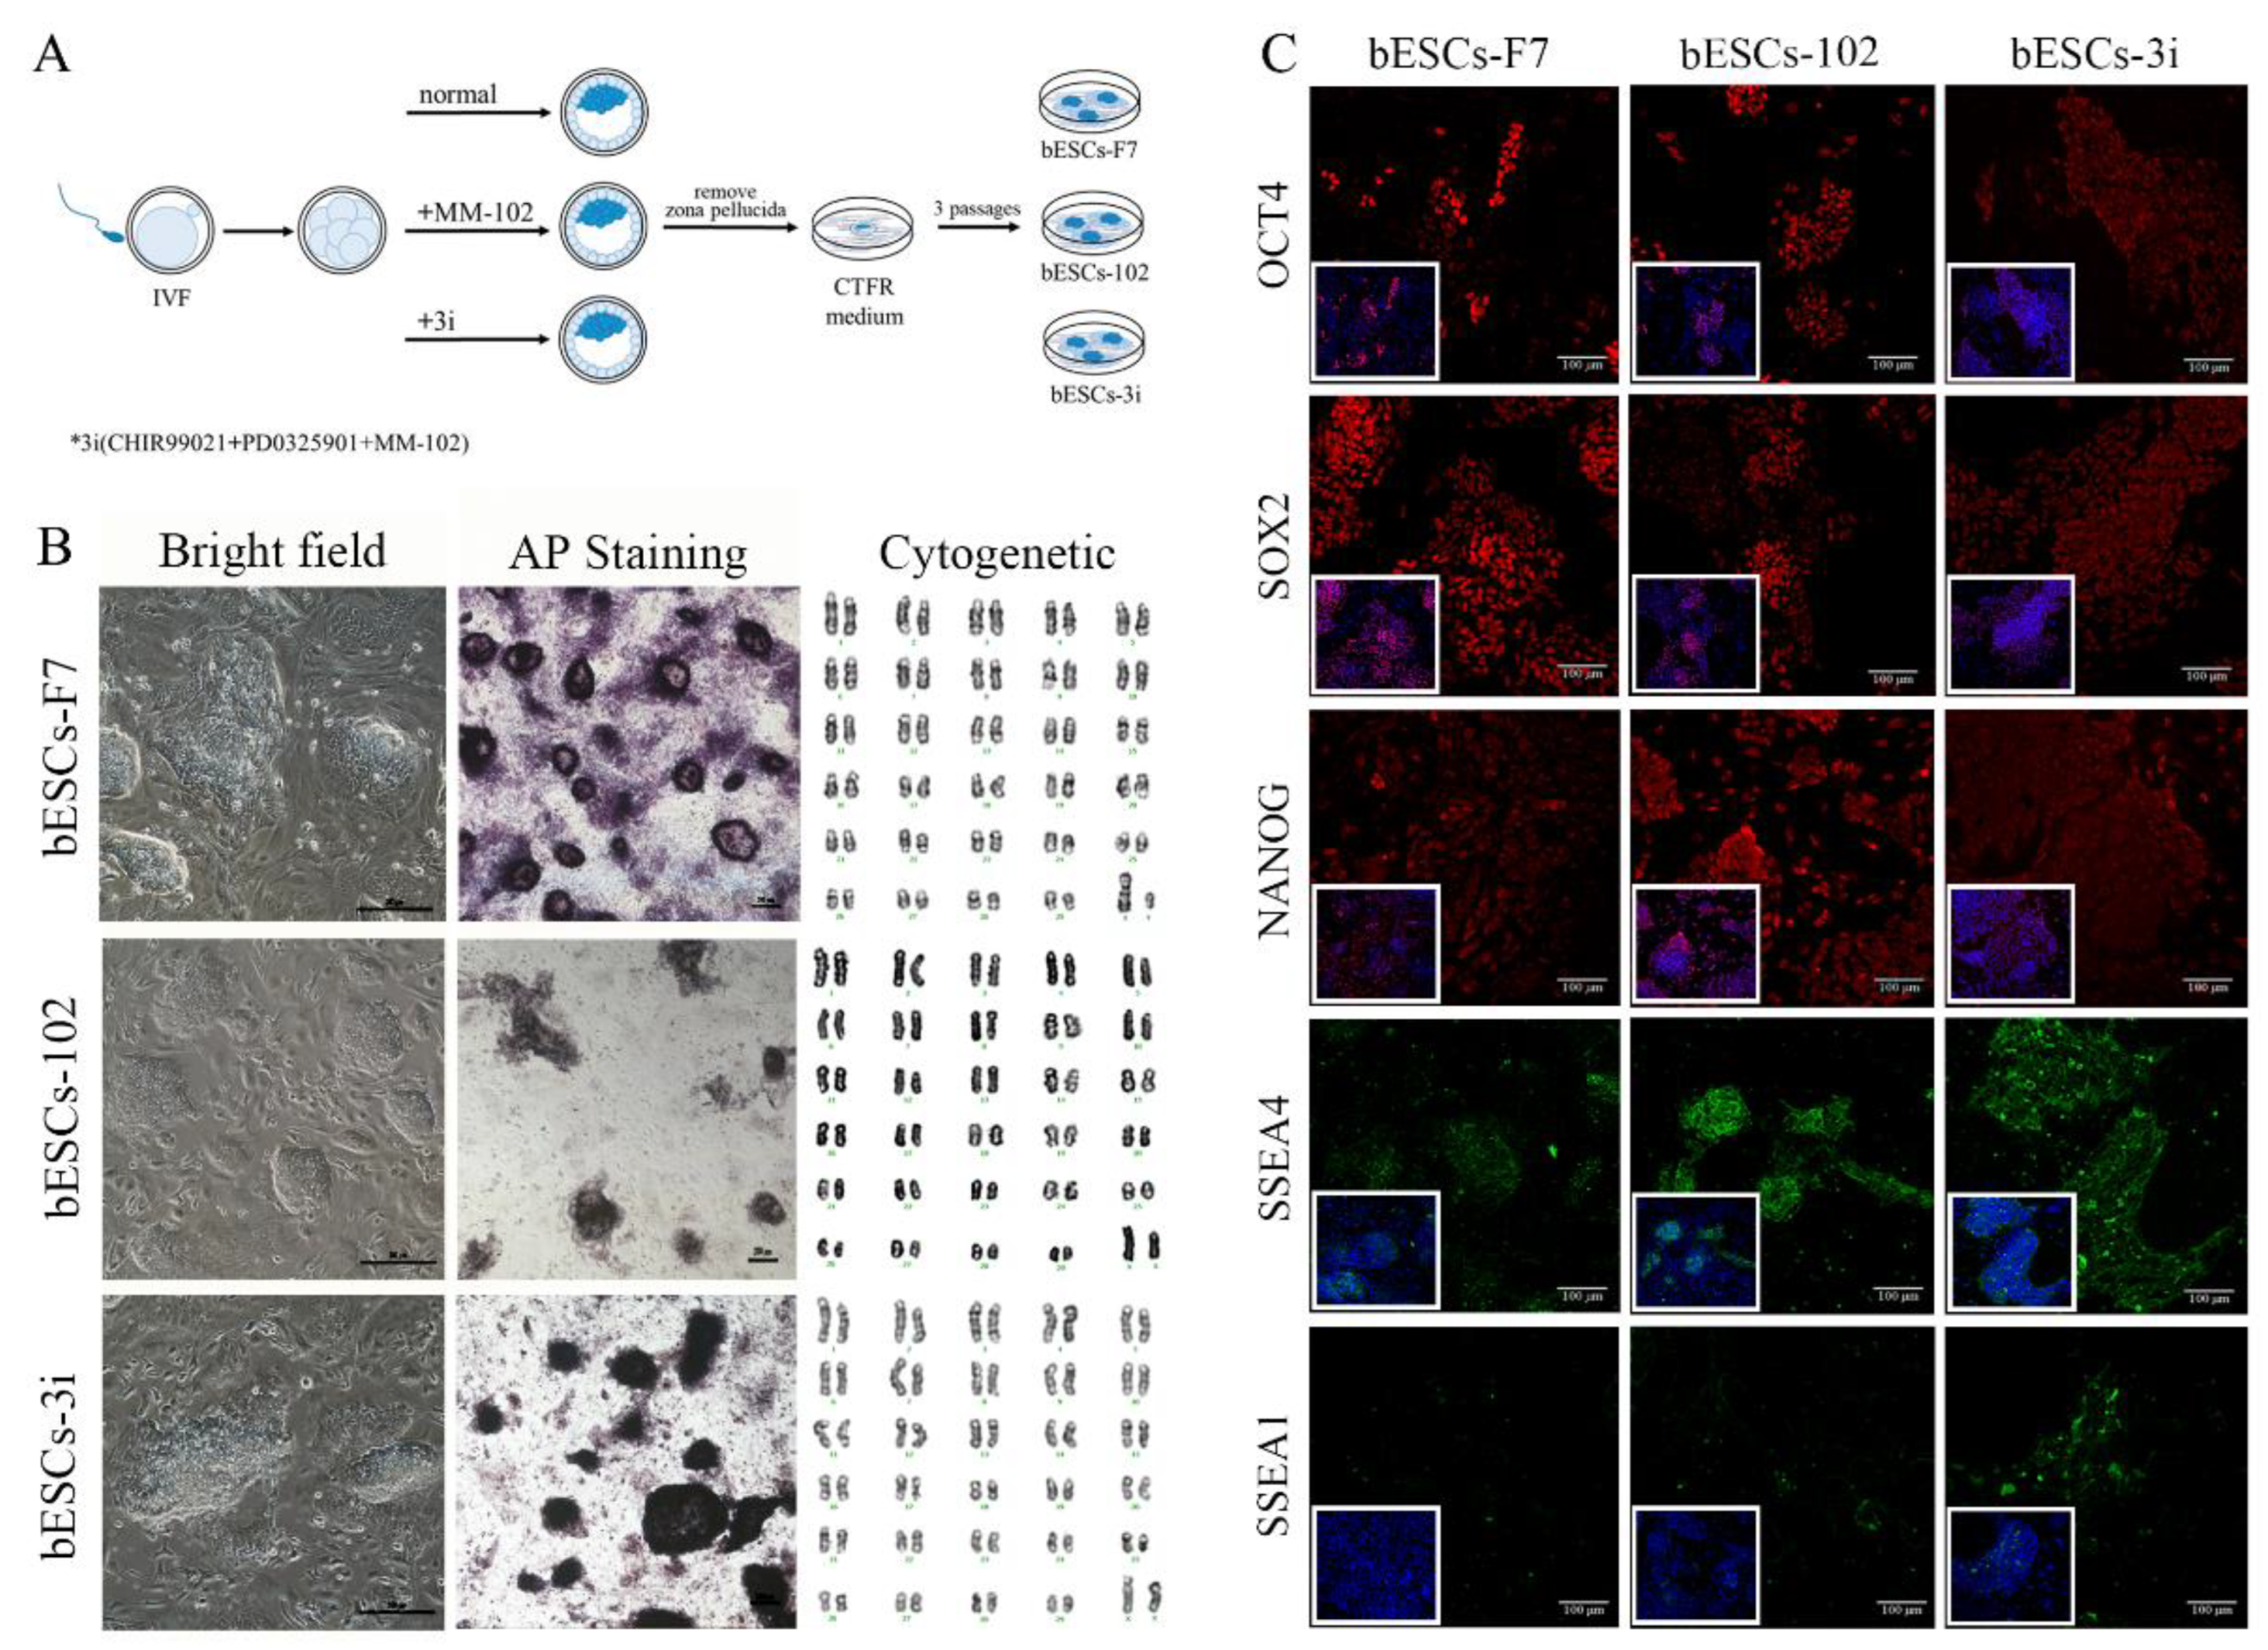
Figure 1.
The generation of bovine blastocysts and establishment of bESCs in CTFR. (A) Schematic diagram of embryos culture with different combinations of MM-102, CHIR99021 and PD0325901, and establishment of bESCs from blastocyst by CTFR culture system. (B) The morphology, alkaline phosphatase staining and karyotyping analysis of bESCs-F7, bESCs-102 and bESCs-3i (Scale bar, 200μm). (C) Immunofluorescence staining of pluripotency marker OCT4, SOX2 and NANOG, primed pluripotency marker SSEA4 and naïve pluripotency marker SSEA1 (Scale bar, 100μm).
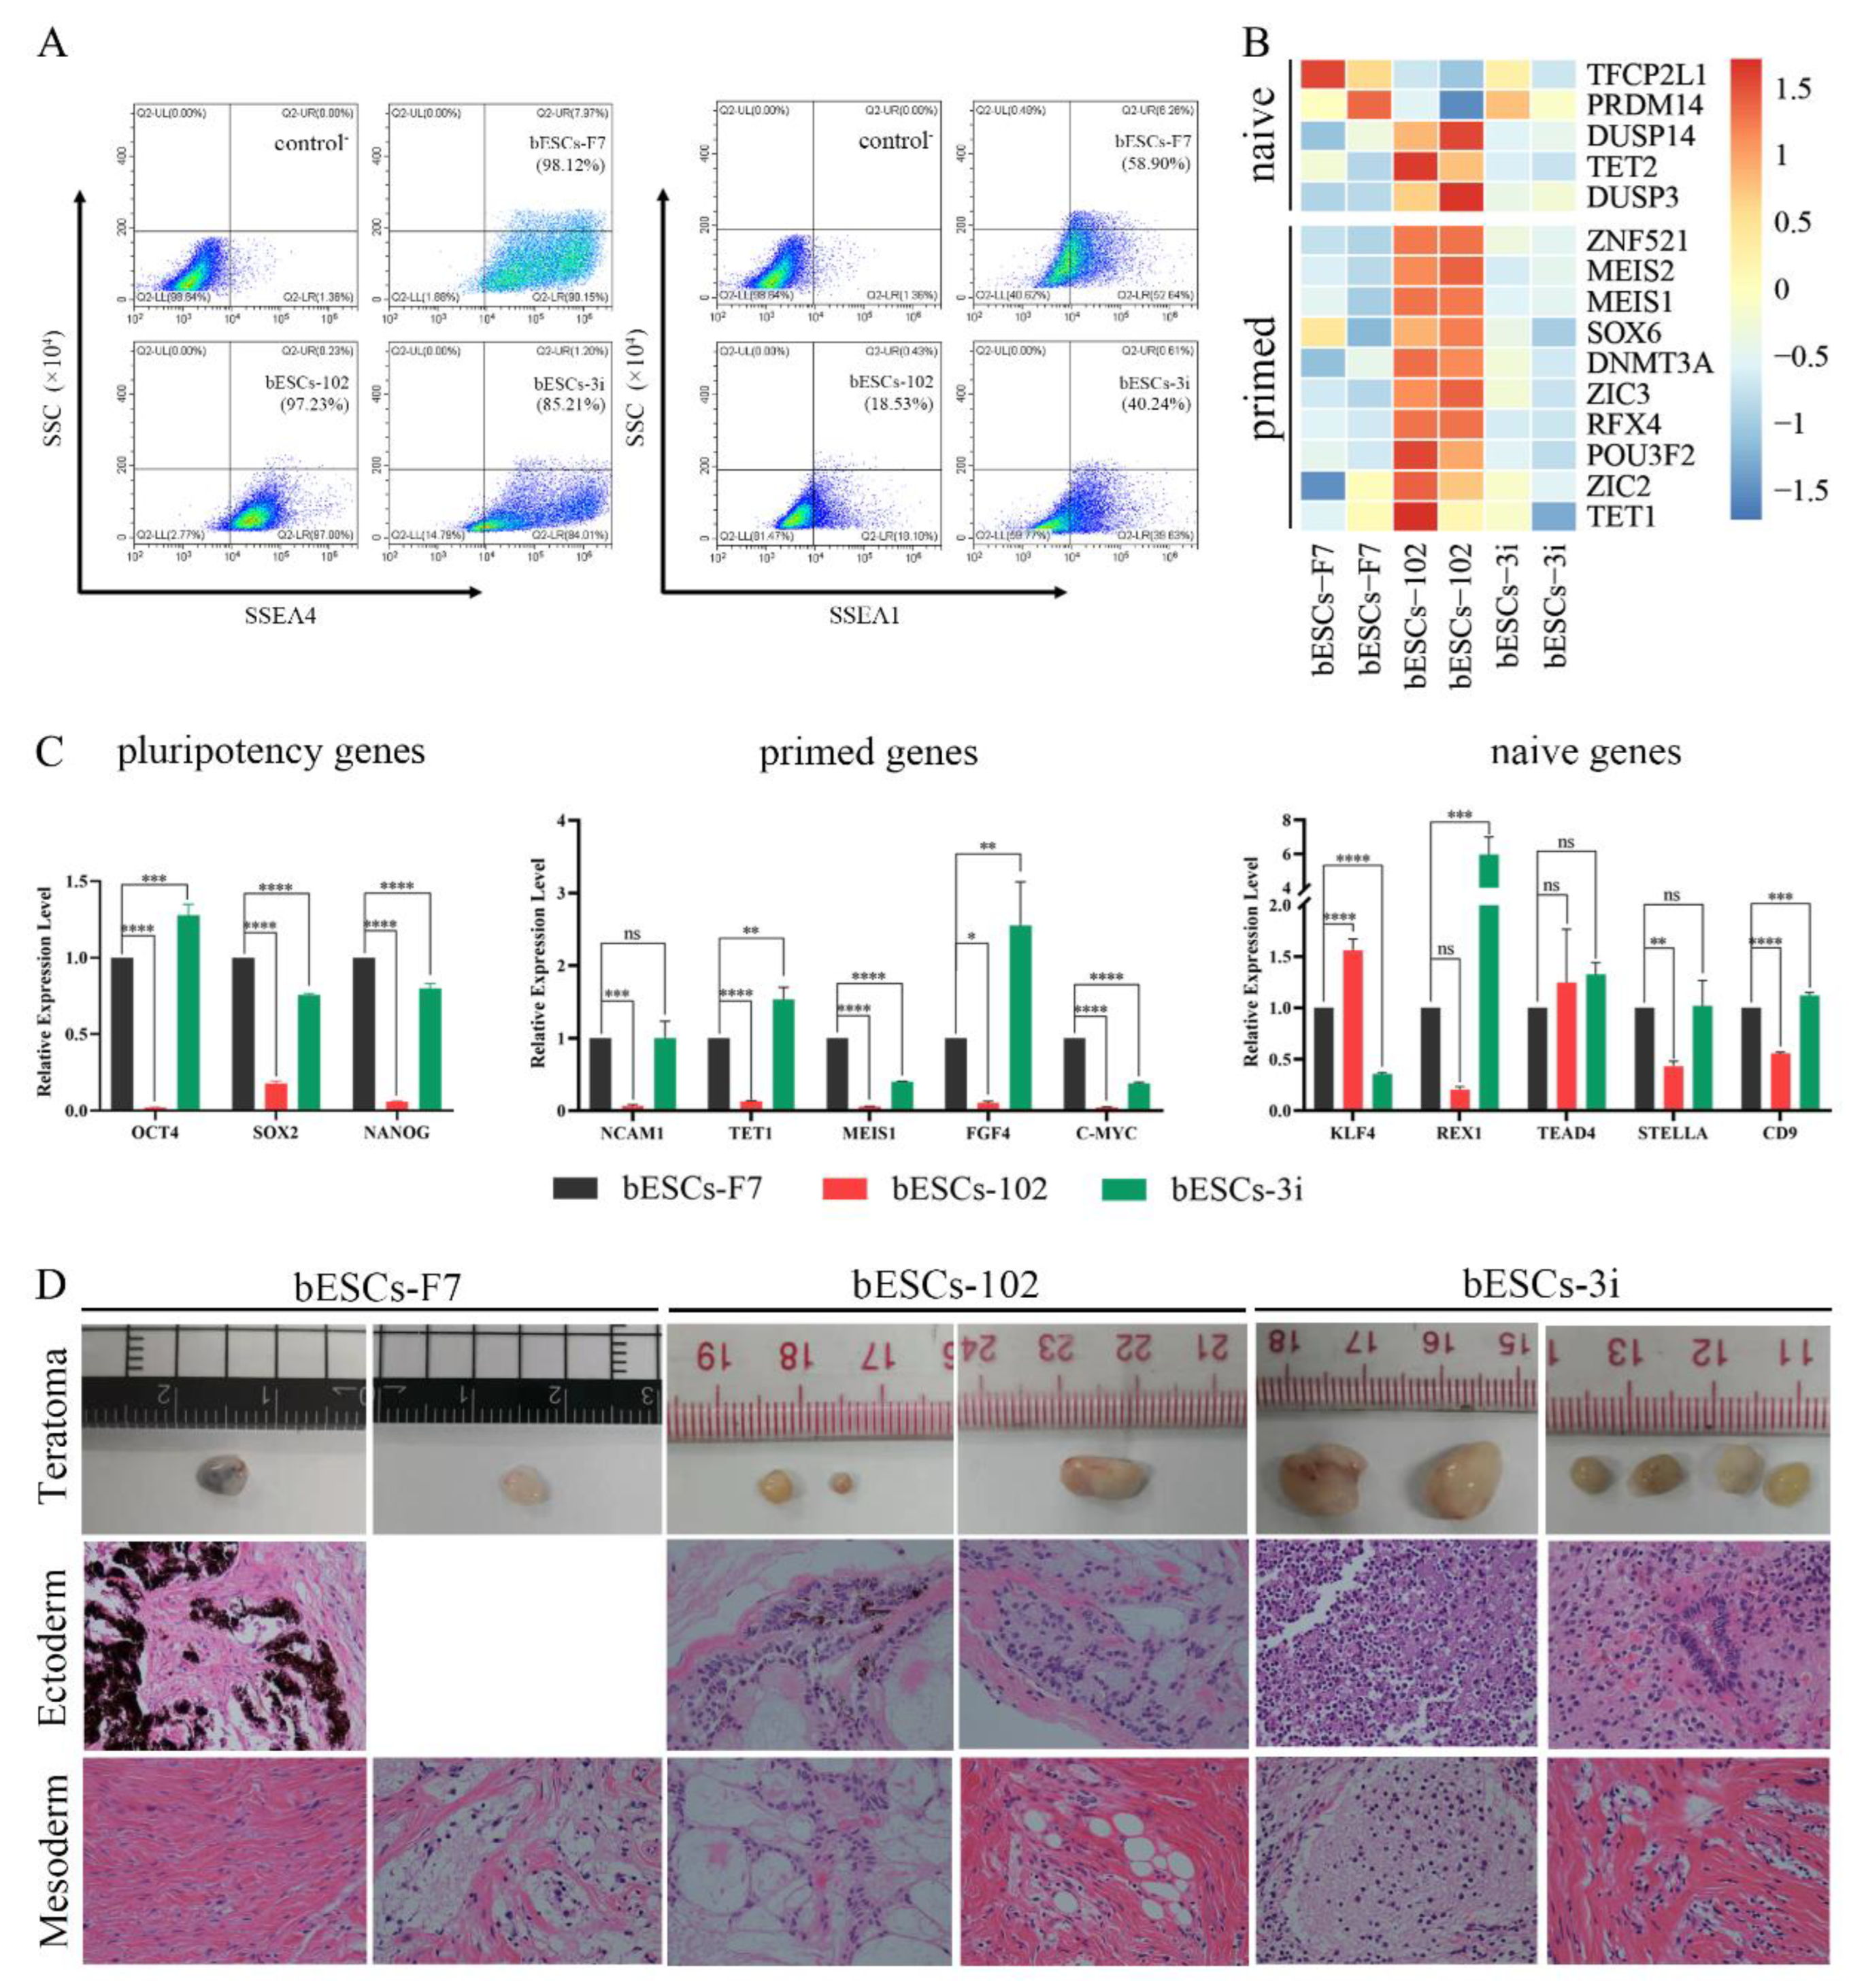
Figure 2.
bESCs-102 and bESCs-3i have higher pluripotency marker expression than bESCs-F7. (A) Flow cytometry results showing expression of SSEA4 and SSEA1 in bESCs-F7, bESCs-102 and bESCs-3i, the negative control consisted of a mixture of three cell lines. (B) Transcriptome analysis of selected naïve and primed pluripotency markers in bESCs-F7, bESCs-102 and bESCs-3i. RNA-seq was performed, and RPKM values were used to define up-regulated expressed genes (RPKM≥1, red) and down-regulated expressed genes (RPKM <1, blue). (C) The relative expression level of pluripotency genes in bESCs-F7, bESCs-102 and bESCs-3i by qRT-PCR. qRT-PCR data, normalized to GAPDH. nsp < 0.1, *p < 0.05, **p < 0.01, ***p < 0.001, ****p < 0.0001. (D) Representative images showing H&E staining of histological sections derived from teratomas generated by bESCs-F7, bESCs-102 and bESCs-3i. Derived teratomas contained tissues of two germ lineages: ectoderm and mesoderm (Magnification 100×).
Figure 3.
The establishment of MLL1 inhibited bESCs. (A) Schematic diagram of the establishment of MLL1 inhibited cell lines bESCs-102-5 and bESCs-102-50. (B) The morphology, alkaline phosphatase staining and karyotyping analysis of bESCs-102-5 and bESCs-102-50 (Scale bar, 200μm). (C) Immunofluorescence staining of pluripotent marker OCT4, SOX2 and NANOG, primed pluripotent marker SSEA4 and naïve pluripotent marker SSEA1 (Scale bar, 100μm).
Figure 4.
MLL1 inhibition improves the pluripotency of bESCs. (A) Flow cytometry results showing expression of SSEA4 and SSEA1 in bESCs-F7, bESCs-102-5 and bESCs-102-50. The negative control consisted of a mixture of three cell lines. (B) Transcriptome analysis of selected naive and primed pluripotent markers in different bESCs. RNA-seq was performed, and RPKM values were used to define up-regulated expressed genes (RPKM≥1; red) and down-regulated expressed genes (RPKM <1; blue). (C) The relative expression level of pluripotent genes in bESCs-F7, bESCs-102-5 and bESCs-102-50 by qRT-PCR. qRT-PCR data normalized to GAPDH. nsp < 0.1, *p < 0.05, **p < 0.01, ***p < 0.001, ****p < 0.0001. (D) H&E staining of histological sections derived from teratomas generated by bESCs-102-5 and bESCs-102-50. Derived teratomas contained tissues of all three germ layer lineages: ectoderm, mesoderm and endoderm (Magnification 100×).
Figure 5.
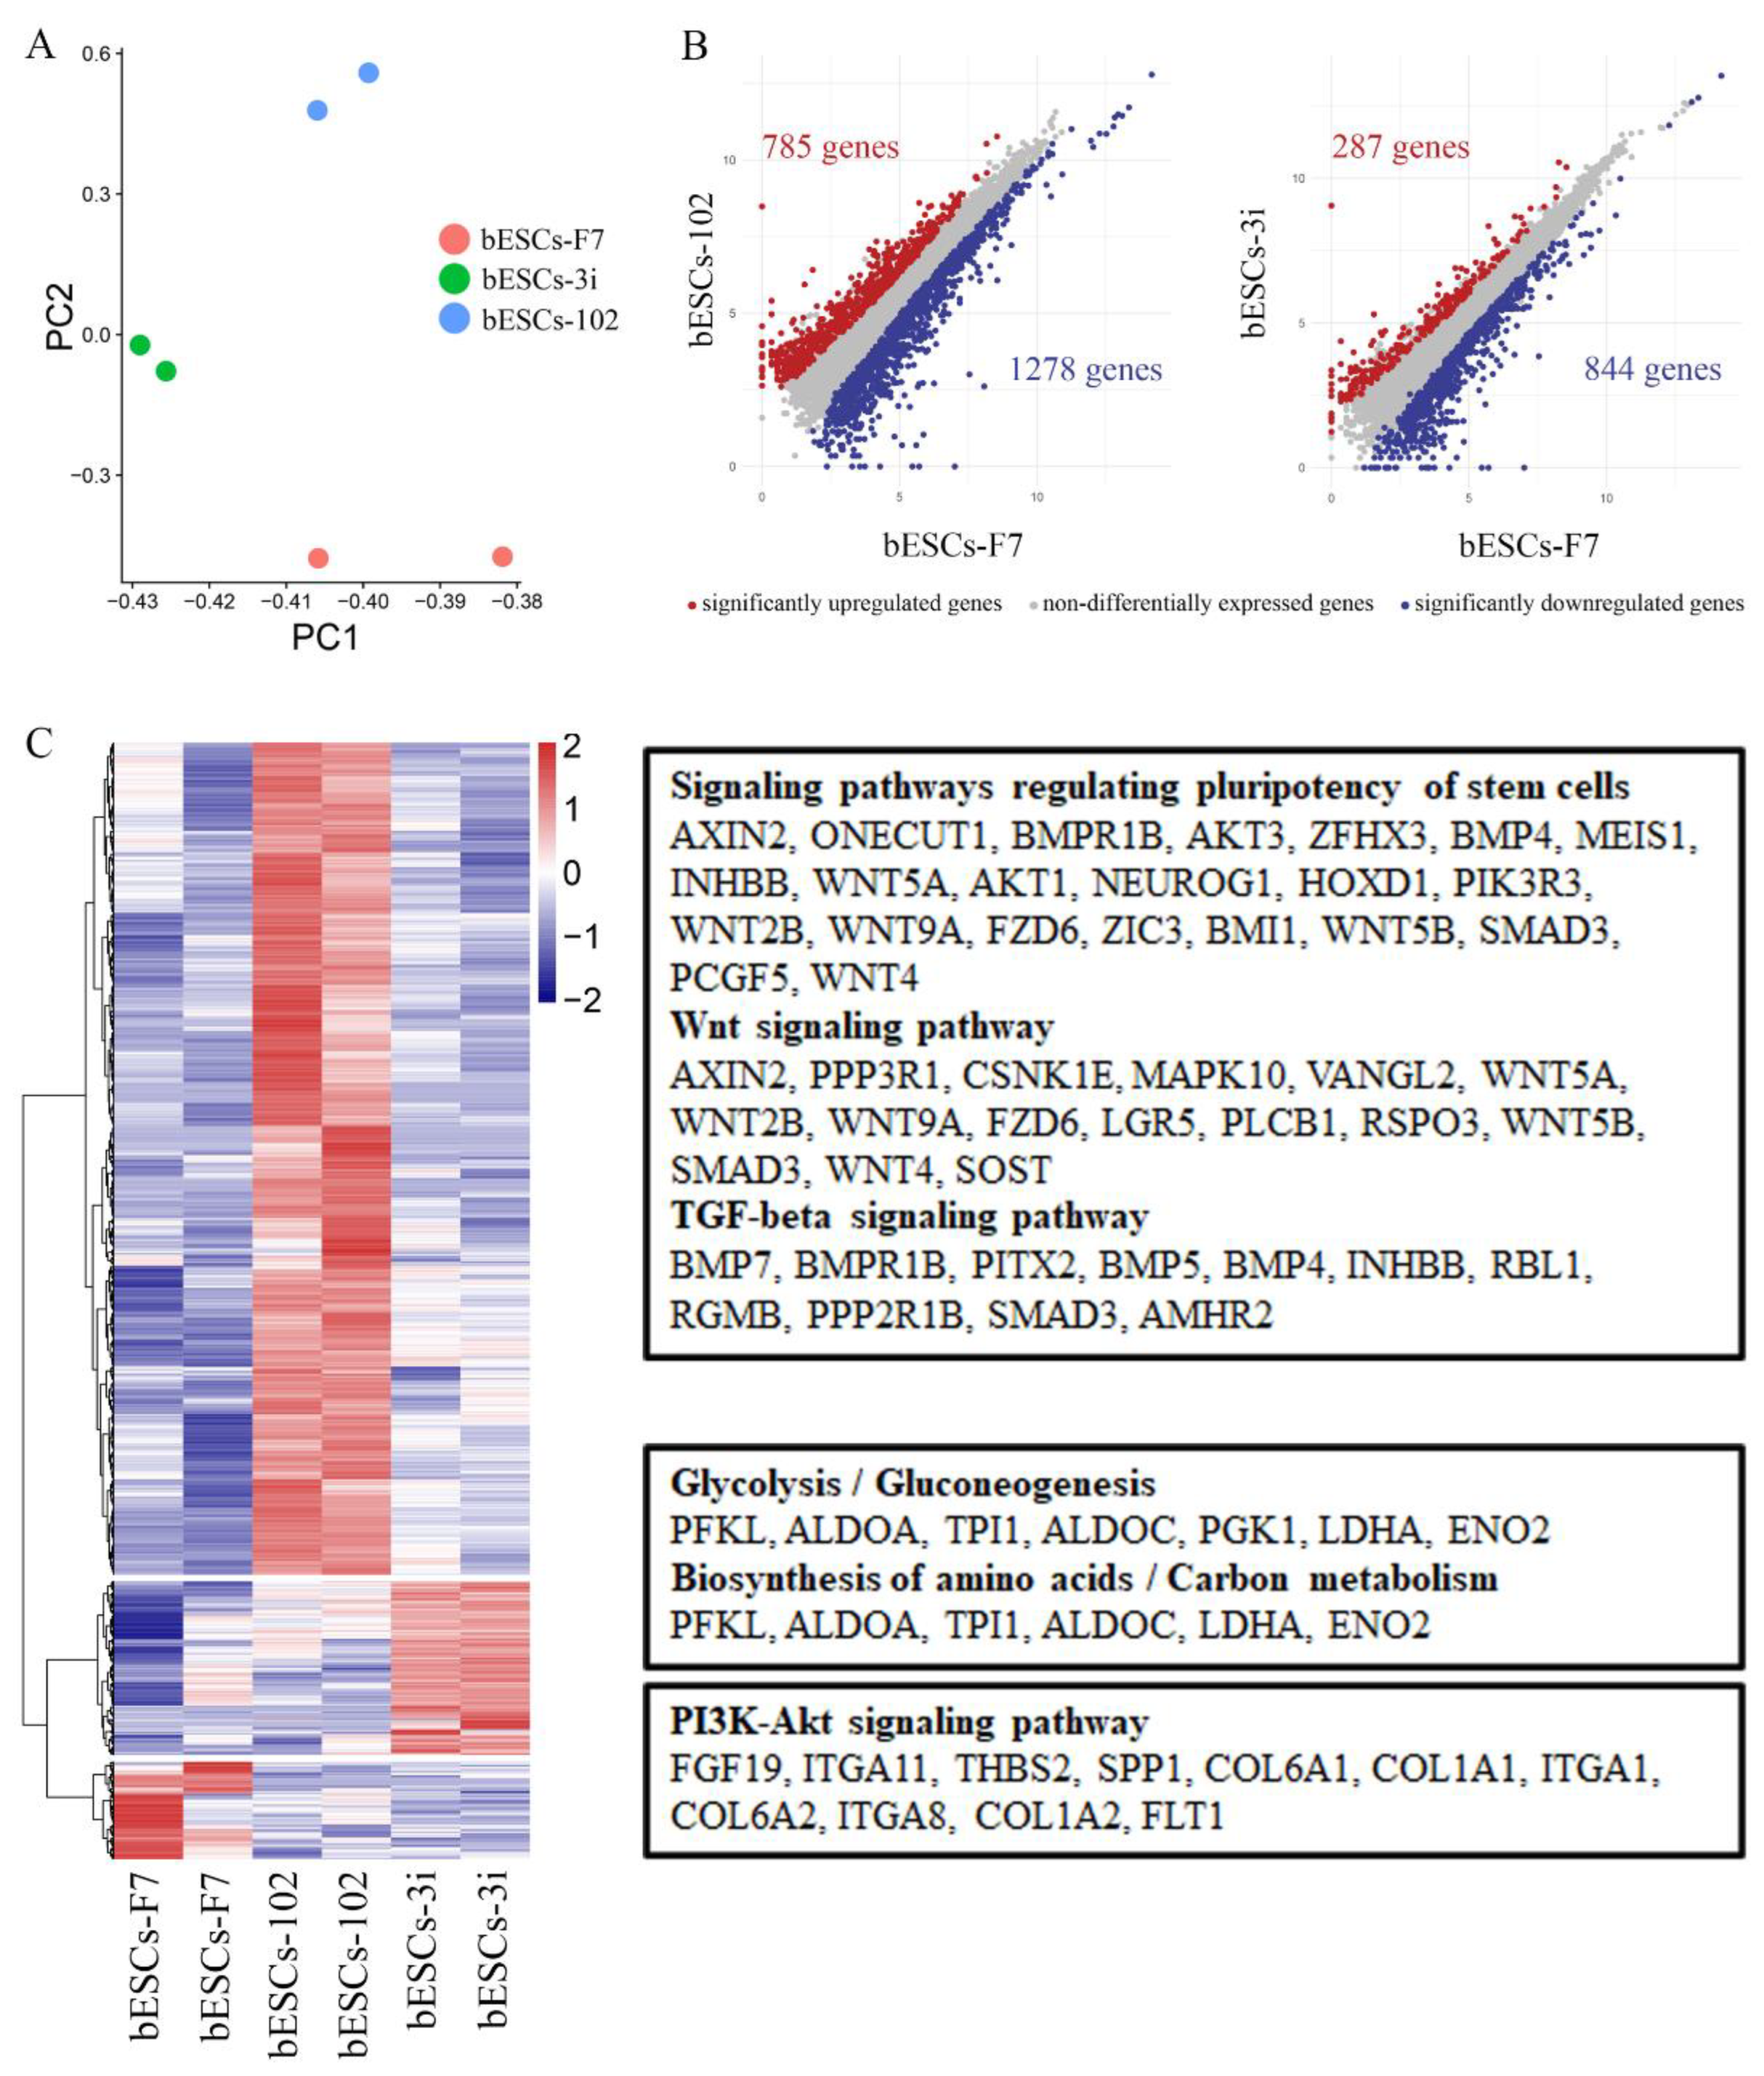
Comparison of the pluripotency of bESCs-102 and bESCs-F7, and bESCs-3i and bESCs-F7. (A) PCA based on RNA-seq data of bESCs-F7, bESCs-102 and bESCs-3i. (B) Scatterplots showing significantly up-regulated (in red) and down-regulated (in blue) genes between bESC-F7 and bESC-102, and bESC-F7 and bESC-3i. Genes not differentially expressed are presented in gray. (C) Heat maps and KEGG analysis of highly expressed genes in bESCs-F7, bESCs-102 and bESCs-3i, respectively. RNA-seq was performed, and RPKM values were used to define up-regulated expressed genes (RPKM≥1, red) and down-regulated expressed genes (RPKM <1, blue).
Figure 6.
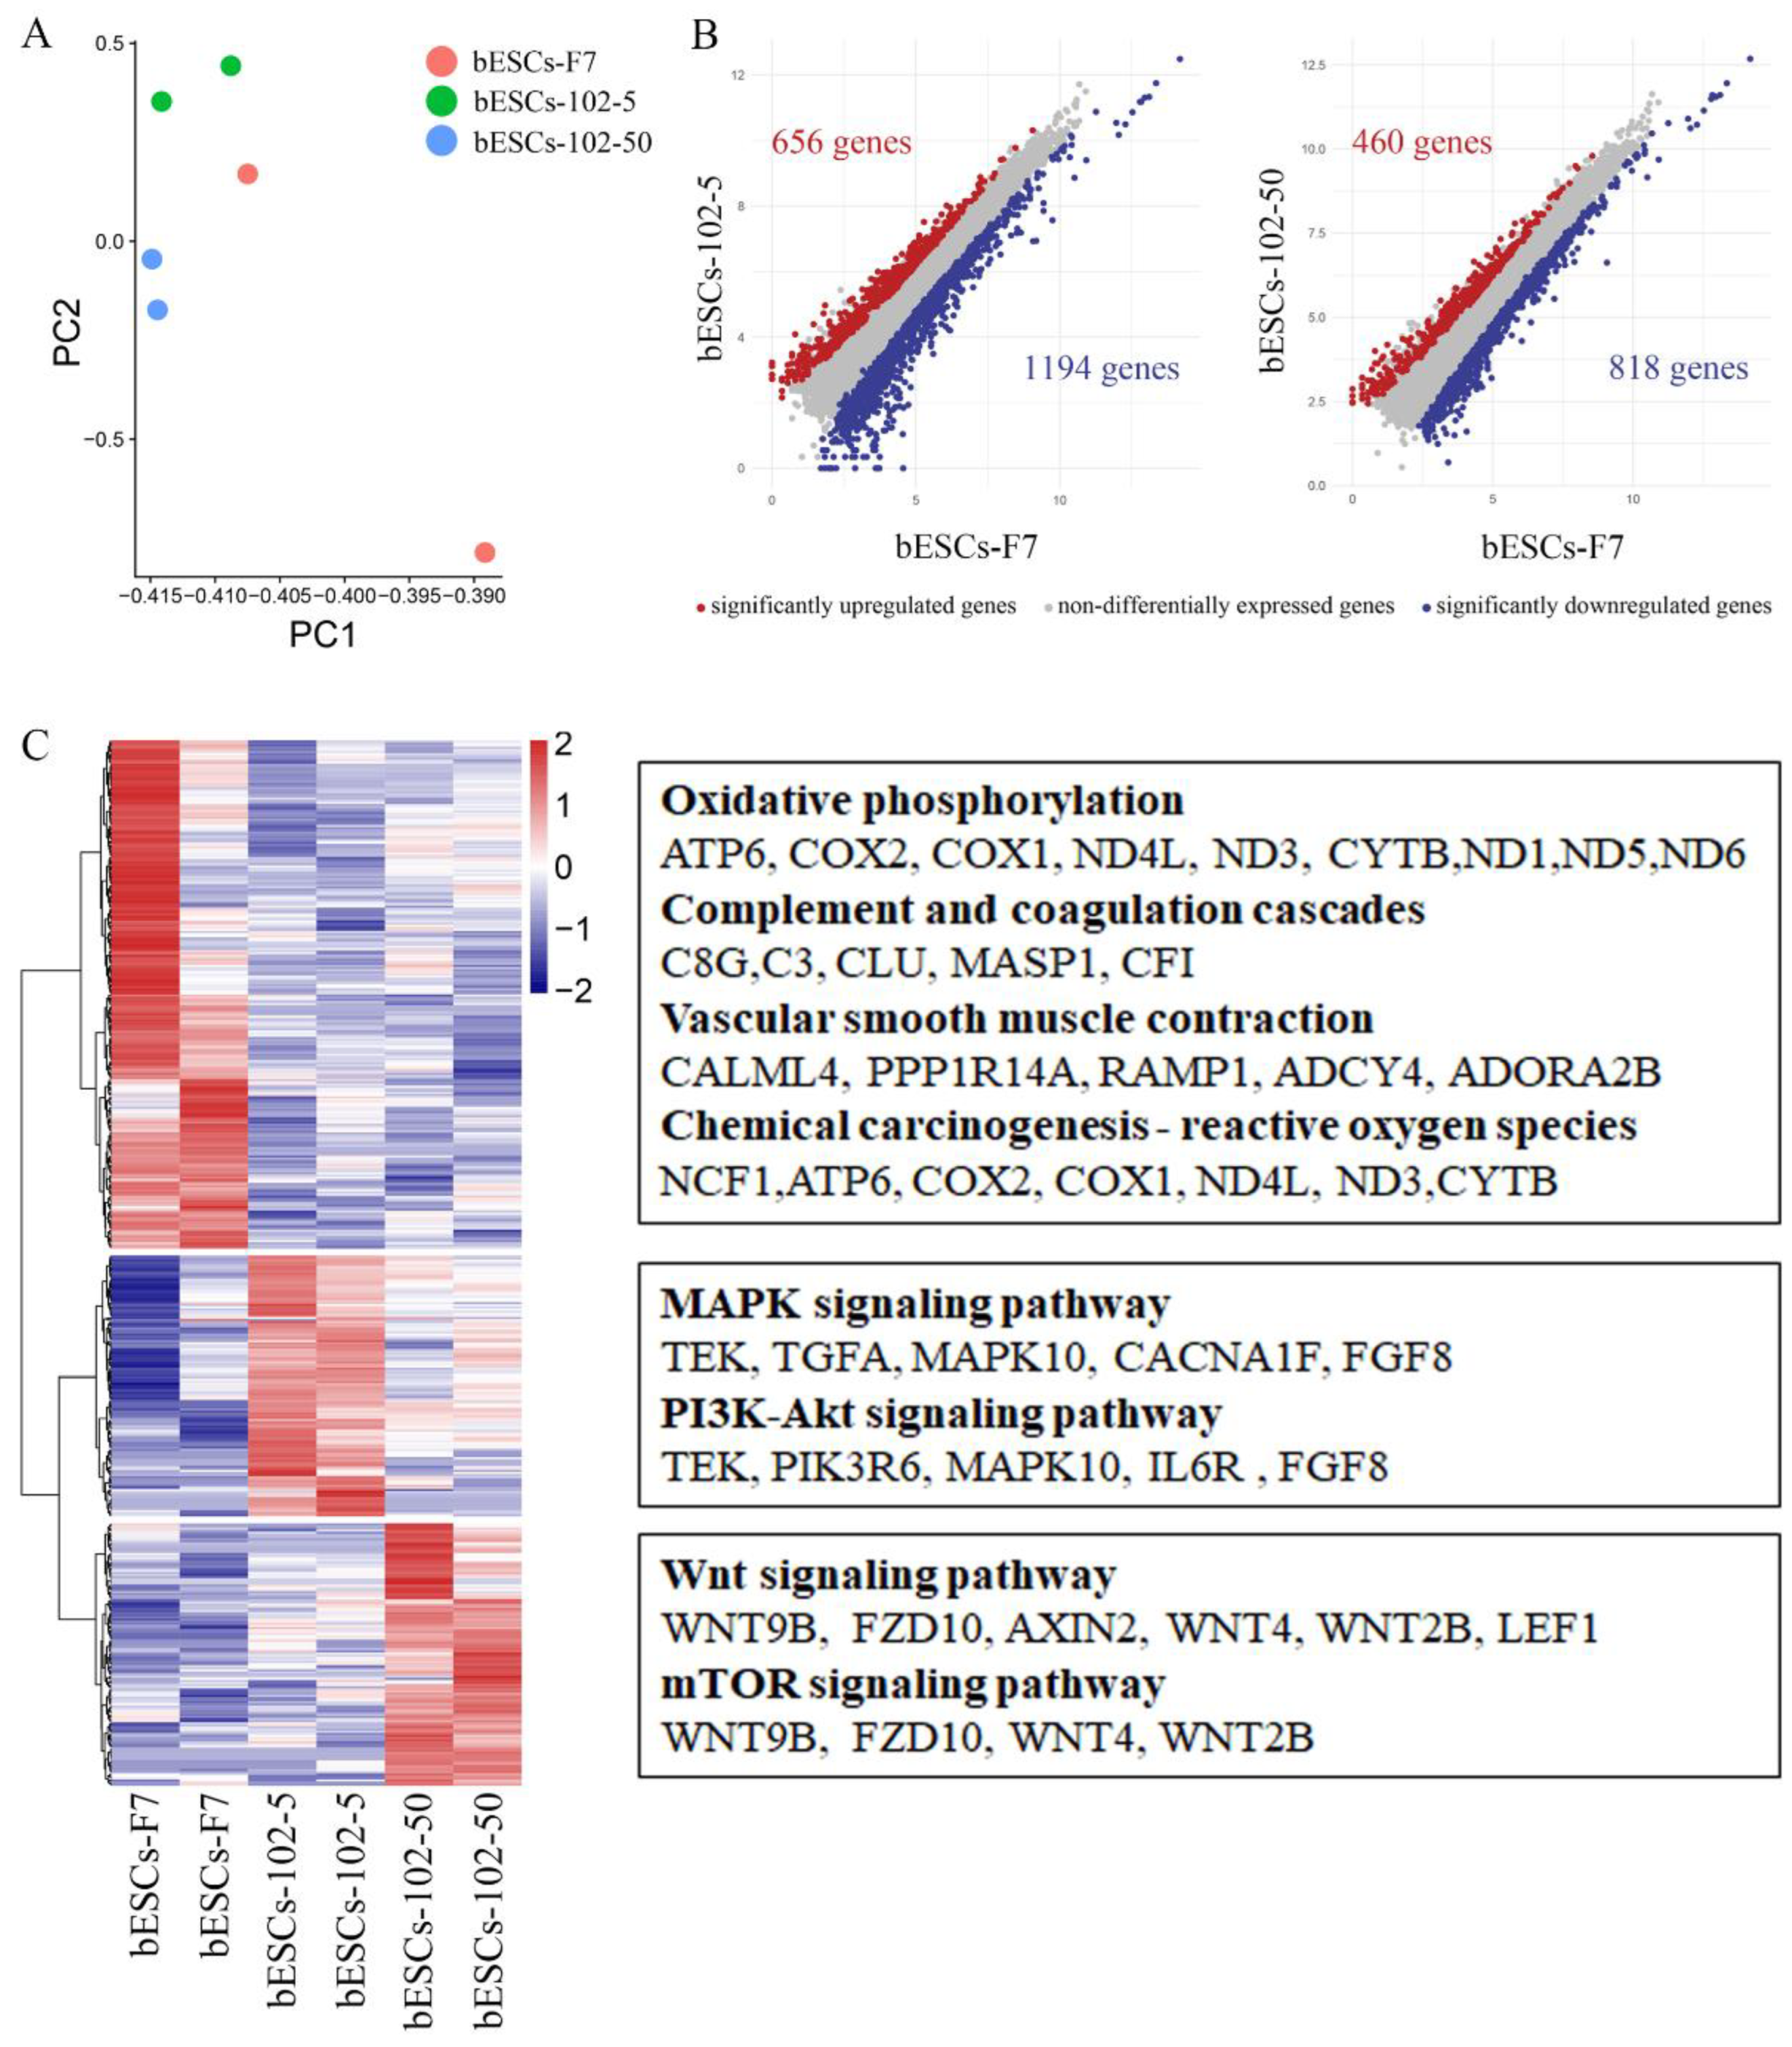
MLL1 inhibition enhanced stem cell pluripotent related pathways in bESCs-102-5 and bESCs-102-50. (A) PCA based on RNA-seq data in bESCs-F7, bESCs-102-5 and bESCs-102-50. (B) The scatterplots show significantly up-regulated (in red) and down-regulated (in blue) genes between bESC-F7 and bESC-102-5, and bESC-F7 and bESC-102-50. Genes not differentially expressed are presented in gray. (C) Heat maps and KEGG analysis of highly expressed genes in bESCs-F7, bESCs-102-5 and bESCs-102-50, respectively. RNA-seq was performed, and RPKM values were used to define up-regulated expressed genes (RPKM≥0.5, red) and down-regulated expressed genes (RPKM <0.5, blue).
Figure 7.
The histone modification of bESCs-F7 was changed by MLL1 inhibition. (A) The relative expression level of MLL1 in bESCs-F7, bESCs-102-5, bESCs-102-50 (left), bESCs-102 and bESCs-3i (right) by qRT-PCR. qRT-qPCR data, normalized to GAPDH. nsp < 0.1, *p < 0.05, **p < 0.01, ***p < 0.001, ****p < 0.0001. (B) The relative expression level of PRDM14 in bESCs-F7, bESCs-102-5, bESCs-102-50, bESCs-102 and bESCs-3i by qRT-qPCR. qRT-qPCR data, normalized to GAPDH. nsp < 0.1, *p < 0.05, **p < 0.01, ***p < 0.001, ****p < 0.0001. (C) Western blotting showing protein level of PRDM14, P300 and G9A in bESCs-F7, bESCs-102-5, bESCs-102-50 (left), bESCs-102 and bESCs-3i (right). (D) Western blotting showing protein level of H3K3me1, H3K4me2 and H3K27me3 in bESCs-F7, bESCs-102-5, bESCs-102-50 (left), bESCs-102 and bESCs-3i (right). (E) PCA based on ChIP-seq data of H3K4me1 in BFF, bESCs-F7, bESCs-102-5 and bESCs-102-50. (F) Heatmap of ChIP-seq of global genes of BFF, bESCs-F7, bESCs-102-5 and bESCs-102-50. RPKM values were used to define up-regulated expressed genes (RPKM≥1, red) and down-regulated expressed genes (RPKM <1, blue).
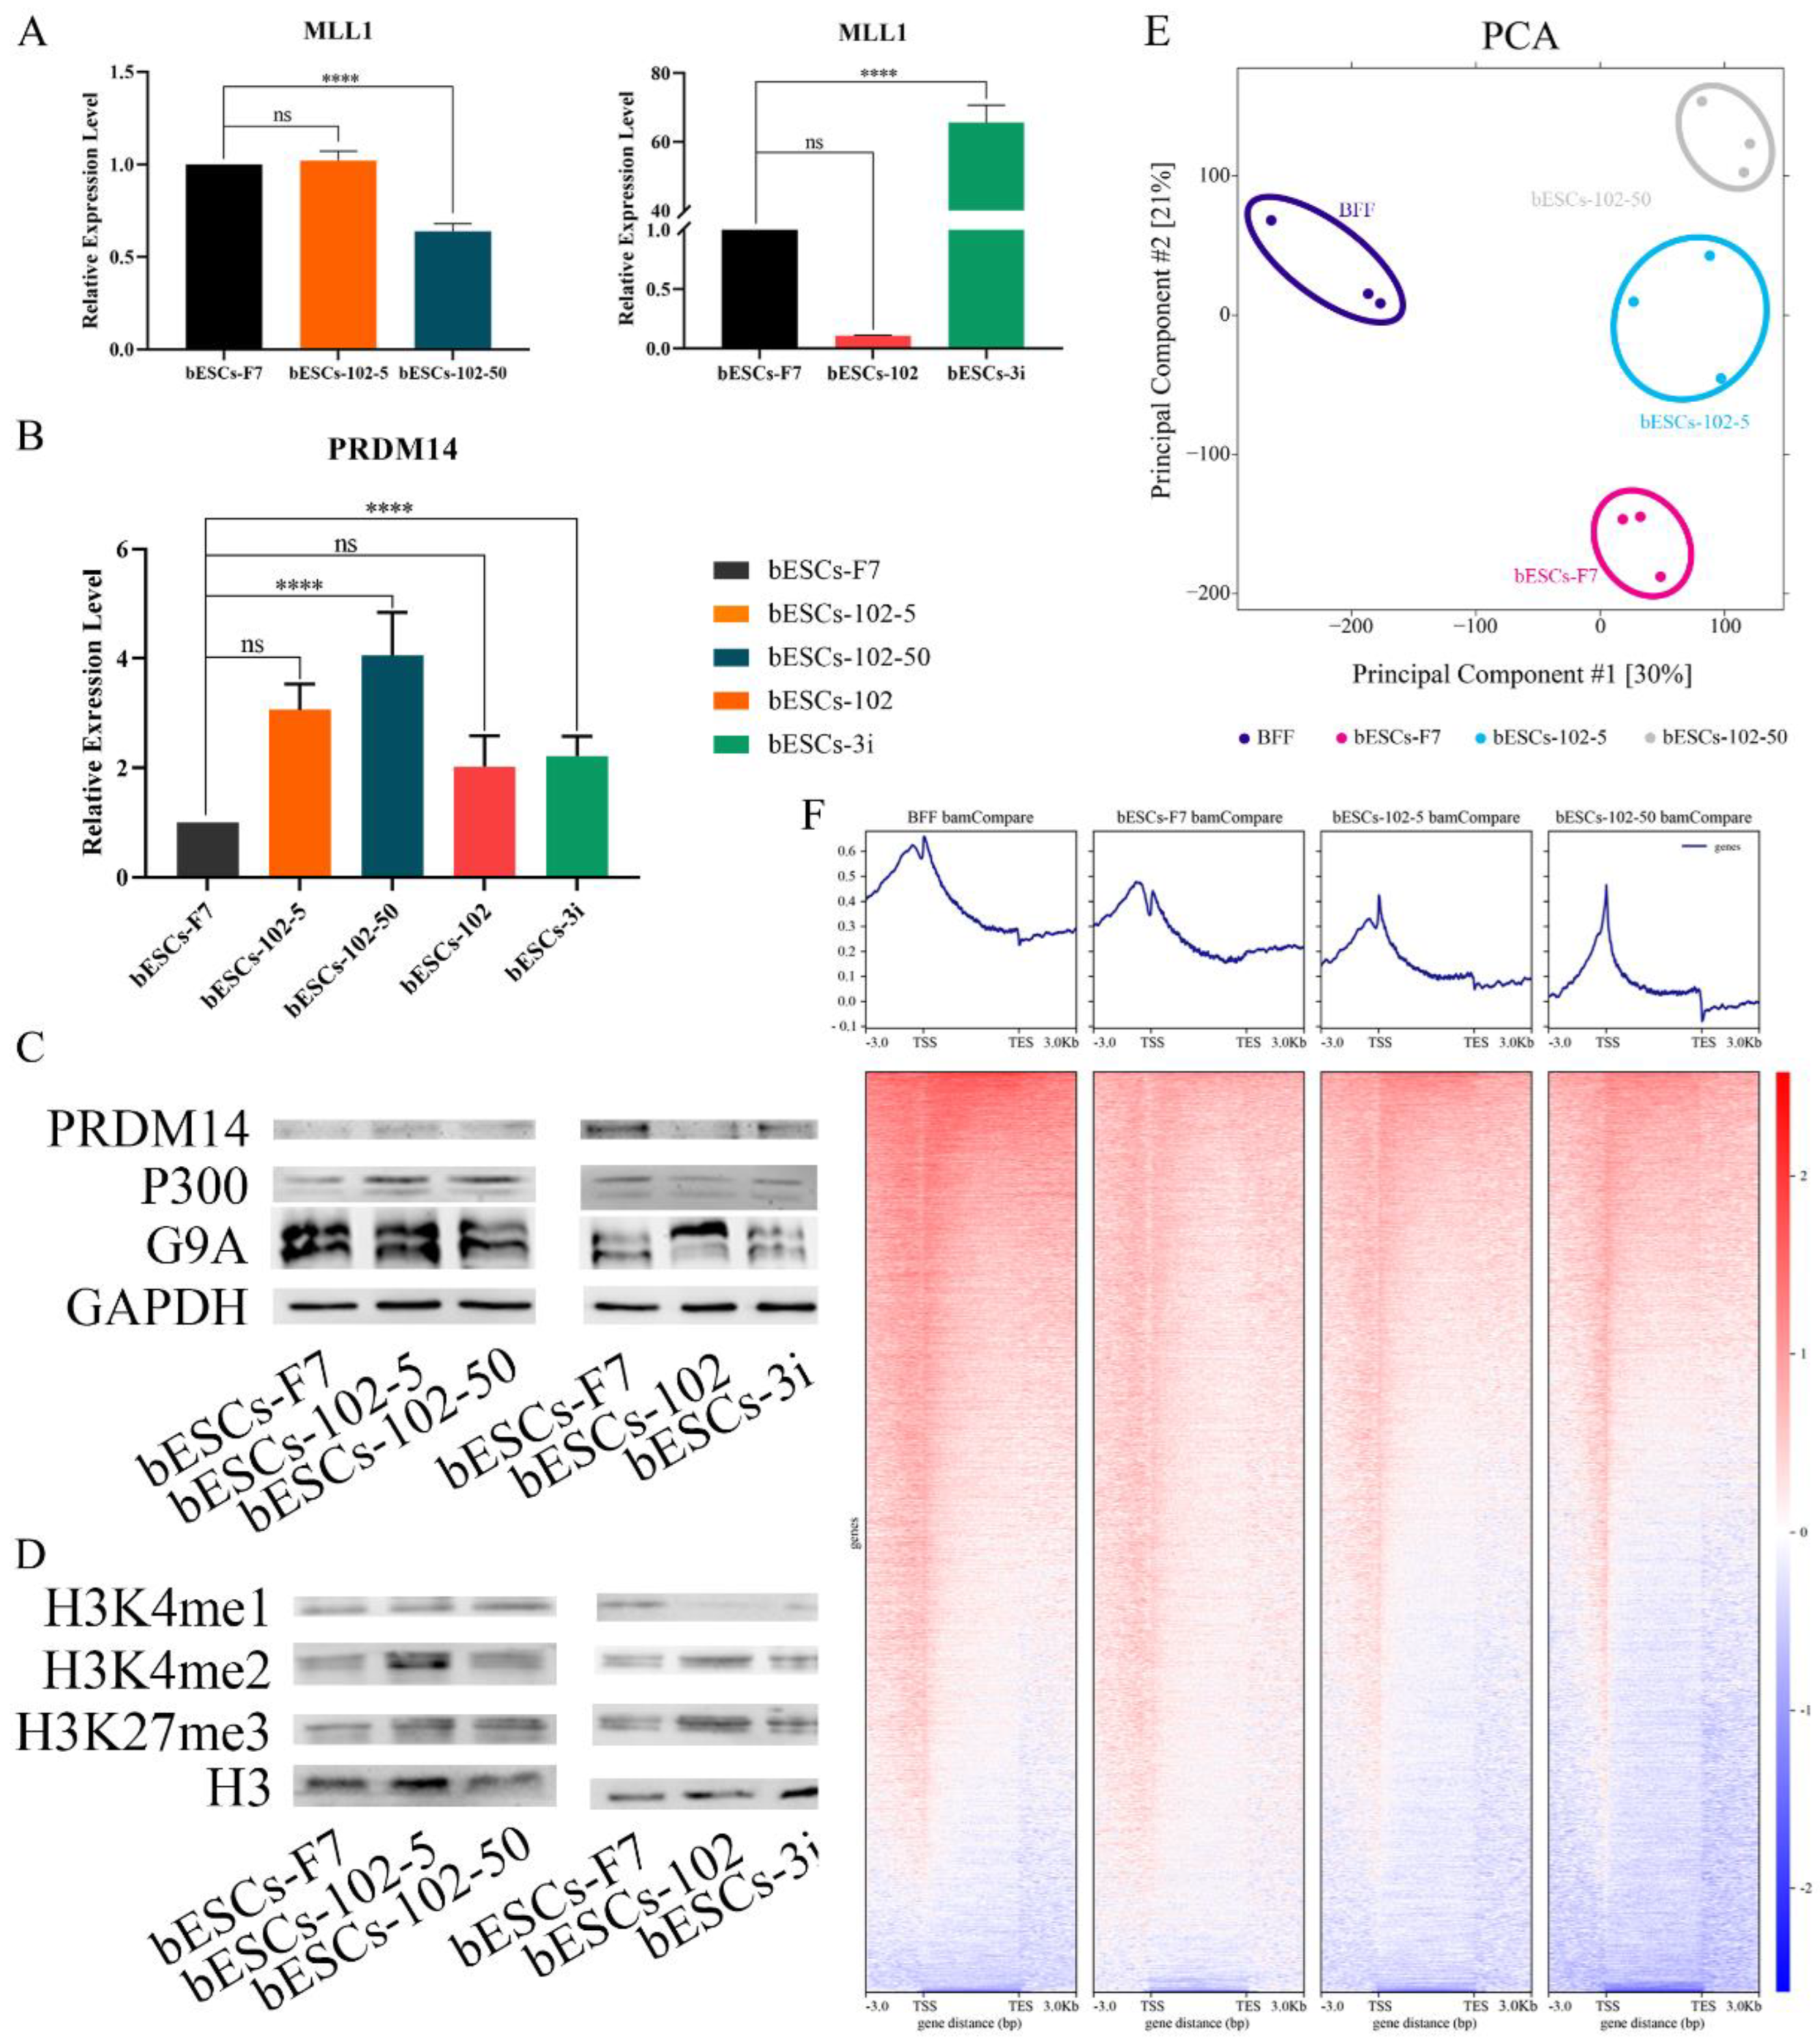
Figure 8.
MLL1 inhibition changed the distribution of H3K4me1 at the promoter region. (A) Ratios of H3K4me1 at gene regulatory regions based on H3K4me1 ChIP-seq of bESCs-F7, bESCs-102-5, bESCs-102-50 and BFF. (B) Comparison of H3K4me1 modification levels on the promoters of bESCs-F7, bESCs-102-5 and bESCs-102-50. (C) Volcano plot displaying the H3K4me1 modification on the promoters of bESCs-F7, bESCs-102-5, and bESCs-102-50. Red and blue dots indicate up-regulated and down-regulated genes. (D) Peak map of H3K4me1 enrichment in the promoter region of DUSP5 and OCT4 of bESCs-F7, bESCs-102-5, and bESCs-102-50 (pink regions). (E) Integrative Genomics Viewer (IGV) Genome Browser views showing H3K4me1 tracks of pluripotent genes in bESCs-F7, bESCs-102-5 and bESCs-102-50.
Figure 9.
MLL1 inhibition altered DNA methylation in bESCs. (A) The relative expression level of DNMT family in bESCs-F7, bESCs-102-5, bESCs-102-50, bESCs-102 and bESCs-3i by qRT-PCR. qRT-qPCR data, normalized to GAPDH. nsp < 0.1, *p < 0.05, **p < 0.01, ***p < 0.001, ****p < 0.0001. (B) Western blotting showing decreased expression of DNMT3A and DNMT3B in bESCs-F7, bESCs-102-5, bESCs-102-50, bESCs-102 and bESCs-3i. (C) Correlation plot of methylated sites in bESCs-F7 versus either bESCs-102-5, bESCs-102-50, bESCs-102 or bESCs-3i. The Red line represents fit based on linear regression modeling (off-center best fit indicates lower correlation); the blue line is based on LOESS weighted regression modeling (curved best-fit line indicates non-linear correlation). (D) Pearson correlation of bESCs-F7, bESCs-102-5, bESCs-102-50, bESCs-102 and bESCs-3i. (E) Comparison of DNA methylation of bESCs-F7, bESCs-102-5, bESCs-102-50, bESCs-102 and bESCs-3i showed the differences in the overall distribution of CG methylation levels on gene functional elements. (F) Bisulfite genomic sequencing of the promoter regions of OCT4 and NANOG in bESCs-F7, bESCs-102-5, bESCs-102-50, bESCs-102 and bESCs-3i.
