Submitted:
21 June 2023
Posted:
21 June 2023
You are already at the latest version
Abstract
Keywords:
1. Introduction
2. Materials and Methods
2.1. Experiment
2.1.1. Experimental set up
2.1.2. Experimental materials
2.1.3. Experimental process
2.1.3.1. Confirmation of identical natural infiltration in two rooms
2.1.3.2. Optimization of the impacts of the adjustable factors of office spaces on CO2 removal efficiency
- Plants absorb CO2 via photosynthesis, which is influenced by both internal and external factors. Internal factors refer to the carbon fixation pathways of plants (C3, C4, and CAM), while external factors include light, the environmental CO2 concentration, the temperature, mineral elements, and water [54]. In office spaces, the temperature is usually set to ensure thermal comfort, while humidity is often difficult to regulate. Therefore, in the experiment, the temperature was controlled at 25 °C but the humidity was not regulated.
- Due to the unsuitability of C4 plants for indoor environments, C3 and CAM plant species were selected as the experimental subjects. This selection was based on their distinct carbon fixation efficiency and adaptability to different environmental conditions.
- Supplemental lighting was installed to ensure the function of the living walls due to the variability of the natural light intensity influenced by factors such as the weather, season, and orientation. Thus, it was necessary to examine the effect of light intensity on the living walls and adjust the supplementary illumination.
- The substrate moisture content is closely related to the irrigation system and maintenance of the living walls, and insufficient and excessive watering are common issues in the management of the living walls [44]. The investigation of the effects of different substrate moisture levels on the CO2 removal efficiency of the living walls can help to optimize the maintenance procedures and reduce associated costs.
2.1.3.3. Optimization of the impact of the significant factor of office spaces on the CO2 removal efficiency
2.2. Simulation
2.2.1. Simulation conditions
2.2.2. Modeling description
2.2.3. Indoor CO2 concentration
2.2.4. Mechanical ventilation types
2.2.5. Climate and locations
3. Results
3.1. Experimental research
3.1.1. Confirmation of identical natural infiltration in two rooms
3.1.2. Optimization of the impacts of the adjustable factors of office spaces on CO2 removal efficiency
3.1.3. Optimization of the impact of the significant factor of office spaces on the CO2 removal efficiency
3.2. Simulation
3.2.1. CO2 concentration and fresh air volume
3.2.2. Fresh air energy consumption
4. Discussion
4.1. Comparison to other methods of indoor CO2 removal
4.2. Optimization of the CO2 removal efficiency in office spaces
5. Conclusions
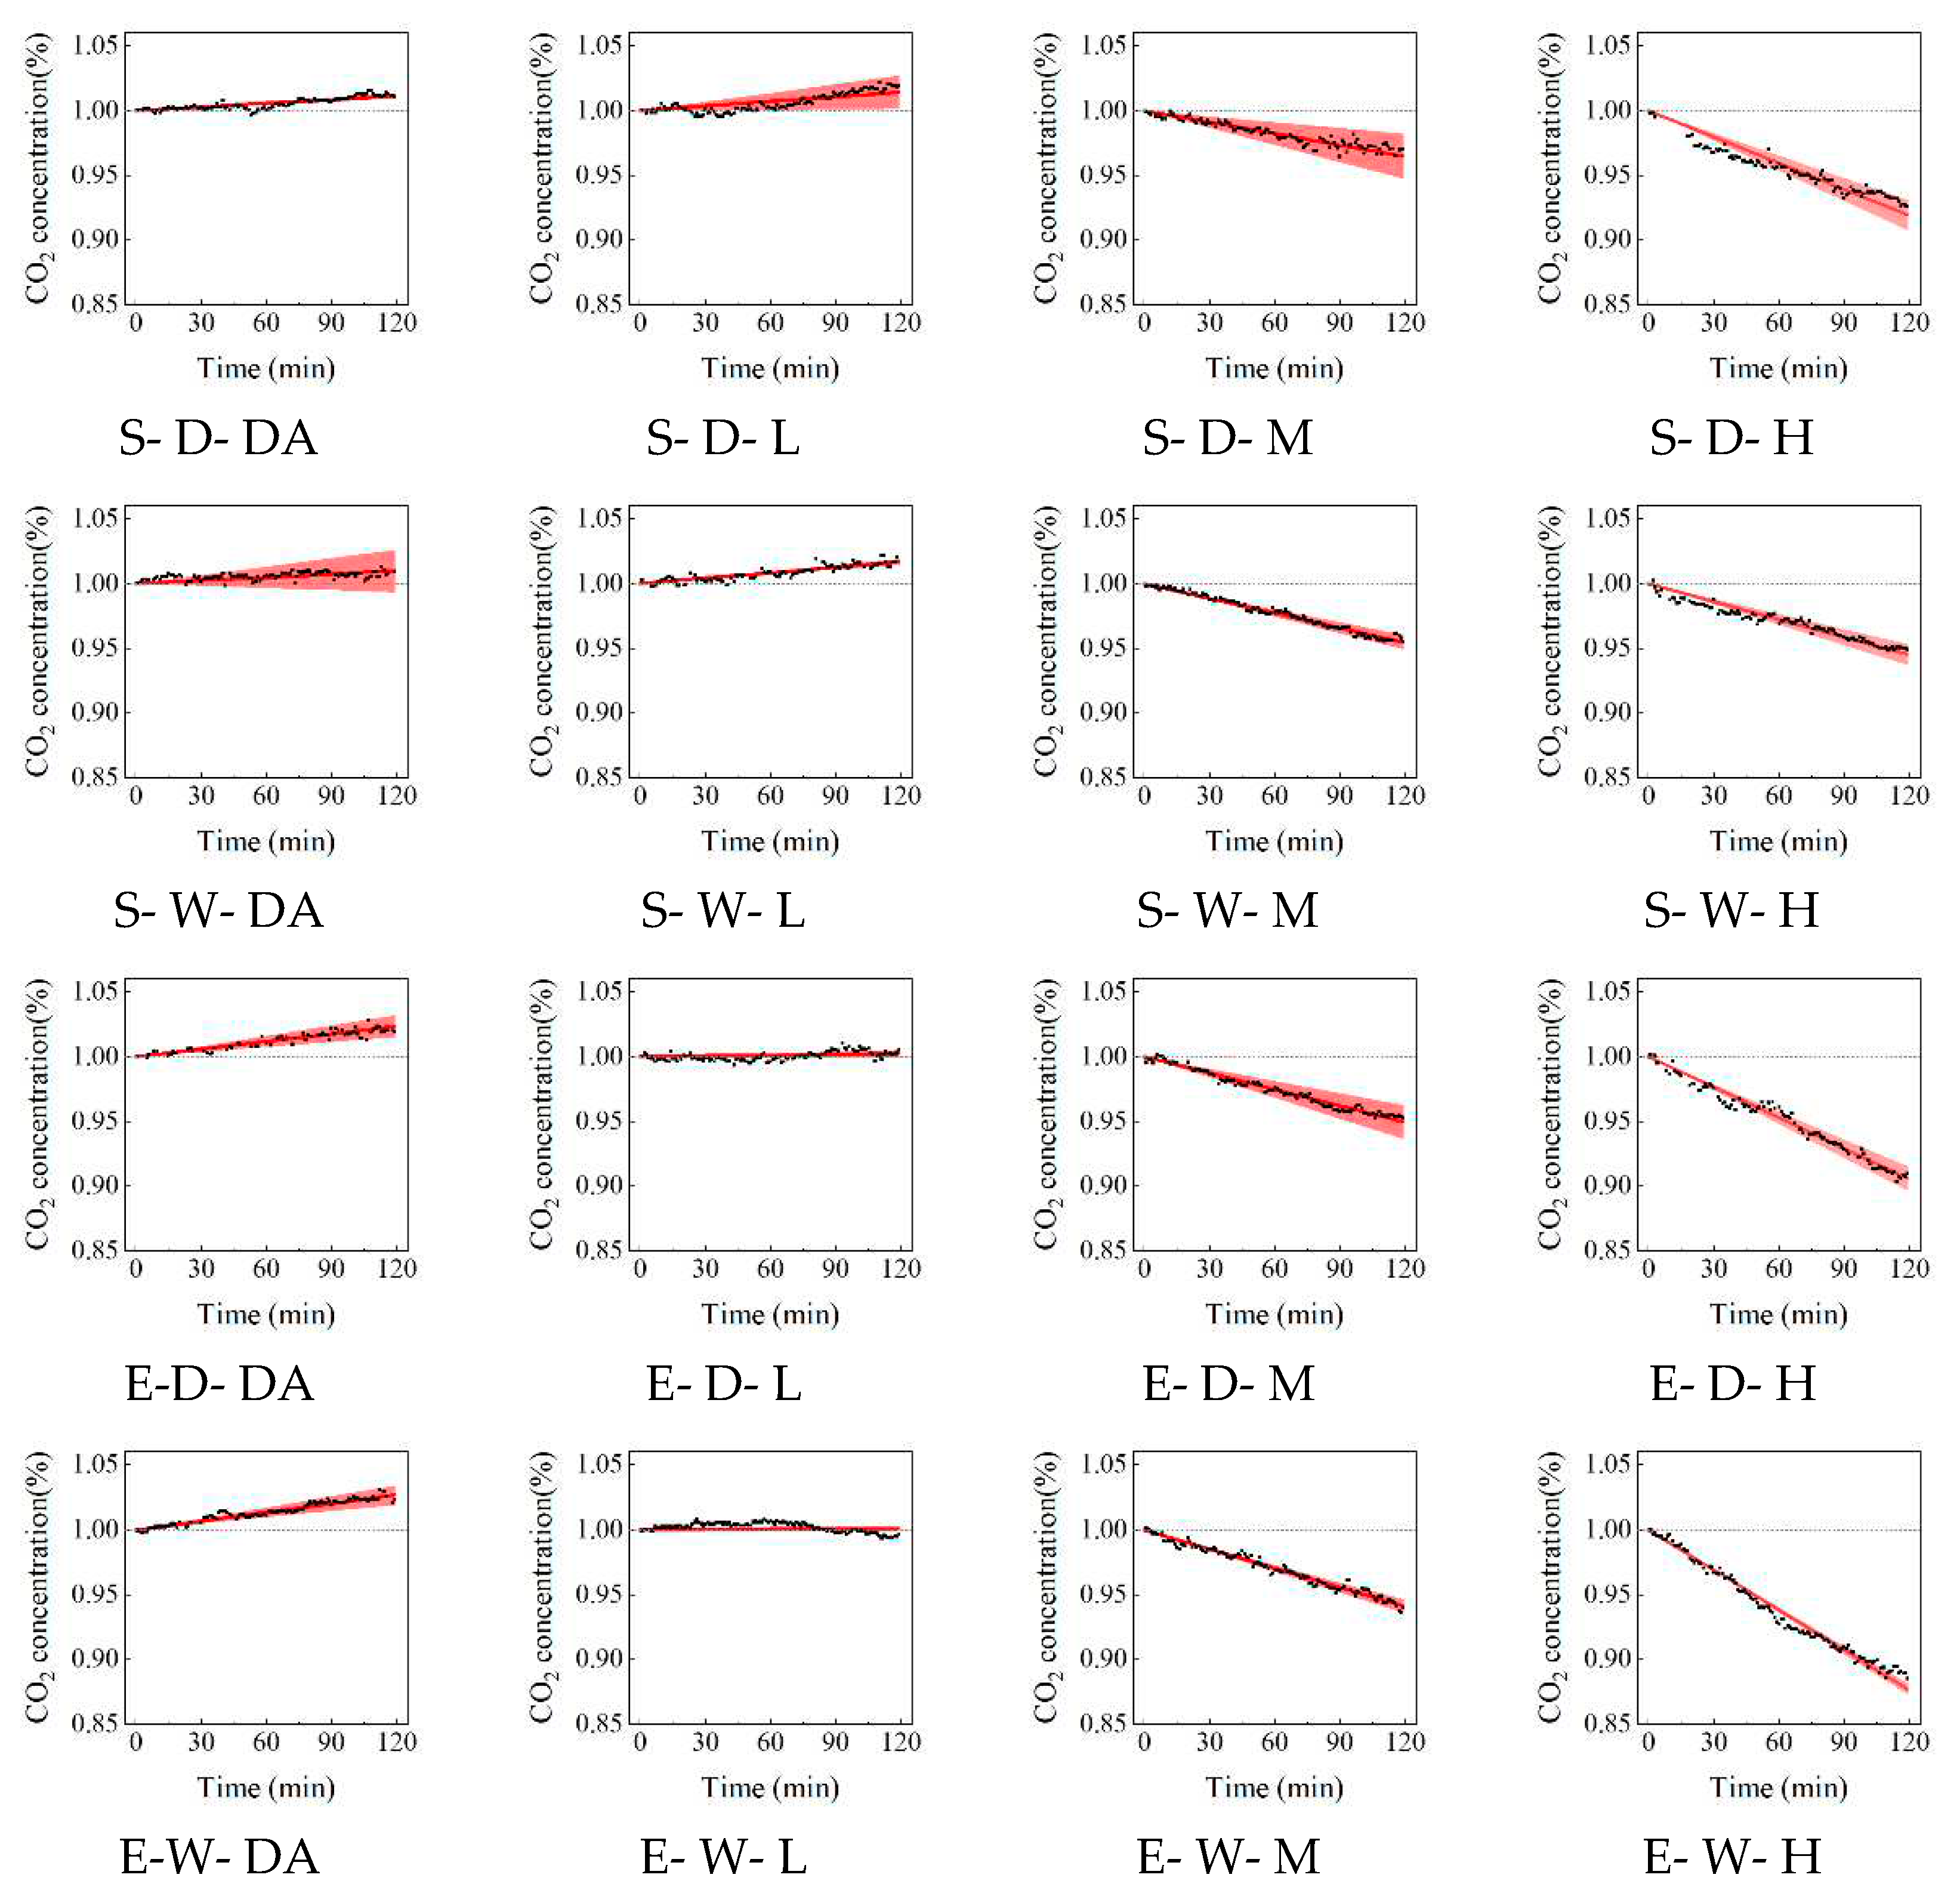
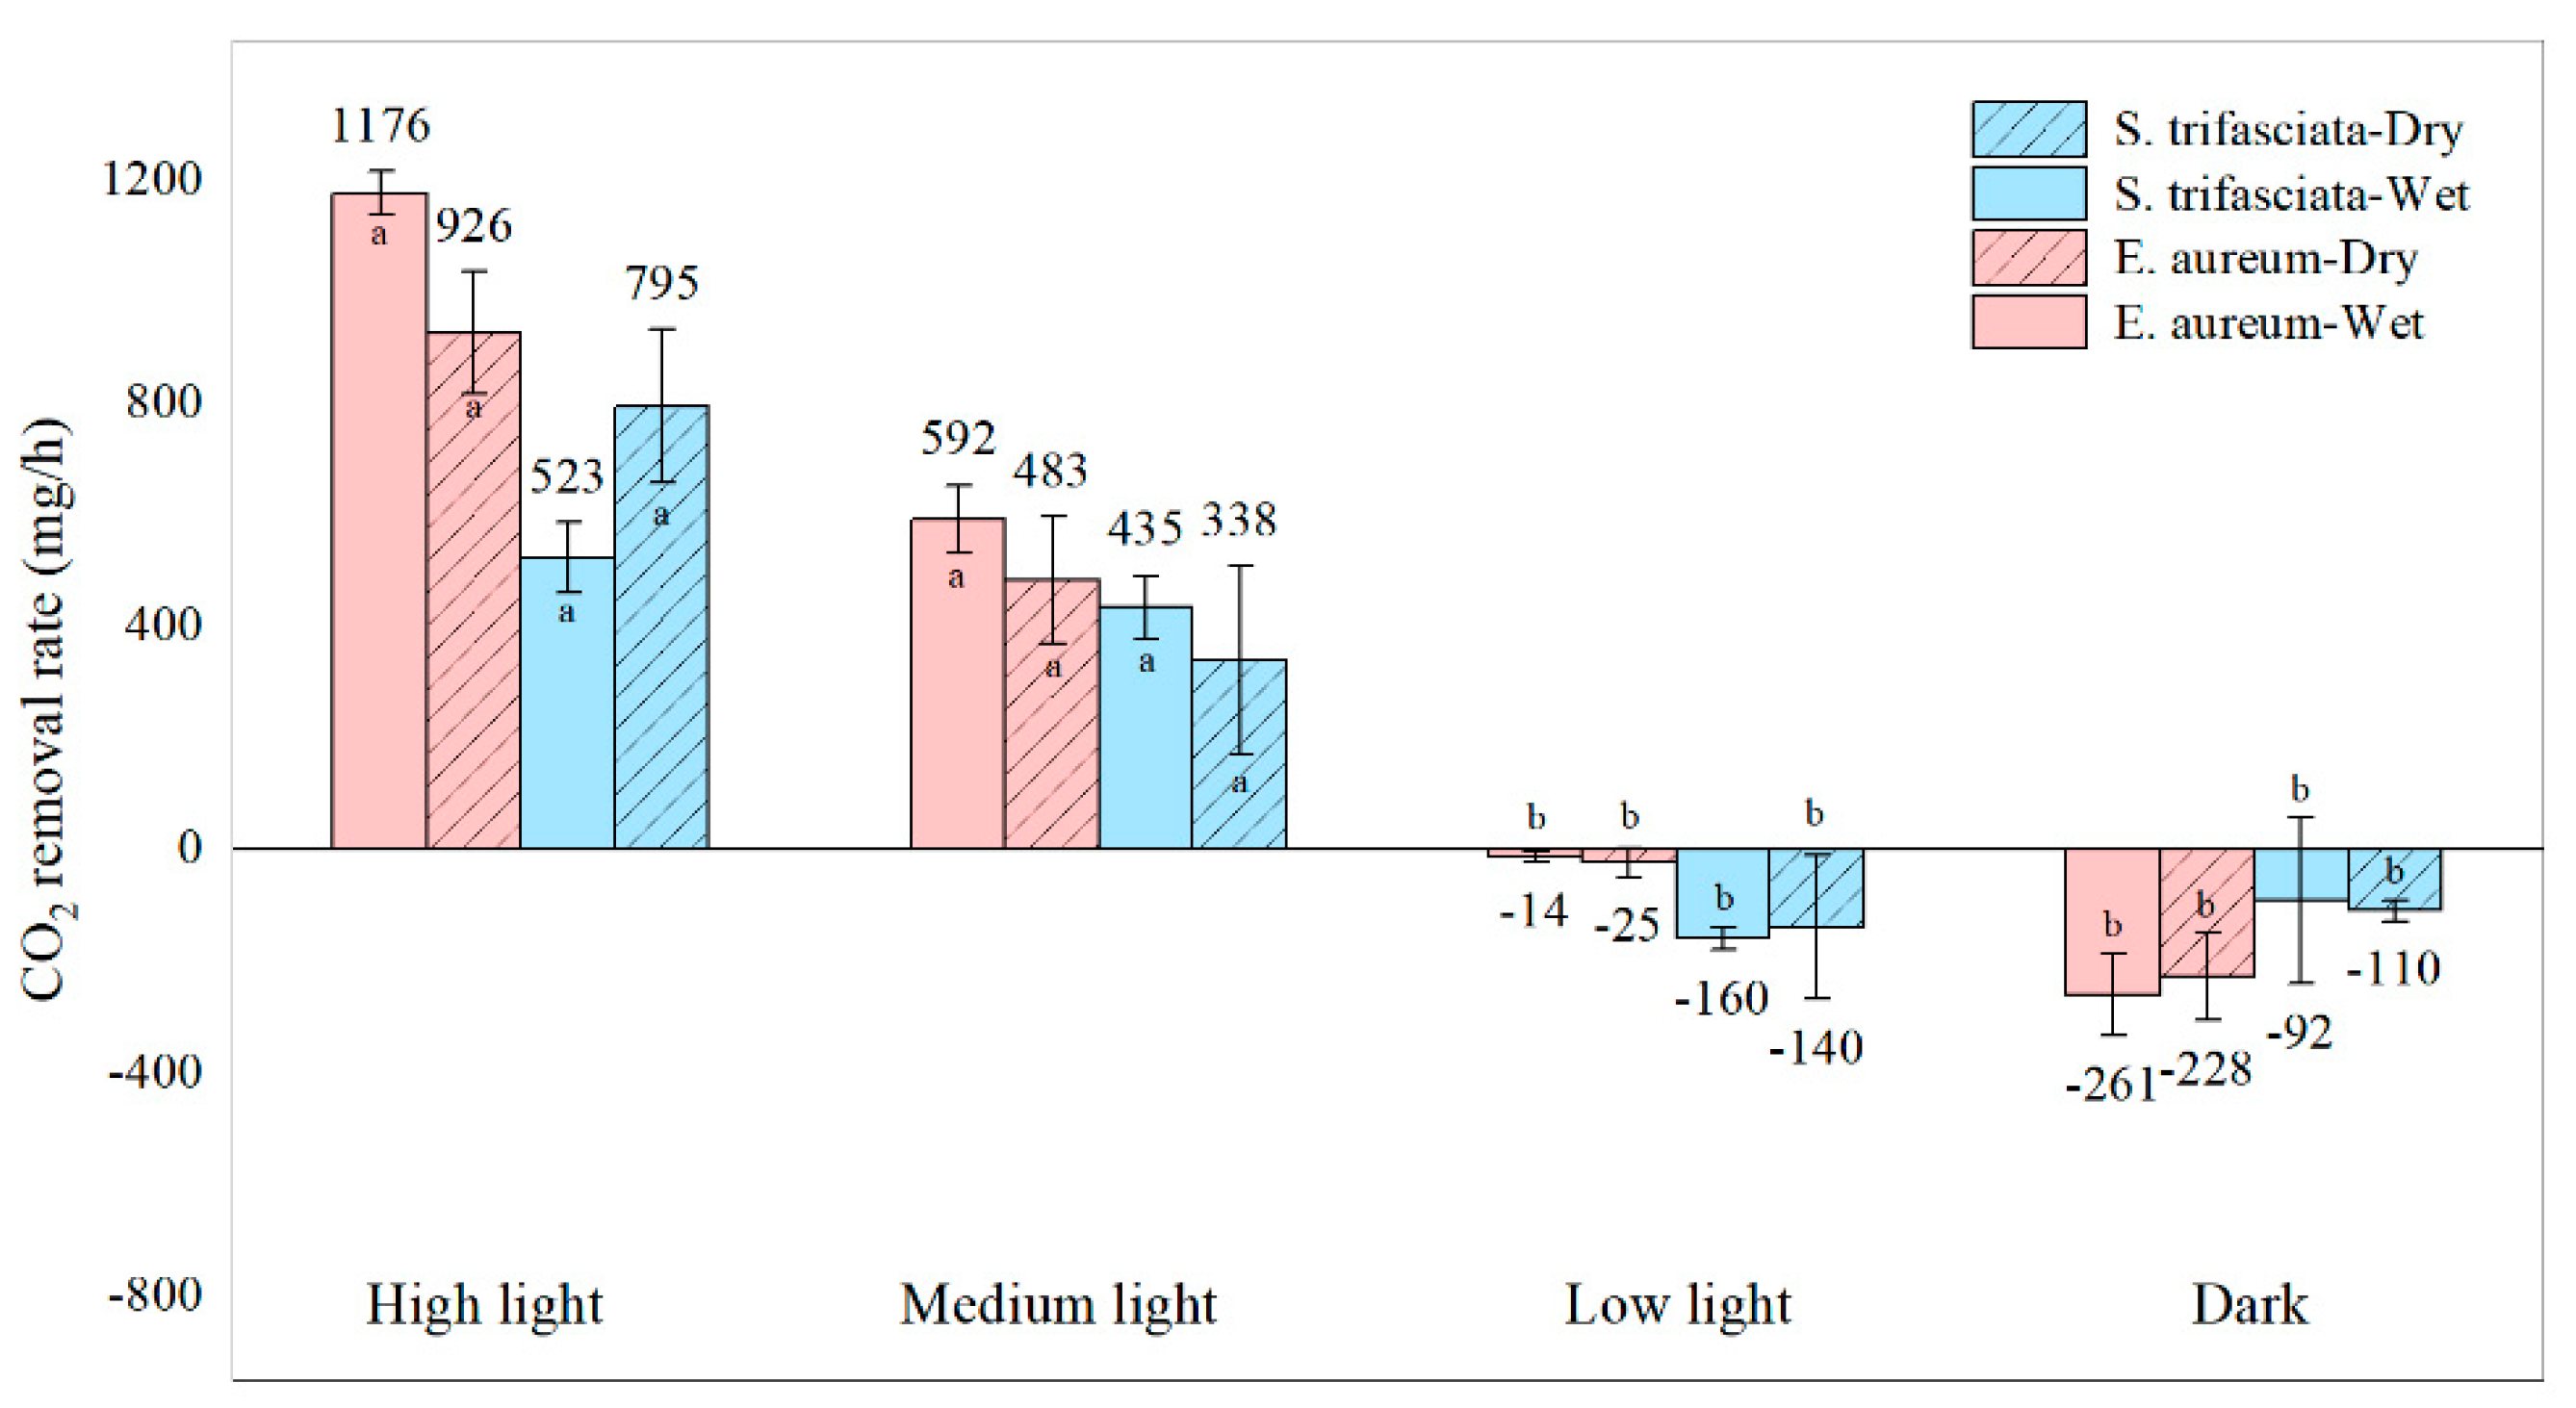
- The selection of C3 plants for living walls was found to achieve higher CO2 removal efficiency than CAM plants.
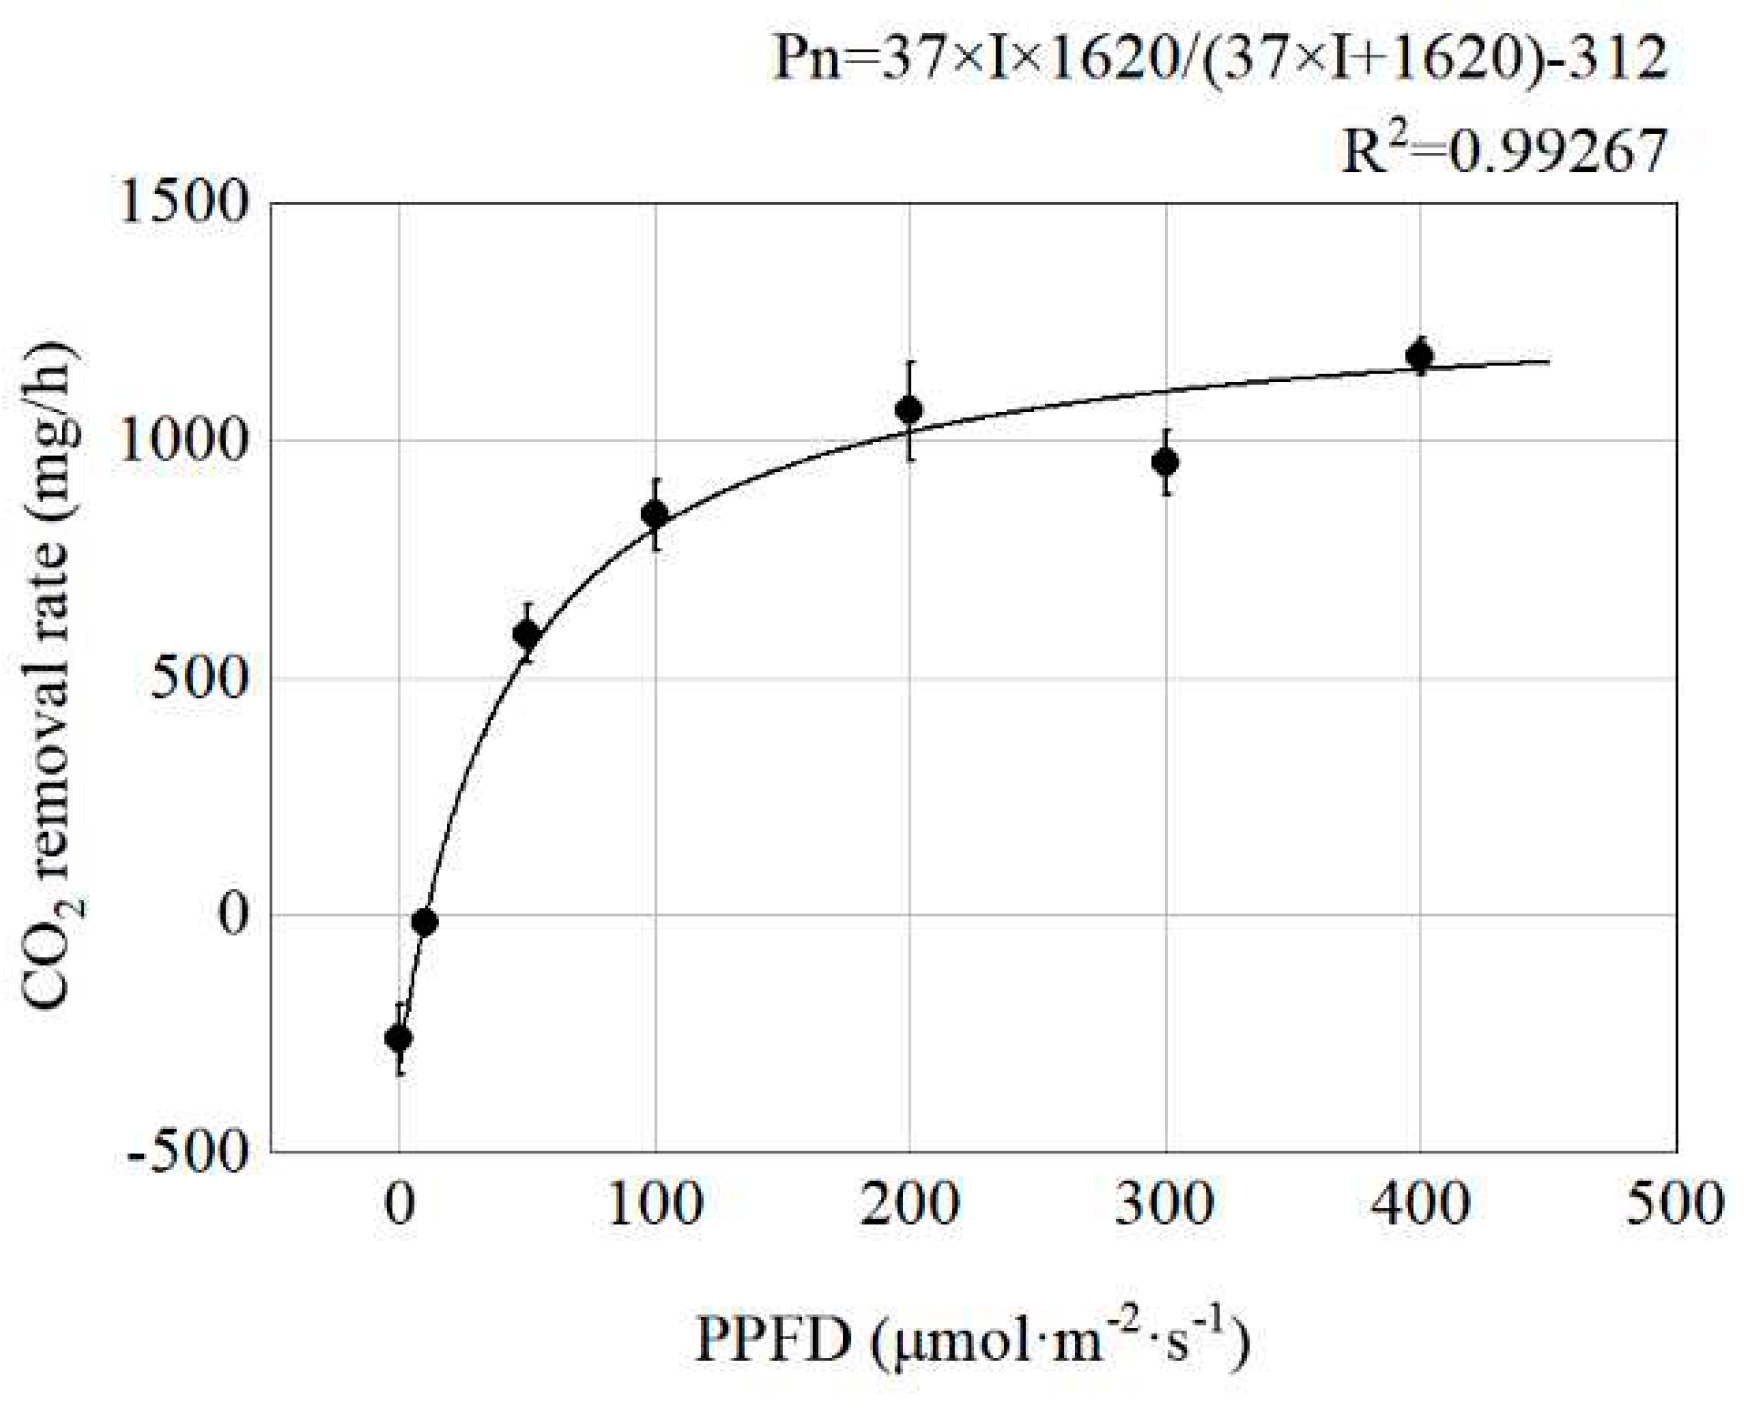
- Natural light is primarily used for CO2 removal in living walls. The activation of artificial lighting is recommended when the surface light intensity of living walls drops below the LCP of 13 μmol·m-2·s-1.
- The reduction of the irrigation frequency was found to have no impact on the CO2 removal efficiency of CAM plant living walls, but decreased the CO2 removal efficiency by 18.4%-21.3% for C3 plant living walls.
- In a 30-m2 office with two and three occupants, living walls can reduce the fresh air demand by 12.3%-27.8% and decrease fresh air energy consumption by 11.2%-28.2%.
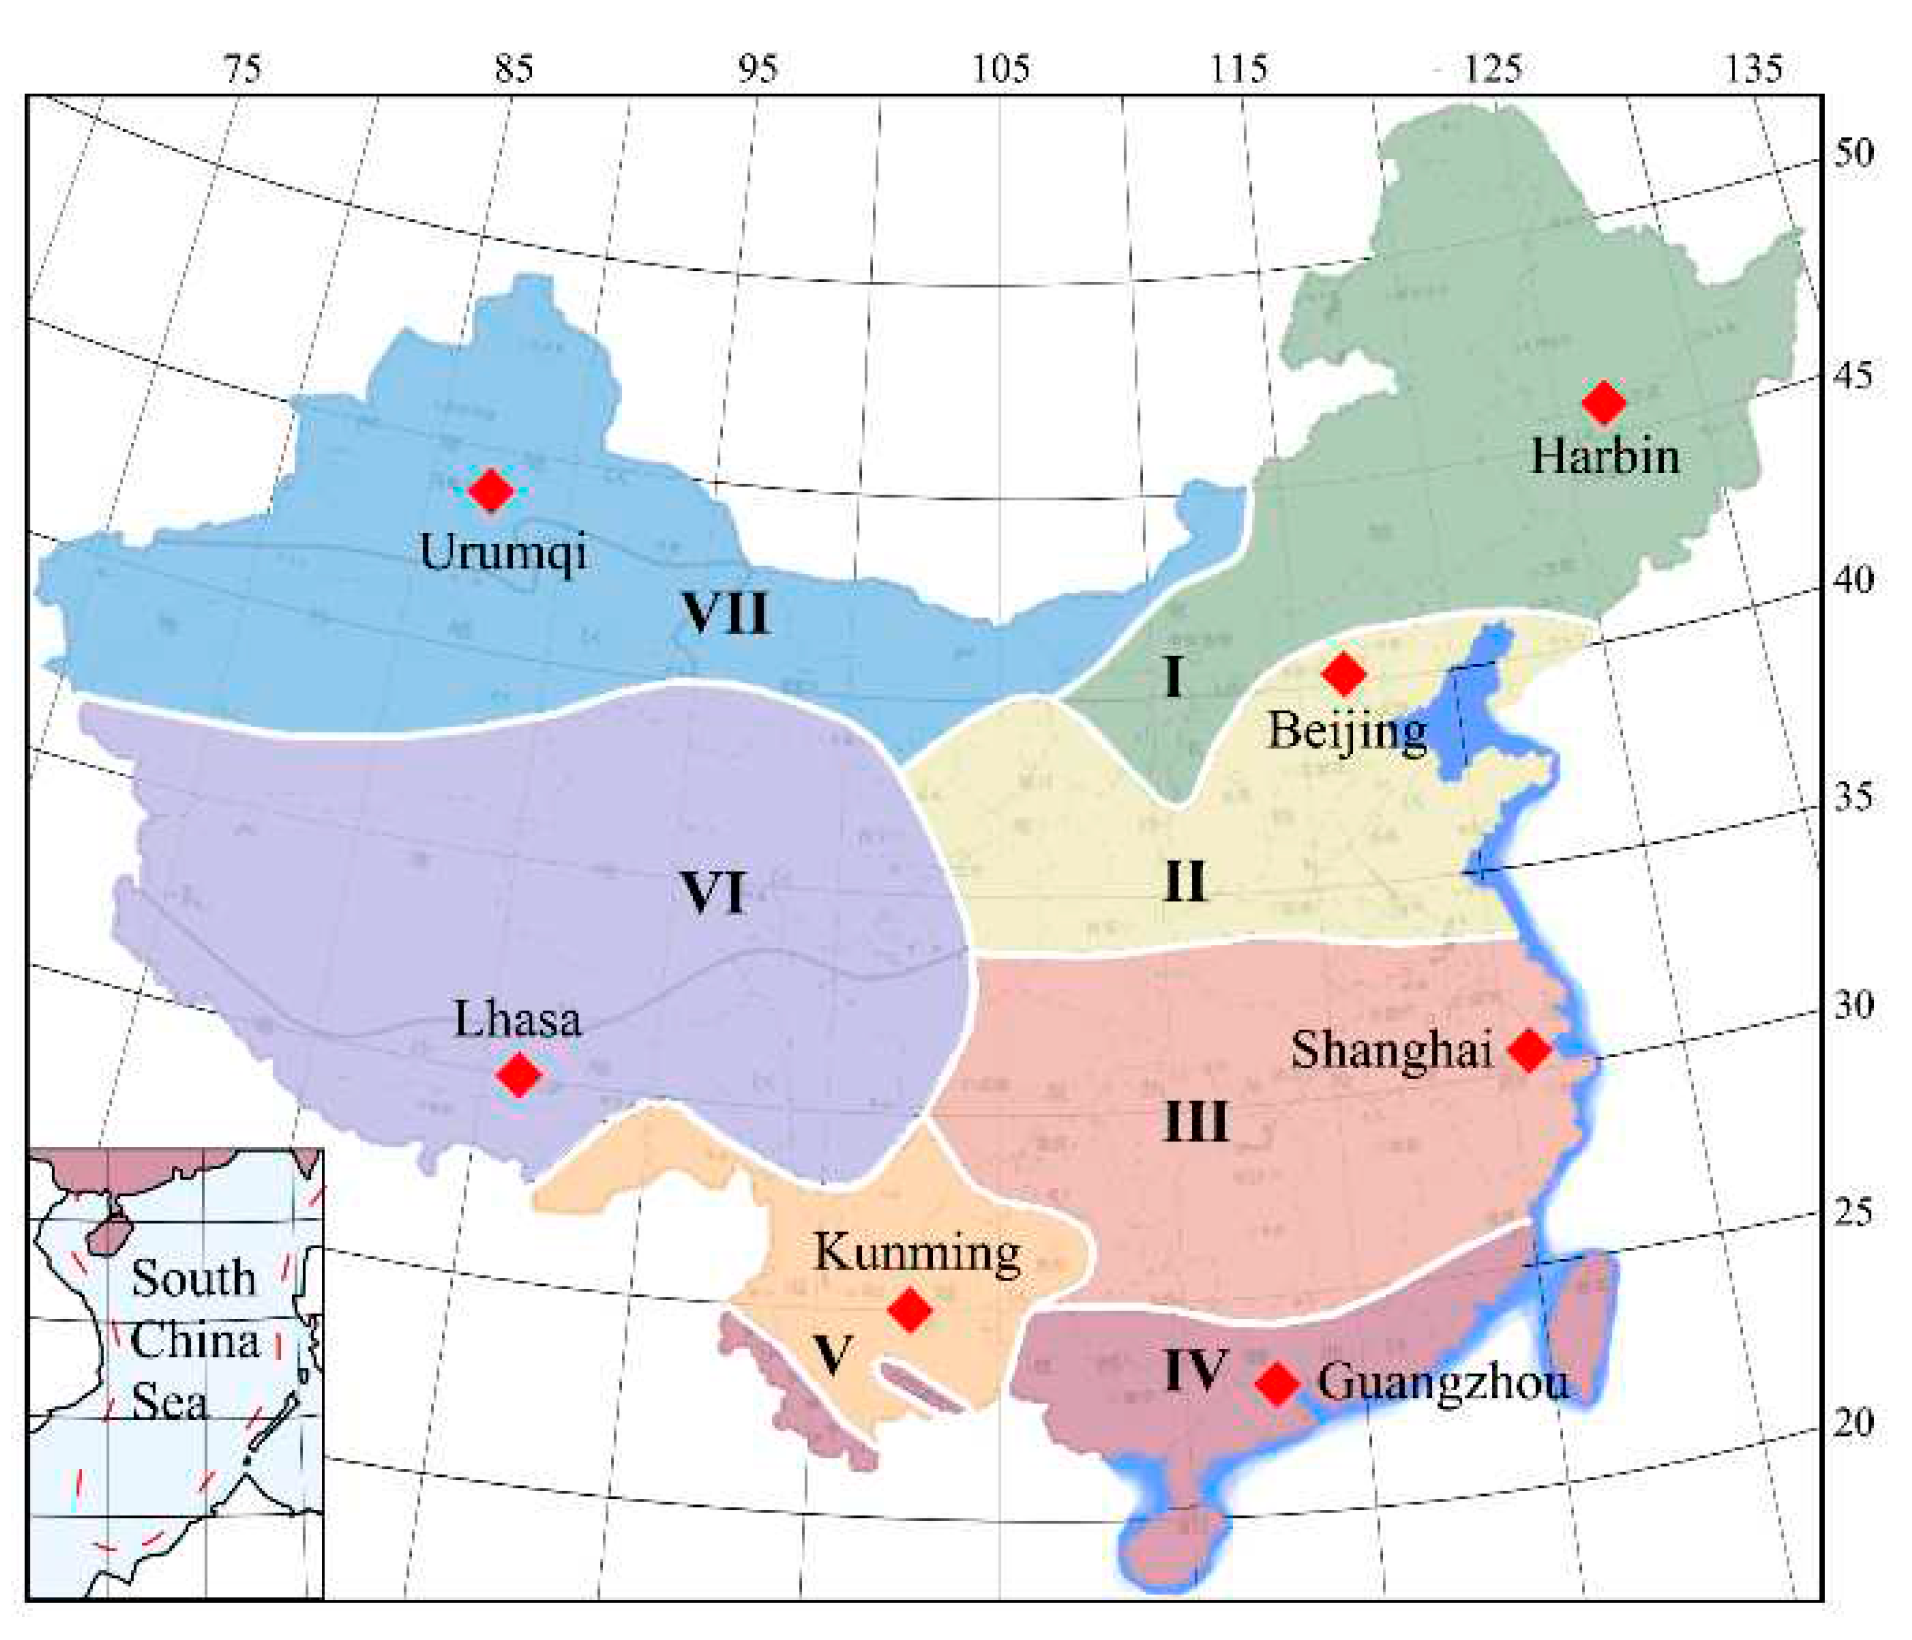
- The fresh air energy savings of the living walls varied significantly across climate regions. The city with the highest savings, Harbin, was found to have 4.2 times the energy savings of Kunming, the city with the lowest savings. Humid regions were found to exhibit 17.8%-29.1% higher energy savings as compared to dry regions.
Author Contributions
Funding
Data Availability Statement
Conflicts of Interest
References
- Tran, V. V.; Park, D.; Lee, Y.-C. , Indoor air pollution, related human diseases, and recent trends in the control and improvement of indoor air quality. International journal of environmental research and public health 2020, (8), 2927. [Google Scholar] [CrossRef] [PubMed]
- WHO Air pollution; 2023.
- Chujit, W.; Wiwatanadate, P.; Deesomchok, A.; Sopajaree, K.; Eldeirawi, K.; Tsai, Y. I. , Air pollution levels related to peak expiratory flow rates among adult asthmatics in Lampang, Thailand. Aerosol and Air Quality Research 2020, (6), 1398–1410. [Google Scholar] [CrossRef]
- Langford, N. J. , Carbon dioxide poisoning. Toxicological reviews 2005, 24, 229–235. [Google Scholar] [CrossRef] [PubMed]
- Permentier, K.; Vercammen, S.; Soetaert, S.; Schellemans, C. , Carbon dioxide poisoning: a literature review of an often forgotten cause of intoxication in the emergency department. International journal of emergency medicine 2017, (1), 14. [Google Scholar] [CrossRef] [PubMed]
- Shriram, S.; Ramamurthy, K.; Ramakrishnan, S. , Effect of occupant-induced indoor CO2 concentration and bioeffluents on human physiology using a spirometric test. Building and Environment 2019, 149, 58–67. [Google Scholar] [CrossRef]
- Chae, Y. S.; Park, S.; Kang, D. W.; Kim, D. W.; Kang, M.; San Choi, D.; Choe, J. H.; Hong, C. S. , Moisture-tolerant diamine-appended metal–organic framework composites for effective indoor CO2 capture through facile spray coating. Chemical Engineering Journal 2022, 433, 133856. [Google Scholar] [CrossRef]
- Law, J.; Watkins, S.; Alexander, D. , In-flight carbon dioxide exposures and related symptoms: Association, susceptibility, and operational implications. NASA technical paper 2010, 216126, 2010. [Google Scholar]
- Law, J.; Van Baalen, M.; Foy, M.; Mason, S. S.; Mendez, C.; Wear, M. L.; Meyers, V. E.; Alexander, D. Relationship between carbon dioxide levels and reported headaches on the international space station. Journal of occupational and environmental medicine 2014, 56, 477–483. Available online: https://www.jstor.org/stable/48500627. [CrossRef]
- Allen, J. G.; MacNaughton, P.; Satish, U.; Santanam, S.; Vallarino, J.; Spengler, J. D. , Associations of Cognitive Function Scores with Carbon Dioxide, Ventilation, and Volatile Organic Compound Exposures in Office Workers: A Controlled Exposure Study of Green and Conventional Office Environments. Environ Health Perspect 2016, (6), 805–12. [Google Scholar] [CrossRef]
- Satish, U.; Mendell, M. J.; Shekhar, K.; Hotchi, T.; Fisk, W. B. J. , Is CO2 an Indoor Pollutant? Direct Effects of Low-to-Moderate CO2 Concentrations on Human Decision-Making Performance. Environmental Health Perspectives 2012, (12), 1671–1677. [Google Scholar] [CrossRef]
- Jacobson, T. A.; Kler, J. S.; Hernke, M. T.; Braun, R. K.; Meyer, K. C.; Funk, W. E. , Direct human health risks of increased atmospheric carbon dioxide. Nature Sustainability 2019, 2. [Google Scholar] [CrossRef]
- Commission, N. H. a. W. Indoor Air Quality Standard. In China Standard Publishing House: Beijing, 2022; Vol. GB/T 18883-2022.
- ASHRAE, Ventilation for Acceptable Indoor Air Quality. In 2019; Vol. ANSI/ASHRAE Standard 62.1-2019.
- Bala, G. , Digesting 400 ppm for global mean CO2 concentration. Curr Sci 2013, (11), 1471–1472. [Google Scholar]
- Wang, S.; Lee, Y. R.; Won, Y.; Kim, H.; Jeong, S. E.; Hwang, B. W.; Cho, A. R.; Kim, J. Y.; Park, Y. C.; Nam, H. , Development of high-performance adsorbent using KOH-impregnated rice husk-based activated carbon for indoor CO2 adsorption. Chemical Engineering Journal 2022, 437, 135378. [Google Scholar] [CrossRef]
- Zhao, Y.; Zhou, J.; Fan, L.; Chen, L.; Li, L.; Xu, Z. P.; Qian, G. Indoor CO2 Control through Mesoporous Amine-Functionalized Silica Monoliths. Industrial & Engineering Chemistry Research 2019, (42), 58. [Google Scholar] [CrossRef]
- Shiue, A.; Hsu, T. H.; Chang, S. M.; Leggett, G. , Using polyvinyl alcohol (PVA):poly(allylamine) (PAA) coated on reverse osmosis membrane for separating carbon dioxide from indoor air. International Journal of Environmental Science and Technology 2022, (5), 19. [Google Scholar] [CrossRef]
- Omrani, S.; Garcia-Hansen, V.; Capra, B. R.; Drogemuller, R. , Effect of natural ventilation mode on thermal comfort and ventilation performance: Full-scale measurement. Energy and Buildings 2017, 156, 1–16. [Google Scholar] [CrossRef]
- Amoatey, P.; Omidvarborna, H.; Baawain, M. S.; Al-Mamun, A. , Indoor Air Pollution and Exposure Assessment of the Gulf Cooperation Council Countries: A Critical Review. Environment International 2018, 121, 491–506. [Google Scholar] [CrossRef]
- Lai, D.; Qi, Y.; Liu, J.; Dai, X.; Zhao, L.; Wei, S. , Ventilation behavior in residential buildings with mechanical ventilation systems across different climate zones in China. Building and Environment 2018, 143, 679–690. [Google Scholar] [CrossRef]
- Xue, D. , Air Conditioning. Tsinghua University Press: Beijing, 2000.
- Liddament, M. W. , A review of ventilation and the quality of ventilation air. Indoor air 2000, (3), 193–199. [Google Scholar] [CrossRef]
- Irga, P.; Pettit, T.; Torpy, F. The phytoremediation of indoor air pollution: a review on the technology development from the potted plant through to functional green wall biofilters. Reviews in Environmental Science and Bio/Technology 2018, 17, 395–415. [Google Scholar] [CrossRef]
- Matheson, S.; Fleck, R.; Irga, P. J.; Torpy, F. R. Phytoremediation for the indoor environment: a state-of-the-art review. Reviews in Environmental Science and Bio/Technology 2023, 22, 249–280. [Google Scholar] [CrossRef]
- Liu, F.; Yan, L.; Meng, X.; Zhang, C. , A review on indoor green plants employed to improve indoor environment. Journal of Building Engineering 2022, 53, 104542. [Google Scholar] [CrossRef]
- Bowman, R. O.; Thomae, F. W. , Long-term nontoxic support of animal life with algae. Science 1961, (3471), 55–56. [Google Scholar] [CrossRef] [PubMed]
- Gitelson, J. I.; Okladnikov, Y. N. In Human Functions in a Biological Life Support System, International Conference on Environmental Systems, 1997; 1997.
- Berkovich, Y. A.; Krivobok, N.; Sinyak, Y. E. , Project of conveyer-type space greenhouse for cosmonauts' supply with vitamin greenery. Advances in Space Research 1998, (10), 1401–1405. [Google Scholar] [CrossRef]
- Pegas, P. N.; Alves, C. A.; Nunes, T.; Bate-Epey, E. F.; Evtyugina, M.; Pio, C. A. Could houseplants improve indoor air quality in schools? J Toxicol Environ Health A 2012, 75, 1371–1380. [Google Scholar] [CrossRef]
- Tudiwer, D.; Korjenic, A. , The effect of an indoor living wall system on humidity, mould spores and CO2-concentration. Energy and Buildings 2017, 146, 73–86. [Google Scholar] [CrossRef]
- Meng, X.; Yan, L.; Liu, F. , A new method to improve indoor environment: Combining the living wall with air-conditioning. Building and Environment 2022, 216. [Google Scholar] [CrossRef]
- Yungstein, Y.; Helman, D. , Cooling, CO2 reduction, and energy-saving benefits of a green-living wall in an actual workplace. Building and Environment 2023, 236. [Google Scholar] [CrossRef]
- Research, C. A. o. B. , Design standard for energy efficiency of public buildings. In China Architecture & Building Press: Beijing, 2015; Vol. GB50189-2015.
- Zhang, H.; Yang, R.; You, S.; Zheng, W.; Zheng, X.; Ye, T. , The CPMV index for evaluating indoor thermal comfort in buildings with solar radiation. Building and Environment 2018, 134, 1–9. [Google Scholar] [CrossRef]
- Andrady, A. L.; Hamid, S.; Hu, X.; Torikai, A. Effects of increased solar ultraviolet radiation on materials. Journal of photochemistry and photobiology B: Biology 1998, 46, 96–103. [Google Scholar] [CrossRef]
- Kosonen, R.; Tan, F. , Assessment of productivity loss in air-conditioned buildings using PMV index. Energy and buildings 2004, (10), 987–993. [Google Scholar] [CrossRef]
- Zhang, F.; Haddad, S.; Nakisa, B.; Rastgoo, M. N.; Candido, C.; Tjondronegoro, D.; de Dear, R. , The effects of higher temperature setpoints during summer on office workers' cognitive load and thermal comfort. Building and environment 2017, 123, 176–188. [Google Scholar] [CrossRef]
- Medlyn, B.; Dreyer, E.; Ellsworth, D.; Forstreuter, M.; Harley, P.; Kirschbaum, M.; Le Roux, X.; Montpied, P.; Strassemeyer, J.; Walcroft, A. Temperature response of parameters of a biochemically based model of photosynthesis. II. A review of experimental data. Plant, Cell & Environment 2002, 25, 1167–1179. [Google Scholar] [CrossRef]
- Sage, R. F.; Kubien, D. S. The temperature response of C3 and C4 photosynthesis. Plant, cell & environment 2007, 30, 1086–1106. [Google Scholar] [CrossRef]
- Al Horr, Y.; Arif, M.; Kaushik, A.; Mazroei, A.; Katafygiotou, M.; Elsarrag, E. , Occupant productivity and office indoor environment quality: A review of the literature. Building and Environment 2016, 105, 369–389. [Google Scholar] [CrossRef]
- Shao, Y.; Li, J.; Zhou, Z.; Hu, Z.; Zhang, F.; Cui, Y.; Chen, H. , The effects of vertical farming on indoor carbon dioxide concentration and fresh air energy consumption in office buildings. Building and Environment 2021, 195, 107766. [Google Scholar] [CrossRef]
- Pennisi, S. V.; van Iersel, M. W. , Quantification of carbon assimilation of plants in simulated and in situ interiorscapes. HortScience 2012, (4), 468–476. [Google Scholar] [CrossRef]
- Gubb, C.; Blanusa, T.; Griffiths, A.; Pfrang, C. Can houseplants improve indoor air quality by removing CO2 and increasing relative humidity? Air Quality, Atmosphere & Health 2018, 11, 1191–1201. [Google Scholar] [CrossRef]
- Lee, Y.-K.; Kim, Y. I.; Lee, W.-S. Development of CO2 Concentration Prediction Tool for Improving Office Indoor Air Quality Considering Economic Cost. Energies 2022, 15. [Google Scholar] [CrossRef]
- Torpy, F. R.; Irga, P. J.; Burchett, M. D. , Profiling indoor plants for the amelioration of high CO2 concentrations. Urban Forestry & Urban Greening 2014, 13, 227–233. [Google Scholar] [CrossRef]
- Parhizkar, H.; Khoraskani, R. A.; Tahbaz, M. , Double skin façade with Azolla; ventilation, Indoor Air Quality and Thermal Performance Assessment. Journal of Cleaner Production 2020, 249. [Google Scholar] [CrossRef]
- Ben-David, T.; Waring, M. S. , Impact of natural versus mechanical ventilation on simulated indoor air quality and energy consumption in offices in fourteen U.S. cities. Building and Environment 2016, 104, 320–336. [Google Scholar] [CrossRef]
- Ng, L. C.; Ojeda Quiles, N.; Dols, W. S.; Emmerich, S. J. Weather Correlations to Calculate Infiltration Rates for U. S. Commercial Building Energy Models. Building & Environment 2018, 127, 47. [Google Scholar] [CrossRef]
- Sherman, M. H. , Estimation of infiltration from leakage and climate indicators. Energy and buildings 1987, (1), 81–86. [Google Scholar] [CrossRef]
- Research, C. A. o. B. , Design Code for Heating Ventilation and Air Conditioning of Civil Buildings. In China Architecture & Building Press: Beijing, 2012; Vol. GB 50736-2012.
- Chatakul, P.; Janpathompong, S. , Interior plants: Trends, species, and their benefits. Building and Environment 2022, 222. [Google Scholar] [CrossRef]
- Armijos-Moya, T.; de Visser, P.; Ottelé, M.; van den Dobbelsteen, A.; Bluyssen, P. M. , Air Cleaning Performance of Two Species of Potted Plants and Different Substrates. Applied Sciences 2021, (1), 284. [Google Scholar] [CrossRef]
- Pan, R. , Plant Physiology. Veision 7 ed.; Higher Education Press: Beijing, 2012. [Google Scholar]
- Research, C. A. o. B. , Standard for lighting design of buildings. In China Architecture & Building Press: Beijing, 2013; Vol. GB 50034-2013.
- Torpy, F. R.; Zavattaro, M.; Irga, P. J. Green wall technology for the phytoremediation of indoor air: a system for the reduction of high CO2 concentrations. Air Quality, Atmosphere & Health 2016, 10, 575–585. [Google Scholar] [CrossRef]
- Dominici, L.; Fleck, R.; Gill, R. L.; Pettit, T. J.; Irga, P. J.; Comino, E.; Torpy, F. R. , Analysis of lighting conditions of indoor living walls: Effects on CO2 removal. Journal of Building Engineering 2021, 44. [Google Scholar] [CrossRef]
- Baly, E. C. C. The kinetics of photosynthesis. Proceedings of the Royal Society of London. Series B-Biological Sciences 1935, 117, 218–239. [Google Scholar] [CrossRef]
- YE, Z.-P. , A review on modeling of responses of photosynthesis to light and CO2. Chinese Journal of Plant Ecology 2010, (6), 727. [Google Scholar] [CrossRef]
- Persily, A. K. Evaluating building IAQ and ventilation with indoor carbon dioxide. Transactions-American society of heating refrigerating and air conditioning engineers 1997, 103, 193–204. [Google Scholar]
- Research, Z. P. I. o. A. D. a.; Hengzun Group Co., L. , Standard for design of office building. In China Architecture & Building Press: Beijing, 2019; Vol. JGJ/T 67-2019.
- CIBSE, TM23 Testing buildings for air leakage. In CIBSE: UK, 2022; Vol. 9781914543173.
- Zhu, Y. , Built Environment. Veision 4 ed.; China Architecture & Building Press: Beijing, 2015. [Google Scholar]
- Lu, Y. , Heating, Ventilation and Air Conditioning. Veision 3 ed.; China Architecture & Building Press: Beijing, 2015. [Google Scholar]
- Qi, M. W.; Li, X. F.; Weschler, L. B.; Sundell, J. , CO2 generation rate in Chinese people. Indoor Air 2014, (6), 559–66. [Google Scholar] [CrossRef] [PubMed]
- Administration, G. S. The 5th national physical fitness monitoring bulletin; People's Sports Press: Beijing, 2022. [Google Scholar]
- Guyot, *!!! REPLACE !!!*; Gaelle, *!!! REPLACE !!!*; Sherman, *!!! REPLACE !!!*; Max, *!!! REPLACE !!!*; H., *!!! REPLACE !!!*; Walker, *!!! REPLACE !!!*; Iain, *!!! REPLACE !!!*; S., *!!! REPLACE !!!*. Smart ventilation energy and indoor air quality performance in residential buildings: A review. Energy & Buildings 2018. [Google Scholar] [CrossRef]
- Lu, X.; Pang, Z.; Fu, Y.; O'Neill, Z. , The nexus of the indoor CO2 concentration and ventilation demands underlying CO2-based demand-controlled ventilation in commercial buildings: A critical review. Building and Environment 2022, 218. [Google Scholar] [CrossRef]
- Zhang, S.; Ai, Z.; Lin, Z. , Novel demand-controlled optimization of constant-air-volume mechanical ventilation for indoor air quality, durability and energy saving. Applied Energy 2021, 293. [Google Scholar] [CrossRef]
- Sherman, M. H.; Walker, I. S. , Meeting residential ventilation standards through dynamic control of ventilation systems. Energy and Buildings 2011, (8), 1904–1912. [Google Scholar] [CrossRef]
- Research, C. A. o. B. , Code for Thermal Design of Civil Building. In China Architecture & Building Press: Beijing, 2016; Vol. GB50176-2016.
- Research, C. I. o. B. S. D. , Uniform Standard for Design of Civil Building. In China Architecture & Building Press: Beijing, 2019; Vol. 5035. [Google Scholar]
- Lee, J. S. , Stomatal Opening Mechanism of CAM Plants. Journal of Plant Biology 2010, (1), 19–23. [Google Scholar] [CrossRef]
- Grams, T. E. E.; Thiel, S. , High light-induced switch from C-3-photosynthesis to Crassulacean acid metabolism is mediated by UV-A/blue light. Journal of Experimental Botany 2002, (373), 1475–1483. [Google Scholar] [CrossRef]
- Chu, Y.; Xu, P.; Jia, Y.; Lin, M.; Dou, Q. , An adsorption-based CO2 treatment unit for ultra-low fresh air HVAC system using solid amine. Energy and Buildings 2021, 111148. [Google Scholar] [CrossRef]
- Liu, Y.; Huang, L.; Song, C.; Wang, D.; Suolang, B.; Duan, G. , Effect of hypoxia on human cognitive ability and indoor oxygen environment demand for sojourners at high altitude. Building and Environment 2021, 194. [Google Scholar] [CrossRef]
- Jiang, S.-Y.; Ma, A.; Ramachandran, S. Negative Air Ions and Their Effects on Human Health and Air Quality Improvement. International Journal of Molecular Sciences 2018, 19. [Google Scholar] [CrossRef]
- Torpy, F.; Clements, N.; Pollinger, M.; Dengel, A.; Mulvihill, I.; He, C.; Irga, P. Testing the single-pass VOC removal efficiency of an active green wall using methyl ethyl ketone (MEK). Air Quality, Atmosphere & Health 2018, 11, 163–170. [Google Scholar] [CrossRef]
- Treesubsuntorn, C.; Thiravetyan, P. , Botanical biofilter for indoor toluene removal and reduction of carbon dioxide emission under low light intensity by using mixed C3 and CAM plants. Journal of Cleaner Production 2018, 194, 94–100. [Google Scholar] [CrossRef]
- Irga, P.; Paull, N.; Abdo, P.; Torpy, F. , An assessment of the atmospheric particle removal efficiency of an in-room botanical biofilter system. Building and Environment 2017, 115, 281–290. [Google Scholar] [CrossRef]
- Mangone, G.; Kurvers, S. R.; Luscuere, P. G. , Constructing thermal comfort: Investigating the effect of vegetation on indoor thermal comfort through a four season thermal comfort quasi-experiment. Building and Environment 2014, 81, 410–426. [Google Scholar] [CrossRef]
- Altman, A.; Shennan, S.; Odling-Smee, J. , Ornamental plant domestication by aesthetics-driven human cultural niche construction. Trends in Plant Science 2022, (2), 124–138. [Google Scholar] [CrossRef]
- Poorter, H.; Nagel, O. , The role of biomass allocation in the growth response of plants to different levels of light, CO2, nutrients and water: a quantitative review. Functional Plant Biology 2000, (12), 1191–1191. [Google Scholar] [CrossRef]
- Luettge, U. Stem CAM in arborescent succulents. Trees-Structure and Function 2008, 22, 139–148. [Google Scholar] [CrossRef]
- Irga, P. J.; Torpy, F. R.; Burchett, M. D. , Can hydroculture be used to enhance the performance of indoor plants for the removal of air pollutants? Atmospheric Environment 2013, 77, 267–271. [Google Scholar] [CrossRef]
- Zainorizuan, M. J.; Suhaimi, M. M.; Leman, A. M.; Afandi, A.; Hariri, A.; Idris, A. F. a.; Dzulkifli, S. N. M.; Gani, P.; Yee Yong, L.; Alvin John Meng Siang, L.; Mohamad Hanifi, O.; Siti Nazahiyah, R.; Mohd Shalahuddin, A. In Effectiveness of Indoor Plant to Reduce CO2 in Indoor Environment, MATEC Web of Conferences, 2017; 2017.
- Nelson, J. A.; Bugbee, B. , Economic analysis of greenhouse lighting: light emitting diodes vs. high intensity discharge fixtures. PloS one 2014, (6), e99010. [Google Scholar] [CrossRef] [PubMed]
- Tambussi, E. A.; Bort, J.; Araus, J. L. , Water use efficiency in C-3 cereals under Mediterranean conditions: a review of physiological aspects. Annals of Applied Biology 2007, (3), 307–321. [Google Scholar] [CrossRef]
| Instrument | Model | Parameters | Accuracy | Setting Points |
|---|---|---|---|---|
| Air quality monitor | SenseAir S8 | CO2 (ppm) | ±40 ppm | Indoor: In the center of the room, 1.2 m above the ground |
| SensenSHT20 | Temperature (°C) | ±0.3 °C | ||
| Relative humidity (%) | ±3% | |||
| Photosynthetic photon flux density (PPFD) meter | Apogee MQ-500 | PPFD/(μmol·m-2·s-1) | ±5% | On the top of canopy |
| Apogee SQ-520 | Outdoor: Roof | |||
| CO2 sensor | RS-BYH-CO2-M | CO2 (ppm) | ±40 ppm (25 °C) | Outdoor: Roof |
| Weather station | Campbell 81000 | Wind speed (m/s) | ±1% | Outdoor: Roof |
| Campbell CS215 | Temperature (°C) | ±0.3 °C (25 °C) | ||
| Relative humidity (%) | ±2% (25 °C) | |||
| Volumetric water content (VWC) sensor | Decagon Devices 5TE | VWC (m3/m3) | ±3% | Substrate |
| Species | Family | Metabolism | Leaf Type | Leaf Area (cm2 ) | Plant Height (cm) |
|---|---|---|---|---|---|
| Sansevieria trifasciata | Asparagaceae | CAM | succulent | 537±77 | 28±1 |
| Epipremnum aureum | Araceae | C3 | herbaceous | 614±111 | 22±1 |
| Climate Region | City | Average Temperature in Winter (°C) |
Dry Bulb Temperature in Summer (°C) |
Relative Humidity in Summer |
Atmospheric Pressure in Summer (kPa) |
Moisture Content in Summer (g/kg) |
Enthalpy in Summer (kJ/kg) |
|---|---|---|---|---|---|---|---|
| Ⅰ | Harbin | -27.1 | 30.7 | 62% | 98.8 | 17.7 | 76.2 |
| Ⅱ | Beijing | -9.9 | 33.5 | 61% | 100.0 | 20.2 | 85.7 |
| Ⅲ | Shanghai | -2.2 | 34.4 | 69% | 100.5 | 24.1 | 96.5 |
| Ⅳ | Guangzhou | 5.2 | 34.2 | 68% | 100.0 | 23.6 | 95.0 |
| Ⅴ | Kunming | 0.9 | 26.2 | 68% | 80.8 | 18.3 | 73.0 |
| Ⅵ | Lhasa | -7.6 | 24.1 | 38% | 65.3 | 11.0 | 52.4 |
| Ⅶ | Urumqi | -23.7 | 33.5 | 34% | 91.1 | 12.2 | 65.2 |
| Date | Wind Speed (m/s) | Leading Wind Direction | Outdoor and Indoor Temperature Difference (°C) | CO2 Concentration (ppm) | CO2 Concentration Difference (ppm) | |||
|---|---|---|---|---|---|---|---|---|
| Room A | Room B | Room A | Room B | |||||
| 1 | 2022/10/14 11:00-13:00 | 2.3 | WSW/SSW/WNW | 4.1 | 3.4 | 150 | 171 | 21 |
| 2 | 2022/10/15 0:00-2:00 | 2.3 | WSW/SSW | 4.6 | 3.5 | 47 | 49 | 2 |
| 3 | 2022/10/16 10:30-12:30 | 4.6 | WSW/SSW | 4.9 | 3.8 | 164 | 182 | 18 |
Disclaimer/Publisher’s Note: The statements, opinions and data contained in all publications are solely those of the individual author(s) and contributor(s) and not of MDPI and/or the editor(s). MDPI and/or the editor(s) disclaim responsibility for any injury to people or property resulting from any ideas, methods, instructions or products referred to in the content. |
© 2023 by the authors. Licensee MDPI, Basel, Switzerland. This article is an open access article distributed under the terms and conditions of the Creative Commons Attribution (CC BY) license (http://creativecommons.org/licenses/by/4.0/).


