Preprint
Article

Sensitivity of Eurasian Rear-Edge Birch Populations to Regional Climate and Local Hydrological Conditions

Altmetrics

Downloads

124

Views

27

Comments

0

A peer-reviewed article of this preprint also exists.

Submitted:

21 June 2023

Posted:

21 June 2023

You are already at the latest version

Alerts
Abstract
South rear-edge populations of widely distributed temperate and boreal tree species such as birches (Betula pubescens and B. pendula) are considered particularly vulnerable to climate warming, and at the same time they constitute genetic reservoirs of drought-adapted ecotypes. Here, we compared radial growth patterns and responses to climate, river or dam flows and a drought index of rear-edge (southernmost) populations (Toledo Mountains, central-southern Spain) with populations located in northern Spain of B. pubescens and B. pendula. Then, we per-formed a comparative analysis across Europe of B. pendula populations. The main climatic con-straint of birch growth was high summer water deficit, although the effect of local hydrological conditions was particularly important in rear-edge populations. We found declining growth trends in rear-edge stands since the early 21st century, related to decreasing water availability and increasing aridity. Our results also suggested distinct growth patterns and climate-growth associations of B. pendula across Europe that show how populations further south and in warmer locations were more sensitive to the drought. In conclusion, drought-induced growth decline can be exacerbated by local human land uses leading to reduced river inflow, thus endangering birch populations at their southern distribution limit. Protection of endangered rear-edge birch populations requires adequate management of local water resources.
Keywords: 
Subject: Biology and Life Sciences  -   Forestry

1. Introduction

Birch species (Betula L.) are deciduous, shade-intolerant shrubs and trees native to the northern hemisphere and widely distributed across boreal and temperate forests of Eurasia and North America [1]. Although birches have a wide ecological range, they are usually found in cool-wet sites with abundant soil water availability such as mires, river banks or in alpine or arctic treelines [2]. Birches play an important role as major pioneer species due to their efficient colonization of disturbed sites, increasing soil fertility and facilitating establishment of other species [3,4], and to high growth rates at young age [5,6]. So, birch species are valuable in natural or anthropogenic regeneration and contribute to stability of forest ecosystems [7]. Birches are also important for maintaining biodiversity by supporting a high number of invertebrate [8], bird [9] and lichen species [10]. Moreover, they yield high-quality timber that is highly suitable for plywood production [3]. Therefore, birches have an important ecological and economic value.
However, ongoing climate change is leading to warming temperatures and increasing frequency of extreme climate events such as prolonged dry spells and heatwaves [11]. This has amplified drought stress and related forest disturbances during the last decades [12]. As a consequence, forest dieback and growth decline events have been reported in multiple biomes [13,14]. These drought-induced dieback and mortality episodes have been also reported in birch forests of southeastern Siberia [15] or in the Himalayas [16]. Those studies emphasized that regional climate conditions caused the dieback but local topography amplified the negative impacts of soil moisture deficit [15,16]. However, we still lack adequate assessments of local vs. regional impacts on birch growth and decline.
In Europe, two main birch tree species are generally recognized: downy birch (Betula pubescens Ehrh.) and silver birch (Betula pendula Roth.), which have some of the largest geographical distribution area in the continent [1,17]. However, in many parts of Europe they are sympatric and can naturally hybridize, generating plants with intermediate morphological traits [18]. Both species are sensitive to water shortage in summer and snow regime in winter [19,20,21,22], as well as vulnerable to low temperatures in spring [23]. Nonetheless, there are some differences in their ecological requirements as B. pubescens is more suitable for cooler climates and wetter soils, whereas B. pendula has been shown to be more tolerant to drought and warmer temperature [24,25]. In addition, nonlinear responses to environmental and climatic gradients have been described in birches [21,26,27].
Birch populations in southern Spain and Morocco represent the southwestern distribution limit (rear edge) of both B. pubescens and B. pendula in Eurasia (Figure 1) [17]. These rear-edge populations are highly fragmented and show a strong genetic differentiation [28]. They mainly grow on particularly humid locations (e.g., near rivers, streams or mires) within Mediterranean environments subjected to pronounced summer drought [29]. Palaeoecological studies show that birch populations in central-southern Spain (Toledo Mountains) survived past dry periods, but showed a clear demise due to increasing livestock pressure [30,31]. According to these studies, ungulate densities and herbivory pressure reached unprecedented values during the last decades. The resulting heavy ungulate browsing, that menaces birch recruitment, along with wildfire occurrence and habitat fragmentation have been identified as major threats to those Spanish rear-edge birch populations [29,31].
Long-term isolation of rear-edge populations has often resulted in local adaptation, especially to tolerate drought and increase the species survival under increasingly dry and warm conditions but reducing plasticity thus limiting their adaptability to rapid environmental changes [32,33,34]. Rear-edge populations have been also shown to be particularly vulnerable to climate warming despite their genetic adaptations [35,36]. Indeed, pioneer birch species such as B. pendula are forecasted to be among the most endangered by climate warming during the 21st century in some regions of southern Europe where they may become locally extinct as their range shifts northwards or upwards according to species distribution models [37]. Therefore, analyses of the performance of rear-edge birch stands growth responses to increasing aridification and alteration of local hydrological conditions are needed to better understand their vulnerability compared to more central populations.
Here, we studied radial growth patterns of rear-edge B. pubescens and B. pendula populations located in central-southern Spain and we analyzed the differences with more central populations of the species at different spatial scales. For this purpose, we used a dendrochronological retrospective approach based on tree-ring width data, which is an efficient proxy used for the long-term assessment of responses of forests to environmental changes [38,39]. Our objectives were (i) to compare radial growth trends and growth responses to regional climate and local hydrological conditions between B. pubescens and B. pendula populations in central-southern Spain (Toledo Mountains) and northern Spain (Iberian System); and (ii) to address growth variability and climate-growth relationships of B. pendula across Europe. We expect that radial growth of rear-edge populations would be more limited by moisture than northern populations of Spain and Europe, and that local changes in water supply determined by site-specific hydrology would modulate or even surpass regional climate effects on tree growth of rear-edge populations.

2. Materials and Methods

2.1. Study sites and species

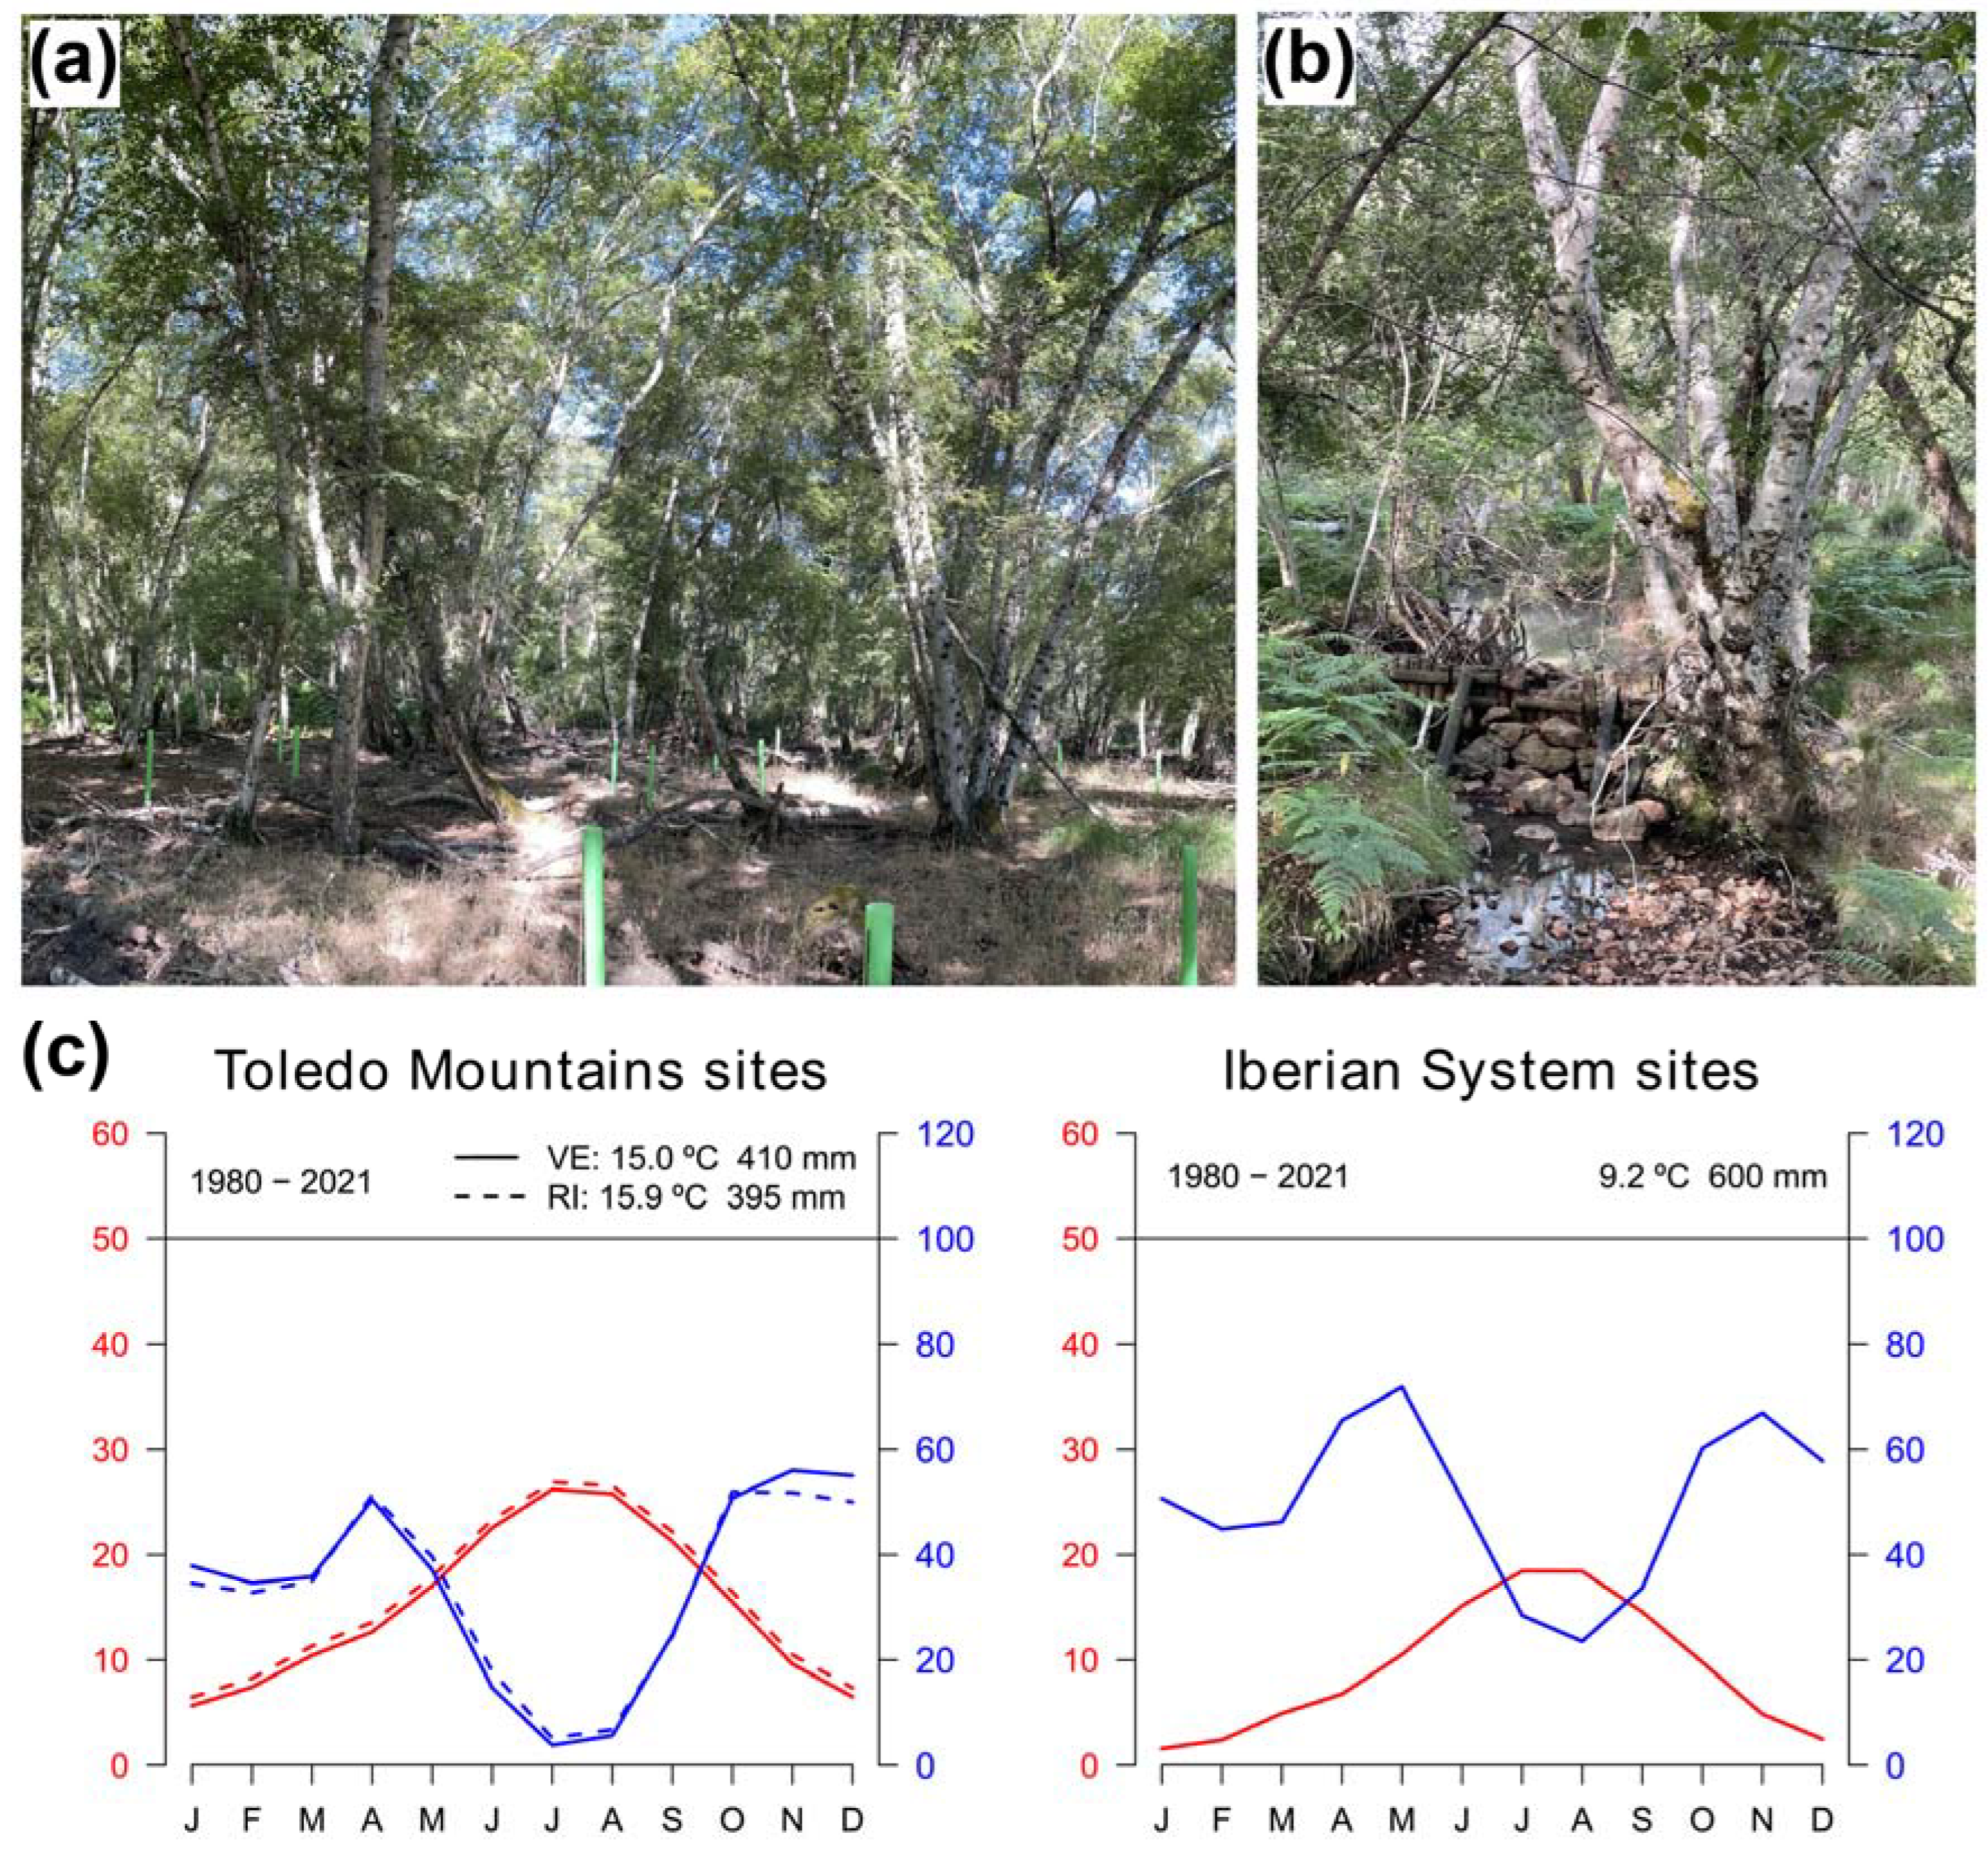
Firstly, we compared Spanish birch populations located in the Toledo Mountains and the Iberian System where rear-edge and more central populations, respectively, of both species are found (Figure 1). The Toledo Mountains (“Montes de Toledo”) study area is located central-southern Spain, where several rear-edge birch populations are located [29]. There, we sampled two birch populations at the southern distribution limit of the species inhabiting sites with contrasting ecological conditions (Figure 1, Table 1). La Ventilla site is located within the “Cabañeros” National Park and the downy birch (Betula pubescens Ehrh. subsp. celtiberica (Rothm. & Vasc.) Rivas Mart.) trees grow over waterlogged soils in a mire (Figure A1a), close to the Bullaque river. This is the only population of this species in the study area which, according to palaeoecological data, was more widely distributed in the past [29,40]. The Riofrío site is found along the banks of a stream (Figure A1b), which is a tributary of the Bullaque river. Here, riparian forests are formed along a ca. 2-km long stream and silver birch (B. pendula Roth. subsp. fontqueri (Roth.) G. Moreno & Peinado) is restricted to the river bank. Understory vegetation of both stands included Pteridium aquilinum, Ruscus aculeatus, Erica arborea, Cistus spp., Pistacia lentiscus and Pistacia terebinthus, among others. The study area in the Iberian System is found in northern Spain (Razoncillo valley), where populations are found within or near a continuous species distribution (Figure 1) [17]. There, we sampled one B. pubescens population located in a humid rocky area. Among the accompanying species we found Fagus sylvatica and Salix spp., and the understory was dominated by Vaccinium myrtillus, Calluna vulgaris and Erica spp. Finally, information on a B. pendula population in the Iberian System (ES01 site) was obtained from the GenTree Database [41], that was located very close to the previous one (Table 1; Figure 1). Both populations are located close to a tributary stream of the Revinuesa river. It should be noted that the ES01 chronology finishes in 2015, although for the sake of simplicity the period of analysis of the Spanish birch populations will be referred to as 1980-2021.
Secondly, we compiled tree-ring width data of B. pendula across Europe merging our own field-data and the GenTree Database [41]. The authors of this dataset provided induvial tree-ring width data, along with tree- and site-level characteristics. In total, growth variability and climate responses of 23 B. pendula populations were compared across a wide environmental gradient throughout Europe (Figure 1). Information on site and tree characteristics can be found in Table A1, while methodological issues are specified in Martínez-Sancho et al. [41].

2.2. Climate and river flow data

Long-term and homogeneous records of climatic data of each study site were retrieved from the 0.1º gridded E-OBS v 27.0e dataset [43]. To characterize drought severity, we calculated the Standardized Precipitation-Evapotranspiration Index (SPEI) for the period 1980 – 2021. The SPEI is a standardized multi-scalar drought index based on the accumulated water deficit, in which negative values indicate a negative cumulative water balance [44]. SPEI values from January to December at different time-scales were calculated using the package SPEI [45] in R software [46].
On the one hand, study sites in Spain showed contrasting climatic regimes (Figure A1c). The climate in the Toledo Mountains is Mediterranean with a marked period of summer drought and spring and autumn rainfall, and in the Iberian System is continental Mediterranean with cold winters. The mean annual temperature during the 1980 – 2021 period was higher in the Toledo Mountains, with slight differences between La Ventilla (15.0º C) and Riofrío (15.9º C), than in the study sites of the Iberian System (9.2º C). The coldest month was January and the warmest month was July (Figure A1c). The mean annual precipitation was 410 mm in La Ventilla, 395 mm in Riofrío and 600 mm in the Iberian System study sites. The driest months were July-August, whereas October-November and April-May were the wettest months in southern and northern sites, respectively (Figure A1c).
On the other hand, the mean annual temperature among the different populations of B. pendula analyzed in the European assessment ranges from 0.8º C in northern Finland (FI19) to 15.9º C in central-southern Spain (ES03, Riofrío). Total annual precipitation had minimum values at Riofrío with 415 mm and maximum values at Switzerland study sites with almost 1500 mm. Meanwhile, annual water balance was highest at southern United Kingdom (GB13) and Switzerland and lowest at the rear-edge population Riofrío (Table A1).
To characterize local hydrological conditions, we retrieved series of monthly flow data of water streams near the Spanish study sites from the Spanish National Flow and Discharge Database (“Centro de Estudios y Experimentación de Obras Públicas”, data available at the webpage https://ceh.cedex.es). For the Toledo Mountains sites, we obtained data of the Bullaque river (Luciana, 38º 35’ 28” N, 4º 10’ 16” W, 536 m a.s.l.) covering the period 1965 – 2019, and the for the Iberian System sites we got data of Revinuesa river (Vinuesa, 41º 54’ 47” N, 2º 45’ 23” W, 1090 m a.s.l.) for the period 1962-2019. Additionally, reservoir data, outflows and inflows “Torre de Abraham” dam (39º 22’ 28” N, 4º 14’ 44” W, 700 m a.s.l.), close to the Toledo Mountains sites, for the period 1978 – 2019. According to these data, Bullaque river flow and “Torre de Abraham” dam inflows peak in January and February and reach minimum values from July to October. The pattern of Revinuesa river flow was similar although maximum values were delayed (March – April).
In La Ventilla, the mires are progressively drying due to the water extraction from the phreatic zone for agriculture in nearby intensively irrigated crop fields. Soil water extraction intensified in the 2010s and has led to a progressive decline of the birch population reducing growth and increasing mortality rates [47].

2.3. Field sampling and dendrochronological methods

In total, 81 birch trees (33 B. pubescens and 48 B. pendula) were sampled in the Spanish sites. Two cores were extracted at 1.3 m height from each tree, perpendicular to the maximum slope, using 5 mm Pressler increment borers (Haglöf, Sweden) for dendrochronological analysis. Often birch trees were multi-stemmed, so that the trunk with the largest DBH and most vertical was selected for core extraction. Cores were air-dried, glued onto wooden mounts and sanded until tree rings were clearly visible [38]. All samples were visually cross-dated, and tree-ring width (TRW) was measured with a 0.001 resolution using scanned images (resolution 2400 dpi) and the CooRecorder and CDendro softwares [48]. The quality of cross-dating was checked using the COFECHA software, which calculates moving correlations between individual series of ring-width values and the mean sites chronologies [49].
The individual tree TRW series were transformed to basal area increment (BAI) series because it is a two-dimensional measure of stem increment in area that is known to better reflect growth of the whole tree than the one-dimensional ring width [50]. BAI series were calculated using the following equation and assuming concentric rings:
BAI = π (R2t − R2 t −1),
where R2t and R2 t −1 are the radii corresponding to the current (t) and prior (t – 1) years, respectively.
All individual TRW chronologies were detrended using a spline of two- third of the growth series length and a 0.5 response cut off. A bi- weight robust mean was used to calculate mean site standardized chronologies of ring-width indices (RWI). We also calculated several dendrochronological statistics to characterize tree-ring width data [38]: the mean and first-order autocorrelation (AC) of TRW data, the mean inter-series correlation (Rbar) of individual series of ring-width indices, the mean sensitivity (MS) of standardized ring-width indices (a measure of relative change in width between consecutive rings),and the Expressed Population Signal (EPS) of ring-width indices which measures the coherence and replication of site chronologies.

2.4. Statistical analyses

We used the Kruskal Wallis test to evaluate differences in DBH, tree age and mean TRW between Spanish sites within each species. Breakpoint analysis was applied to detect structural changes in BAI series corresponding to the onset of growth decline. Then, trends in radial growth before and after the break point dates were assessed using the Kendall Preprints 77250 i001 statistic. Climate – growth relationships were assessed by calculating bootstrapped correlations between site standardized chronologies (RWI) and monthly mean temperature and precipitation sums for the 1980 – 2021 period. The window of analysis spanned from previous September to September of the year of tree-ring formation. We also calculated correlations between RWIs and SPEI, which was calculated at 1-, 3-, 6-, 9- and 12-month time scales, to quantify the relationship between radial growth variability and water deficit. To detect potential instabilities between growth indices and selected climatic data, we computed moving bootstrapped correlations considering moving 20-year long intervals lagged by one year. Pearson correlations were calculated to evaluate the statistical relationship between site RWI series and river flow and reservoir dam data. The aggregate effect of regional climate and local hydrological conditions on radial growth was addressed by means of linear mixed effects models (LMM; [51]. One model was adjusted for each site and species including tree-level RWI as response variables and SPEI, temperature, precipitation and river flow (or dam inflow) series as fixed effects. Selected variables were those showing significant correlations in the previous analysis. The presence of multicollinearity among predictors was tested using variance inflation factors (VIF) discarding variables with VIF > 3.
We used generalized additive mixed models (GAMM; [52]) to describe growth responses to climate of B. pendula populations across Europe. Predictors were included as smooth functions of temperature, precipitation and drought index (SPEI) using thin-plate regressions splines with a maximum of four degrees of freedom to allow for nonlinear responses [53]. We also included site as a random effect and a first- order autocorrelation structure. The selection of the climatic variables was based on minimizing the Akaike Information Criterion (AIC; [54]). We also calculated the marginal (R2m) and conditional (R2c) R2 values which account for the effects of fixed and fixed plus random factors, respectively.
To evaluate the relationships among European B. pendula RWI chronologies and compared them with the rear-edge population in central-southern Spain, we calculated a Principal Component Analysis (PCA) on the covariance matrix considering the common and best-replicated period 1985–2015. We kept the first (PC1) and second (PC2) principal com- ponents because they individually accounted for at least 15% of variance. We also performed a PCA on the covariance matrix of site RWI – climate correlations to assess relationships in the growth response to temperature and precipitation among different European populations. Finally, we calculated correlations of PCA scores and loadings with geographical and climatic variables to decipher continental-scale patterns of B. pendula growth and climate sensitivity.
All statistical analyses were performed within the R software [46]. Processing of radial growth series and dendrochronological statistics were calculated using the R package dplR [55]. Trends in temporal series and break points analysis were assessed with the R packages Kendall [56] and strucchange [57], respectively. Relationships between radial growth series and climate were assessed using the R package treeclim [58]. We used lme4 and lmerTest packages to fit LMMs [59,60]. The GAMMs were fitted using the R package mgvc [61].

3. Results

3.1. Growth patterns of birch populations in southern and northern Spain

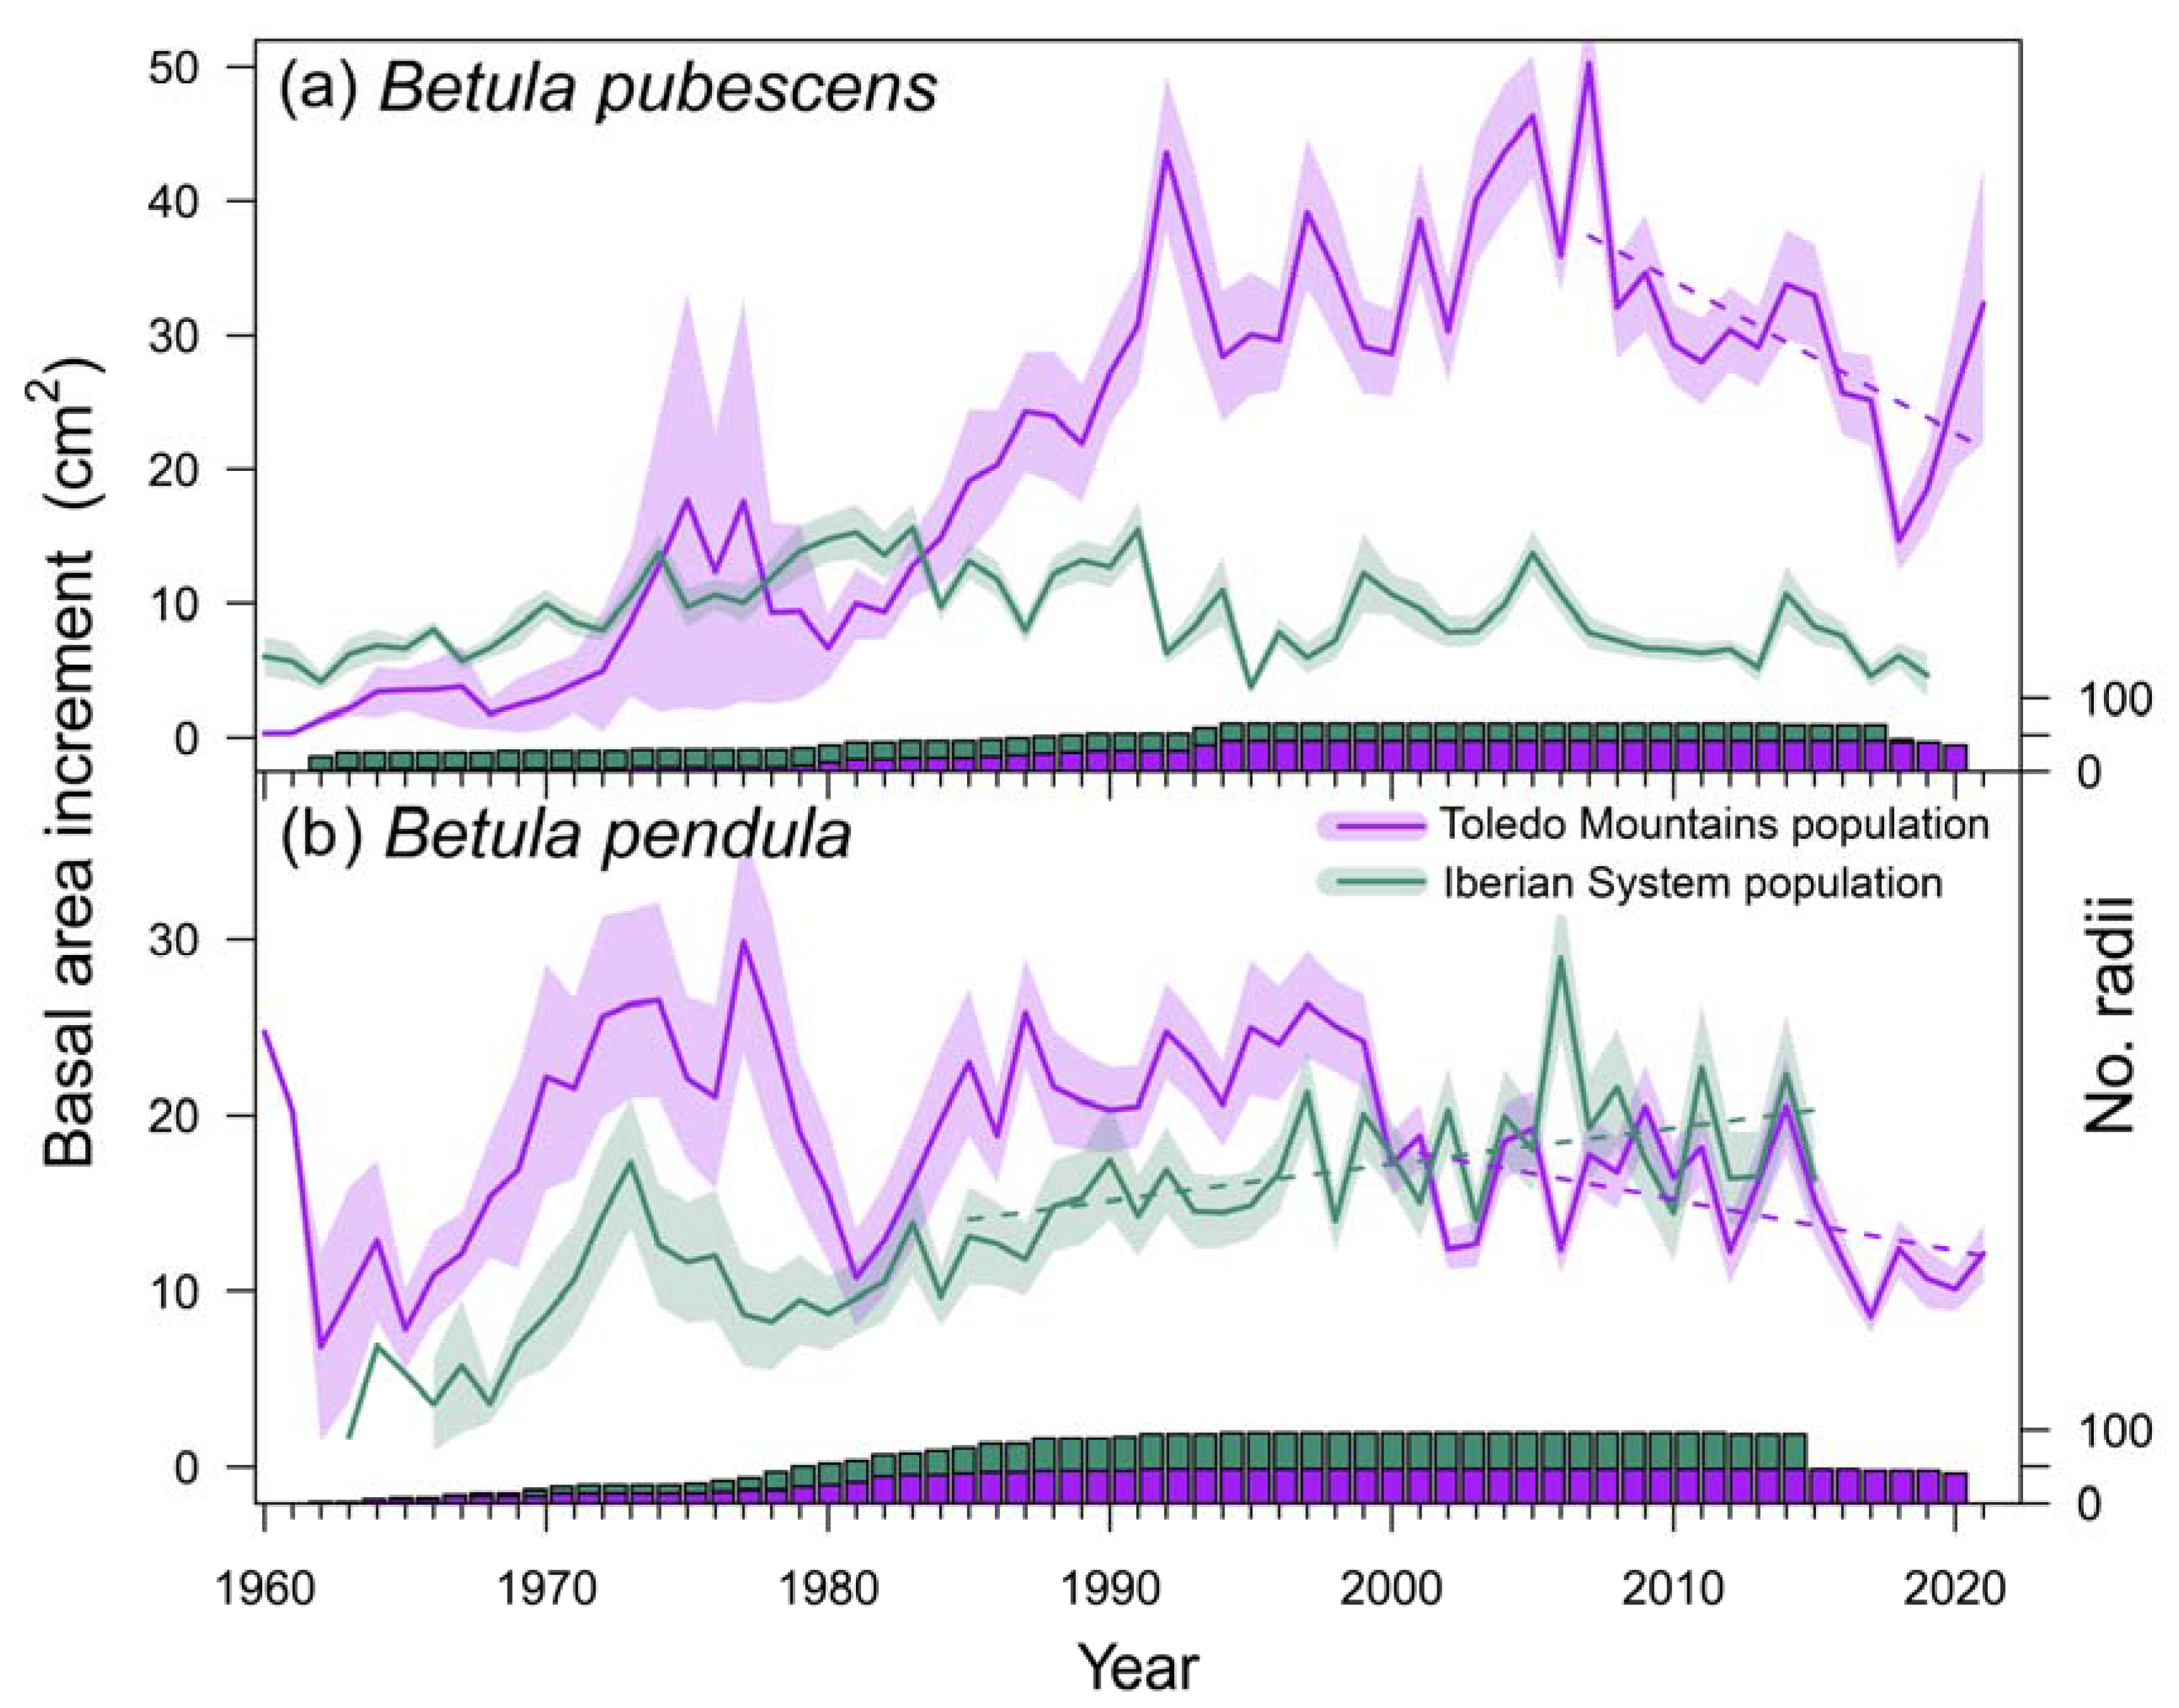
The mean diameter of B. pubescens trees did not differ between Spanish study sites (χ2 = 16.757, p = 0.159), but B. pendula trees showed higher DBH at the southern population than in the northern population (χ2 = 18.519, p < 0.001) (Table 1). Tree age was significantly higher at Razoncillo site compared to La Ventilla (χ2 = 22.129, p = 0.036), but no differences were found between B. pendula populations (χ2 = 3.551, p = 0.159). The oldest sampled individuals were around 90 years old at the northern stand of B. pubescens. Mean growth rates (TRW) were higher in La Ventilla than in Razoncillo (χ2 = 23.541, p = 0.023) (Figure 2), and similar between Riofrío and ES01 (χ2 = 0.146, p = 0.703). We found break points in BAI series corresponding to 2007 (both B. pubescens stands), 2001 (Riofrío), and 1984 (ES01). Before each break point date birch trees of every site showed a positive growth trend (La Ventilla: Preprints 77250 i001 = 0.762, p < 0.001; Razoncillo: Preprints 77250 i001 = 0.216, p = 0.033; Riofrío: Preprints 77250 i001 = 0.267, p = 0.016; ES01: Preprints 77250 i001 = 0.446, p = 0.004). Afterwards, growth trends became negative at the southern populations with a stepper slope in La Ventilla (Preprints 77250 i001 = -0.513, p = 0.017) than in Riofrío (Preprints 77250 i001 = -0.368, p = 0.025), whereas non-significant and positive trends were found at the northern populations (Razoncillo: Preprints 77250 i001 = -0.259, p = 0.199; ES01: Preprints 77250 i001 = 0.376, p = 0.003) (Figure 2).

3.2. Effect of climate and local hydrlogy on growth of Spanish birch stands

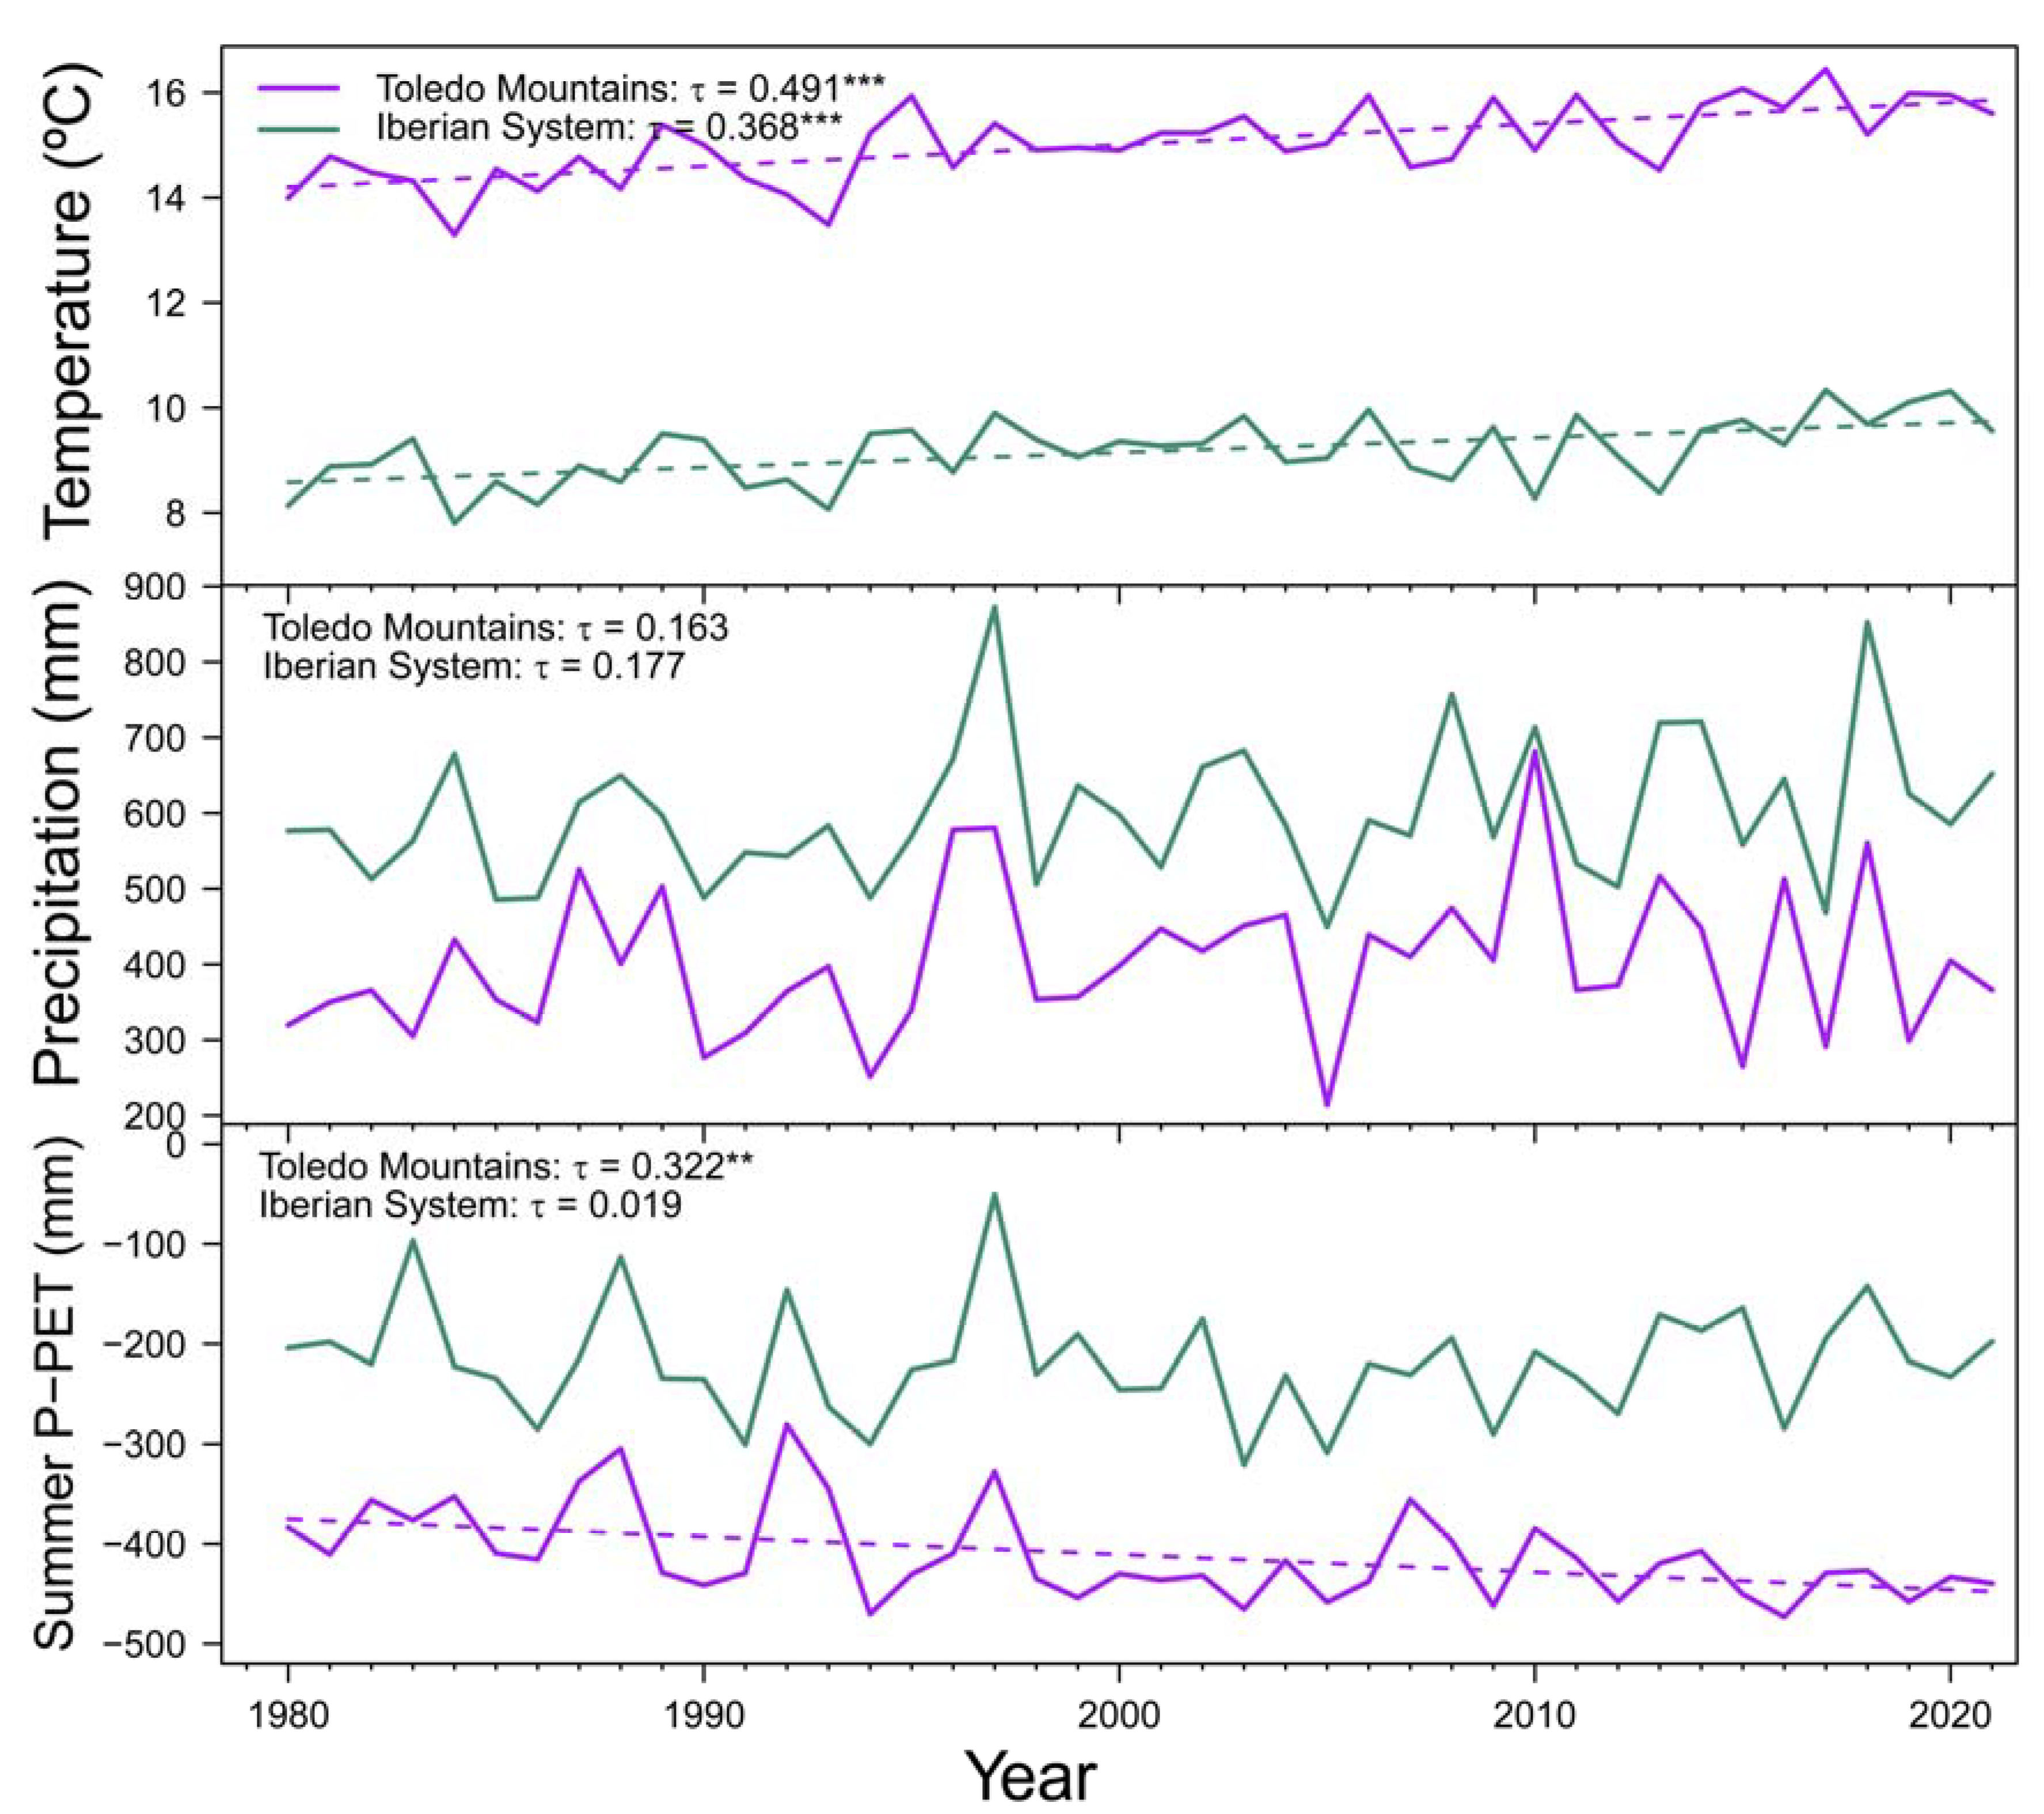
Mean annual temperature showed positive trends in both Spanish study sites during the period 1980-2021, while no significant trends were found for mean annual precipitation. Summer water balance (P-PET) significantly decreased at Toledo Mountains, but the same pattern was not detected in the Iberian System (Figure A2). These results are in line with the negative trend of the annual flow of the Bullaque river found for the period 1980-2019 (Preprints 77250 i001 = -0.275, p = 0.011), which is not found in Revinuesa river (Preprints 77250 i001 = -0.149, p = 0.114).
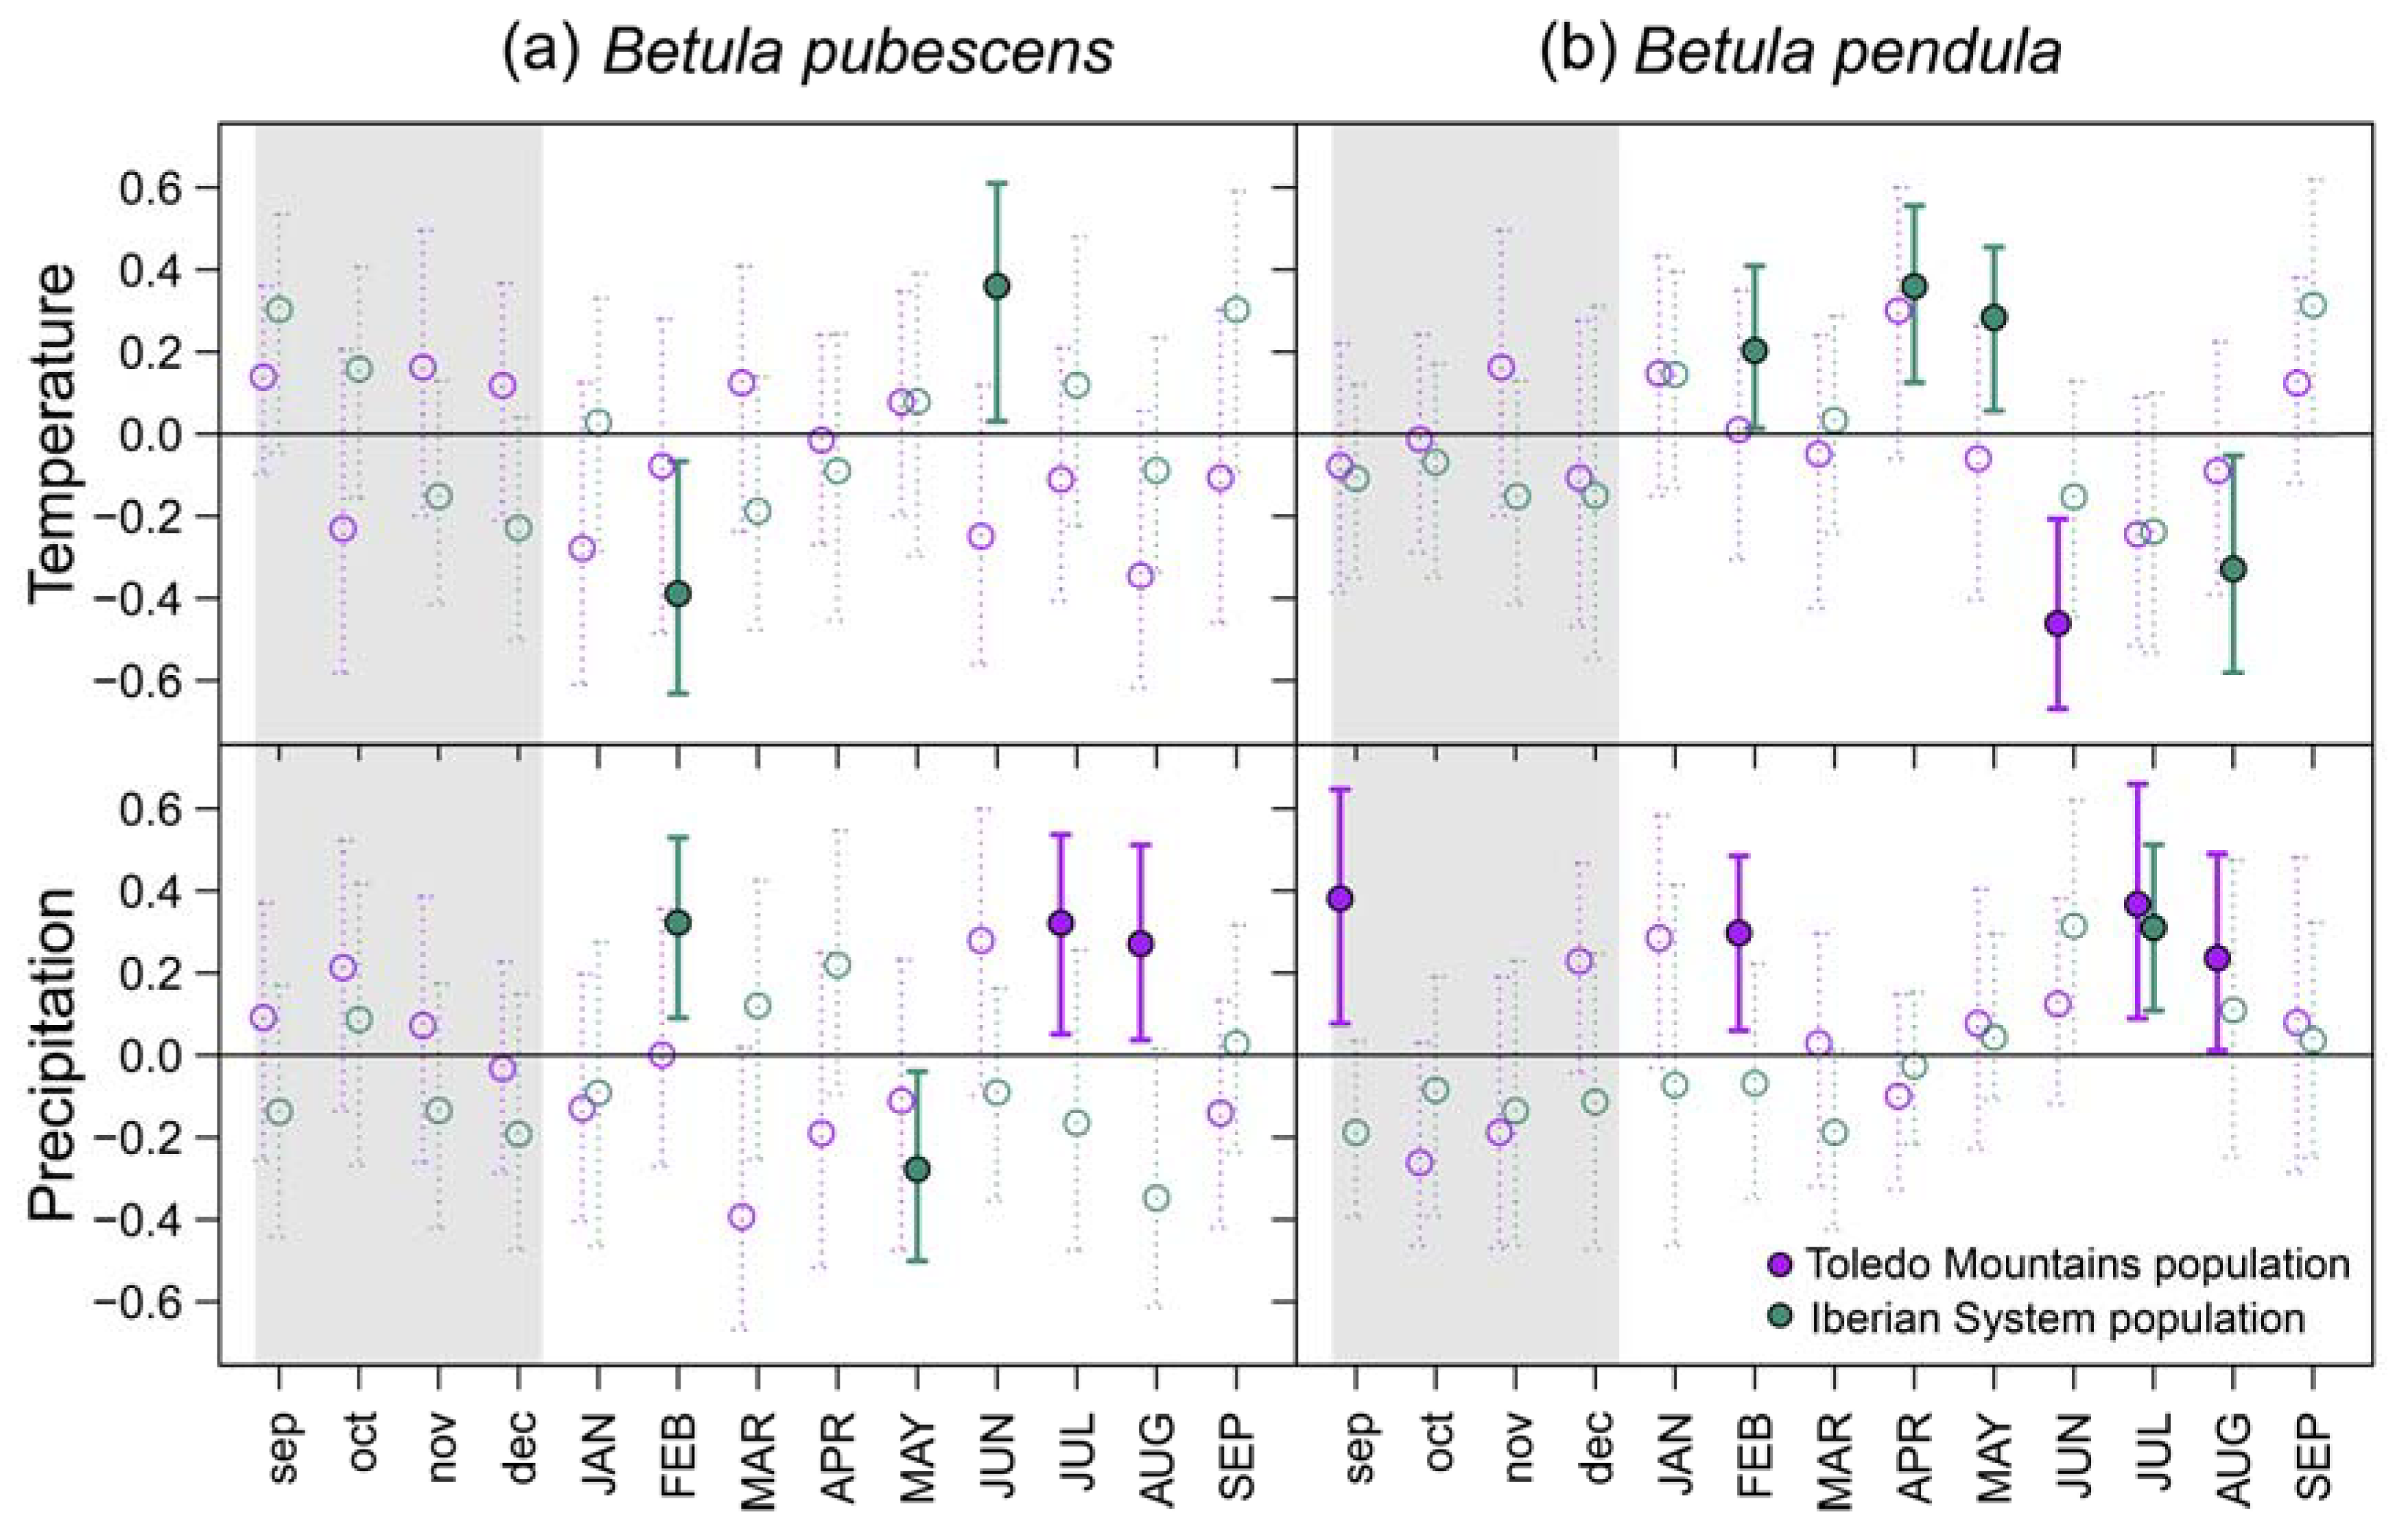
Bootstrapped correlations showed that associations between site-level RWI chronologies and temperature were more common in northern populations of both birch species, whereas significant relationships with precipitation were more frequent in southern rear-edge birch populations (Figure 3). In the Iberian System, birch trees positively responded to April and May (B. pendula) and June (B. pubescens) mean temperature. Opposite patterns were found between species at the northern locations regarding the response to February temperature. Negative correlations with summer temperature were found in B. pendula populations (June at Riofrío and August at ES01). Rear-edge populations of both species positively responded to summer (July and August) precipitation, and we also found positive correlations in Riofrío with previous September and February precipitation (Figure 3).
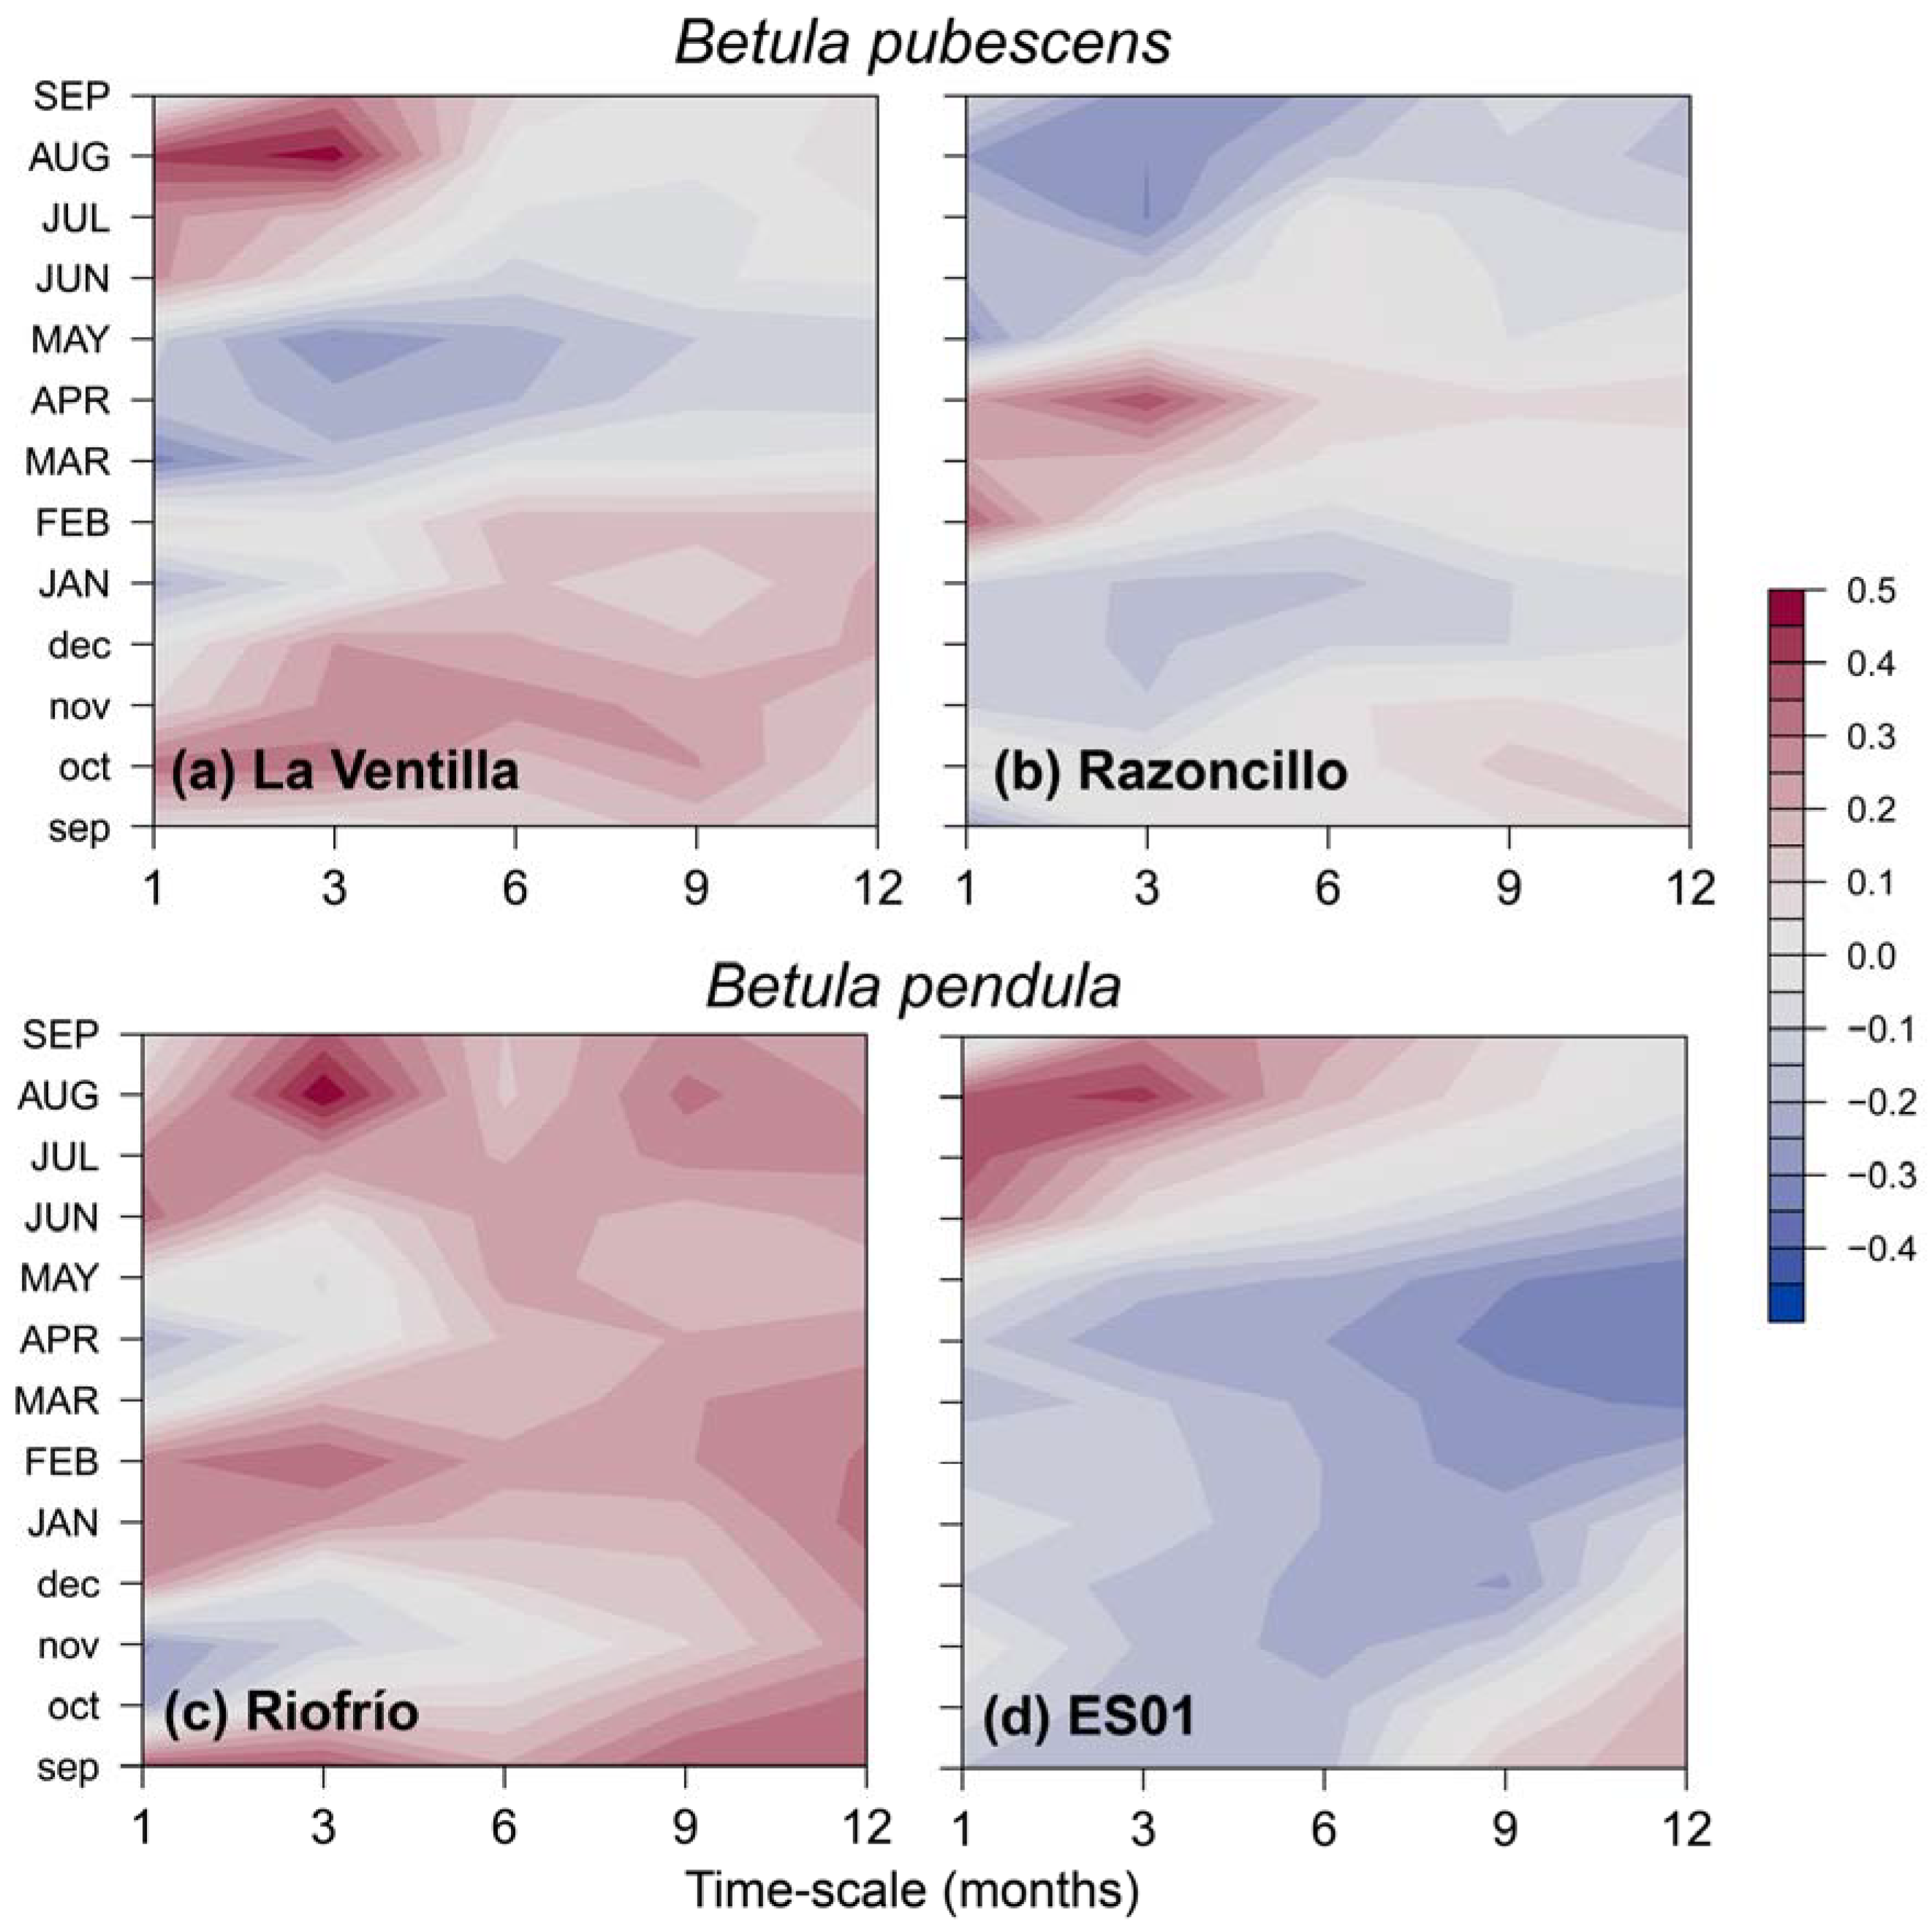
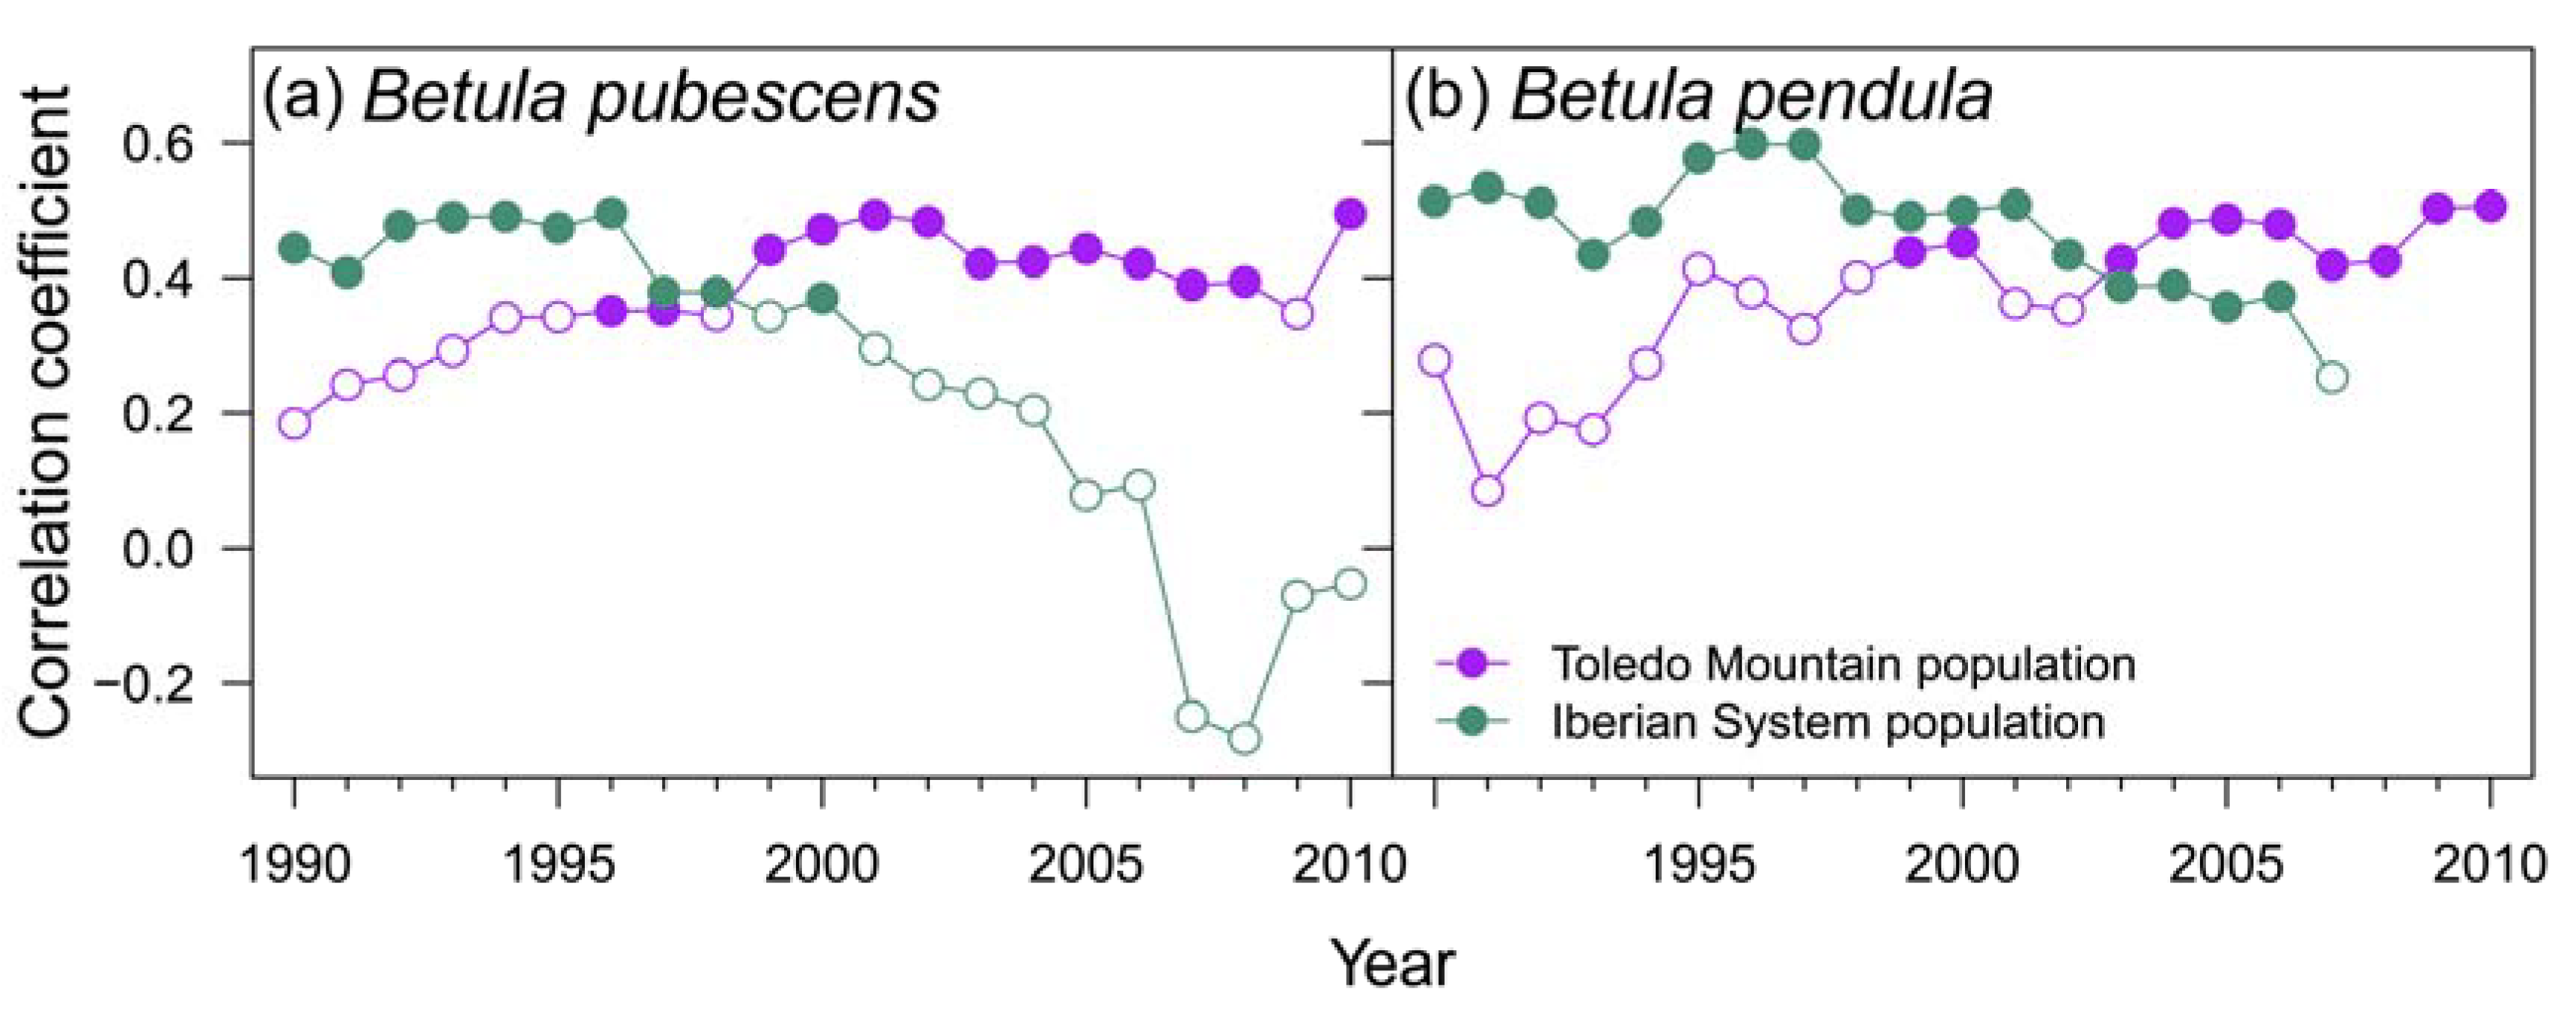
These results are consistent with the correlations found with the SPEI drought index (Figure A3). The rear-edge populations of the two birch species (La Ventilla and Riofrío) and the northern population of B. pendula (ES01) showed the strongest correlation with SPEI3 August, that is, accumulated water deficit between June and August. Meanwhile, RWI of the northern stand of B. pubescens (Razonzillo) showed the strongest association with SPEI3 April (February to April accumulated water deficit) (Figure A3). However, the correlation with water deficit was nonstationary in three out of the four populations studied as the effect of water deficit changed over time (Figure 4). Correlations between RWI and SPEI3 August increased over time in read-edge populations of Toledo Mountains becoming significant since the mid and late 1990s. In contrast, B. pubescens growth in Razoncillo site had a decreasing response to moisture conditions in spring. The effect of summer water deficit on B. pendula growth in the Iberian System remained more or less constant (Figure 4).
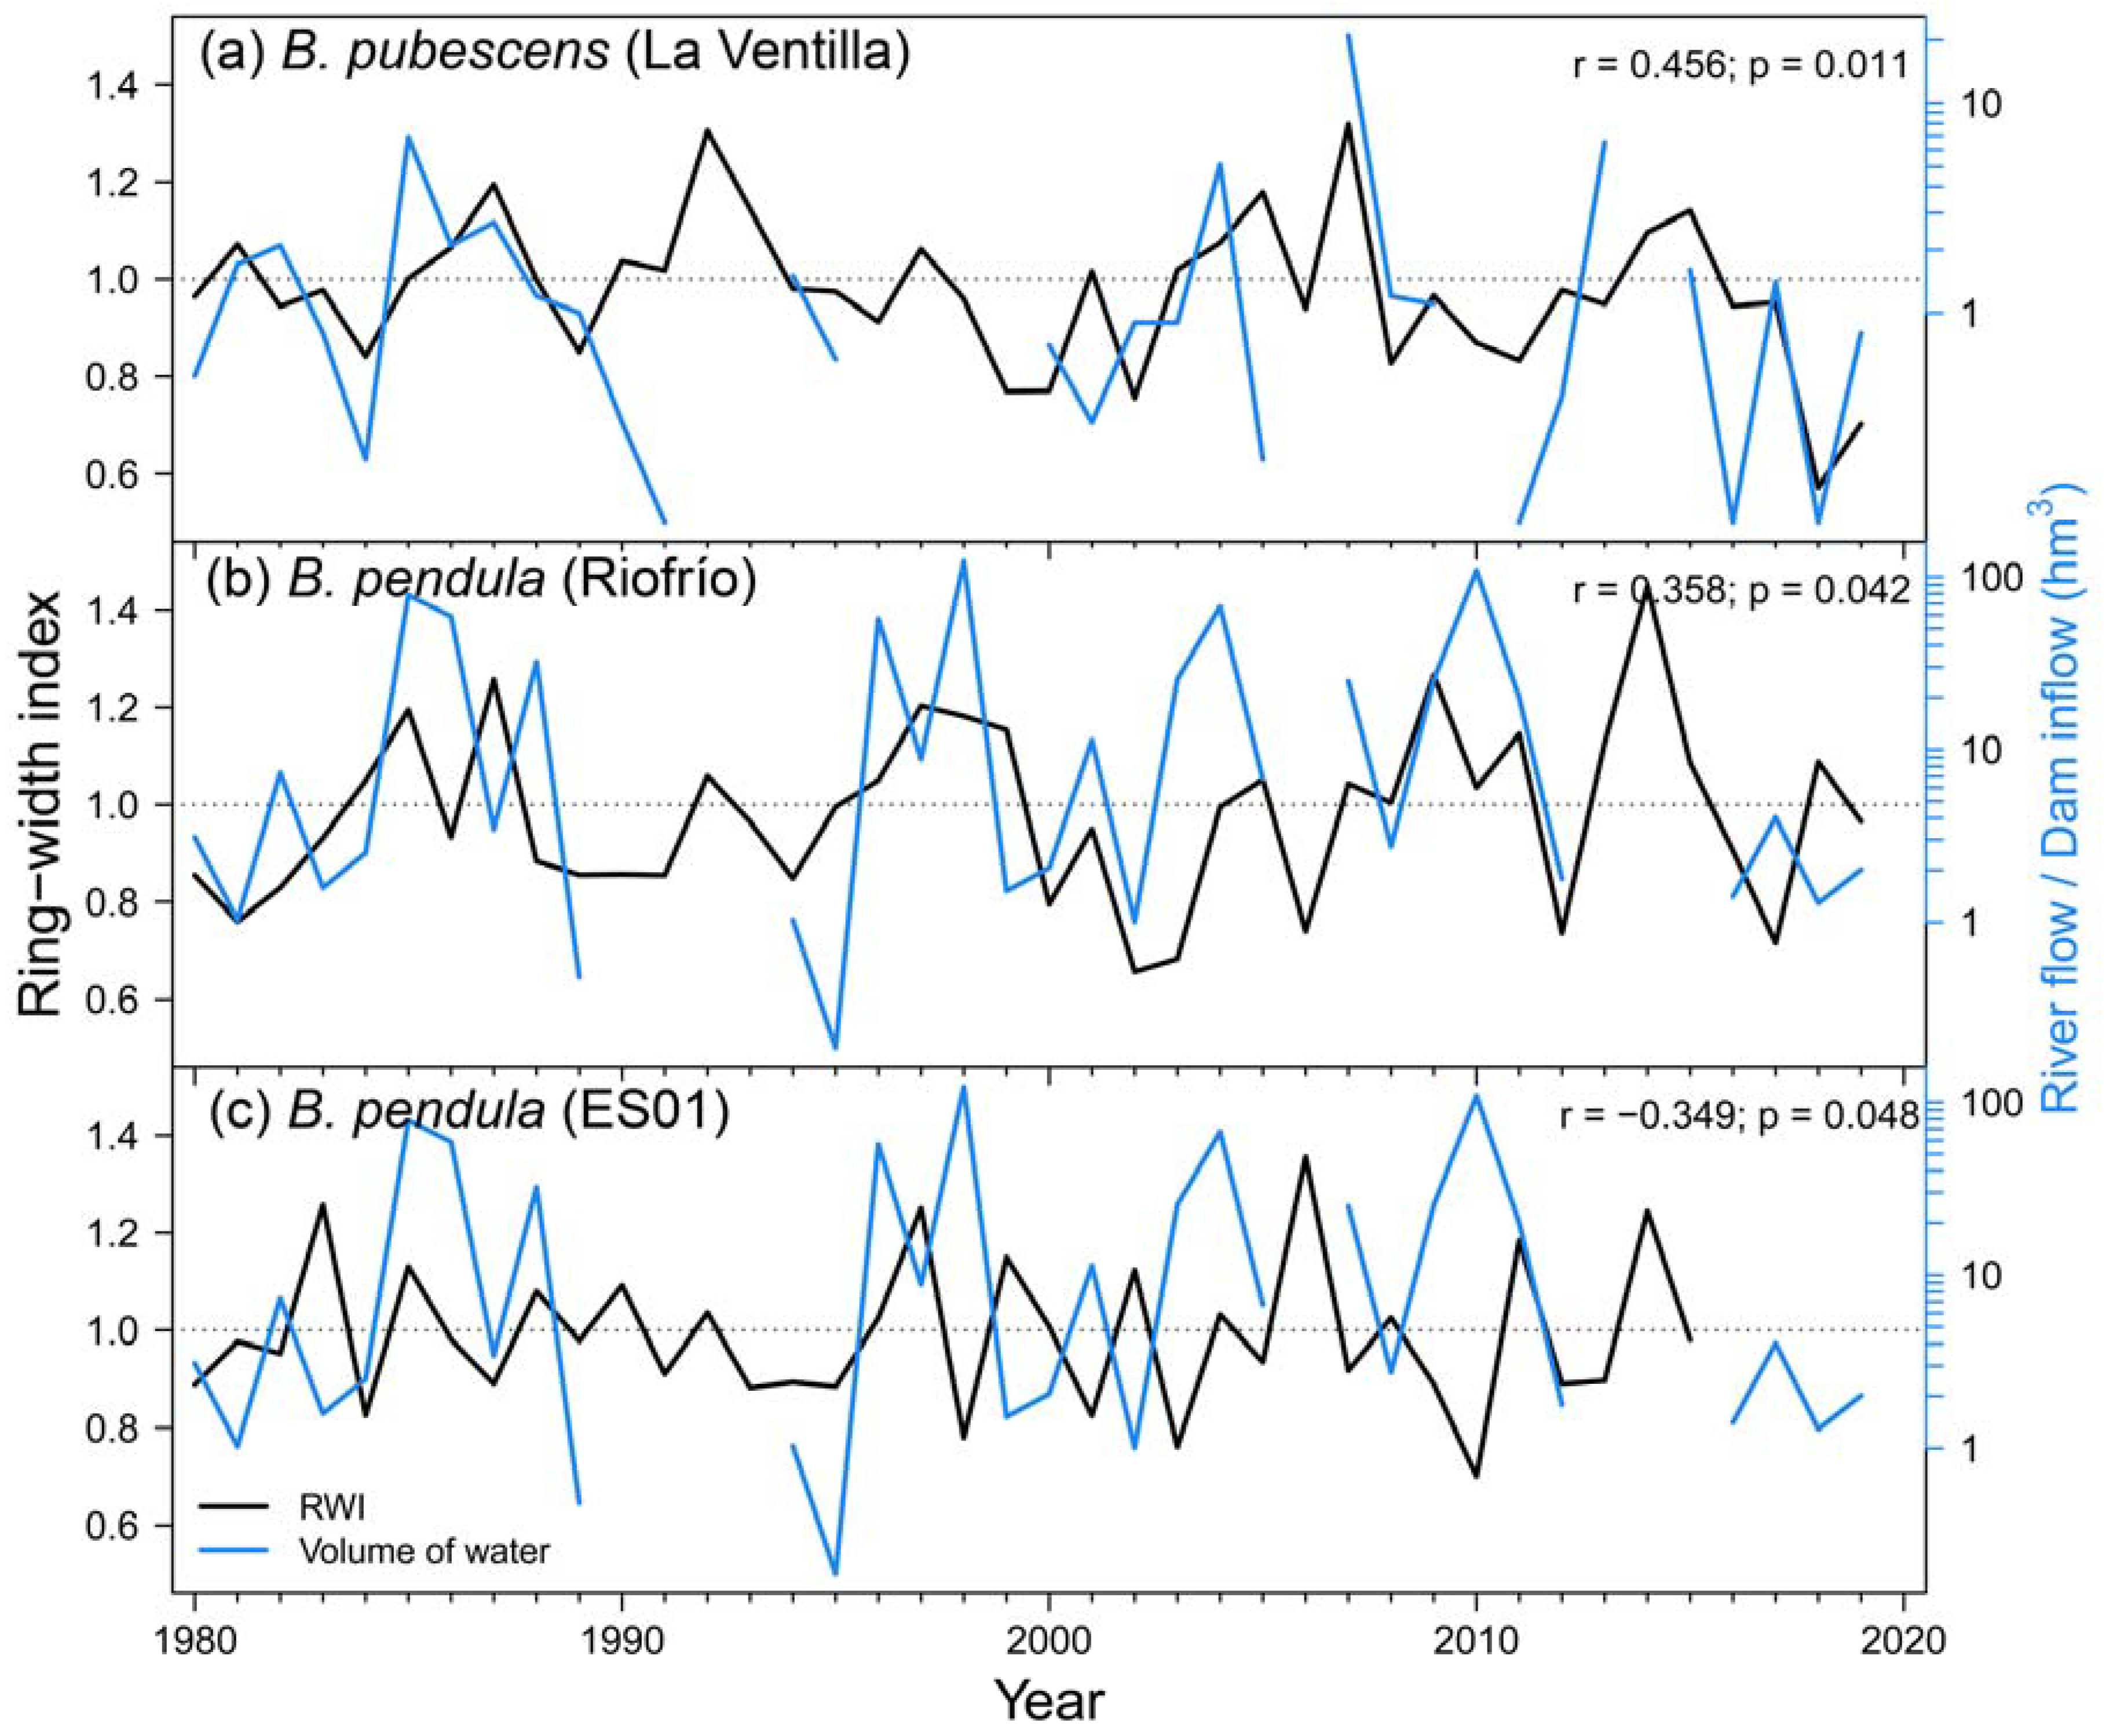
Regarding local hydrology, we found significant correlations between radial growth and river flow data. RWI of B. pubescens at La Ventilla site was positively correlated with the water inflow to the “Torre de Abraham” reservoir from previous November (Figure A4a), which is located upstream the study site and it is likely related to the feeding of the aquifer on which this stand is located. This correlation reaches higher levels of significance if only the period 2000-2019 is considered (r = 0.563; p = 0.006). B. pendula growth at Riofrío site showed a positive response to Bullaque river flow during February (Figure A4b). B. pendula RWI in the Iberian System was negatively correlated with flow of Revinuesa river during previous September (Figure A4c). We found no significant correlations between growth variability and river flow in B. pubescens stand of Razoncillo.
According to the results of the LMMs, the effect of local hydrological conditions was more important that the regional climate in modulating growth variability in the B. pubescens stand of La Ventilla, and of similar importance for the B. pendula stand of Riofrío (Table 2). In ES01, the effect of climate on RWI exceeded that of the river. Among the climatic variables, rear-edge populations showed stronger impact of summer water deficit, and northern populations of the Iberian System were more sensitive to temperature (Table 2).

3.2. Assessment of silver birch growth variability across Europe

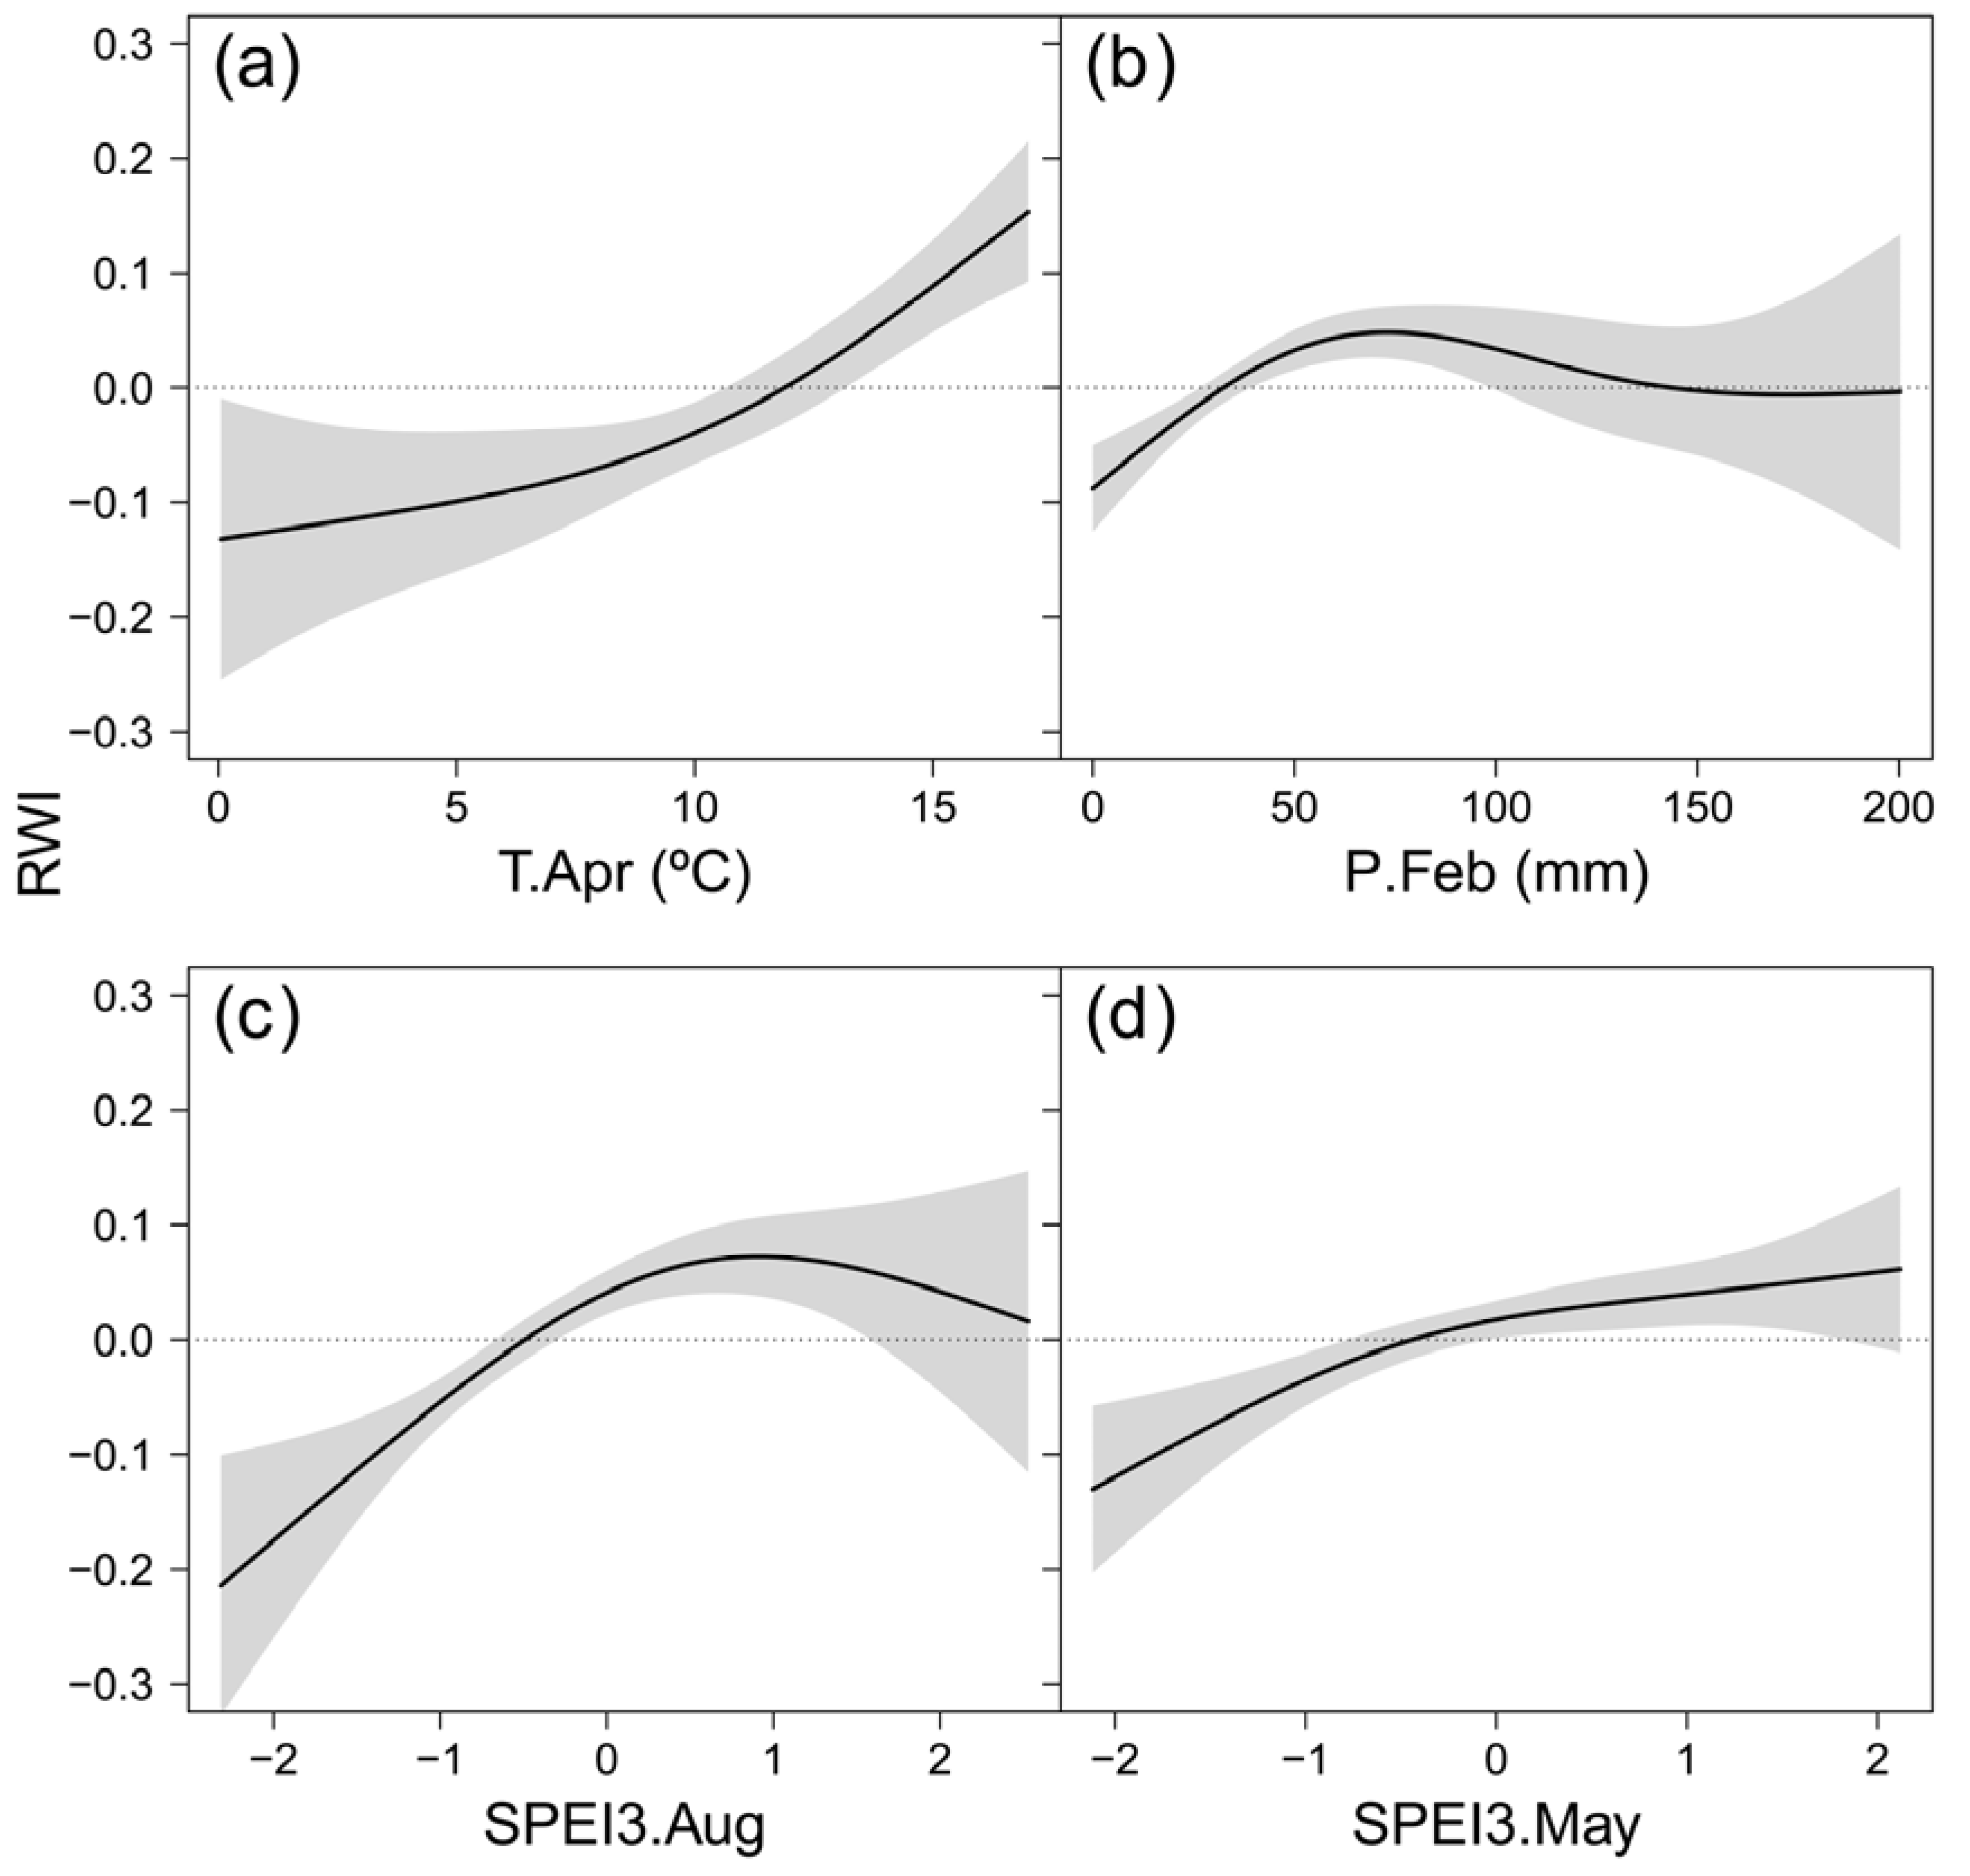
The GAMM characterizing the climatic impact on growth variability of B. pendula across Europe included similar variables to those highlighted by the correlation analysis (Table 3). The effective degrees of freedom ranged 2.2-2.8, indicating response curves with two inflection points (Figure 5). The nonlinear responses indicated dependence of the responses on local climates. Summer moisture availability (SPEI3 August) had the strongest effect on RWI (Table 3). The response curve formed an arc, thus suggesting radial growth sensitivity to water deficit during June-August, which decreased and disappeared as summer moisture availability increased (Figure 5c). April temperature showed the second strongest effect on RWI, and the response curve indicated explicit sensitivity to low temperature (Temp. April < 12.5 ºC) (Figure 5a). Precipitation during February limited RWI at values below 100 mm per month, while the effect of higher precipitation was not significant (Figure 5b). Finally, the response to spring moisture availability (SPEI3 May) showed a positive trend (Figure 5d), pointing out to the relevance of weather conditions during the early growing season for B. pendula radial growth.
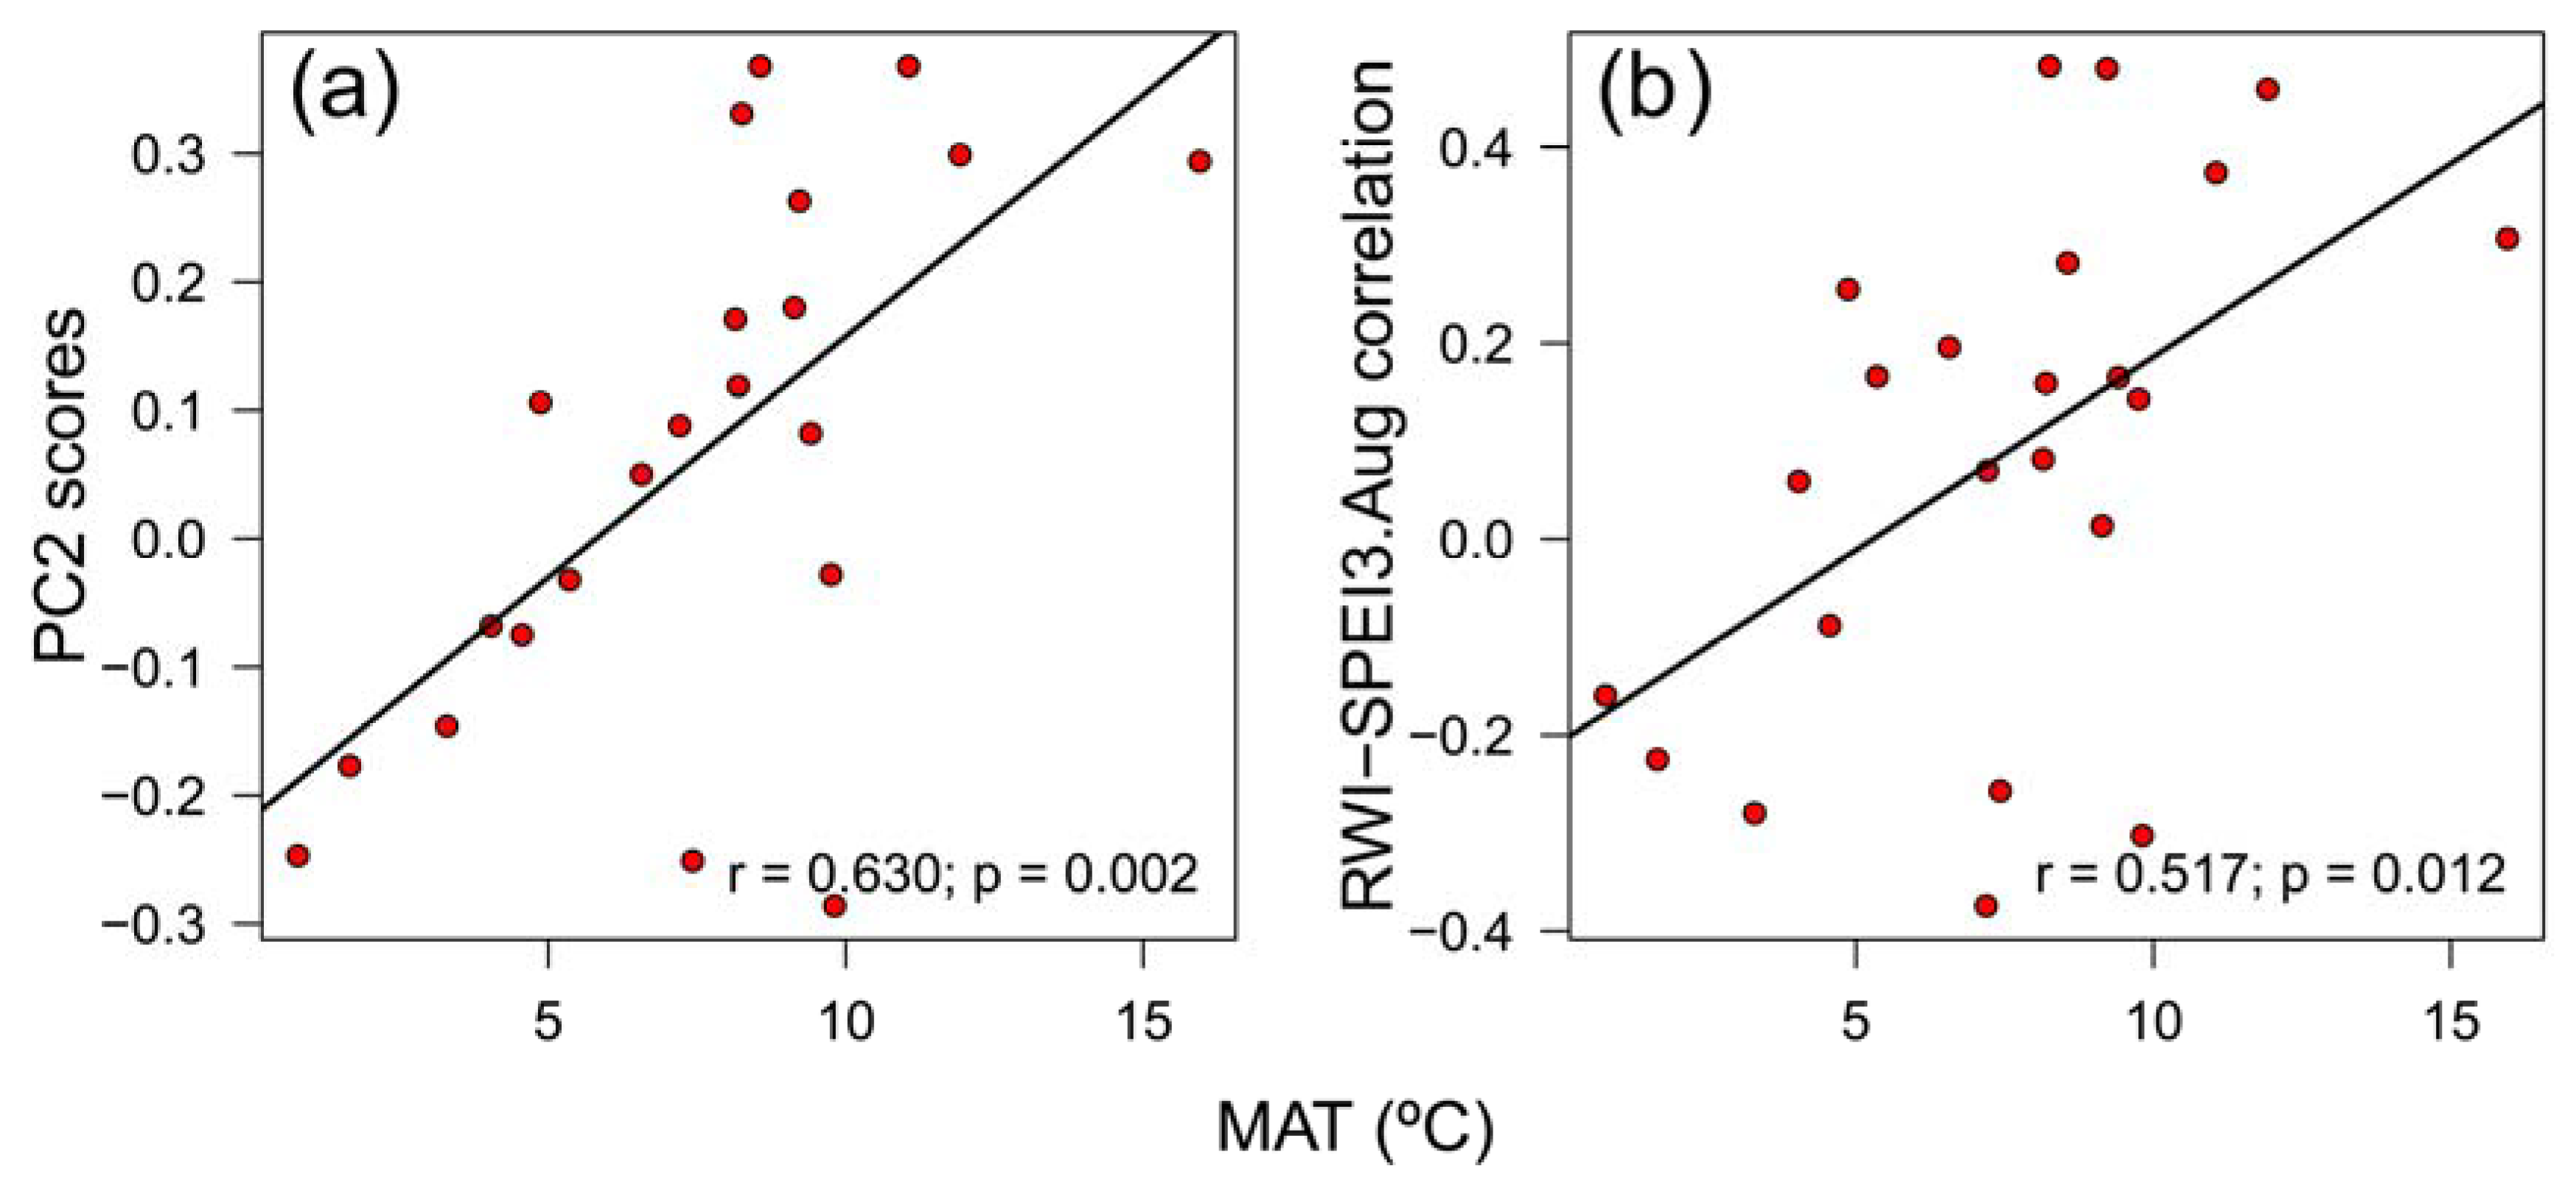
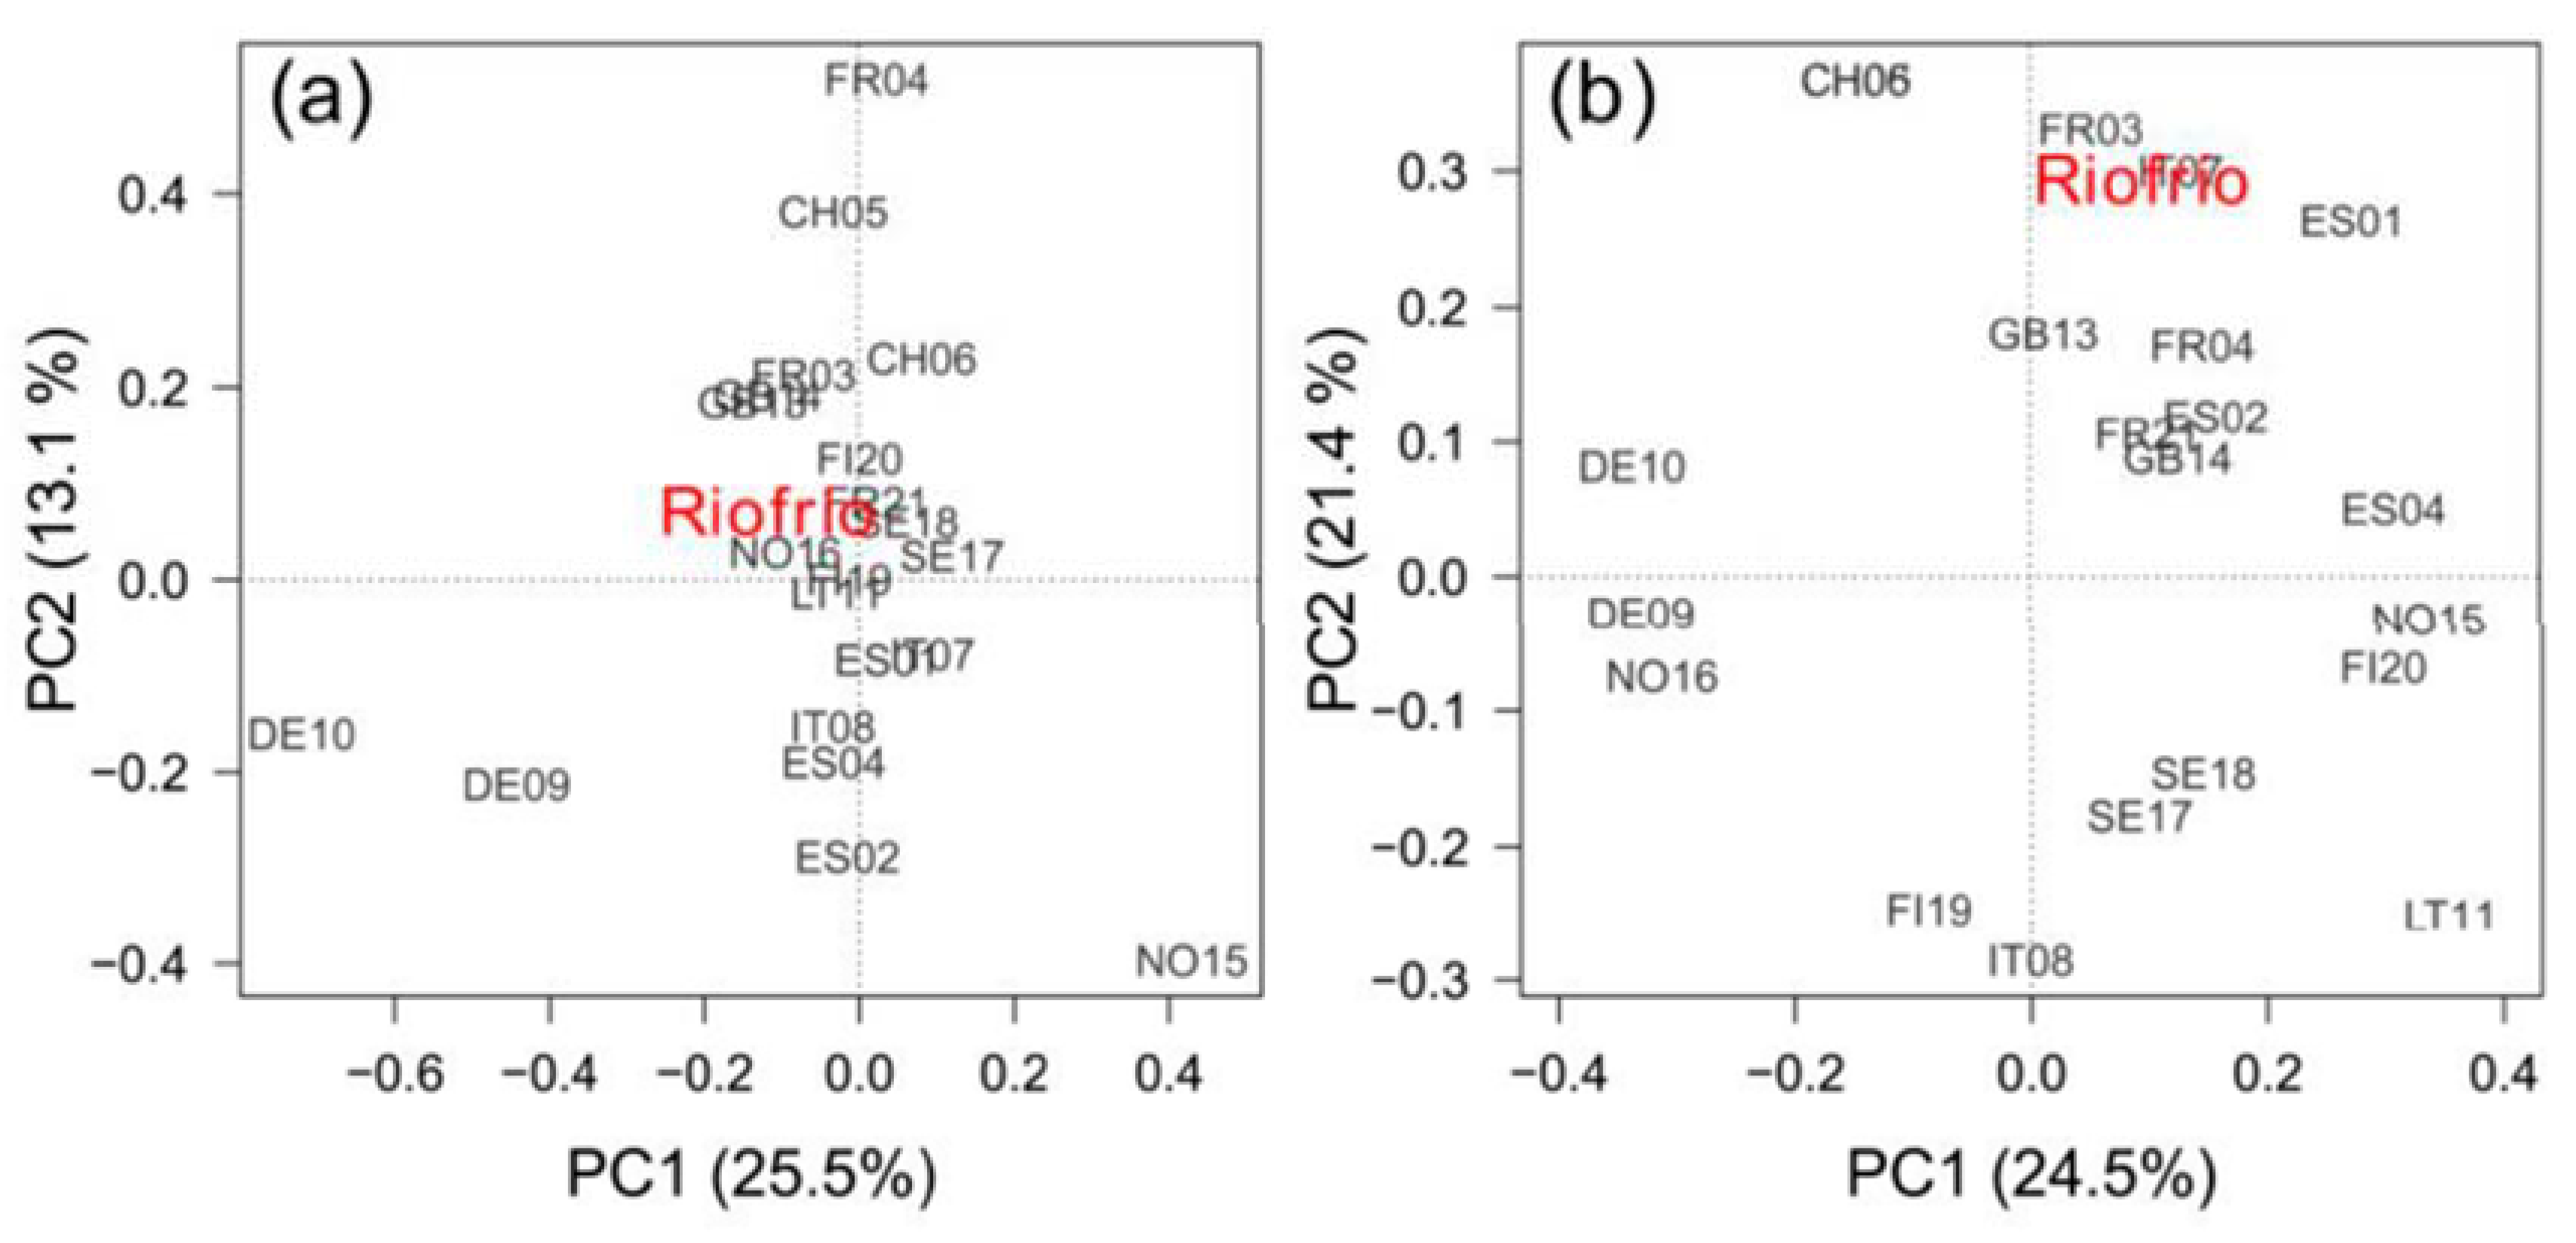
Growth variability of the southernmost rear-edge population, that is Riofrío, only was significantly correlated with site FR21 (r = 0.392, p = 0.032) (Figure 6a). The PC1 and PC2 accounted for 25.5% and 13.1% of the variance, respectively, and did not correlate with any geographic or climatic variable. Climate-RWI relationships of site Riofrío showed significant positive correlations with several sites from Spain (ES01, ES02), France (FR03, FR21), Switzerland (CH05, CH06) and Italy (IT07), and a negative association with a Finnish site (FI09) (Figure 6b). Accordingly, the PC2 loadings were negatively related to site latitude (r = -0.636, p = 0.001) and longitude (r = -0.643, p = 0.001), but positively related to site mean annual temperature (r = 0.630, p = 0.002) (Figure A6a) and site total annual precipitation (r = 0.442, p = 0.039). In addition, B. pendula RWI – SPEI3 August correlations across Europe were also negatively related to latitude (r = -0.618, p = 0.002) and longitude (r = -0.574, p = 0.004), and positively related to elevation (r = 0.498, p = 0.015) and mean annual temperature (r = 0.517, p = 0.011) (Figure A6b).

4. Discussion

European birch species (Betula pendula and B. pubescens) display some of the widest physiological and geographical amplitudes of all Eurasian broad-leaved tree species [2,3]. In the present dendrochronological study of the two species at different spatial scales, we have found common climatic constraints on birch radial growth (Figure 3 & Figure 5). Growth enhancement under warm conditions during the early growing season has been described previously for both species [19,20,21]. This is likely related to bud opening and cambium reactivation above a certain threshold of temperature sum [23,62,63]. Environmental conditions prior to the onset of stem growth also influence interannual variability of birch growth. Such is the case of winter (February) precipitation, which we found to be positively related with radial growth (Figure 3). This effect can have two alternative explanations, as thick snow layers may prevent root freezing during winter [19], and water supply from snowmelt and winter precipitation can maintain the soil water reserve at the beginning of growth [62]. It is surprising the negative association of B. pubescens with February temperature (Figure 3). It could be due to the chilling requirement for dormancy release of buds [64], which is consistent with the more cold-adapted behavior suggested for this species [24]. Nonetheless, the strongest climatic influence on radial growth of studied birch populations was exerted by summer (June-August) water deficit at the different spatial scales analyzed (Table 2 & Table 3; Figure A3). Premature leaf shedding, mortality of fine roots and cessation of cambium activity have been related to water shortage in birch trees [62,65,66], thus reducing the growing season length and the annual tree growth. Soil water shortage has been also found to reduce leaf area and stomatal conductance, which impair photosynthesis and growth of B. pendula seedlings [25,66,67].
B. pubescens is considered more sensitive to drought and high temperatures than B. pendula [24], however, our data do not seem to confirm this pattern in the comparison of Spanish birch populations located at the southern limit of their geographical distribution. This result is likely explained by the large effect of site conditions rather than regional climate on radial growth, as suggested by the significant correlations found with local hydrological conditions (Figure A4). We found a negative correlation between growth and Revinuesa river flow during the previous September in the Iberian system population of B. pendula. This result can be related to stress related to humid and cloudy conditions reducing carbohydrate synthesis or bud formation during the prior autumn or to the reproductive effort triggered by favorable conditions in the preceding growing season that reduces radial growth the next year [68,69].
The effect of local hydrology on rear-edge birch populations of the Toledo Mountains was similar to or even higher than that of the regional climate (Table 2). At Riofrío, dry winter and warm summer conditions likely reduce the quantity of runoff contribution to river discharge (Figure A5a), thus reducing the soil moisture available in the banks of the stream where birches grow. It is remarkable that birch growth in this site depends on previous winter precipitation (Figure 3b), which can recharge soil moisture levels to enhance radial growth in spring [36]. By contrast, we did not find significant associations between dam inflow and regional climate (Figure A5b), which may be related to the nearby agricultural fields that are irrigated with water not only from the dam, but also from the aquifer that feeds the mire on which La Ventilla stand is located. Hence, climatic-driven soil moisture shortage is aggravated by human land uses at La Ventilla which reduce the groundwater availability. Indeed, one of the major threats to mires in the Toledo Mountains is the intensive drainage for watering and agricultural uses [30,40].
Long-term low growth rates and negative patterns have been identified as early warning signals of forest dieback [70,71]. Therefore, declining growth trends showed by birch rear-edge populations that started 15-20 years ago (Figure 2) suggest their loss of vitality and the onset of canopy dieback. Considering their increasing reliance on summer water balance (Figure 4), these patterns are likely induced by the ongoing aridification of climate of the Toledo Mountains region (Figure A2c) and aggravated by the decreasing water supplied by local hydrology. Mortality events of B. pubescens and B. pendula induced by extreme weather events have been described [15,24], as well as growth decline as a result of aridification [16,22]. For instance, [15] found that a very low summer precipitation lead to low soil moisture levels and caused B. pendula dieback and extensive mortality in southeastern Siberia, particularly in southern and south-facing slopes with relatively drier and warmer conditions. Likewise, [16] reported warming-induced growth decline of Himalayan birch (Betula utilis D. Don) in a semi-arid (south–west facing slope) treeline in the Himalayas (central Nepal).
Nonlinear climatic responses of B. pendula along Europe suggest local adaptation (Figure 5), which is supported by the variability in climate-growth relationships in the different populations (Figure 6b). Growth patterns and climate-growth responses of Riofrío rear-edge population showed similarity with the populations geographically closer, and therefore, probably present more similar climatic conditions. Indeed, we found that climatic responses followed geographical and climatic gradients (Figure A6), so that the higher the mean annual temperature, the greater the sensitivity to water deficit during summer. Great intraspecific variability in the drought tolerance has been found among B. pendula provenances or ecotypes [67,72,73]. These studies highlighted that genotypes of dry origin perform better against drought than genotypes of wet origin as pointed by their lower leaf turgor loss point [72], larger osmostic adjustment and higher stomatal conductance [67]. The isolation of birch populations in central-southern Spanish mountains, that might have persisted here as glacial relicts, has led to their taxonomic differentiation and local adaptation to warmer and drier climate [28]. Though local adaptation can reduce adaptability of genotypes to rapid environmental changes [33,74], rear-edge population can provide drought-tolerant genotypes to more central distributions considering predicted species range shifts [37,75]. However, these populations face multiple threats including drastic habitat fragmentation, warmer and drier conditions, or reduction of water supply due to human land uses. In fact, B. pendula subsp. fontqueri has been included in the red list of plants of the IUCN [76]. There is therefore a case for management efforts to help preserve these rear-edge populations.
Palaeoecological and ecological studies in the study area provide several recommendations for the management and conservation of these rare Mediterranean woodlands including (1) restoring birch stands since past and recent land-use intensification caused their decline through the direct removal of trees or the indirect drying of soils, (2) reducing the elevated density of wild ungulates which graze on birch seedlings, and (3) protecting or enlarging sensitive and vulnerable habitats like Sphagnum bogs and riparian forests [30,31,77,78,79,80]. Preserving and restoring some of these threatened and protected sites such La Ventilla by recharging and maintaining their soil water pools, particularly during the dry summer, is also highly recommended.

5. Conclusions

The assessment of radial growth patterns of rear-edge birch populations of central-southern Spain through dendroecological approaches provides evidence of the strong effect of local hydrological conditions on growth variability being even greater than that of regional climate in the case of B. pubescens populations growing on a mire. Both rear-edge birch populations showed declining trends that started at the beginning of the 21st century, which were not found in northern Spain. The declining growth is likely related to increasing reliance on water summer availability, along with decreasing water supply due to climate change and agricultural land uses. The assessment of radial growth of B. pendula across Europe suggested local adaptations to climate conditions. Long-term isolated, rear-edge birch populations can provide drought-tolerant genotypes to more central distributions, so management actions are required to ensure their persistence by preserving adequate ecohydrological conditions and avoiding local soil drying which triggers dieback.

Author Contributions

Conceptualization, R.L.L., J.A.L.S. and J.J.C.; methodology, E.G.A., M.C. and J.J.C.; formal analysis, E.G.A.; investigation, J.J.C. and J.A.L.S.; resources, J.J.C. and J.A.L.S.; data curation, E.G.A. and J.J.C.; writing—original draft preparation, E.G.A. and J.J.C.; writing—review and editing, M.C., R.L.L., J.A.L.S. and J.J.C.; funding acquisition, J.J.C. All authors have read and agreed to the published version of the manuscript.

Funding

This research was funded by Spanish Ministry of Science and Innovation (TED2021-129770B-C21 project). E.G.A. was supported by CSIC (PIE-20223AT003).

Data Availability Statement

The data presented in this study are available on request from the corresponding author.

Acknowledgments

We thank the “Cabañeros” National Park personal and director for field permissions and help in La Ventilla site. We also thank “Junta de Castilla La Mancha” forest guards for their help to sampled Riofrío site.

Conflicts of Interest

The authors declare no conflict of interest.

Appendix A

Table A1. Geographic, climatic and dendrochronological characteristics of Betula pendula populations distributed along a north-south gradient in Europe including field data and GenTree Dendroecological Collection [41]. Abbreviations: mean annual temperature (MAT), mean annual precipitation (MAP), annual water balance expressed as precipitation minus potential evapotranspiration (P-PET), diameter at breast height (DBH), mena tree-ring width (TRW), mean inter-series correlation of detrended tree-ring width (Rbar), Expressed Population Signal (EPS).
ID Country Latitude (ºN) Longitude (º E) Elevation (m a.s.l.) MAT (ºC) MAP (mm) P-PET (mm) DBH (cm) TRW (mm) Tree age (years) Rbar EPS
FI19 Finland 66.37 26.73 127.13 0.79 585 52 19.94 1.82 48.2 0.30 0.923
SE17 Sweden 64.76 18.70 278.12 1.66 578 45 22.67 2.39 40.5 0.32 0.93
SE18 Sweden 63.92 19.89 150.95 3.29 672 123 24.11 2.42 43.5 0.25 0.887
FI20 Finland 61.66 29.29 89.71 4.04 614 50 21.17 2.16 45.6 0.25 0.858
NO16 Norway 60.80 10.75 187.28 4.56 667 105 25.76 3.81 27.2 0.32 0.922
NO15 Norway 59.82 11.03 261.29 5.35 937 369 26.06 0.75 70.6 0.22 0.893
GB14 United Kingdom 57.23 -3.67 279.87 7.21 903 318 23.71 1.99 49.5 0.12 0.804
LT11 Lithuania 55.03 23.01 56.21 7.42 632 15 22.17 2.12 25.5 0.32 0.911
LT12 Lithuania 54.62 24.23 112.78 7.18 637 28 21.82 4.70 17.7 0.48 0.953
GB13 United Kingdom 54.23 -3.03 15.37 9.13 1450 825 30.24 1.87 62.4 0.15 0.827
DE10 Germany 52.54 14.05 57.91 9.41 564 -95 18.81 2.21 47.8 0.36 0.942
DE09 Germany 51.84 14.44 61.95 9.75 565 -101 30.00 2.62 61.2 0.14 0.809
CH05 Switzerland 46.32 8.96 772.51 8.56 1452 843 32.28 2.92 51.1 0.19 0.842
CH06 Switzerland 46.14 8.99 990.73 11.05 1487 801 28.33 2.48 41.4 0.08 0.691
FR04 France 44.84 3.32 995.65 8.14 875 288 31.53 2.54 55.0 0.24 0.895
FR21 France 44.21 7.10 1690.52 4.86 984 489 18.61 1.43 49.1 0.09 0.51
FR03 France 44.20 7.07 1417.37 8.25 874 271 20.73 3.44 31.3 0.23 0.923
IT07 Italy 43.61 11.71 1051.84 11.92 1150 458 26.13 2.01 56.1 0.05 0.497
ES04 Spain 42.69 -0.28 1790.00 6.56 1251 716 29.80 3.44 40.0 0.30 0.628
ES02 Spain 42.67 -0.32 1063.39 8.19 1165 579 20.74 2.69 34.9 0.20 0.845
IT08 Italy 42.16 13.62 1552.42 9.81 1089 459 16.72 1.03 54.7 0.16 0.741
ES01 Spain 41.97 -2.62 1287.29 9.22 601 -11 29.83 3.98 40.2 0.26 0.921
Riofrío Spain 39.08 -4.50 648.00 15.95 415 -450 40.77 3.10 45.7 0.23 0.93
Figure A1. Appearance of the study stands and trees at the southernmost (rear-edge) population of Betula pubescens (La Ventilla; a) and B. pendula (Riofrío; b). Climate diagrams of the Spanish study sites at Toledo Mountains (La Ventilla solid lines; Riofrío dash lines) and Iberian System (c).
Preprints 77250 g0a1
Figure A2. Mean annual temperature, total annual precipitation and summer water balance (precipitation minus potential evapotranspiration; P-PET) during the 1980-2021 period in the Toledo Mountains (purple lines) and Iberian System (green lines). Dash lines show significant (p < 0.05) trends according to Kendall τ statistic (indicated in upper left corner).
Preprints 77250 g0a2
Figure A3. Bootstrapped correlation coefficients calculated between standardized site chronologies of tree-ring width (RWI) and the Standardized Precipitation and Evapotranspiration Index (SPEI) calculated at different time-scales. The window of analysis spanned from previous September (lowercase letters) to September of the year of tree-ring formation (uppercase letters).
Preprints 77250 g0a3
Figure A4. Relationship between ring-width index of birch at La Ventilla (a), Riofrío (b) and ES01 (c) study sites with November inflows of “Torre de Abraham” dam, February flow of Bullaque river and previous September flow of Revinuesa river, respectively. Pearson correlation statistics are shown in the upper-right corner of each graph. Black and blue lines represent radial growth and water flow, respectively. Note the logarithmic scales of monthly flow and inflow data.
Preprints 77250 g0a4
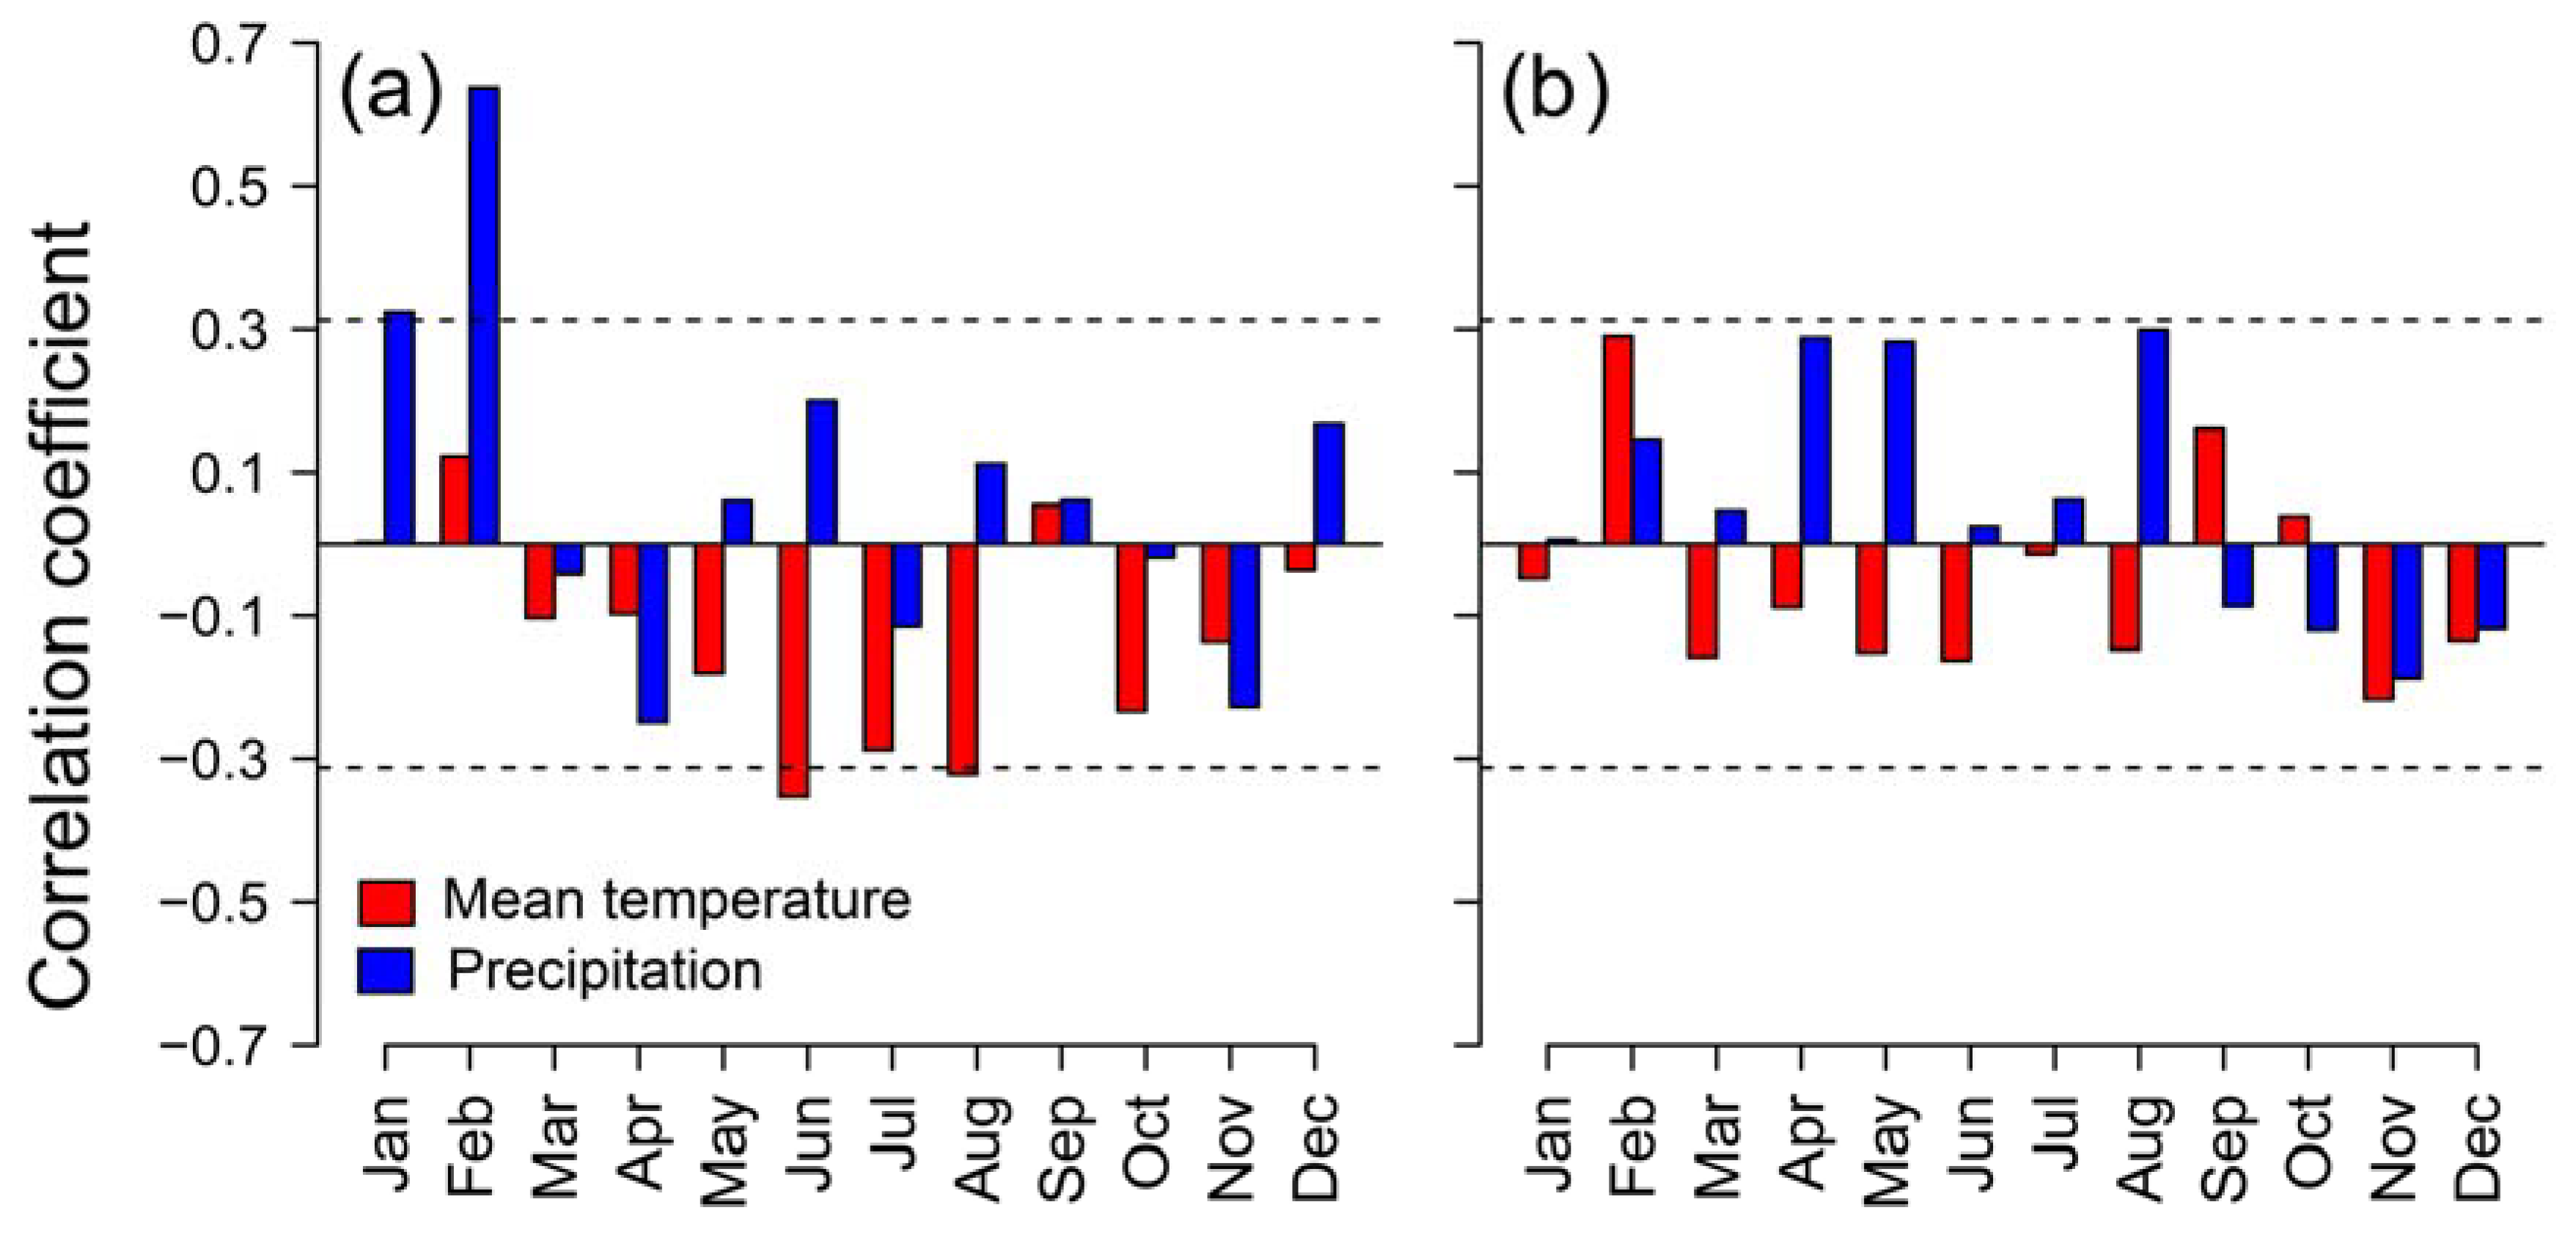
Figure A5. Pearson correlation coefficients of Bullaque river flow in February (a) and “Torre de Abraham” dam inflow in November (b) with monthly regional climatic variables (E-OBS v 27.0e dataset [43]): mean temperature (red bars) and precipitation (blue bars). Horizontal dashed lines indicate significant (p < 0.05) correlations.
Preprints 77250 g0a5
Figure A6. Relationship between mean annual temperature (MAT) with the PC2 scores of the Principal Component Analysis on the covariance matrix of RWI – climate correlations (a) and the RWI-SPEI3.Aug correlations (b) of Betula pendula across Europe.
Preprints 77250 g0a6

References

  1. Ashburner, K.; McAllister, H.A. The genus Betula: a taxonomic revision of birches; Kew Publishing: London, 2016. [Google Scholar]
  2. Atkinson, M.D. Betula pendula Roth (B. verrucosa Ehrh.) and B. pubescens Ehrh. J. Ecol. 1992, 80, 837–870. [Google Scholar] [CrossRef]
  3. Hynynen, J.; Niemistö, P.; Viherä-Aarnio, A.; Brunner, A.; Hein, S.; Velling, P. Silviculture of birch (Betula pendula Roth and Betula pubescens Ehrh.) in Northern Europe. Forestry 2010, 83, 103–119. [Google Scholar] [CrossRef]
  4. Jonczak, J.; Jankiewicz, U.; Kondras, M.; Kruczkowska, B.; Oktaba, L.; Oktaba, J.; Olejniczak, I.; Pawłowicz, E.; Polláková, N.; Raab, T.; et al. The influence of birch trees (Betula spp.) on soil environment – A review. For. Ecol. Manage. 2020, 477. [Google Scholar] [CrossRef]
  5. Nieuwenhuis, M.; Barrett, F. The growth potential of downy birch (Betula pubescens (Ehrh.)) in Ireland. Forestry 2002, 75, 75–87. [Google Scholar] [CrossRef]
  6. Kund, M.; Vares, A.; Sims, A. Early growth and development of silver birch (Betula pendula Roth.) plantations on abandoned agricultural land. 2010, 679–688. [Google Scholar] [CrossRef]
  7. Dubois, H.; Verkasalo, E.; Claessens, H. Potential of birch (Betula pendula Roth and B. pubescens Ehrh.) for forestry and forest-based industry sector within the changing climatic and socio-economic context of western Europe. Forests 2020, 11, 1–26. [Google Scholar] [CrossRef]
  8. Woodcock, B.A.; Leather, S.R.; Watt, A. Changing management in Scottish birch woodlands: A potential threat to local invertebrate biodiversity. Bull. Entomol. Res. 2003, 93, 159–167. [Google Scholar] [CrossRef]
  9. Felton, A.; Andersson, E.; Ventorp, D.; Lindbladh, M. A comparison of avian diversity in spruce monocultures and spruce-birch polycultures in Southern Sweden. Silva Fenn. 2011, 45, 1143–1150. [Google Scholar] [CrossRef]
  10. Wannebo-Nilsen, K.; Bjerke, J.W.; Beck, P.S.A.; Tømmervik, H. Epiphytic macrolichens in spruce plantations and native birch forests along a coast-inland gradient in North Norway. Boreal Environ. Res. 2010, 15, 43–57. [Google Scholar]
  11. IPCC Summary for Policymakers. In Climate Change 2021: The Physical Science Basis. Contribution of Working Group I to the Sixth Assessment Report of the Intergovernmental Panel on Climate Change; Masson-Delmotte, V.; Zhai, P.; Pirani, A.; Connors, S.L.; Péan, C.; Berger, S.; Caud, N.; Chen, Y.; Goldfarb, L.; Gomis, M.I.; Huang, M.; Leitzell, K.; Lonnoy, E.; Matthews, J.B.R.; Maycock, T.K.; Waterfield, T.; Yelekçi, O.; Yu, R.; Zhou, B.; Eds. (Eds.) Cambridge University Press, 2021; pp. 3–32. [Google Scholar]
  12. Seidl, R.; Thom, D.; Kautz, M.; Martin-benito, D.; Peltoniemi, M.; Vacchiano, G.; Wild, J.; Ascoli, D.; Petr, M.; Honkaniemi, J.; et al. Forest disturbances under climate change. Nat. Clim. Chang. 2017, 7, 395–402. [Google Scholar] [CrossRef]
  13. Allen, C.D.; Breshears, D.D.; McDowell, N.G. On underestimation of global vulnerability to tree mortality and forest die-off from hotter drought in the Anthropocene. Ecosphere 2015, 6, 1–55. [Google Scholar] [CrossRef]
  14. Hammond, W.M.; Williams, A.P.; Abatzoglou, J.T.; Adams, H.D.; Klein, T.; López, R.; Sáenz-Romero, C.; Hartmann, H.; Breshears, D.D.; Allen, C.D. Global field observations of tree die-off reveal hotter-drought fingerprint for Earth’s forests. Nat. Commun. 2022, 13. [Google Scholar] [CrossRef]
  15. Kharuk, V.I.; Ranson, K.J.; Oskorbin, P.A.; Im, S.T.; Dvinskaya, M.L. Climate induced birch mortality in Trans-Baikal lake region, Siberia. For. Ecol. Manage. 2013, 289, 385–392. [Google Scholar] [CrossRef]
  16. Tiwari, A.; Fan, Z.X.; Jump, A.S.; Zhou, Z.K. Warming induced growth decline of Himalayan birch at its lower range edge in a semi-arid region of Trans-Himalaya, central Nepal. Plant Ecol. 2017, 218, 621–633. [Google Scholar] [CrossRef]
  17. Beck, P.; Caudullo, G.; De Rigo, D.; Tinner, W. Betula pendula, Betula pubescens and other birches in Europe: distribution, habitat, usage and threats. In European Atlas of Forest Tree Species; San-Miguel-Ayanz, J., de Rigo, D., Caudullo, G., Houston Durrant, T., Mauri, A., Eds.; Publication Office of the European Union: Luxembourg, 2016; pp. 70–73. [Google Scholar]
  18. Thórsson, Æ.T.; Salmela, E.; Anamthawat-Jónsson, K. Morphological, cytogenetic, and molecular evidence for introgressive hybridization in birch. J. Hered. 2001, 62, 404–408. [Google Scholar] [CrossRef] [PubMed]
  19. Levanič, T.; Eggertsson, O. Climatic effects on birch (Betula pubescens Ehrh.) growth in Fnjoskadalur valley, northern Iceland. Dendrochronologia 2008, 25, 135–143. [Google Scholar] [CrossRef]
  20. Harr, L.; Esper, J.; Kirchhefer, J.A.; Zhou, W.; Hartl, C. Growth response of Betula pubescens Ehrh. to varying disturbance factors in northern Norway. Trees - Struct. Funct. 2021, 35, 421–431. [Google Scholar] [CrossRef]
  21. Matisons, R.; Elferts, D.; Schneck, V.; Kowalczyk, J. Silver birch shows nonlinear responses to moisture availability and temperature in the eastern Baltic Sea region. Dendrochronologia 2022, 76, 126003. [Google Scholar] [CrossRef]
  22. Augustaitis, A.; Augustaitienė, I.; Baugarten, M.; Bičenkienė, S.; Girgždienė, R.; Kulbokas, G.; Linkevičius, E.; Marozas, V.; Mikalajūnas, M.; Mordas, G.; et al. Tree-ring formation as an indicator of forest capacity to adapt to the main threats of environmental changes in Lithuania. Sci. Total Environ. 2018, 615, 1247–1261. [Google Scholar] [CrossRef]
  23. Schmitt, U.; Jalkanen, R.; Eckstein, D. Cambium dynamics of Pinus sylvestris and Betula spp. in the northern boreal forest in Finland. Silva Fenn. 2004, 38, 167–178. [Google Scholar] [CrossRef]
  24. Hemery, G.E.; Clark, J.R.; Aldinger, E.; Claessens, H.; Malvolti, M.E.; O’connor, E.; Raftoyannis, Y.; Savill, P.S.; Brus, R. Growing scattered broadleaved tree species in Europe in a changing climate: a review of risks and opportunities. Forestry 2010, 83, 65–81. [Google Scholar] [CrossRef]
  25. Possen, B.J.H.M.; Oksanen, E.; Rousi, M.; Ruhanen, H.; Ahonen, V.; Tervahauta, A.; Heinonen, J.; Heiskanen, J.; Kärenlampi, S.; Vapaavuori, E. Adaptability of birch (Betula pendula Roth) and aspen (Populus tremula L.) genotypes to different soil moisture conditions. For. Ecol. Manage. 2011, 262, 1387–1399. [Google Scholar] [CrossRef]
  26. Way, D. a; Oren, R. Differential responses to changes in growth temperature between trees from different functional groups and biomes: a review and synthesis of data. Tree Physiol. 2010, 30, 669–88. [Google Scholar] [CrossRef] [PubMed]
  27. Hofgaard, A.; Ols, C.; Drobyshev, I.; Kirchhefer, A.J.; Sandberg, S.; Söderström, L. Non-stationary response of tree growth to climate trends along the Arctic Margin. Ecosystems 2019, 22, 434–451. [Google Scholar] [CrossRef]
  28. Martín, C.; Parra, T.; Clemente-muñoz, M.; Hernandez-bermejo, E. Genetic diversity and structure of the endangered Betula pendula subsp. fontqueri populations in the south of Spain. Silva 2008, 42, 487–498. [Google Scholar]
  29. Sánchez de Álamo, C.; Sardinero, S.; Bouso, V.; Hernández Palacios, G.; Pérez-Badia, R.; Fernández-González, F. Los abedulares del Parque Nacional De Cabañeros : sistemática, demografía, biología reproductiva y estrategias de conservación. In Proyectos de investigación en parques nacionales: 2006-2009; Organismo Autónomo de Parques Nacionales, Ministerio de Medio Ambiente: Madrid, 2010; pp. 275–309. [Google Scholar]
  30. Luelmo-Lautenschlaeger, R.; Pérez-Díaz, S.; Alba-Sánchez, F.; Abel-Schaad, D.; López-Sáez, J.A. Vegetation history in the Toledo Mountains (Central Iberia): Human impact during the last 1300 years. Sustainability 2018, 10, 2575. [Google Scholar] [CrossRef]
  31. Morales-Molino, C.; Tinner, W.; Perea, R.; Carrión, J.S.; Colombaroli, D.; Valbuena-Carabaña, M.; Zafra, E.; Gil, L. Unprecedented herbivory threatens rear-edge populations of Betula in southwestern Eurasia. Ecology 2019, 100, 1–15. [Google Scholar] [CrossRef]
  32. Hampe, A.; Petit, R.J. Conserving biodiversity under climate change: The rear edge matters. Ecol. Lett. 2005, 8, 461–467. [Google Scholar] [CrossRef] [PubMed]
  33. Aitken, S.N.; Bemmels, J.B. Time to get moving: Assisted gene flow of forest trees. Evol. Appl. 2016, 9, 271–290. [Google Scholar] [CrossRef]
  34. Borovics, A.; Mátyás, C. Decline of genetic diversity of sessile oak at the retracting (xeric) limits. Ann. For. Sci. 2013, 70, 835–844. [Google Scholar] [CrossRef]
  35. Fréjaville, T.; Vizcaíno-Palomar, N.; Fady, B.; Kremer, A.; Benito Garzón, M. Range margin populations show high climate adaptation lags in European trees. Glob. Chang. Biol. 2020, 26, 484–495. [Google Scholar] [CrossRef] [PubMed]
  36. Camarero, J.J.; Gazol, A.; Sangüesa-Barreda, G.; Vergarechea, M.; Alfaro-Sánchez, R.; Cattaneo, N.; Vicente-Serrano, S.M. Tree growth is more limited by drought in rear-edge forests most of the times. For. Ecosyst. 2021, 8, 1–15. [Google Scholar] [CrossRef]
  37. Dyderski, M.K.; Paź, S.; Frelich, L.E.; Jagodziński, A.M. How much does climate change threaten European forest tree species distributions? Glob. Chang. Biol. 2018, 24, 1150–1163. [Google Scholar] [CrossRef] [PubMed]
  38. Fritts, H.C. Tree Rings and Climate; Blackburn Press: Caldwell, USA, 2001. [Google Scholar]
  39. Xu, K.; Wang, X.; Liang, P.; An, H.; Sun, H.; Han, W.; Li, Q. Tree-ring widths are good proxies of annual variation in forest productivity in temperate forests. Sci. Rep. 2017, 7, 1–8. [Google Scholar] [CrossRef]
  40. López-Sáez, J.A.; García-Río, R.; Alba-Sánchez, F.; García-Gómez, E.; Pérez-Díaz, S. Peatlands in the Toledo Mountains (central Spain): Characterisation and conservation status. Mires Peat 2014, 15, 1–23. [Google Scholar]
  41. Martínez-Sancho, E.; Slámová, L.; Morganti, S.; Grefen, C.; Carvalho, B.; Dauphin, B.; Rellstab, C.; Gugerli, F.; Opgenoorth, L.; Heer, K.; et al. The GenTree Dendroecological Collection, tree-ring and wood density data from seven tree species across Europe. Sci. Data 2020, 7, 1–7. [Google Scholar] [CrossRef]
  42. de Rigo, D.; Caudullo, G.; Durrant, T.H.; San-Miguel-Ayanz, J. The European Atlas of Forest Tree Species: Modelling, data and information on forest tree species. In The European Atlas of Forest Tree Species; Publication Office of the European Union: Luxembourg, 2016; pp. 40–45. [Google Scholar]
  43. Cornes, R.; van der Schrier, G.; van den Besselaar, E.J.M.; Jones, P.D. An ensemble version of the E-OBS temperature and precipitation datasets. J. Geophys. Res. Atmos. 2018, 123, 9391–9409. [Google Scholar] [CrossRef]
  44. Vicente-Serrano, S.M.; Beguería, S.; López-Moreno, J.I. A multiscalar drought index sensitive to global warming: The standardized precipitation evapotranspiration index. J. Clim. 2010, 23, 1696–1718. [Google Scholar] [CrossRef]
  45. Beguería, S.; Vicente-Serrano, S.M. SPEI: Calculation of the Standardised Precipitation-Evapotranspiration Index. R package version 1.7. 2017.
  46. R core Team R: A language and environment for statistical computing. R foundation for statistical computing. 2023.
  47. Luelmo-lautenschlaeger, R.; Morales-molino, C.; Blarquez, O.; Pérez-díaz, S.; Sabariego-ruiz, S.; Ochando, J.; Carrión, J.S.; Perea, R.; Fernández-gonzález, F.; López-sáez, J.A. Long-term vegetation history of a relict birch forest (Betula pubescens subsp. celtiberica (Rothm. & Vasc.) Rivas Mart.) in the Toledo Mountains (central Iberia). Conservation implications. Rev. Palaeobot. Palynol. 2023, 315, 104906. [Google Scholar]
  48. Larsson, L.A.; Larsson, P.O. CDendro and CooRecorder (v. 9.3.1) 2018. 2018.
  49. Holmes, R.L. Computer-assisted quality control in tree-ring dating and measurement. Tree-Ring Bull. 1983, 43, 69–78. [Google Scholar]
  50. Biondi, F.; Qeadan, F. A theory-driven approach to tree-ring standardization: Defining the biological trend from expected basal area increment. Tree-Ring Res. 2008, 64, 81–96. [Google Scholar] [CrossRef]
  51. Pinheiro, J.C.; Bates, D.M. Mixed-effects models in S and S-PLUS.; Springer-Verlag: New York, 2000. [Google Scholar]
  52. Wood, S.N. Generalized Additive Models. An Introduction with R; Chapman and Hall/CRC: Boca Raton, USA, 2017. [Google Scholar]
  53. Wood, S.N. Thin-plate regression splines. J. R. Stat. Soc. Ser. B 2003, 65, 95–114. [Google Scholar] [CrossRef]
  54. Burnham, K.P.; Anderson, D.R. Model Selection and Multimodel Inference: a Practical Information-theoretic Approach; 2nd ed.; Springer-Verlag: New York, 2002. [Google Scholar]
  55. Bunn, A.; Korpela, M.; Biondi, F.; Campelo, F.; Mérian, P.; Qeadan, F.; Zang, C. dplR: Dendrochronology Program Library in R. R package version 1.7.1. 2020.
  56. McLeod, A.I. Kendall: Kendall rank correlation and Mann-Kendall trend test. R package version 2.2. 2011.
  57. Zeileis, A.; Kleiber, C.; Walter, K.; Hornik, K. Testing and dating of structural changes in practice. Comput. Stat. Data Anal. 2003, 44, 109–123. [Google Scholar] [CrossRef]
  58. Zang, C.; Biondi, F. Treeclim: An R package for the numerical calibration of proxy-climate relationships. Ecography (Cop.). 2015, 38, 431–436. [Google Scholar]
  59. Bates, D.; Maechler, M.; Bolker, B.; Walker, S. Fitting Linear Mixed-Effects Models Using lme4. J. Stat. Softw. 2015, 67, 1–48. [Google Scholar]
  60. Kuznetsova, A.; Brockhoff, P.B.; Christensen, R.H.B. lmerTest package: Tests in linear mixed effects models. J. Stat. Software2 2017, 82, 1–26. [Google Scholar] [CrossRef]
  61. Wood, S.N. Fast stable restricted maximum likelihood and marginal likelihood estimation of semiparametric generalized linear models. J. R. Stat. Soc. Ser. B 2011, 73, 3–36. [Google Scholar] [CrossRef]
  62. Castells, X.; Gutiérrez, E. Phenology and stem growth dynamics of Betula pendula Roth. in the Spanish Pyrenees. Res. Sq. 2022. [Google Scholar]
  63. Marchand, L.J.; Dox, I.; Gricar, J.; Prislan, P.; Van den Bulcke, J.; Fonti, P.; Campioli, M. Timing of spring xylogenesis in temperate deciduous tree species relates to tree growth characteristics and previous autumn phenology. Tree Physiol. 2020, 41, 1161–1170. [Google Scholar] [CrossRef] [PubMed]
  64. Pudas, E.; Leppälä, M.; Tolvanen, A.; Poikolainen, J.; Venäläinen, A.; Kubin, E. Trends in phenology of Betula pubescens across the boreal zone in Finland. Int. J. Biometeorol. 2008, 52, 251–259. [Google Scholar] [CrossRef]
  65. Fernández-Martínez, J.; Fransi, M.A.; Fleck, I. Ecophysiological responses of Betula pendula, Pinus uncinata and Rhododendron ferrugineum in the Catalan Pyrenees to low summer rainfall. Tree Physiol. 2016, 36, 1520–1535. [Google Scholar] [CrossRef] [PubMed]
  66. Aspelmeier, S.; Leuschner, C. Genotypic variation in drought response of silver birch (Betula pendula Roth): Leaf and root morphology and carbon partitioning. Trees - Struct. Funct. 2006, 20, 42–52. [Google Scholar]
  67. Aspelmeier, S.; Leuschner, C. Genotypic variation in drought response of silver birch (Betula pendula): Leaf water status and carbon gain. Tree Physiol. 2004, 24, 517–528. [Google Scholar]
  68. Hacket-Pain, A.J.; Ascoli, D.; Vacchiano, G.; Biondi, F.; Cavin, L.; Conedera, M.; Drobyshev, I.; Liñán, I.D.; Friend, A.D.; Grabner, M.; et al. Climatically controlled reproduction drives interannual growth variability in a temperate tree species. Ecol. Lett. 2018, 21, 1833–1844. [Google Scholar] [CrossRef] [PubMed]
  69. Davi, H.; Cailleret, M.; Restoux, G.; Amm, A.; Pichot, C.; Fady, B. Disentangling the factors driving tree reproduction. Ecosphere 2016, 7, 1–16. [Google Scholar]
  70. Cailleret, M.; Jansen, S.; Robert, E.M.R.; Desoto, L.; Aakala, T.; Antos, J.A.; Beikircher, B.; Bigler, C.; Bugmann, H.; Caccianiga, M.; et al. A synthesis of radial growth patterns preceding tree mortality. Glob. Chang. Biol. 2017, 23, 1675–1690. [Google Scholar]
  71. Camarero, J.J.; Gazol, A.; Sangüesa-Barreda, G.; Cantero, A.; Sánchez-Salguero, R.; Sánchez-Miranda, A.; Granda, E.; Serra-Maluquer, X.; Ibáñez, R. Forest growth responses to drought at short- and long-term scales in Spain: Squeezing the stress memory from tree rings. Front. Ecol. Evol. 2018, 6, 1–11. [Google Scholar]
  72. Hannus, S.; Hirons, A.; Baxter, T.; McAllister, H.A.; Wiström, B.; Sjöman, H. Intraspecific drought tolerance of Betula pendula genotypes: an evaluation using leaf turgor loss in a botanical collection. Trees - Struct. Funct. 2021, 35, 569–581. [Google Scholar] [CrossRef]
  73. Ranney, T.G.; Bir, R.E.; Skroch, W.A. Comparative drought resistance among six species of birch (Betula): influence of mild water stress on water relations and leaf gas exchange. Tree Physiol. 1991, 8, 351–360. [Google Scholar]
  74. Cavin, L.; Jump, A.S. Highest drought sensitivity and lowest resistance to growth suppression are found in the range core of the tree Fagus sylvatica L. not the equatorial range edge. Glob. Chang. Biol. 2017, 23, 362–379. [Google Scholar] [CrossRef] [PubMed]
  75. Ranno, V.; Blandino, C.; Giusso Del Galdo, G. A comparative study on temperature and water potential thresholds for the germination of Betula pendula and two Mediterranean endemic birches, Betula aetnensis and Betula fontqueri. Seed Sci. Res. 2020, 30, 249–261. [Google Scholar]
  76. Vivero, J.L. Betula pendula var. fontqueri (Rothm.) G.Moreno & Peinado. In The IUCN Red List of Threatened Species 1998. 1998. [Google Scholar]
  77. Luelmo-Lautenschlaeger, R.; Pérez-Díaz, S.; Blarquez, O.; Morales-Molino, C.; López-Sáez, J.A. The Toledo Mountains: A resilient landscape and a landscape for resilience? hazards and strategies in a mid-elevation mountain region in central Spain. Quaternary 2019, 2. [Google Scholar]
  78. Luelmo-Lautenschlaeger, R.; Blarquez, O.; Pérez-Díaz, S.; Morales-Molino, C.; López-Sáez, J.A. The Iberian Peninsula’s burning heart — Long-term fire history in the Toledo Mountains (Central Spain). Fire 2019, 2. [Google Scholar]
  79. Luelmo Lautenschlaeger, R.; Pérez Díaz, S.; López Sáez, J.A. Paisajes relictos en los Montes de Toledo (España). Los humedales como refugio. In Conservación, Gestión y Restauración de la Biodiversidad. XI Congreso Español y I Congreso Iberoamericano de Biogeografía. Santander (España), 22-25 de junio; Carracedo, V., García-Codron, J.C., Garmendia, C., Rivas, V., Eds.; Asociación de Geógrafos Españoles (AGE): Santander, 2020; pp. 591–600. [Google Scholar]
  80. Morales-Molino, C.; Colombaroli, D.; Tinner, W.; Perea, R.; Valbuena-Carabaña, M.; Carrión, J.S.; Gil, L. Vegetation and fire dynamics during the last 4000 years in the Cabañeros National Park (central Spain). Rev. Palaeobot. Palynol. 2018, 253, 110–122. [Google Scholar] [CrossRef]
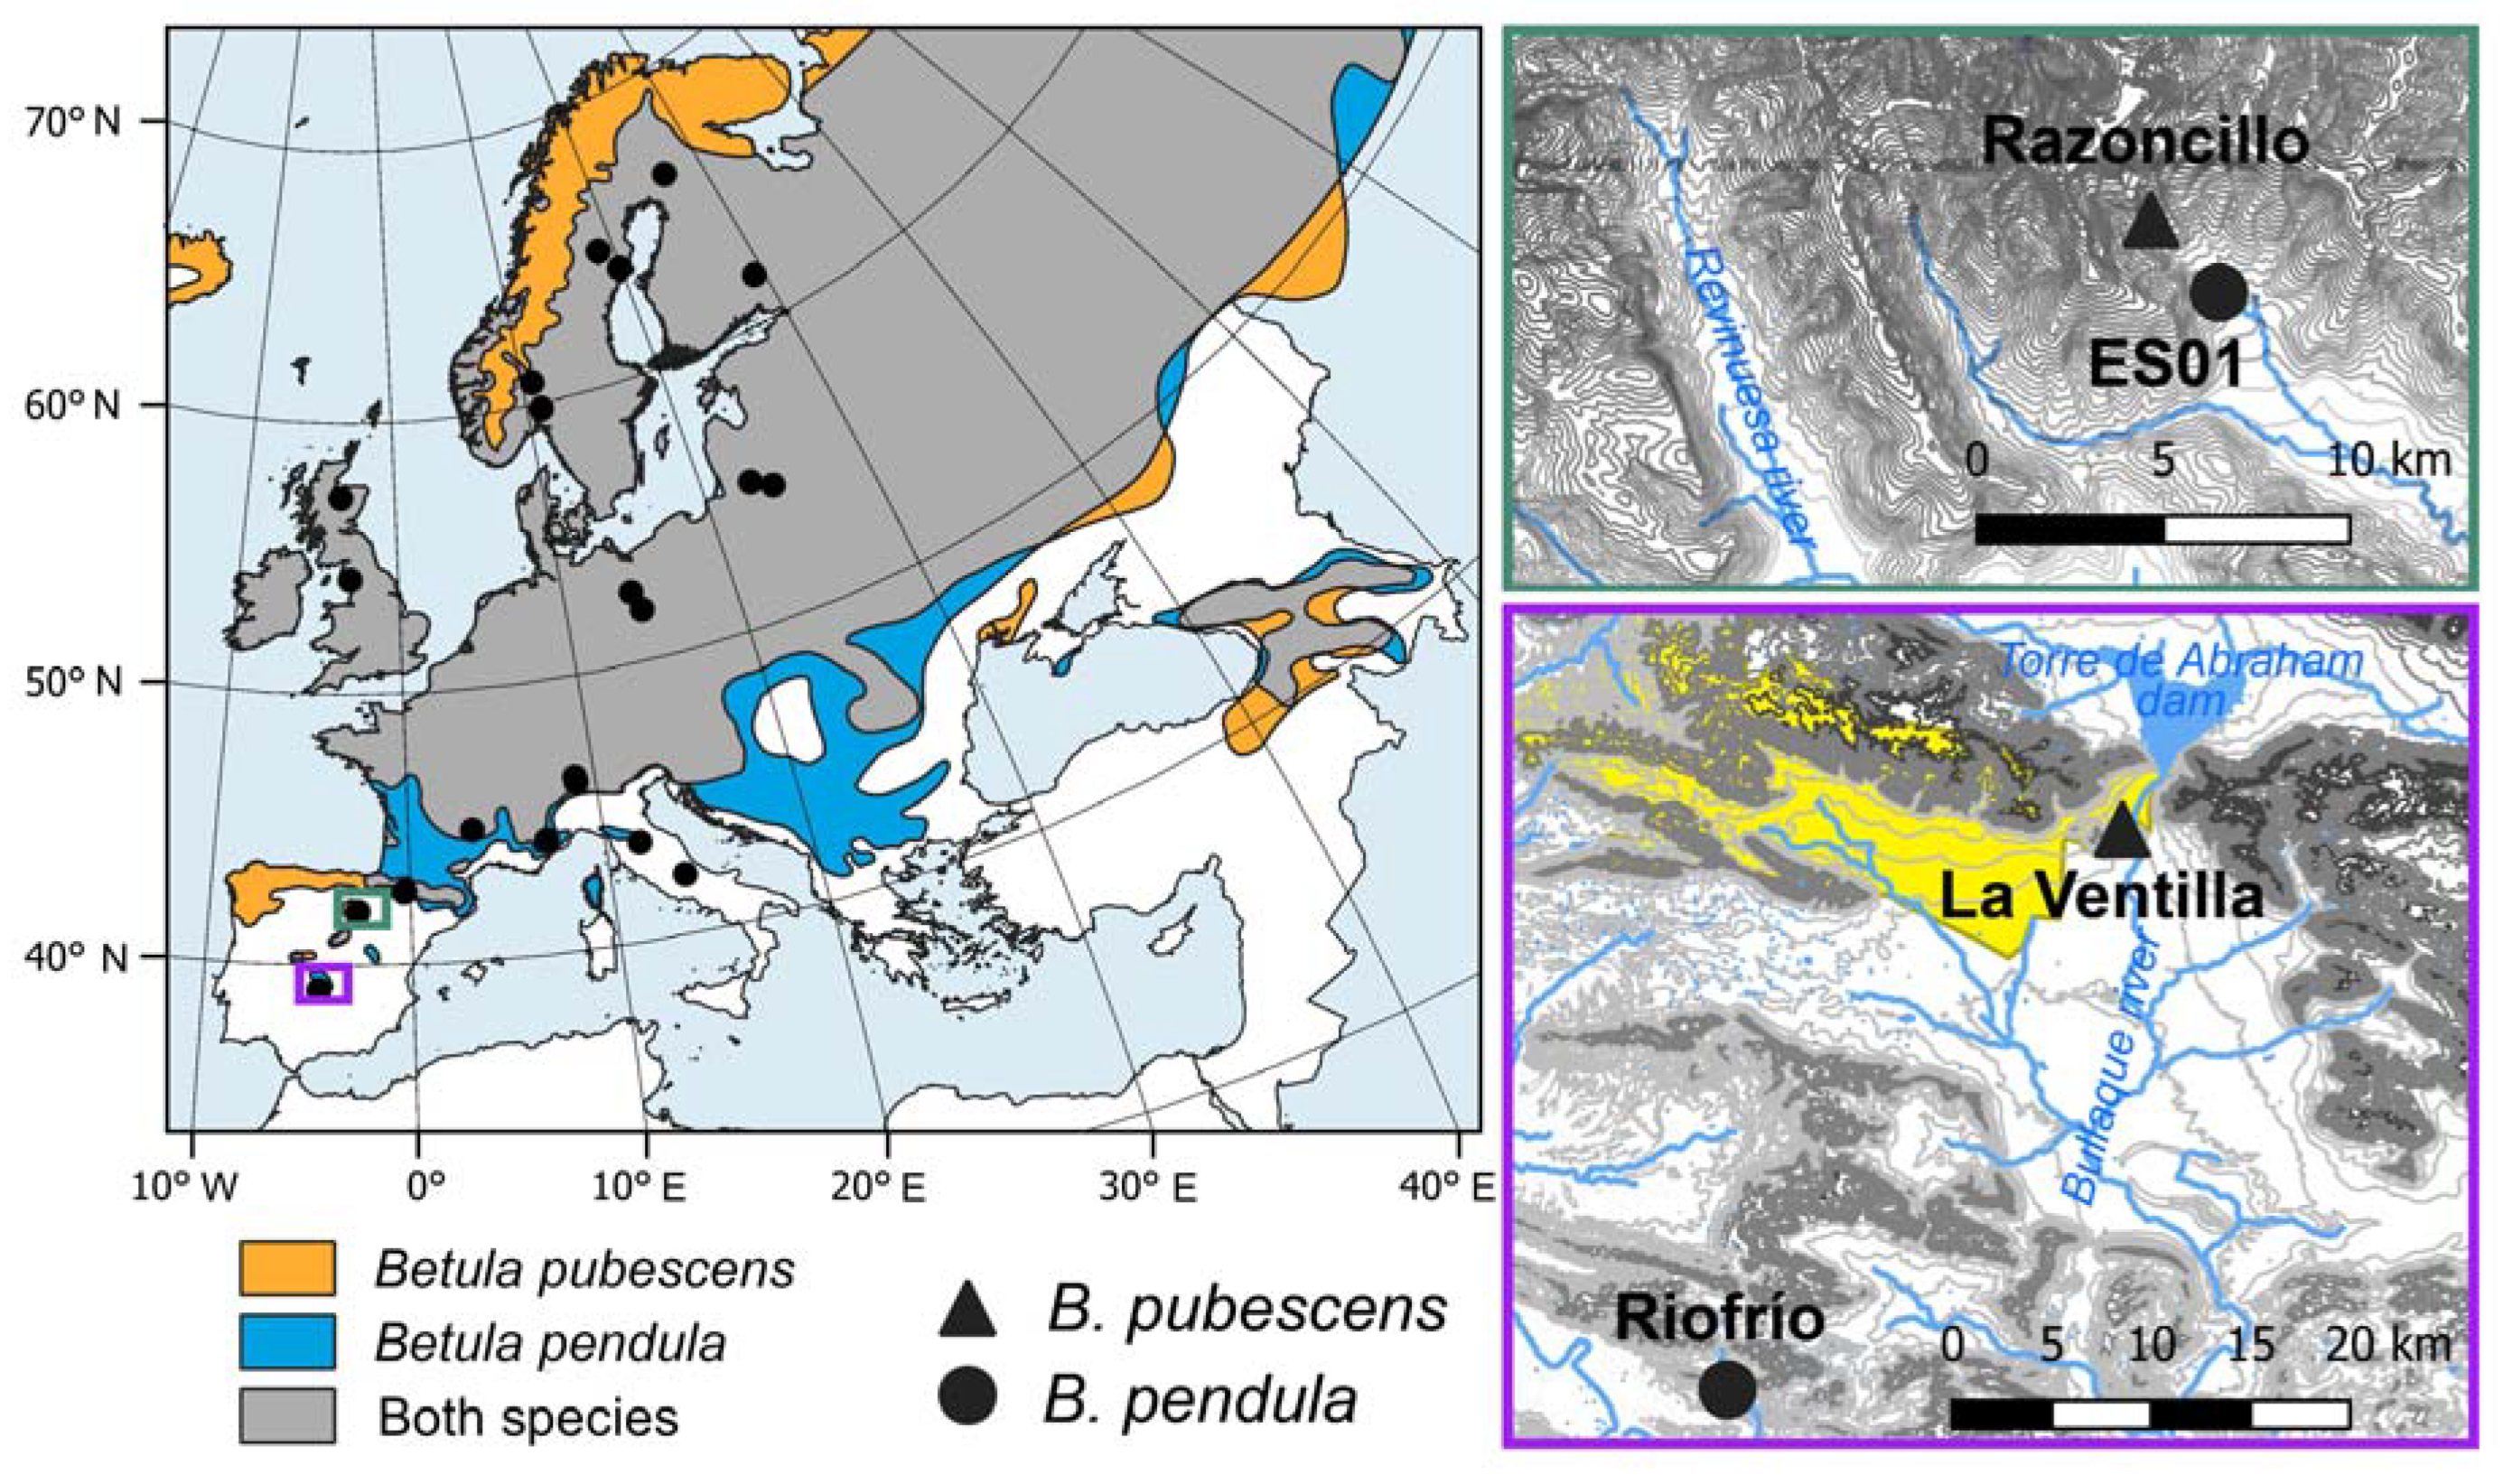
Figure 1. Distribution range of Betula pubescens (orange area), B. pendula (blue area) and the area where the distribution ranges of both species overlap (grey area) according to de Rigo et al. [42] (left). Location of Spanish study sites corresponding to the Iberian System (top right) and the Toledo Mountains (bottom right). The yellowish area indicates the limits of the “Cabañeros” National Park. Symbols indicates the location of the study sites of B. pubescens (triangles) and B. pendula (circles).
Preprints 77250 g001
Figure 2. Variation of basal area increment (BAI) in the two study species, Betula pubescens (a) and B. pendula (b). Solid lines represent the means and shaded areas around them the standard error of the mean. Dash lines show significant (p < 0.05) trends in mean BAI before and after detected break point dates. The bars show sample depth (number of measured radii) with the same colors as those used for symbols.
Preprints 77250 g002
Figure 3. Bootstrapped correlations between monthly mean temperature (upper panels) and monthly total precipitation (bottom panels) during the period 1980 – 2021 based on standardized site chronologies of ring-width indices (RWI) from Betula pubescens (a) and B. pendula (b). Different colors represent rear-edge (purple symbols and bars) and core populations (purple symbols and bars). Error bars are 95%-confidence intervals and significant and non-significant effects are represented by filled and empty symbols, respectively. Grey shaded areas indicate the year prior to tree-ring formation (months abbreviated by lowercase letters).
Preprints 77250 g003
Figure 4. Moving bootstrapped correlation coefficients between site ring-width indices (RWI) and Standardized Precipitation-Evapotranspiration Index (SPEI) that showed the strongest correlation (see Figure A4): SPEI3 August in La Ventilla, Riofrío and ES01, and SPEI3 April in Razoncillo. Filled and empty symbols represent significant (p < 0.05) and non-significant correlations, respectively.
Preprints 77250 g004
Figure 5. Estimated smoothing splines (black lines) and their 95% confidence intervals (shaded areas) of the responses of standardized chronologies (RWI) of Betula pendula to climatic variables across Europe during the period 1985-2015: Standardized Precipitation-Evapotranspiration Index of August calculated at 3-month time scale (SPEI3.Aug; a), SPEI of February calculated at 1-month timescale (SPEI1.Feb; b), precipitation from previous September (c) and April temperature (d).
Preprints 77250 g005
Figure 6. Biplots showing the sites’ scores in the first (PC1) and second (PC2) principal components of a Principal Component Analysis (PCA) calculated on the covariance matrix of Betula pendula tree-ring width standardized chronologies (RWI) (a), and on the covariance matrix of correlations between monthly temperature and precipitation and RWIs (b) for the common period 1985‒2015. The variance of each component is shown between parentheses.
Preprints 77250 g006
Table 1. Characteristics (mean ± standard error) of sampled sites and birch trees.
Betula pubescens Betula pendula
Site ID La Ventilla Razoncillo Riofrío ES01
Latitude (º N) 39º 20’ 25” 41º 59‘ 12“ 39º 05’ 00” 41 58‘ 08“
Longitude (º W) 4º 16’ 40” 2º 38‘ 38“ 4º 30’ 10” 2º 37‘ 19“
Elevation (m a.s.l.) 638 1555 648 1290
DBH (cm) 49.9 ± 3.1 35.0 ± 1.3 40.8 ± 1.6 29.8 ± 1.8
Tree age (years) 38 ± 2 67 ± 4 46 ± 2 40 ± 2
No. sampled trees (No. radii) 21 (44) 12 (24) 23 (46) 25 (50)
TRW (mm) 1 5.01 ± 0.27 1.43 ± 0.11 3.10 ± 0.22 3.46 ± 0.28
AC1 0.71 ± 0.03 0.62 ± 0.04 0.73 ± 0.02 0.52 ± 0.06
Rbar1 0.278 0.360 0.296 0.239
MS1 0.297 0.369 0.288 0.318
EPS1 0.864 0.871 0.906 0.863
Variables’ abbreviations: coarse woody debris (CWD), diameter at breast height (DBH), tree-ring width (TRW), first-order autocorrelation (AC), mean inter-series correlation (Rbar), mean sensitivity (MS), expressed population signal (EPS). 1 Calculated for the period 1980-2021 (with EPS > 0.85) on raw (TRW, AC) or standardized (Rbar, MS) ring-width values.
Table 2. Linear mixed effects models (LMM) characterizing the aggregate effect of regional climate and local hydrological conditions on radial growth of study birch populations in Spain during the period 1980-2021. For each predictor variable the F statistic and the associated p value (+p<0.1; *p<0.05; **p<0.01; ***p<0.001) are shown.
Species Site Variable F
Betula pubescens La Ventilla Prec. Jul 2.161
Prec. aug 0.448
SPEI3 August 9.317**
Dam inflow Nov-1 15.335***
Razoncillo Temp. Feb 1.164
Temp. Jun 10.660**
Prec. Feb 0.216
Prec. May 2.780+
SPEI3 April 6.610*
Betula pendula Riofrío Prec. Sep-1 3.897*
Prec. Feb 2.472
Prec. Jul 0.539
SPEI3 August 7.357**
River flow Feb 7.983**
ES01 Temp. Feb 2.981+
Temp. Apr 0.317
Temp. May 25.944***
Temp. Aug 29.684***
Prec. Jul 1.760
SPEI3 August 4.019*
River flow Sep-1 3.942*
Table 3. Generalized additive mixed models (GAMM) fitting ring-width index (RWI) chronologies of Betula pendula across Europe against climatic variables for the period 1985-2015.
Variable Effective degree of freedom F-statistic p-value
Temp. Apr 2.034 8.912 0.002
Prec. Feb 2.626 5.636 <0.001
SPEI3 August 2.442 14.307 <0.001
SPEI3 May 2.060 5.869 0.001
R2m 0.143
R2c 0.303
Disclaimer/Publisher’s Note: The statements, opinions and data contained in all publications are solely those of the individual author(s) and contributor(s) and not of MDPI and/or the editor(s). MDPI and/or the editor(s) disclaim responsibility for any injury to people or property resulting from any ideas, methods, instructions or products referred to in the content.
Copyright: This open access article is published under a Creative Commons CC BY 4.0 license, which permit the free download, distribution, and reuse, provided that the author and preprint are cited in any reuse.
Prerpints.org logo

Preprints.org is a free preprint server supported by MDPI in Basel, Switzerland.

Subscribe

© 2024 MDPI (Basel, Switzerland) unless otherwise stated