1. Introduction
The global trends of rapid urbanization, induced by the increase of population living in urban areas, as well as car-centered mobility have caused a fast change in land use with the replacement of permeable and vegetated areas by built-up and impermeable surfaces. This is the main contributor to the Urban Heat Island (UHI) effect formation, i.e., the difference in thermal balance between urban and rural areas, which further exacerbates the thermal environment in cities, increases building cooling loads, reduces thermal comfort of open spaces and increases threat to human health [
1]. Moreover, by impacting the thermal comfort of urban outdoor spaces, which are vital elements of the urban environment, UHI affects in a way the character of the city in aesthetic, ecological and functional sense [
2]. Indeed, open public spaces have been proven to have various physical, environmental, economic and social benefits for humans [
3]. Their presence is directly linked to the users’ outdoor thermal comfort [
4,
5,
6] as well as to the energy loads of buildings [
7] and have a decisive role in mitigating the intensity of the UHI. Even though the awareness about the impacts of climate change is rising, most public spaces have been designed without deep concerns for climate factors such as air temperature, air humidity, wind speed and radiation fluxes so far [
8], but rather often in response to certain urban planning quantitative “minimum” standard or compensatory mechanisms. Therefore, redesigning open public spaces to make cities adapt against unpredictable and more frequent extreme events in a changing climate scenario could significantly contribute to the mitigation of the UHI adverse effects. Thus, assessing climatic and comfort conditions of public spaces at the intra-urban scale is crucial for resilient urban planning. Indeed, climate environments within the urban area depend not only on the meteorological parameters (e.g.,temperature, moisture content of the air, rain, wind, fog, snow, insolation, cloudiness and general air quality) [
9] but on the site-specific features as well (e.g., urban morphology, the presence of greenery, the surface materials, the use of the public space) [
10].
Strategies for UHI mitigation could be broadly classified into three main categories: vegetation increase, change of surface material or color and urban form modification [
11]. Urban greenery affects the microclimate by providing shading, evapotranspiration, air flow regulation and heat exchange [
12,
13,
14]. Although different methods of applying this strategy have been verified to improve thermal comfort, e.g., green roofs, walls, park areas, the strongest cooling potential of the trees is due to shading [
9,
15]. Surface materials have a significant impact on the thermal balance of urban areas due to their capacity to absorb radiation and dissipate accumulated heat in the atmosphere, causing an increase in the ambient temperature [
16]. Massive use of low albedo materials, such as asphalt or dark concrete, contributes to the deterioration of climatic conditions and thermal comfort. Replacing the low albedo surfaces with “cool materials” in the urban area leads to higher reflectivity of solar radiation and contributes to the decrease of surface temperatures, resulting in the improvement of thermal comfort [
16,
17,
18]. Finally, the urban morphology, (street orientation, building geometry, density and layout) affects the urban microclimate in different ways [
10]. Building density and orientation modify the penetration of light, the trapping of short and longwave radiation and affect the airflow in urban canyons [
19,
20]. Changes in the urban morphology features, including orientation and height diversity of urban blocks [
21] and their configuration and geometry [
22], can significantly improve microclimatic conditions. Other mitigation strategies include the effect of water [
23,
24,
25], reducing human heat release, change in roof design [
26], controlling solar access through shading structures [
16,
17] and airflow [
9].
These categories of strategies might all encompass urban streets redesign to a certain extent. Indeed, in most cities streets mostly support “hard mobility”, i.e., a form of high-emission people and goods movement centered on high-speed, energy-intensive, land-intensive [
27], and mostly grey infrastructure, poor in vegetation and permeable surfaces. This model is in contrast with a growing and urgent need for “soft mobility”, i.e., zero-emission mobility centered on pedestrian, biking and transit infrastructure. Indeed, designing for hard mobility intensifies the UHI effect through additional heat fluxes from vehicles and overheated urban surfaces, resulting in higher heat stress and health risks for pedestrians [
28]. On the contrary, reducing hard mobility spaces has been proven to decrease the amount of traffic in the examples of San Francisco; Portland, Oregon; Milwaukee, Wisconsin; Seoul, South Korea [
29]. Furthermore, research has shown that the transition from hard to soft mobility allows for the implementation of different mitigation strategies, resulting in the improvement of thermal conditions [
28,
30]. Indeed, promoting policies for boosting pedestrianization and walkability is one of the most effective strategies for developing mobility oriented towards humans and climate friendliness [
31].
As recalled, public space and mobility layout heterogeneous features are highly influencing the urban thermal environment, which, in turn, might result in a different local climate, i.e., urban microclimate. Urban microclimate is defined as the climate that prevails at the micro-scale level, referring to an area of up to one kilometer [
32]. At this scale, individual structures and trees affect the climate conditions by casting shadows, reflecting sunlight and altering the wind flow, directly influencing the thermal comfort of people as well as the energy performance of the adjacent buildings. Analysis of the microclimatic conditions and thermal comfort in urban areas has been advancing along with the development of computational simulation technologies. Modelling urban elements and climate at the micro-scale has enabled analysis of the impact of different urban features on climatic conditions for the examination of existing environment, prediction of the microclimate conditions under different planning scenarios and the verification of the effectiveness of the applied strategies and policies. These models have become instruments to facilitate communication between technical and non-technical professionals [
33] to support decision and policy making. The most common tools for simulating microclimate processes are Computational Fluid Dynamics (CFD) models, due to their ability to address a wider range of issues including air flow, air quality, pollution and thermal comfort, compared to other numerical tools [
34,
35].
There has been little research examining the link between microclimate, thermal comfort and urban mobility layout in the urban areas yet. Besides, given the need of site-specific assessment and strategy proposal in the field of the UHI [
1], this paper seeks to analyze the effect of urban mobility layout on microclimate and thermal comfort to finally explore its potential in terms of UHI mitigation. To this end, a real-world case study has been examined, i.e., the city of Turin, north-western Italy, via a comprehensive and extended analysis linking its peculiar urban mobility layout to microclimate features for proposing UHI mitigation design scenarios. Since proposing redevelopment scenarios based on site-specific strategies should be informed by evidence [
36], we have been carrying out advanced microclimate simulations to assess how different clusters of urban streets (which, in turn, are a function of their layout, mobility supported, and type of surfaces) might be redesigned considering shared spatial features. These evidence-based scenarios could be finally scaled up to the urban level, considering their relevance for each specific cluster of urban streets retrieved, and should ideally inform policymakers and designers for guiding policies and redevelopments of the public space in Turin streets. This paper is structured as follows. After the introduction, section 2 describes the methodology adopted, including the workflow for data collection and clustering of different urban street typologies, case study selection and microclimate simulations. The results of the clustering process and simulations per environmental variable and comfort index considered are presented in section 3. They are discussed in relation to the elements proven in the prior scientific research to have major impact on the microclimatic conditions [
10], i.e., urban canyons, street orientation, surface materials, and vegetation (section 4). Finally, in the Conclusions, we suggest preliminary site-specific redevelopment scenarios, grounding on single or combined strategies, for UHI mitigation in relation to the spatial and microclimate features of the urban street clusters.
2. Materials and Methods
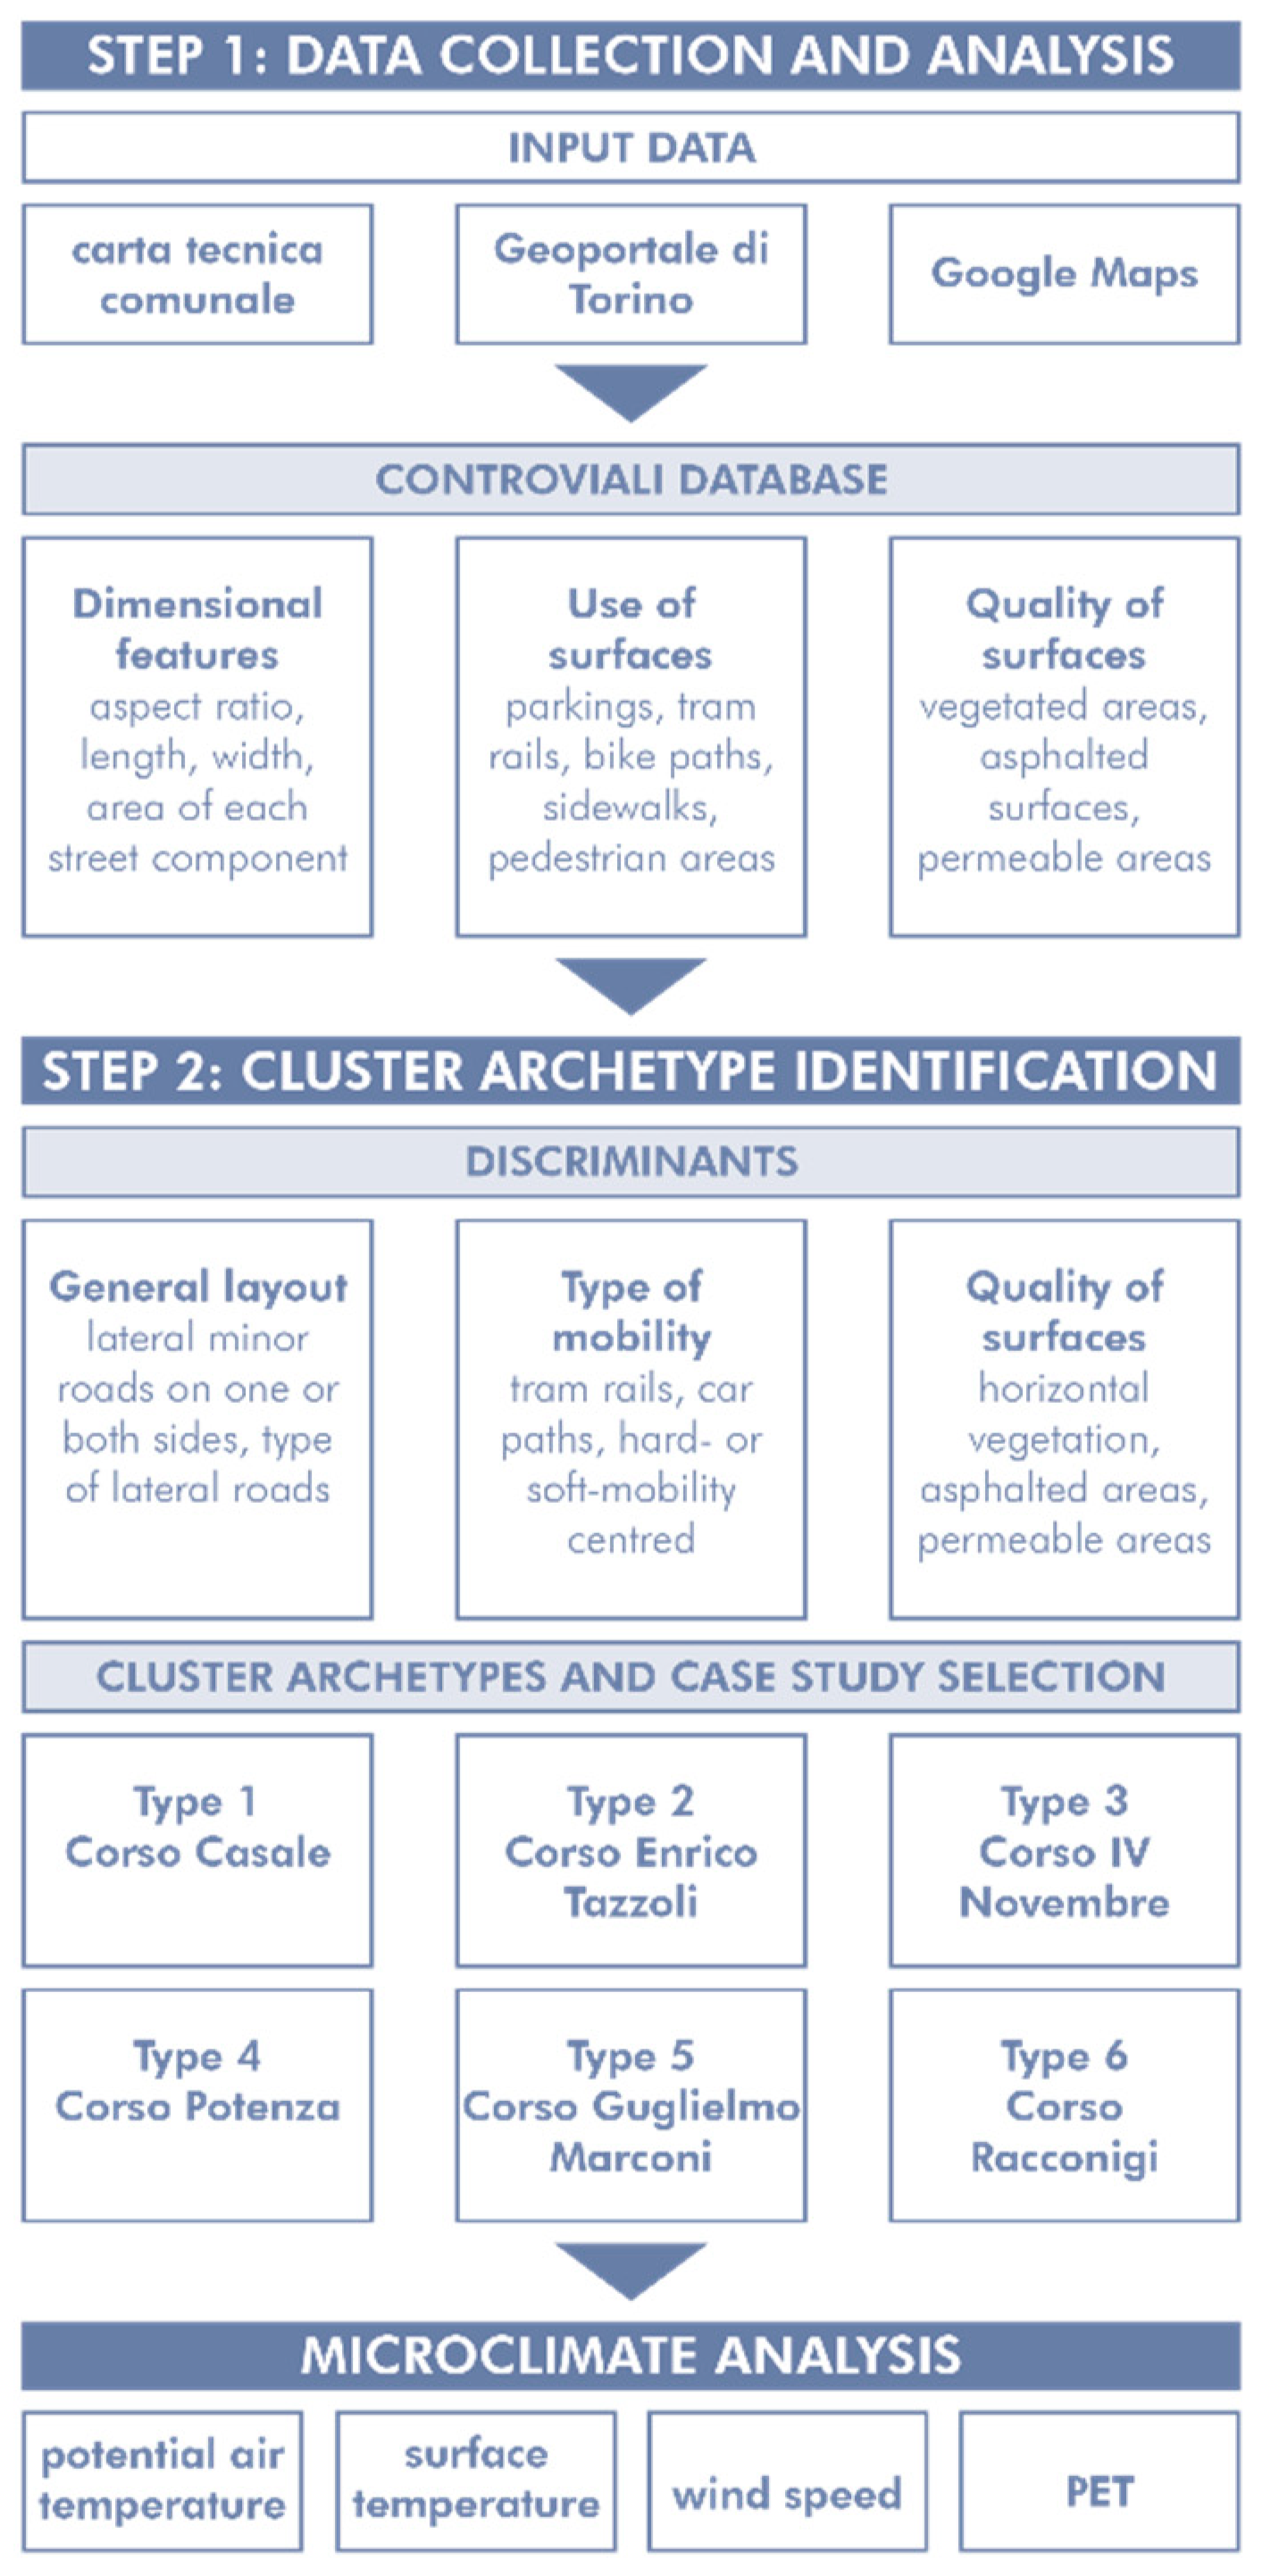
This section reports on the methodological framework adopted in this research (
Figure 1) and tested in the study area of Turin. The first step encompasses urban mobility layout analysis and data collection via several data sources. Data gathered for each boulevard with lateral sides were collected in a unique database, providing relevant information related to dimensional features (i.e., aspect ratio, length, size of central boulevards and lateral streets), use of surfaces (i.e., car parking lots, tram rails, bike paths, sidewalks and pedestrian areas), quality of surfaces (i.e., vegetated and asphalted areas, permeable areas). These data were further synthesized and elaborated into maps and figures, reported in this section as support for the clustering. Indeed, the second step of this research consists of identifying cluster archetypes of urban boulevards with lateral sides in Turin, for each of which the best representative case study was then selected for performing the advanced CFD microclimate simulation (third step).
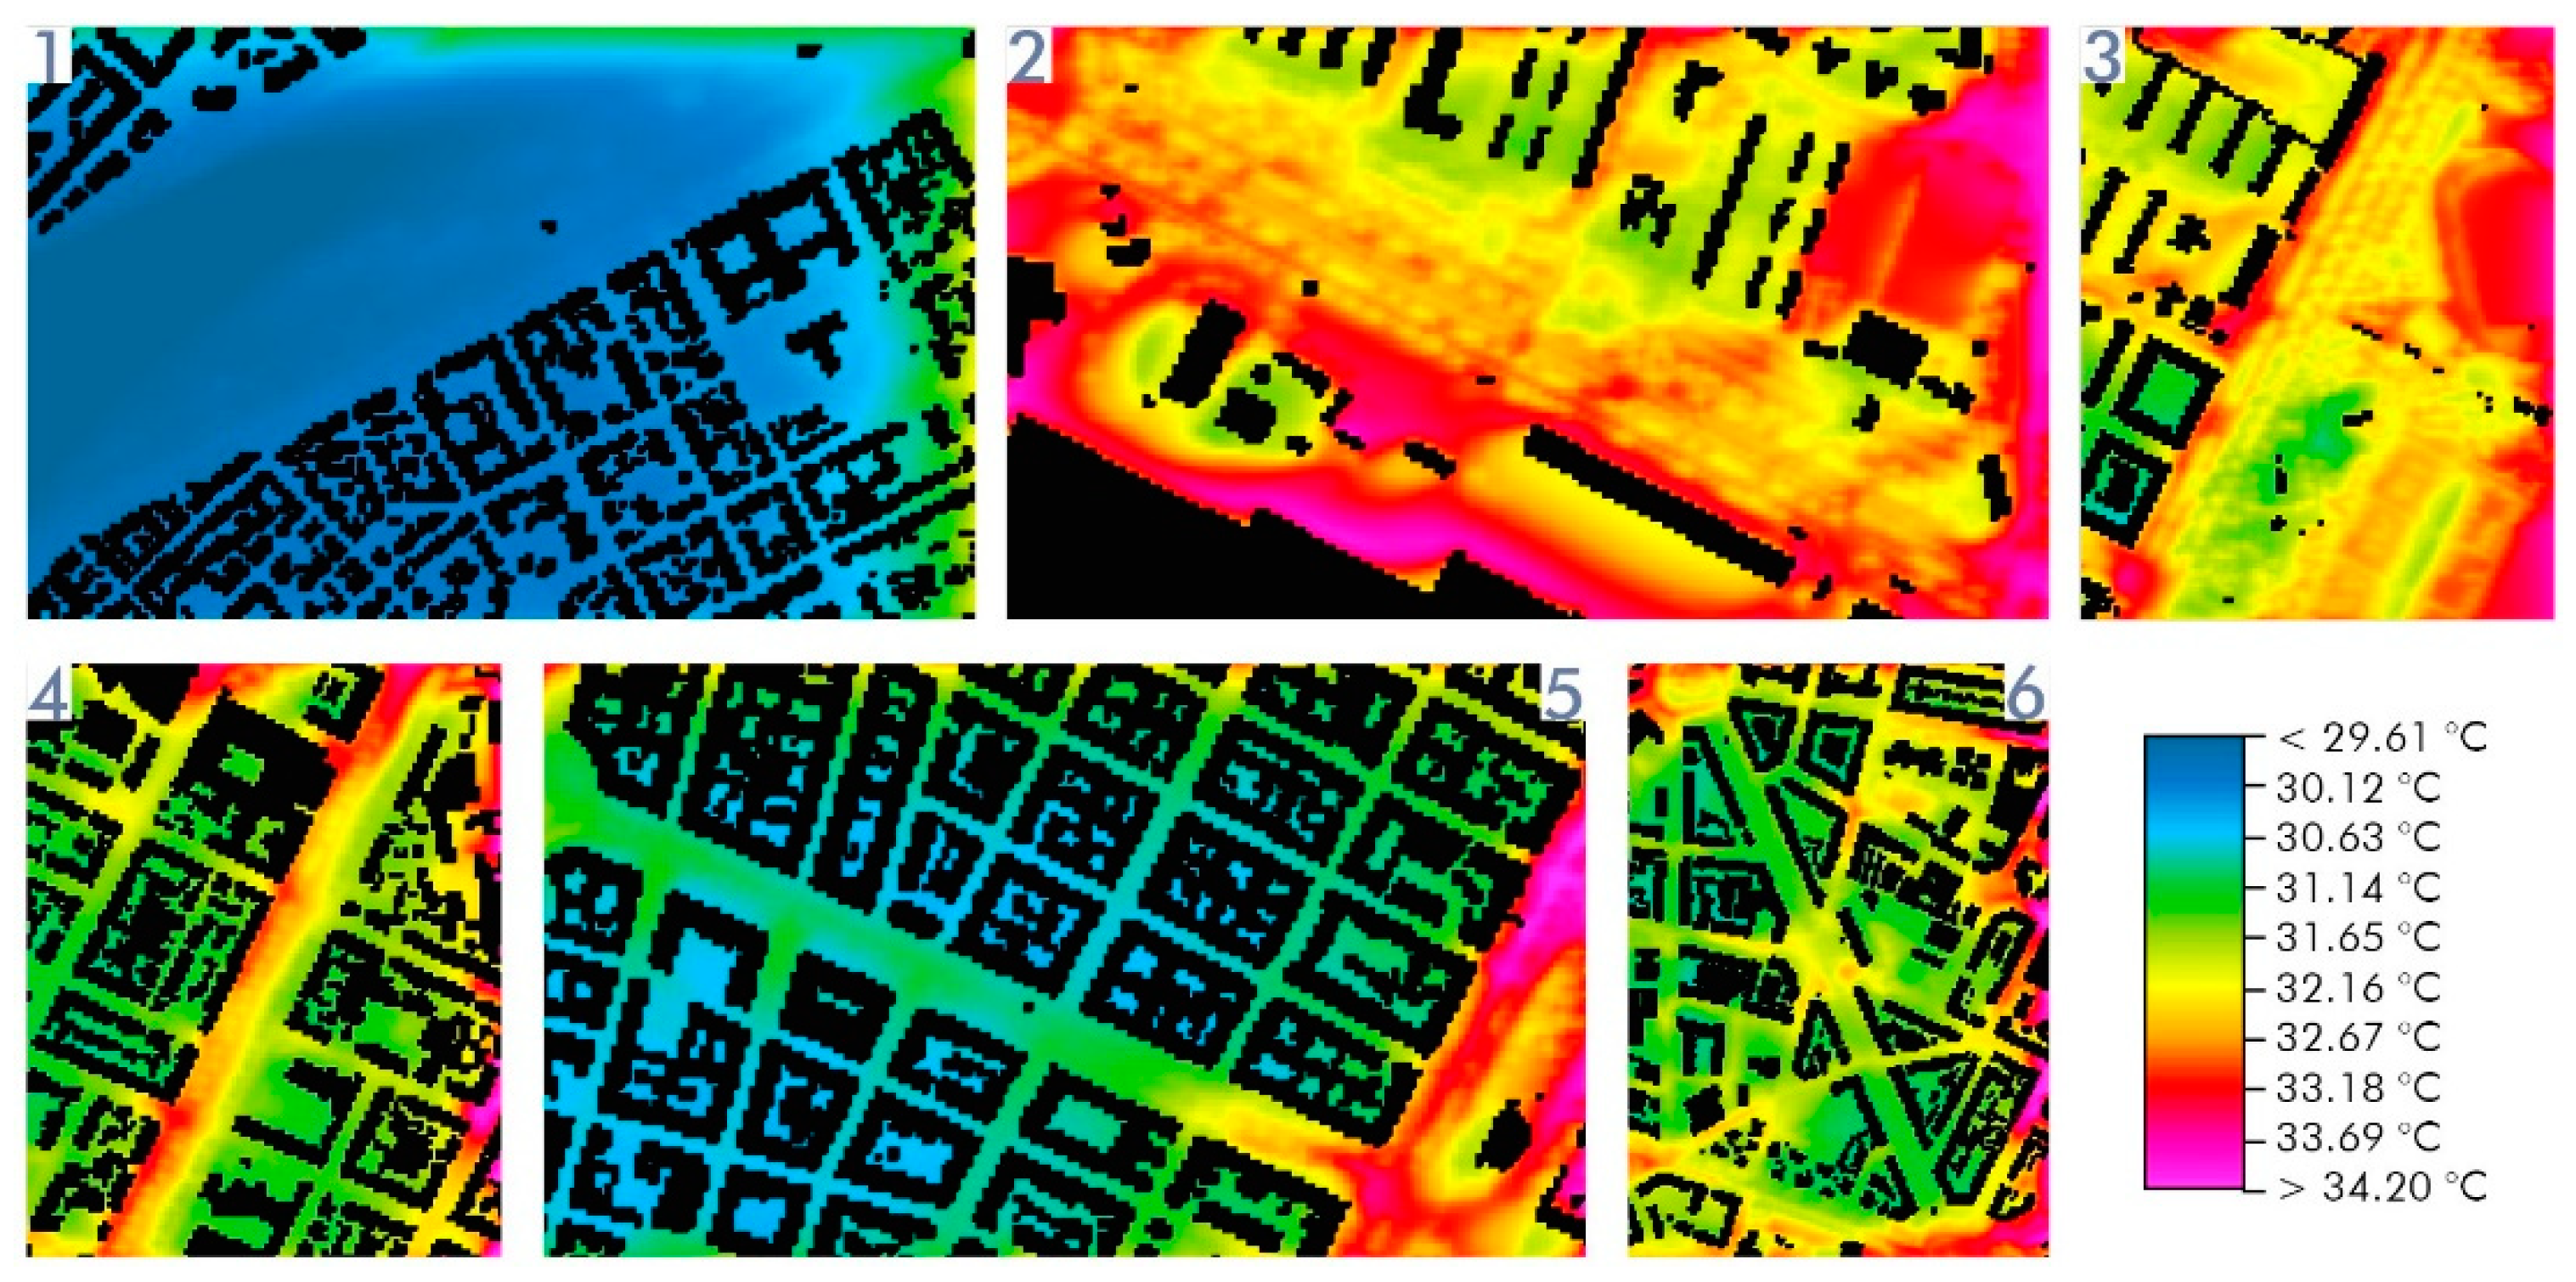
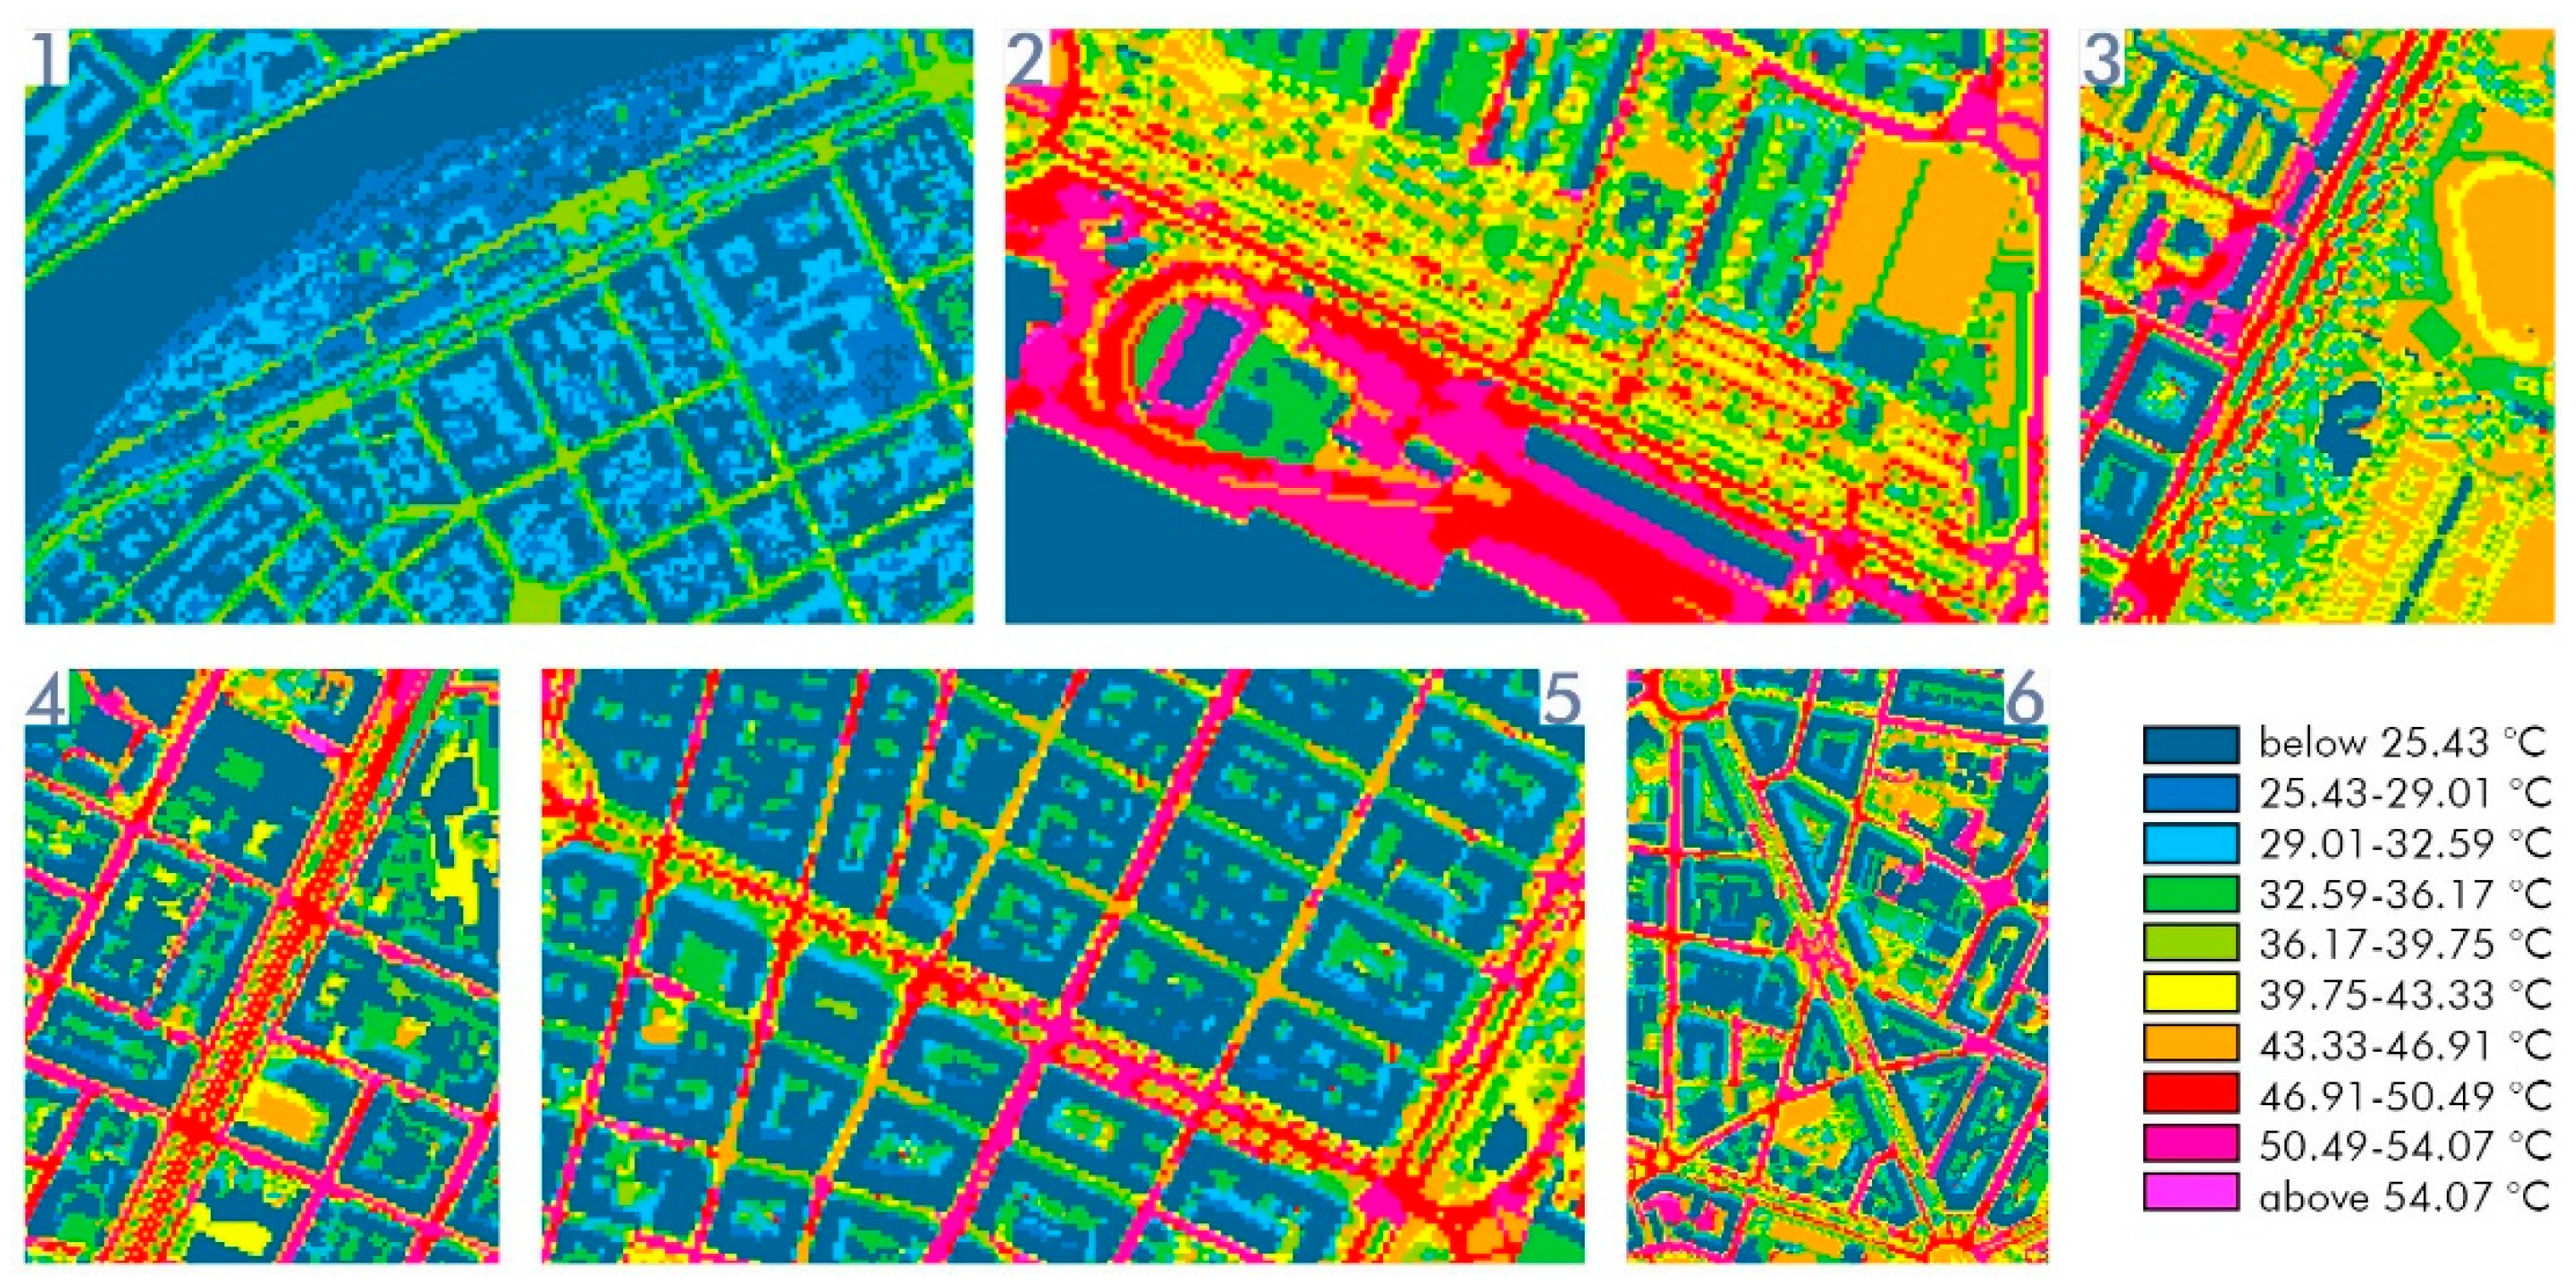
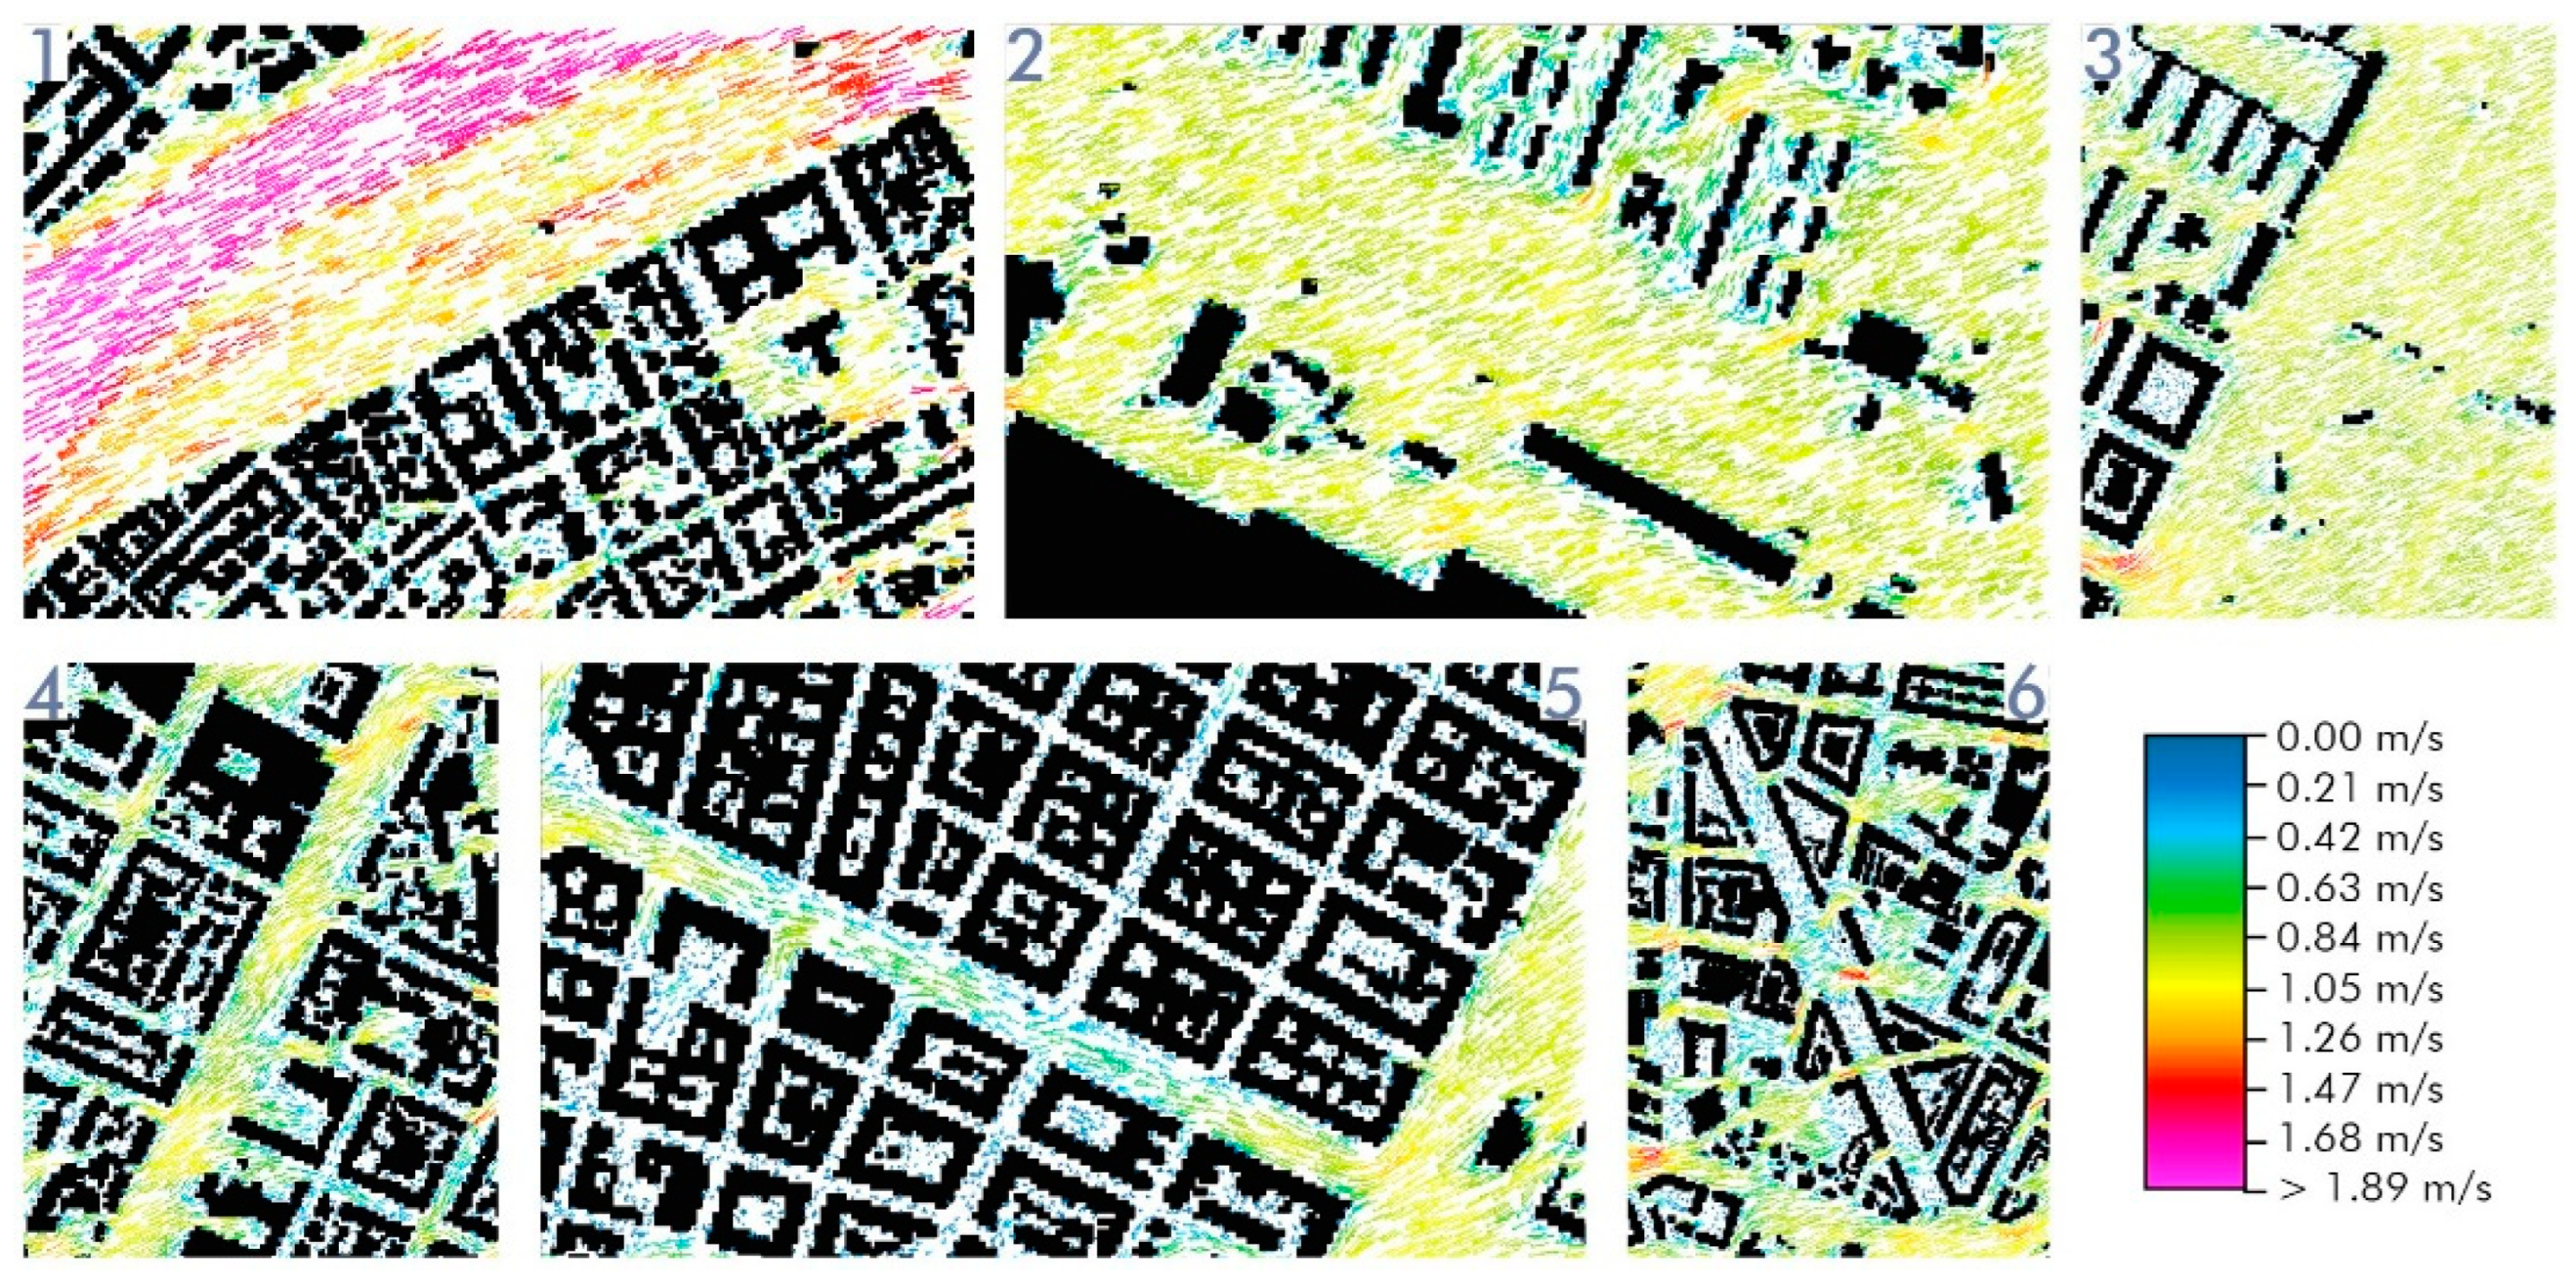
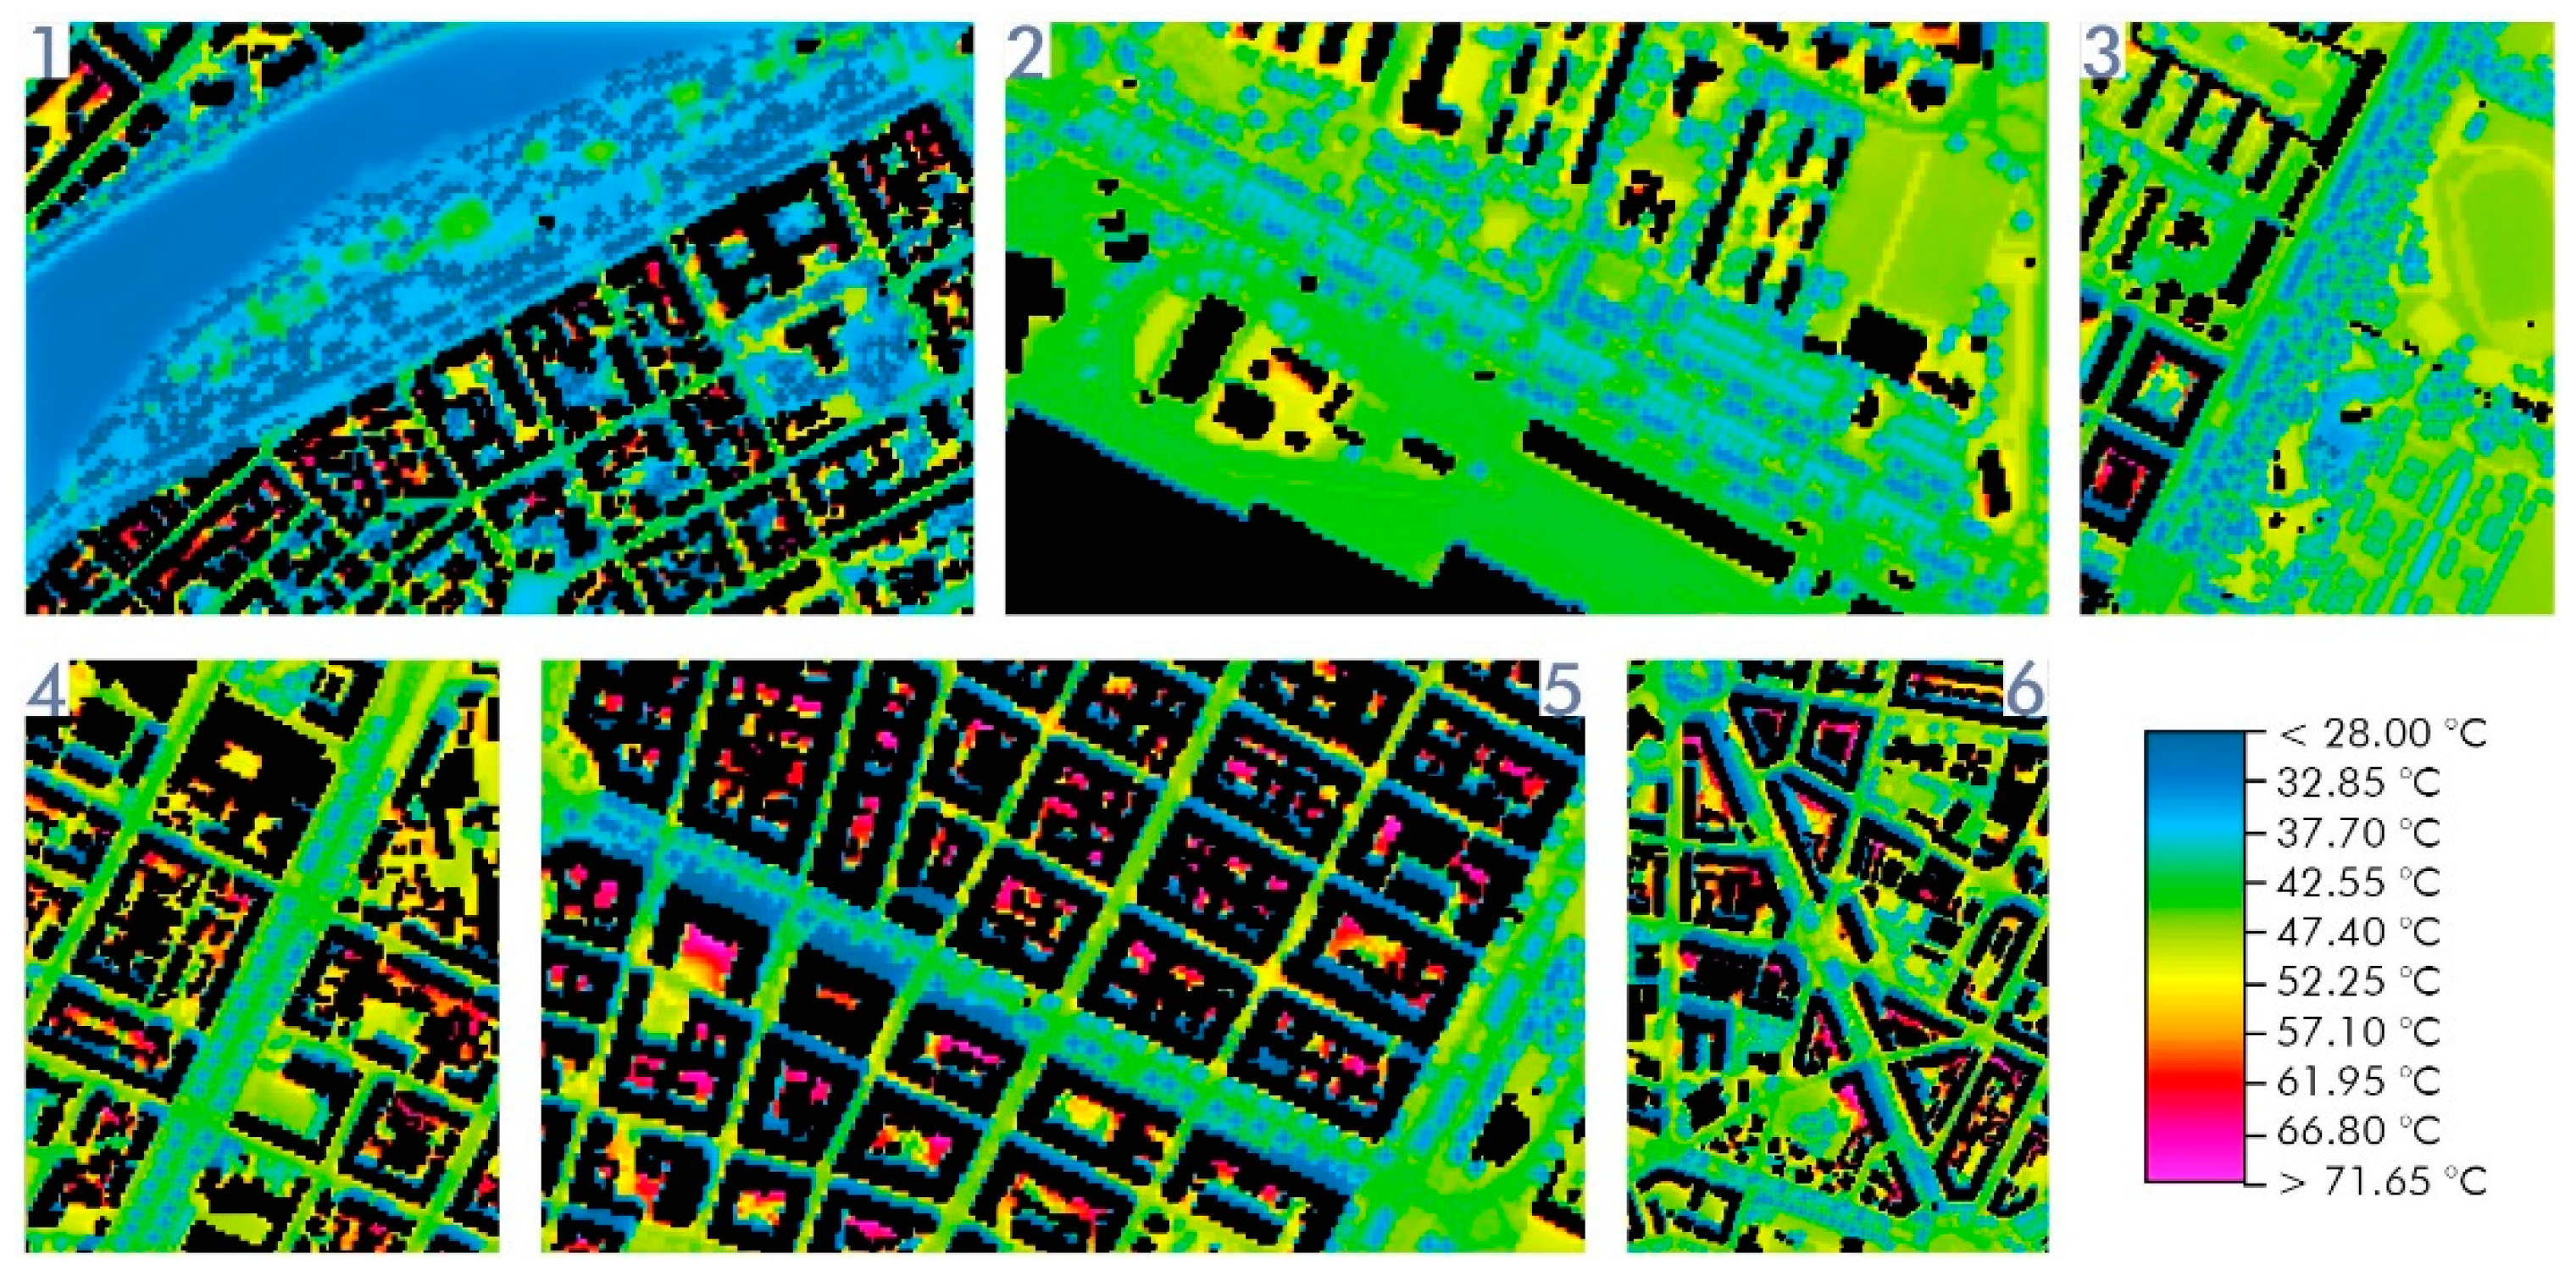
The discriminants for clustering the boulevards correspond to general layout (streets with lateral minor roads on one or both sides and type of lateral roads), type of mobility supported (boulevards with tram rails or car paths only, hard- or softmobility centered boulevards), quality of surfaces (presence of horizontal vegetation, asphalted areas, permeable areas). We chose to base our clustering on these aspects because they mostly refer to how space in streets is used. This might lead to identifying UHI mitigation strategies that imply common changes in land use within those public spaces. Indeed, strategies could ideally be scaled-up to the urban level since clusters of streets share major spatial features. However, the discussions will specifically focus on the selected case studies (one per cluster) to deep dive into the morphological aspects (i.e., urban canyons, orientation, type of surfaces) that are mostly influencing the UHI. Indeed, the microclimate analysis reports on Potential Air Temperatures (PAT), Surface Temperatures (ST), Wind Speed (WS) and Physiological Equivalent Temperature (PET) showing the hour in which the most critical results in terms of thermal comfort were obtained by the simulation, i.e., 14:00. Results at 10:00 and 18:00 were extracted as well, and they are included in the Appendix of this paper. Finally, the microclimate assessment and the spatial/morphological analysis of clusters will support policy and scenario design for the UHI mitigation strategy implementation in the Conclusions. Based on the preliminary analysis presented in the following paragraphs, the results of the clustering process and CFD simulations are presented in
Section 3.
2.1. Study Area
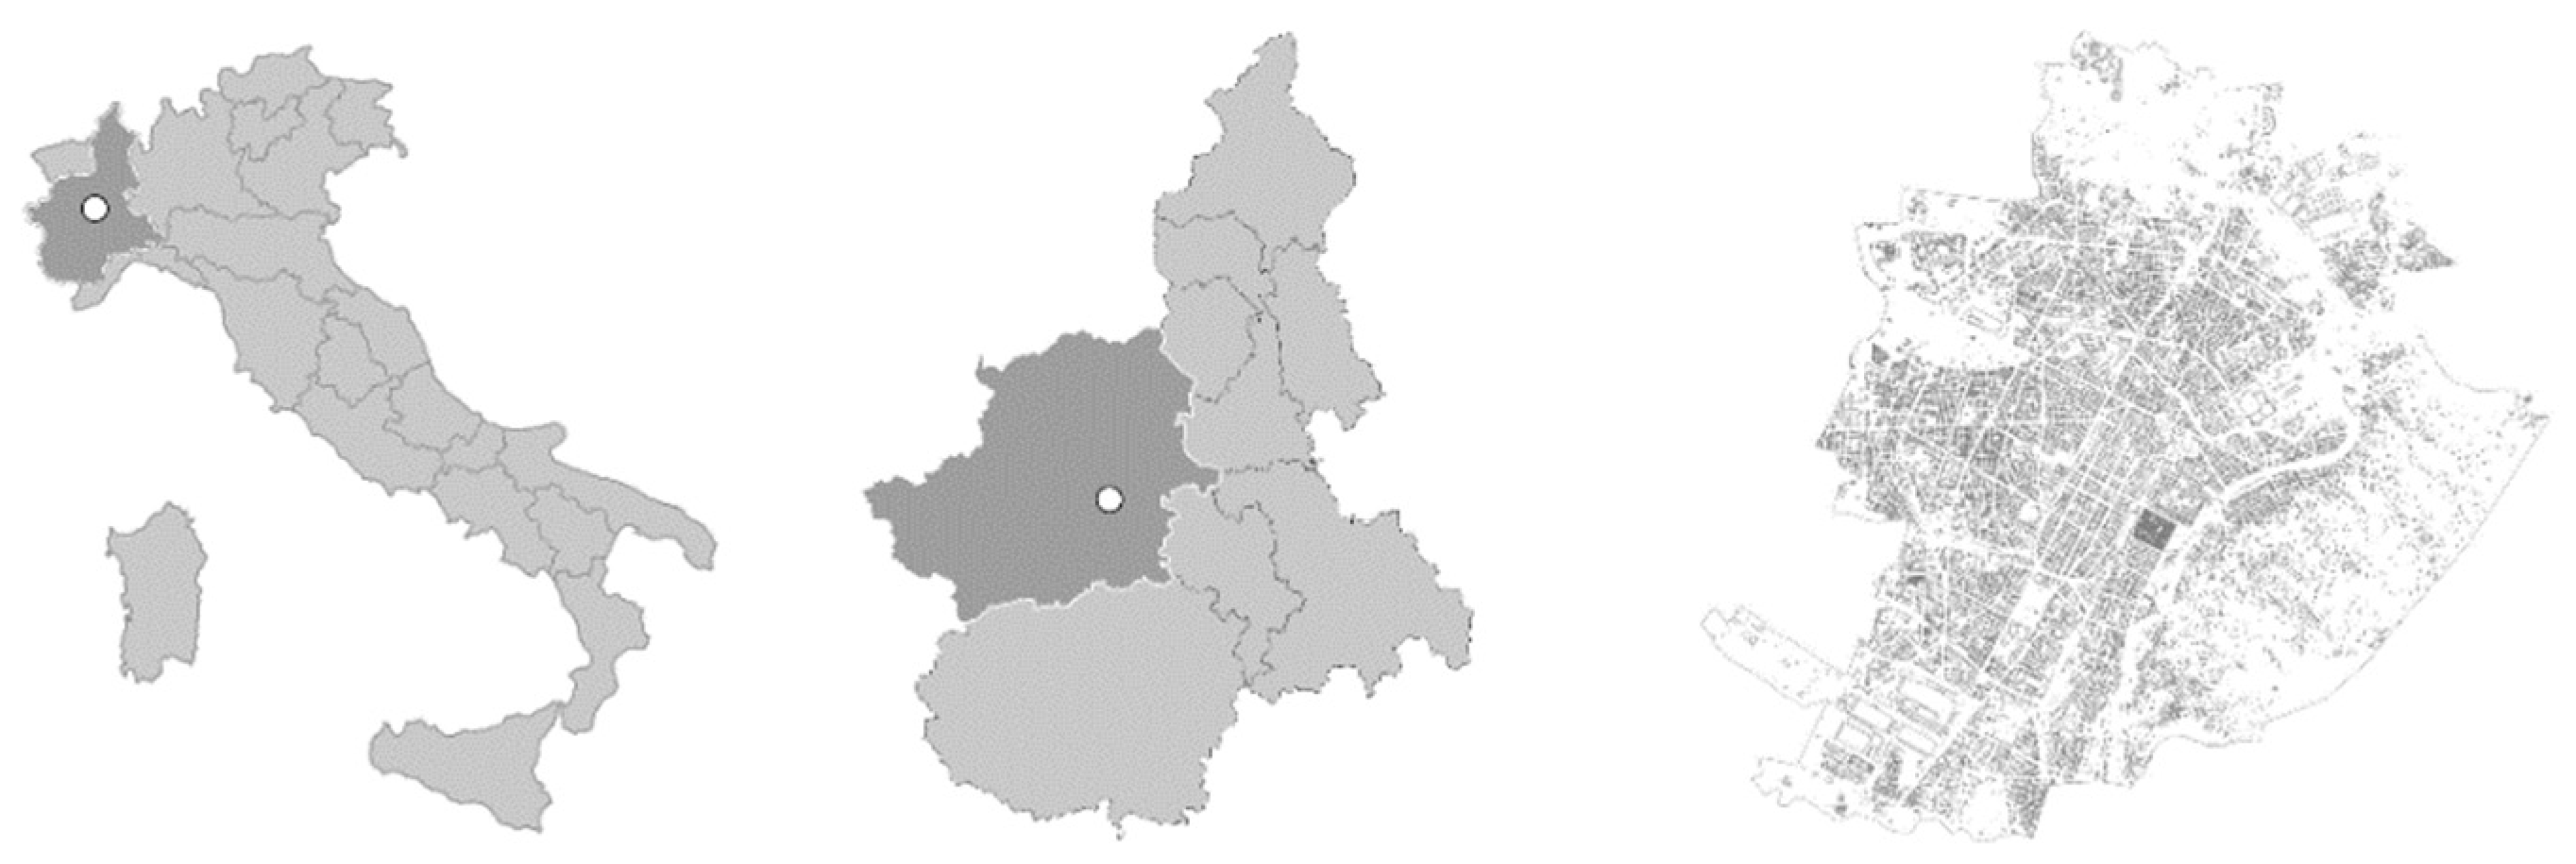
Turin is a city in the Piedmont region, in the northwest of Italy. It is located along the river Po and surrounded by the Alps on the west and north side. Turin (Cfa climate according to the Köppen-Geiger classification) [
37] is the largest Italian metropolitan area in terms of surface (about 6.800 km
2) (
Figure 2). It is also the city in which the most intense Surface Urban Heat Island (SUHI) effect was observed while studying the SUHI phenomenon in 10 Italian cities [
38]. The urban matrix of Turin is characterized by wide tree-lined avenues which consist of a central boulevard, or
viale, and one or two smaller lateral roads, called
controviali. This configuration, probably unique, originated in the 19
th century [
39,
40]. The architect Carlo Promis designed the avenues based on the “allées” which had originated in the 18th century and the Napoleonic period. The project for the avenues was executed between 1851 and 1853, starting from the part of Corso Vittorio Emanuele II from Corso Re Umberto to Piazza Carlo Felice [
40]. In the plan designed by Edoardo Pecco, in the avenues where trees were planted, the minimum distance between the building facades and the row of trees was 12 meters [
39]. This allowed for wide avenues with plenty of vegetation, creating a new urban concept. Analogous solutions emerged soon in the other European cities, such as Haussman’s boulevards in Paris, between 1853 and 1871, and Ring of Vienna in 1858-1859 [
40].
We focus our analysis on boulevards with
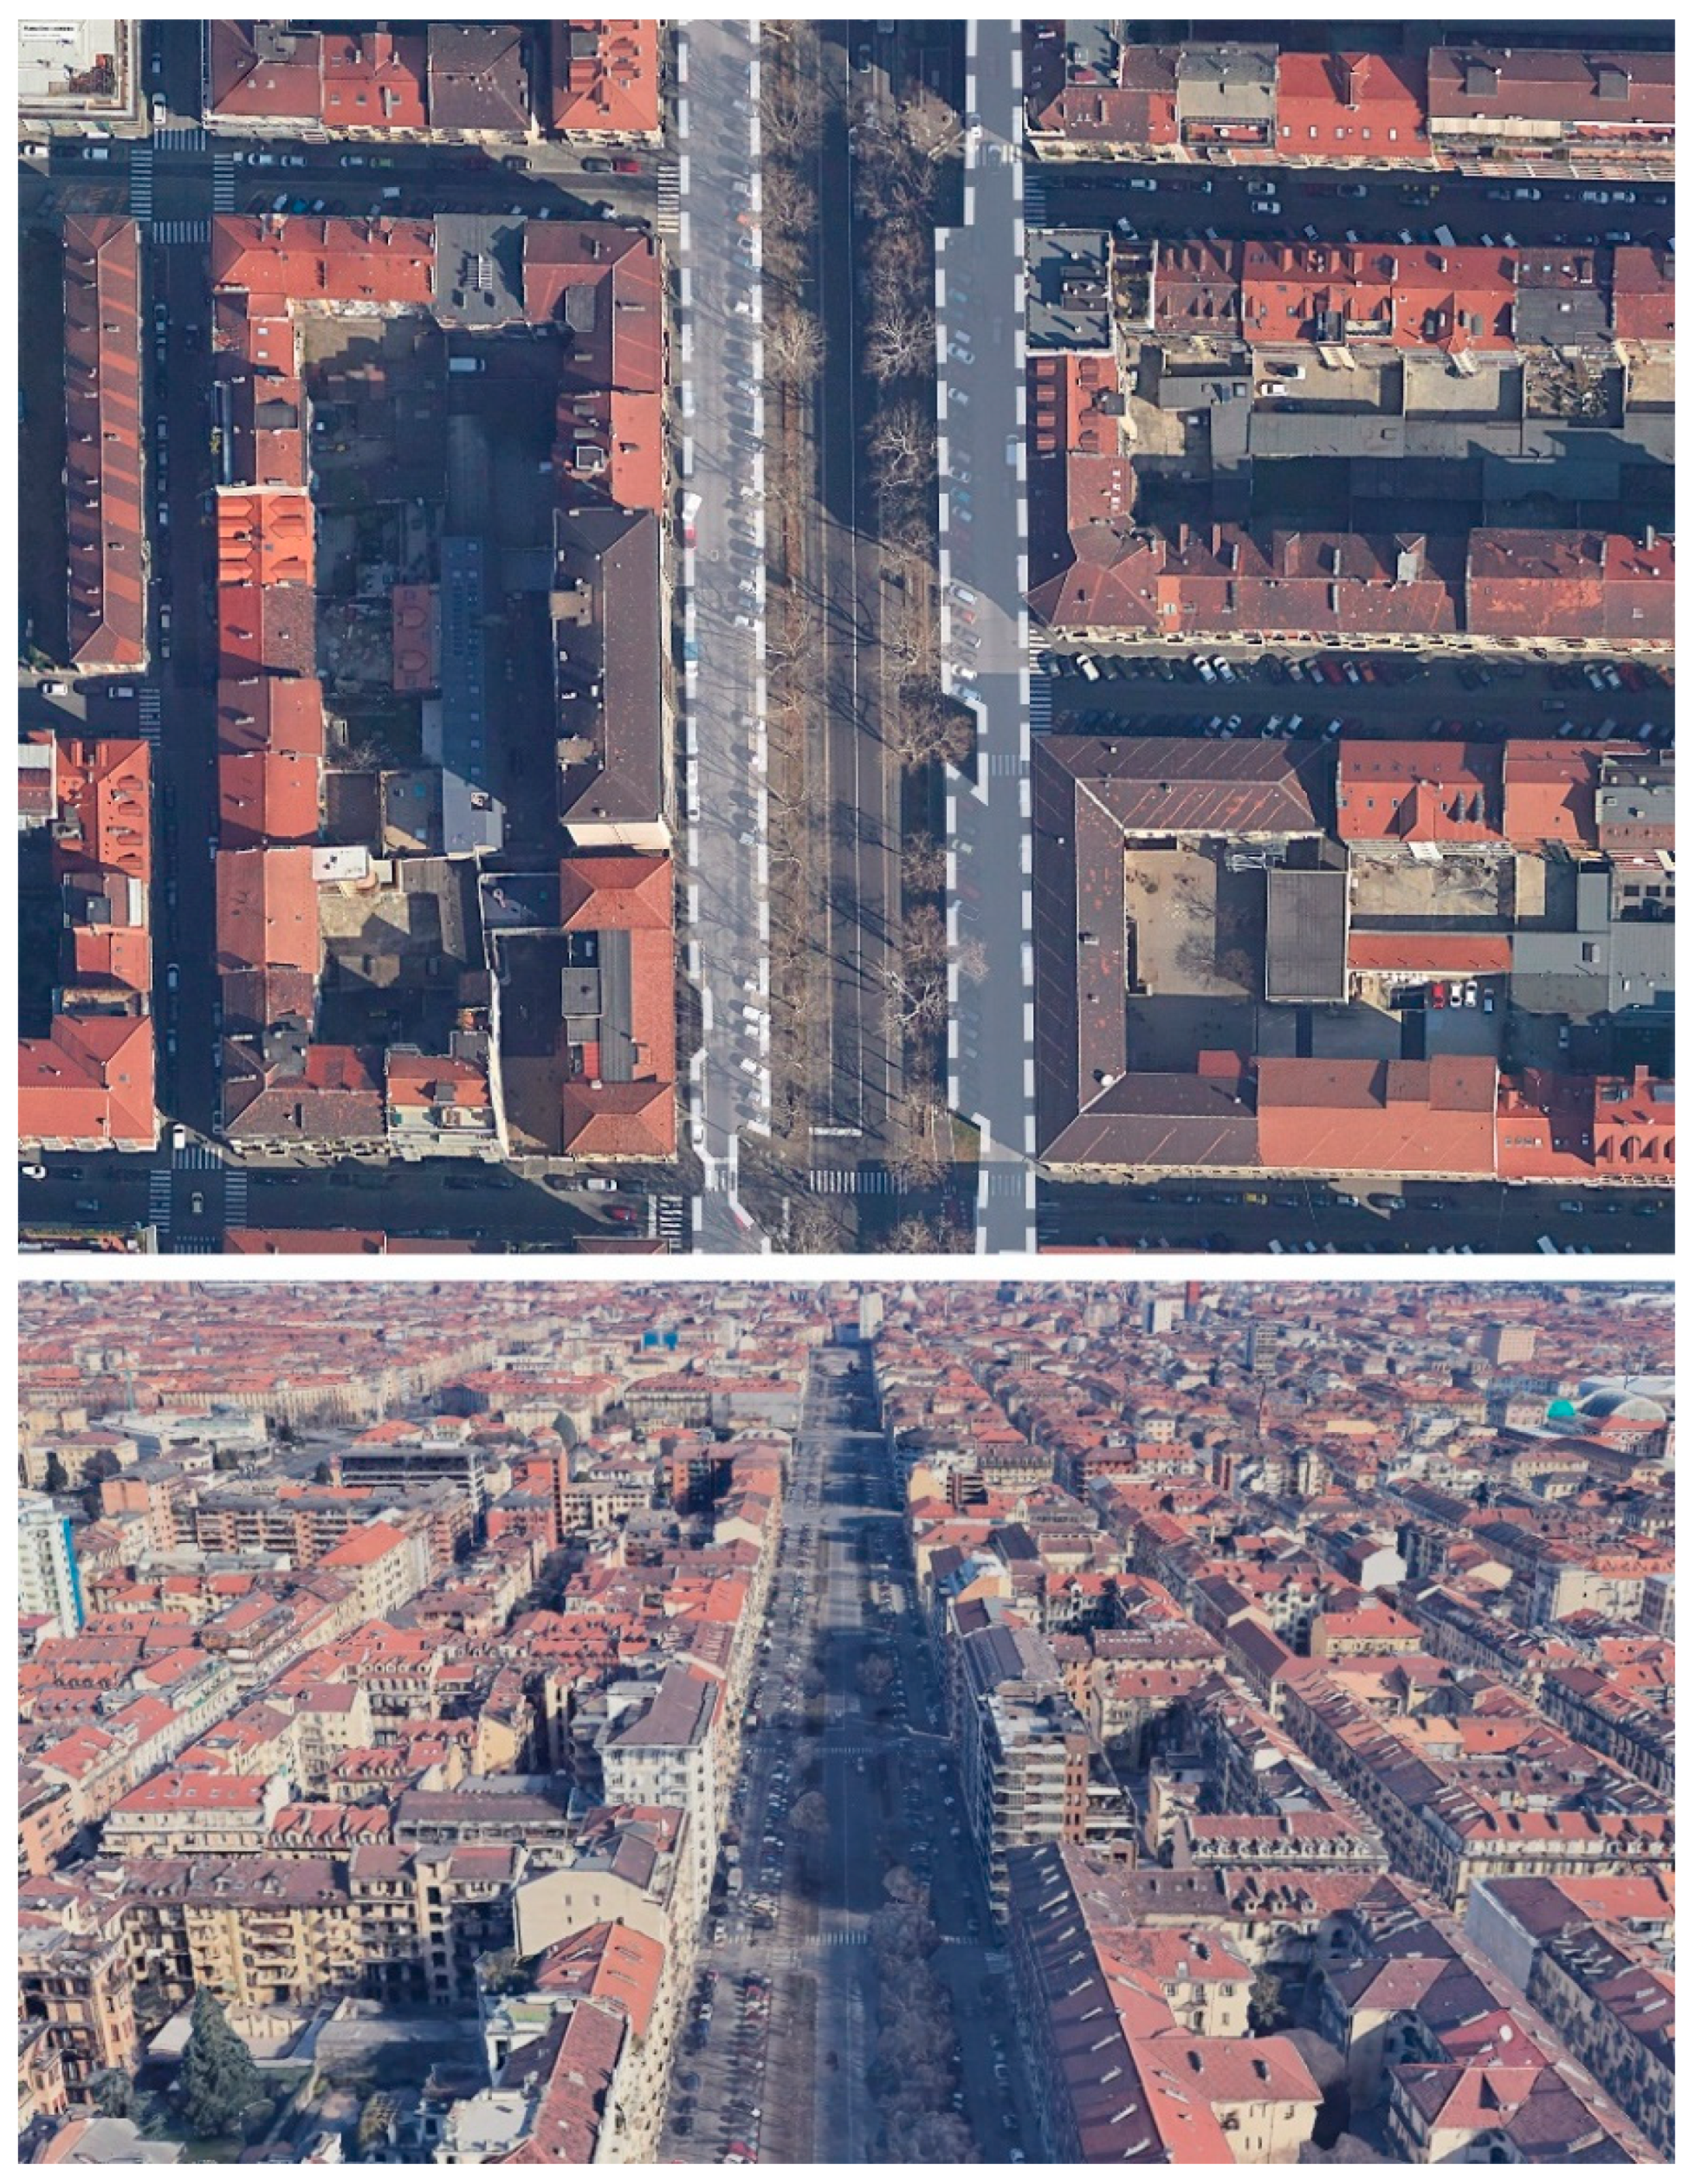
controviali for several reasons. First, they constitute the prevalent mobility scheme in Turin, where all major roads are provided with lateral minor streets, which often allow cars to turn right (
Figure 3). Second, they have great potential in terms of UHI mitigation and climate adaptation if different uses of these spaces were promoted considering future smaller private car volumes. Indeed, given the actual mobility design by
controviali, changing the use of their space should not require reconsidering the entire urban mobility, but rather the upgrade of selected surfaces for boosting soft mobility and implementing the green infrastructure. At present
controviali are mostly used as car parking. with little space for pedestrians, cyclists and transition spaces. Third, the identification of case study site-specific strategies according to the microclimate simulations and boulevard clusters’ features might be scaled-up to the whole city to finally boost the UHI mitigation potential of
controviali.
2.2.1. General Layout
The urban scale analysis for deriving clusters of boulevards with lateral streets was conducted using data from the cadastral maps from Geoportale - Città di Torino (
http://geoportale.comune.torino.it/web/) and Google Maps. Firstly, an analysis of the urban matrix and identification of streets with
controviali was performed, noting every change in the street sections as well. It was discovered that there are 62 boulevards equipped with
controviali in Turin, which, at a deeper analysis, might be divided in turn into 171 different segments with peculiar street sections. The length of the streets is approximately 86,
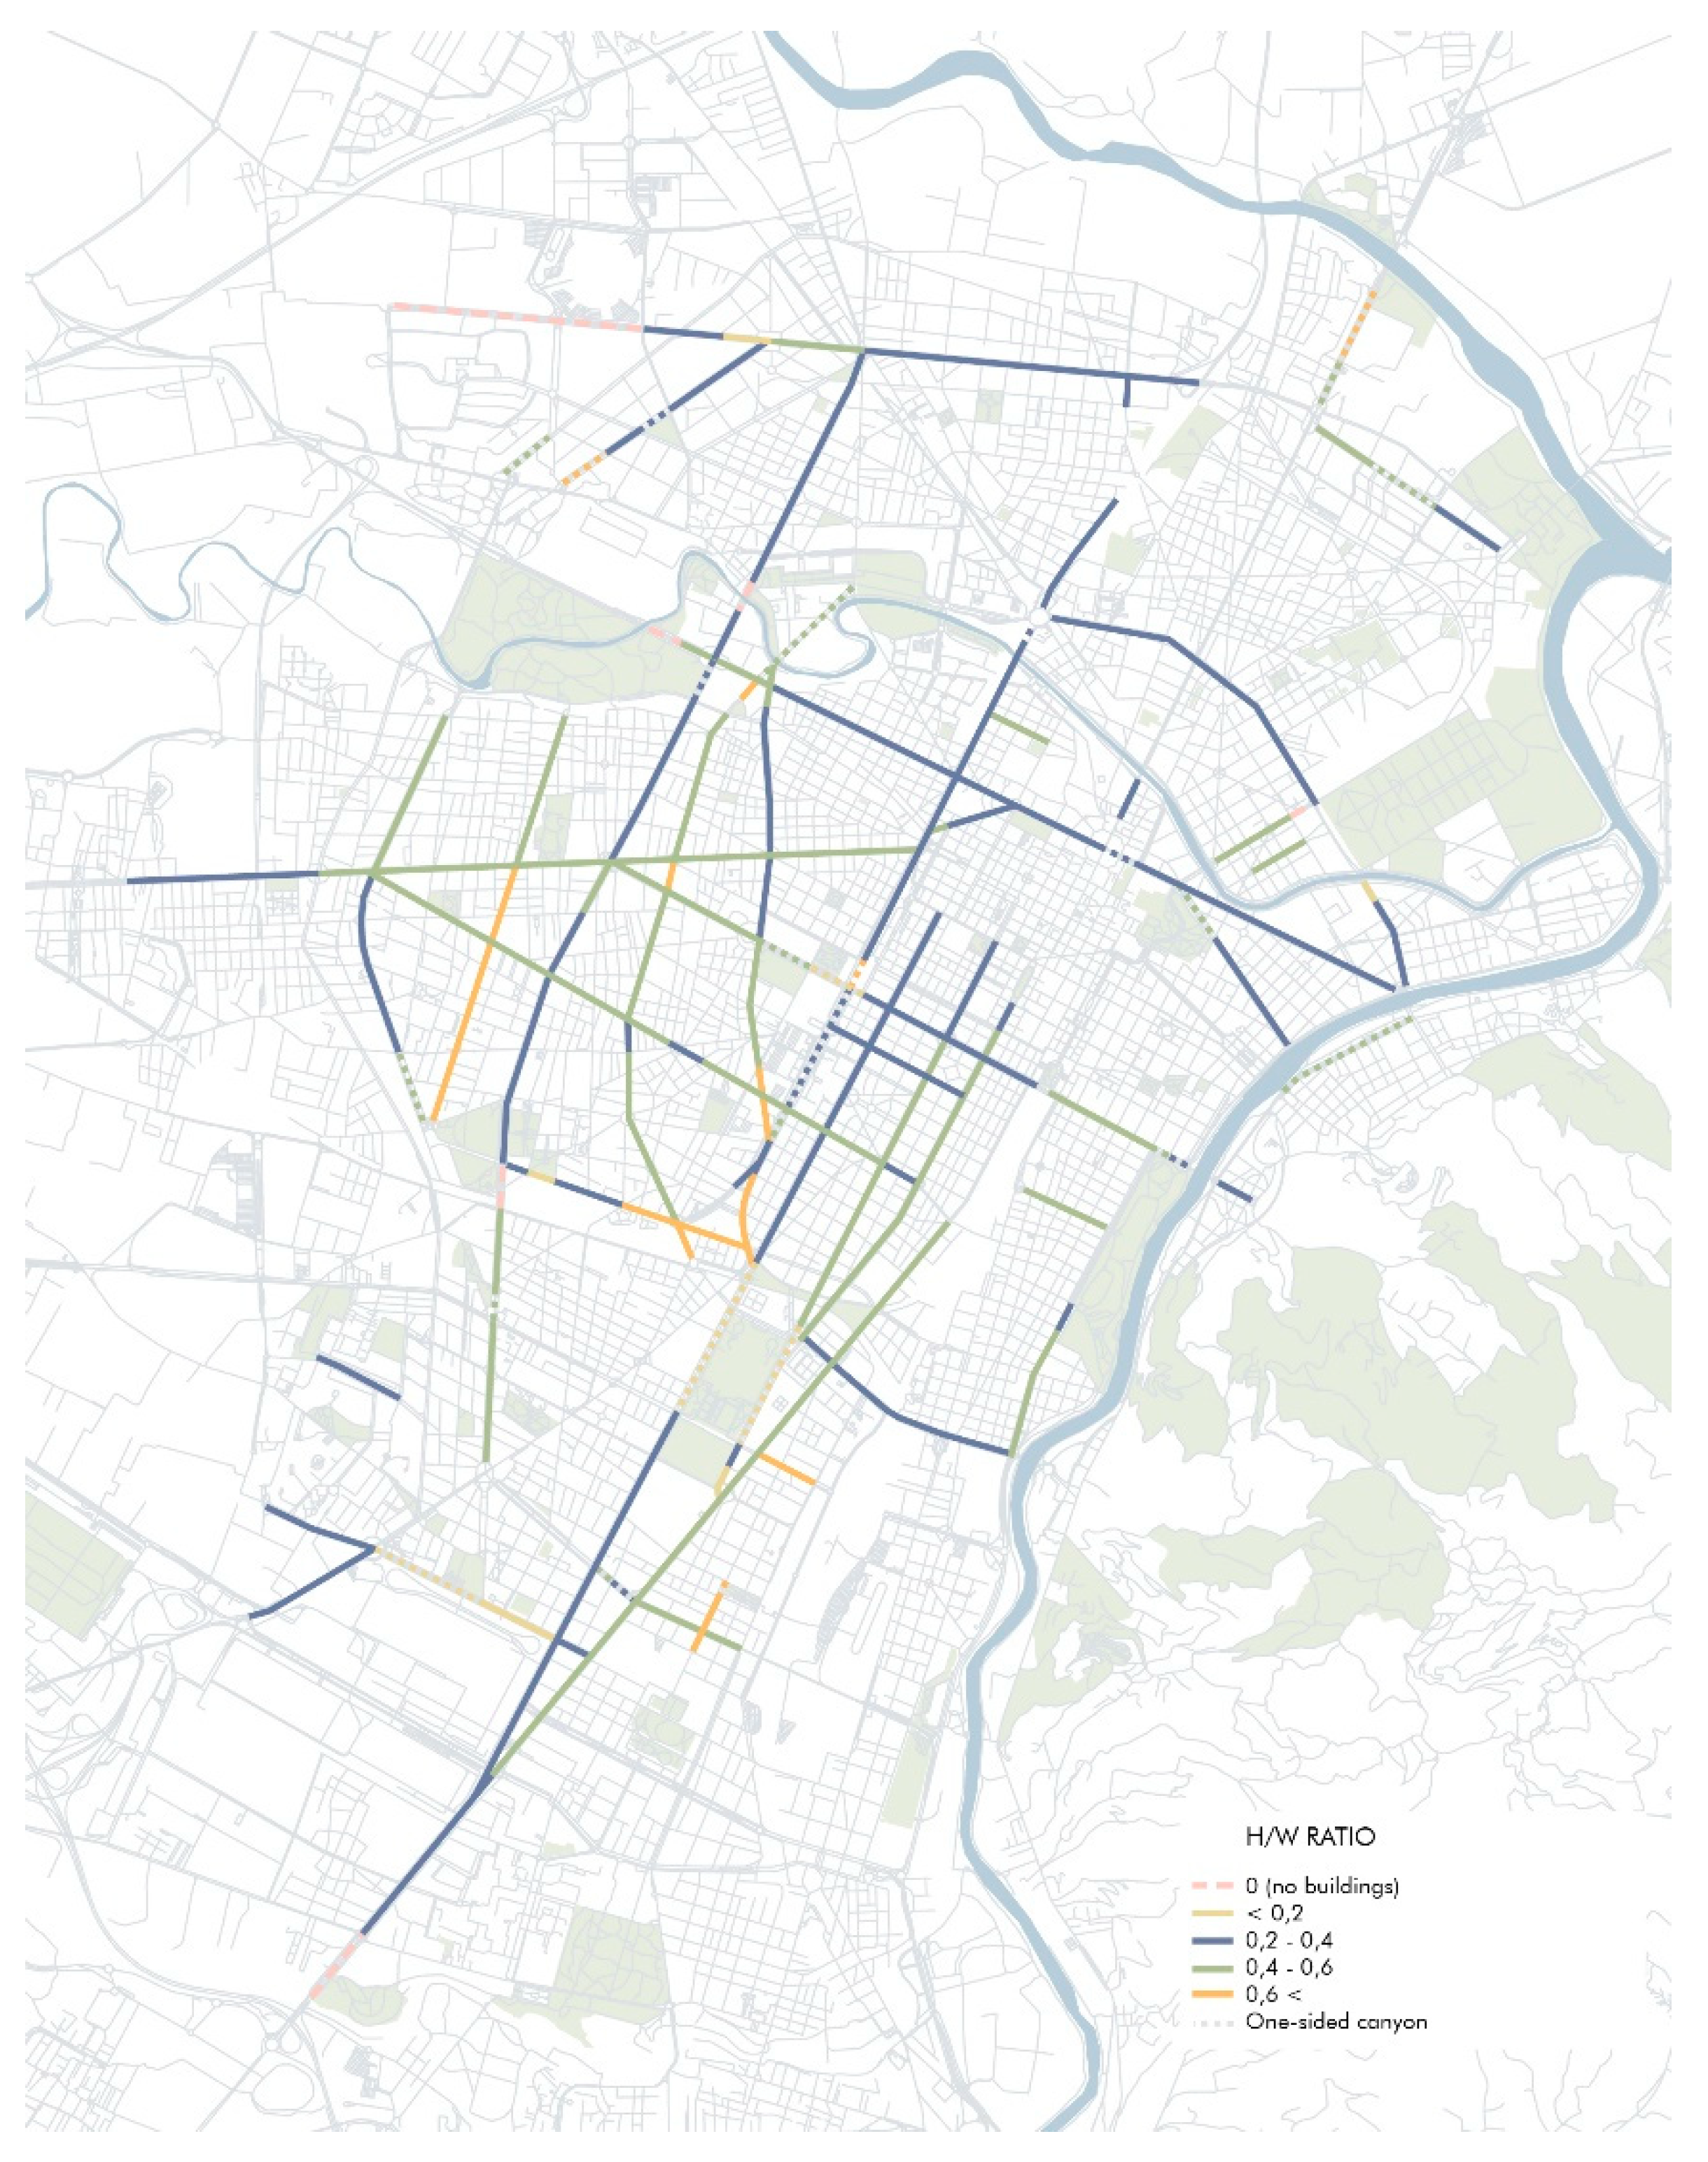
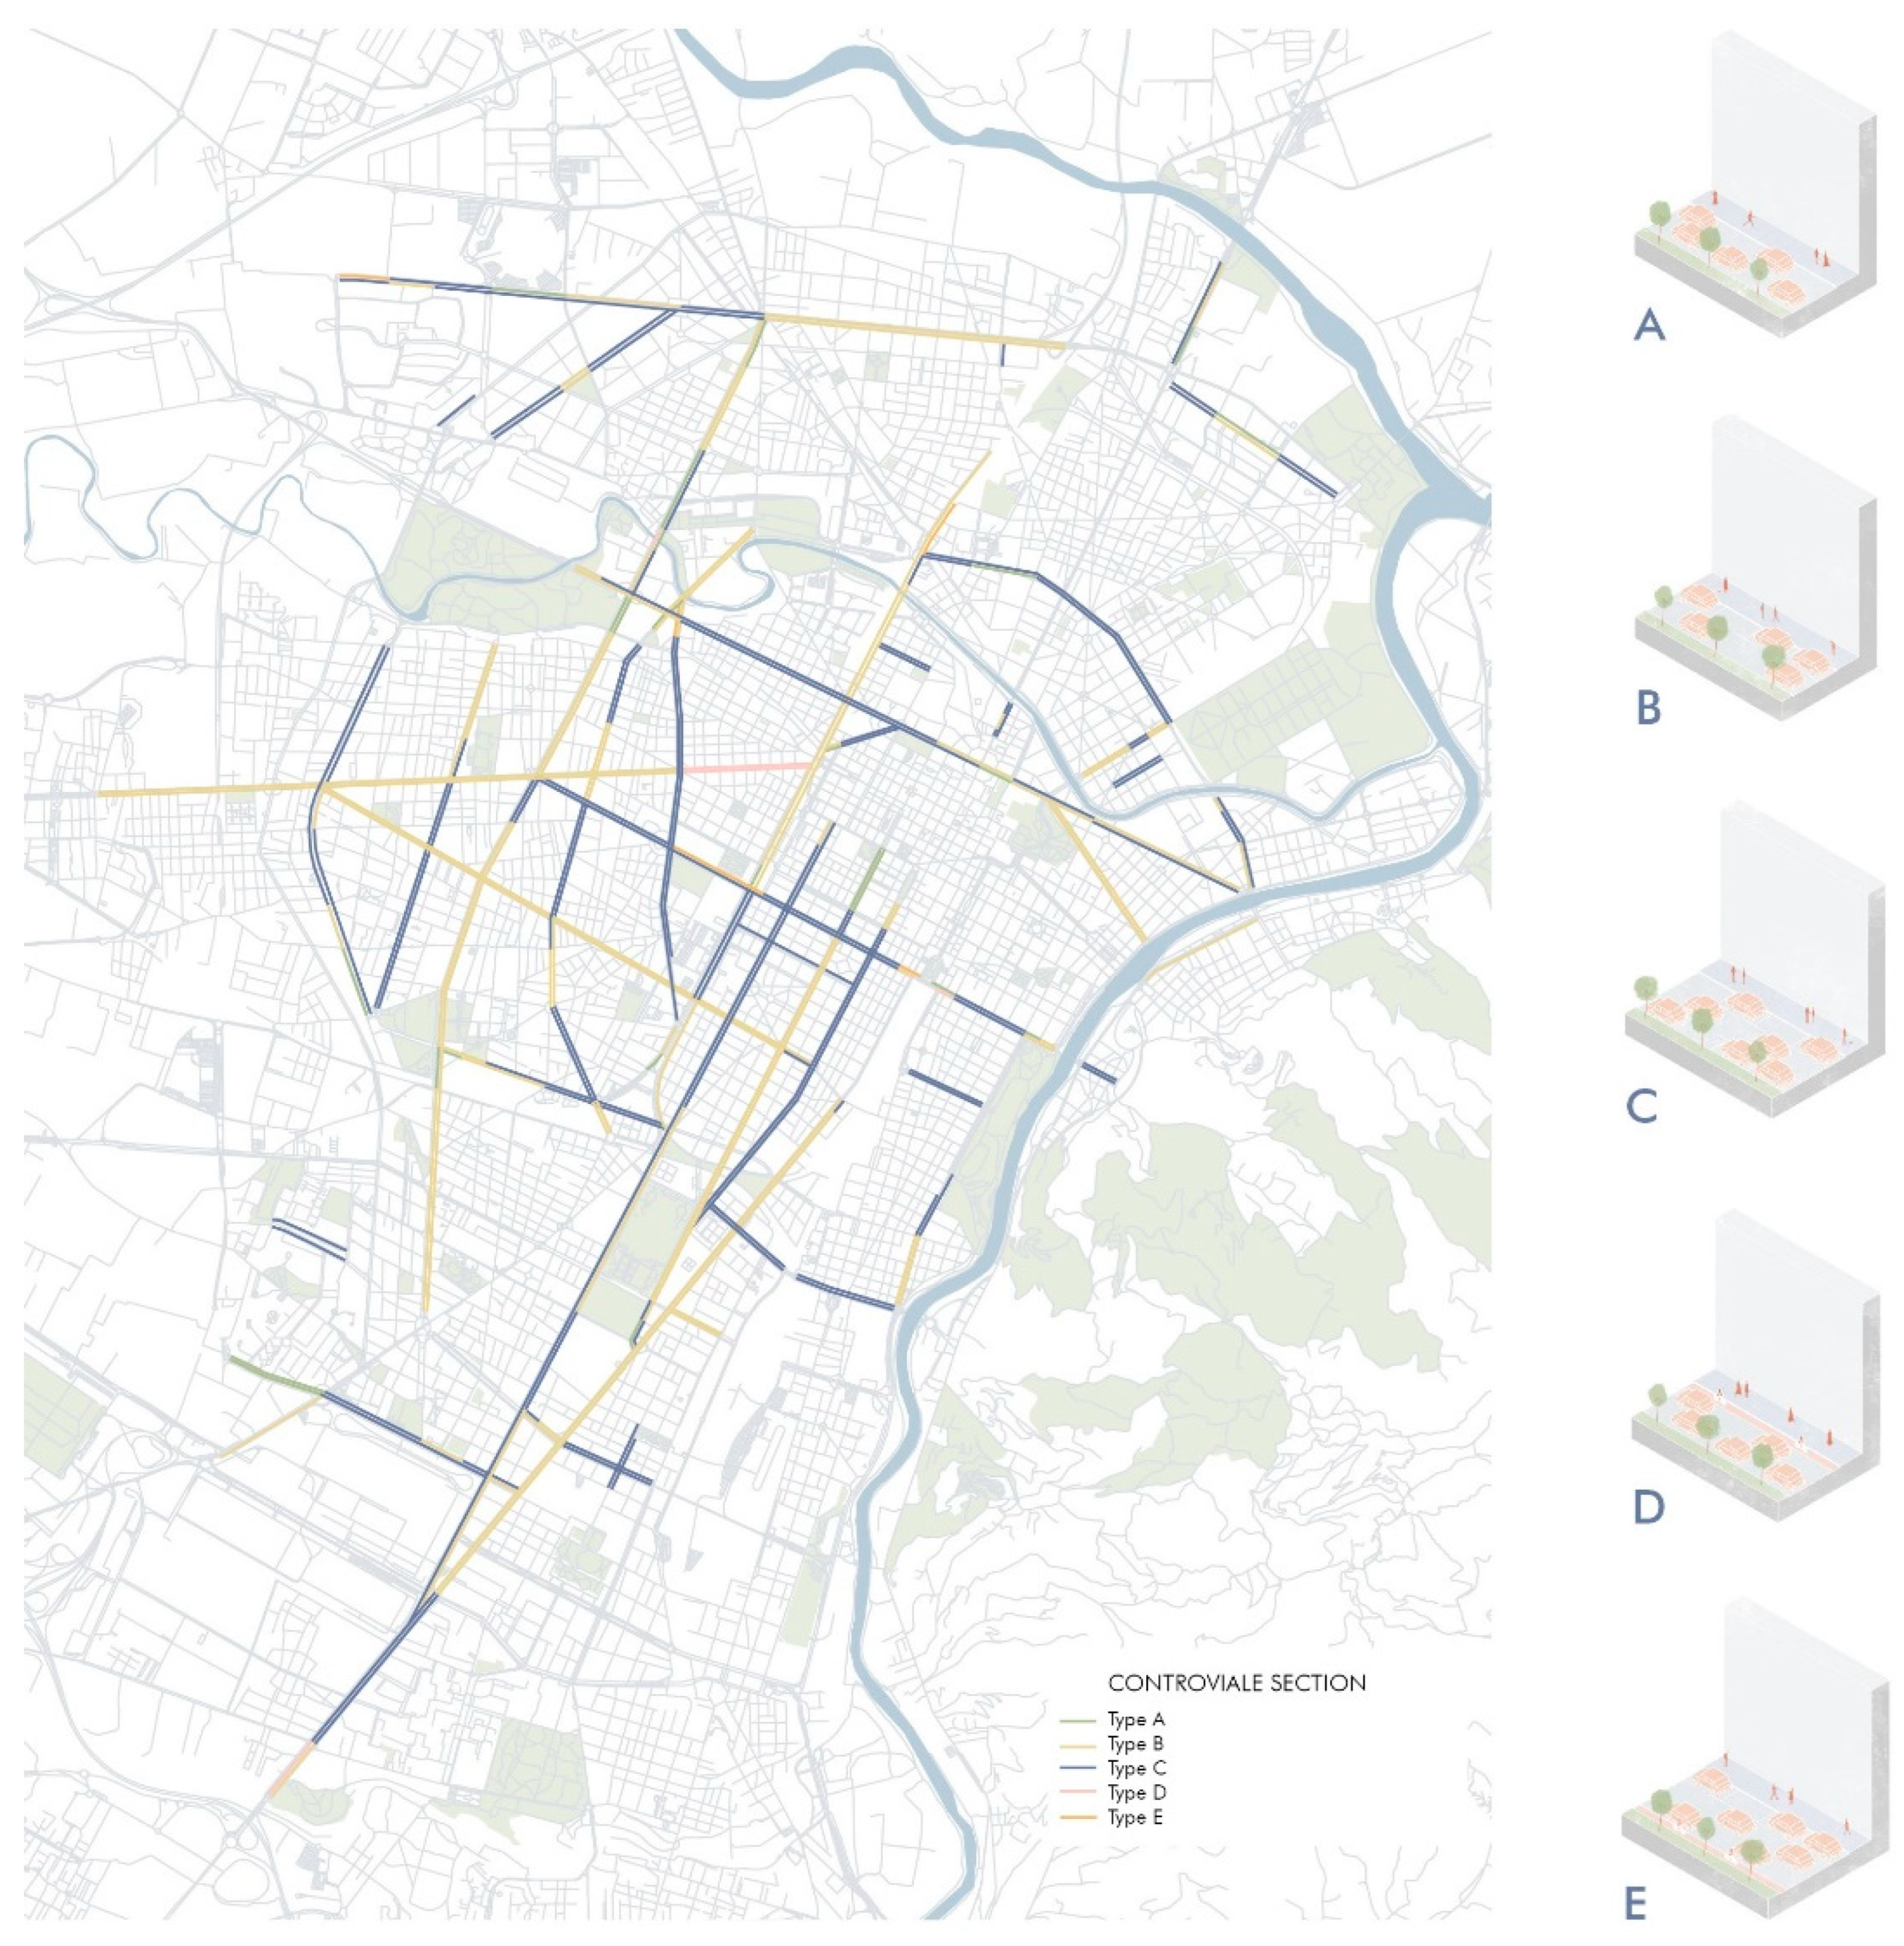
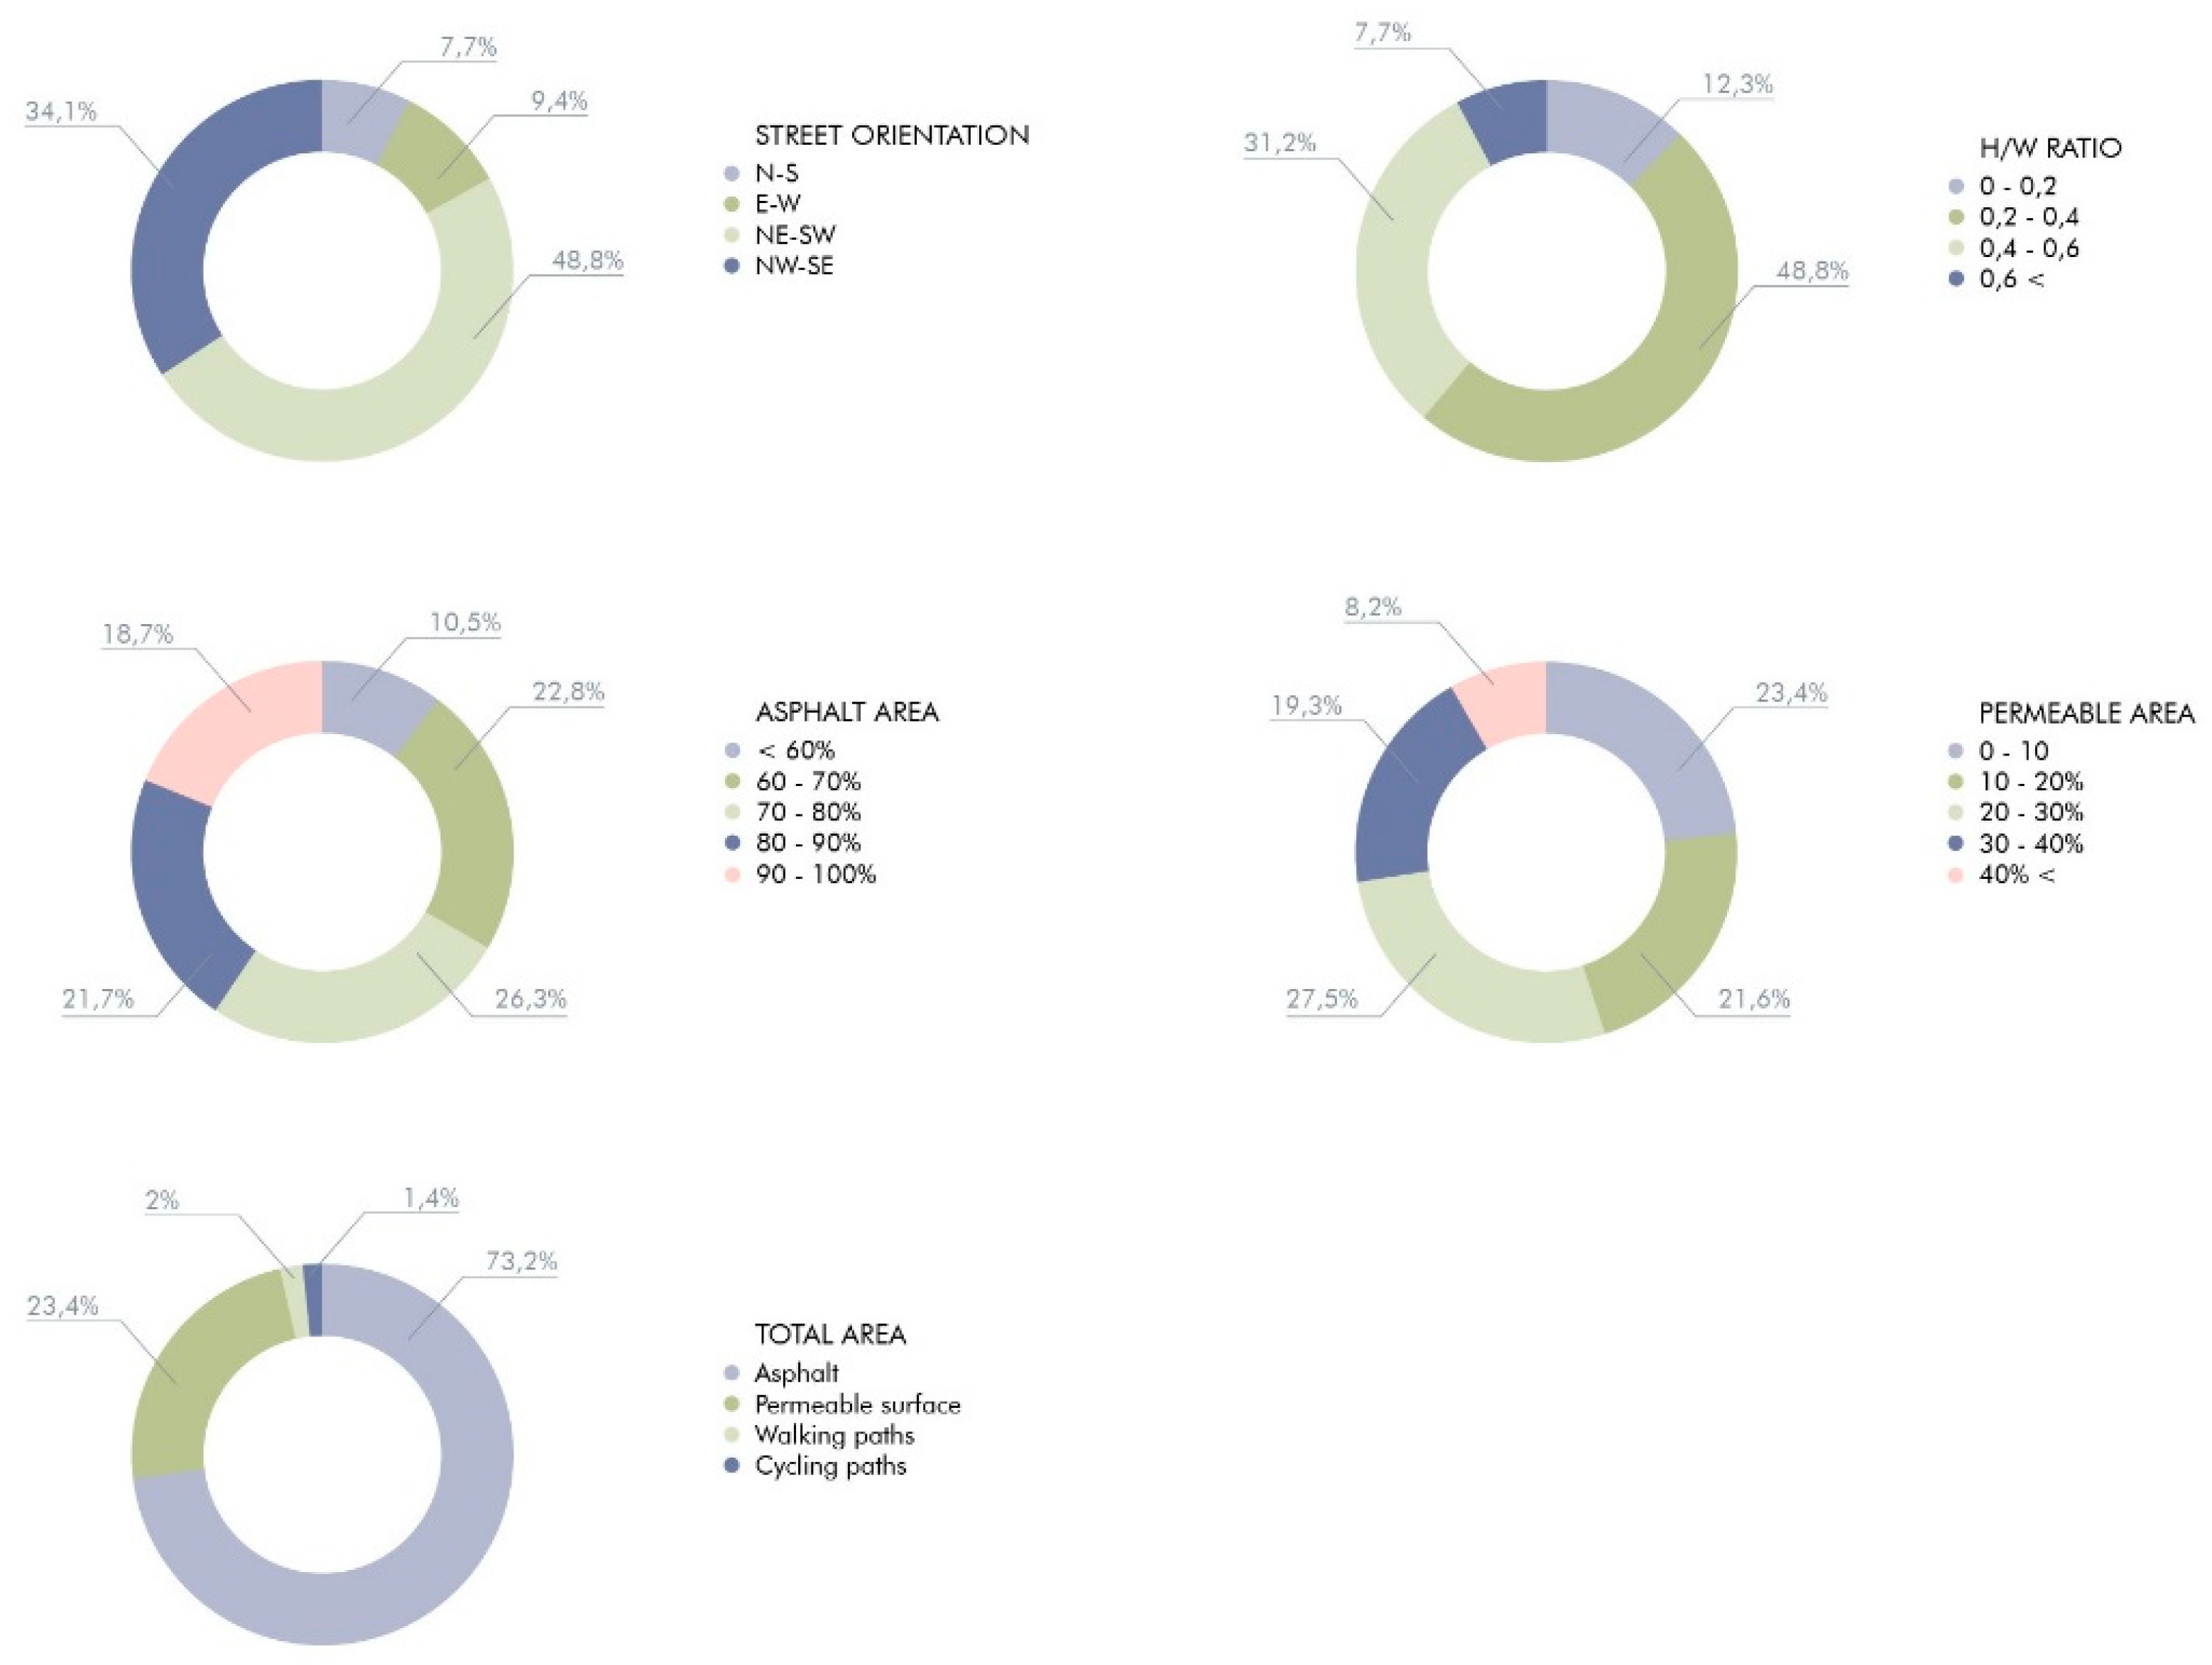
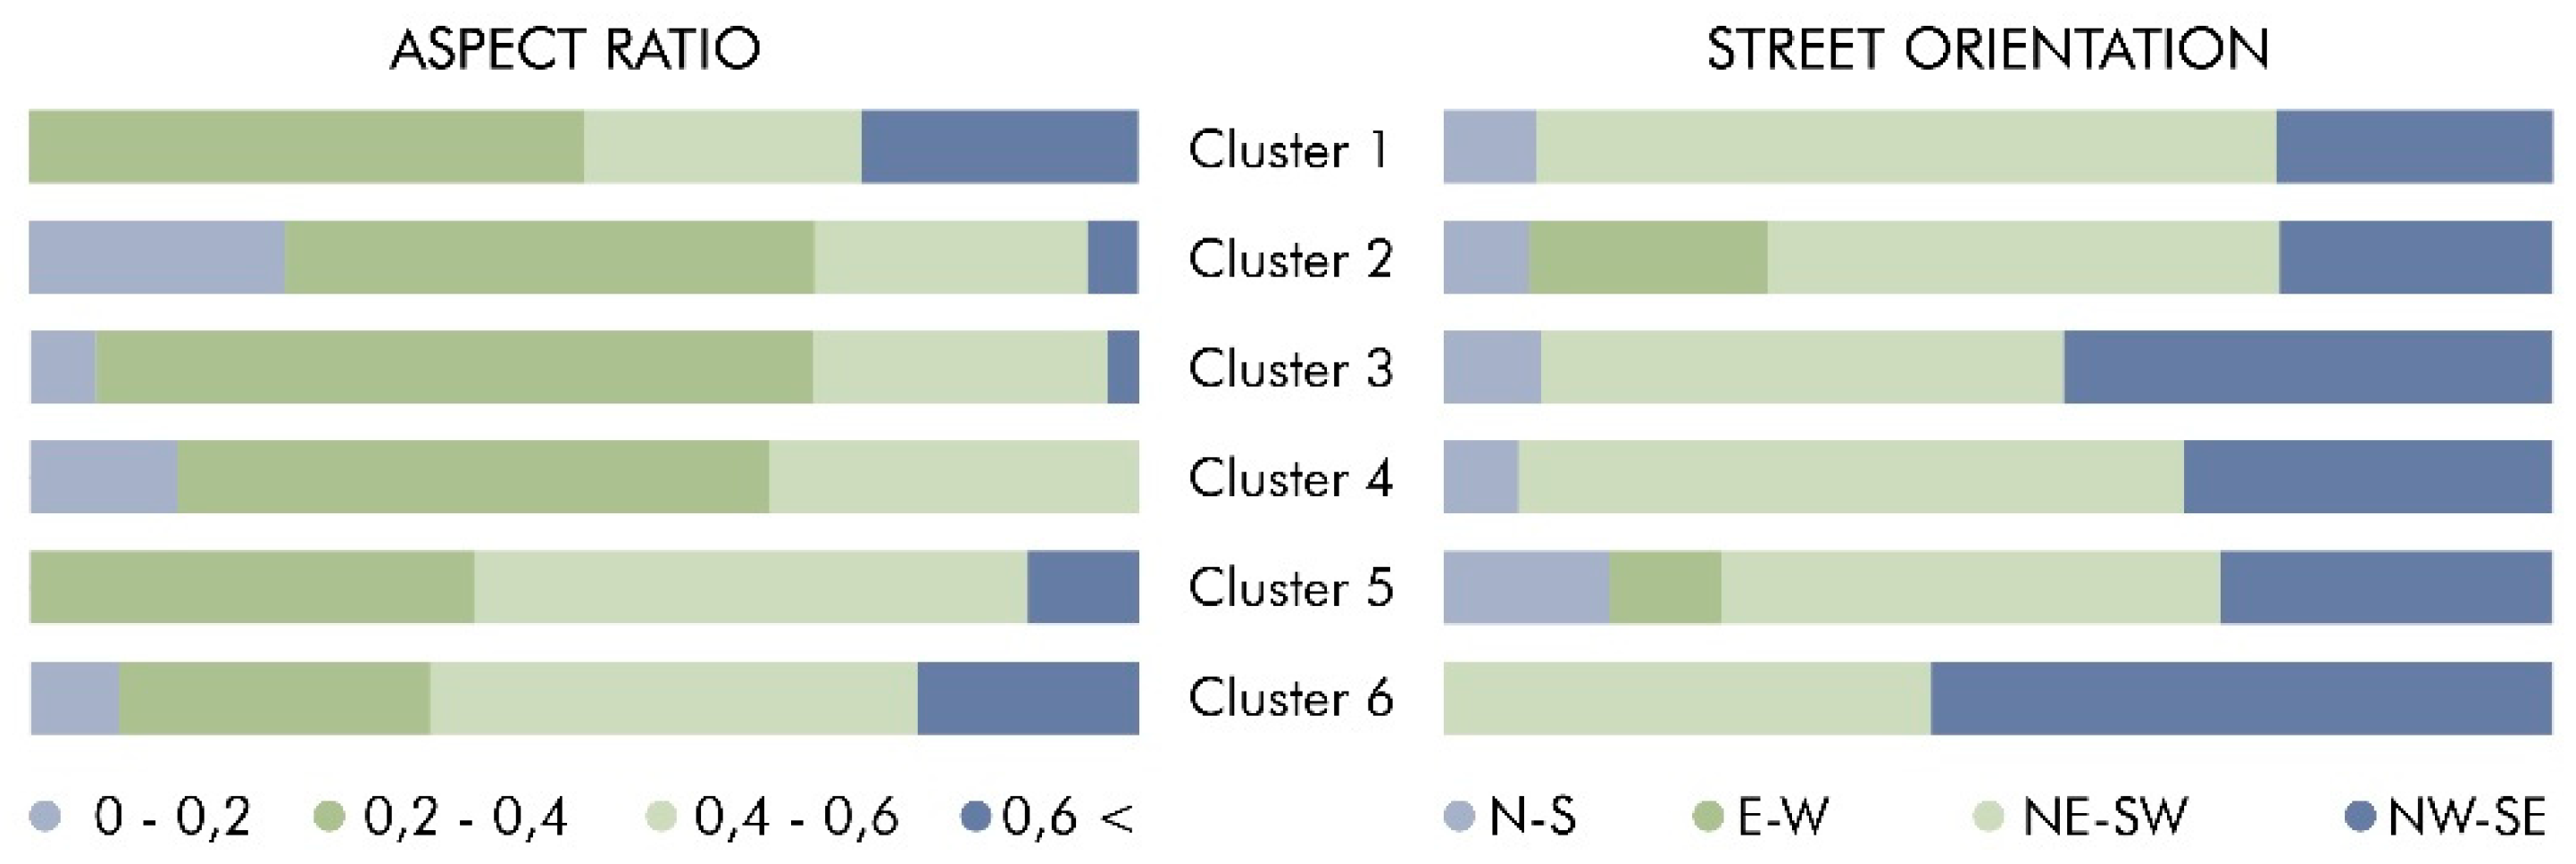
160 meters. Due to the great width of the avenues with controviali and rather short buildings, the urban canyons are mainly shallow. Indeed, most of the streets have an aspect ratio between 0.2 and 0.6 (Figure 4). Finally, controviali are mostly used as traffic lanes, usually followed by other functions, including parking lanes, cycling paths, bus lanes etc. Based on these functions, five main types of
controviali were recognized (
Figure 5):
- A.
Only car lanes
- B.
Car lanes and one parking lane
- C.
Car lanes and two parking lanes
- D.
Car lanes and cycling lanes
- E.
Car lanes and two different functions (tram rails, bicycle path, bus lane, parking).
The most common types are B and C, proving that the dominant use of the controviali is for hard mobility. These features contribute to the final definition of clusters.
2.2.2. Type of Mobility
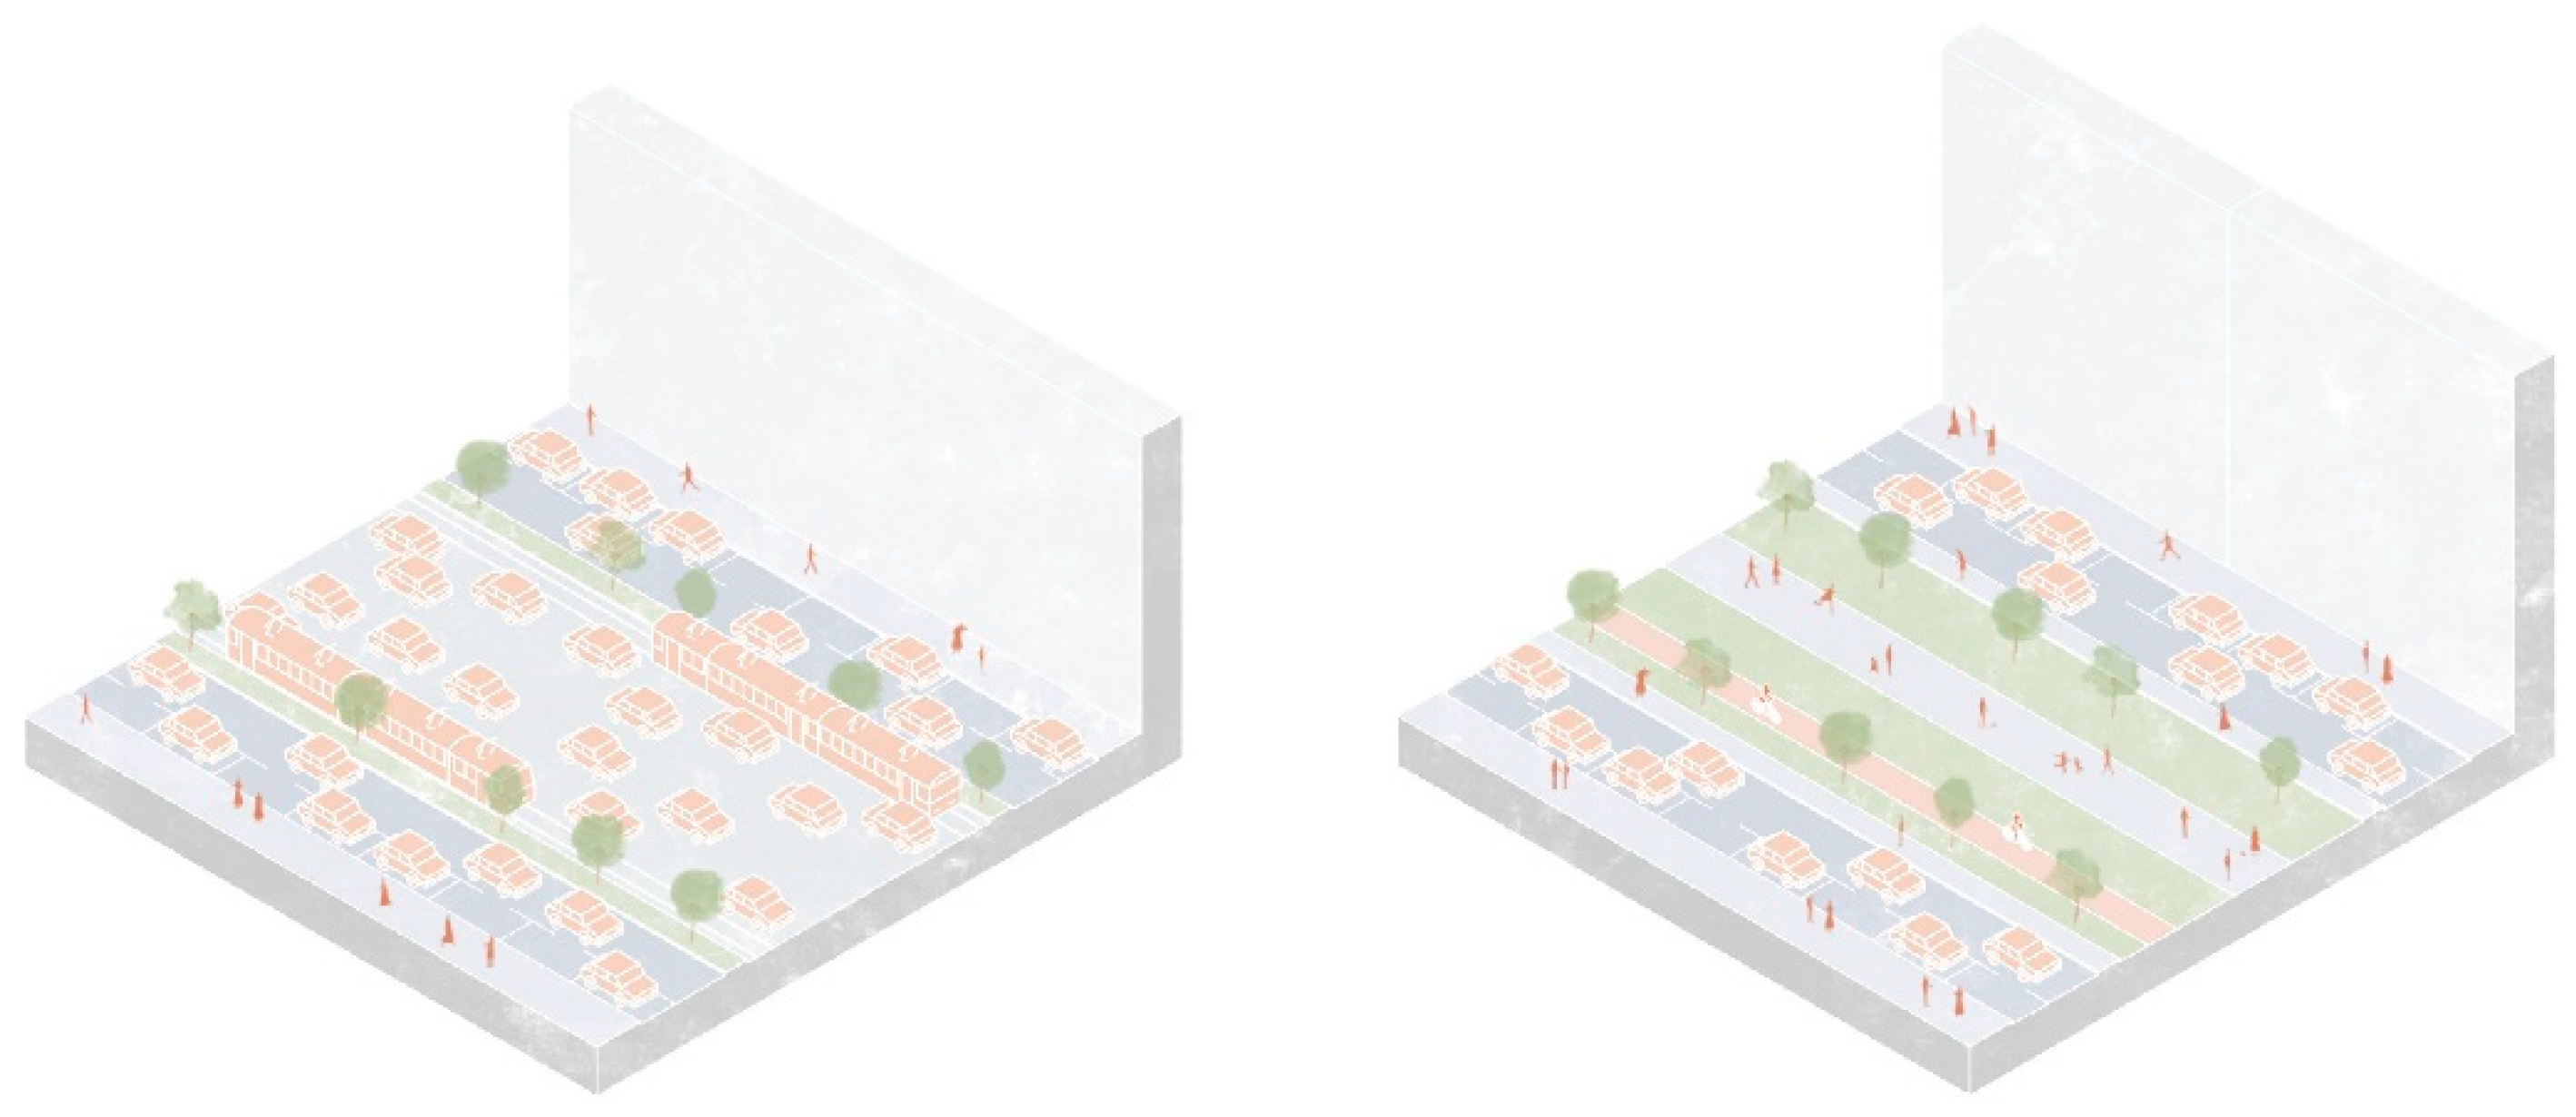
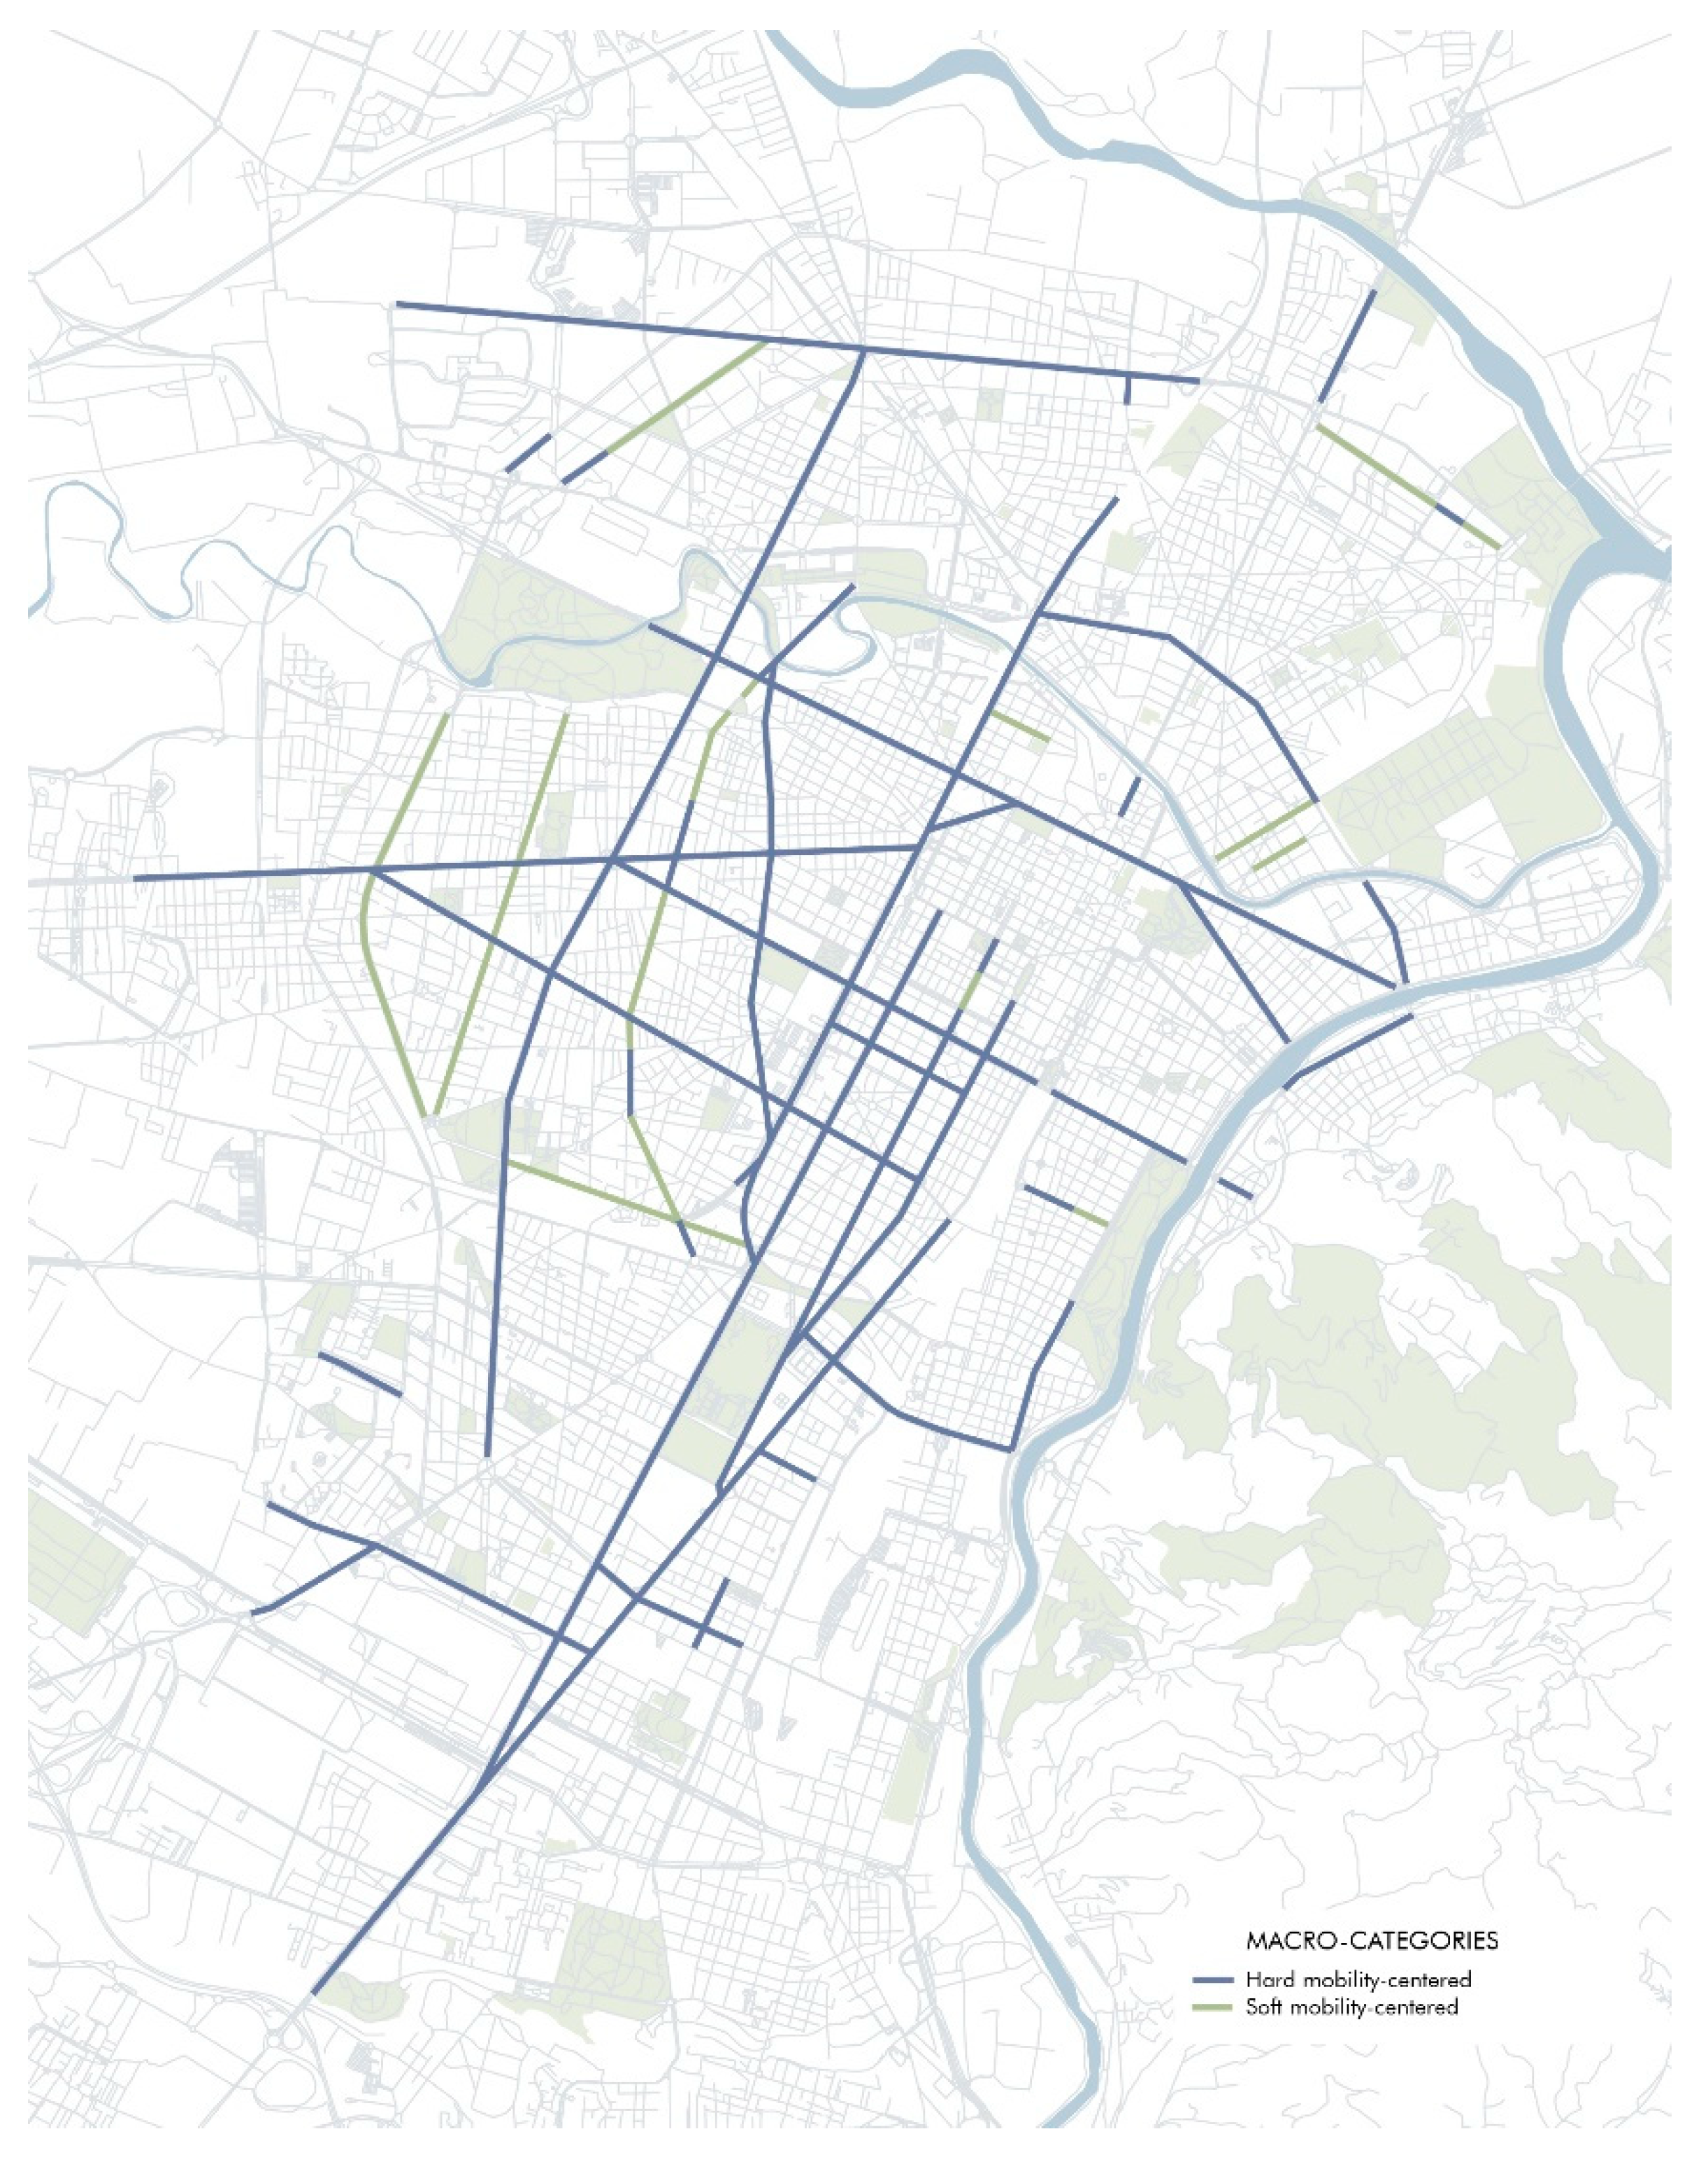
Two macro-categories of boulevards with lateral streets were identified: those in which the central part of the street is for the hard mobility (hard-mobility centered) and those in which pedestrian and cycle paths are in the middle of the boulevard (soft-mobility centered) (
Figure 6).
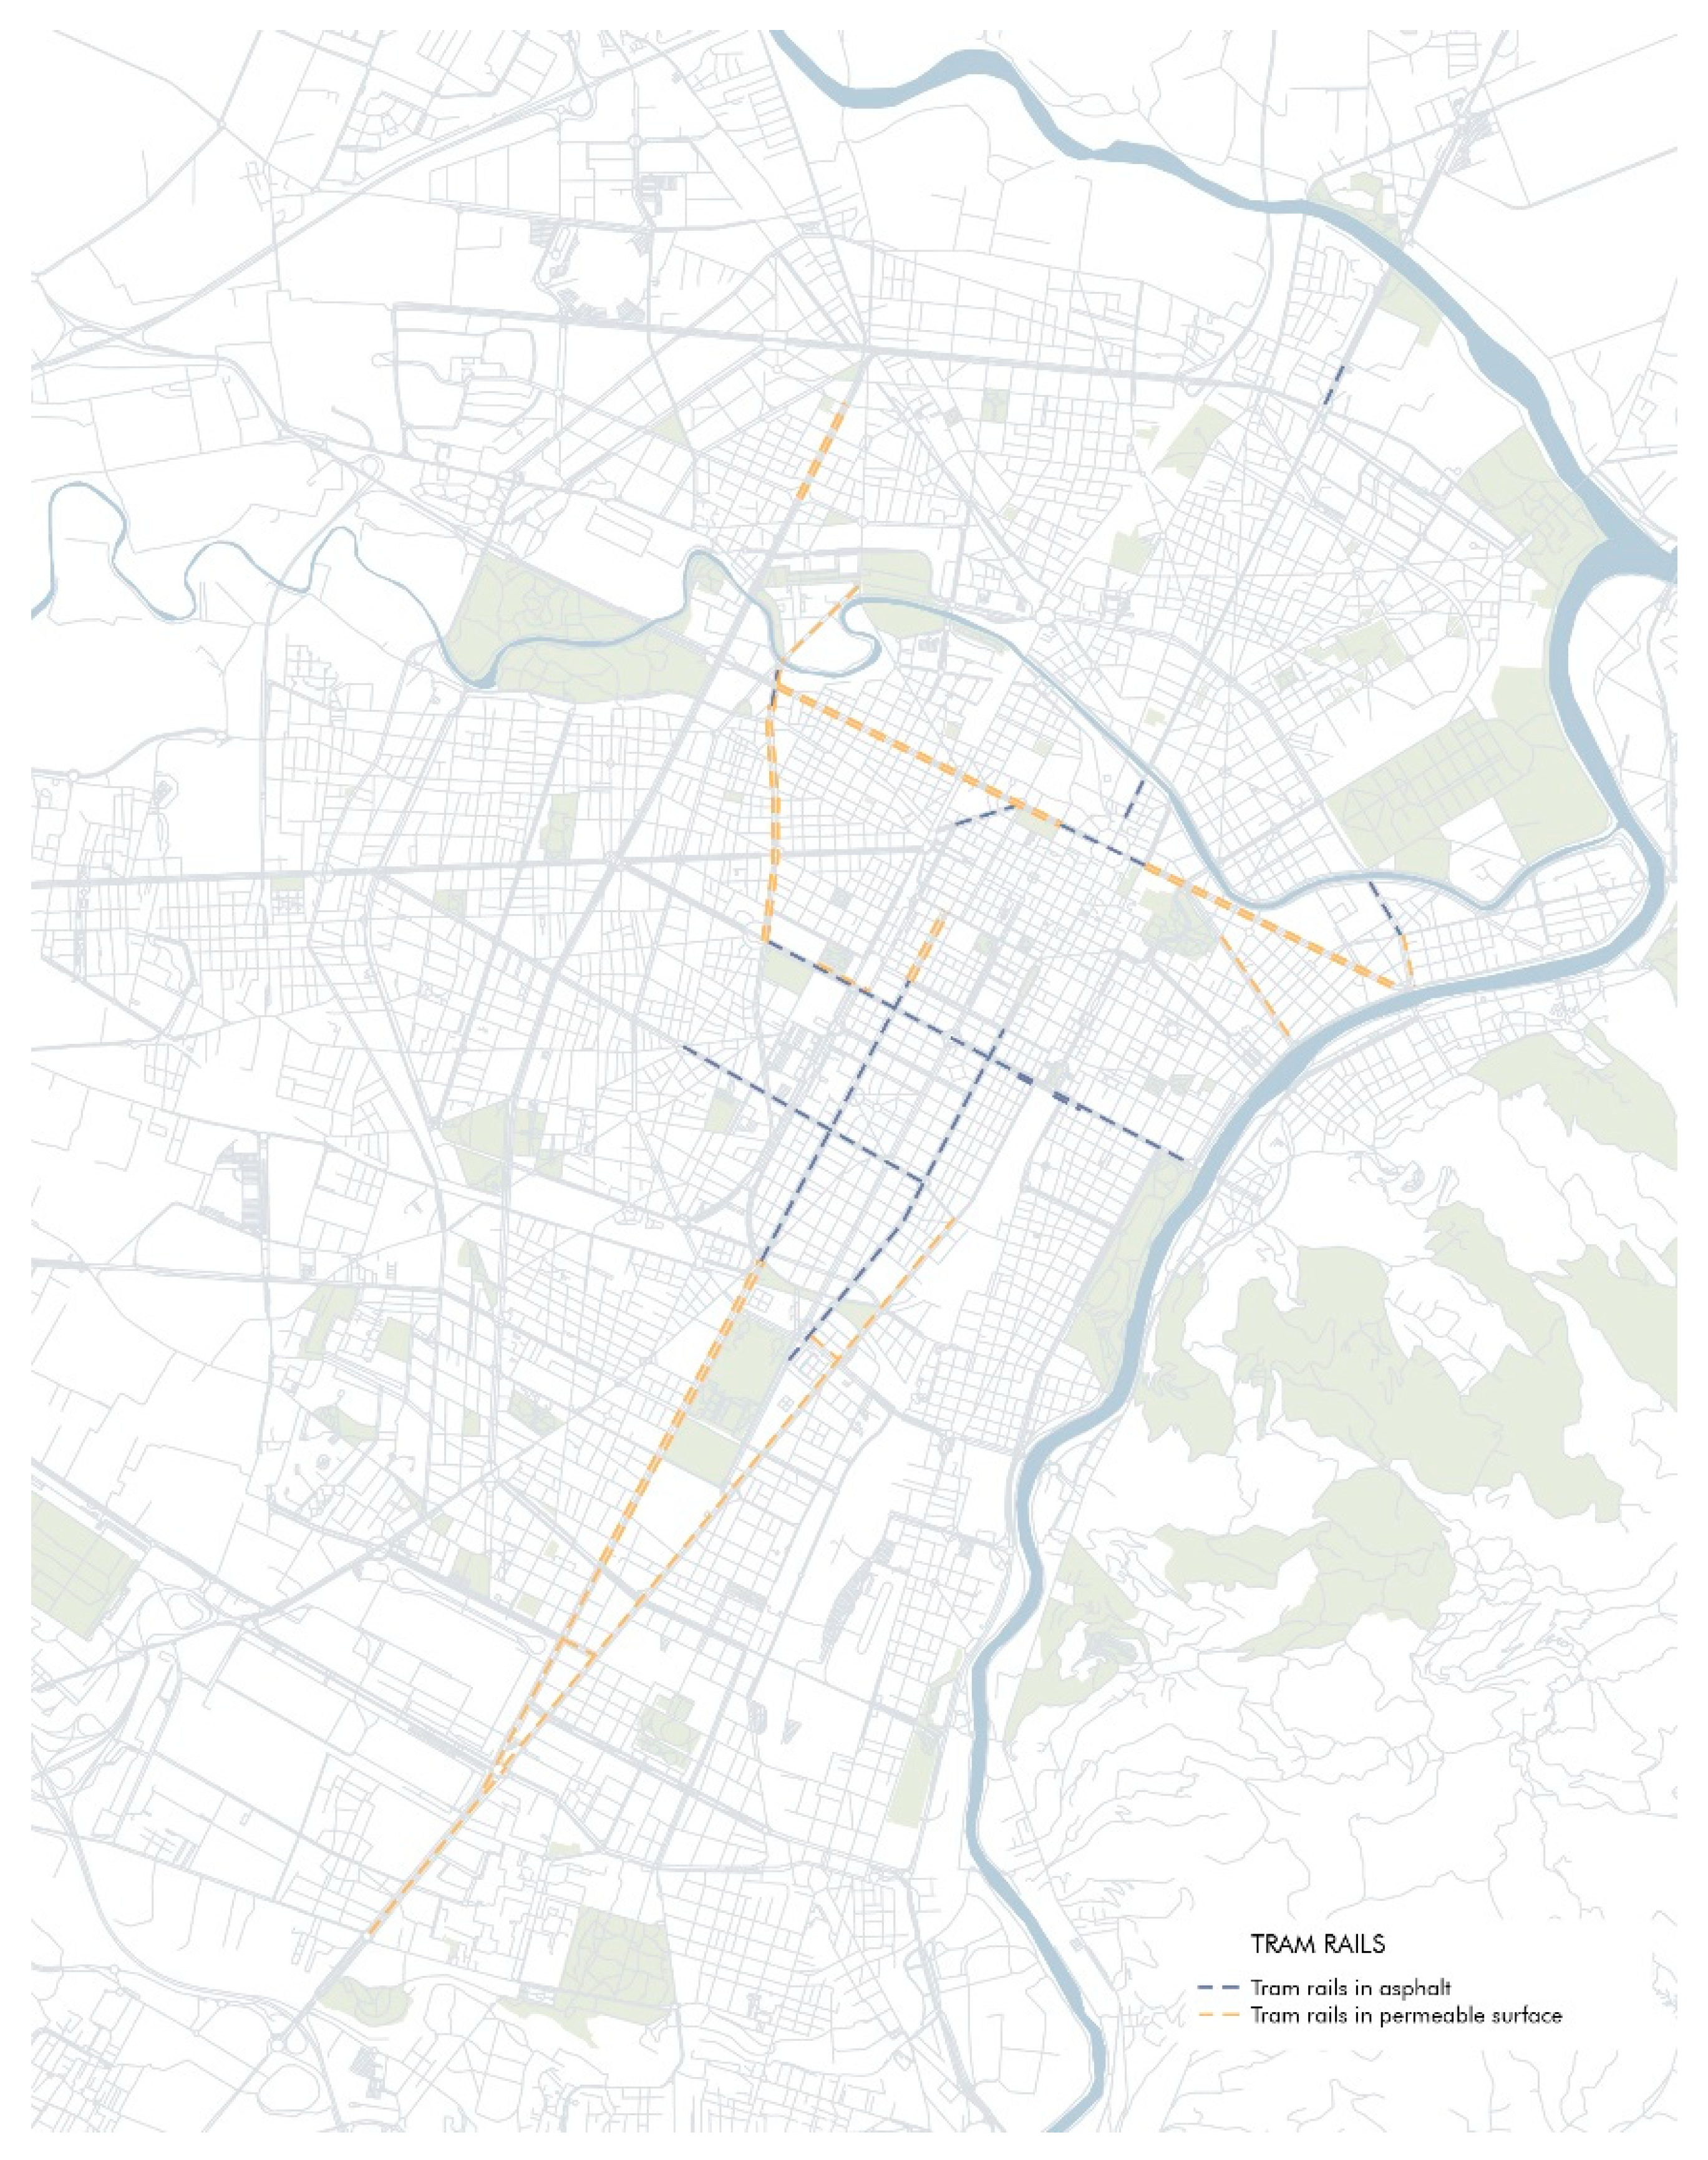
Figure 7 localizes these categories at the urban scale. The presence of tram rails is notable both within the asphalt surfaces among the cars and in the green areas between central roads and
controviali (
Figure 8). Approximately 30% of the boulevards contain tram rails within them. These features contribute to the final definition of clusters.
2.2.3. Type of Surfaces
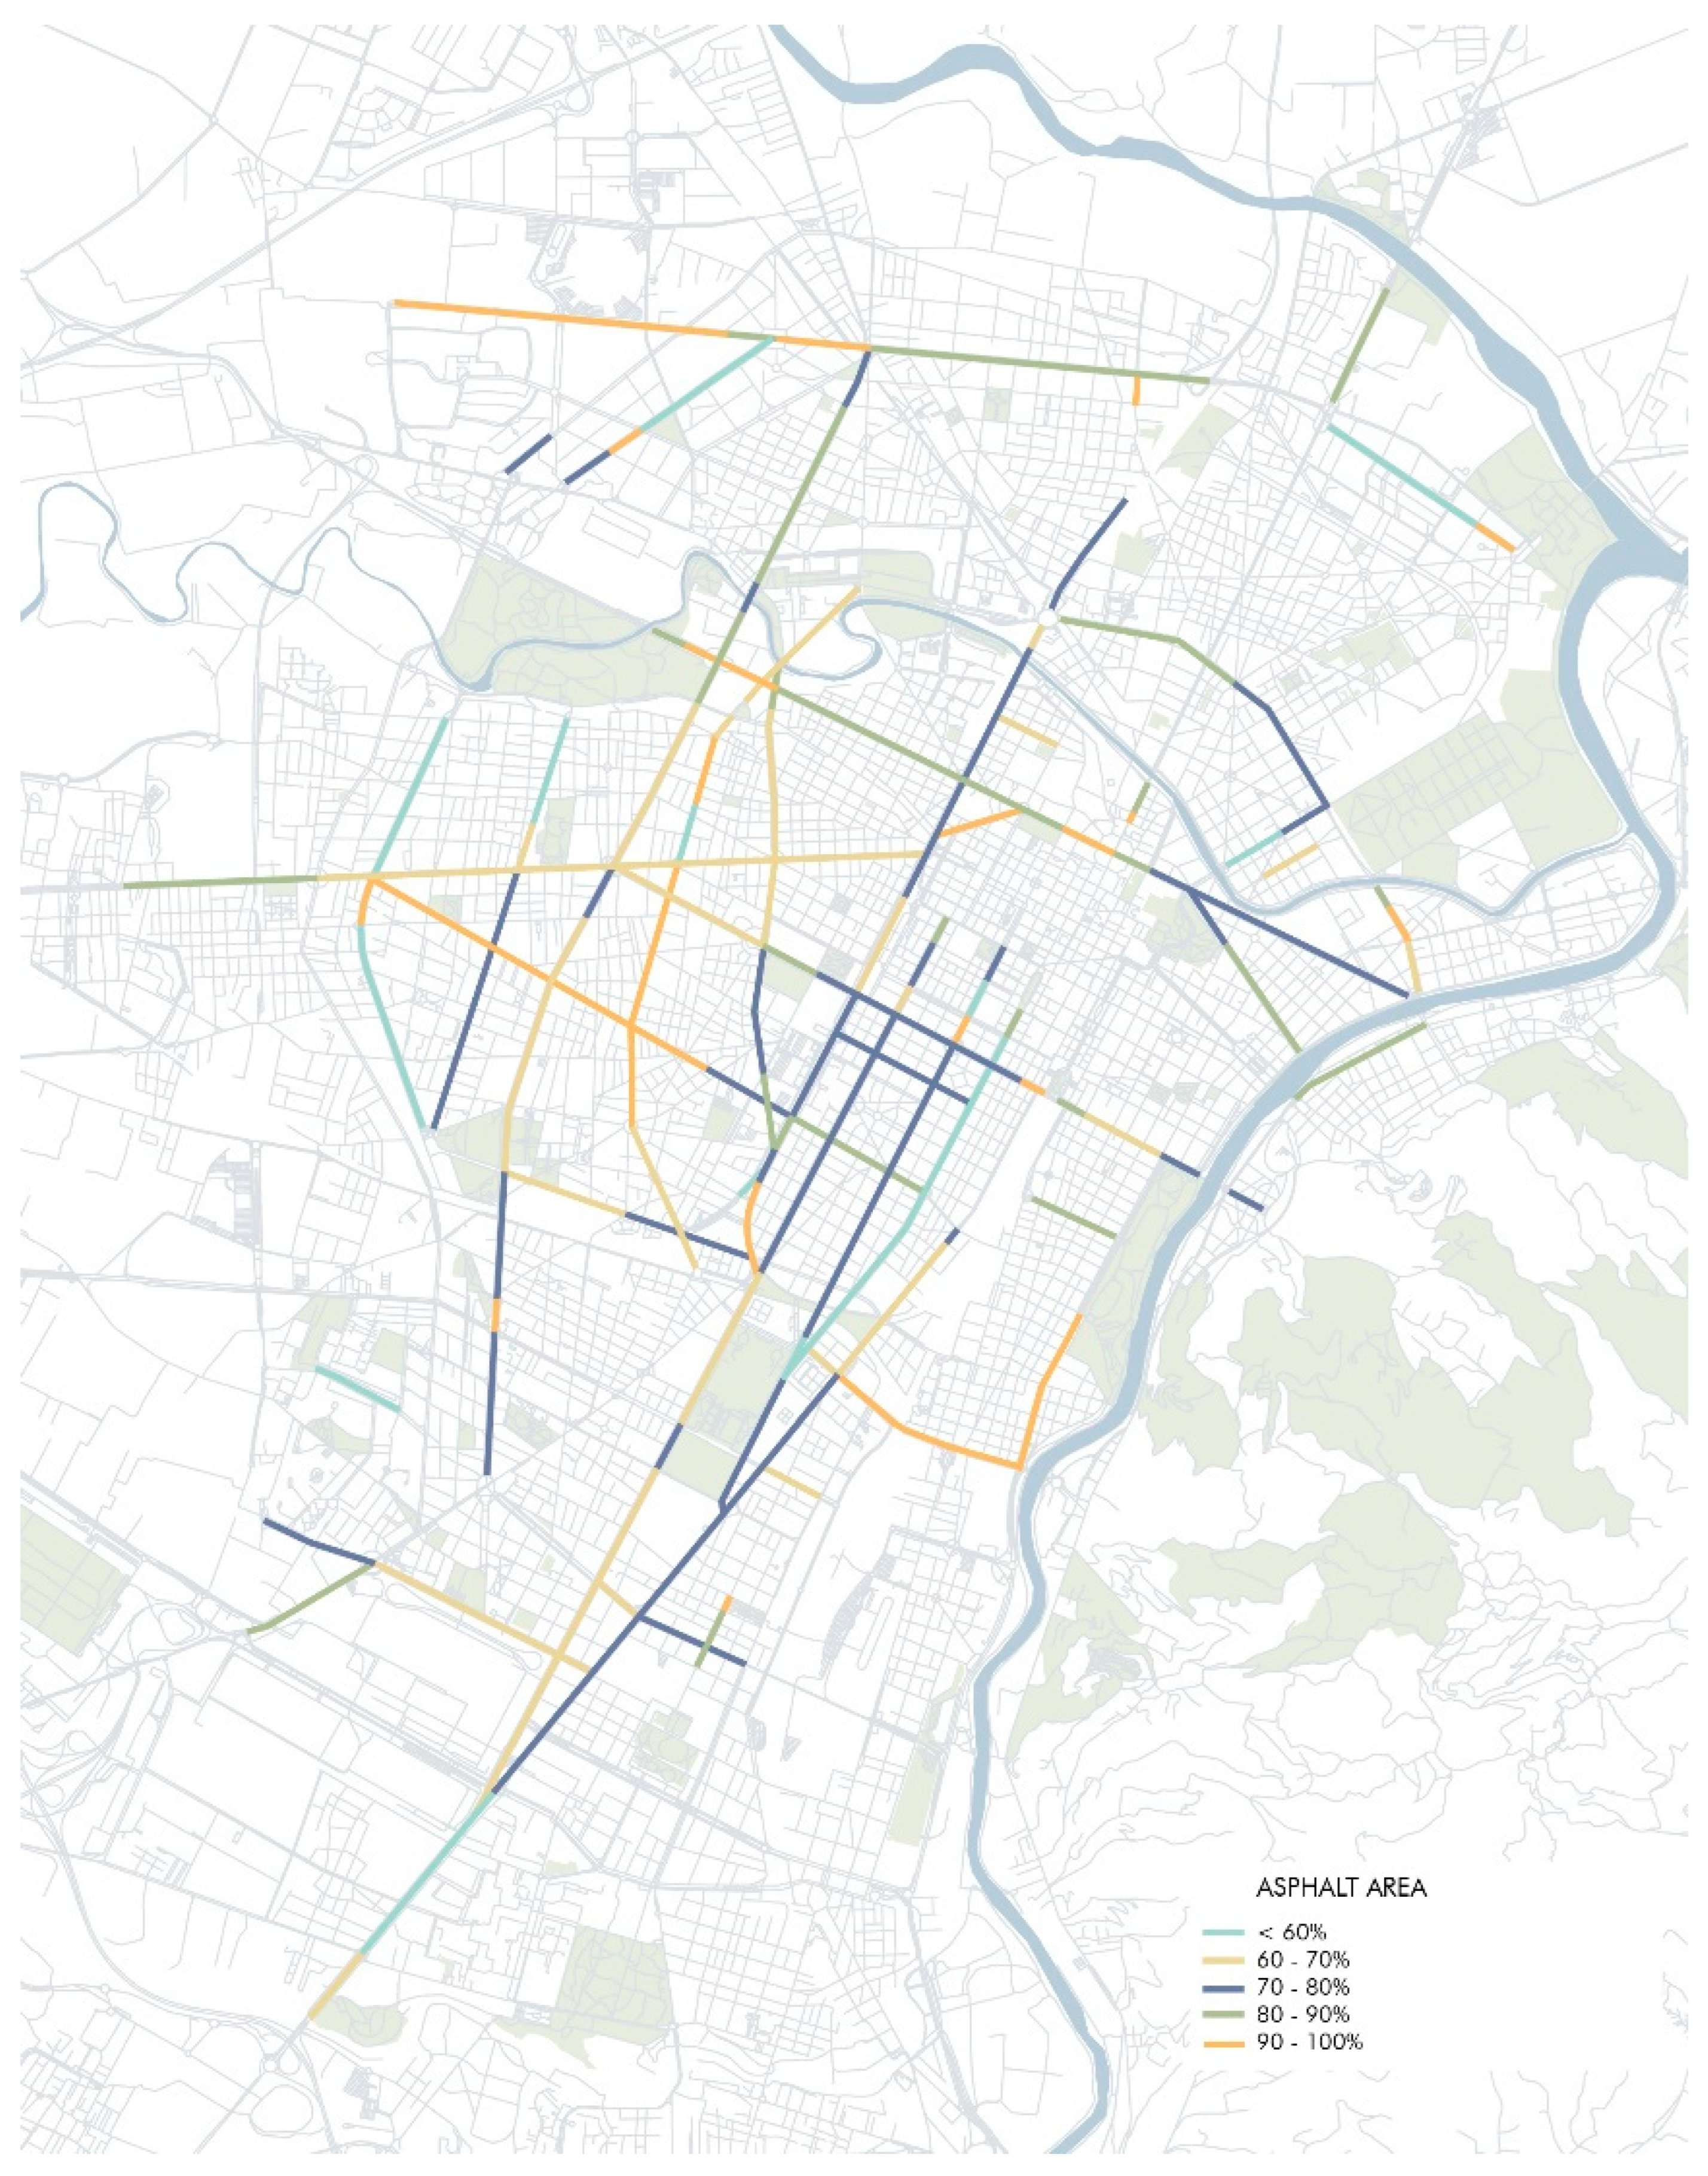
The last discriminant for clustering the urban mobility is linked to surface typologies. Four main components of the street surfaces are asphalt, permeable surfaces, walking paths and bicycle paths. Asphalt is a dominant element, covering approximately 73% of the entire area of the boulevards with
controviali. Since asphalt is a major contributor to the UHI effect, and therefore an important factor in determining microclimate conditions, the amount of asphalt coverage was specifically analyzed. Around 90% of the streets with
controviali have over 60% of their area covered in asphalt (
Figure 9). Most of the boulevards with
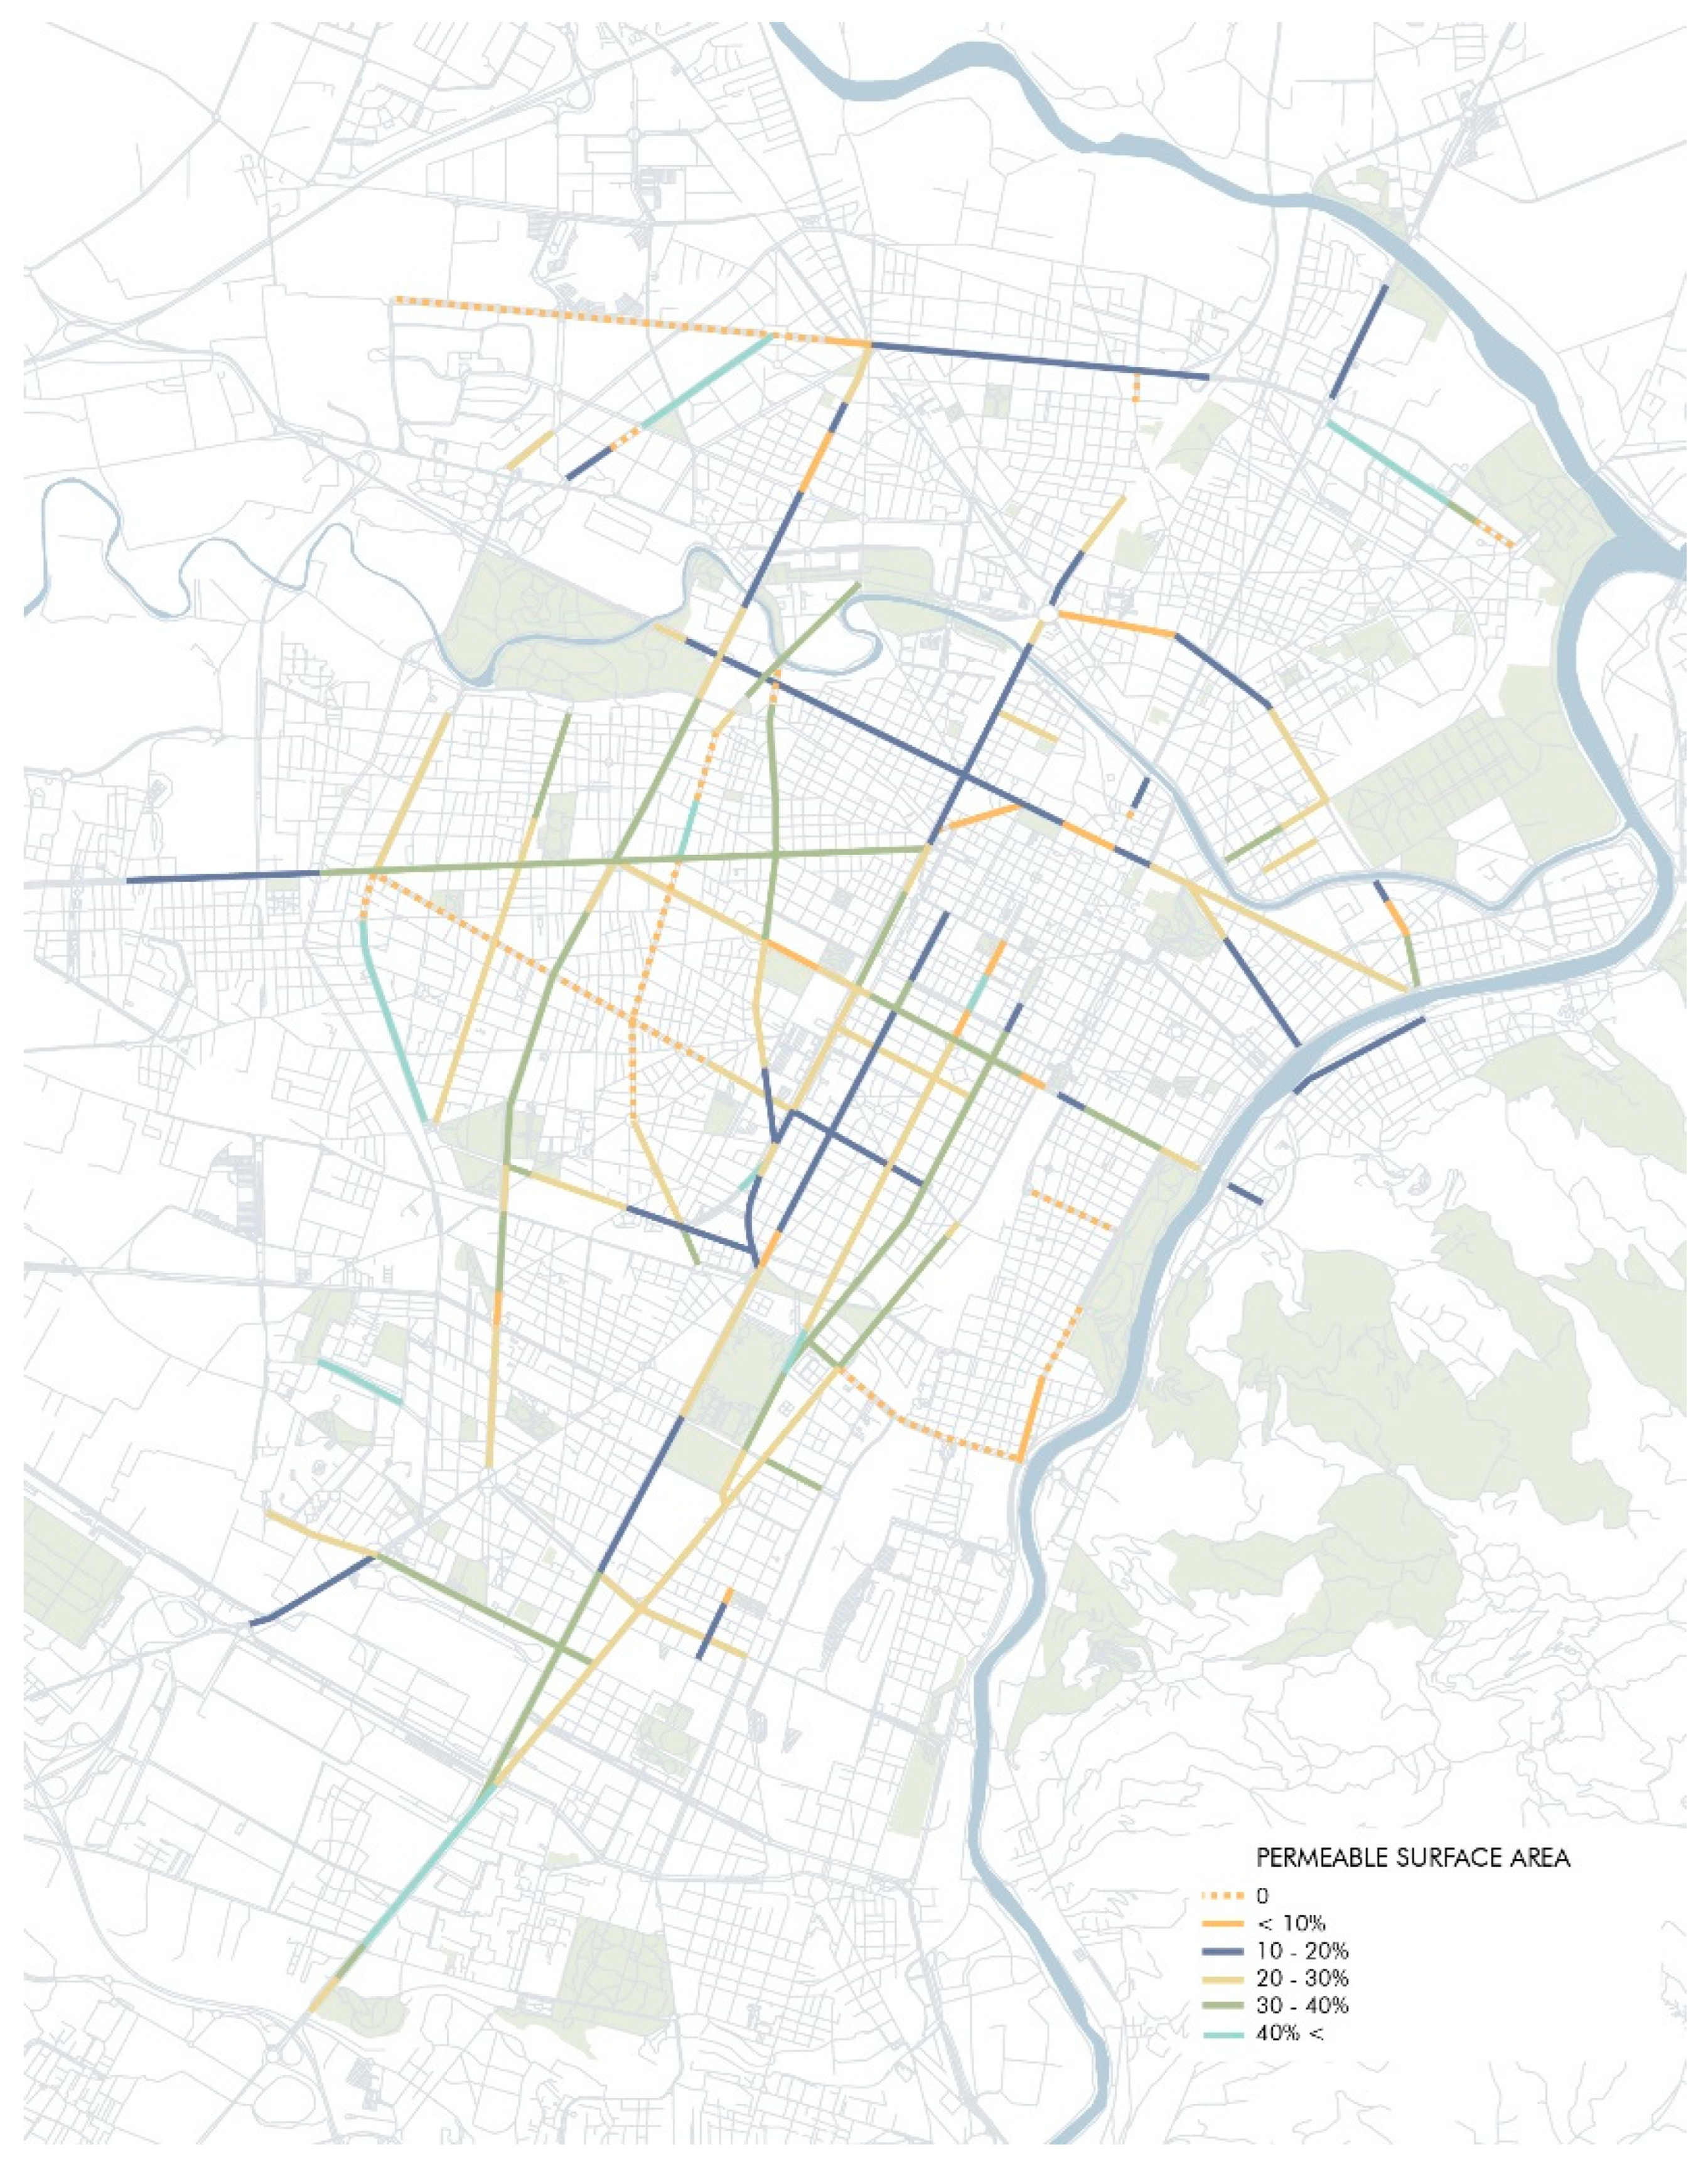
controviali are characterized with rows of high trees and a certain amount of permeable surfaces, which impacts the microclimatic conditions as well. Only between 10% and 15% of the streets have no permeable surfaces (
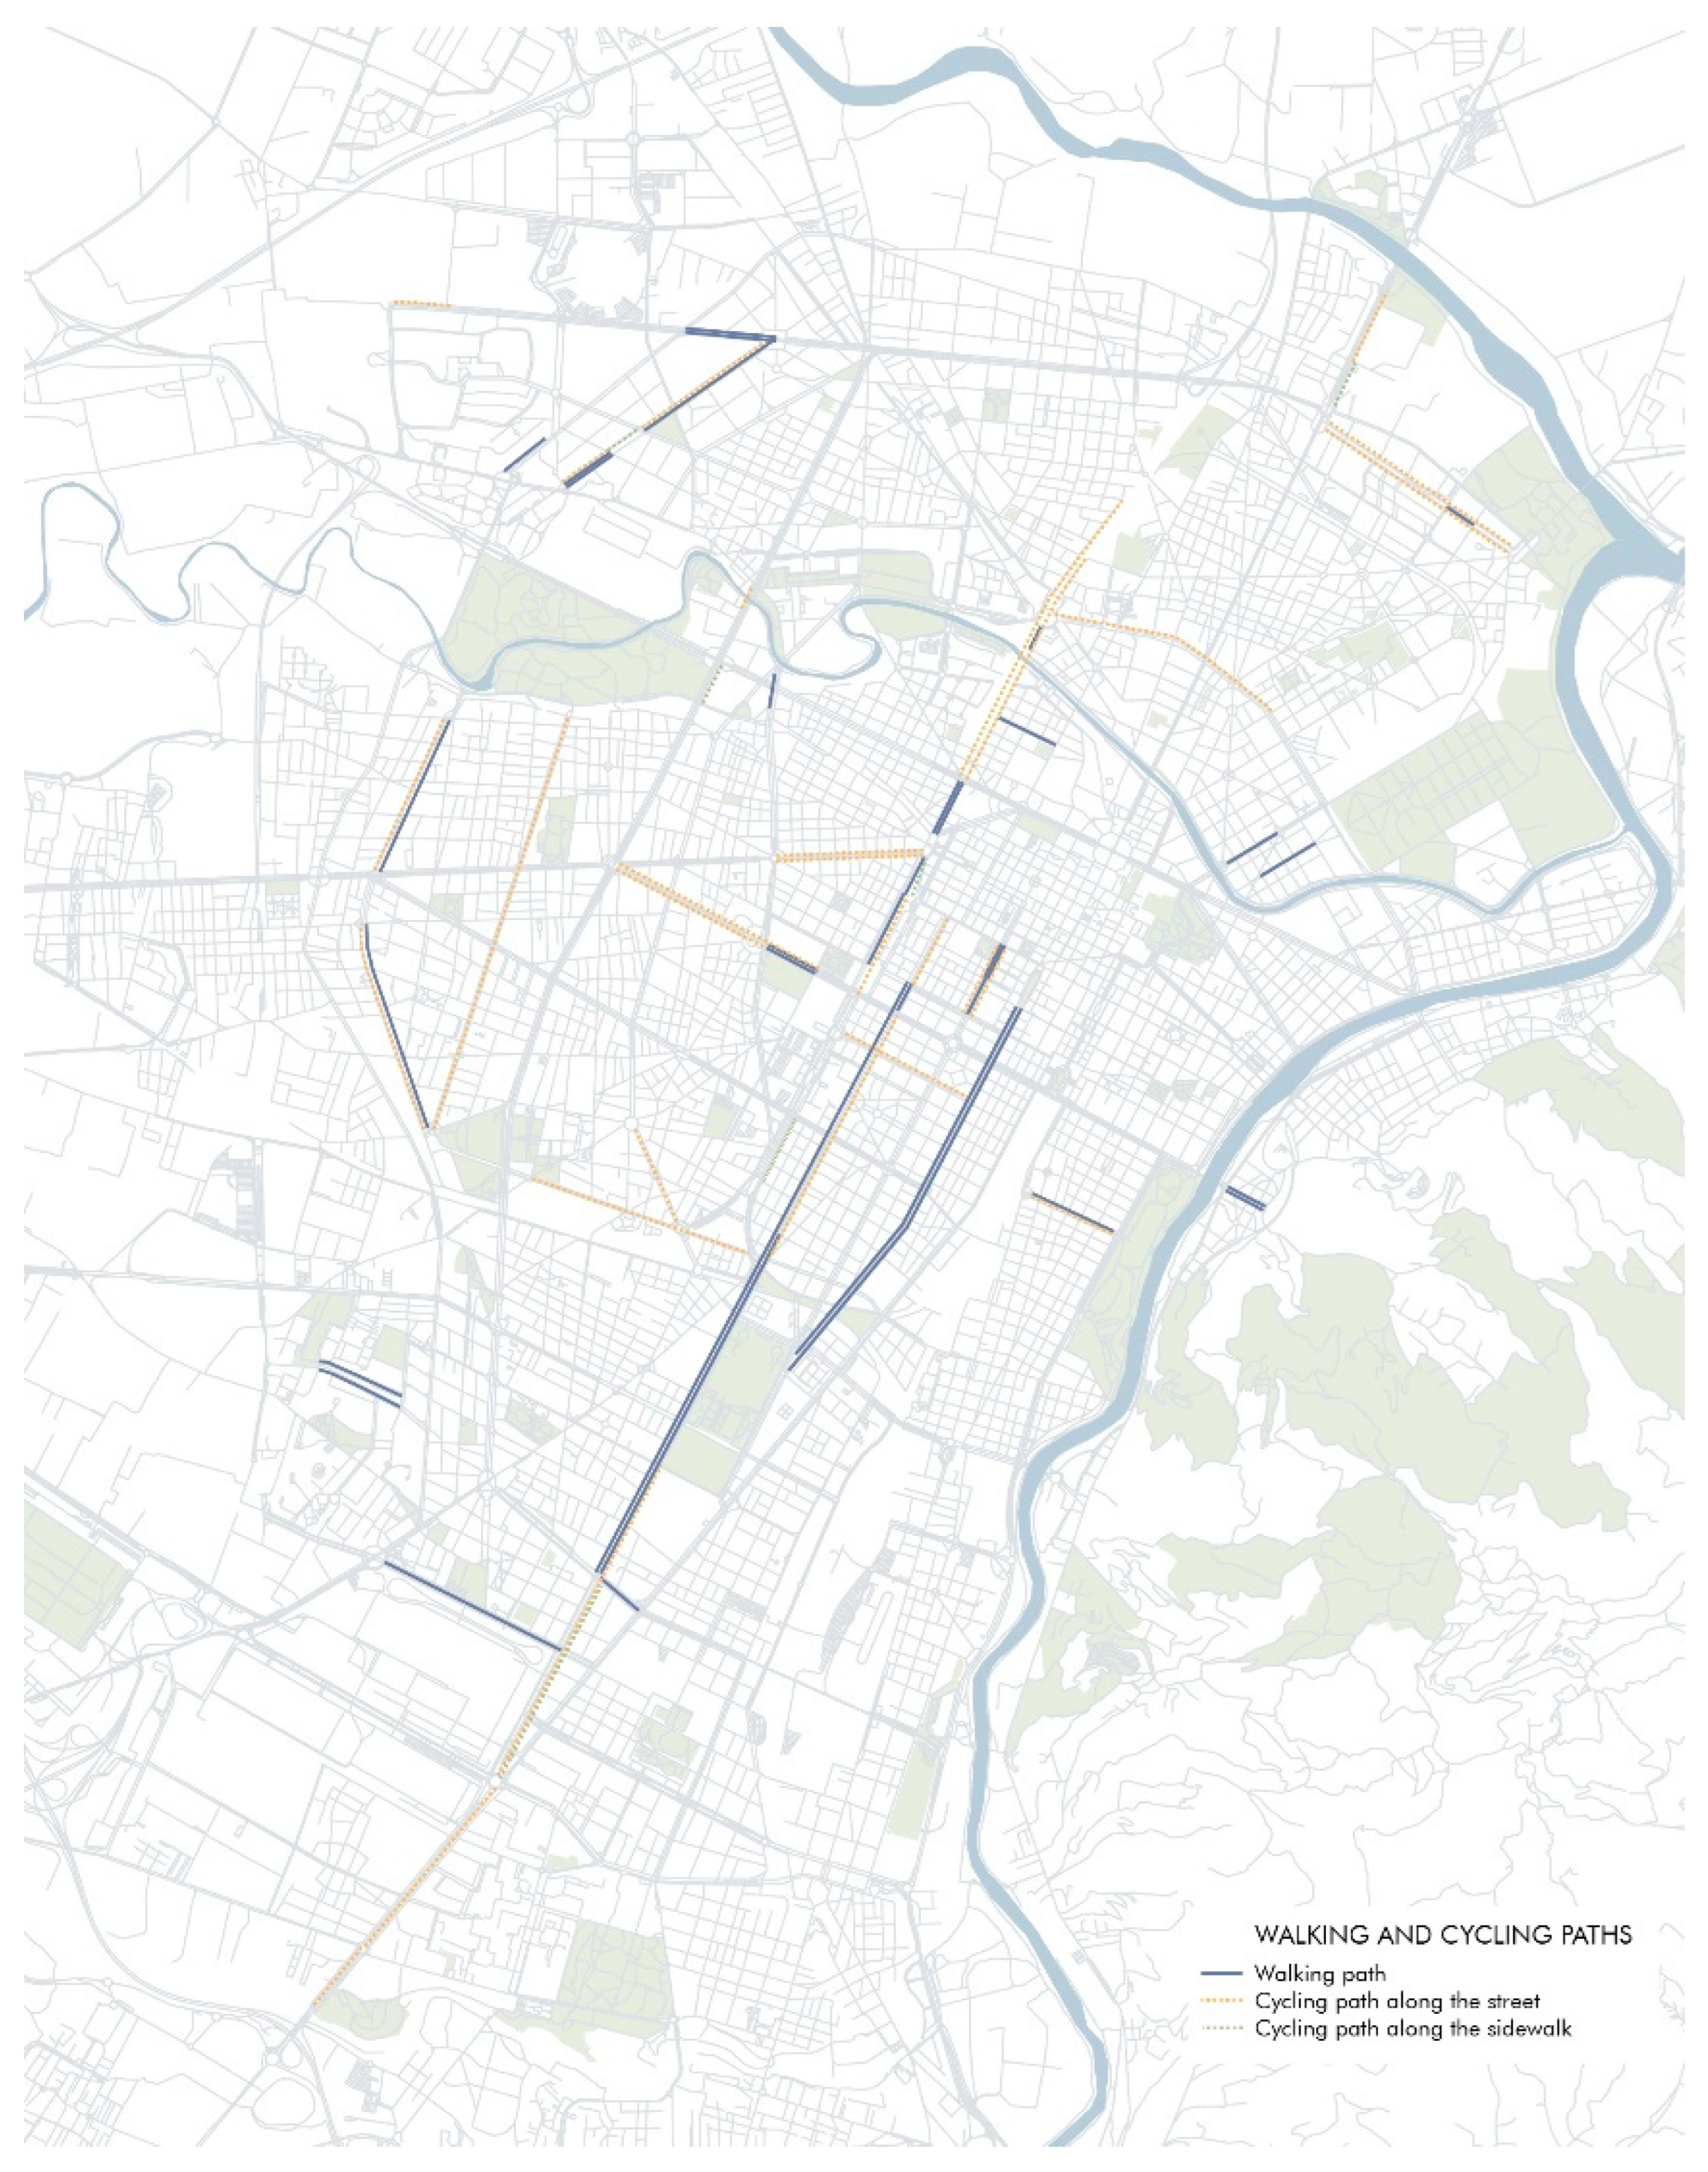
Figure 10). As for the pedestrian areas, only around 20% of these streets have walking paths among them, excluding sidewalks, and around 30% of the streets have bicycle paths (
Figure 11). These features contribute to the final definition of clusters.
2.3. CFD Simulations
CFD microclimate simulations were performed in ENVI-met 5.0.2. ENVI-met is a 3D microclimate modelling software based on the laws of thermodynamics and fluid dynamics [
41]. It was designed in 1994 by Professor M. Bruse and has been under constant development ever since. The model can simulate microscale interactions between urban surfaces, vegetation, and atmosphere [
42]. It could be used to simulate different atmosphere processes such as air flow, air temperature, humidity, turbulence, radiation fluxes and to calculate various thermal comfort indices including
physiologically equivalent temperature (PET), the predicted mean vote (PMV), Universal Thermal Comfort Index (UTCI) and others [
33]
. ENVI-met is one of the most widely used tools for microclimatic research, urban design and thermal comfort studies due to its capacity to recreate microclimatic conditions within urban canopy layer [
43,
44,
45]
. Researchers have been using it principally to examine the effects of urban elements on microclimate [
46,
47]
, and the impacts of different mitigation and adaptation strategies [
17,
48,
49]
.
All the case studies were modelled in the ENVI-met module Spaces with the same input data. The location was set to Turin, with latitude 45.07 and longitude 7.69, time zone Central European Standard Time and reference longitude 15.00. Four nesting grids were placed at the borders of the model area to avoid edge errors in the simulations. Wall material was set as “Default Wall - moderate insulation”, while roof material was “Roofing: Tile”, default materials from the ENVI-met database. Dominant surfaces used in the models are asphalt, grass, light concrete (mainly in the courtyards) and grey concrete (for the sidewalks and walking paths).
Microclimate simulations were conducted for the hottest day of the year 2020, July 19
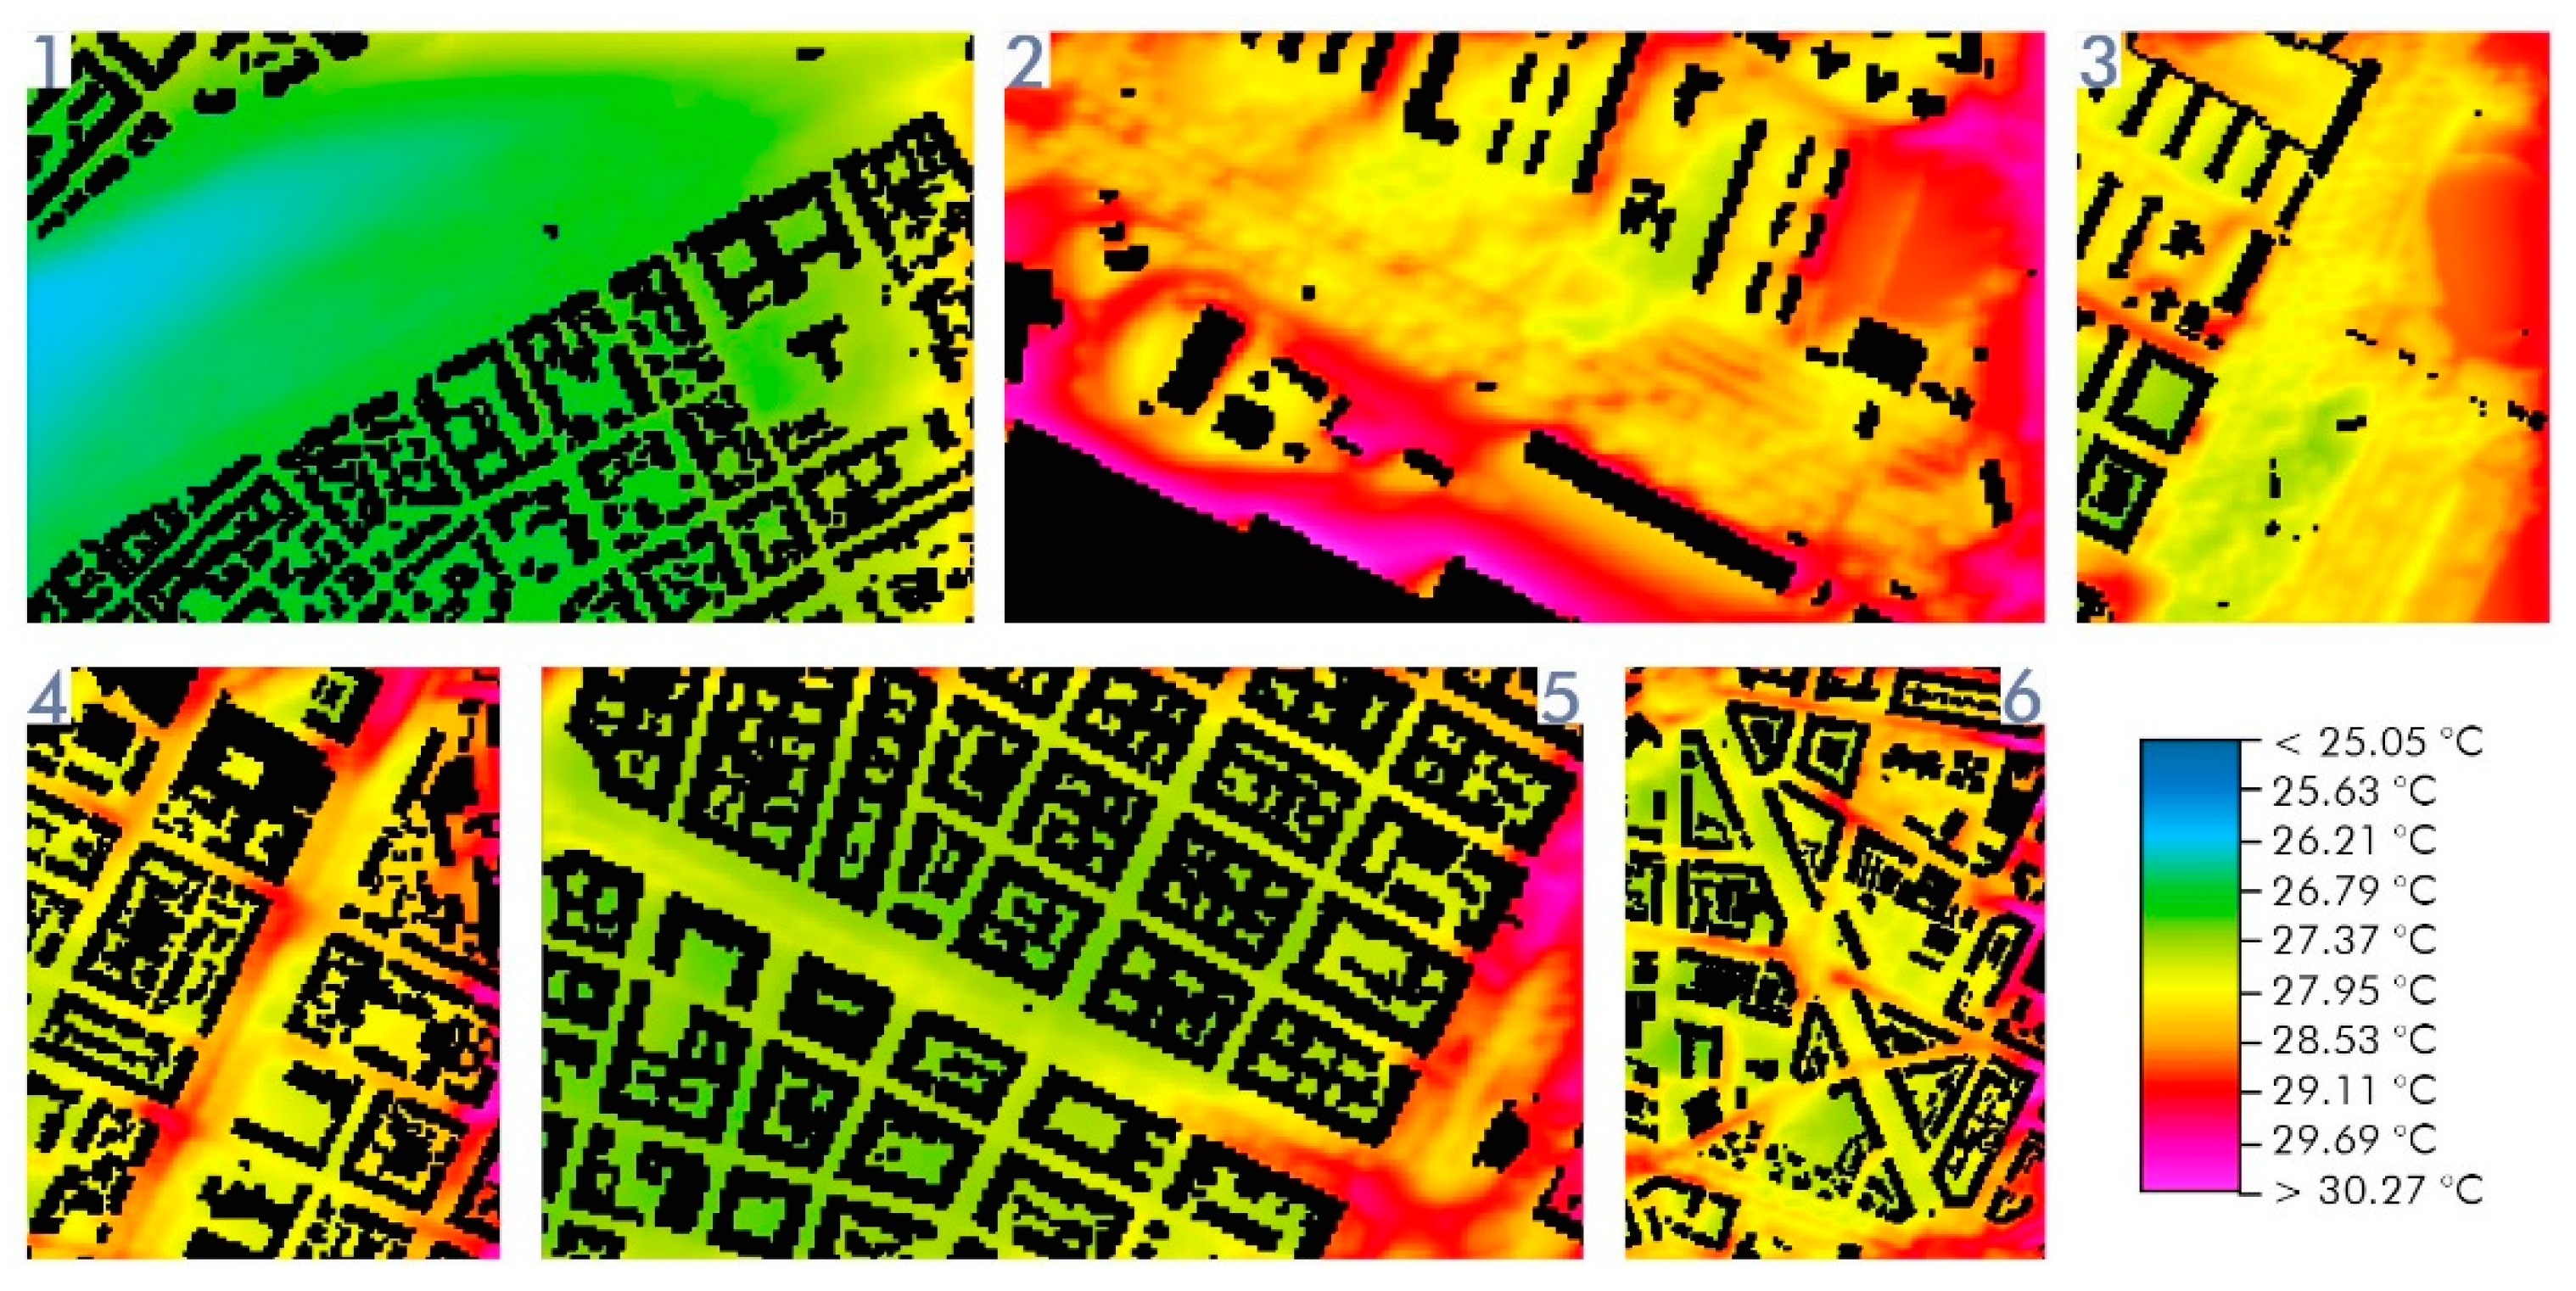
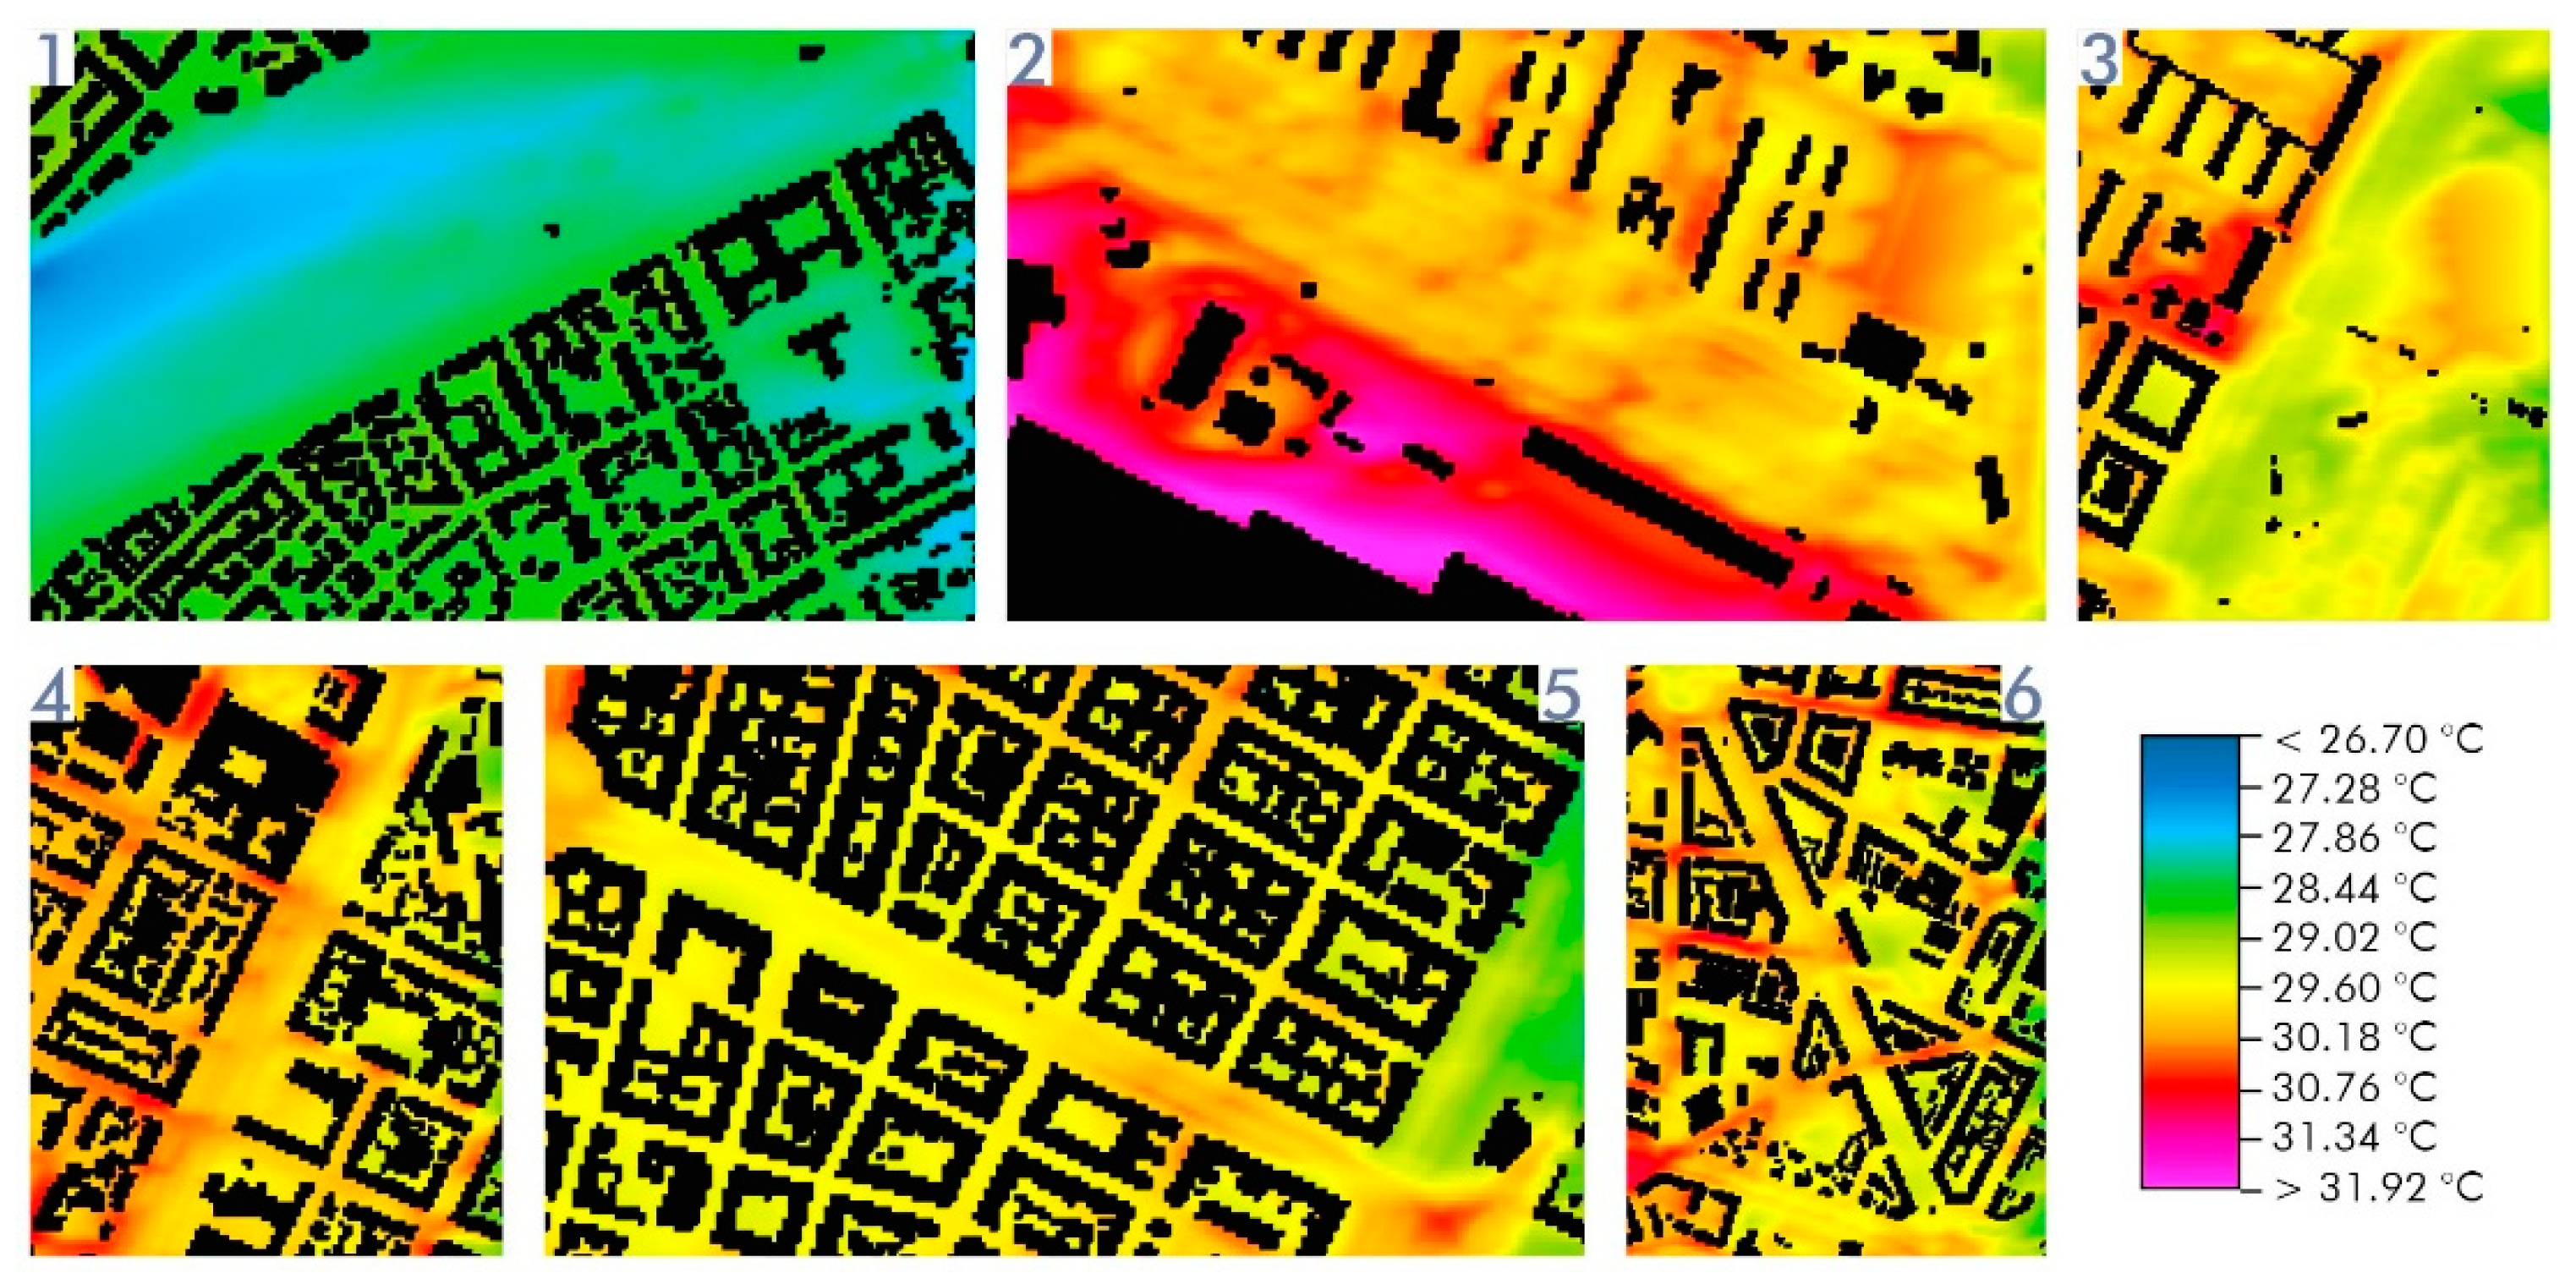
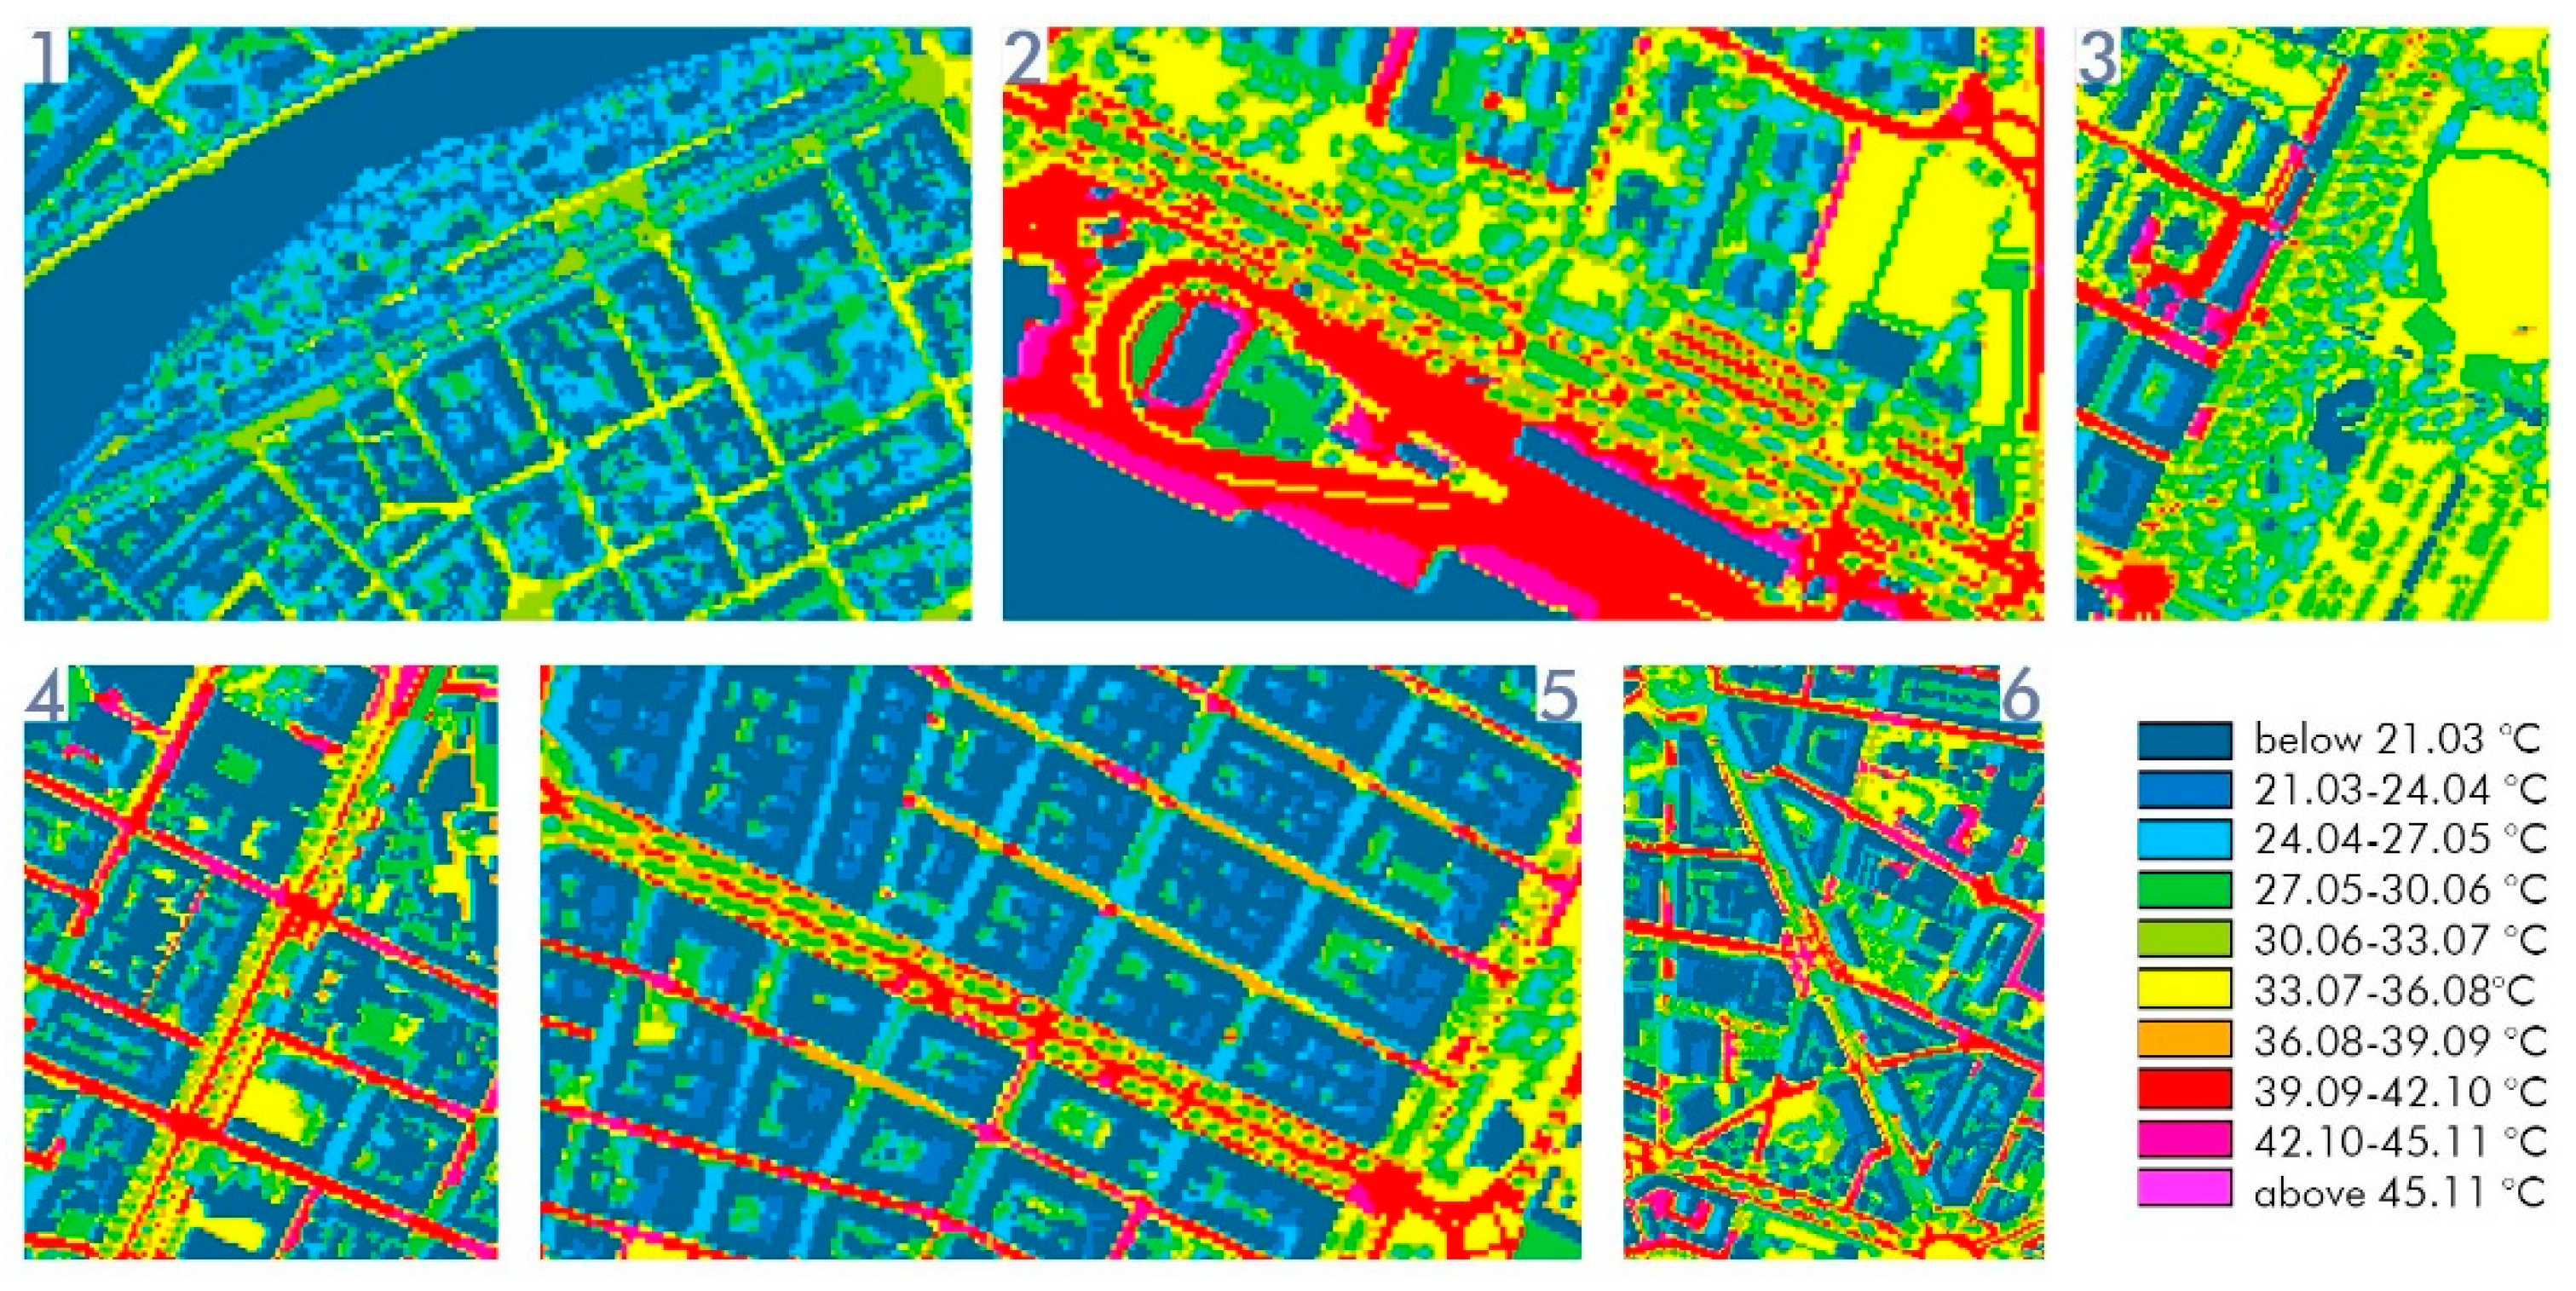
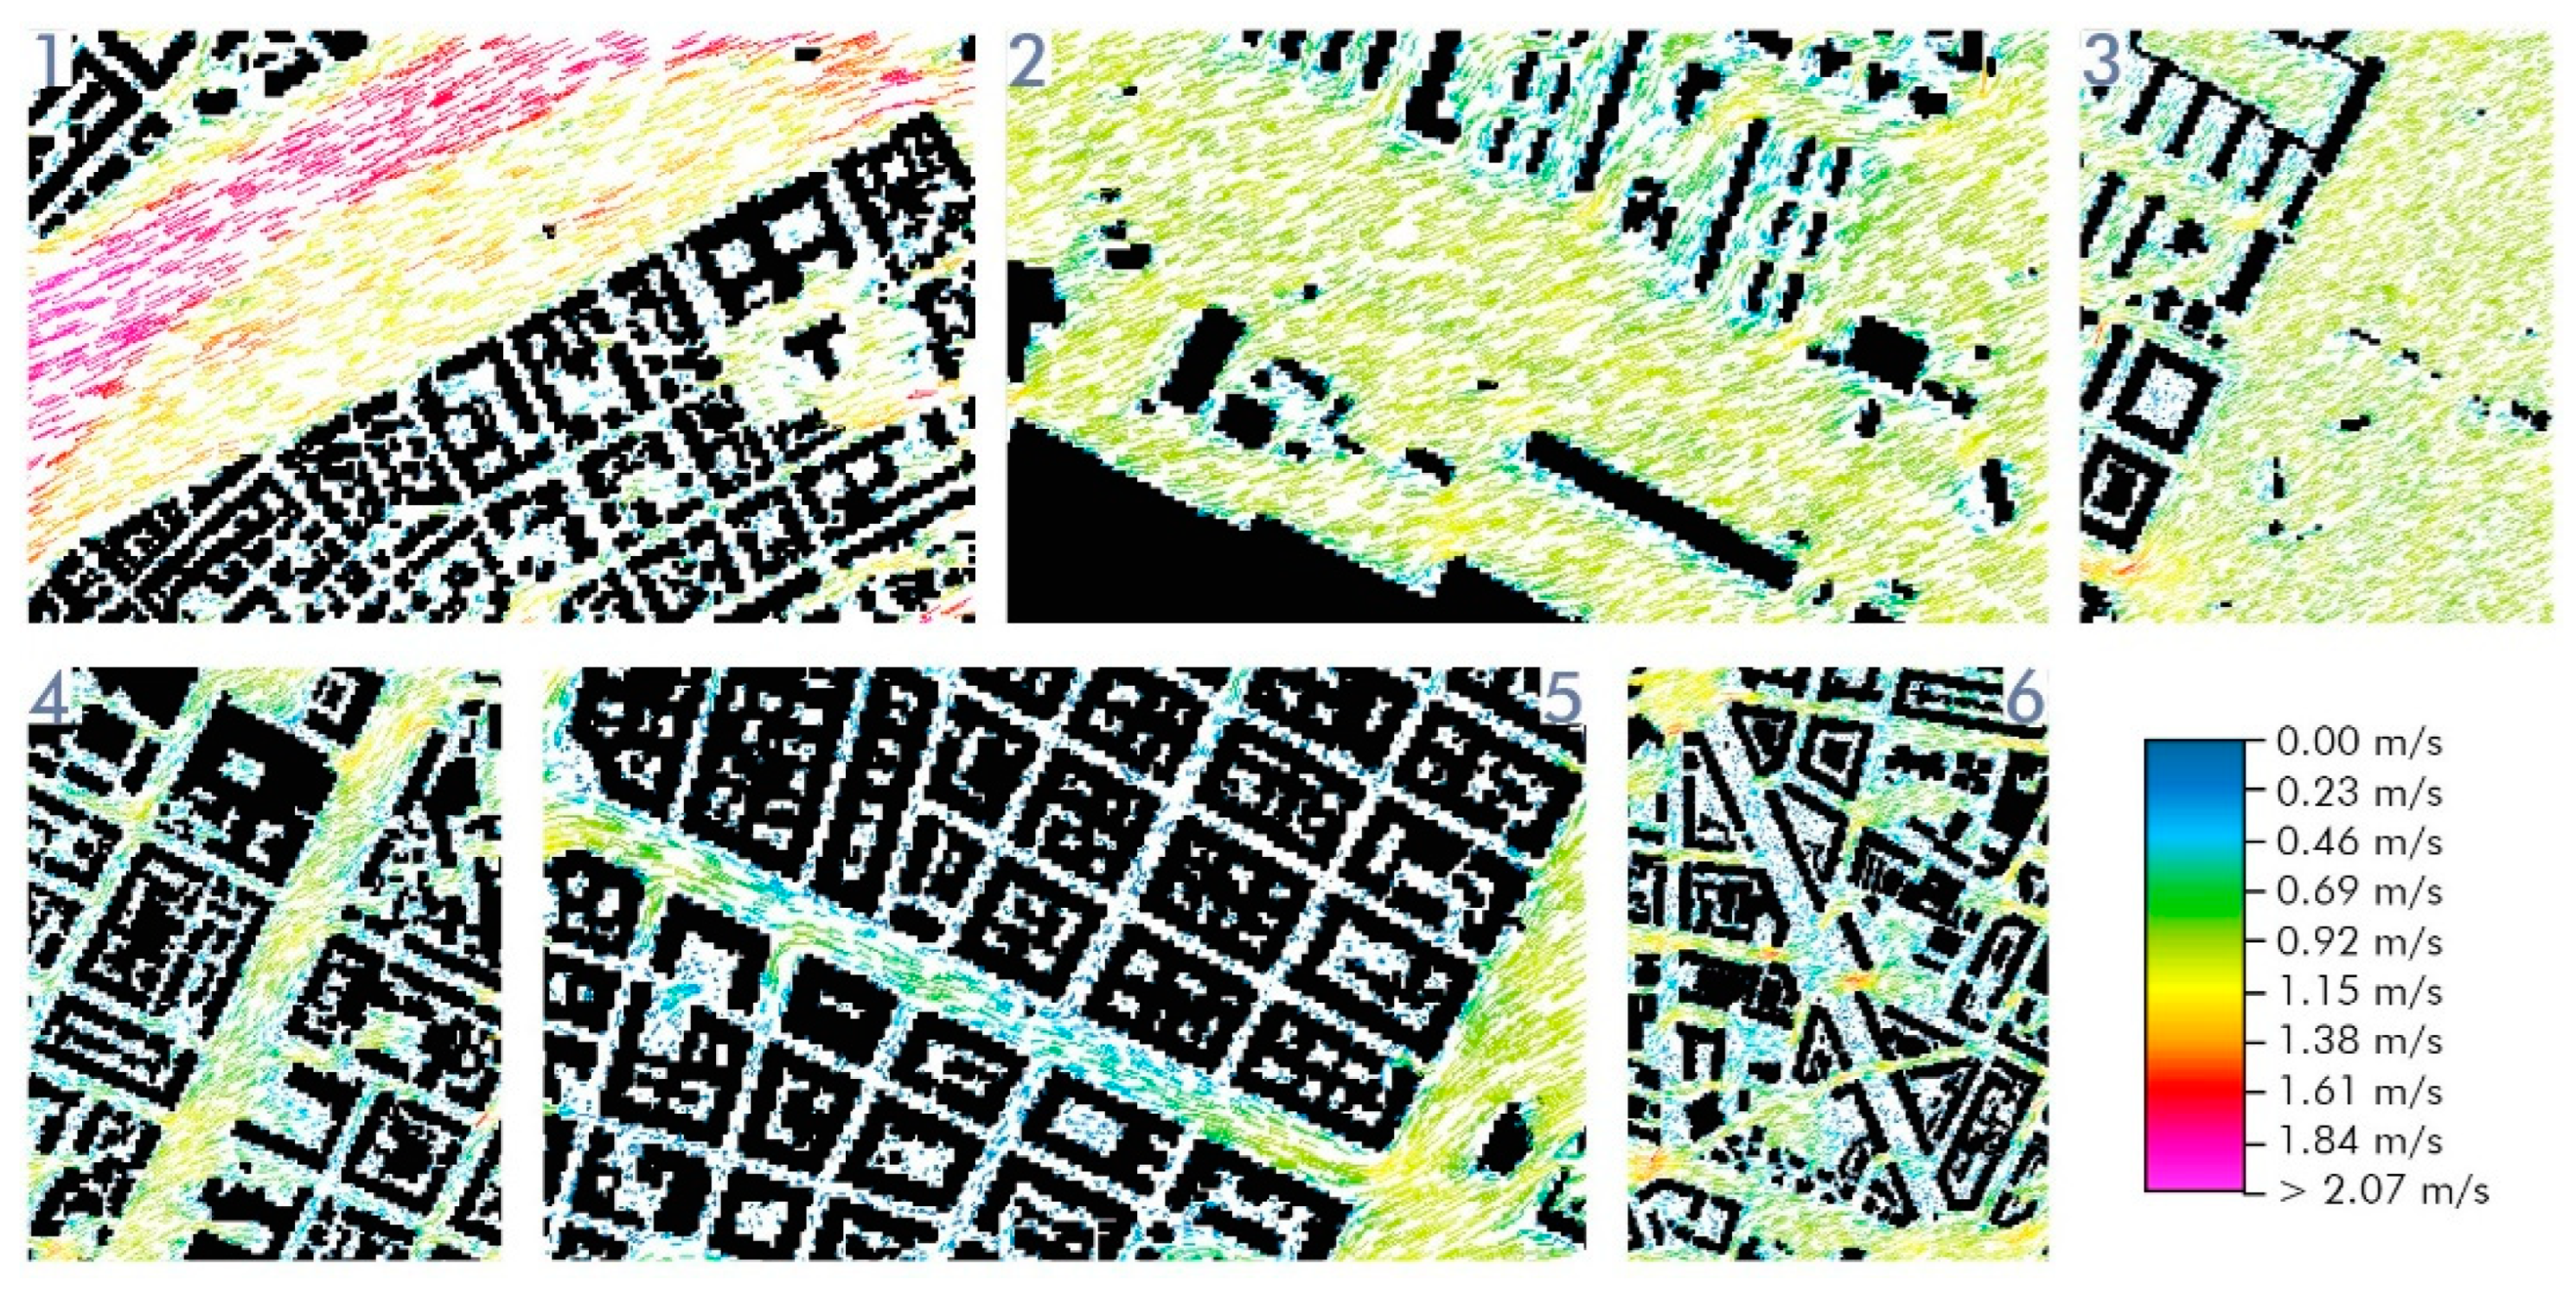
th. As recalled, four parameters were analyzed: PAT, ST, WS, and PET. The results were examined for three different hours: 10:00 h, 14:00 h, which was found to be the most critical hour of the day, and 18:00 h.
Table 1 reports on meteorological boundary conditions used for the simulation, derived from ARPA Piedmont (Regional Agency for Environmental Protection).
4. Discussions
In this section, we will provide a deep dive into the microclimatic response of selected case studies, seeking to highlight which elements of the urban environment are primarily affecting the UHI formation, given our CFD simulations and previous research. We will also highlight the limits of the adopted approach. However, the purpose of microclimate simulations is to derive broad evidence-based take-away points in the conclusions. These points should assist policymakers and professionals (i.e., urban planners, architects, engineers) in designing and prioritizing urban-scale site-specific strategies for UHI mitigation in Turin, given the high availability of space, even in actual compact urban matrix, due to the presence of controviali.
4.1. Urban Canyon
Compact spaces provide better urban thermal comfort than open spaces in hot climates. Besides, in compact spaces the UHI mitigation potential of vegetation, surfaces, and water bodies is weaker than in open spaces [
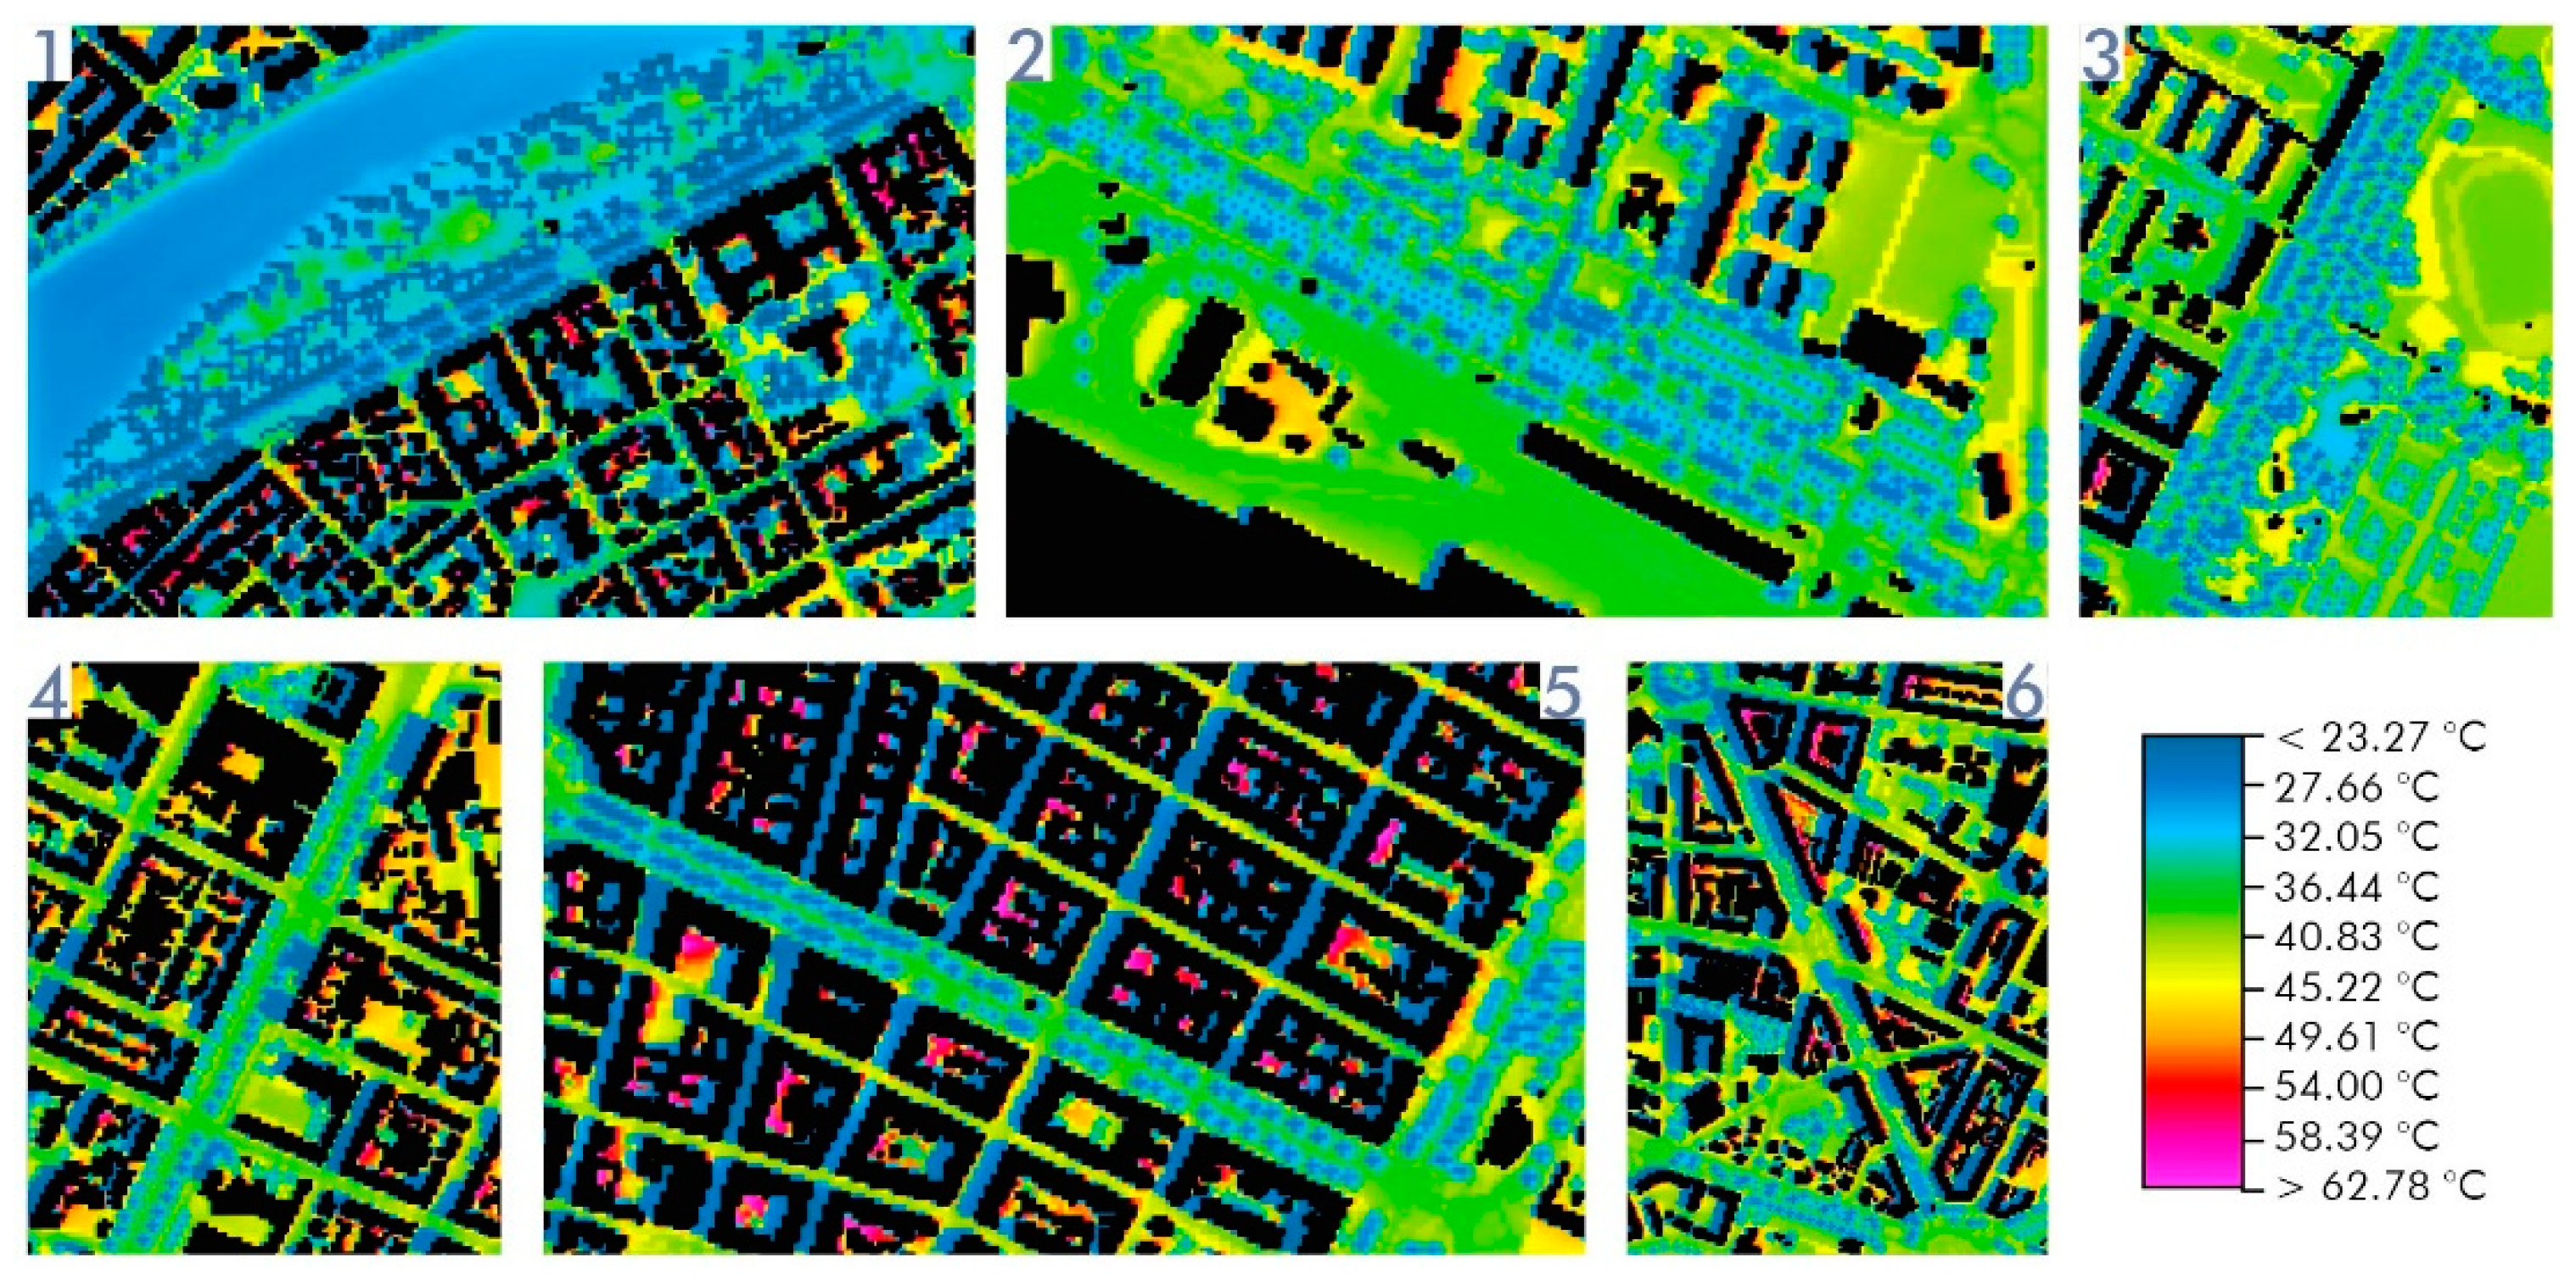
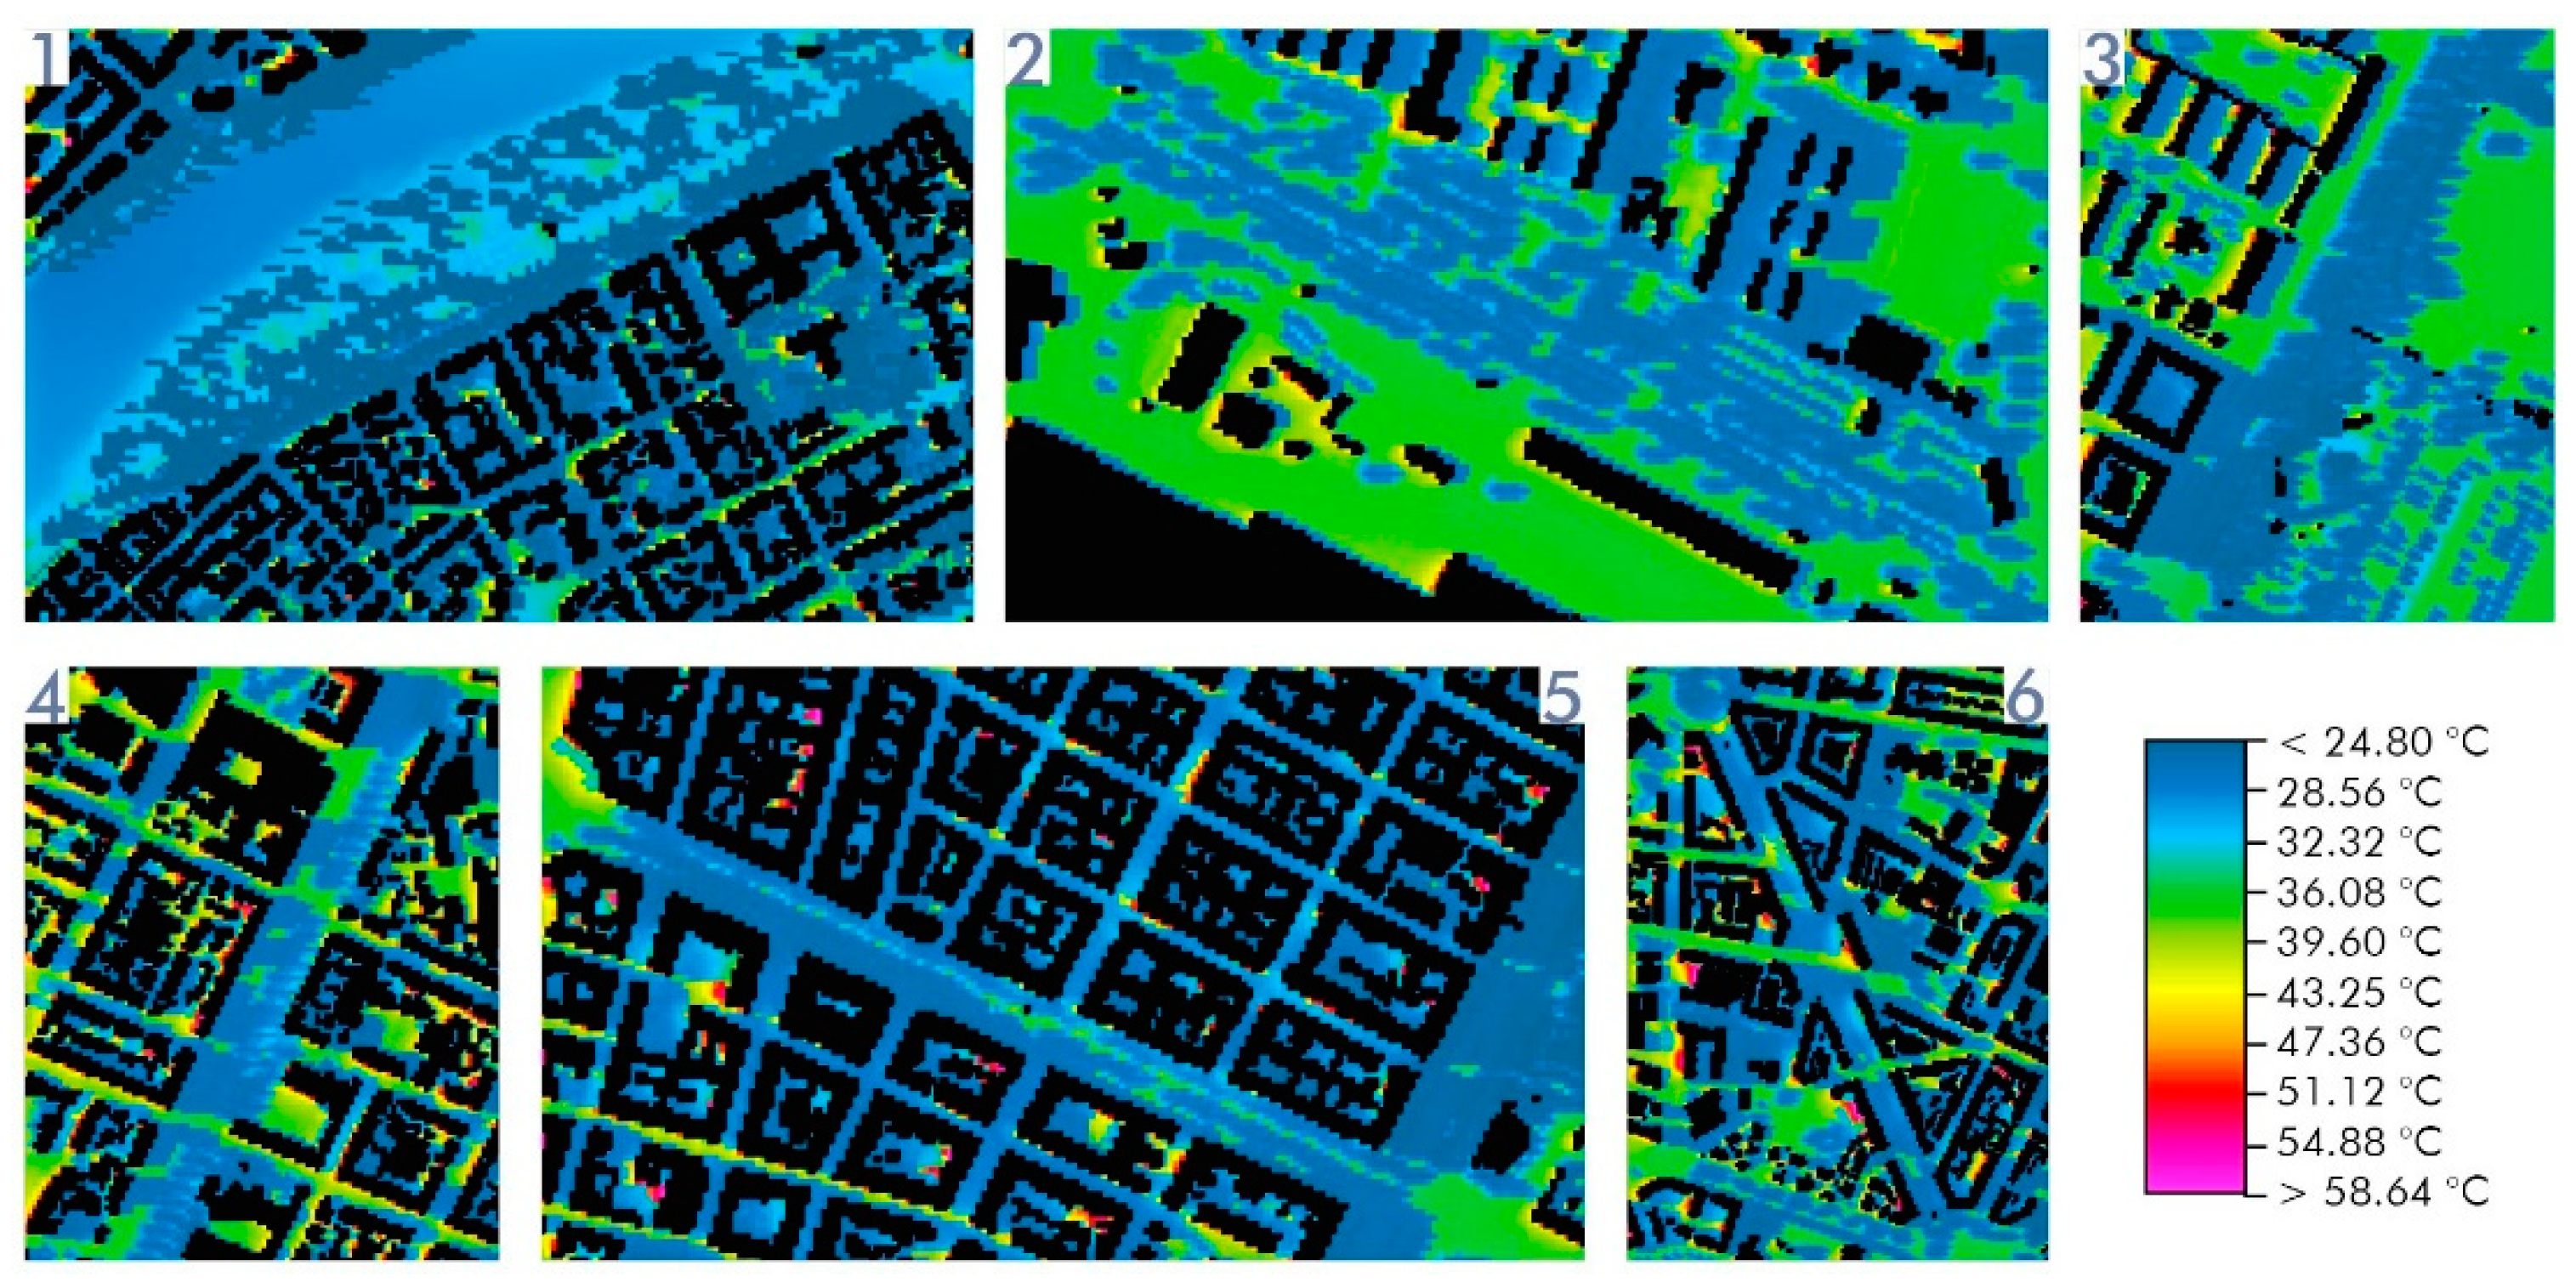
1]. Indeed, the one-sided boulevards (“non-canyon” urban spaces) of Corso Enrico Tazzoli and Corso IV Novembre, which are the less shadowed and more open, have the highest Potential Air Temperature (PAT) in the morning and afternoon hours. On the other hand, Corso Casale, the remaining one-sided boulevard, has the lowest PAT of all the case studies. According to the previous research, deep canyons usually show much lower surface ground temperatures than wide ones in hot dry climates [
10,
53] and best comfort conditions typically occur in shaded canyons [
54]. However, the results in Corso Casale, both for air temperature and PET, suggest that big water bodies like rivers have the greatest UHI mitigation potential as they can be considered heat sinks in urban spaces [
1]. Nevertheless, such a condition is peculiar to boulevards adjacent to the Po River only. In Corso Marconi and Corso Racconigi, the streets (canyons) with the highest aspect ratio, the PAT values are lower than other cases during morning and afternoon (except for Corso Casale). In the evening hours, the results slightly differ (see Appendix). Corso IV Novembre has lower PAT values than the other cases (except for Corso Casale again). This indicates the significant impact of vegetation on temperature reduction in the evening hours, given the presence of a park in the area of Corso IV Novembre. Moreover, the analysis emphasizes the importance of shading provided by the surrounding buildings for the reduction of PAT. Therefore, deeper urban canyons, thus denser tissues, provide better thermal conditions than most of the one-sided or shallow canyons.
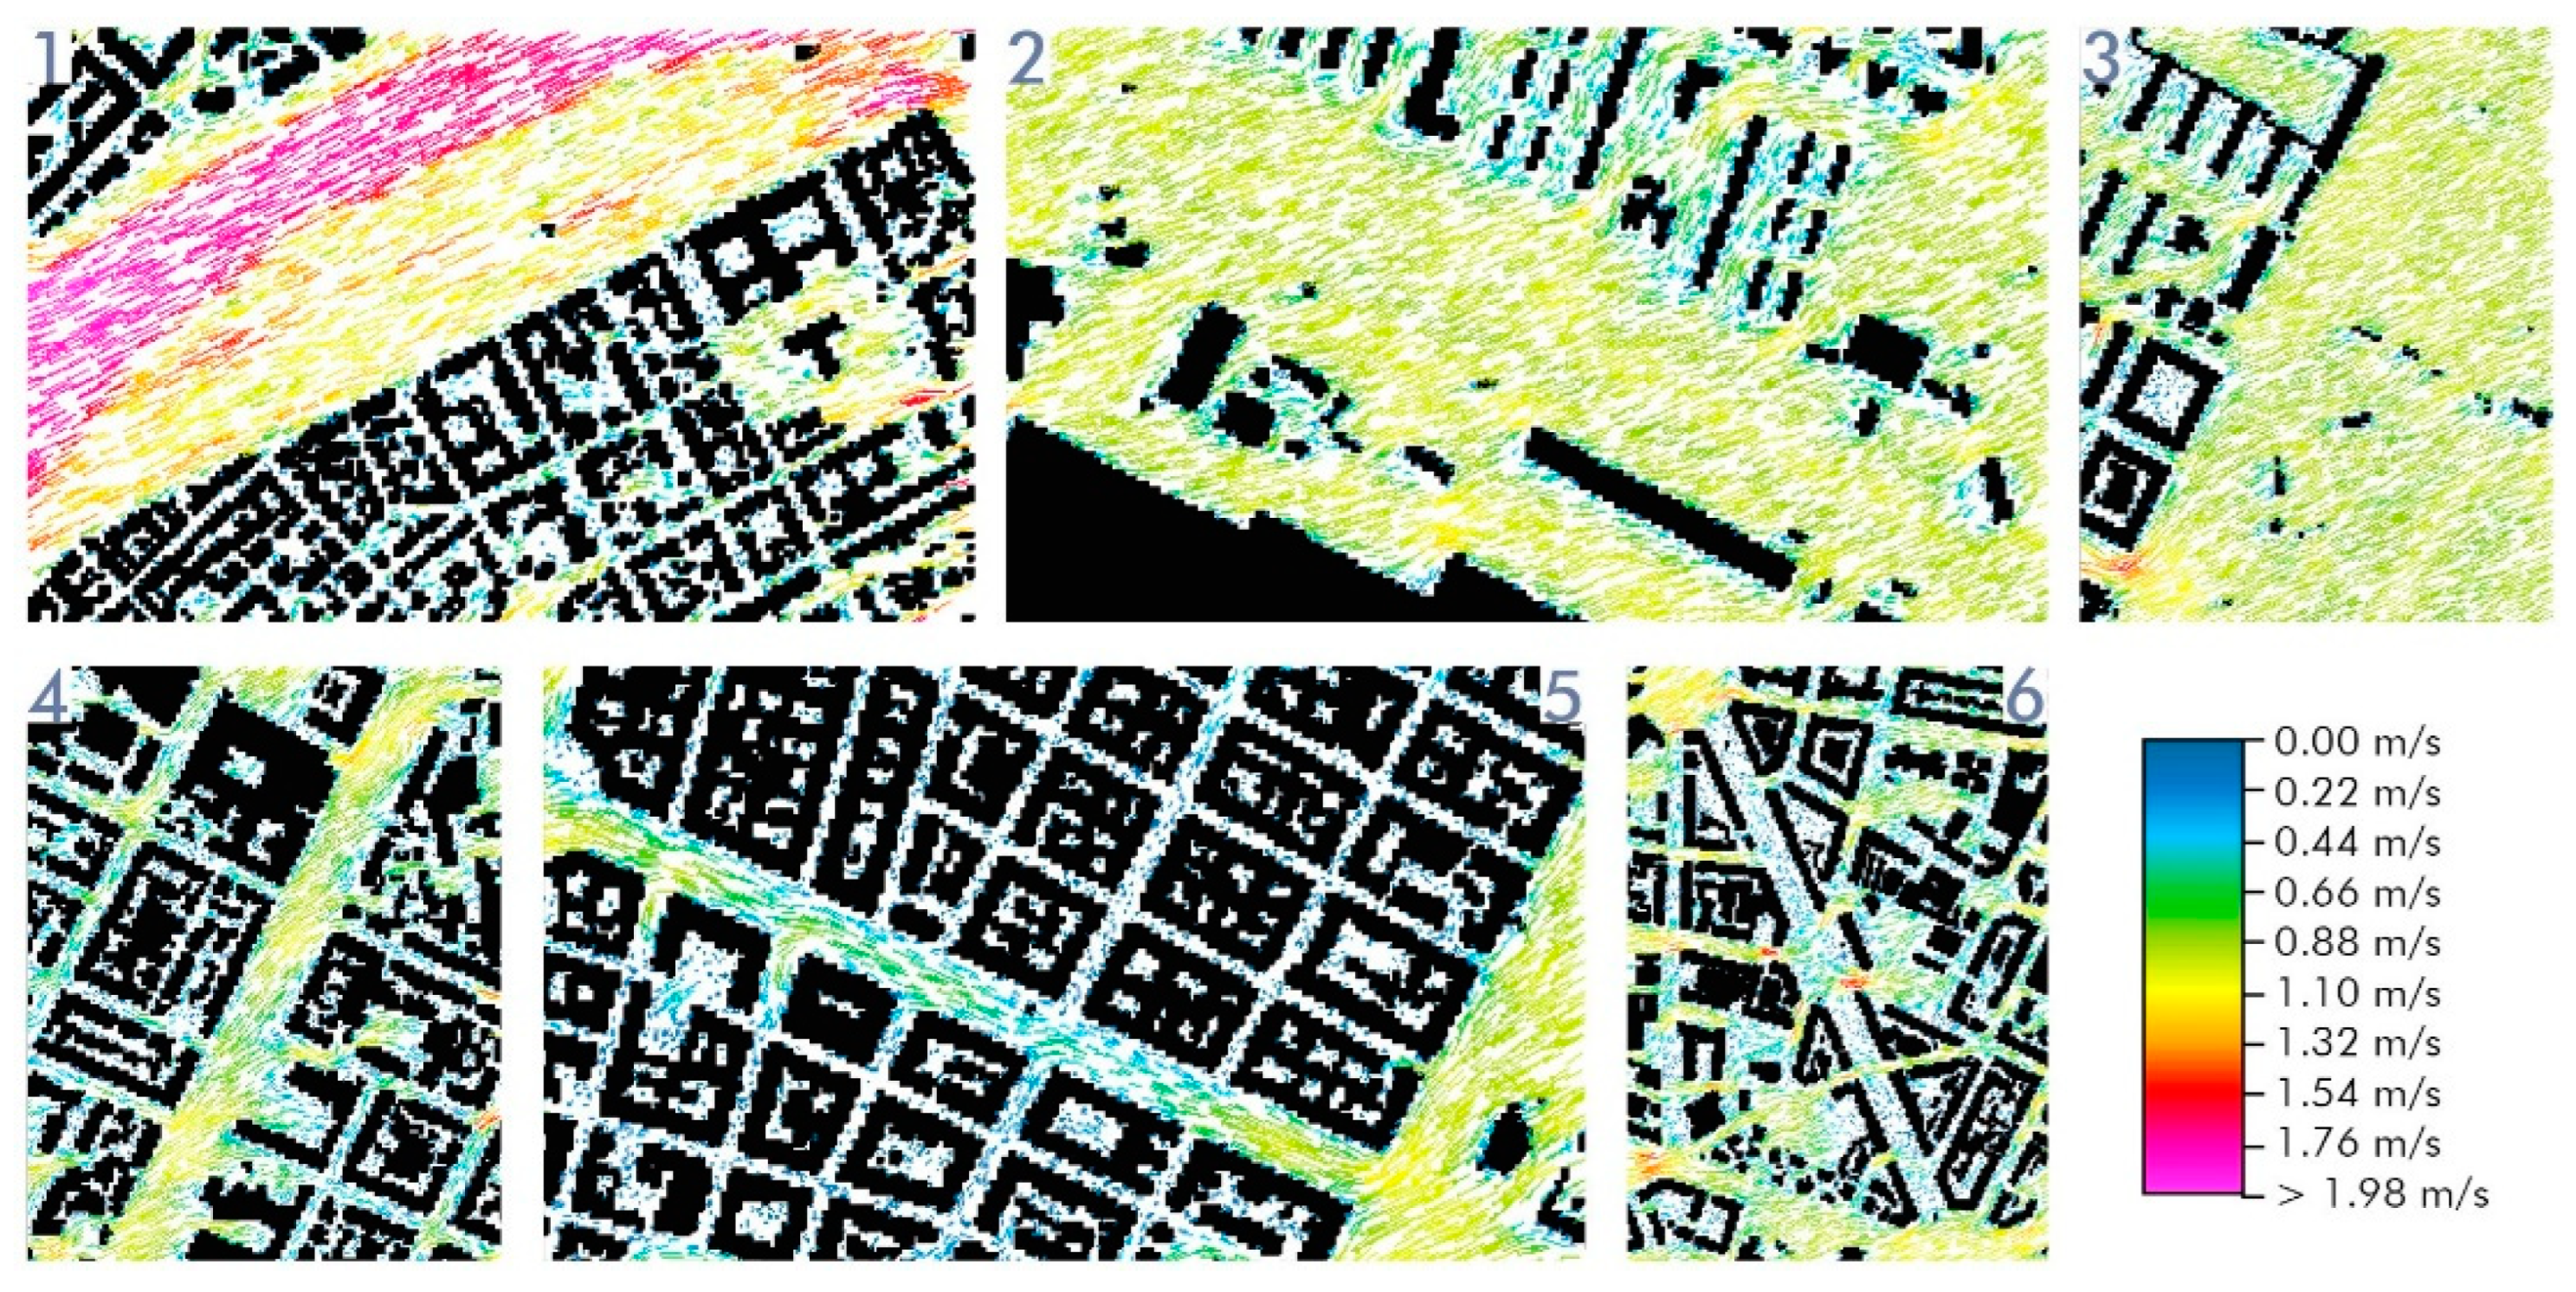
The wind speed analysis demonstrated that wind speed in the one-sided boulevards (non-canyon spaces) is higher than in the symmetrical ones (canyons), due to the lack of obstacles. Indeed, the wind decelerates when it encounters buildings and trees [
1] but this must take into consideration the direction of the wind. Indeed, in Corso Potenza, where the orientation of the canyon is parallel to the prevalent direction of the wind, the air flows slightly faster.
Thermal comfort analysis indicates that the one-sided and shallow canyon case studies, Corso IV Novembre, Corso Tazzoli and Corso Potenza have less favorable thermal conditions than deep or symmetric canyons of Corso Marconi, Corso Racconigi and Corso Casale. In the evening hours, the PET values change, reducing the difference of thermal comfort in the case studies. Specifically, in the evening hours, when the sun is setting, the effect of vegetation shading is more evident. The PET analysis demonstrates a significant difference in the values close to the vegetation as opposed to the ones of the non-shaded areas, suggesting the importance of blocking solar radiation during the day for thermal comfort, proving the stance from the literature [
17,
55].
4.2. Orientation
Urban canyon and orientation are inseparable aspects of the urban morphology, and therefore to assess the impact of urban geometry on the climate at micro-scale, both elements must be examined. Numerous researchers have examined the effect of different street orientations on microclimatic conditions in urban areas. However, their findings differ based on location, latitude, meteorological parameters, and urban features of the case studies. Previous studies [
52,
56,
57,
58] suggest that the most unfavorable orientation is E-W. Besides, [
55] indicate that the NE-SW oriented urban canyons provide higher thermal discomfort, while [
59] claim that this orientation provides the best thermal comfort. According to [
52] and [
58], the most favorable thermal conditions occur in streets N-S oriented.
The PAT analysis suggests that the NW-SE orientation is more favorable than the NE-SW one in the morning and afternoon hours in deep urban canyons. Corso Casale and Corso IV Novembre are both one-sided canyons NE-SW oriented, suggesting that it is the optimal orientation in the evening hours for the comfort in the open spaces. However, as recalled, this might highly depend on the wind direction as well (NE blowing in the simulations). Nonetheless, there is a significant difference between these two case studies. The urban non-canyon space of Corso IV Novembre is shallower, with the buildings on the north-west side of the street, while Corso Casale is characterized by higher buildings on the south-east side of the street. These two case studies indicate that the presence of wind could have greater impact on the potential air temperature in the evening hours, when solar radiation is lower. Deep canyons of Corso Marconi and Corso Racconigi, oriented NW-SE, have lower wind speed. The simulation results verify the importance of geometry and orientation for urban air flow [
1]. The most favorable orientation regarding wind speed is NE-SW because of the wind direction input, which is prevailing in Turin during summers, providing better urban ventilation, cooling, and removal of pollutants [
60]. Wind speed analysis confirms the stance by [
57] that wind speed is the highest in the streets oriented parallel to the prevailing wind and the lowest in the perpendicular ones. Finally, Corso Casale has the best thermal conditions, but the remaining NE-SW streets have less favorable PET values, stressing the high mitigation potential of big water bodies and the need to protect pedestrians from solar radiation.
4.3. Surfaces
Types of surfaces and their properties can have substantial effect on the microclimate conditions [
18],61–63]. However, compared to urban geometry and vegetation, surfaces have less UHI mitigation potential and cooler surfaces might even worsen the thermal comfort for pedestrians because of an increase in the reflected solar radiation [
1]. Therefore, specific simulations for the evaluation of design scenarios and environmental assessment are highly needed for this. Dominant surface types covering the case studies include asphalt, ground and concrete pavement used for walking and cycling paths. Asphalt, the main constituent of all the case studies, contributes to the formation of UHI due to its low albedo and non-permeability [
10].
The PAT analysis demonstrates a discrepancy in the ratio of permeable and non-permeable surfaces and the temperature values. The temperature in the case study with the highest asphalt-to-green areas ratio, Corso Marconi, is lower than in Corso Tazzoli, which has the lowest ratio. Corso Casale has the most favorable thermal conditions, although it is one of the case studies with the greatest area coverage in non-permeable surfaces. The inconsistency in the PAT values and ratio of permeable and non-permeable surfaces in the case studies confirms that this is not the primary element affecting air temperature in the urban canyon. Surface temperatures of the areas shaded by surrounding buildings or vegetation are lower than in the non-shaded areas, despite the type of surface. Again, this verifies the primary role of street geometry first against the UHI formation. Indeed, despite Corso Marconi’s minimal permeability, it has better thermal conditions in spaces shaded by buildings and trees than Corso IV Novembre, Potenza and Tazzoli, which have more green areas. The PET results indicate that thermal comfort in the green areas is more favorable than in the non-permeable areas, except in the spaces shaded by buildings.
4.4. Vegetation
The significant impact of vegetation on the microclimate has been noted in the literature [
15], [
55,
61,
62,
64,
65]. It has been proven to lower air temperature and provide more favorable thermal comfort, along with promoting various health benefits for humans [
66,
67]. Two of the case studies, Corso Casale and Corso IV Novembre, have a park on one side. The difference is in the position of the vegetated area. Here, the wind speed is sensitively higher due to no obstacles present, either buildings or tree lines. In Corso Casale it is on the N-W side of the street while in Corso IV Novembre it is located on the S-E side. All of the case studies have rows of plane trees about 20 meters high. Corso Casale and Corso IV Novembre, despite both having a big, vegetated area on one side, have different PAT intensities in the morning and afternoon hours. Correspondingly, Corso Marconi and Corso Racconigi, as well as Corso Tazzoli and Corso Potenza, have similar temperatures but different amounts of vegetation in their urban canyons and open spaces. In the evening hours, the most vegetated case studies have the lowest PAT. Again, the sole presence of vegetation is not enough to lower the potential air temperature, as demonstrated in the case of Corso IV Novembre.
The shade cast by surrounding buildings has the biggest impact on surface temperature reduction, further confirming the need for denser urban environments for greater comfort. Indeed, PET analysis shows that in all the case studies thermal comfort is improved with the presence of vegetation, but not to the same extent as with the shade of the surrounding buildings.
4.5. Limits
This study faces several limitations. First, as for the use of the software ENVI-met, the modality of the simulation was set as “Simple Forcing.” This means that initial values of wind speed and directions were used only, due to simulation time constraints and data availability. However, wind speed and direction might have changed throughout the day, slightly affecting the selected parameters potentially. Second, as for the meteorological boundary conditions, they were acquired from “Caselle” ARPA station (
http://www.arpa.piemonte.it/rischinaturali/tematismi/meteo/osservazioni/rete-meteoidrografica/anagrafica-stazioni.html?delta=2&ID_VENUE=21529, accessed on 15 May 2023), in the periphery of Turin Metropolitan Area. This helped us in managing such a complex and extensive simulation process, as well as reducing biases related to different input meteorological values and harmonizing the comparisons. However, another approach could have been adopted if we had acquired data from the nearest meteorological station with respect to selected case studies to finally rely on more case study-specific conditions. Third, the simulations refer to case studies elected as representatives of each boulevard cluster. Although we believe that this approach might still be valuable to finally identify site-specific strategies related to proper roads’ conditions and features, and based on urban layouts’ responses, it might lead to an oversimplification, considering that each road might potentially have its own microclimate peculiarities in light of different geometry, surfaces, and vegetation properties. However, this study is one of the first comprehensive research on microclimate in Turin at the urban scale. Besides, its originality lies in acknowledging the presence of peculiar controviali as a potential resource to “gain space” in a strictly consolidated urban settlement for UHI mitigation and climate adaptation purposes. Moreover, the simulation process and selected case studies are based on real-world data and features (rather than morphological archetypes, as it mostly happens in the field literature). Finally, the methodological approach was designed to be potentially replicated in future research. Indeed, this workflow (data gathering and analysis at an urban scale, clustering urban streets in relation to the layout, mobility supported, and type of surfaces, and performing advanced CFD simulations to inform cluster-specific nature-based strategies) might be scaled-up and adapted to other study areas.
5. Conclusions and Implications for Urban Mobility Design
Since the final aim is to finally identify and prioritize evidence-based specific solutions to mitigate the UHI by designing more resilient spaces in urban streets, the approach presented might fit other cities where urban streets are oversized considering the near-future decline of private car use [
68]. To this end, the identification of clusters of boulevards based on their street features and mobility type helped examine the effects of those properties on thermal conditions through representative case studies and advanced CFD microclimate simulations.
Due to Turin’s urban density and the actual need for space to implement UHI mitigation and climate adaptation strategies, many boulevards with
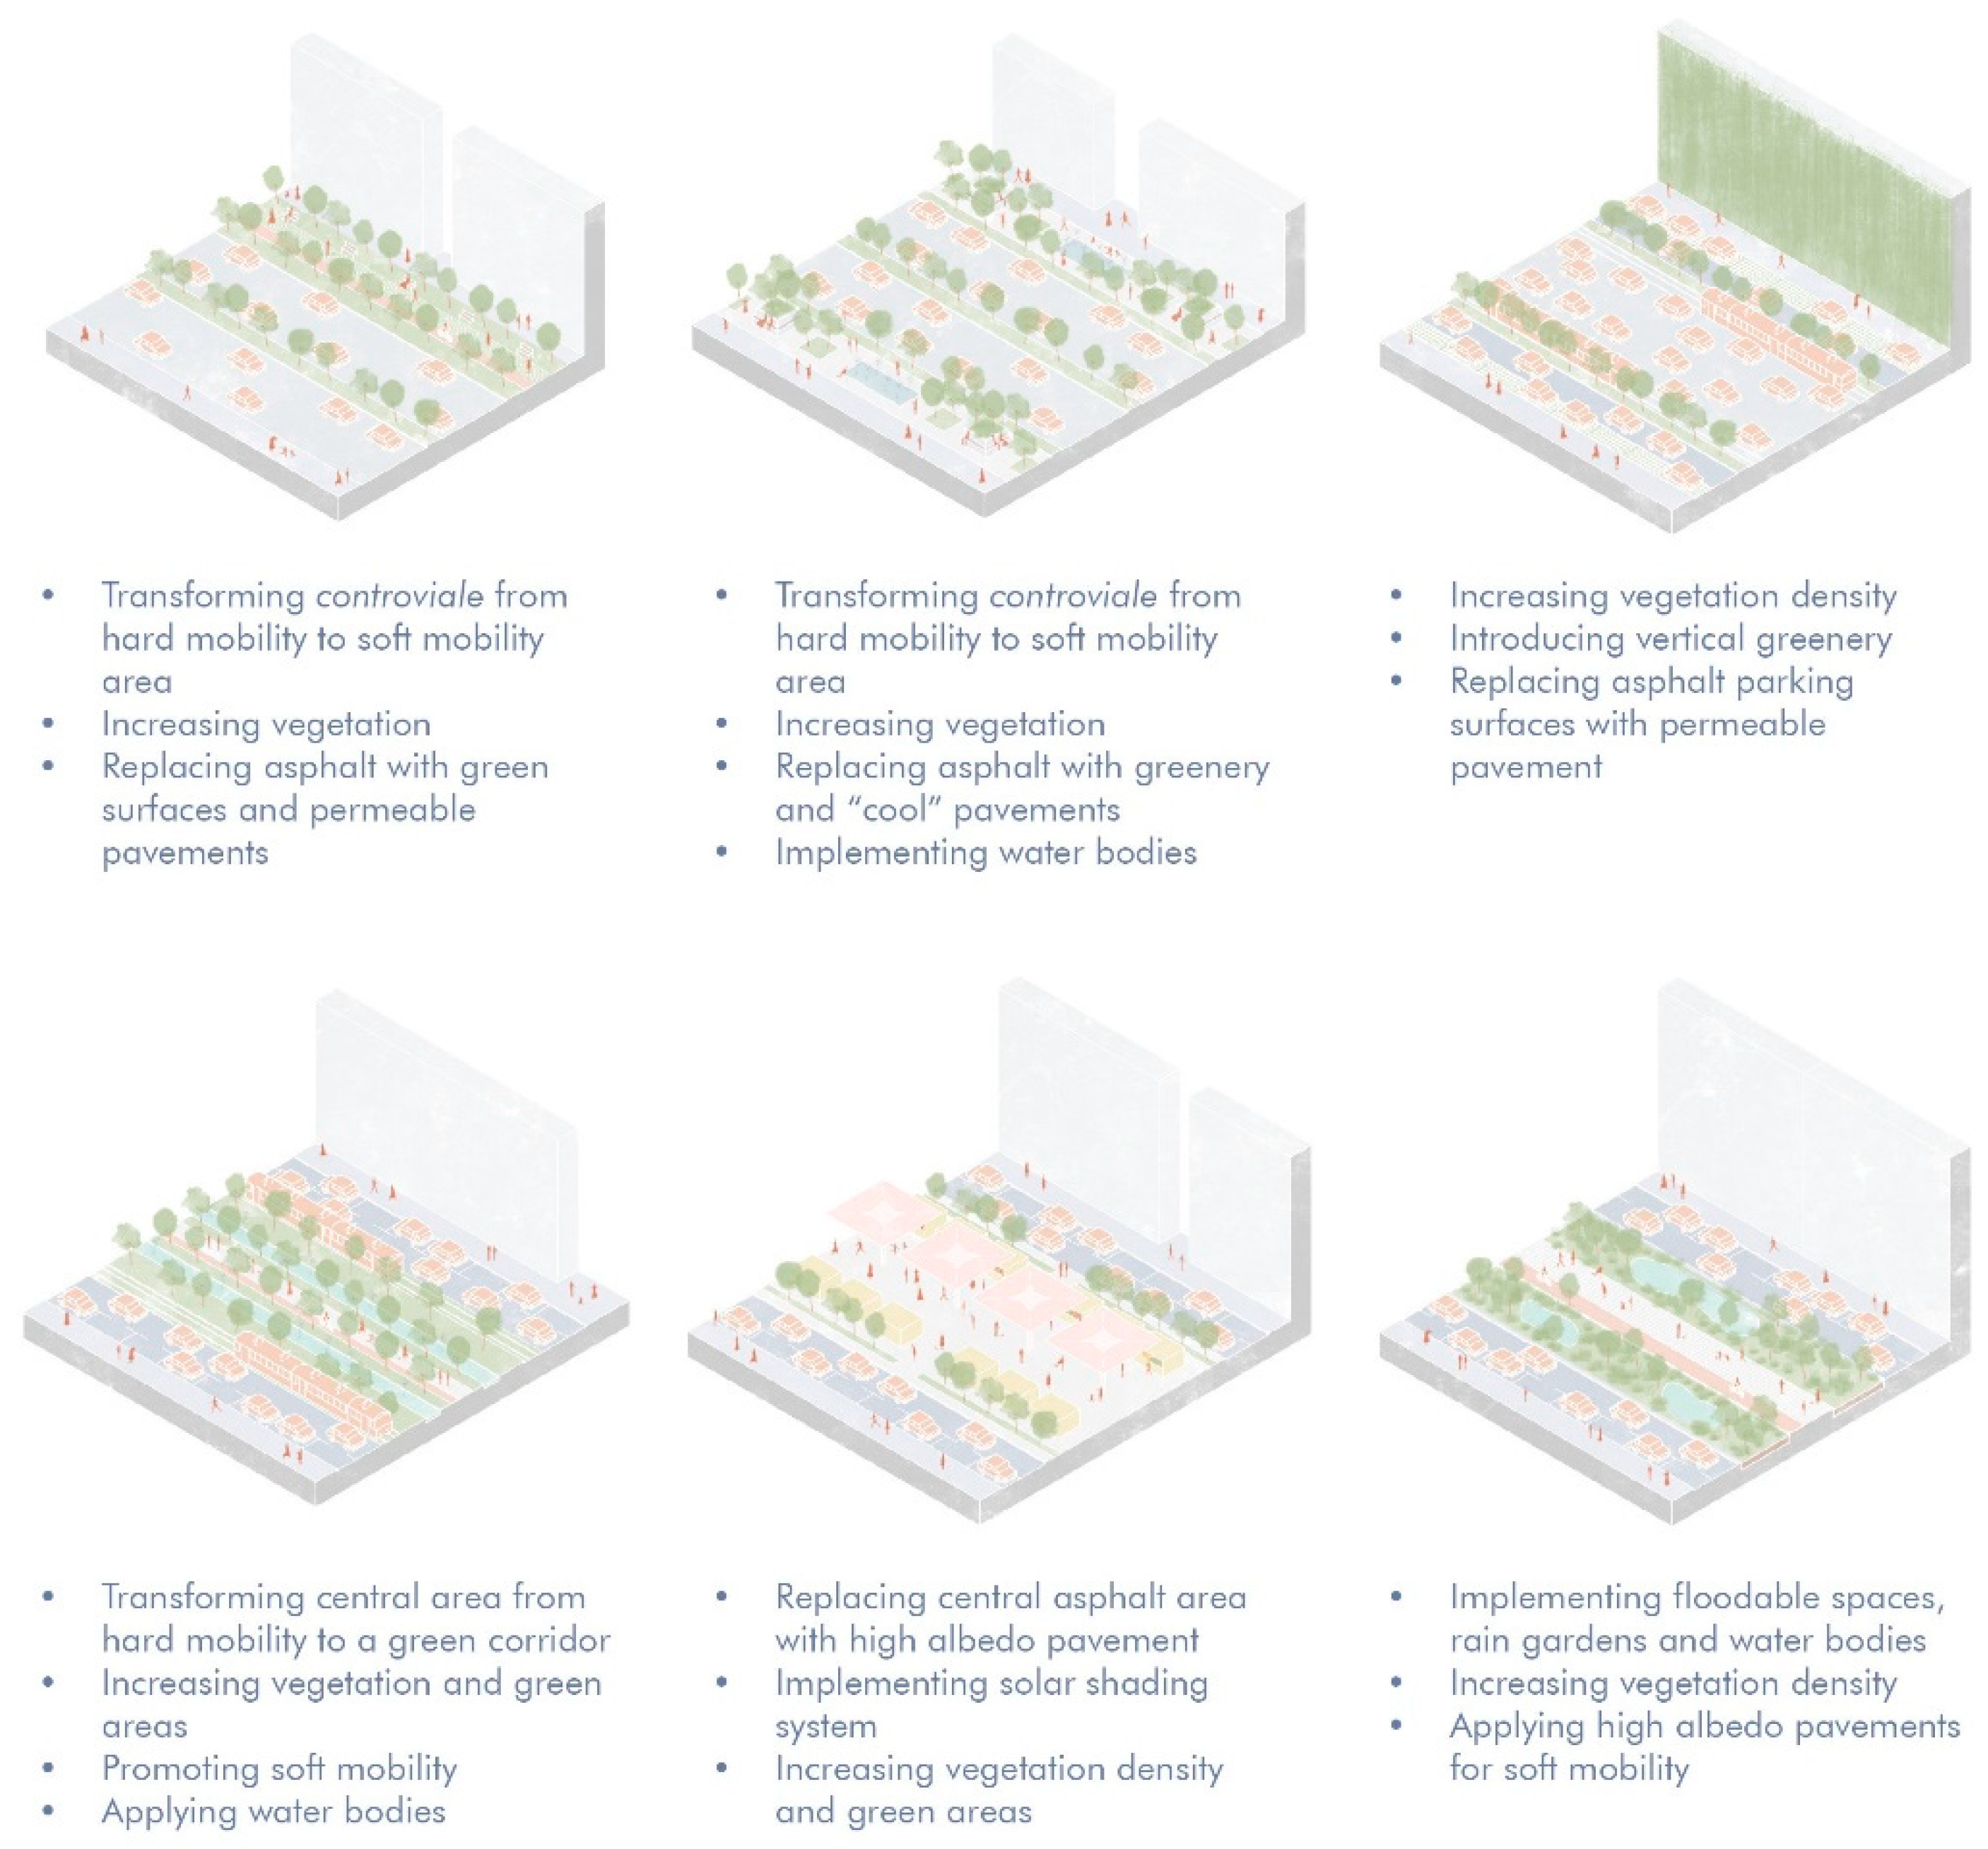
controviali could provide that space by reducing the overabundant areas designated for hard mobility and parking lots. Given the analysis performed, we synthetize some general and cluster-specific implications for guiding the implementation of those strategies (
Figure 24) in the city of Turin. Although these take-away points might be applied to other cities, since some are reported in previous research as well, we strongly suggest taking them as a reference starting point while encouraging site-specific data collection and microclimate assessment before proposing any UHI mitigation strategy.
- -
Urban policies should further promote pedestrianization of car-centered streets as an effective way to provide space for implementing UHI mitigation and climate adaptation strategies [
28,
30]. Removal of vehicular traffic improves safety, promotes human-centered approach and enhances the quality of life [
31]. Given that, when technically and economically feasible, we suggest to destinate
controviali to soft mobility, especially in those boulevards with greatest urban sections and smaller H/W ratios (clusters 2, 3 and 4).
- -
A more radical policy approach would imply the use of central lanes for soft mobility while confining hard mobility to controviali only. Indeed, despite different orientations, a massive presence of asphalt like all other clusters, and lower air flows due to greater presence of solid obstacles, the case with better thermal conditions are the denser urban fabrics, that are soft mobility-centered (Cluster 5 and 6). As emerged from the data collection and urban scale analysis, these clusters are a minority in the city, but still, it is possible to implement soft-mobility and green infrastructures in dense fabrics as well. Corso Marconi has recently been closed to traffic in the central lane, with controviali now used for cars and bikes with limited 30km/h speed. Corso Marconi is still under redevelopment for increasing vegetation and permeable surfaces. Citizens in the neighborhood have gradually been appreciating this change in land use, as a massive presence of people in the street at all hours confirms. Since it does not only have social benefits but might highly contribute to the UHI mitigation as well, this model of urban mobility, inverting the paradigm and putting pedestrians and cyclists at the center of the street while confining cars and parking lots to the controviali only, should be further encouraged, when feasible.
- -
As recalled in previous research, the first factor influencing the urban microclimate – thus, the formation of the UHI effect – is urban geometry. This constitutes a “structural” condition on which designers often could not directly intervene. However, denser urban fabrics provide more shaded streets (Clusters 1 and 6) regardless of the other investigated aspects of street features, thus greater comfort to pedestrians, lowering air and surface temperature and contributing to the mitigation of the UHI.
- -
The second aspect with greater air temperature reduction and comfort improvement is vegetation, as reported by previous research as well. Deciduous tree lines in boulevards should ideally follow the prevailing direction of the wind in summer, although this is not always feasible. Vegetation is also particularly efficient in shallow or one-sided canyons (Clusters 2, 3 and 4). If it should not be possible to provide space for planting trees (e.g., in high volume-traffic boulevards or city center), urban vegetation could be applied vertically on building facades. Therefore, implementation of green infrastructure is a strategy that would have multiple impacts in all mobility Clusters.
- -
Elimination of hard mobility from one part or both parts of the street in all clusters still enables replacement of the low albedo asphalt surfaces with cool materials, permeable pavement or green areas, which would result in lower surface temperatures. However, case-by-case assessment should be performed, since, according to previous research, cool material implementation might lower the user comfort in certain cases.
- -
According to the reference literature [
23,
24,
25,
69]Click here to enter text., blue infrastructure can significantly contribute to the cooling of urban environment. In our simulations, the effect of the Po River against better comfort conditions was high, but the magnitude of the cooling effect depends on the siz [
70] and boulevards that benefit of the river mitigation effect are just a few in Turin. Therefore, the effect of floodable spaces, rain gardens or water bodies alongside the streets might be negligible but the immediate surroundings of small water bodies can become cooler by means of shading from trees, fountains or water mists, finally positively influencing daytime PET.
Based on these reflections, we have identified some preliminary design scenarios that might suit the different clusters of mobility in the context of Torino (
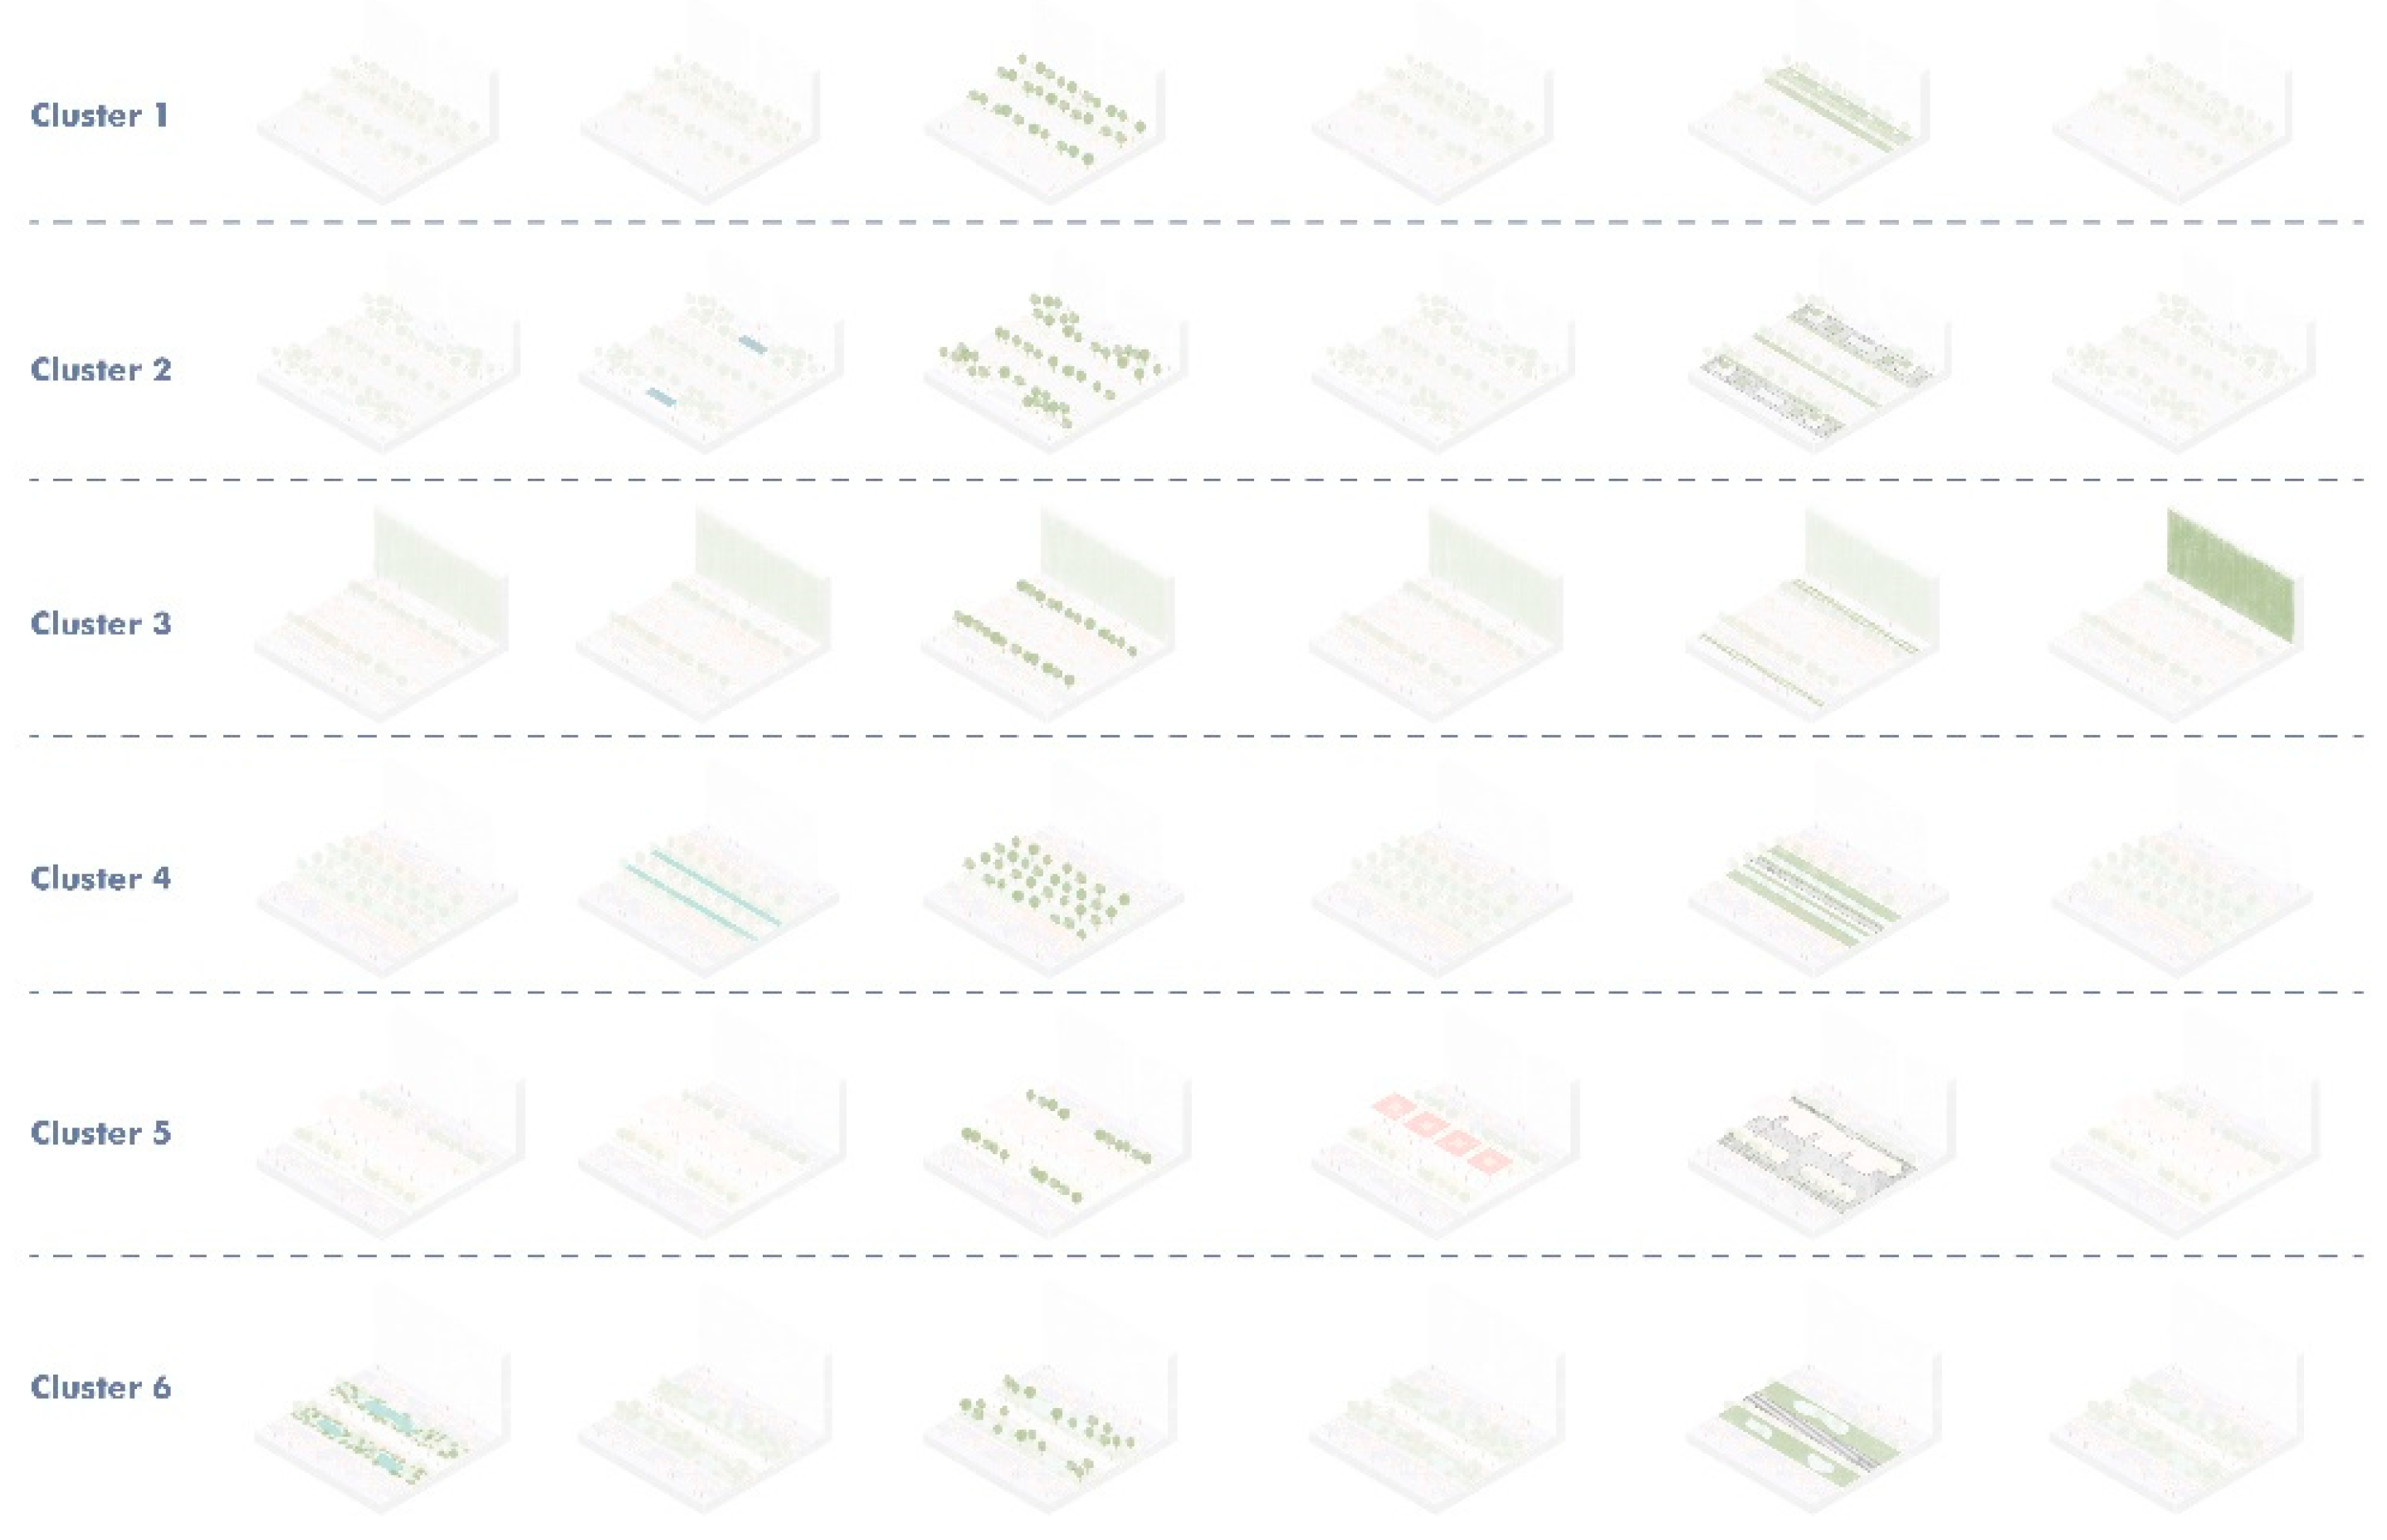
Figure 24). These scenarios respond to diverse needs and spatial opportunities in the different clusters (
Figure 25) and imply single or combined strategies for UHI mitigation and climate adaptation. In the boulevards of Cluster 1, transforming
controviale into the soft mobility area covered in vegetation and permeable surfaces could have a notable impact on the thermal conditions, while leaving sufficient space for the hard mobility, since the boulevards are some of the main traffic routes in the city. Due to the shallow urban canyons of the Cluster 2 boulevards, it is suggested to transform the area of
controviali into soft mobility spaces to benefit from shading due to their proximity to the buildings. The asphalt should be replaced with “cool” pavements, green areas, and small water bodies to provide better thermal comfort. Many of the Cluster 3 boulevards are important traffic routes in the city, especially for public transportation. For this reason, the suggested strategy is, in the case of inability to change the mobility type within the street, to apply vertical greenery to the surrounding buildings and to replace the parking surfaces along the street with permeable pavements. The position of the public transportation along the
controviali in Cluster 4, characterized by dominantly shallow canyons, could allow for an intervention of a bigger scope in the central area. Closing the central area to hard mobility could provide sufficient space to implement a vegetated area, such as a small park, including water bodies and high albedo walking and cycling pavements. In cluster 5, the central area is dedicated to soft mobility, markets, or parking spaces. The scenario here would be to replace the central asphalt areas with reflective “cool” pavements and to add shading devices that could complement the shade provided by deeper urban canyons. Finally, the proposed strategy for Cluster 6 involves the transformation of central areas into floodable spaces or rain gardens. Implementation of water bodies would be strengthened with the presence of green infrastructure and the central walking and cycling surfaces could be improved with higher albedo pavements.
In all these cases, further microclimate simulations would be needed to assess the viability of designing new public space by adopting a single strategy or more than one, as well as to refine their prioritization considering their environmental benefits and costs. Indeed, we are aware that these changes involving uses of space, surface materials, and green infrastructure implementation might sometimes appear as major ones (although they would not need any change in the urban geometry). Besides, they would imply deeper citizens’ lifestyle and habits change and thus involve support from the social dimension of the urban sustainable transition as well. Finally, these changes would also require financing. All these aspects might be worth exploring in future research.
Figure 1.
Methodological framework.
Figure 1.
Methodological framework.
Figure 2.
Location of the study area on a national and regional scale. Authors’ elaboration.
Figure 2.
Location of the study area on a national and regional scale. Authors’ elaboration.
Figure 3.
Aerial view of the boulevards. Authors’ elaboration (background images: Google Earth).2.2. Data collection and representation.
Figure 3.
Aerial view of the boulevards. Authors’ elaboration (background images: Google Earth).2.2. Data collection and representation.
Figure 4.
Aspect ratio for boulevards with lateral roads (controviali) in Turin. Authors’ elaboration.
Figure 4.
Aspect ratio for boulevards with lateral roads (controviali) in Turin. Authors’ elaboration.
Figure 5.
Controviali type of sections and identification. Authors’ elaboration.
Figure 5.
Controviali type of sections and identification. Authors’ elaboration.
Figure 6.
Macro-categories of boulevards with lateral roads: examples of hard-mobility centered (left) and soft-mobility centered (right). Authors’ elaboration.
Figure 6.
Macro-categories of boulevards with lateral roads: examples of hard-mobility centered (left) and soft-mobility centered (right). Authors’ elaboration.
Figure 7.
Macro-categories of boulevards with lateral roads (controviali) in Turin: soft mobility and hard –mobility-centered boulevards. Authors’ elaboration.
Figure 7.
Macro-categories of boulevards with lateral roads (controviali) in Turin: soft mobility and hard –mobility-centered boulevards. Authors’ elaboration.
Figure 8.
Tram rails along the boulevards. Authors’ elaboration.
Figure 8.
Tram rails along the boulevards. Authors’ elaboration.
Figure 9.
Asphalt surface coverage. Authors’ elaboration.
Figure 9.
Asphalt surface coverage. Authors’ elaboration.
Figure 10.
Permeable surface coverage. Authors’ elaboration.
Figure 10.
Permeable surface coverage. Authors’ elaboration.
Figure 11.
Walking and cycling paths. Authors’ elaboration.
Figure 11.
Walking and cycling paths. Authors’ elaboration.
Figure 12.
Quantification of data on (a) different street orientations; (b) aspect ratio; (c) asphalt area; (d) permeable area; (e) total area. Authors’ elaboration.
Figure 12.
Quantification of data on (a) different street orientations; (b) aspect ratio; (c) asphalt area; (d) permeable area; (e) total area. Authors’ elaboration.
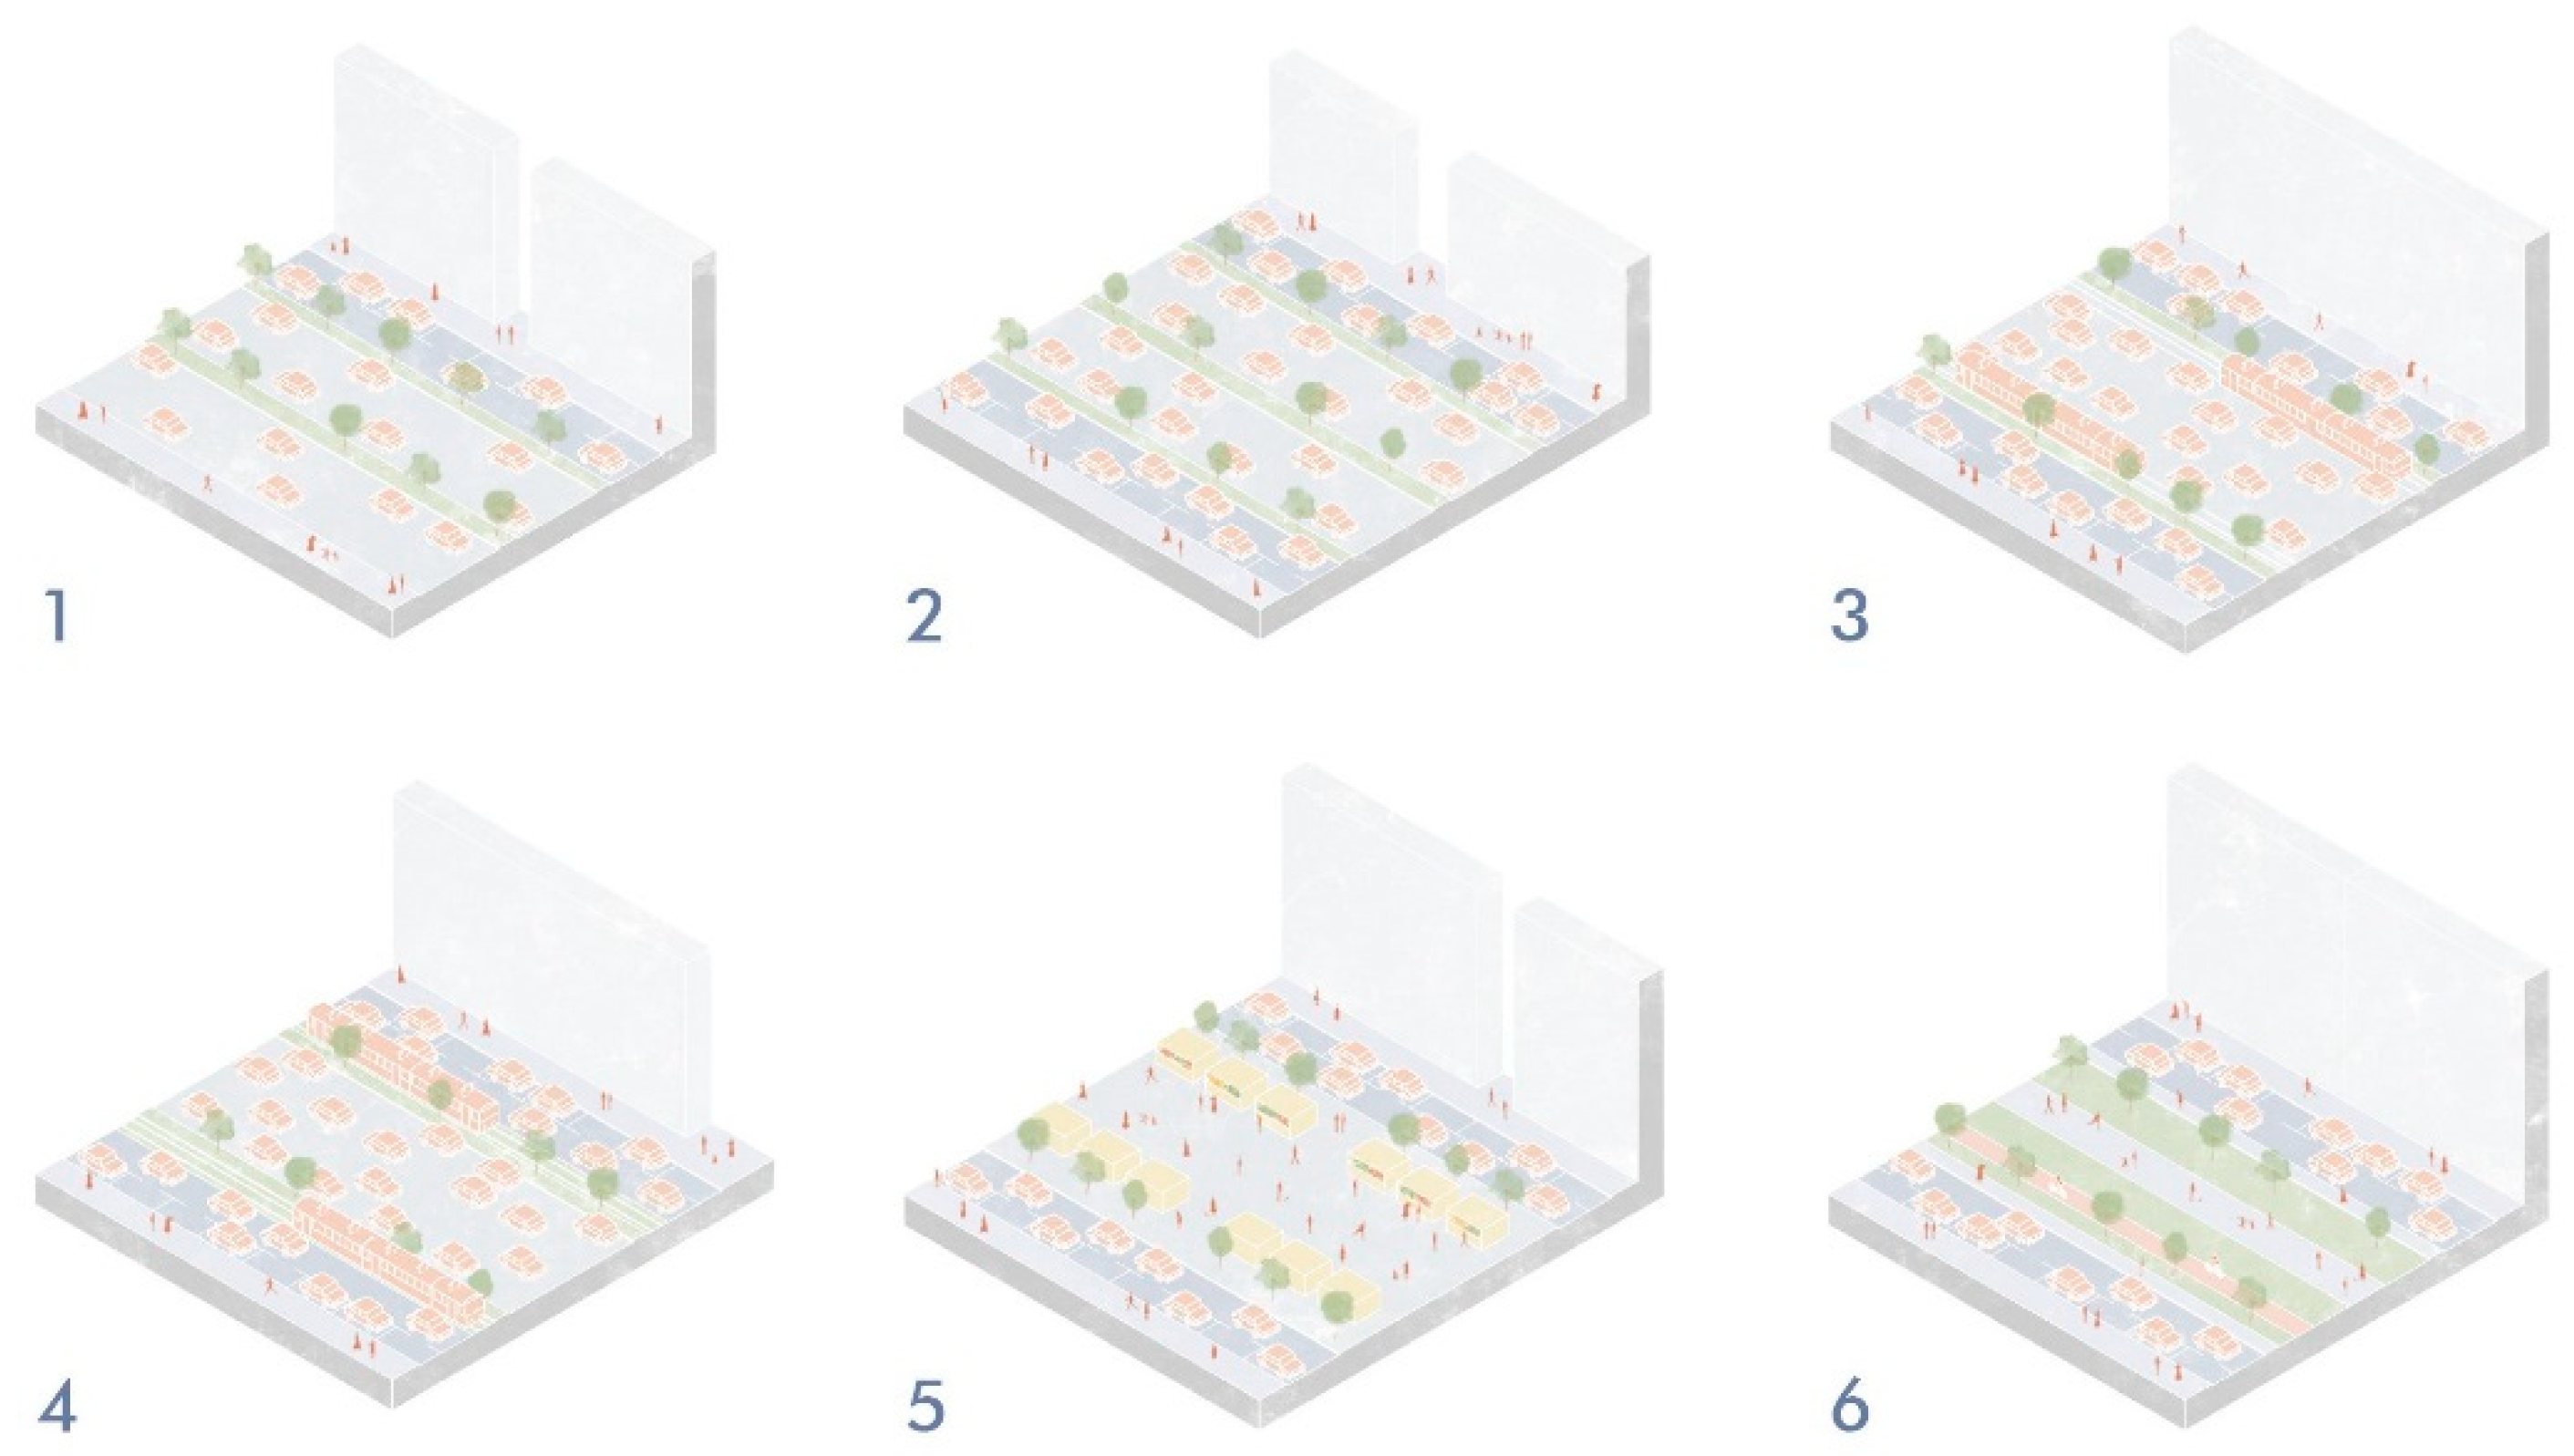
Figure 13.
Six different street clusters’ features in axonometries. Authors’ elaboration.
Figure 13.
Six different street clusters’ features in axonometries. Authors’ elaboration.
Figure 14.
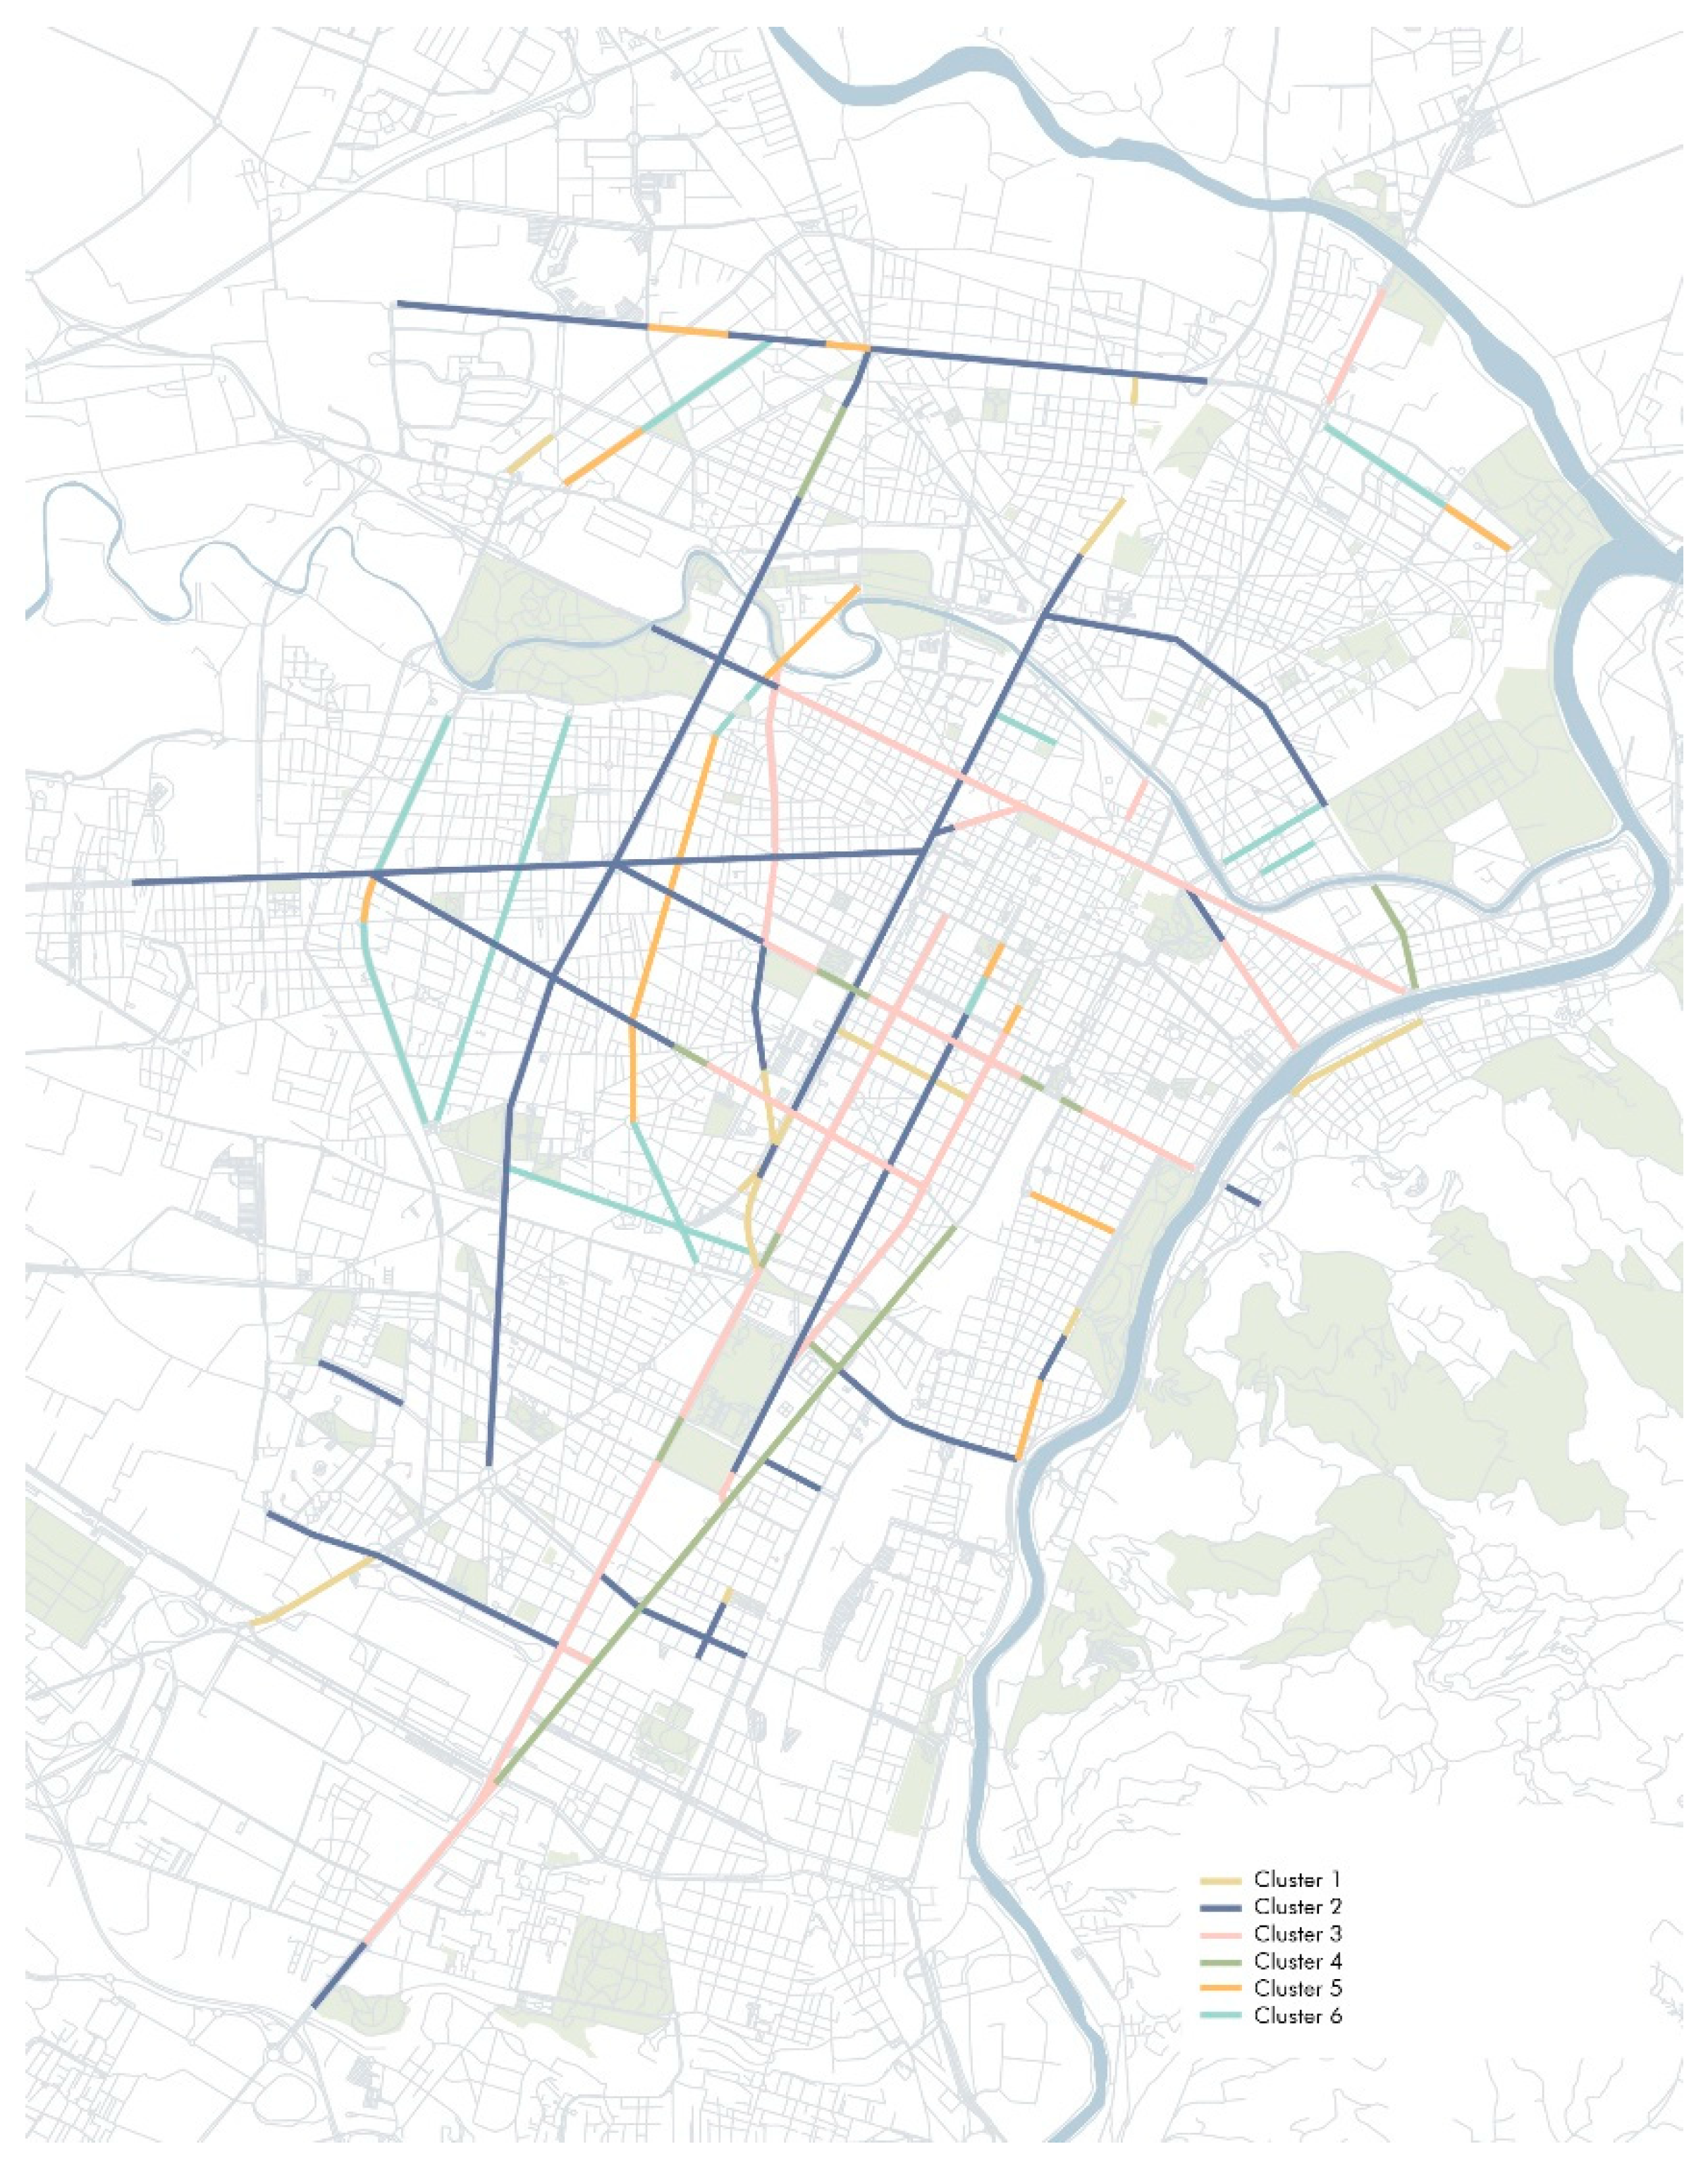
Clusters of boulevards with lateral roads in Turin. Authors’ elaboration.
Figure 14.
Clusters of boulevards with lateral roads in Turin. Authors’ elaboration.
Figure 15.
Aspect ratios and orientations of each cluster. Authors’ elaboration.
Figure 15.
Aspect ratios and orientations of each cluster. Authors’ elaboration.
Figure 16.
Asphalt and permeable surfaces percentage of each cluster. Authors’ elaboration.
Figure 16.
Asphalt and permeable surfaces percentage of each cluster. Authors’ elaboration.
Figure 17.
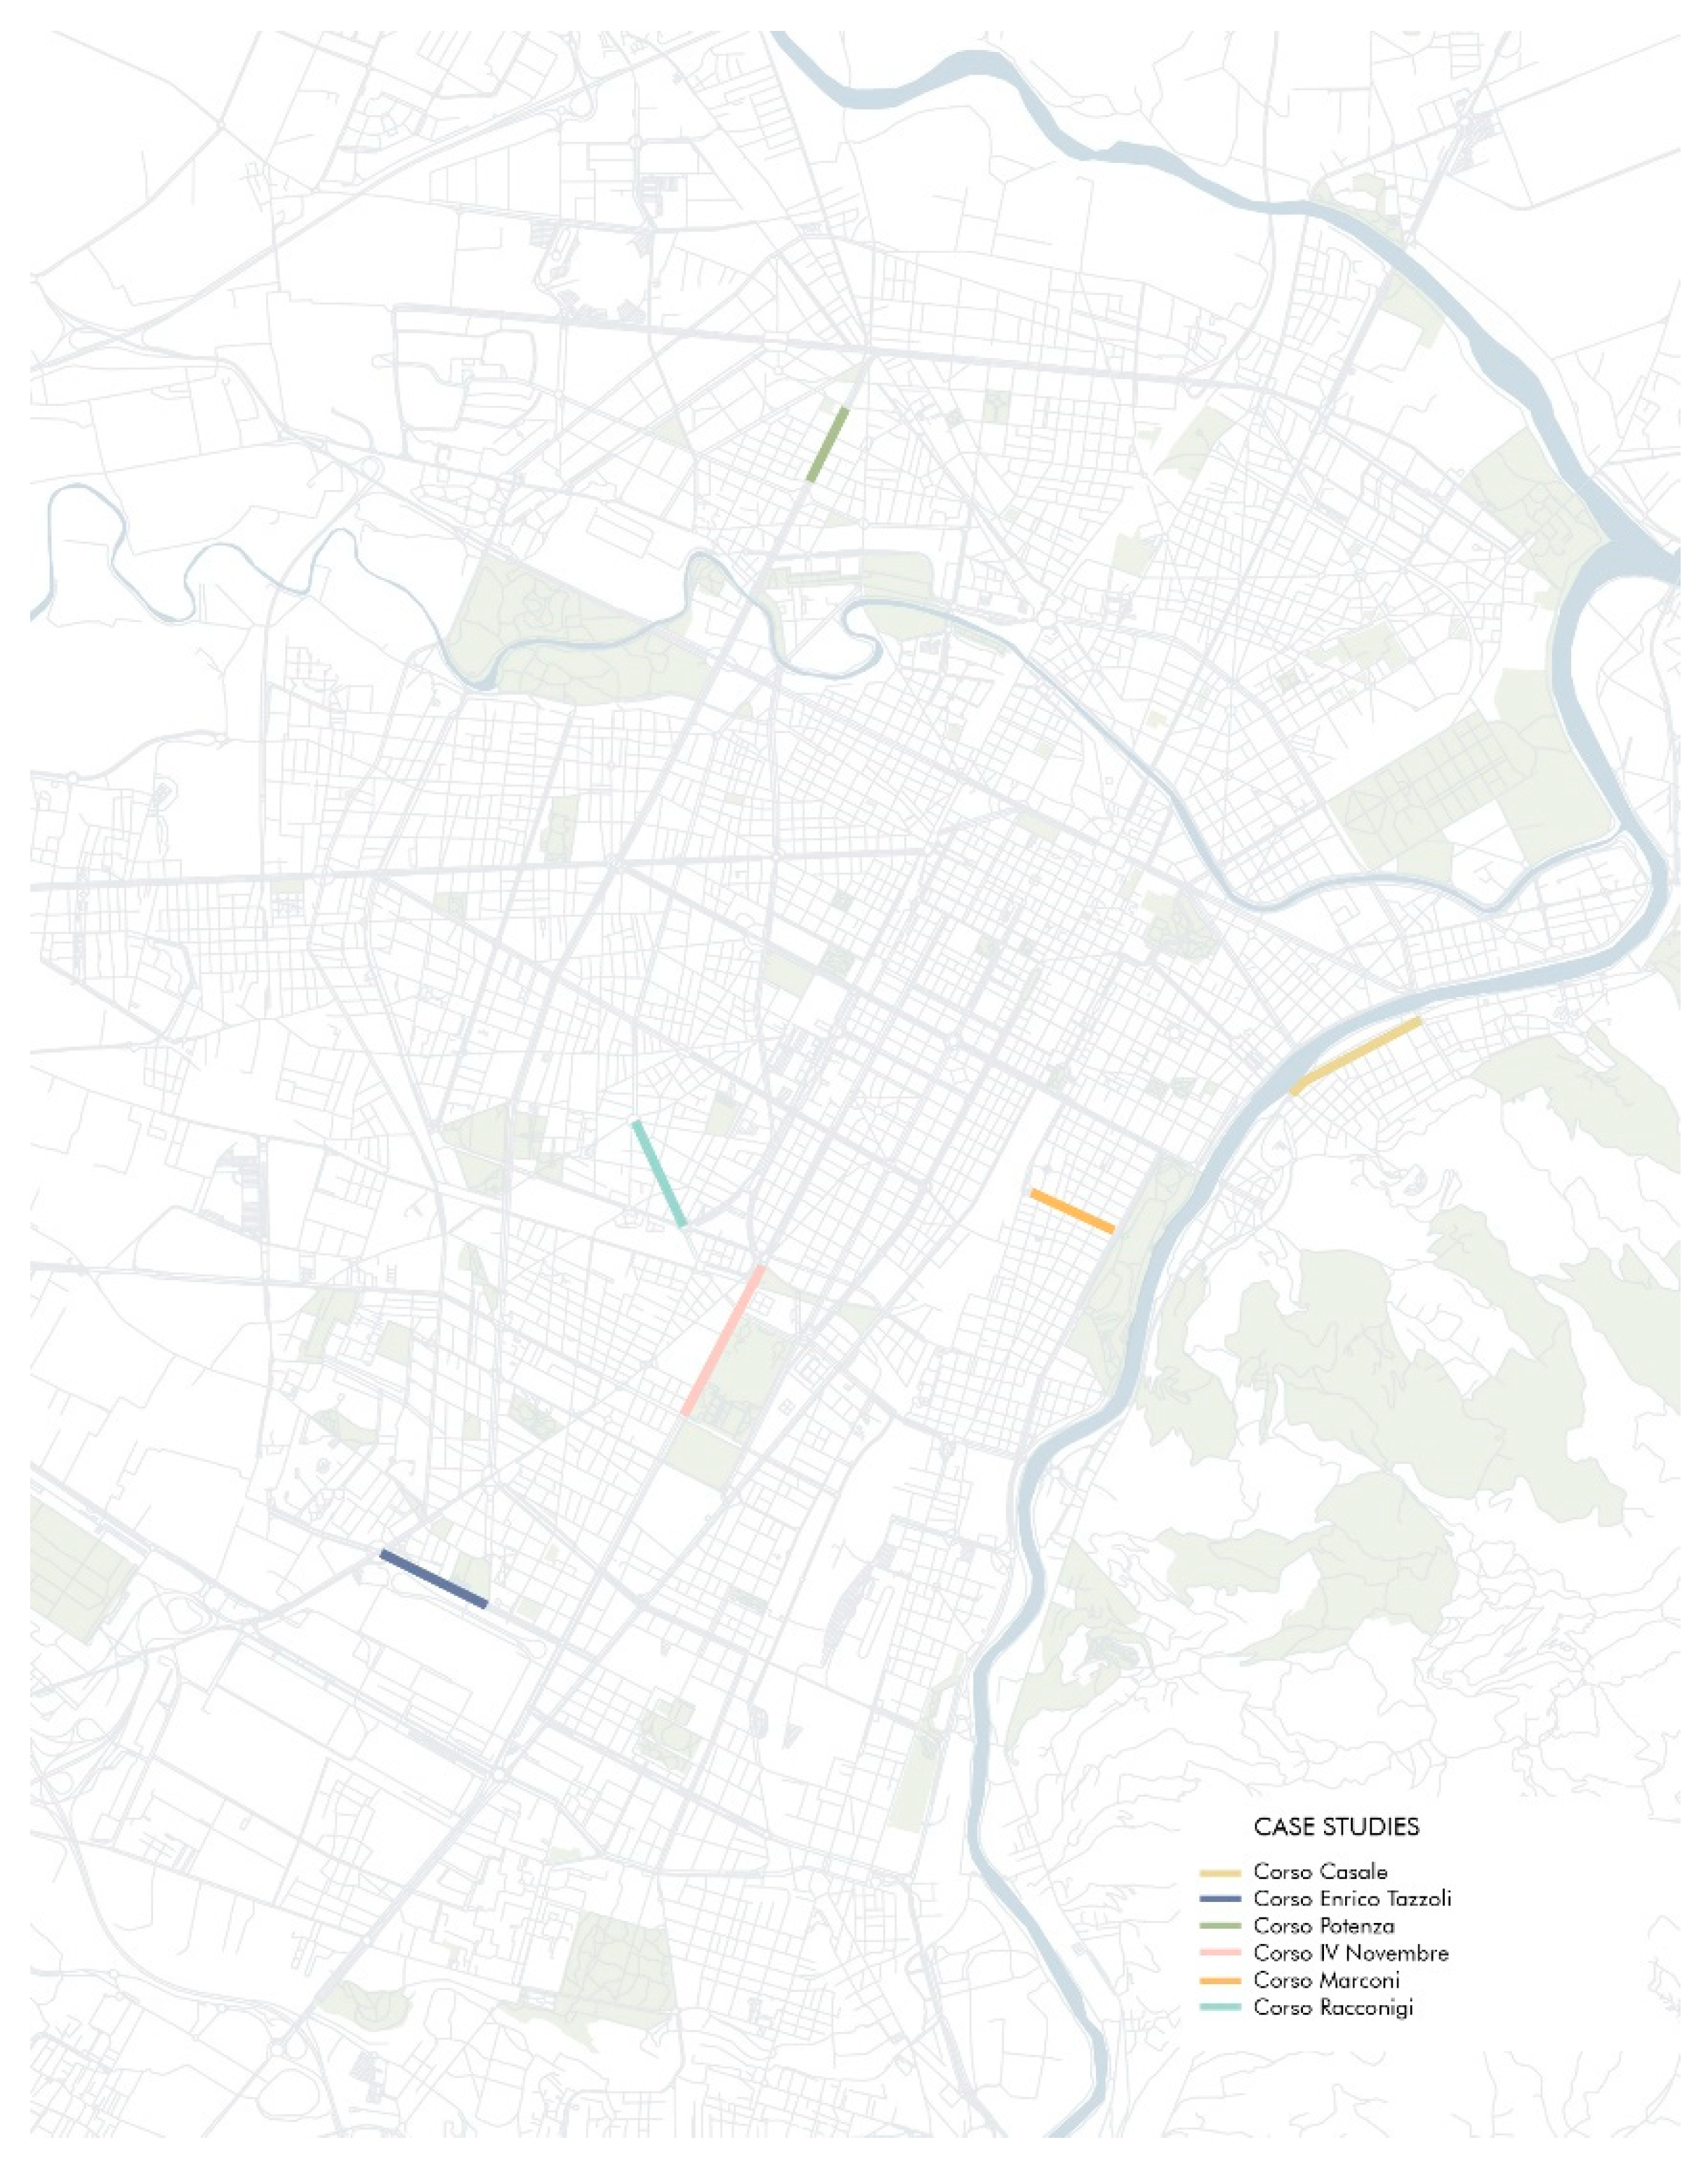
Case studies: 1. Corso Casale; 2. Corso Enrico Tazzoli; 3. Corso IV Novembre; 4. Corso Potenza; 5. Corso Guglielmo Marconi; 6. Corso Racconigi. Authors’ elaboration.
Figure 17.
Case studies: 1. Corso Casale; 2. Corso Enrico Tazzoli; 3. Corso IV Novembre; 4. Corso Potenza; 5. Corso Guglielmo Marconi; 6. Corso Racconigi. Authors’ elaboration.
Figure 18.
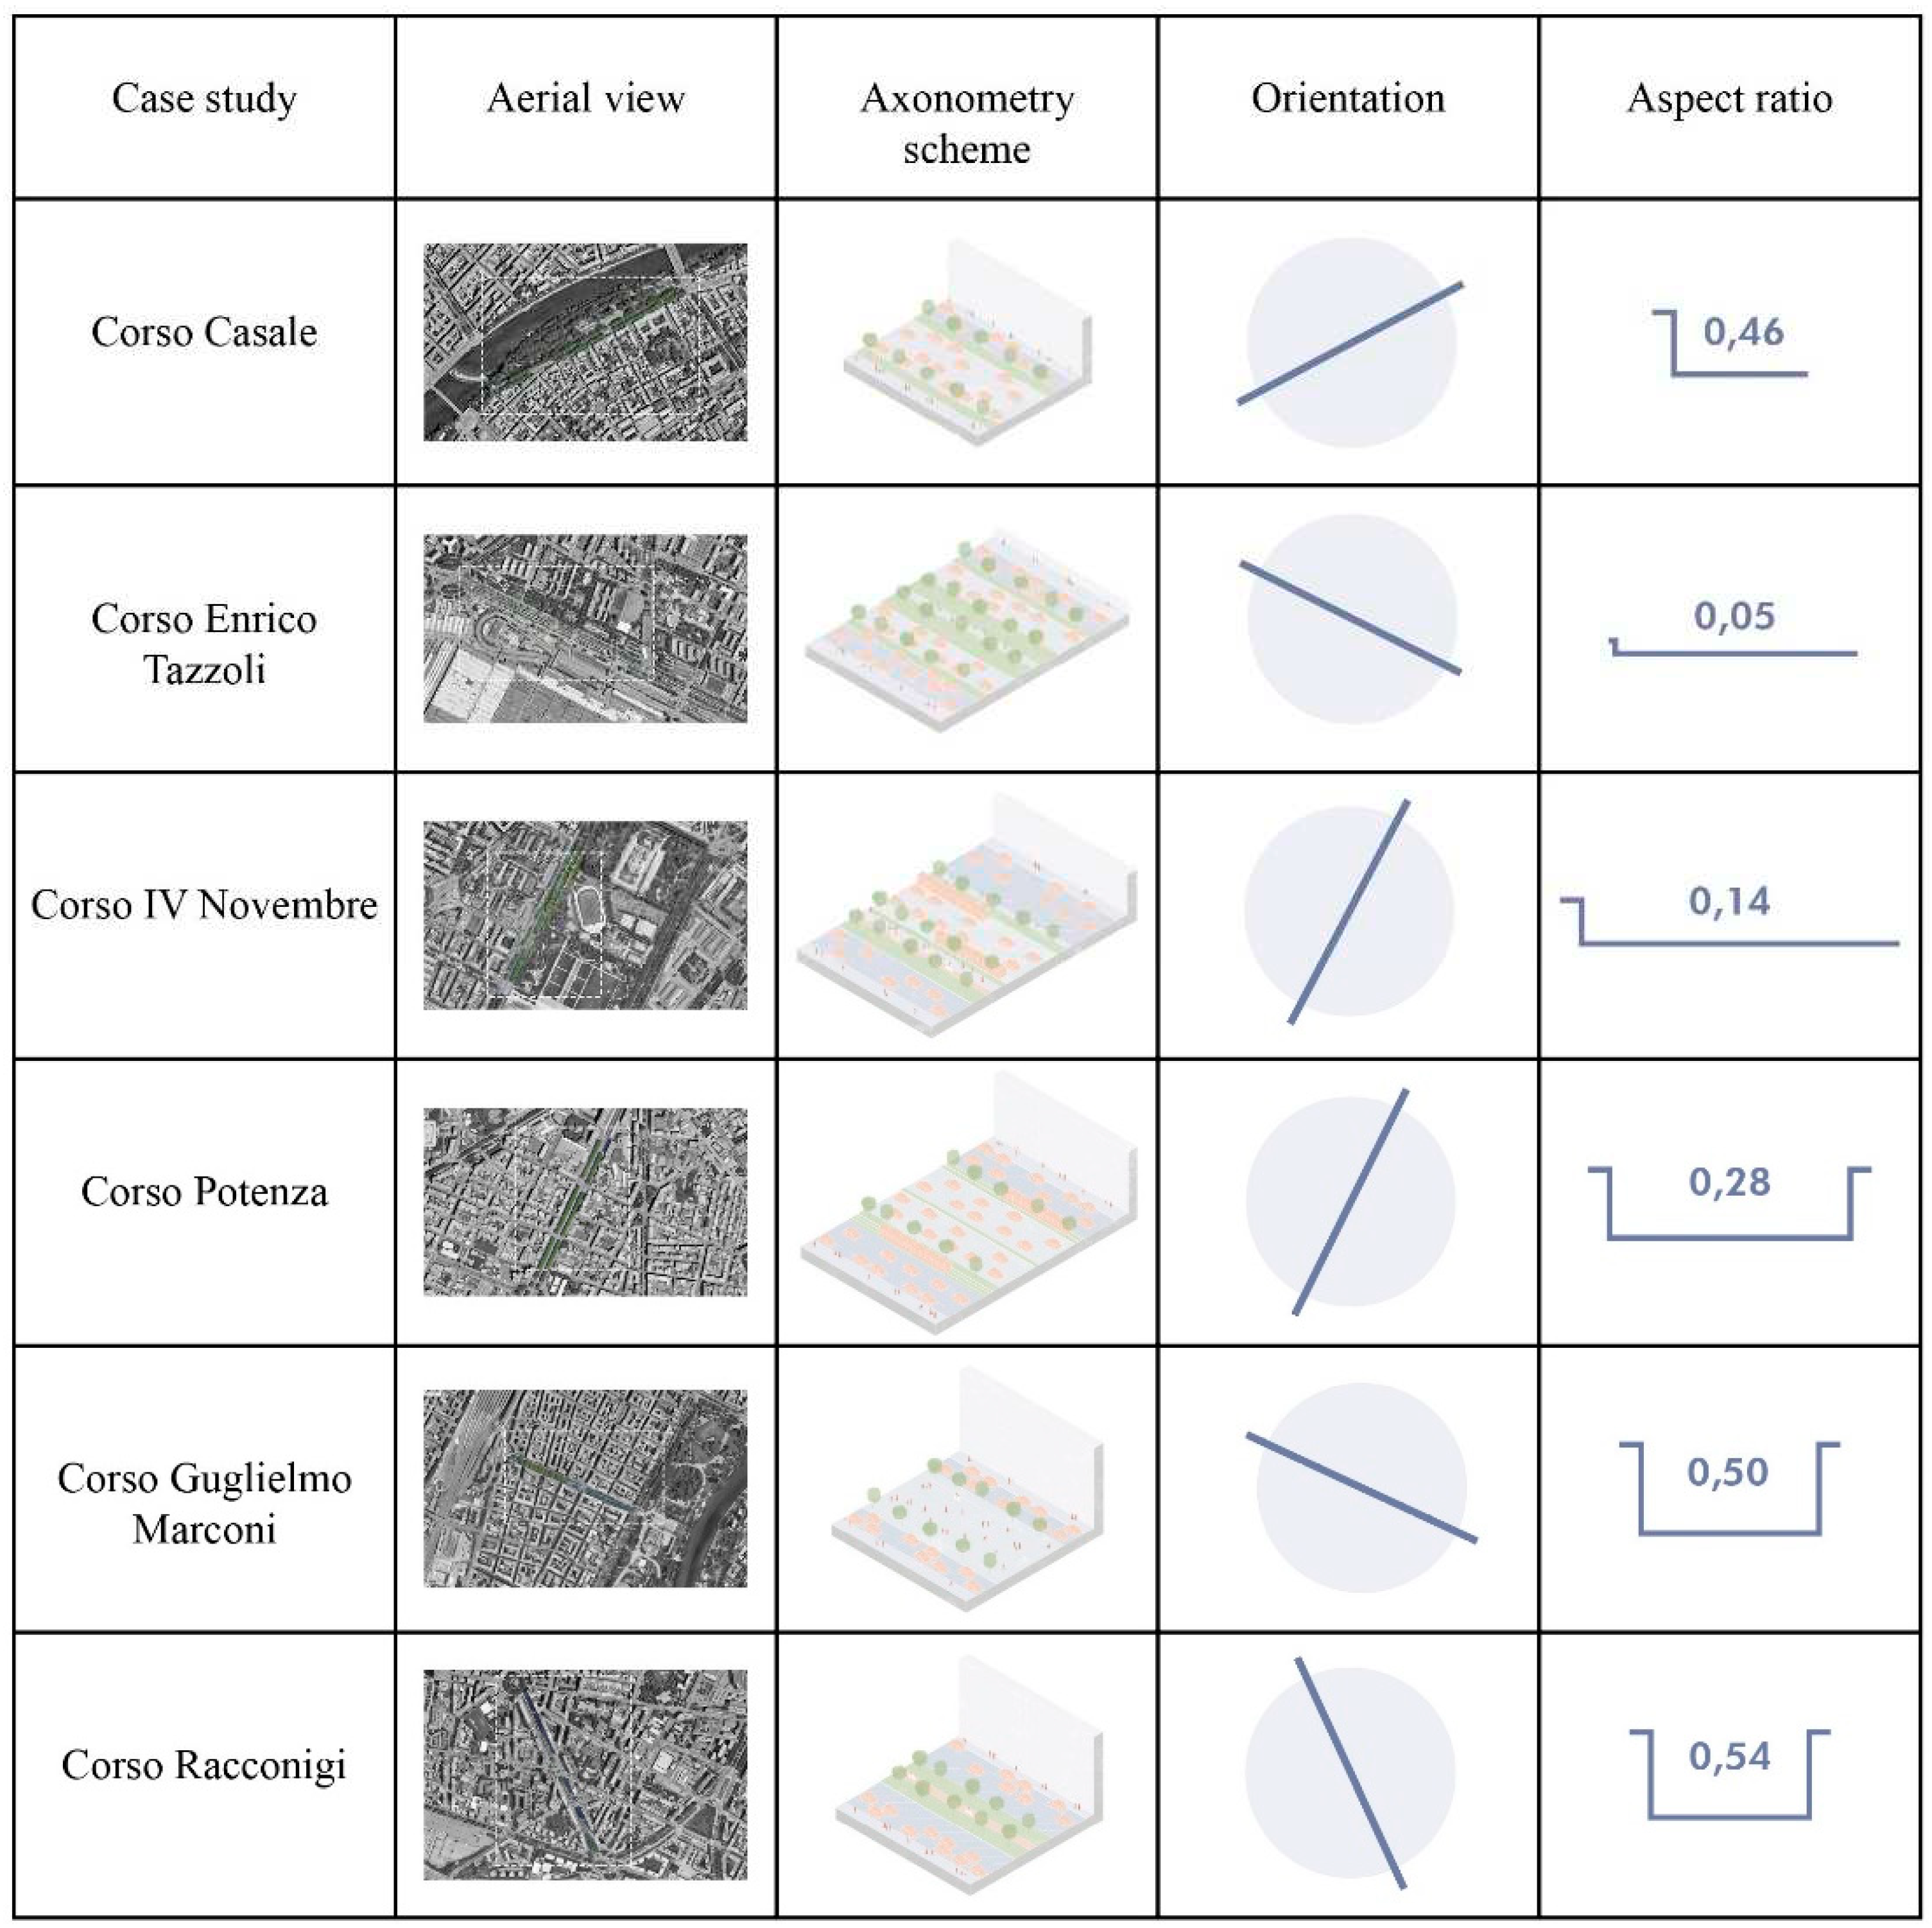
Case studies features. Authors’ elaboration (background images in the second column: Google Maps).
Figure 18.
Case studies features. Authors’ elaboration (background images in the second column: Google Maps).
Figure 19.
Composition of case studies (left); Ratio of permeable and non-permeable surfaces (right). Authors’ elaboration.3.3 Microclimate CFD simulation.
Figure 19.
Composition of case studies (left); Ratio of permeable and non-permeable surfaces (right). Authors’ elaboration.3.3 Microclimate CFD simulation.
Figure 24.
Preliminary site-specific design strategies for boulevards with controviali in Turin.
Figure 24.
Preliminary site-specific design strategies for boulevards with controviali in Turin.
Figure 25.
Matrix of the applicable strategies in each cluster.
Figure 25.
Matrix of the applicable strategies in each cluster.
| Hour |
T air [°C] |
R. H. [%] |
Wind speed [m/s] |
Wind direction [°] |
| 00:00:00 |
22,5 |
76 |
1,5 |
67 |
| 01:00:00 |
21,6 |
81 |
1,8 |
61 |
| 02:00:00 |
20,5 |
85 |
1,2 |
45 |
| 03:00:00 |
19,9 |
90 |
1,2 |
0 |
| 04:00:00 |
19,1 |
92 |
1,4 |
197 |
| 05:00:00 |
19,1 |
89 |
1,6 |
216 |
| 06:00:00 |
21,4 |
80 |
1,1 |
101 |
| 07:00:00 |
23,8 |
62 |
1,9 |
74 |
| 08:00:00 |
25,9 |
52 |
1,3 |
69 |
| 09:00:00 |
27,9 |
46 |
1 |
328 |
| 10:00:00 |
29,9 |
48 |
1,2 |
49 |
| 11:00:00 |
31 |
39 |
2,3 |
93 |
| 12:00:00 |
31,8 |
38 |
1,7 |
72 |
| 13:00:00 |
32,8 |
34 |
2,8 |
53 |
| 14:00:00 |
33,1 |
38 |
1,9 |
48 |
| 15:00:00 |
33 |
37 |
2,5 |
66 |
| 16:00:00 |
32,7 |
42 |
2,4 |
80 |
| 17:00:00 |
30,9 |
55 |
1,6 |
177 |
| 18:00:00 |
27,5 |
56 |
1,8 |
217 |
| 19:00:00 |
25,7 |
60 |
2 |
53 |
| 20:00:00 |
24,1 |
69 |
1,6 |
51 |
| 21:00:00 |
24,6 |
68 |
2 |
223 |
| 22:00:00 |
23,8 |
72 |
1,6 |
190 |
| 23:00:00 |
23,4 |
72 |
2,4 |
207 |
Table 2.
Selected case studies per clusters of boulevards and ENVI-met model features.
Table 2.
Selected case studies per clusters of boulevards and ENVI-met model features.
| Case study |
Cluster |
Cluster features |
Real-world area size |
ENVI-met Modelling resolution |
Number of grids in ENVI-met Spaces |
| Corso Casale |
1 |
Street with controviale on one side only |
800 x 500 m |
5 x 5 x 2 m |
160 x 100 x 29 |
| Corso Enrico Tazzoli |
2 |
Street with controviali on both sides, with only car lanes in the central area |
700 x 400 m |
4 x 4 x 2 m |
175 x 100 x 35 |
| Corso IV Novembre |
3 |
Street with controviali on both sides, with tram rails within car lanes in the central area |
400 x 500 m |
4 x 4 x 2 m |
100 x 125 x 30 |
| Corso Potenza |
4 |
Street with controviali on both sides, with tram rails within the green areas |
400 x 500 m |
4 x 4 x 2 m |
100 x 125 x 35 |
| Corso Guglielmo Marconi |
5 |
Street with controviali on both sides, with asphalt areas for parking or soft mobility between them |
700 x 400 m |
4 x 4 x 2 m |
175 x 100 x 35 |
| Corso Racconigi |
6 |
Street with controviali on both sides, with green areas between them |
500 x 700 m |
4 x 4 x 2 m |
125 x 175 x 35 |
Table 3.
Minimum and maximum values of the parameters analyzed, with legend harmonization. In bold minimum and maximum values per simulation hour are highlighted.
Table 3.
Minimum and maximum values of the parameters analyzed, with legend harmonization. In bold minimum and maximum values per simulation hour are highlighted.
| Microclimate Variable |
Values (min and max) per simulation hour |
Corso Casale |
Corso Enrico Tazzoli |
Corso IV Novembre |
Corso Potenza |
Corso Guglielmo Marconi |
Corso Racconigi |
Max and min values |
Step size |
| Potential air temperature (°C) |
Min 10:00 |
26,24 |
27,54 |
27,18 |
27,35 |
26,99 |
24,88 |
24,88 |
0,58 |
| Max 10:00 |
28,46 |
30,41 |
29,27 |
29,99 |
29,92 |
30,29 |
30,41 |
| Min 14:00 |
29,20 |
31,43 |
30,80 |
30,96 |
30,47 |
29,38 |
29,20 |
0,51 |
| Max 14:00 |
32,36 |
34,00 |
33,78 |
34,38 |
34,32 |
34,62 |
34,62 |
| Min 18:00 |
27,26 |
28,83 |
28,50 |
28,76 |
28,20 |
26,46 |
26,46 |
0,58 |
| Max 18:00 |
29,06 |
32,18 |
31,21 |
31,01 |
30,81 |
31,06 |
32,18 |
| Surface temperature (°C) |
Min 10:00 |
19,84 |
19,85 |
19,85 |
19,85 |
19,41 |
16,02 |
16,02 |
3,01 |
| Max 10:00 |
37,97 |
47,13 |
45,77 |
45,85 |
45,24 |
46,91 |
47,13 |
| Min 14:00 |
19,85 |
19,85 |
19,85 |
19,85 |
19,85 |
19,85 |
19,85 |
3,58 |
| Max 14:00 |
47,62 |
55,98 |
55,73 |
56,08 |
54,80 |
55,61 |
56,08 |
| Min 18:00 |
19,85 |
19,85 |
19,85 |
19,85 |
19,85 |
19,85 |
19,85 |
2,40 |
| Max 18:00 |
37,50 |
45,39 |
44,30 |
44,54 |
44,33 |
44,63 |
45,39 |
| Wind speed (m/s) |
Min 10:00 |
0,00 |
0,02 |
0,00 |
0,00 |
0,00 |
0,00 |
0,00 |
0,23 |
| Max 10:00 |
2,57 |
1,39 |
1,63 |
1,62 |
1,25 |
1,65 |
2,57 |
| Min 14:00 |
0,00 |
0,02 |
0,00 |
0,00 |
0,00 |
0,00 |
0,00 |
0,21 |
| Max 14:00 |
2,54 |
1,36 |
1,58 |
1,56 |
1,20 |
1,61 |
2,54 |
| Min 18:00 |
0,00 |
0,02 |
0,00 |
0,00 |
0,00 |
0,00 |
0,00 |
0,22 |
| Max 18:00 |
2,55 |
1,37 |
1,58 |
1,56 |
1,21 |
1,66 |
2,55 |
| PET (°C) |
Min 10:00 |
22,40 |
24,67 |
23,01 |
23,89 |
22,16 |
20,27 |
20,27 |
4,39 |
| Max 10:00 |
65,63 |
59,72 |
64,92 |
65,34 |
65,25 |
66,81 |
66,81 |
| Min 14:00 |
26,39 |
28,16 |
27,41 |
28,14 |
25,81 |
24,63 |
24,63 |
4,85 |
| Max 14:00 |
70,98 |
66,95 |
69,94 |
71,75 |
75,01 |
72,48 |
75,01 |
| Min 18:00 |
21,80 |
24,81 |
23,51 |
25,05 |
23,70 |
22,63 |
21,80 |
3,76 |
| Max 18:00 |
57,07 |
53,89 |
54,85 |
58,36 |
59,99 |
61,65 |
61,65 |
