Submitted:
20 June 2023
Posted:
21 June 2023
You are already at the latest version
Abstract
Keywords:
1. Introduction
2. Materials and methods
2.1. Expression levels of TIMP-1, TIMP-2, TIMP-3, TIMP-4 in cancer patients
2.2. Survival analysis of TIMPs expression in cancer patients
2.3. TIMP-1, TIMP-2, TIMP-3 and TIMP-4 interactome
2.4. Function enrichment analysis of TIMP-1, TIMP-2, TIMP-3 and TIMP-4
2.5. Correlation analysis between TIMP-1, TIMP-2, TIMP-3, and TIMP-4 with MMPs
2.6. Immune infiltration status of TIMPs
2.7. Statistical data
3. Results
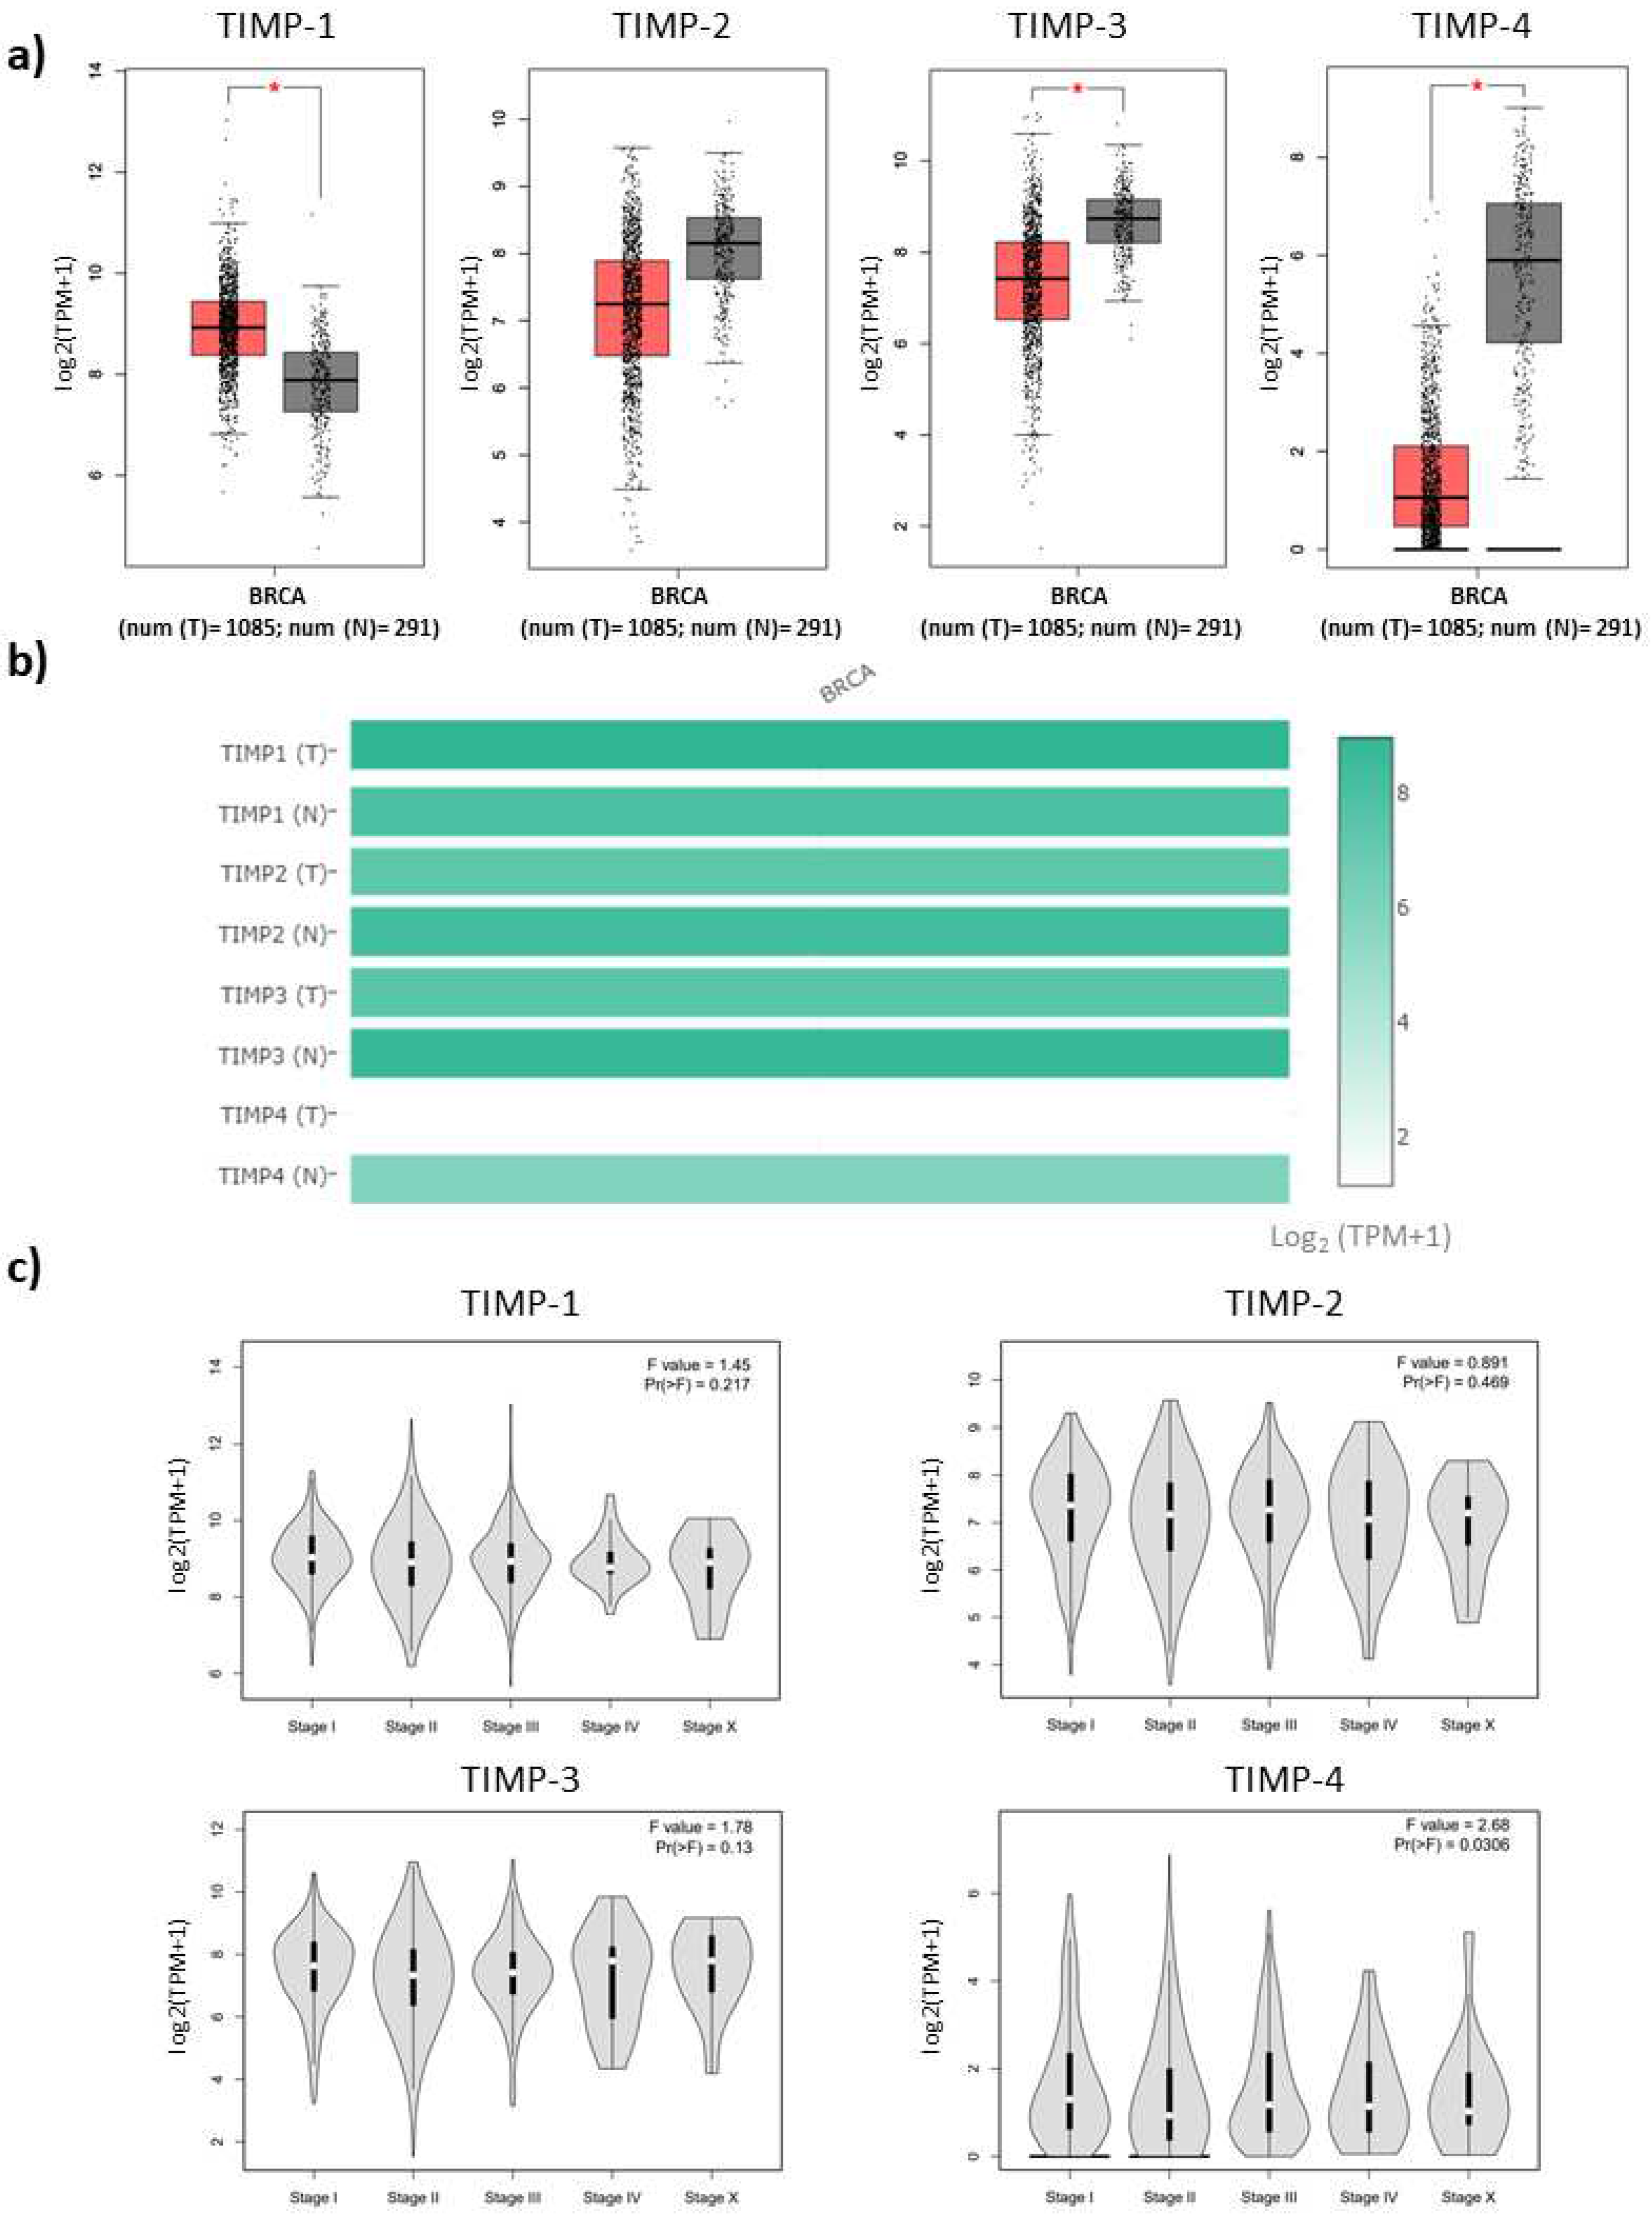
3.1. Expression levels of TIMPs and correlation with progression stages of breast cancer patients
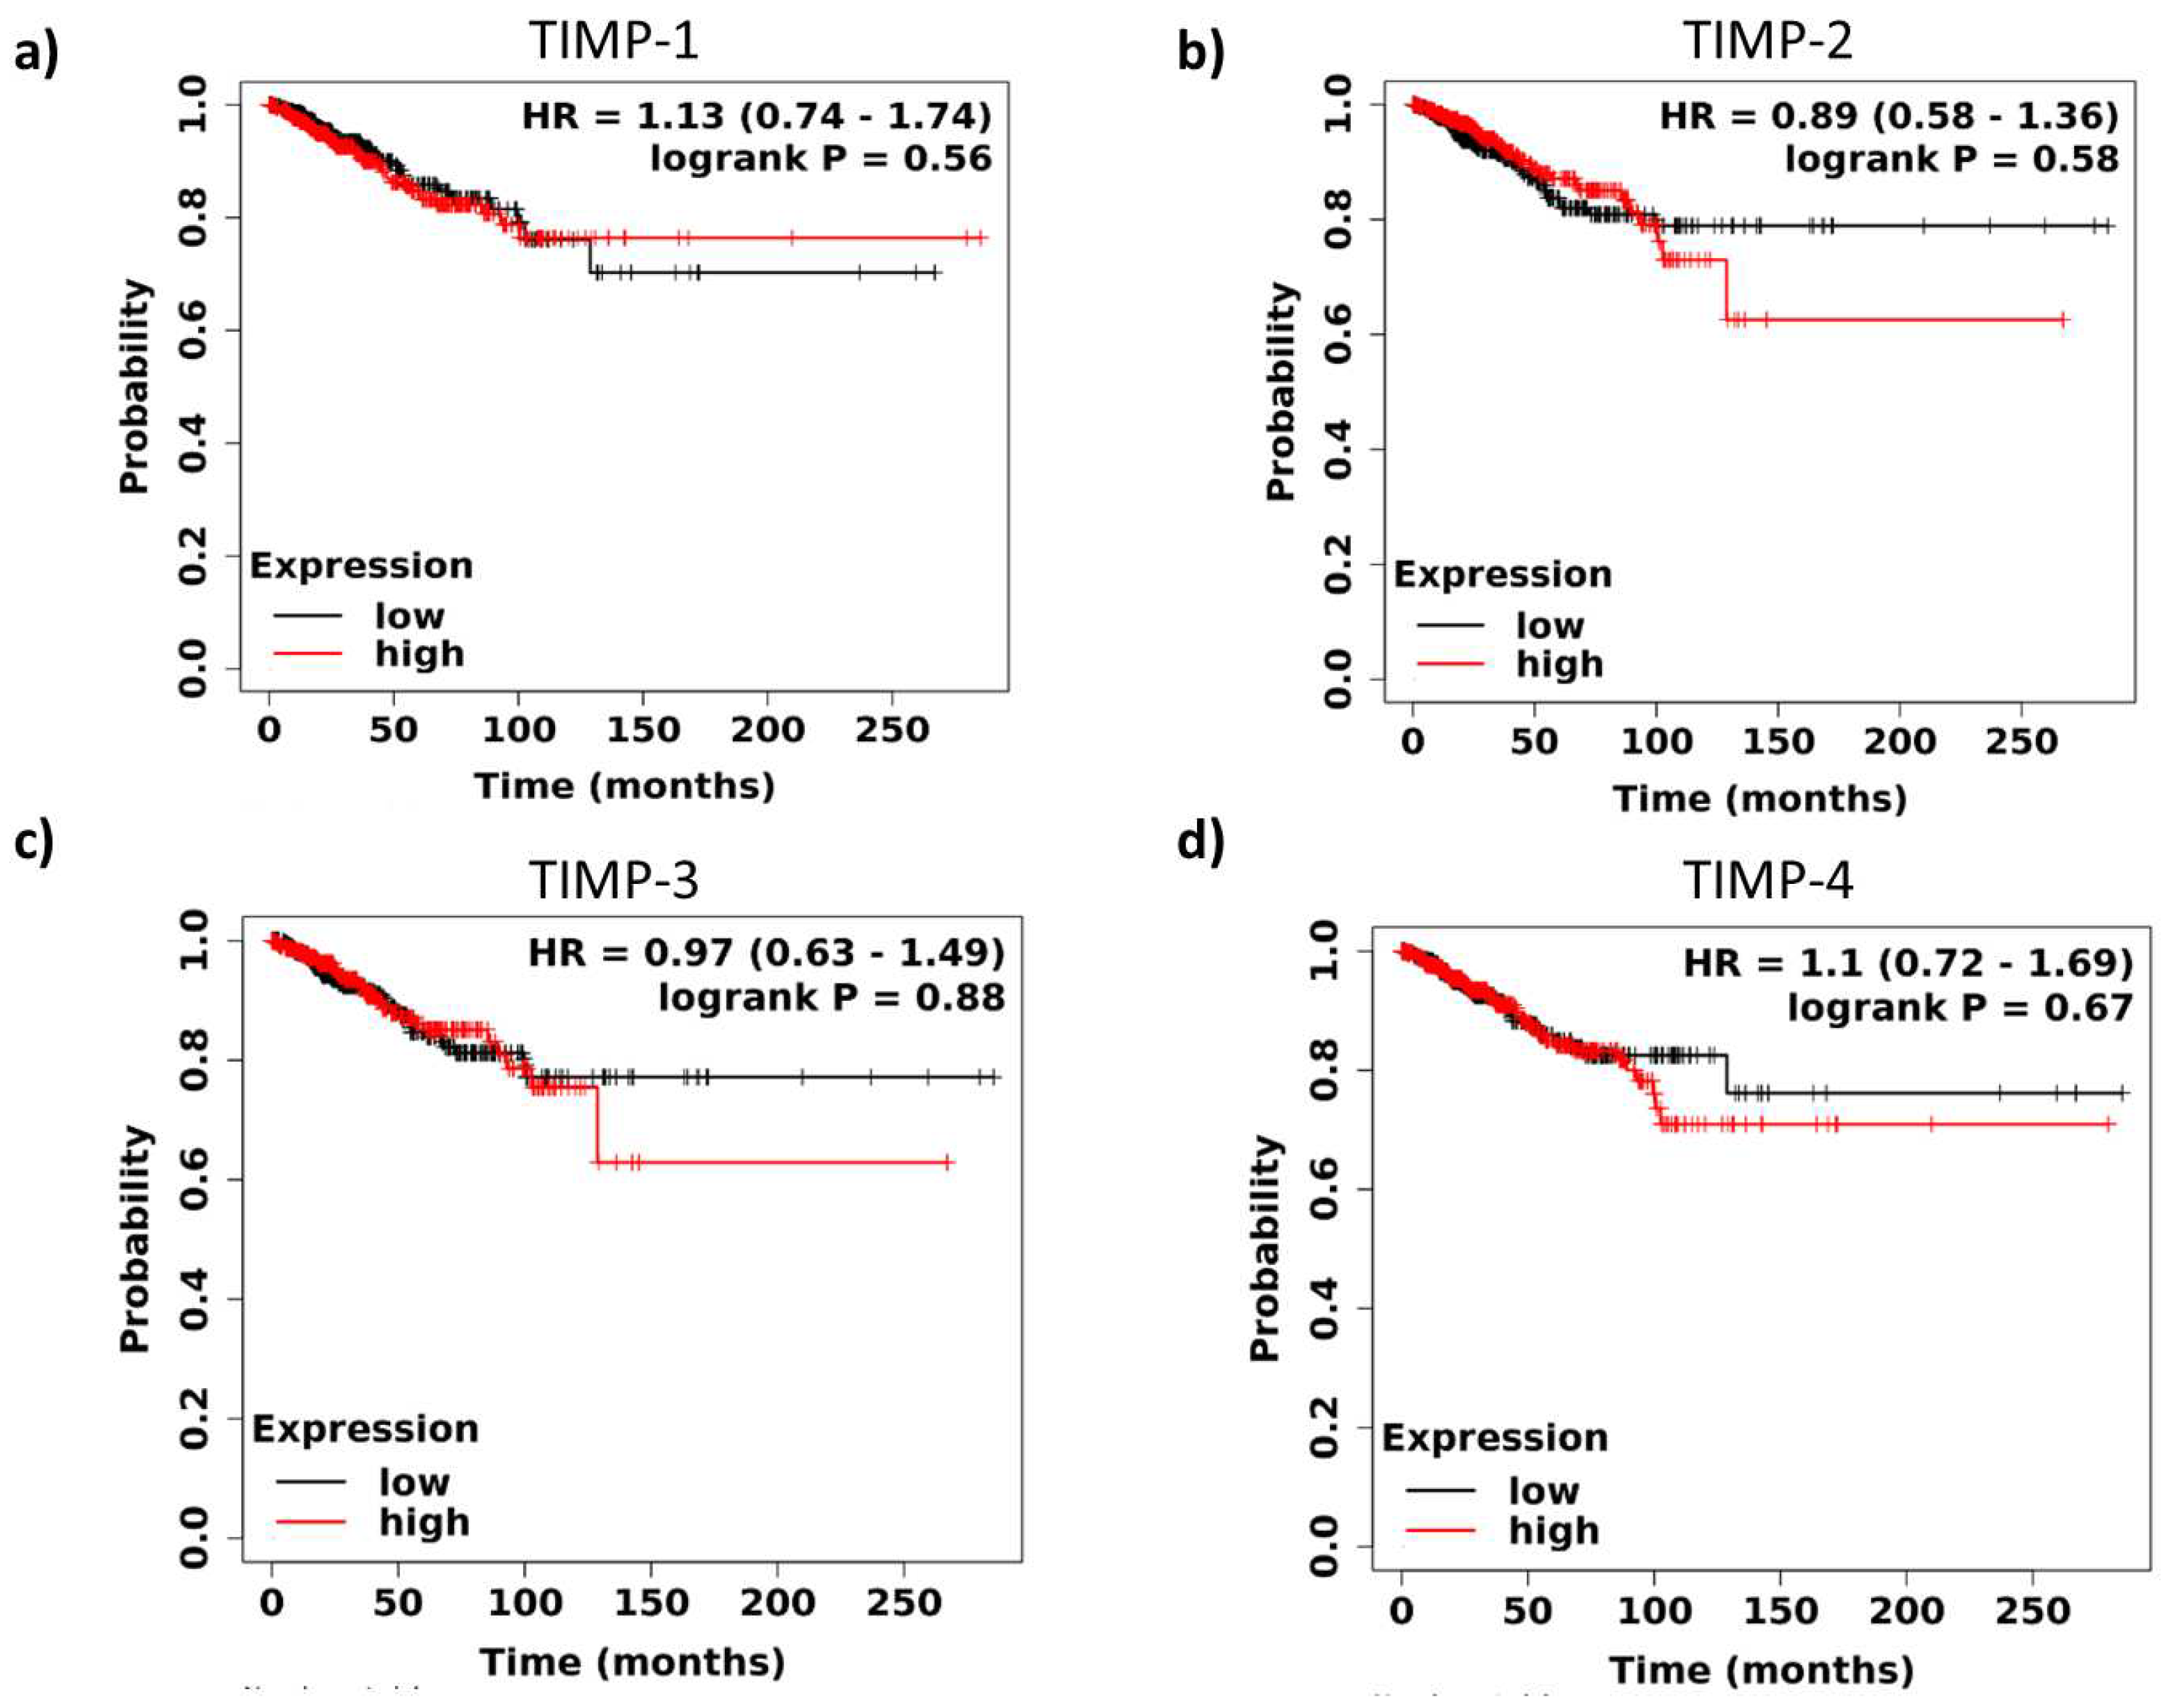
3.2. Survival analysis of TIMPs expression in breast cancer patients
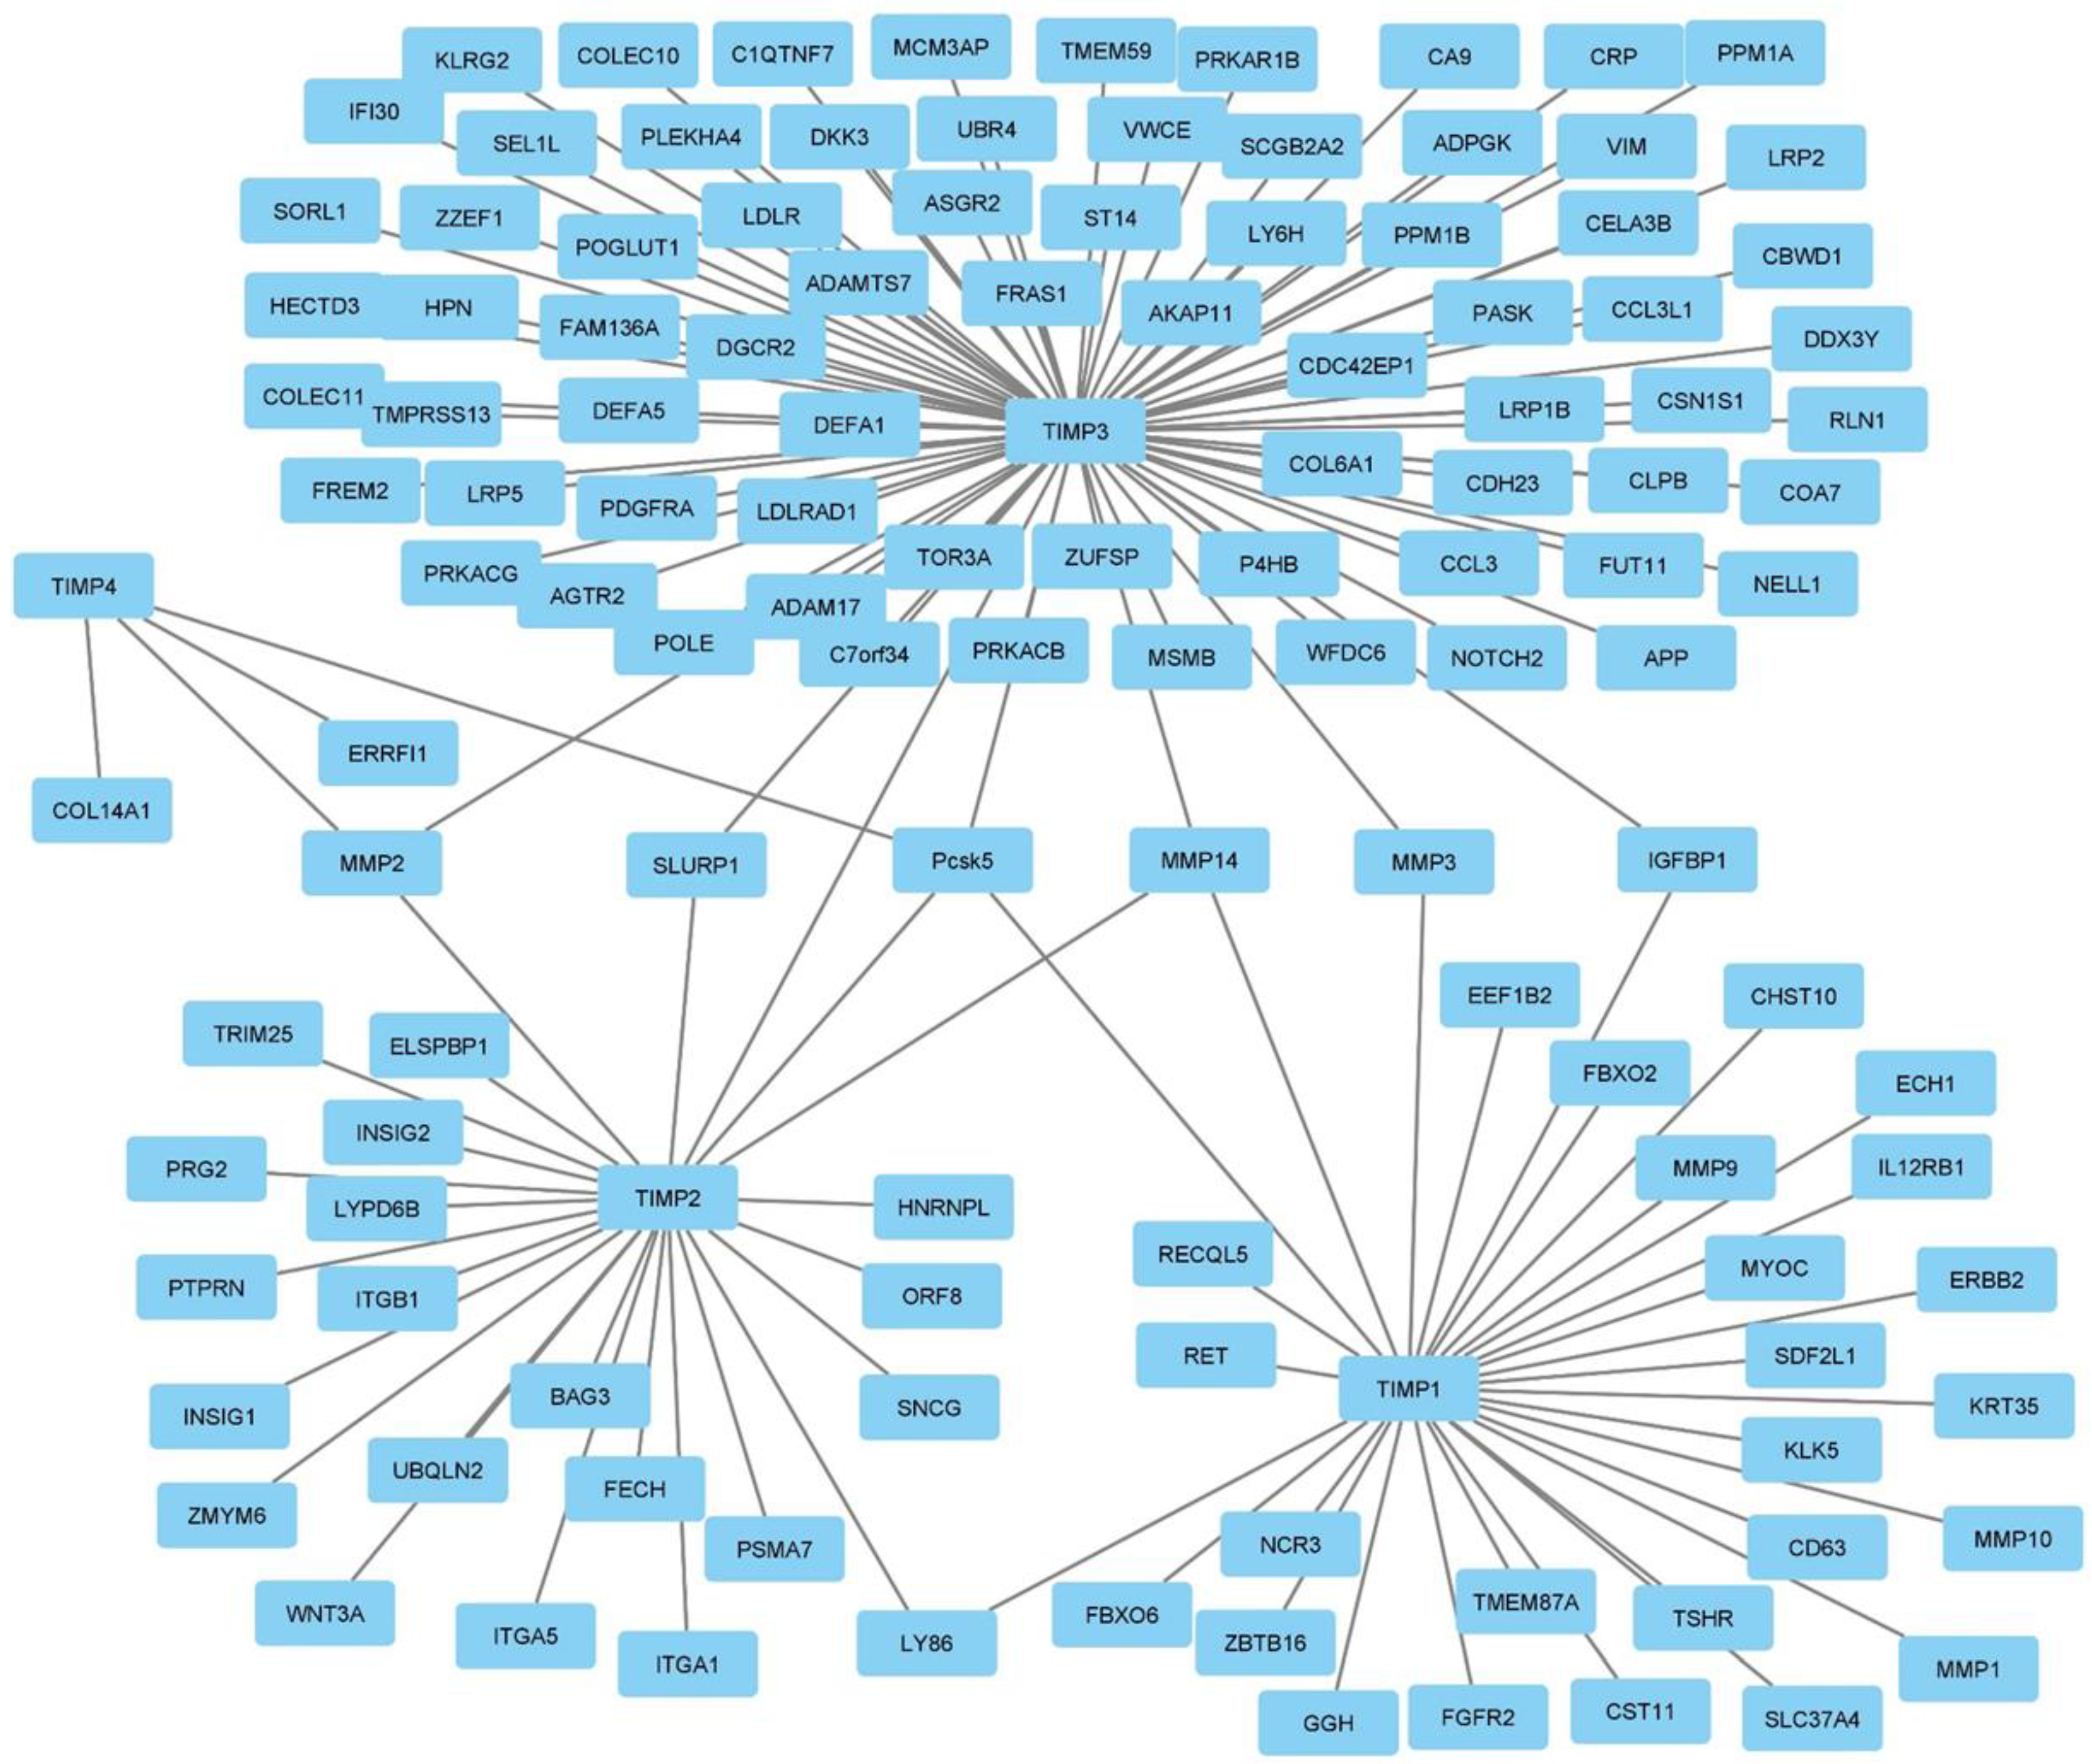
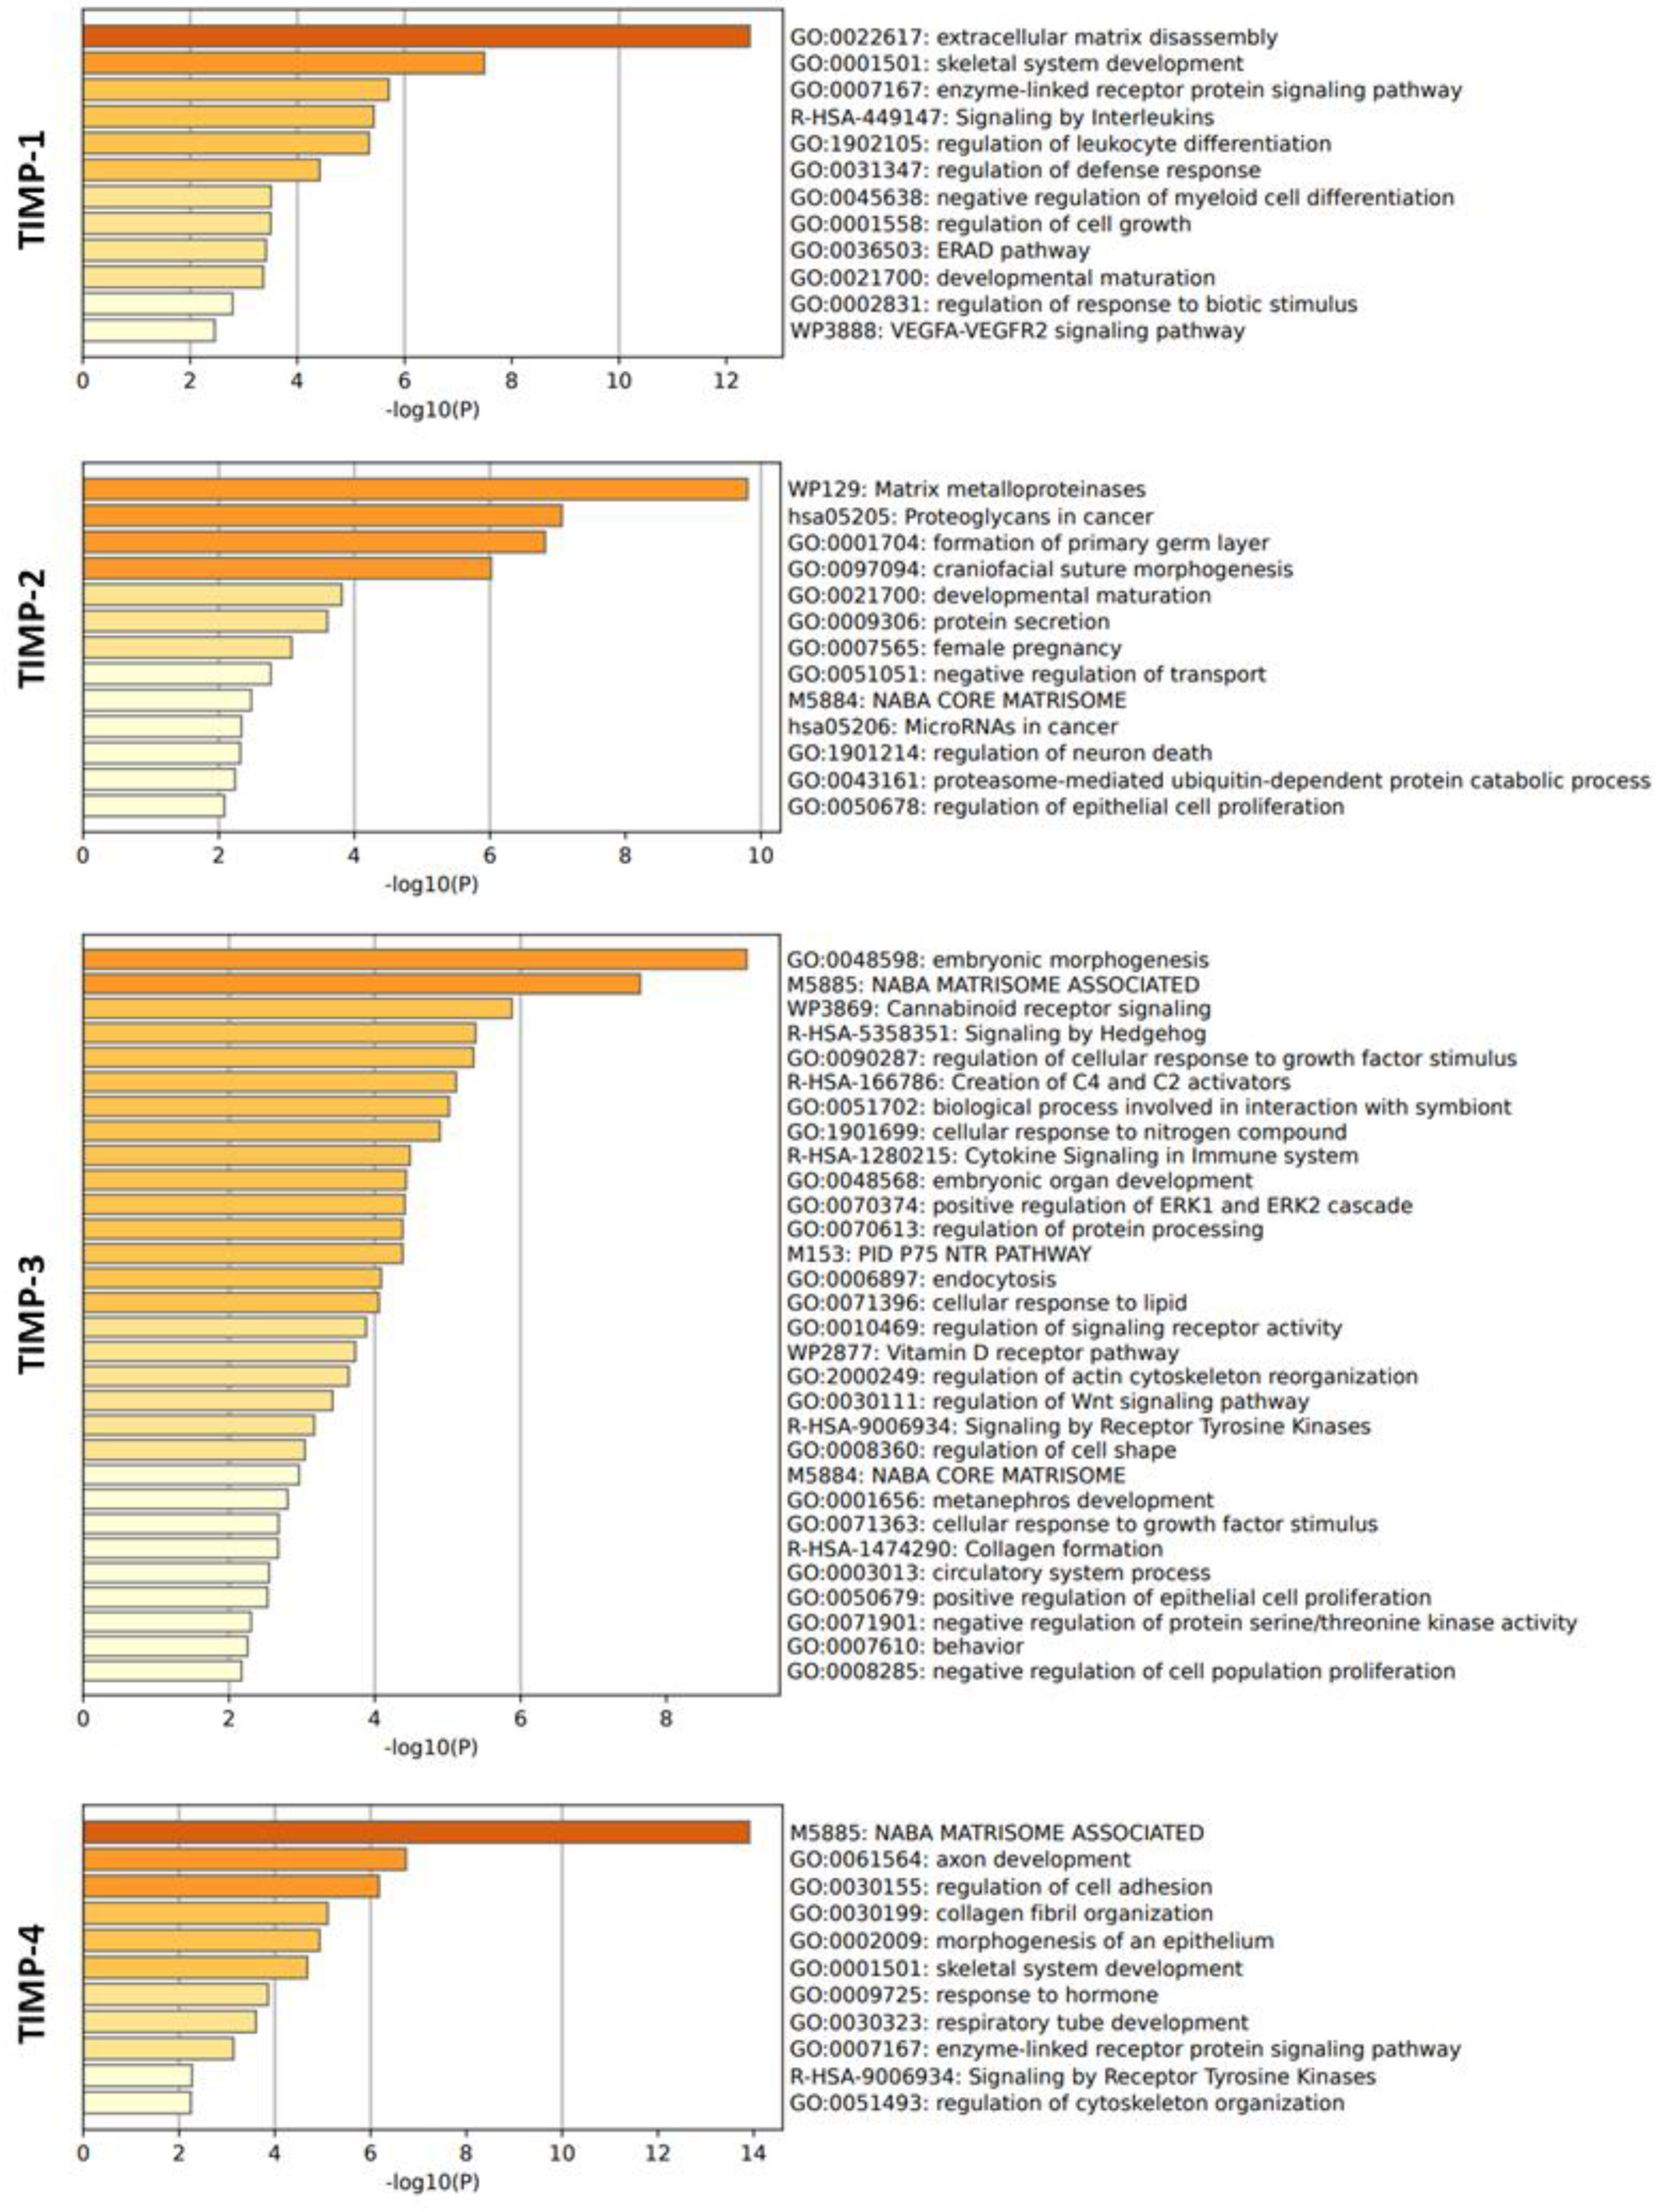
3.3. Interaction of TIMPs with their target proteins and functions
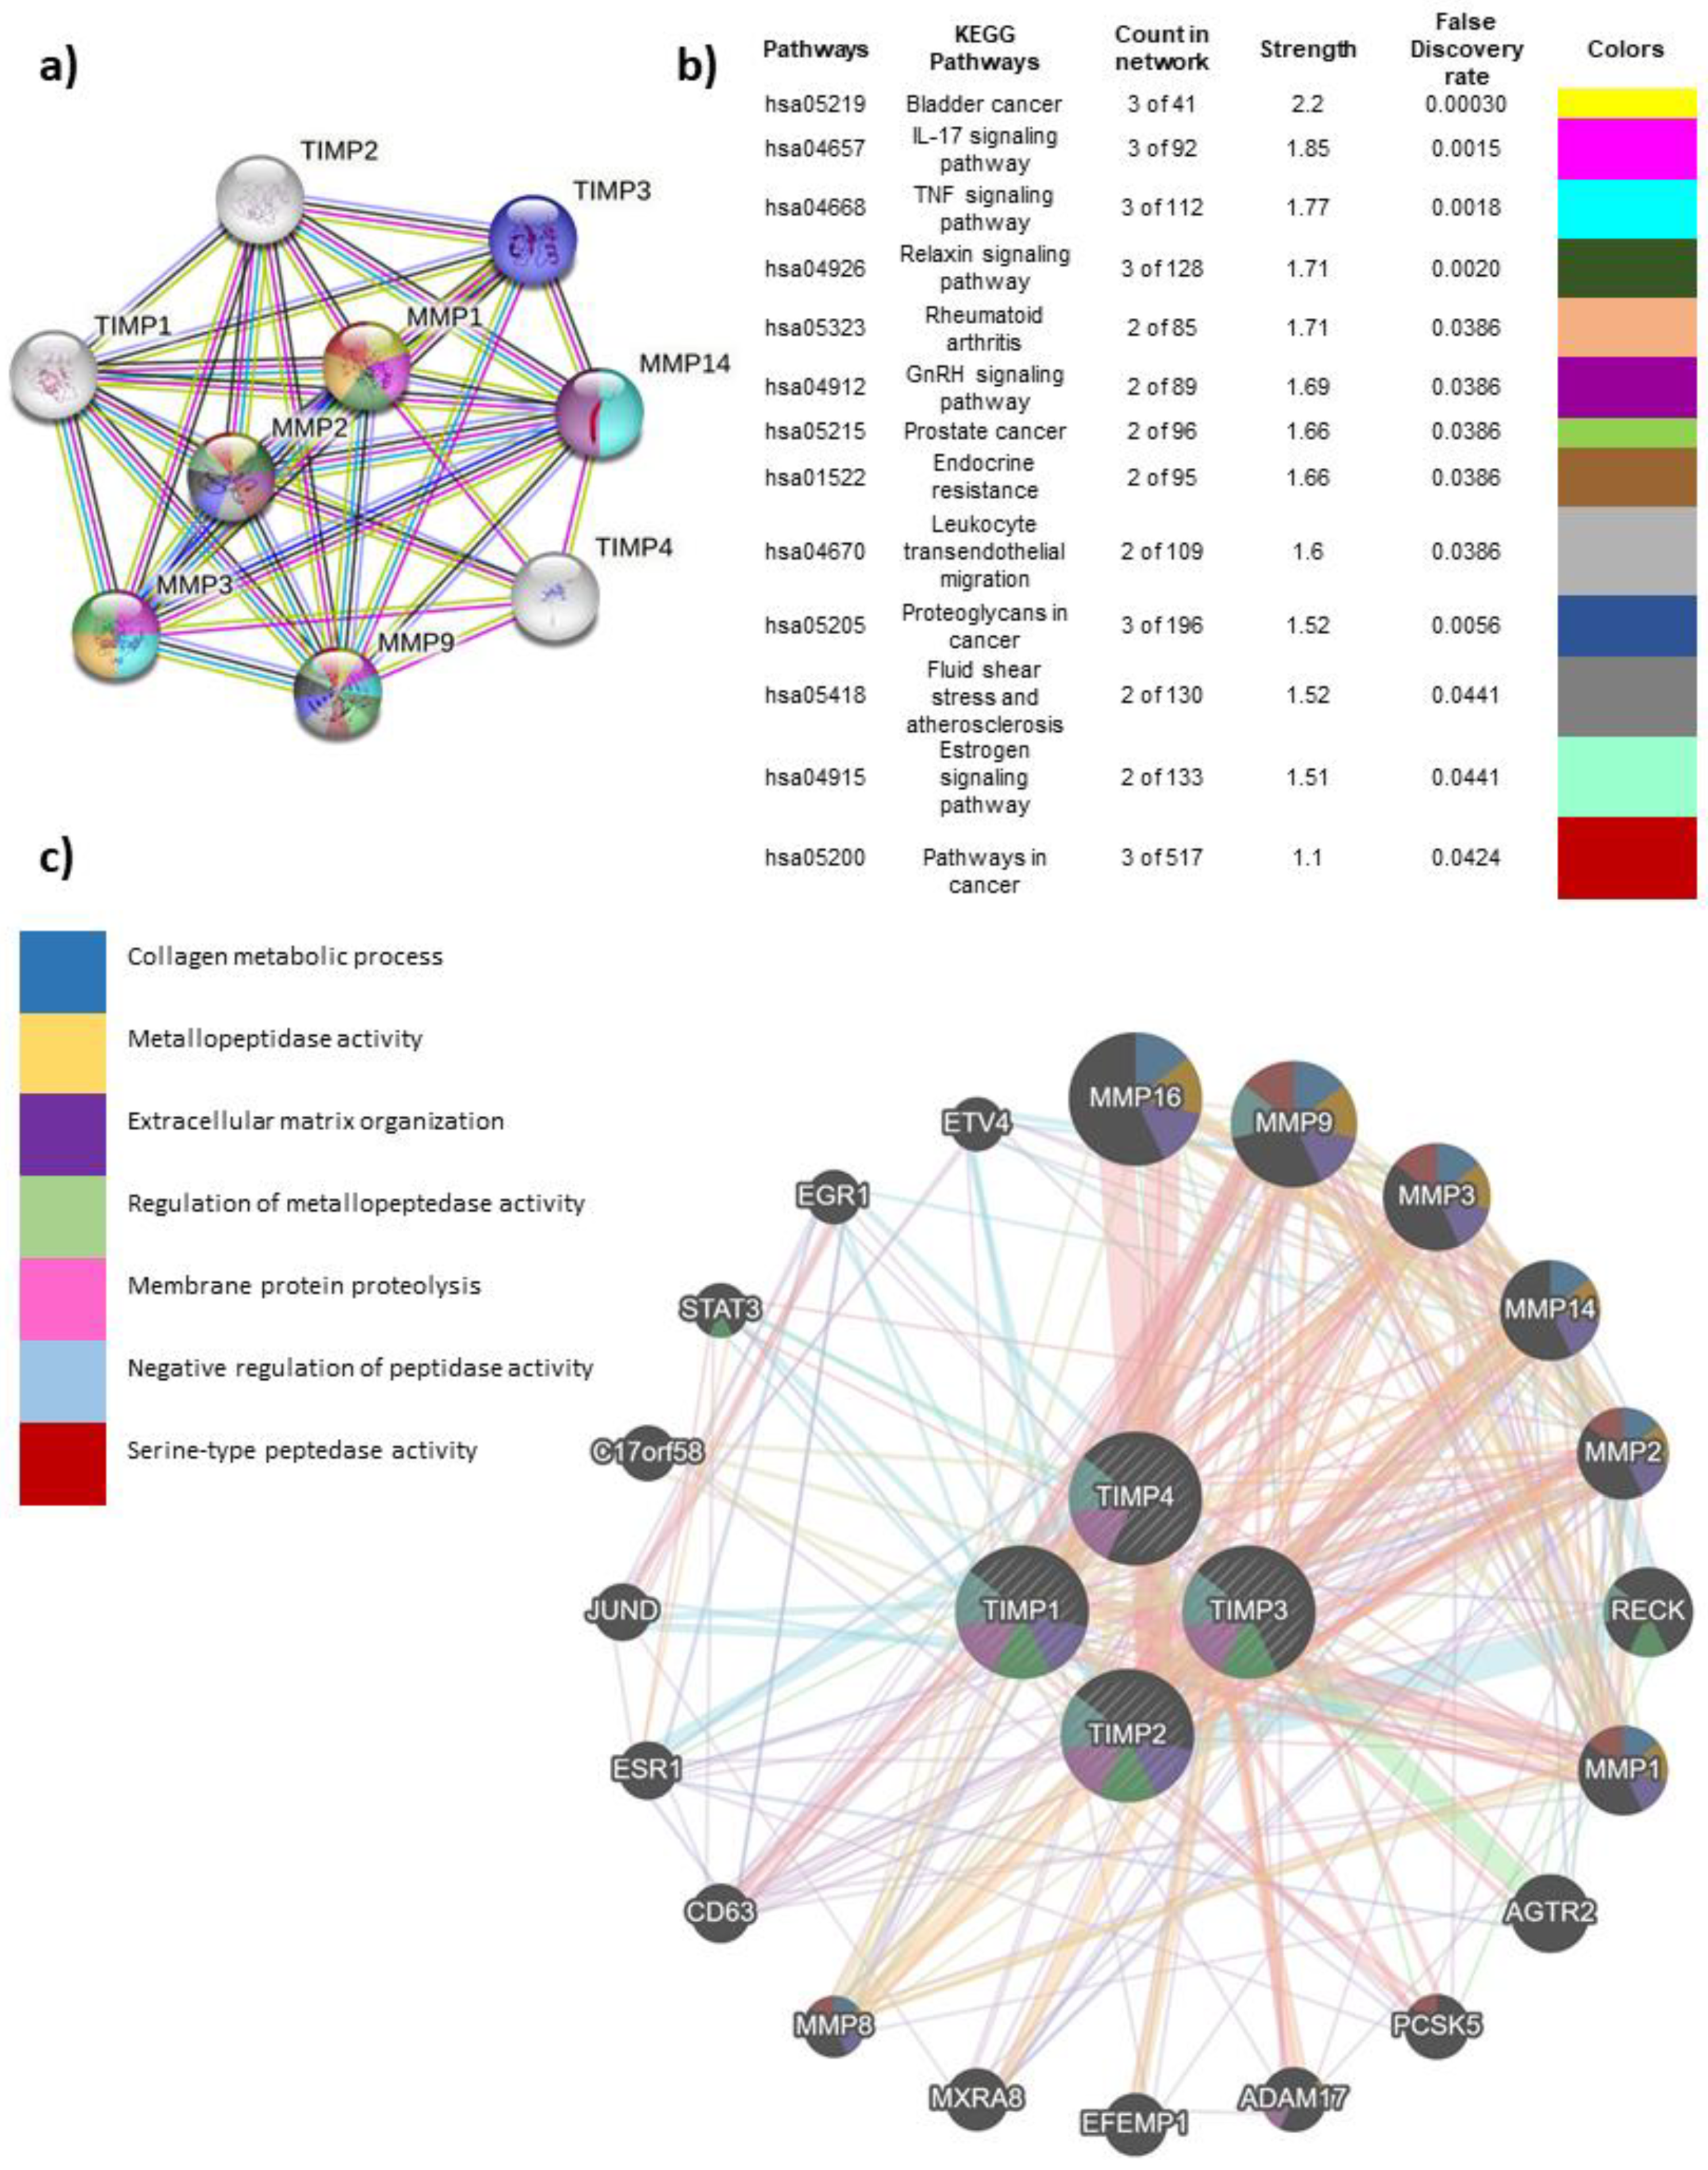
3.4. Global interactome of TIMPs in breast cancer
3.5. Correlation analysis of TIMP-1, TIMP-2, TIMP-3 and TIMP-4 with MMPs
| TIMPs | MMPs | Tissue | |||
| Tumor | Normal | ||||
| R | P | R | P | ||
|
TIMP-1 |
MMP-1 | 0.023 | 0.46 | 0.39 | *** |
| MMP-2 | 0.21 | *** | 0.38 | *** | |
| MMP-3 | 0.14 | *** | 0.6 | *** | |
| MMP-8 | 0.062 | * | 0.16 | 0.085 | |
| MMP-9 | 0.17 | *** | 0.45 | *** | |
| MMP-14 | 0.14 | *** | 0.47 | *** | |
|
TIMP-2 |
MMP-1 | 0.32 | *** | -0.0038 | 0.97 |
| MMP-2 | 0.87 | 0 | 0.76 | *** | |
| MMP-3 | 0.54 | *** | 0.016 | 0.87 | |
| MMP-8 | 0.4 | *** | 0.3 | *** | |
| MMP-9 | 0.25 | *** | 0.19 | * | |
| MMP-14 | 0.85 | *** | 0.24 | ** | |
| MMP-16 | 0.63 | *** | 0.19 | * | |
|
TIMP-3 |
MMP-1 | 0.15 | *** | -0.24 | * |
| MMP-2 | 0.58 | *** | 0.43 | *** | |
| MMP-3 | 0.29 | *** | -0.29 | ** | |
| MMP-9 | 0.11 | *** | -0.044 | 0.64 | |
| MMP-14 | 0.55 | *** | -0.14 | 0.14 | |
|
TIMP-4 |
MMP-1 | -0.22 | *** | -0.26 | ** |
| MMP-2 | 0.22 | *** | 0.3 | ** | |
| MMP-3 | 0.19 | *** | -0.31 | *** | |
| MMP-14 | 0.072 | * | -0.17 | 0.072 | |
| MMP-16 | 0.25 | *** | -0.38 | *** | |
3.6. Immune cell infiltrates by expression of TIMP-1, TIMP-2, TIMP-3 and TIMP-4 in breast cancer patients and subtypes
| TIMP | B cells | CD8+ T cells | CD4+ T cells | Macrophages | Neutrophils | DC |
| TIMP-1 | -0.136 | 0.043 | -0.045 | 0.063 | -0.029 | 0.149 |
| TIMP-2 | -0.237 | 0.406 | -0.004 | 0.087 | 0.317 | 0.279 |
| TIMP-3 | -0.135 | 0.311 | 0.087 | -0.048 | 0.054 | 0.05 |
| TIMP-4 | -0.11 | 0.072 | 0.143 | -0.108 | -0.139 | 0.03 |
4. Discussion
5. Conclusions
6. Significance of the study
Author Contributions
Acknowledgments
Conflicts of Interest
References
- Sung, H., Ferlay, J., Siegel, R. L., Laversanne, M., Soerjomataram, I., Jemal, A., & Bray, F. Global Cancer Statistics 2020: GLOBOCAN Estimates of Incidence and Mortality Worldwide for 36 Cancers in 185 Countries. CA: A Cancer Journal for Clinicians 2021, 71, 209–249. [CrossRef]
- Siegel, R. L., Miller, K. D., Wagle, N. S., & Jemal, A. Cancer statistics, 2023. CA: A Cancer Journal for Clinicians 2023, 73, 17–48. [CrossRef]
- Yin, L., Duan, J. J., Bian, X. W., & Yu, S. C. Triple-negative breast cancer molecular subtyping and treatment progress. Breast Cancer Research 2020. [CrossRef]
- Schettini, F., Brasó-Maristany, F., Kuderer, N. M., & Prat, A. A perspective on the development and lack of interchangeability of the breast cancer intrinsic subtypes. npj Breast Cancer 2022, 8, 1–4. [CrossRef]
- Yersal, O., & Barutca, S. Biological subtypes of breast cancer: Prognostic and therapeutic implications. World Journal of Clinical Oncology 2014, 5, 412–424. [CrossRef]
- Min, S. K., Lee, S. K., Woo, J., Jung, S. M., Ryu, J. M., Yu, J., … Nam, S. J. Relation between tumor size and lymph node metastasis according to subtypes of breast cancer. Journal of Breast Cancer 2021. [CrossRef]
- Raeeszadeh-Sarmazdeh, M., Greene, K. A., Sankaran, B., Downey, G. P., Radisky, D. C., & Radisky, E. S. Directed evolution of the metalloproteinase inhibitor TIMP-1 reveals that its N- and C-terminal domains cooperate in matrix metalloproteinase recognition. Journal of Biological Chemistry 2019. [CrossRef]
- Cayetano-Salazar, L., Nava-Tapia, D. A., Astudillo-Justo, K. D., Arizmendi-Izazaga, A., Sotelo-Leyva, C., Herrera-Martinez, M., … Navarro-Tito, N. Flavonoids as regulators of TIMPs expression in cancer: Consequences, opportunities, and challenges. Life Sciences 2022. [CrossRef]
- Vandenbroucke, R. E., & Libert, C. Is there new hope for therapeutic matrix metalloproteinase inhibition? Nature Reviews Drug Discovery 2014, 13, 904–927. [CrossRef]
- Cabral-Pacheco, G. A., Garza-Veloz, I., Rosa, C. C. D. La, Ramirez-Acuña, J. M., Perez-Romero, B. A., Guerrero-Rodriguez, J. F., … Martinez-Fierro, M. L. The roles of matrix metalloproteinases and their inhibitors in human diseases. International Journal of Molecular Sciences 2020, 21, 1–53. [CrossRef]
- Jackson, H. W., Defamie, V., Waterhouse, P., & Khokha, R. TIMPs: Versatile extracellular regulators in cancer. Nature Reviews Cancer 2017, 17, 38–53. [CrossRef]
- Wang, X., & Khalil, R. A. Matrix Metalloproteinases, Vascular Remodeling, and Vascular Disease. In Advances in Pharmacology, 1st ed.; Elsevier Inc., 2018; Vol. 81. [CrossRef]
- Bourboulina, D., & Stetler-Stevenson, W. G. Matrix MetalloProteinases (MMPs) andTissue Inhibitors of MetalloProteinases (TIMPs): positive and negative regulators intumor cell adhesion. Semin Cancer Biol 2011, 20, 161–168. [CrossRef]
- Shimoda, M. Extracellular vesicle-associated MMPs: A modulator of the tissue microenvironment. In Advances in Clinical Chemistry, 1st ed.; Elsevier Inc., 2019; Vol. 88. [Google Scholar] [CrossRef]
- Wang, D. D., Xu, W. X., Chen, W. Q., Li, L., Yang, S. J., Zhang, J., & Tang, J. H. Identification of TIMP2 as a Prognostic Biomarker and Its Correlation with Tumor Immune Microenvironment: A Comprehensive Pan-Cancer Analysis. Journal of Oncology 2022, 2022. [CrossRef]
- Chen, W. Q., Yang, S. J., Xu, W. X., Deng, F., Wang, D. D., Tang, J. H., & Ding, J. Bioinformatics analysis revealing prognostic significance of TIMP2 gene in breast cancer. Medicine (United States) 2021, 100, E27489. [CrossRef]
- Tang, Z., Li, C., Kang, B., Gao, G., Li, C., & Zhang, Z. GEPIA: A web server for cancer and normal gene expression profiling and interactive analyses. Nucleic Acids Research 2017, 45, W98–W102. [CrossRef]
- Lánczky, A., & Győrffy, B. Web-based survival analysis tool tailored for medical research (KMplot): Development and implementation. Journal of Medical Internet Research 2021, 23, 1–7. [CrossRef]
- Oughtred, R., Stark, C., Breitkreutz, B. J., Rust, J., Boucher, L., Chang, C., … Tyers, M. The BioGRID interaction database: 2019 update. Nucleic Acids Research 2019, 47, D529–D541. [CrossRef]
- Paul Shannon, 1, Andrew Markiel, 1, Owen Ozier, 2 Nitin S. Baliga, 1 Jonathan T. Wang, 2 Daniel Ramage, 2, Nada Amin, 2, Benno Schwikowski, 1, 5 and Trey Ideker2, 3, 4, 5, 山本隆久, … 大森敏行. Cytoscape: A Software Environment for Integrated Models. Genome Research 1971, 13, 426.
- Warde-Farley, D., Donaldson, S. L., Comes, O., Zuberi, K., Badrawi, R., Chao, P., … Morris, Q. The GeneMANIA prediction server: Biological network integration for gene prioritization and predicting gene function. Nucleic Acids Research 2010, 38 SUPPL. 2, 214–220. [CrossRef]
- Li, T., Fan, J., Wang, B., Traugh, N., Chen, Q., Liu, J. S., … Liu, X. S. TIMER: A web server for comprehensive analysis of tumor-infiltrating immune cells. Cancer Research 2017, 77, e108–e110. [CrossRef]
- Chen, X., Zhong, S. L., Lu, P., Wang, D. D., Zhou, S. Y., Yang, S. J., … Tang, J. H. miR-4443 participates in the malignancy of breast cancer. PLoS ONE 2016. [CrossRef]
- Harbeck, N., Penault-Llorca, F., Cortes, J., Gnant, M., Houssami, N., Poortmans, P., … Cardoso, F. Breast cancer. Nature Reviews Disease Primers 2019, 5. [CrossRef]
- Feng, Y., Spezia, M., Huang, S., Yuan, C., Zeng, Z., Zhang, L., … Ren, G. Breast cancer development and progression: Risk factors, cancer stem cells, signaling pathways, genomics, and molecular pathogenesis. Genes and Diseases 2018, 5, 77–106. [CrossRef] [PubMed]
- Dechaphunkul, A., Phukaoloun, M., Kanjanapradit, K., Graham, K., Ghosh, S., Santos, C., & Mackey, J. R. Prognostic Significance of Tissue Inhibitor of Metalloproteinase-1 in Breast Cancer. International Journal of Breast Cancer 2012. [CrossRef]
- Guda, P., Chittur, S. V., & Guda, C. Comparative Analysis of Protein-Protein Interactions in Cancer-Associated Genes. Genomics, Proteomics and Bioinformatics 2009. [CrossRef]
- Goff, S. L., & Danforth, D. N. The Role of Immune Cells in Breast Tissue and Immunotherapy for the Treatment of Breast Cancer. Clinical Breast Cancer 2021. [CrossRef]
- Gao, Z. hua, Li, C. xin, Liu, M., & Jiang, J. yuan. Predictive and prognostic role of tumour-infiltrating lymphocytes in breast cancer patients with different molecular subtypes: a meta-analysis. BMC Cancer 2020. [CrossRef]
- Song, G., Xu, S., Zhang, H., Wang, Y., Xiao, C., Jiang, T., … Wang, X. TIMP1 is a prognostic marker for the progression and metastasis of colon cancer through FAK-PI3K/AKT and MAPK pathway. Journal of Experimental & Clinical Cancer Research 2016, 35, 148. [CrossRef]
- Cheng, G., Fan, X., Hao, M., Wang, J., Zhou, X., & Sun, X. Higher levels of TIMP-1 expression are associated with a poor prognosis in triplenegative breast cancer. Molecular Cancer 2016. [CrossRef]
- Jung, Y. S., Liu, X. W., Chirco, R., Warner, R. B., Fridman, R., & Kim, H. R. C. TIMP-1 induces an EMT-like phenotypic conversion in MDCK cells independent of its MMP-inhibitory domain. PLoS ONE 2012, 7. [CrossRef]
- D’Angelo, R. C., Liu, X. W., Najy, A. J., Jung, Y. S., Won, J., Chai, K. X., … Kim, H. R. C. TIMP-1 via TWIST1 induces EMT phenotypes in human breast epithelial cells. Molecular Cancer Research 2014, 12, 1324–1333. [CrossRef]
- Wu, Z. S., Wu, Q., Yang, J. H., Wang, H. Q., Ding, X. D., Yang, F., & Xu, X. C. Prognostic significance of MMP-9 and TIMP-1 serum and tissue expression in breast cancer. International Journal of Cancer 2008, 122, 2050–2056. [CrossRef]
- Talvensaari-Mattila, A., & Turpeenniemi-Hujanen, T. High preoperative serum TIMP-1 is a prognostic indicator for survival in breast carcinoma. Breast Cancer Research and Treatment 2005, 89, 29–34. [CrossRef]
- Voorzanger-Rousselot, N., Juillet, F., Mareau, E., Zimmermann, J., Kalebic, T., & Garnero, P. Association of 12 serum biochemical markers of angiogenesis, tumour invasion and bone turnover with bone metastases from breast cancer: A crossectional and longitudinal evaluation. British Journal of Cancer 2006, 95, 506–514. [CrossRef]
- Würtz, S., Schrohl, A. S., Mouridsen, H., & Brünner, N. TIMP-1 as a tumor marker in breast cancer - An update. Acta Oncologica 2008, 47, 580–590. [CrossRef]
- Liu, X. W., Bernardo, M. M., Fridman, R., & Kim, H. R. C. Tissue inhibitor of metalloproteinase-1 protects human breast epithelial cells against intrinsic apoptotic cell death via the focal adhesion kinase/phosphatidylinositol 3-kinase and MAPK signaling pathway. Journal of Biological Chemistry 2003, 278, 40364–40372. [CrossRef]
- Klintman, M., Würtz, S. Ø., Christensen, I. J., Hertel, P. B., Fernö, M., Malmberg, M., … Brünner, N. Association between tumor tissue TIMP-1 levels and objective response to first-line chemotherapy in metastatic breast cancer. Breast Cancer Research and Treatment 2010, 121, 365–371. [CrossRef]
- Schrohl, A. S., Meijer-Van Gelder, M. E., Holten-Andersen, M. N., Christensen, I. J., Look, M. P., Mouridsen, H. T., … Foekens, J. A. Primary tumor levels of tissue inhibitor of metalloproteinases-1 are predictive of resistance to chemotherapy in patients with metastatic breast cancer. Clinical Cancer Research 2006. [CrossRef]
- Balkhi, S., Mashayekhi, F., Salehzadeh, A., & Saeidi Saedi, H. TIMP1 and TIMP3 circulating levels and promoter polymorphisms in breast cancer. British Journal of Biomedical Science 2021, 78, 236–238. [CrossRef]
- Escalona, R. M., Bilandzic, M., Western, P., Kadife, E., Kannourakis, G., Findlay, J. K., & Ahmed, N. TIMP-2 regulates proliferation, invasion and STAT3-mediated cancer stem cell-dependent chemoresistance in ovarian cancer cells. BMC Cancer 2020, 20, 960. [CrossRef]
- Wang, W., Li, D., Xiang, L., Lv, M., Tao, L., Ni, T., … Zhou, Y. TIMP-2 inhibits metastasis and predicts prognosis of colorectal cancer via regulating MMP-9. Cell Adhesion and Migration 2019, 13, 273–284. [CrossRef]
- Imren, S., Kohn, D. B., Shimada, H., Blavier, L., & DeClerck, Y. A. Overexpression of tissue inhibitor of metalloproteinases-2 retroviral-mediated gene transfer in vivo inhibits tumor growth and invasion. Cancer research 1996, 56, 2891–5.
- Peeney, D., Jensen, S. M., Castro, N. P., Kumar, S., Noonan, S., Handler, C., … Stetler-Stevenson, W. G. TIMP-2 suppresses tumor growth and metastasis in murine model of triple-negative breast cancer. Carcinogenesis 2020, 41, 313–325. [CrossRef]
- Ree, A. H., Flørenes, V. A., Berg, J. P., Mælandsmo, G. M., Nesland, J. M., & Fodstad, Ø. High levels of messenger RNAs for tissue inhibitors of metalloproteinases (TIMP-1 and TIMP-2) in primary breast carcinomas are associated with development of distant metastases. Clinical Cancer Research 1997.
- Remacle, A., McCarthy, K., Noël, A., Maguire, T., McDermott, E., O’Higgins, N., … Duffy, M. J. High levels of TIMP-2 correlate with adverse prognosis in breast cancer. International Journal of Cancer 2000, 86, 118–121.
- Shen, Q., Lee, E. S., Pitts, R. L., Wu, M. H., & Yuan, S. Y. Tissue inhibitor of metalloproteinase-2 regulates matrix metalloproteinase-2-mediated endothelial barrier dysfunction and breast cancer cell transmigration through lung microvascular endothelial cells. Molecular Cancer Research 2010, 8, 939–951. [CrossRef]
- Noel, A., Maillard, C., Rocks, N., Jost, M., Chabottaux, V., Sounni, N. E., … Foidart, J. M. Membrane associated proteases and their inhibitors in tumour angiogenesis. Journal of Clinical Pathology 2004, 57, 577–584. [CrossRef]
- Gu, X., Fu, M., Ding, Y., Ni, H., Zhang, W., Zhu, Y., … Zhu, J. TIMP-3 expression associates with malignant behaviors and predicts favorable survival in HCC. PLoS ONE 2014, 9, 1–8. [CrossRef]
- Su, C. W., Su, B. F., Chiang, W. L., Yang, S. F., Chen, M. K., & Lin, C. W. Plasma levels of the tissue inhibitor matrix metalloproteinase-3 as a potential biomarker in oral cancer progression. International Journal of Medical Sciences 2017, 14, 37–44. [CrossRef]
- Edwards, D.R. TIMP-3 and endocrine therapy of breast cancer: An apoptosis connection emerges. Journal of Pathology 2004, 202, 391–394. [Google Scholar] [CrossRef]
- Su, C. W., Lin, C. W., Yang, W. E., & Yang, S. F. TIMP-3 as a therapeutic target for cancer. Therapeutic Advances in Medical Oncology 2019. [CrossRef]
- Baker, A. H., George, S. J., Zaltsman, A. B., Murphy, G., & Newby, A. C. Inhibition of invasion and induction of apoptotic cell death of cancer cell lines by overexpression of TIMP-3. British Journal of Cancer 1999, 79, 1347–1355. [CrossRef]
- Kang, S. H., Choi, H. H., Kim, S. G., Jong, H. S., Kim, N. K., Kim, S. J., & Bang, Y. J. Transcriptional inactivation of the tissue inhibitor of metalloproteinase-3 gene by DNA hypermethylation of the 5’-CpG island in human gastric cancer cell lines. International Journal of Cancer 2000, 86, 632–635.
- Ninomiya, I., Kawakami, K., Fushida, S., Fujimura, T., Funaki, H., Takamura, H., … Ohta, T. Quantitative detection of TIMP-3 promoter hypermethylation and its prognostic significance in esophageal squamous cell carcinoma. Oncology Reports 2008. [CrossRef]
- Bian, J., Wang, Y., Smith, M. R., Kim, H., Jacobs, C., Jackman, J., … Sun, Y. Suppression of in vivo tumor growth and induction of suspension cell death by tissue inhibitor of metalloproteinases (TIMP)-3. Carcinogenesis 1996, 17, 1805–1811. [CrossRef]
- Wu, D. W., Tsai, L. H., Chen, P. M., Lee, M. C., Wang, L., Chen, C. Y., … Lee, H. Loss of TIMP-3 promotes tumor invasion via elevated IL-6 production and predicts poor survival and relapse in HPV-infected non-small cell lung cancer. American Journal of Pathology 2012, 181, 1796–1806. [CrossRef]
- Jackson, H. W., Hojilla, C. V., Weiss, A., Sanchez, O. H., Wood, G. A., & Khokha, R. Timp3 deficient mice show resistance to developing breast cancer. PLoS ONE 2015, 10, 1–14. [CrossRef]
- Span, P. N., Lindberg, R. L. P., Manders, P., Tjan-Heijnen, V. C. G., Heuvel, J. J. T. M., Beex, L. V. A. M., & Sweep, C. G. J. F. Tissue inhibitors of metalloproteinase expression in human breast cancer: TIMP-3 is associated with adjuvant endocrine therapy success. Journal of Pathology 2004, 202, 395–402. [CrossRef]
- Kornfeld, J. W., Meder, S., Wohlberg, M., Friedrich, R. E., Rau, T., Riethdorf, L., … Riethdorf, S. Overexpression of TACE and TIMP3 mRNA in head and neck cancer: Association with tumour development and progression. British Journal of Cancer 2011, 104, 138–145. [CrossRef] [PubMed]
- Melendez-zajgla, J., Pozo, L. Del, Ceballos, G., & Maldonado, V. Tissue Inhibitor of Metalloproteinases-4. The road less traveled. Molecular Cancer 2008, 11, 1–11. [CrossRef]
- Lizarraga, F., Espinosa, M., Ceballos-Cancino, G., Vazquez-Santillan, K., Bahena-Ocampo, I., Schwarz-Cruz y Celis, A., … Melendez-Zajgla, J. Tissue inhibitor of metalloproteinases-4 (TIMP-4) regulates stemness in cervical cancer cells. Molecular Carcinogenesis 2016, 55, 1952–1961. [CrossRef] [PubMed]
- Liss, M., Sreedhar, N., Keshgegian, A., Sauter, G., Chernick, M. R., Prendergast, G. C., & Wallon, U. M. Tissue inhibitor of metalloproteinase-4 is elevated in early-stage breast cancers with accelerated progression and poor clinical course. American Journal of Pathology 2009, 175, 940–946. [CrossRef]
- Jiang, Y., Wang, M., Çeliker, M. Y. Ç., Liu, Y. E., Sang, Q. X. A., Goldberg, I. D., & Shi, Y. E. Stimulation of mammary tumorigenesis by systemic tissue inhibitor of matrix metalloproteinase 4 gene delivery. Cancer Research 2001.
- Dieci, M. V., Miglietta, F., & Guarneri, V. Immune infiltrates in breast cancer: Recent updates and clinical implications. Cells 2021, 10, 1–27. [CrossRef]
- La Rocca, G., Anzalone, R., Corrao, S., Magno, F., Rappa, F., Marasà, S., … Cappello, F. CD1a down-regulation in primary invasive ductal breast carcinoma may predict regional lymph node invasion and patient outcome. Histopathology 2008, 52, 203–212. [CrossRef]
- Han, J., Jing, Y., Han, F., & Sun, P. Comprehensive analysis of expression, prognosis and immune infiltration for TIMPs in glioblastoma. BMC Neurology 2021, 21, 1–15. [CrossRef]
- Liu, L., Yang, S., Lin, K., Yu, X., Meng, J., Ma, C., … Jin, D. Sp1 induced gene TIMP1 is related to immune cell infiltration in glioblastoma. Scientific Reports 2022, 12, 1–18. [CrossRef]
- Jian, F., Yanhong, J., Limeng, W., Guoping, N., Yiqin, T., Hao, L., & Zhaoji, P. TIMP2 is associated with prognosis and immune infiltrates of gastric and colon cancer. International Immunopharmacology 2022, 110. [CrossRef]
Disclaimer/Publisher’s Note: The statements, opinions and data contained in all publications are solely those of the individual author(s) and contributor(s) and not of MDPI and/or the editor(s). MDPI and/or the editor(s) disclaim responsibility for any injury to people or property resulting from any ideas, methods, instructions or products referred to in the content. |
© 2023 by the authors. Licensee MDPI, Basel, Switzerland. This article is an open access article distributed under the terms and conditions of the Creative Commons Attribution (CC BY) license (http://creativecommons.org/licenses/by/4.0/).


