Submitted:
19 June 2023
Posted:
21 June 2023
You are already at the latest version
Abstract
Keywords:
1. Introduction
2. Materials and Methods
2.1. Chemicals and materials
2.2. Liquid chromatography and mass spectrometry conditions
2.3. Calibrators and quality control samples
2.4. Extraction efficiency and matrix factor
2.5. Protocol for sample preparation
2.6. Method validation
3. Results and discussion
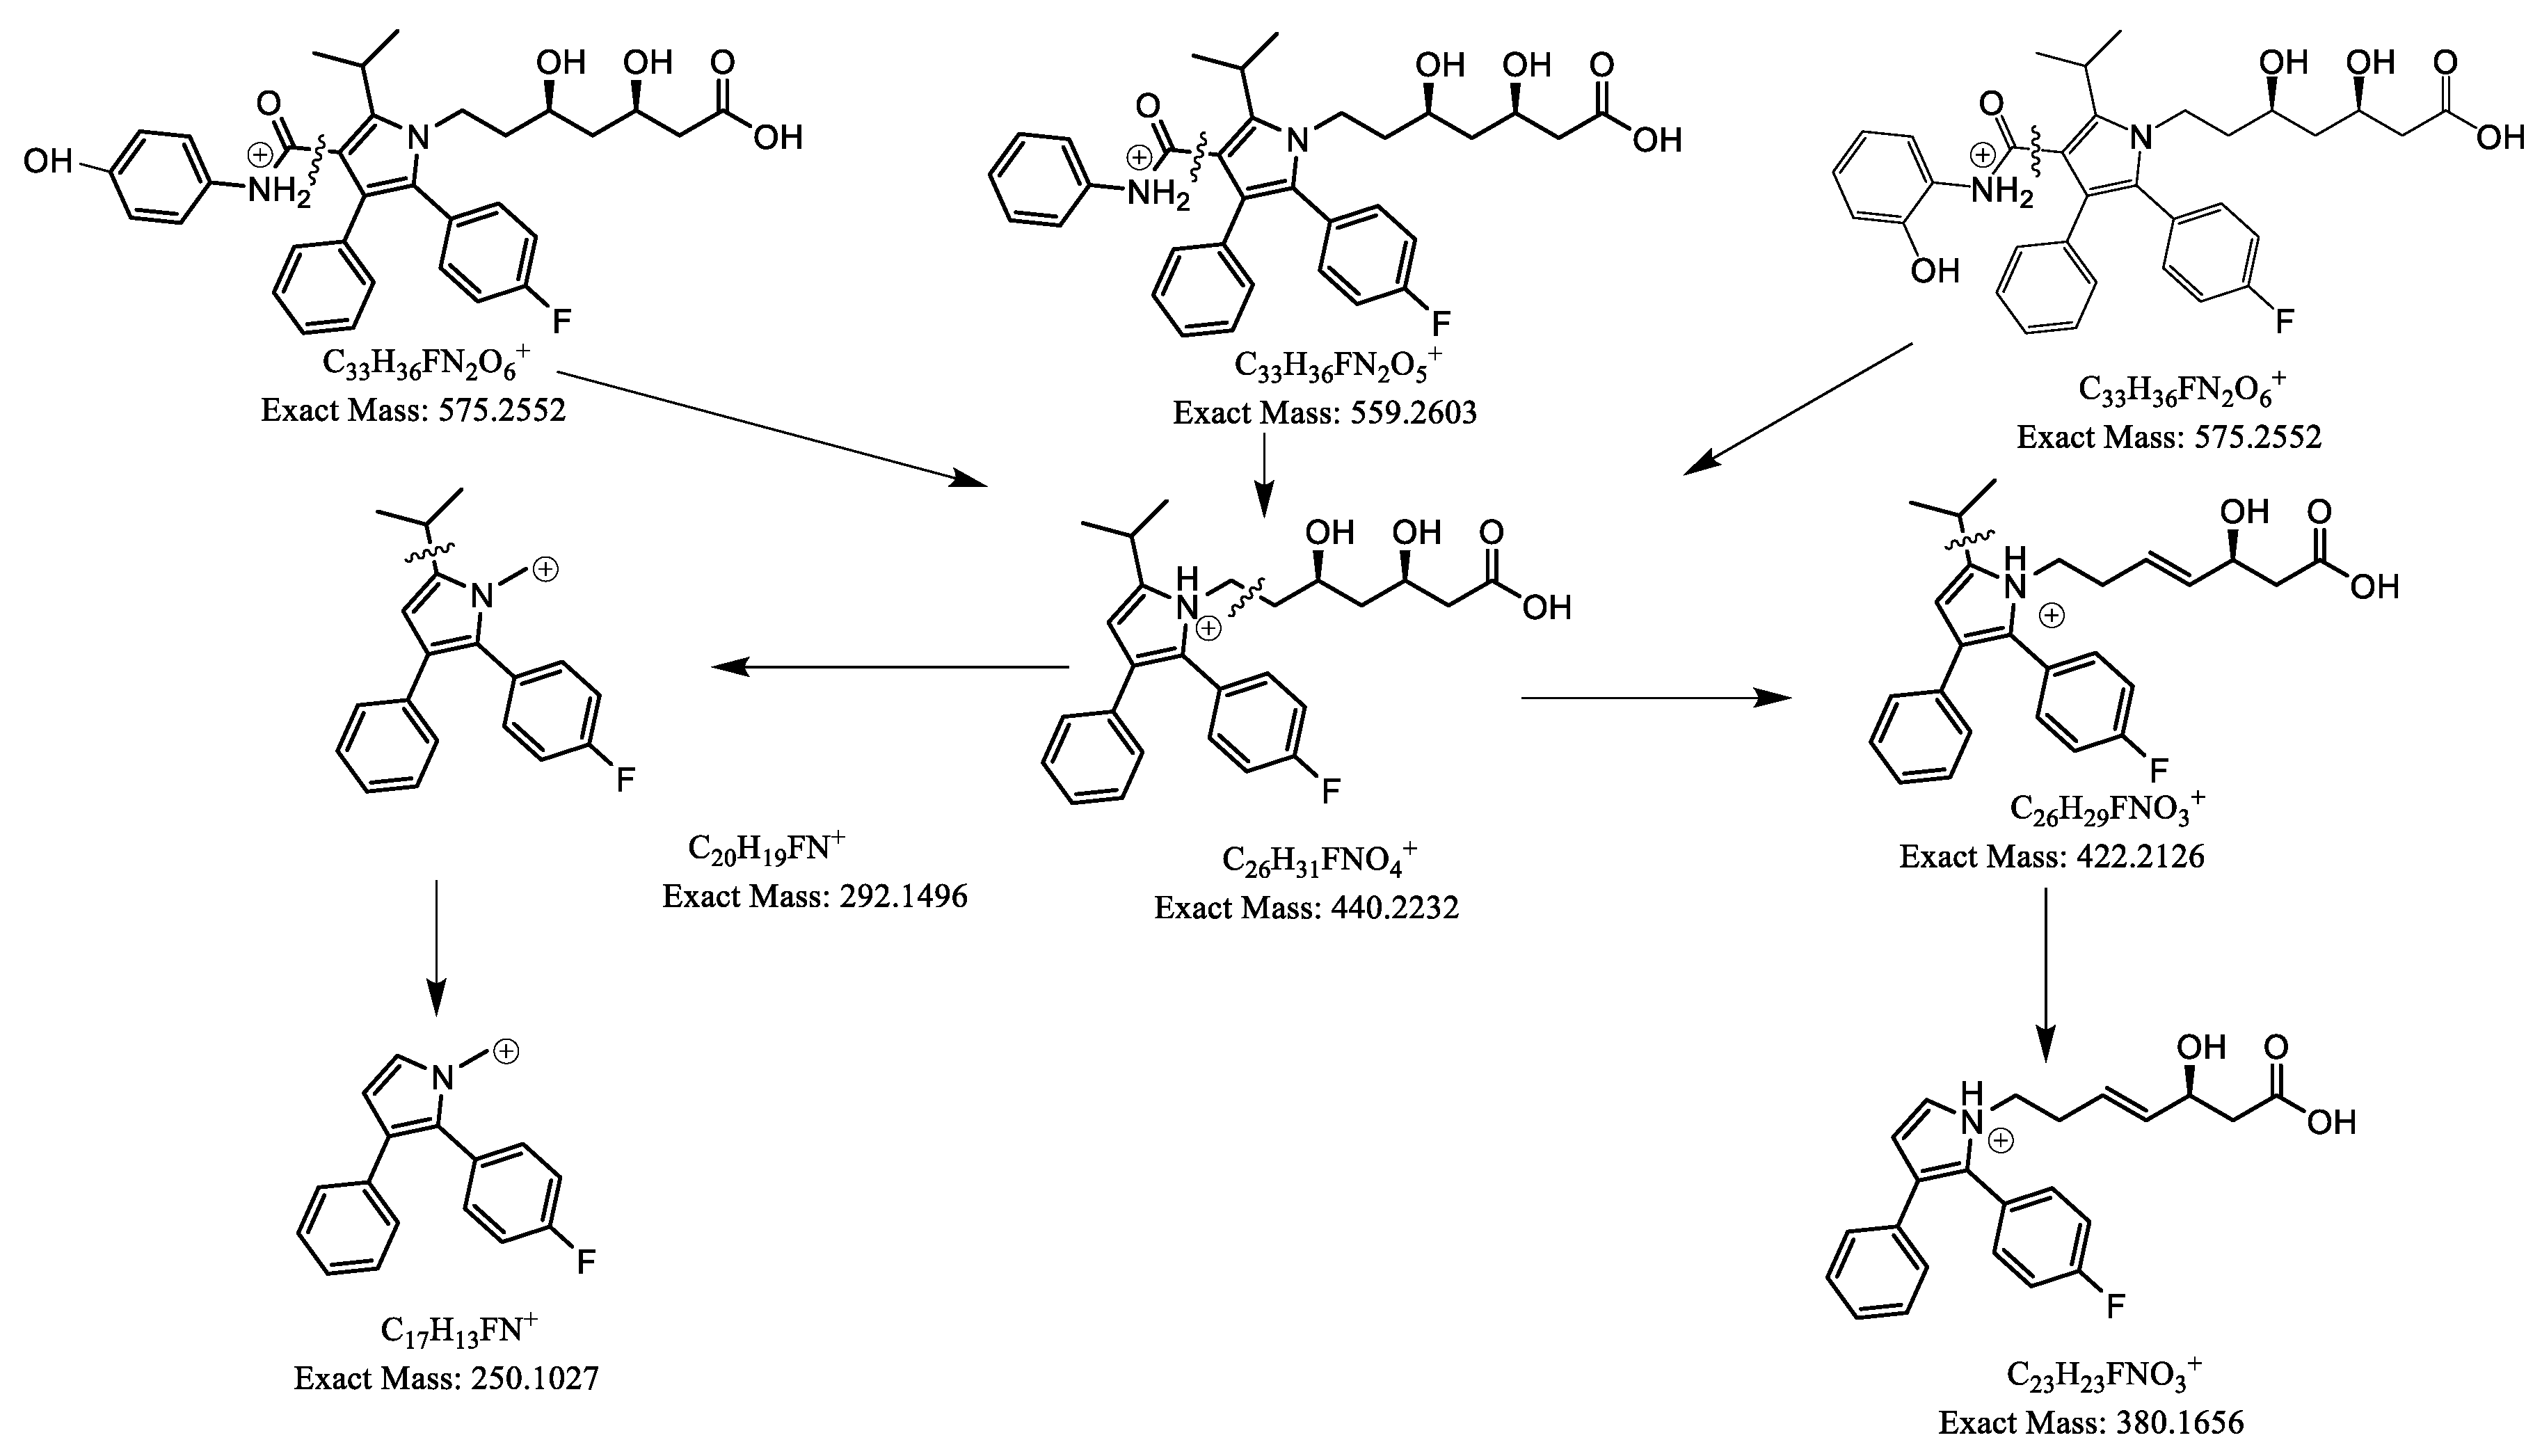
3.1. LC-ESI- MS/MS method development
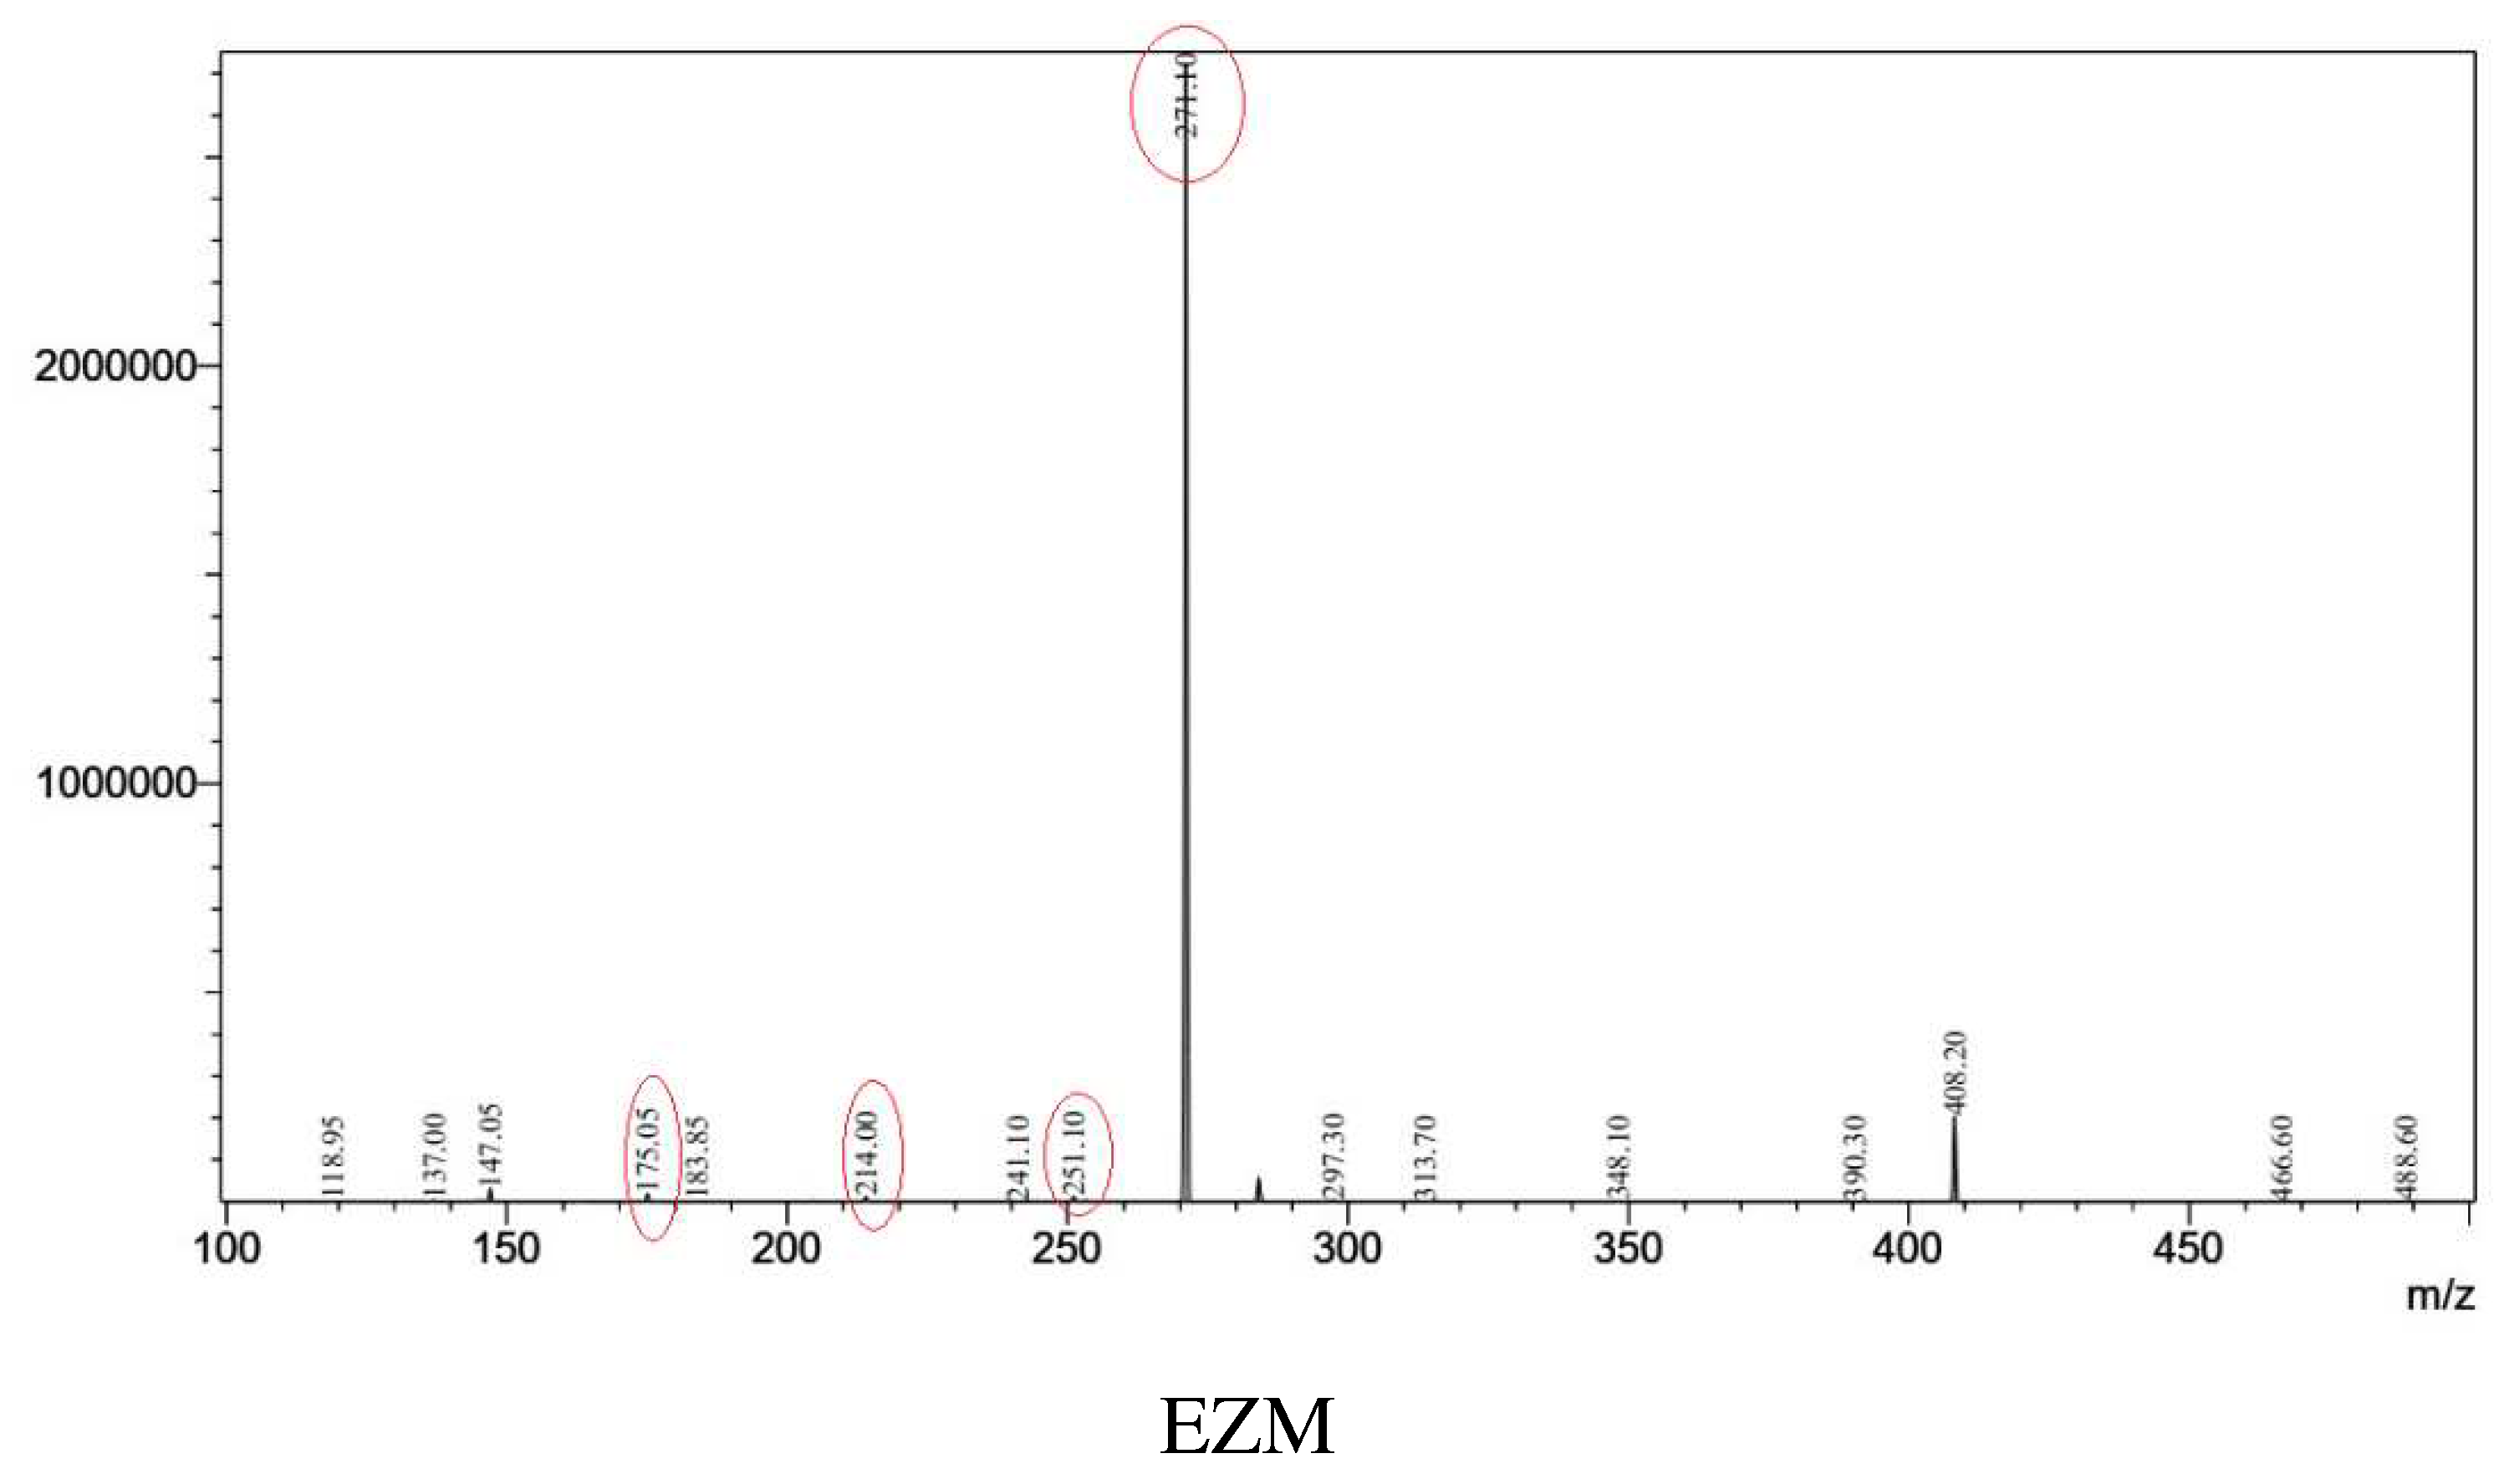
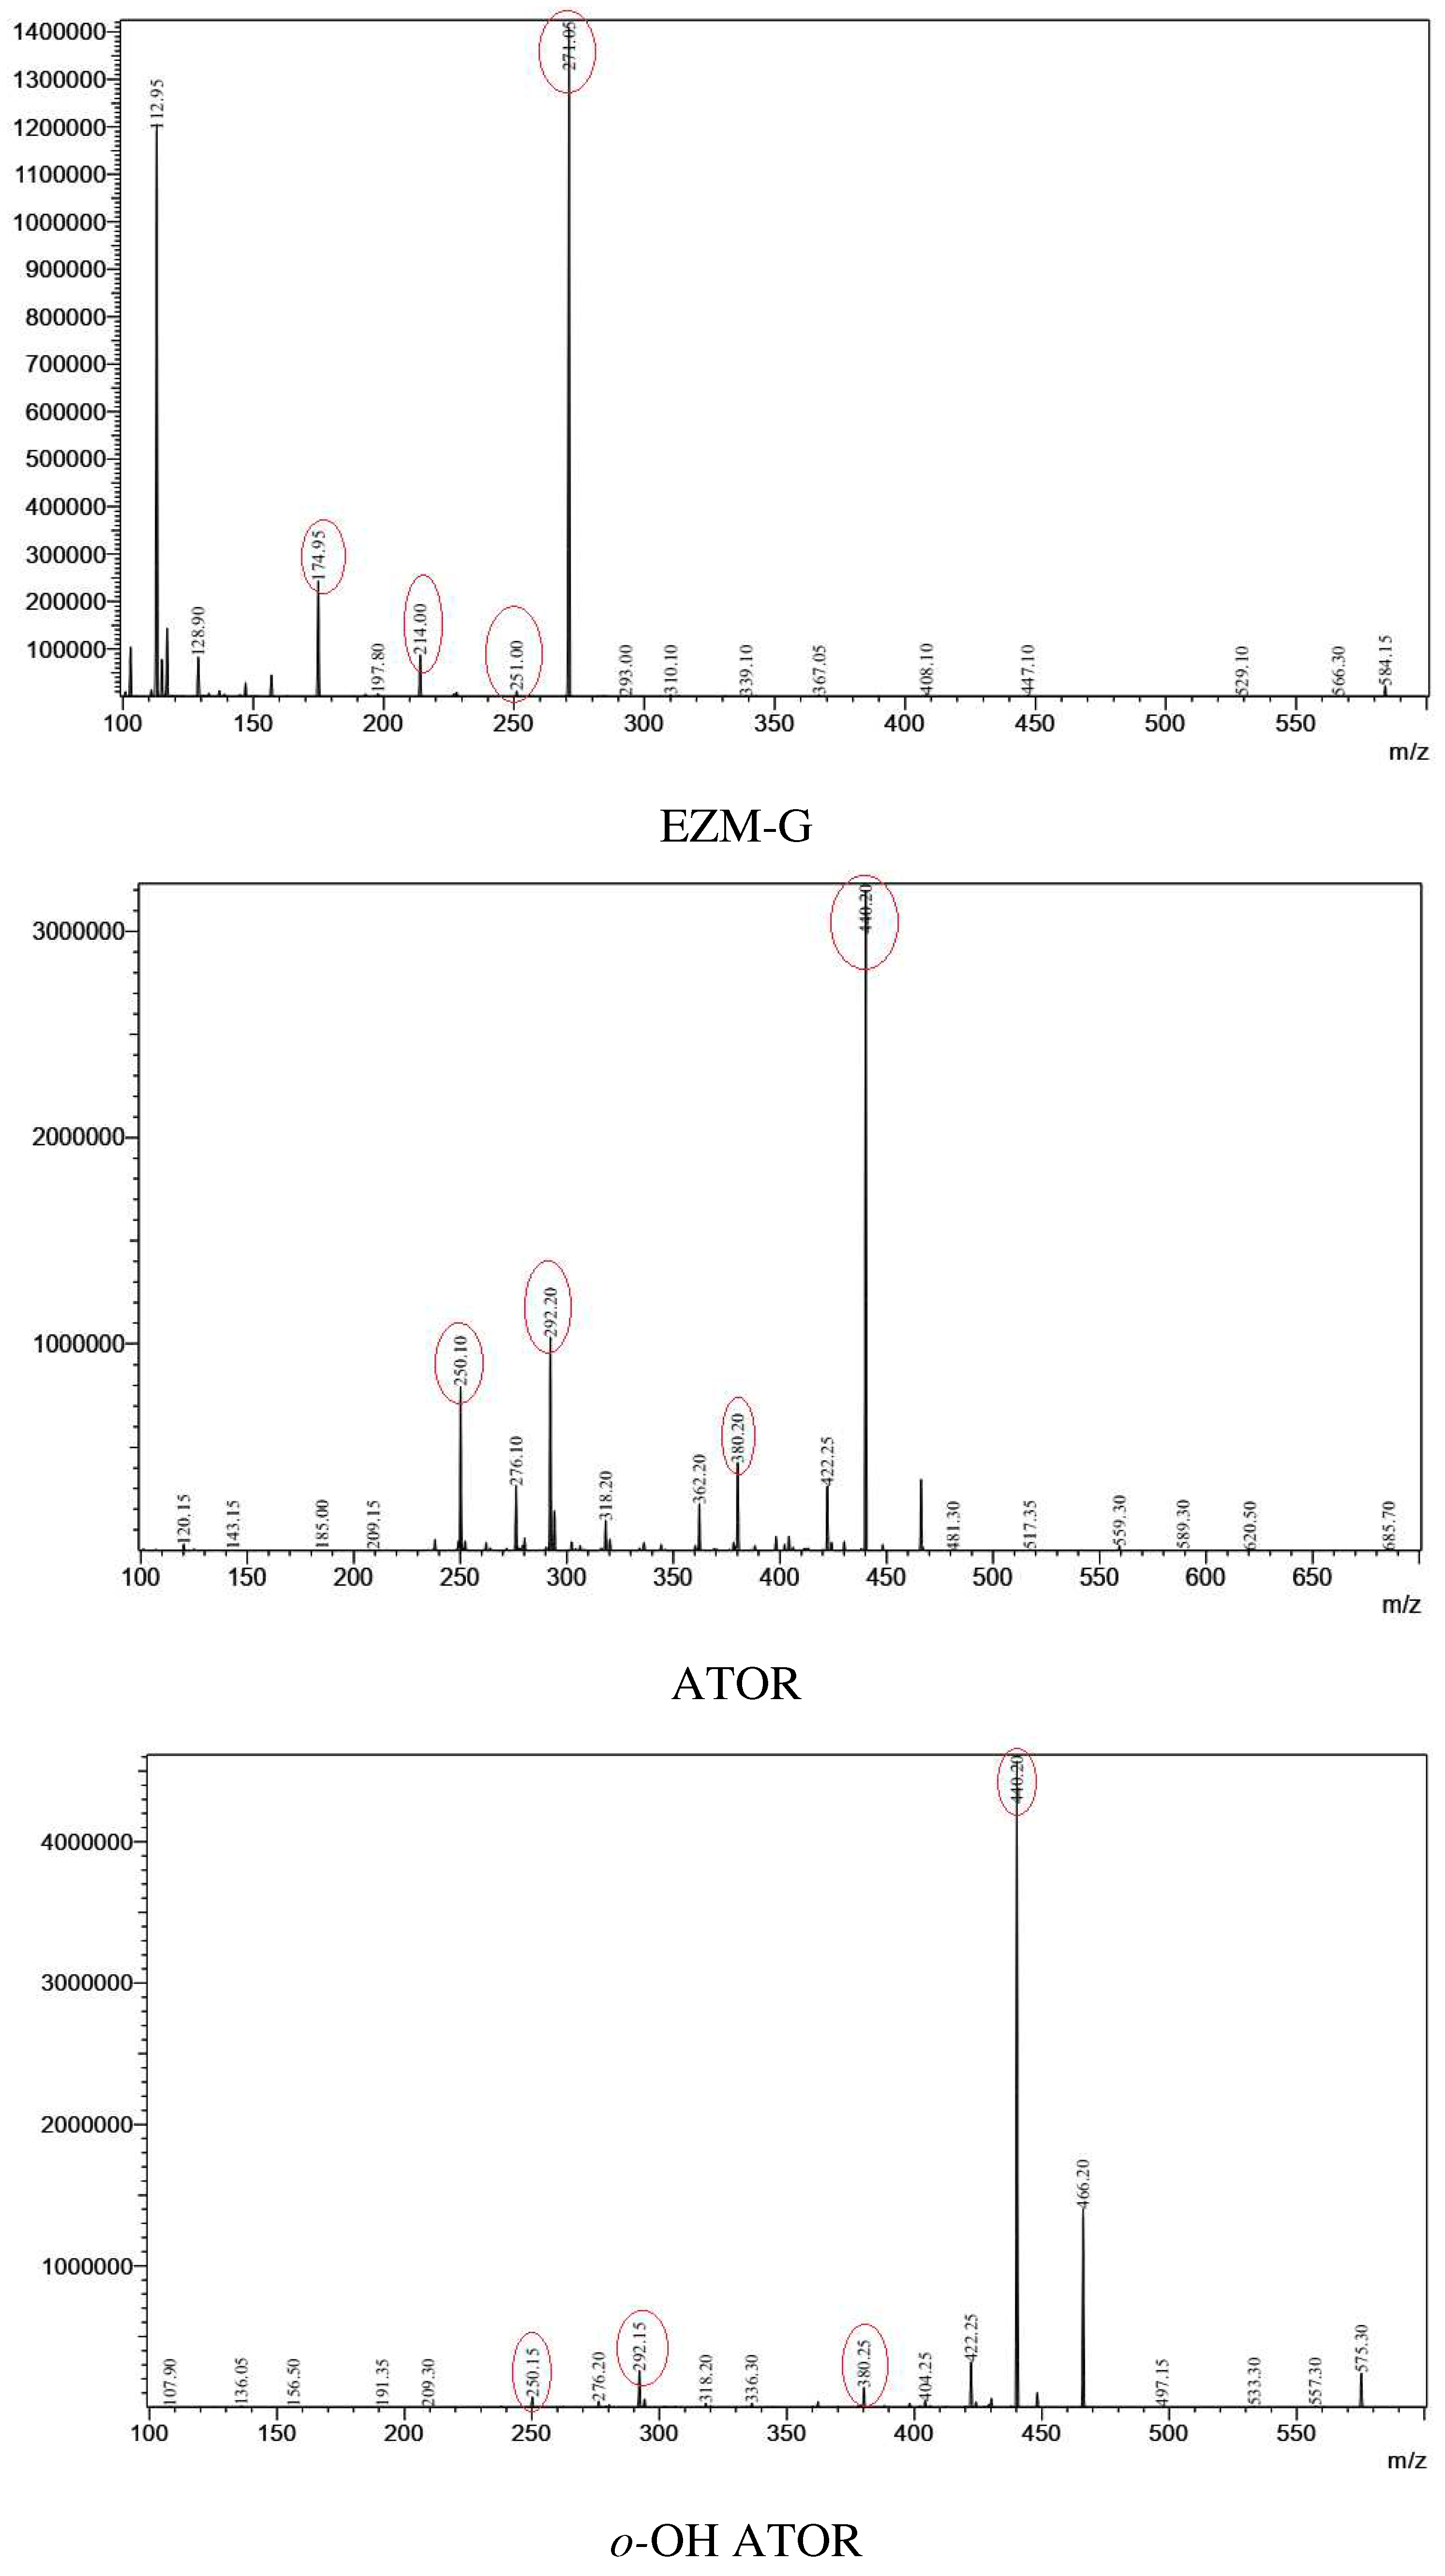
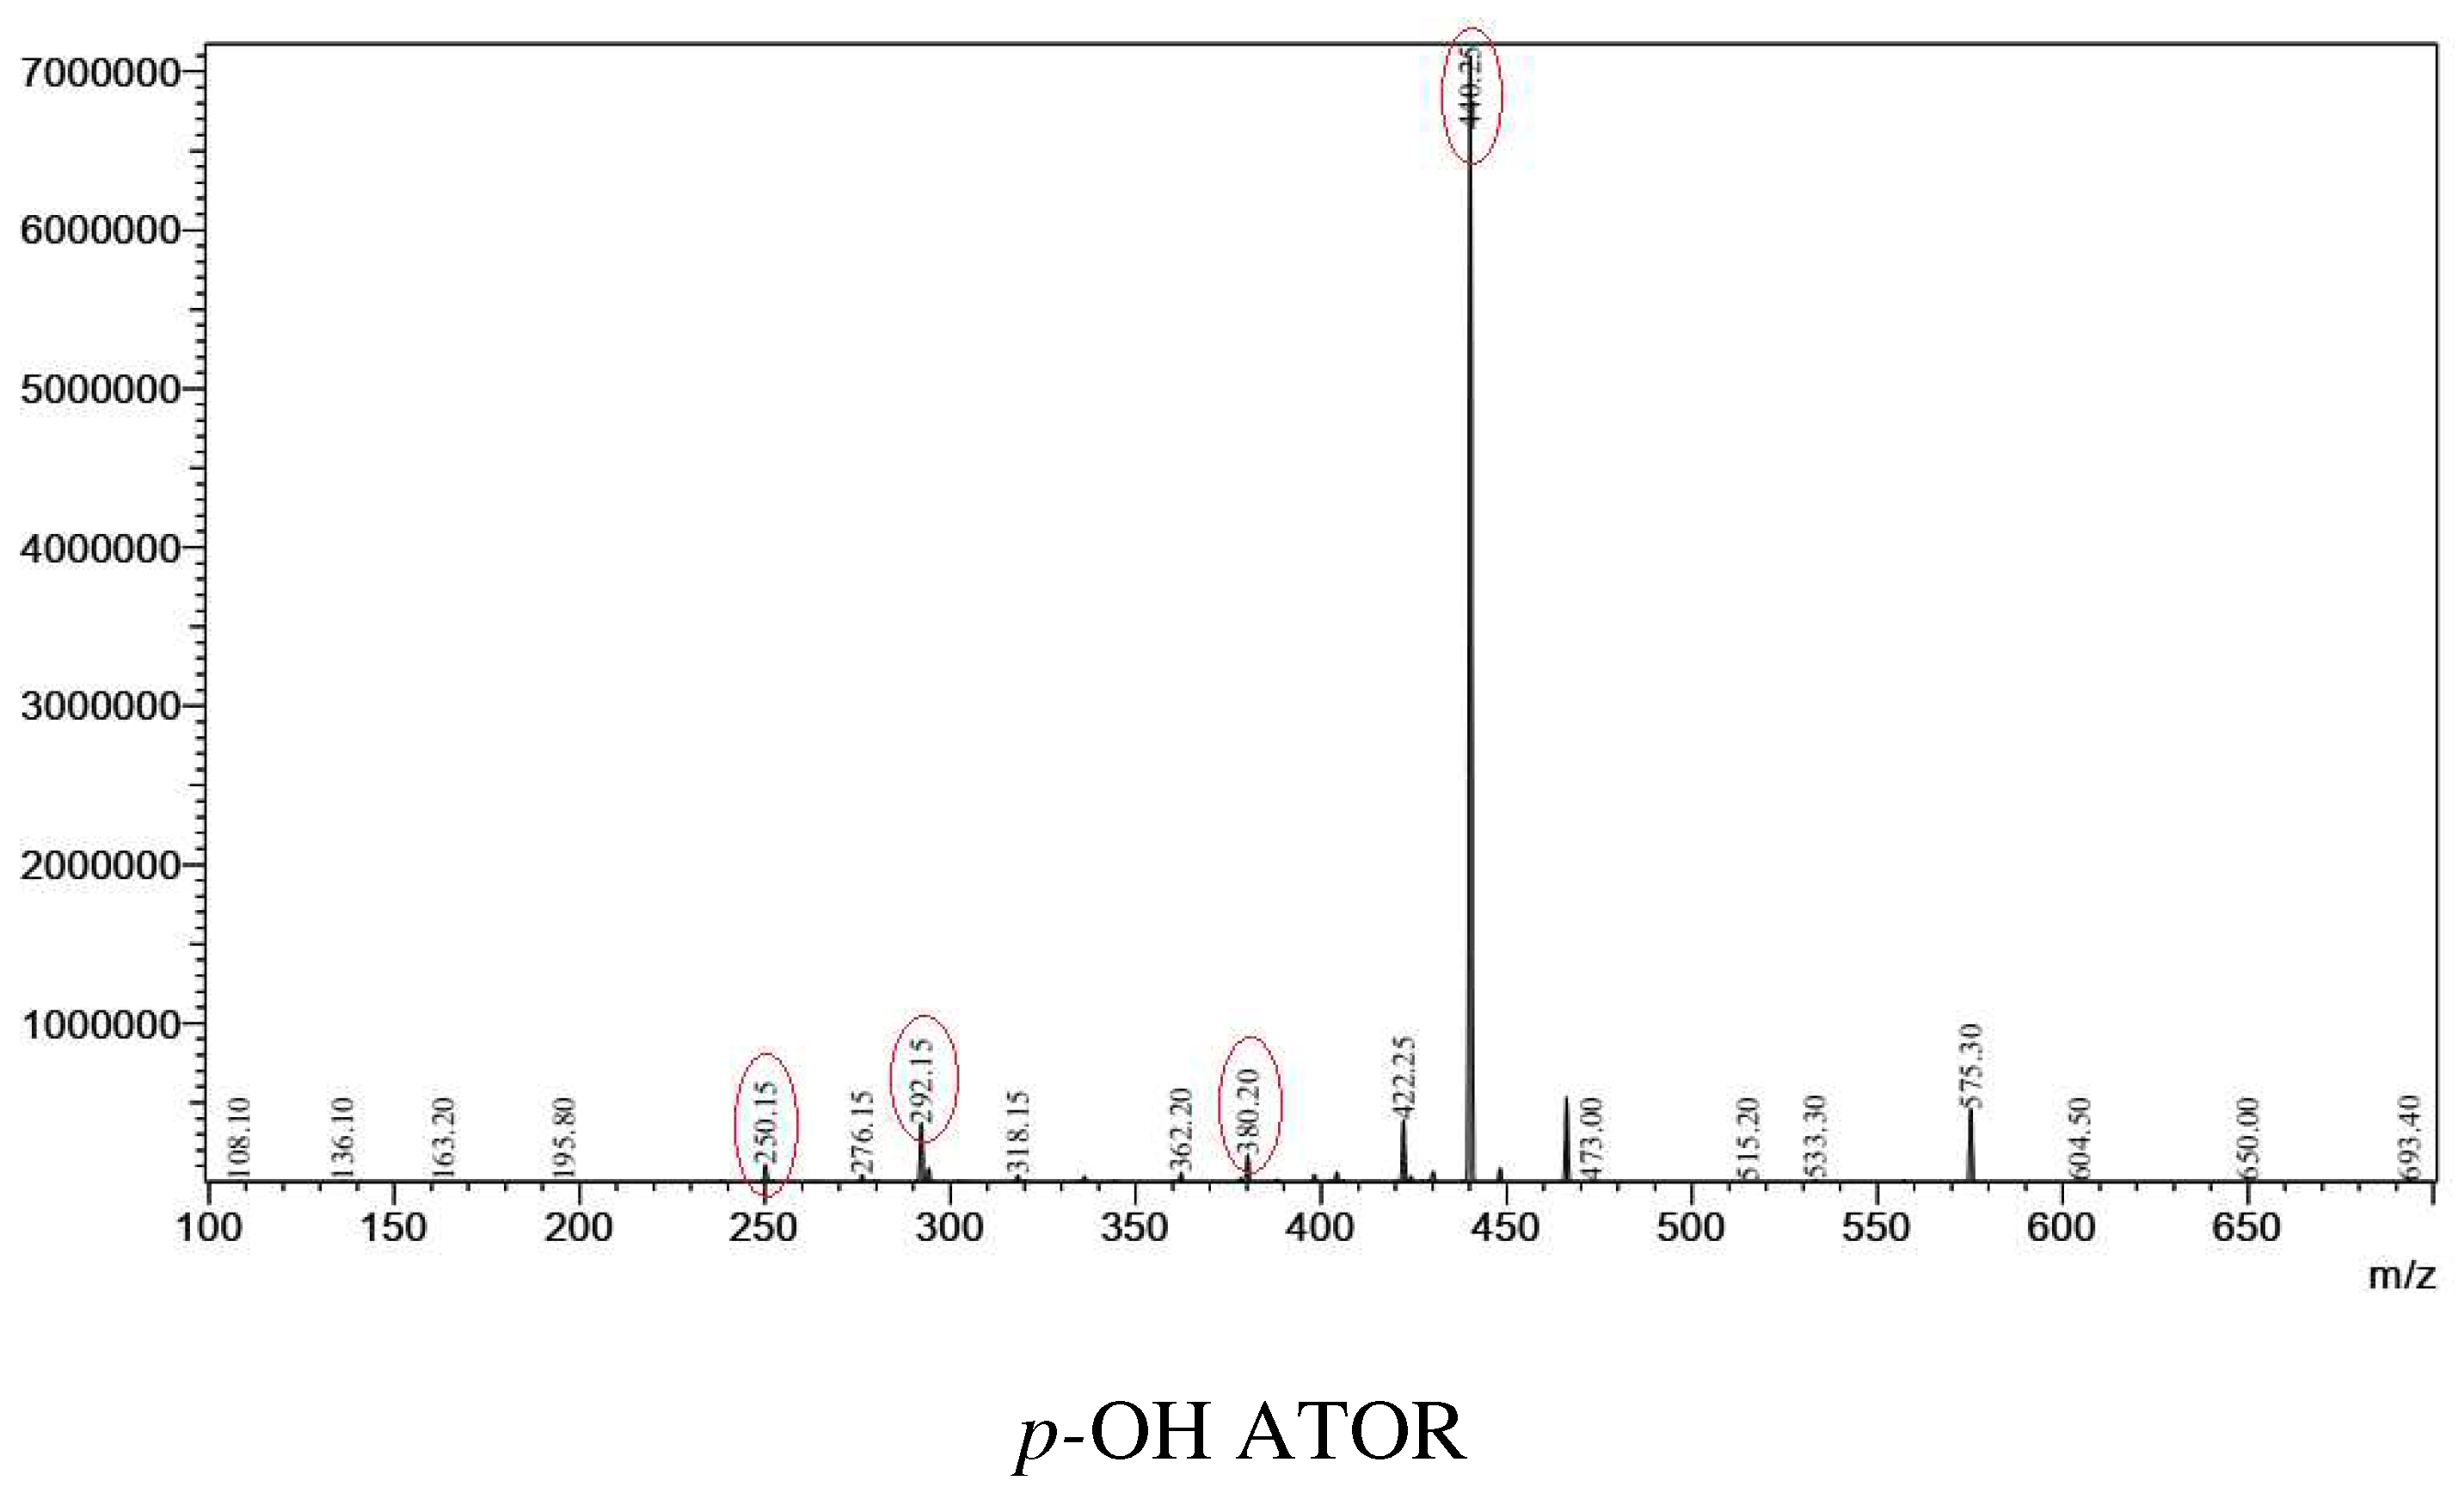
| Analytes | Sources | Parent ions (m/z) | CE (V) |
Daughter ions (m/z) | |
|---|---|---|---|---|---|
| Quantitative ions | Reference ions | ||||
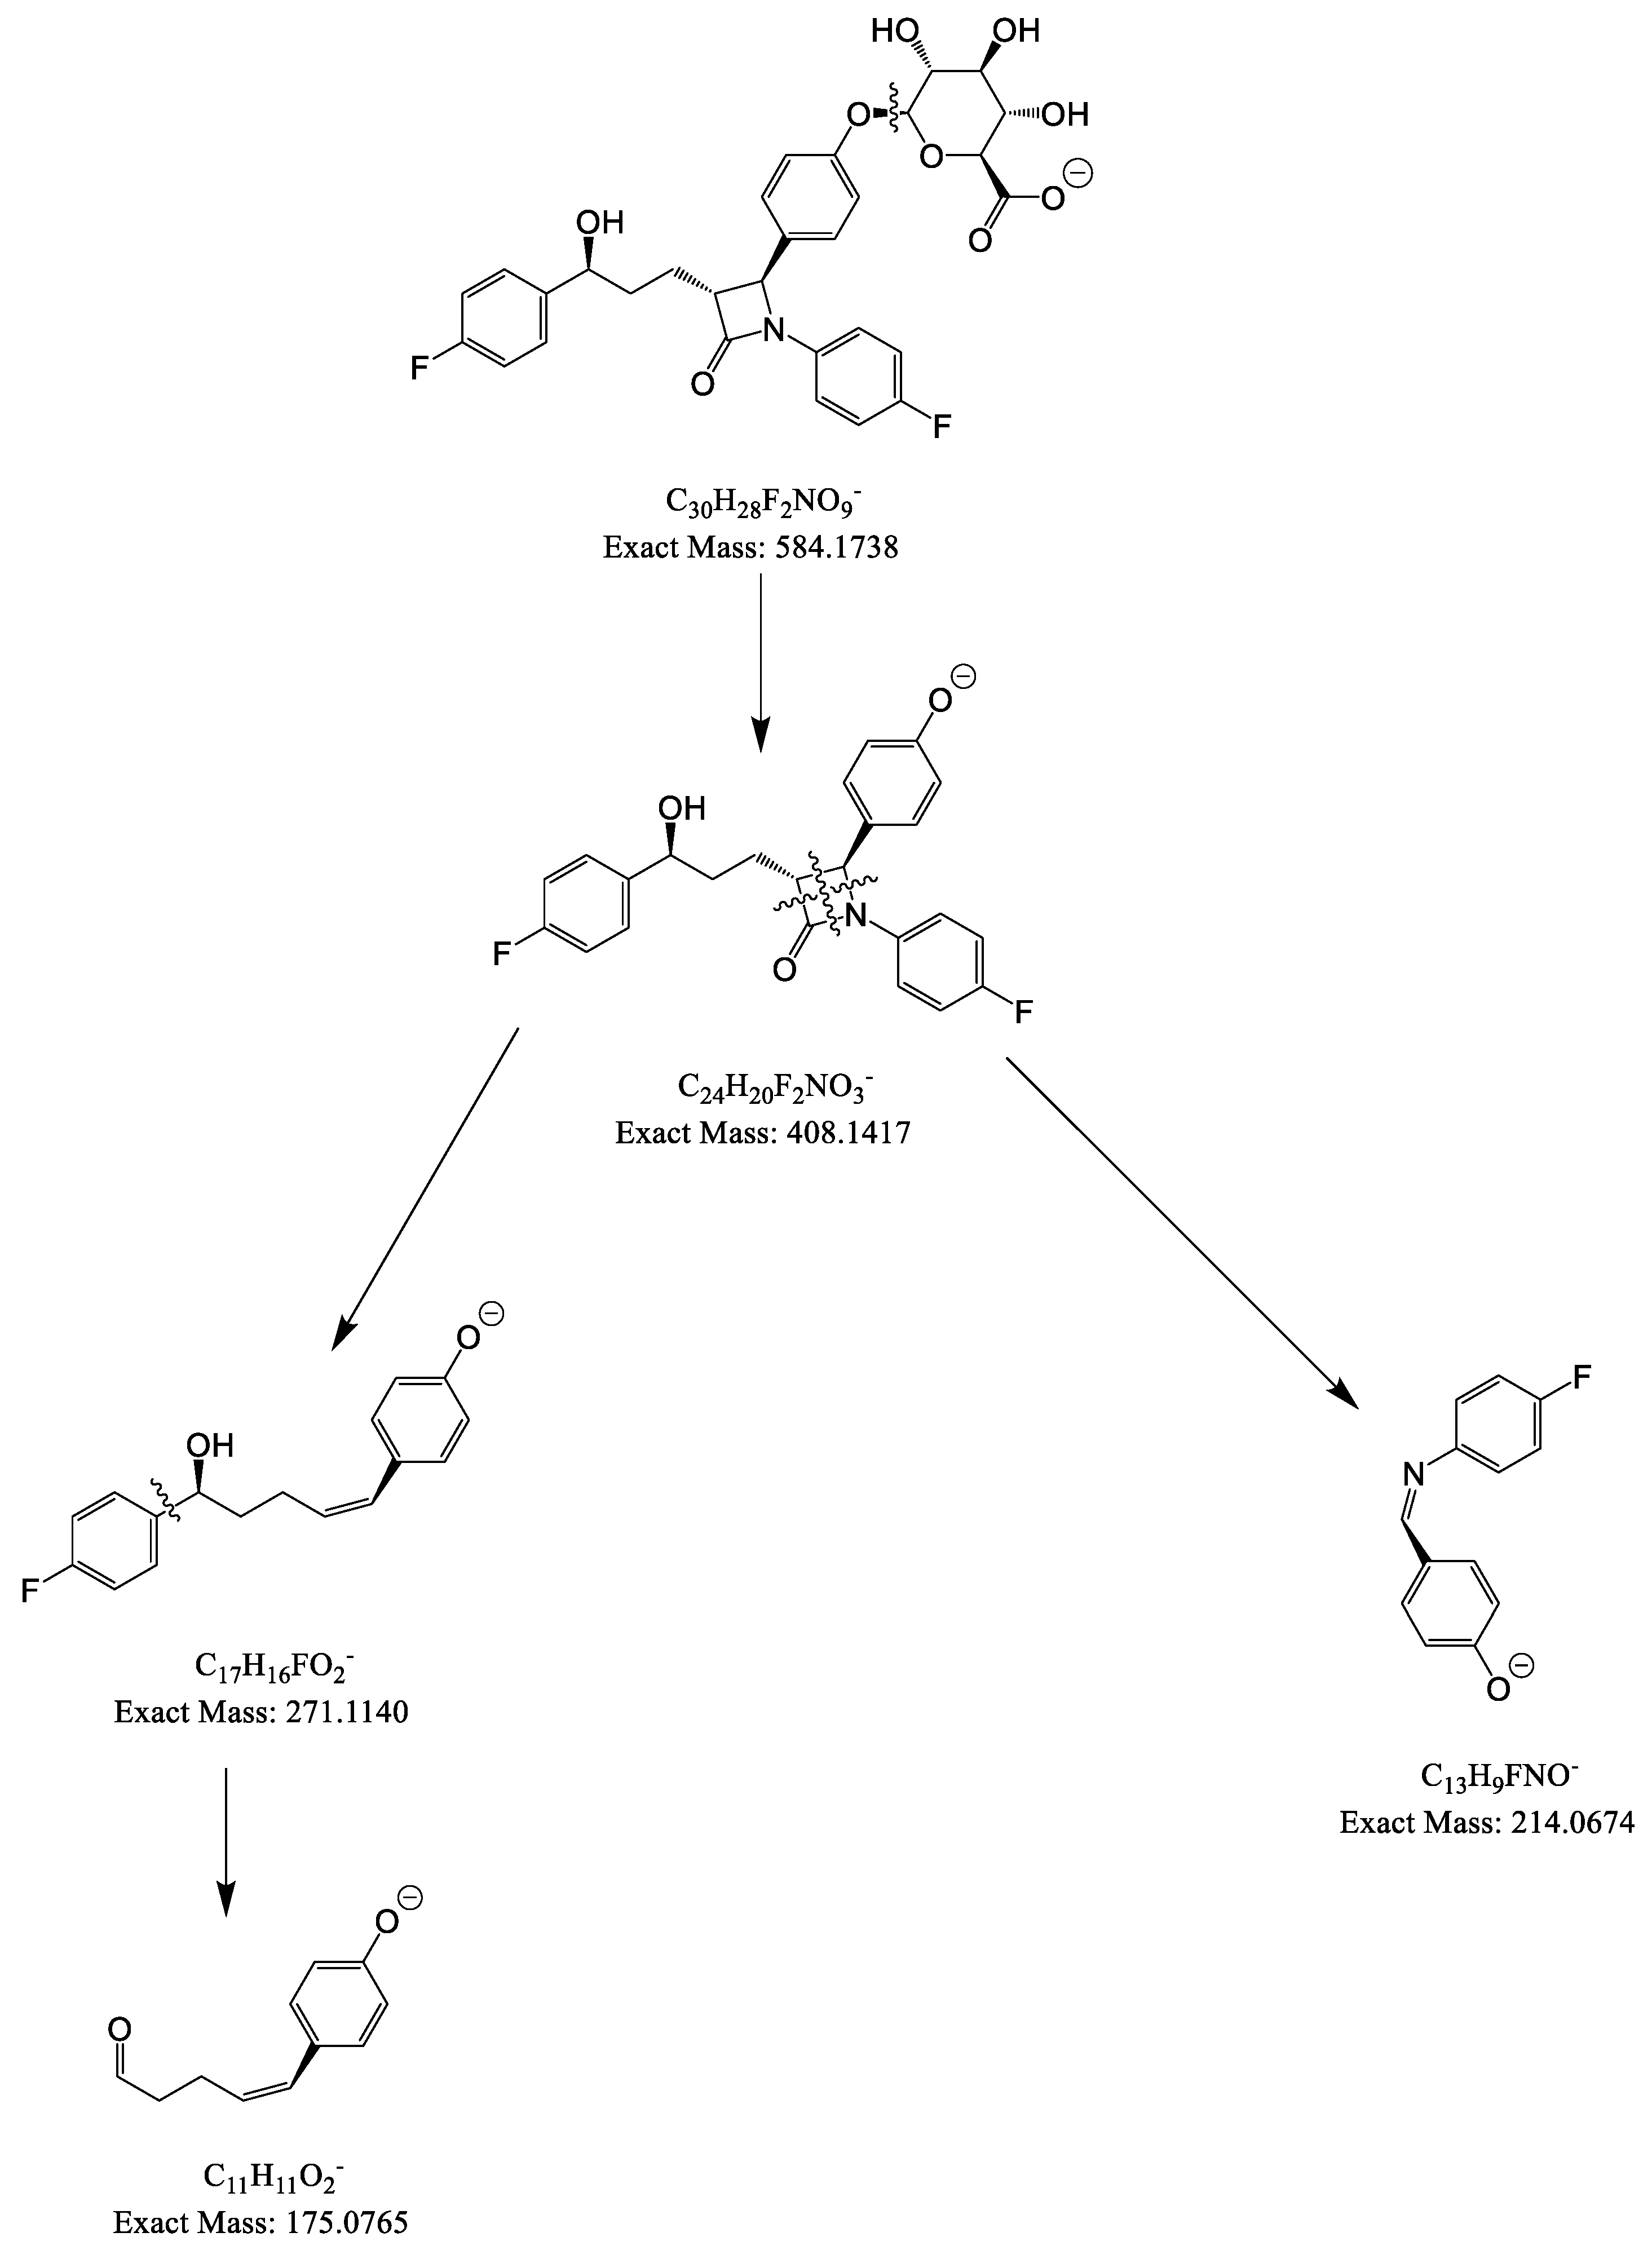
| EZM | ESI (-) | 408 | 17 | 271 | 284, 214, 175 |
| EZM-G | ESI (-) | 584 | 31 | 271 | 284, 214, 175 |
| ATOR | ESI (+) | 559 | -23 | 440 | 380, 292, 250 |
| o-OH ATOR | ESI (+) | 575 | -24 | 440 | 380, 292, 250 |
| p-OH ATOR | ESI (+) | 575 | -24 | 440 | 380, 292, 250 |
3.2. Optimization of sample preparation
3.3. Method validation
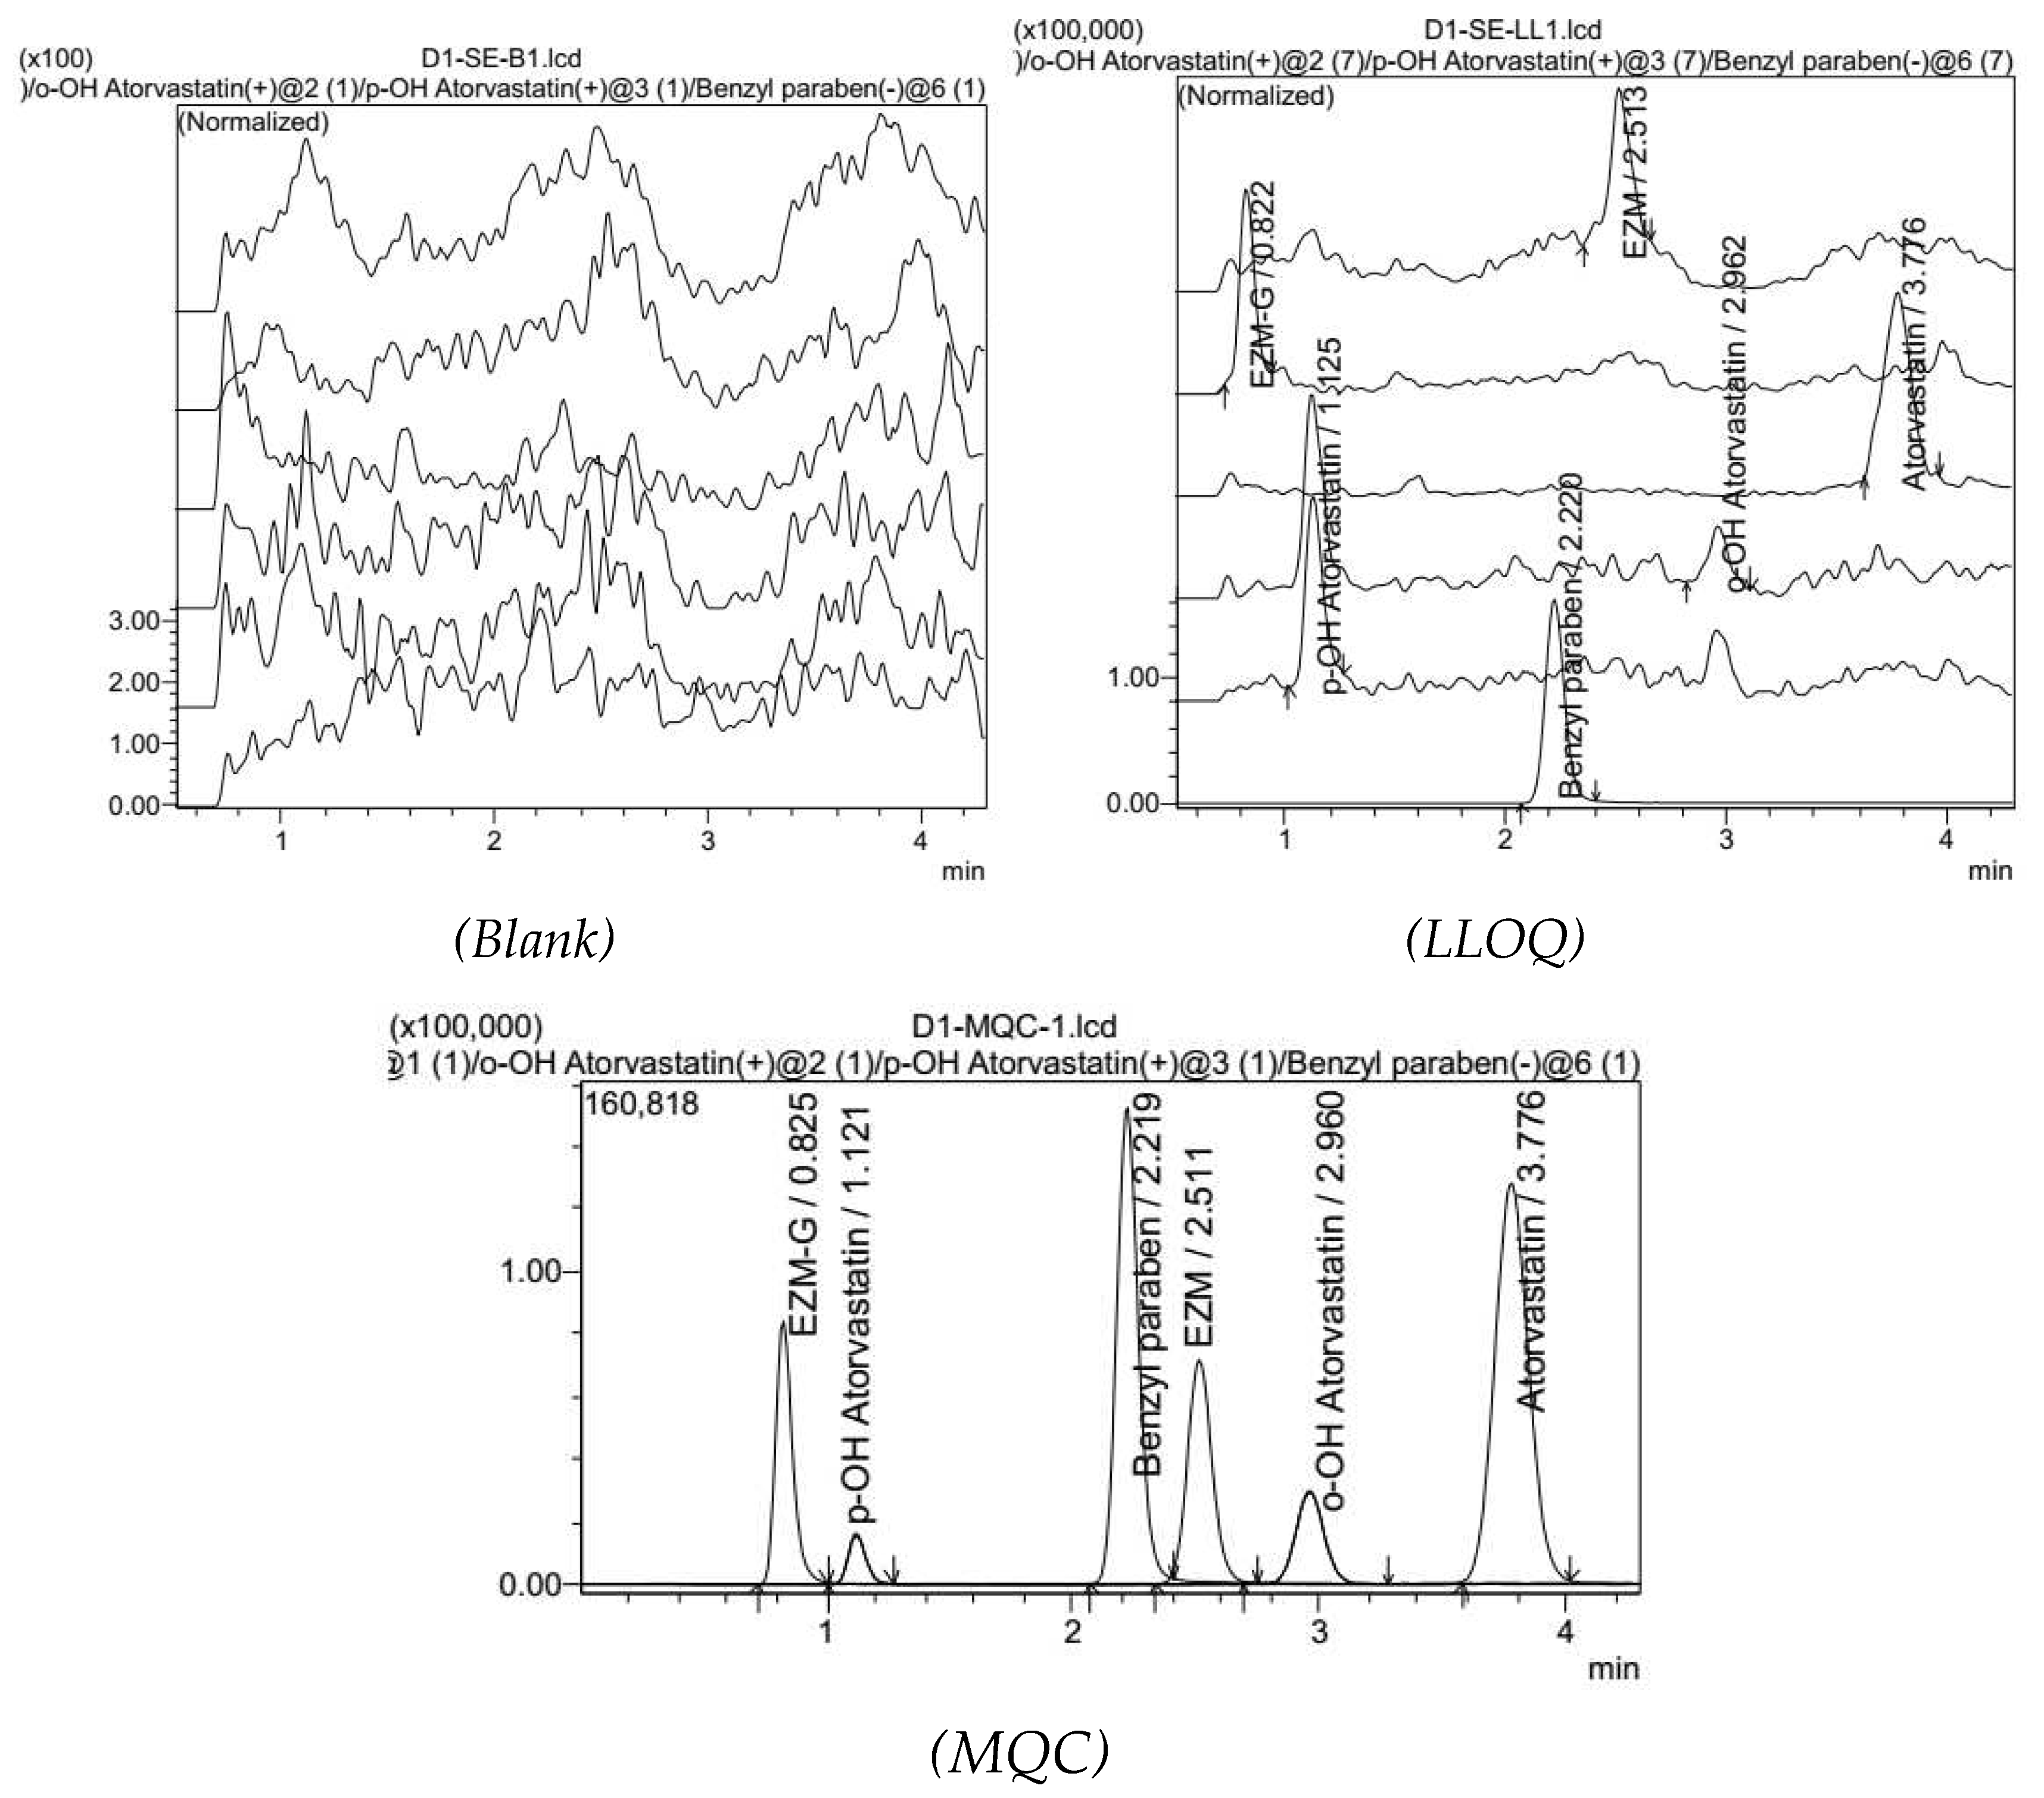
3.3.1. Specifications, selectivity
3.3.2. Linearity
| Analyte | Range (ng/mL) |
Equation ŷ = ax + b, weighting factor 1/x2 | ||
|---|---|---|---|---|
| a | b | R2 | ||
| EZM | 0.06–15 | 0.0688 | 0.0007 | 0.9974 |
| EZM-G | 0.6–150 | 0.0060 | -0.0001 | 0.9941 |
| ATOR | 0.4–100 | 0.0265 | -0.0008 | 0.9951 |
| o-OH ATOR | 0.12–30 | 0.0147 | -0.0003 | 0.9959 |
| p-OH ATOR | 0.05–3 | 0.0595 | -0.0001 | 0.9932 |
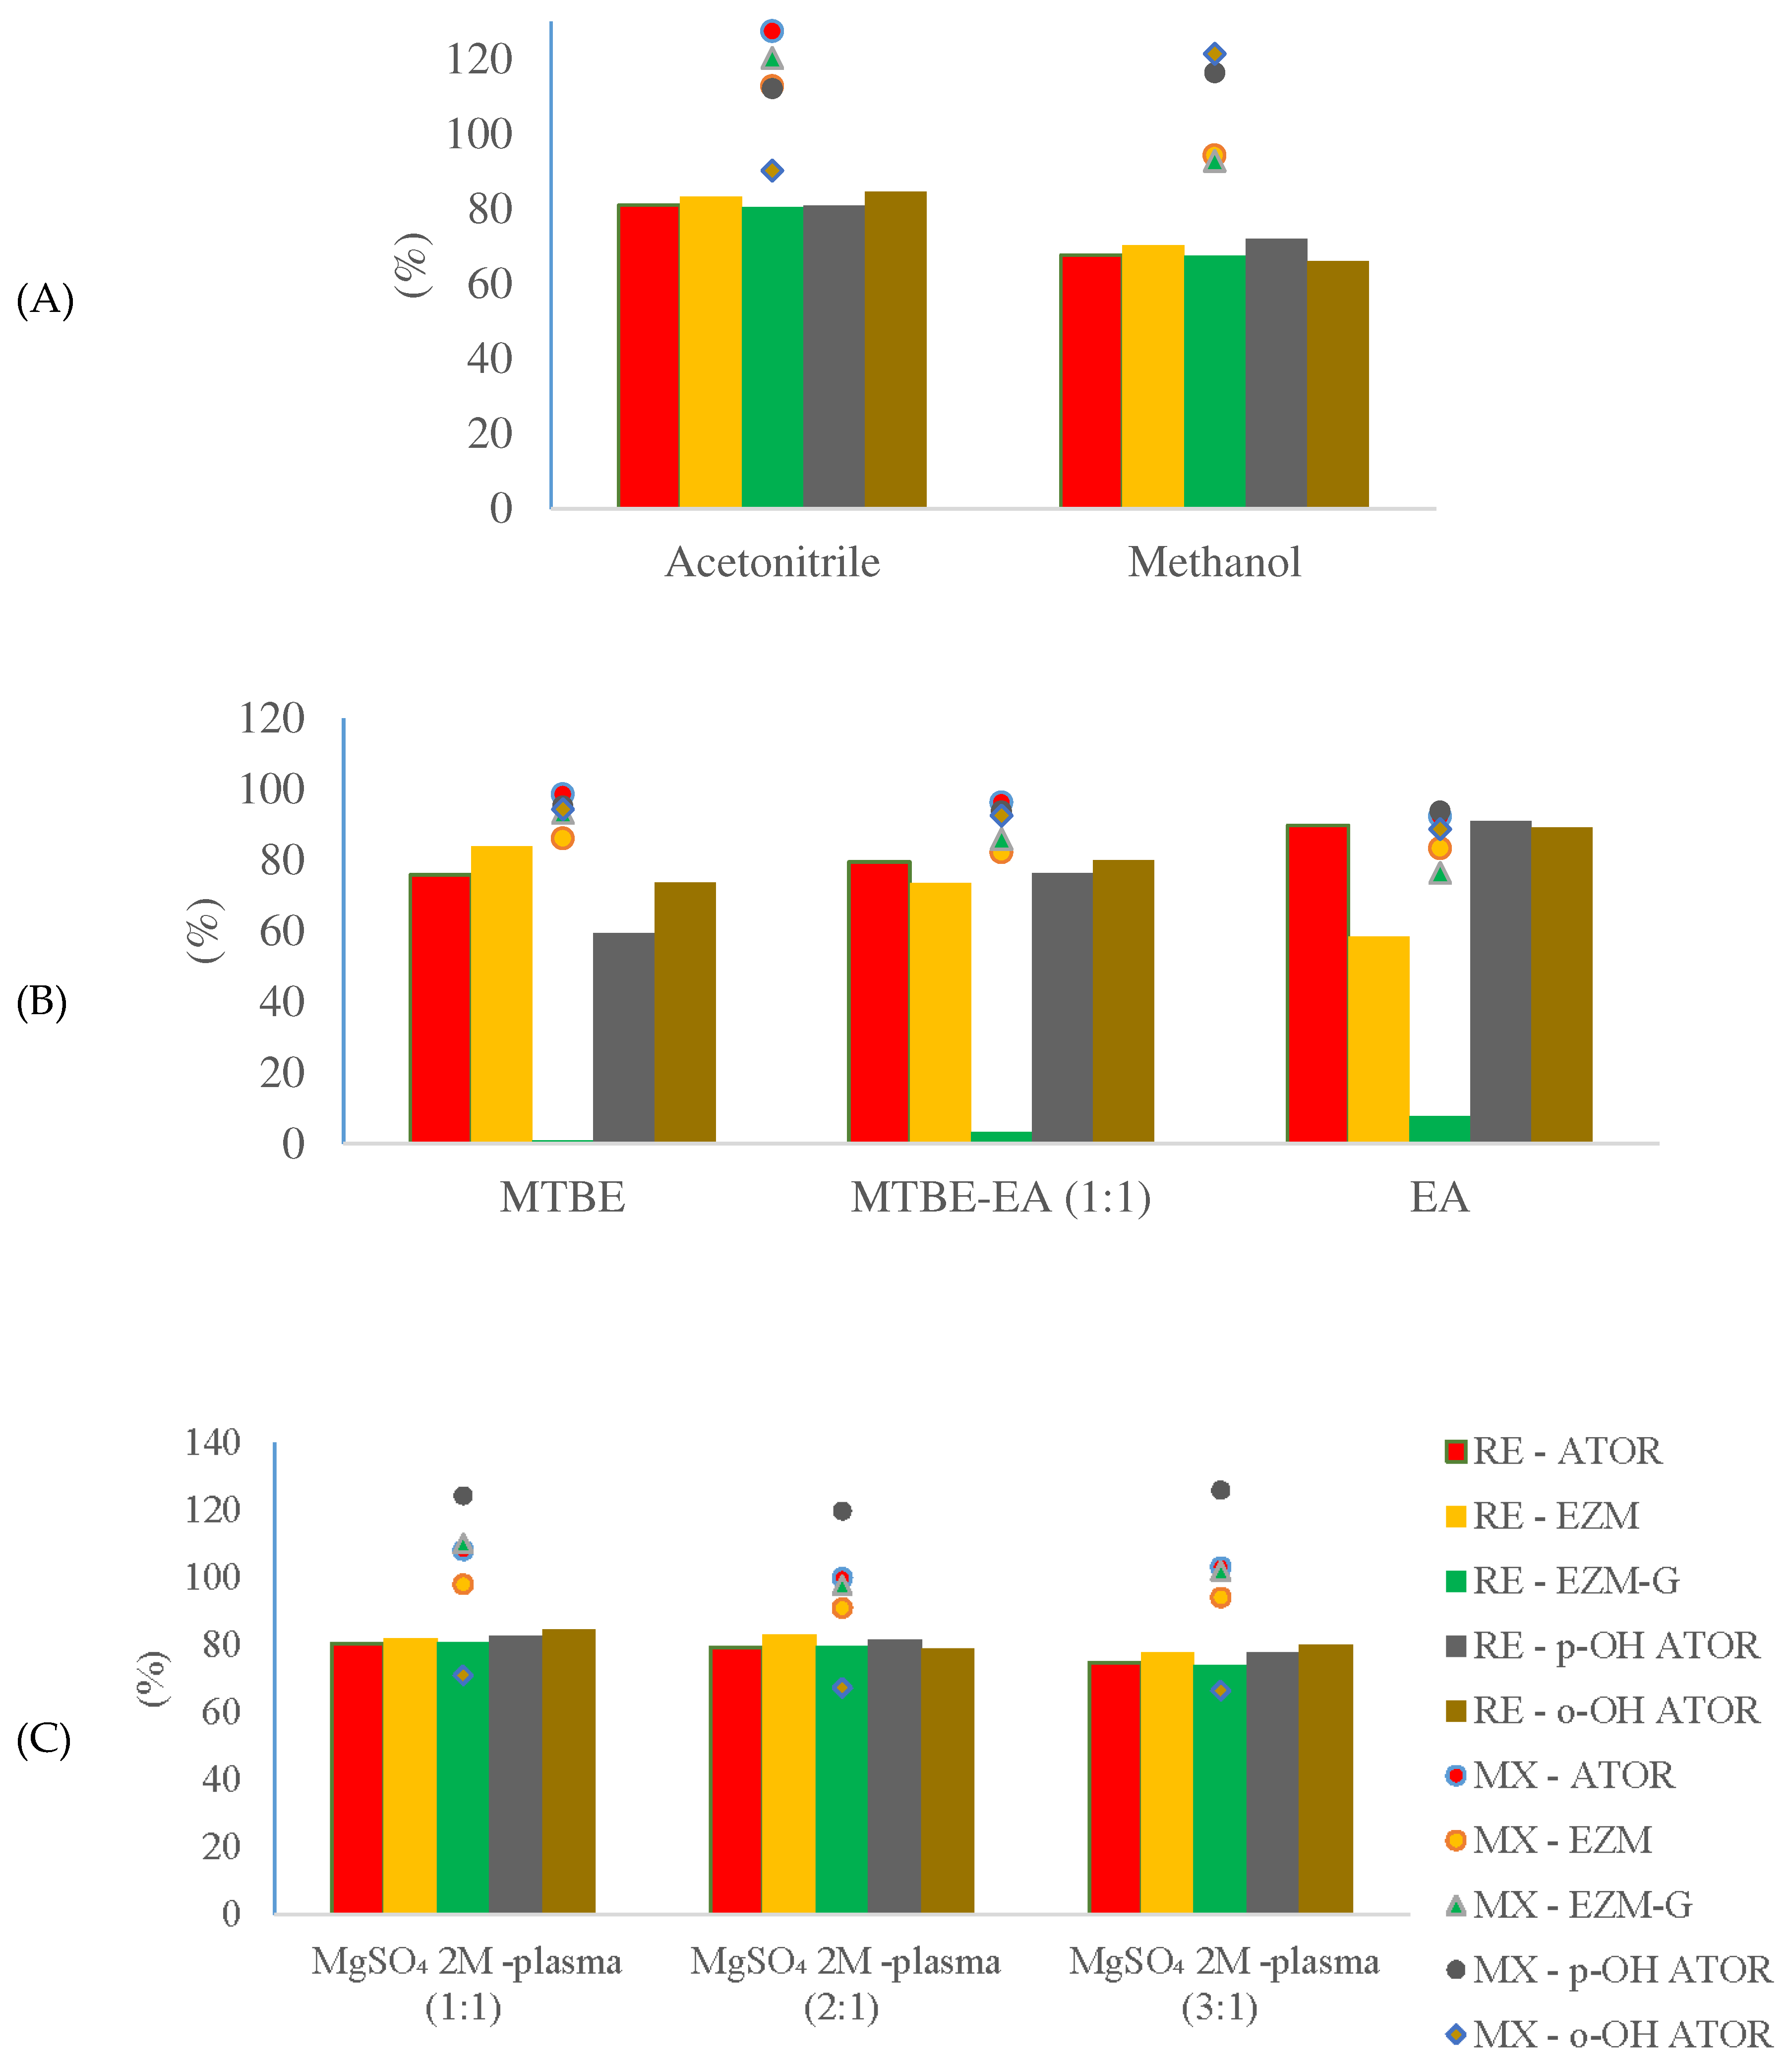
3.3.3. Recovery and matrix effect
3.3.4. Accuracy and precision
3.3.5. Low limit of qualification
3.3.6. Carry-over
3.3.7. Stability
3.4. Comparison to previous analytical methods
4. Conclusions
Author Contributions
Funding
Informed Consent Statement
Data Availability Statement
Conflicts of Interest
References
- ACC/AHA. Clinical practice guideline: 2018 AHA/ACC/AACVPR/AAPA/ABC/ACPM/ADA/AGS/APhA/ASPC/NLA/PCNA Guideline on the Management of Blood Cholesterol. 2018.
- Lennernäs, Hans. Clinical pharmacokinetics of atorvastatin. Clinical pharmacokinetics 2003, 42, 1141–1160. [CrossRef] [PubMed]
- FDA. Draft Guidance on Atorvastatin Calcium and Ezetimibe. 2014.
- Macwan, Joyce S., et al. Development and validation of a sensitive, simple, and rapid method for simultaneous quantitation of atorvastatin and its acid and lactone metabolites by liquid chromatography-tandem mass spectrometry (LC-MS/MS). Analytical and bioanalytical chemistry 2011, 400, 423–433. [CrossRef] [PubMed]
- Ghosh, Chinmoy, et al. Simultaneous estimation of atorvastatin and its two metabolites from human plasma by ESI-LC-MS/MS. Drug Testing and Analysis. 2011, 3, 352–362. [Google Scholar] [CrossRef] [PubMed]
- El-Zailik, Asma, et al. Simultaneous LC–MS/MS analysis of simvastatin, atorvastatin, rosuvastatin and their active metabolites for plasma samples of obese patients underwent gastric bypass surgery. Journal of pharmaceutical and biomedical analysis 2019, 164, 258–267. [Google Scholar] [CrossRef] [PubMed]
- Hermann, Margaret, H. Christensen, and J. L. E. Reubsaet. Determination of atorvastatin and metabolites in human plasma with solid-phase extraction followed by LC–tandem MS. Analytical and bioanalytical chemistry 2005, 382, 1242–1249. [Google Scholar] [CrossRef] [PubMed]
- Nirogi, Ramakrishna VS, et al. Simultaneous quantification of atorvastatin and active metabolites in human plasma by liquid chromatography–tandem mass spectrometry using rosuvastatin as internal standard. Biomedical chromatography 2006, 3, 924–936. [Google Scholar] [CrossRef]
- Partani, Pankaj, et al. Simultaneous quantitation of atorvastatin and its two active metabolites in human plasma by liquid chromatography/(–) electrospray tandem mass spectrometry. Journal of pharmaceutical analysis. 2014, 4, 26–36. [Google Scholar] [CrossRef] [PubMed]
- Zhou, Ying, et al. Development and validation of a liquid chromatography–tandem mass spectrometry method for simultaneous determination of amlodipine, atorvastatin and its metabolites ortho-hydroxy atorvastatin and para-hydroxy atorvastatin in human plasma and its application in a bioequivalence study. Journal of Pharmaceutical and Biomedical Analysis 2013, 83, 101–107. [Google Scholar] [CrossRef]
- Kosoglou, Teddy, et al. Ezetimibe: a review of its metabolism, pharmacokinetics and drug interactions. Clinical pharmacokinetics 2005, 44, 467–494. [Google Scholar] [CrossRef] [PubMed]
- Bahrami, Gholamreza, et al. Application of one-step liquid chromatography–electrospray tandem MS/MS and collision-induced dissociation to quantification of ezetimibe and identification of its glucuronated metabolite in human serum: A pharmacokinetic study. Journal of Chromatography B. 2010, 878, 2789–2795. [Google Scholar] [CrossRef]
- Bae, Jung-Woo, et al. Analytical LC-MS/MS method for ezetimibe and its application for pharmacokinetic study. Journal of liquid chromatography & related technologies. 2012, 35, 141–152. [CrossRef]
- Danafar, Hossein, and Mehrdad Hamidi. A rapid and sensitive LC–MS method for determination of ezetimibe concentration in human plasma: application to a bioequivalence study. Chromatographia 2013, 76, 1667–1675. [CrossRef]
- Guo, Lin, et al. Simultaneous determination of ezetimibe and its glucuronide metabolite in human plasma by solid phase extraction and liquid chromatography–tandem mass spectrometry. Journal of Chromatography B 2015, 986, 108–114. [CrossRef]
- Elkady, Ehab F., et al. Bioanalytical LC–MS/MS method for simultaneous estimation of atorvastatin, its major active metabolites and ezetimibe. Bioanalysis 2022. [CrossRef]
| Analyte | Conc. added (ng/mL) | Accuracy (%) Mean (CV) |
Recovery (n=6) (%) |
Matrix effect (n=6) | ||
|---|---|---|---|---|---|---|
| Intraday (n=6) |
Interday (3 days, n=18) |
MF (%) | IS-normalized MFs (%) | |||
| EZM | 0.061 | 111.69 (5.86) | 98.77 (11.79) | - | - | - |
| 0.184 | 105.77 (4.69) | 103.09 (6.01) | 68.57 ± 1.91 | 106.58 ± 9.47 | 113.5 ± 9.46 | |
| 7.664 | 103.17 (1.66) | 101.49 (2.20) | 82.62 ± 3.86 | - | - | |
| 12.263 | 102.17 (1.89) | 101.28 (3.61) | 82.07 ± 3.28 | 90.98 ± 1.82 | 100.56 ± 2.19 | |
| EZM-G | 0.600 | 102.32 (6.65) | 97.09 (8.84) | - | ||
| 1.801 | 96.13 (3.33) | 99.91 (5.76) | 91.50 ± 5.19 | 85.94 ± 1.13 | 75.72 ± 5.99 | |
| 75.029 | 96.19 (2.41) | 95.29 (2.33) | 85.61 ± 4.80 | - | ||
| 120.046 | 96.42 (2.99) | 94.45 (2.78) | 87.10 ± 2.68 | 91.30 ± 1.88 | 90.79 ± 2.35 | |
| ATOR | 0.400 | 112.68 (4.05) | 104.52 (7.73) | - | - | - |
| 1.200 | 99.00 (3.86) | 103.06 (5.66) | 82.09 ± 4.23 | 104.03 ± 1.95 | 110.78 ± 2.95 | |
| 50.000 | 98.53 (1.62) | 102.79 (3.33) | 81.48 ± 4.26 | - | - | |
| 79.999 | 96.56 (2.81) | 100.98 (5.39) | 81.39 ± 3.09 | 98.24 ± 1.74 | 108.59 ± 2.25 | |
| o-OH ATOR | 0.122 | 103.51 (14.18) | 99.17 (11.50) | - | - | - |
| 0.366 | 107.71 (4.47) | 102.80 (7.43) | 74.37 ± 3.27 | 103.11 ± 3.58 | 93.07 ± 3.08 | |
| 15.261 | 113.82 (0.38) | 108.33 (6.83) | 75.37 ± 4.13 | - | - | |
| 24.418 | 111.33 (2.31) | 107.12 (5.75) | 77.36 ± 3.55 | 99.76 ± 1.73 | 91.87 ± 1.14 | |
| p-OH ATOR | 0.050 | 98.56 (5.22) | 101.98 (6.18) | - | - | - |
| 0.149 | 98.80 (4.31) | 100.76 (7.85) | 80.69 ± 4.27 | 129.18 ± 5.11 | 137.56 ± 5.67 | |
| 1.548 | 92.51 (1.81) | 101.24 (8.19) | 80.13 ± 4.80 | - | - | |
| 2.476 | 89.56 (0.75) | 101.46 (9.99) | 83.02 ± 2.11 | 129.28 ± 1.32 | 142.9 ± 0.86 | |
| IS | 50.000 | 80.01 ± 3.35* | 92.19 ± 1.93 ** | - | ||
| Compound | Stock standard solution | Plasma | Wet extraction | |||||
|---|---|---|---|---|---|---|---|---|
| Conc. (μg/mL) |
Bench-top | Long-term | Conc. (ng/mL) | Bench-top | Freeze-thaw | Long-term | 45h at 15 oC in an autosampler | |
| EZM | 187.5 | 100.52 (0.82) | 100.80 (0.92) | 0.184 | 104.07 (4.45) |
106.50 (4.92) |
103.86 (6.74) | 103.78 (3.17) |
| 12.263 | 104.91 (0.75) |
104.54 (1.06) |
100.52 (0.71) | 105.45 (1.34) |
||||
| EZM-G | 100 | 94.23 (2.66) | 106.14 (0.89) | 1.801 | 93.76 (3.47) |
93.96 (5.44) |
98.06 (3.58) | 97.92 (5.02) |
| 120.046 | 93.64 (1.59) |
92.86 (1.49) |
100.70 (2.09) | 92.30 (2.43) |
||||
| ATOR | 500 | 103.16 (2.13) | 99.88 (0.67) | 1.200 | 100.87 (2.86) |
102.03 (2.98) |
98.61 (1.71) | 106.52 (3.98) |
| 79.999 | 105.99 (0.62) |
106.44 (1.03) |
99.80 (4.77) | 107.29 (0.85) |
||||
| o-OH ATOR | 60 | 98.66 (2.76) | 100.81 (0.71) | 0.366 | 94.46 (4.53) |
94.54 (3.64) |
88.88 (91.61) | 92.62 (5.47) |
| 24.418 | 97.09 (0.59) |
96.53 (1.11) |
103.76 (6.70) | 97.36 (1.35) |
||||
| p-OH ATOR | 120 | 101.50 (5.34) | 106.08 (1.36) | 0.149 | 100.57 (6.75) |
92.98 (7.24) |
100.39 (2.51) | 101.55 (8.08) |
| 2.476 | 100.04 (2.30) |
99.54 (1.04) |
108.85 (2.27) | 99.45 (2.16) |
||||
| IS | 100 | 101.88 (2.03) | 98.97 (1.00) | 50 | - | - | - | 97.47 (1.06) |
| Ref. | Run time | Extraction technique | Analyte | LLOQ (ng/mL) | Extraction efficiency (%) |
|---|---|---|---|---|---|
| 4 | 7 mins | PPT | ATOR | 0.05 | 88.6–111 |
| o-OH ATOR | 0.05 | ||||
| p-OH ATOR | 0.05 | ||||
| 5 | 3.5 mins | SPE | ATOR | 0.05 | 66.18 |
| o-OH ATOR | 0.05 | 45.36 | |||
| p-OH ATOR | 0.05 | 54.01 | |||
| 6 | 5 mins | LLE | ATOR | 0.25 | 96.94-100.37 |
| o-OH ATOR | 0.25 | 92.15-97.71 | |||
| p-OH ATOR | 0.25 | 96.97-99.17 | |||
| 7 | 20 mins | SPE | ATOR | 0.5 | 53 – 78 |
| o-OH ATOR | 1 | ||||
| p-OH ATOR | 0.5 | ||||
| 8 | 3 mins | LLE | ATOR | 0.1 | 51.0-57.3 |
| o-OH ATOR | 0.1 | 46.8-54.3 | |||
| p-OH ATOR | 0.1 | 61.6-68.8 | |||
| 9 | 6 mins | SPE | ATOR | 0.05 | 76.3-78.0 |
| o-OH ATOR | 0.05 | 73.1-75.1 | |||
| p-OH ATOR | 0.05 | 72.6-75.7 | |||
| 10 | 6 mins | LLE | ATOR | 0.035 | 77.23-82.69 |
| o-OH ATOR | 0.02 | 76.39-81.96 | |||
| p-OH ATOR | 0.015 | 78.24-80.29 | |||
| 12 | 5 mins | PPT | EZM | 10 | Not tested |
| EZM-G | identification | Not tested | |||
| 13 | 4.5 mins | LLE | EZM | 0.075 | 61.6 |
| LLE following deconjugation | Total EZM | 1 | 42.0 | ||
| 14 | 10 mins | LLE | EZM | 0.05 | 96.21-97.27 |
| 15 | 5.5 mins | SPE | EZM | 0.1 | 65.3-72.2 |
| EZM-G | 0.5 | 58.6-61.2 | |||
| 16 | LLE | ATOR | 0.5 | 84.94 | |
| o-OH ATOR | 0.5 | 85.46 | |||
| p-OH ATOR | 0.2 | 105.46 | |||
| EZM | 0.2 | 85.2 | |||
| This study | 4.3 mins | SALLE | ATOR | 0.4 | 81.39-82.09 |
| o-OH ATOR | 0.12 | 74.37-77.36 | |||
| p-OH ATOR | 0.05 | 80.13-83.02 | |||
| EZM | 0.06 | 68.57-82.62 | |||
| EZM-G | 0.6 | 85.61-91.50 |
Disclaimer/Publisher’s Note: The statements, opinions and data contained in all publications are solely those of the individual author(s) and contributor(s) and not of MDPI and/or the editor(s). MDPI and/or the editor(s) disclaim responsibility for any injury to people or property resulting from any ideas, methods, instructions or products referred to in the content. |
© 2023 by the authors. Licensee MDPI, Basel, Switzerland. This article is an open access article distributed under the terms and conditions of the Creative Commons Attribution (CC BY) license (http://creativecommons.org/licenses/by/4.0/).


