1. Introduction
Selenium (Se) is an essential trace element for human beings and for many other lives [
1]. The inherent limitation of Se is its low content in the natural world and particularly in organism. So, se-containing materials have found a widespread applications, ranging from pharmacology to material sciences [
2]. In the last decades, selenylation of polysaccharides has been extensively adopted to develop novel sources of Se supplements and to improve the activity of polysaccharide [
3]. Growing evidence have exhibited that selenized polysaccharides possess novel and/or increased activities such as antioxidant [
3], antitumor [
4], antidiabetic [
5], and immunomodulatory activities [
6]. Se content in the selenized polysaccharide were found had a major influence on the biological activity of selenized polysaccharide [
7]. As reported by Liu and coworkers, the anti-tumor effect of selenized
Artemisia sphaerocephala polysaccharides is positively correlated with Se content (4344-13030 μg·g
-1) [
7]. Lee
et al. obtained similar results when comparing the antioxidant activity of selenized
Ulmus pumila L. polysaccharides with different Se contents [
8]. In summary, selenylation of polysaccharide could improve its biological activities, of which Se content might be one of the key factors [
9,
10].
As a traditional selenylation pattern, the nitric acid-sodium selenite (HNO
3-Na
2SeO
3, NA-SS) method is extensively adopted to prepare a selenium-modified polysaccharide [
11]. Although some other selenylation techniques, like glacial acetic acid-selenous acid (GA-SA), glacial acetic acid-sodium selenite (GA-SS) and selenium oxychloride (SOC) methods were reported capable of selenylizing polysaccharides, the NA-SS selenylation reaction was the most common method adopted [
12]. However, low Se contents of selenized polysaccharides were usually obtained by direct conducting the NA-SS method[
9]. Li
et al reported the Se content of selenized
Grifola frondosa polysaccharide was only 445.39 μg/g by direct using NA-SS method [
13]. Similarly, selenized
Artemisia sphaerocephala polysaccharide with the highest Se content of 1703 μg/g was acquired under optimal reaction conditions with NA-SS method by Wang
et al [
14]. So, it is in urgent need of developing new polysaccharide selenylation system to improve this traditional less effective NA-SS method. The cell walls of marine algae, like carrageenan in red algae, fucoidan in brown algae and ulvan in green algae, are rich in sulfated polysaccharides [
15]. Selenylation modification of these sulfated polysaccharides have been increasingly studied given their high Se contents and potential usefulness in selenium supplement [
16,
17,
18]. So the synthesis of selenized polysaccharide without sulphur group, pre-sulfated modification process might do help to increase the Se content.
Gastrodia elata (
G. elata) Blume, belonging to the Orchidaceae family, is mainly distributed in the mountainous areas of eastern Asia, such as China, Korea and India [
19]. The rhizome of
G. elata is commonly called “Tian ma” in traditional Chinese medicine and has been labeled as a healthy food [
20]. Its main active ingredients were gastrodin, gastrodin aglycone (4-hydroxybenzyl alcohol) and
G. elata polysaccharides (GEP) [
21]. The polysaccharides components are more than 10% dry weight and possess a variety of biological activities [
22]. In 2007, Ding and coworkers firstly isolated two polysaccharides from
G. elata, and sulfated derivatives were prepared using the chlorosulfonic acid-pyridine method [
23]. The anti-dengue virus ability of these sulfated polysaccharides was increased as the degree of sulfation increases [
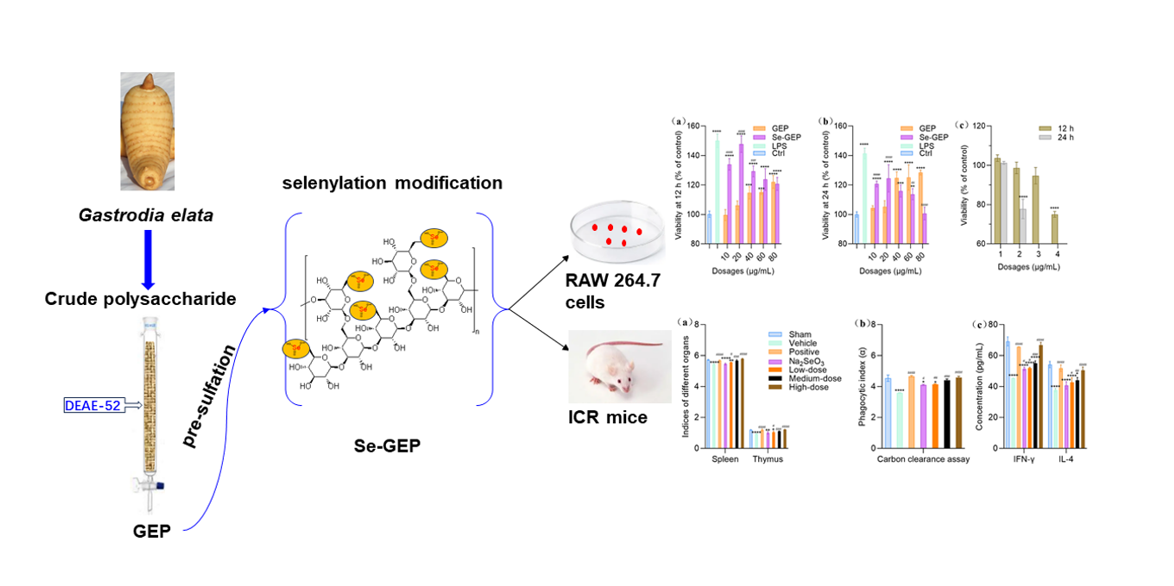
23]. This study describes the preparation and structural characterization of selenized
G. elata polysaccharide, and its immunological activity was also evaluated
in vitro and
in vivo.
2. Results and Discussion
2.1. Physicochemical Analysis
2.1.1. Chemical Analysis and Molecular Weight Determination
In this work, efficient selenylation of GEP was accomplished by selenylation modification of pre-sulfated GEP polysaccharide (S-GEP).
Table 1 summarized the composition of GEP, S-GEP and Se-GEP including total sugar, reducing sugar, protein, uronic acids, molecular weight,
etc. The content of total sugar in GEP was 93.18%. The sulfur content and DS of S-GEP was 7.16% and 0.47, respectively. Under an optimal condition, a maximum Se content of 22,900 μg/g in Se-GEP. As compared with direct selenylation of GEP (D-GEP, 2805 μg/g) by the NA-SS method, pre-sulfation modification’s selenylation efficiency was greatly improved with an approximately 8-fold higher Se content.
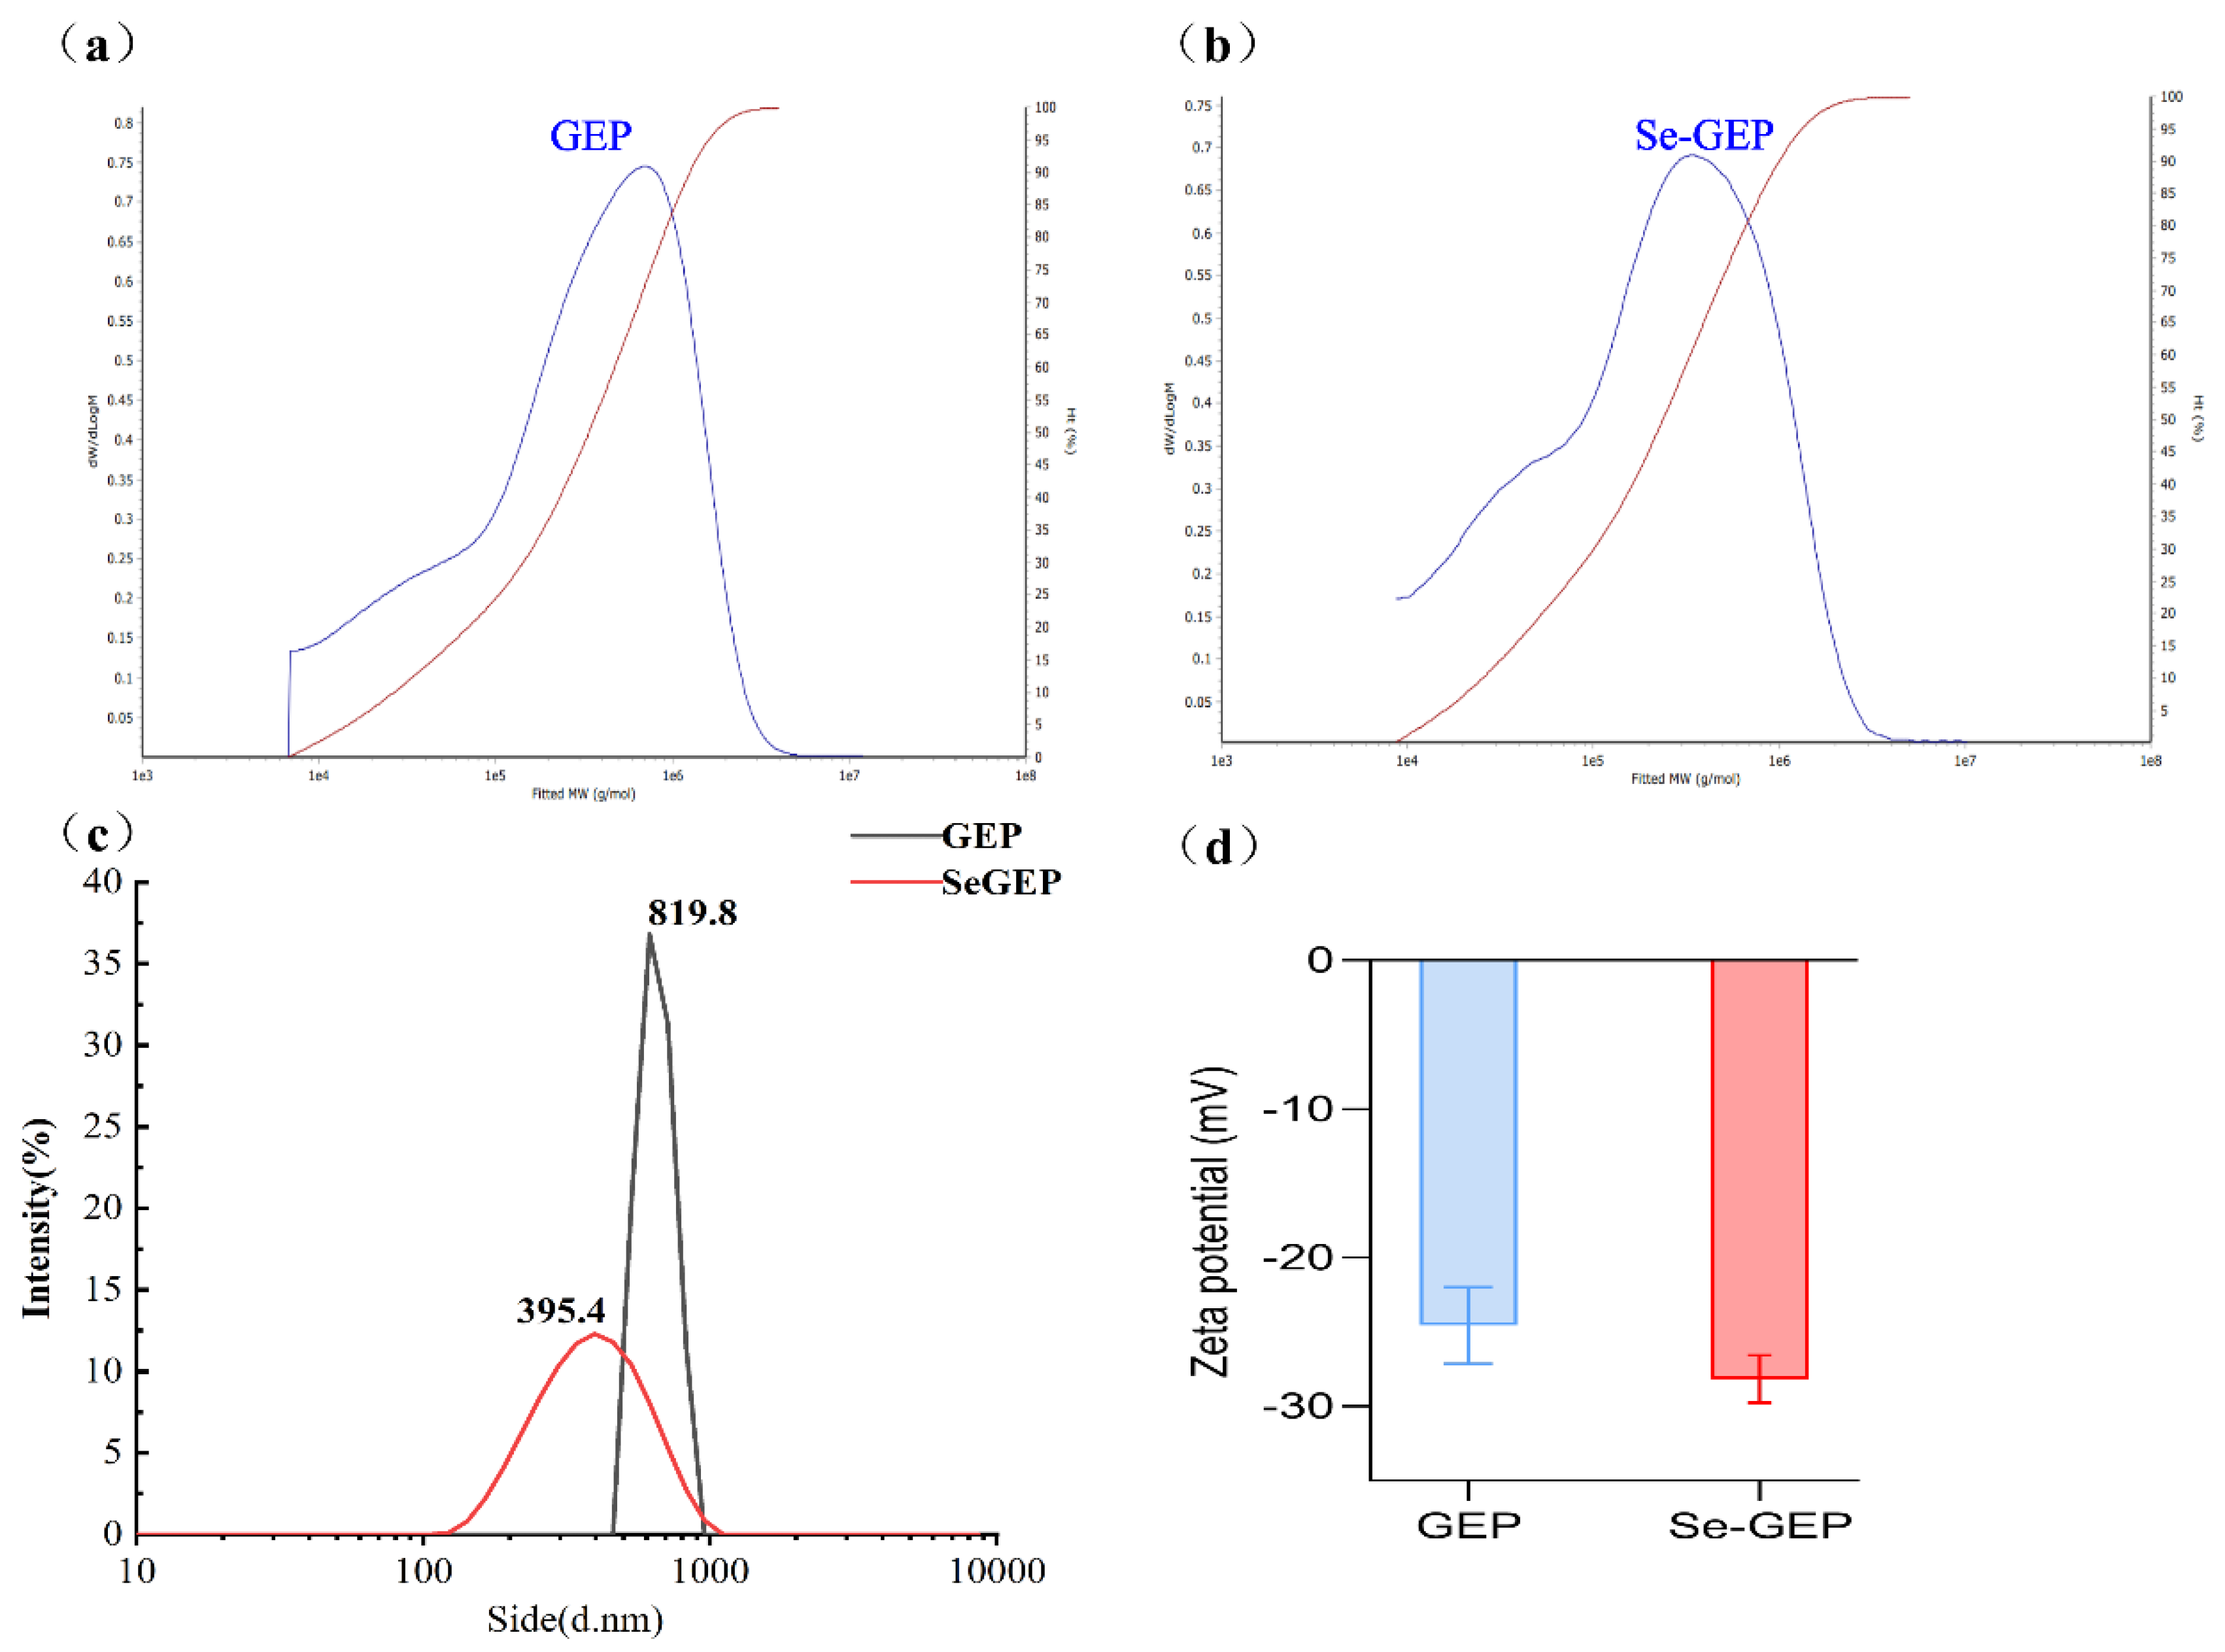
The average molecular weight of GEP and Se-GEP were estimated to be 524.4 kDa and 488.9 kDa by HPGPC method after the calibration with a series of standard Dextrans as referred to in section 3.5.2. as described below (
Figure 1a,b).
2.1.2. Size Distribution and Zeta Potential
The size distribution is an important physical parameter for nanoparticles, as a larger particle of system results in a faster sedimentation rate and poor stability [
24]. As shown in the particle size distribution in
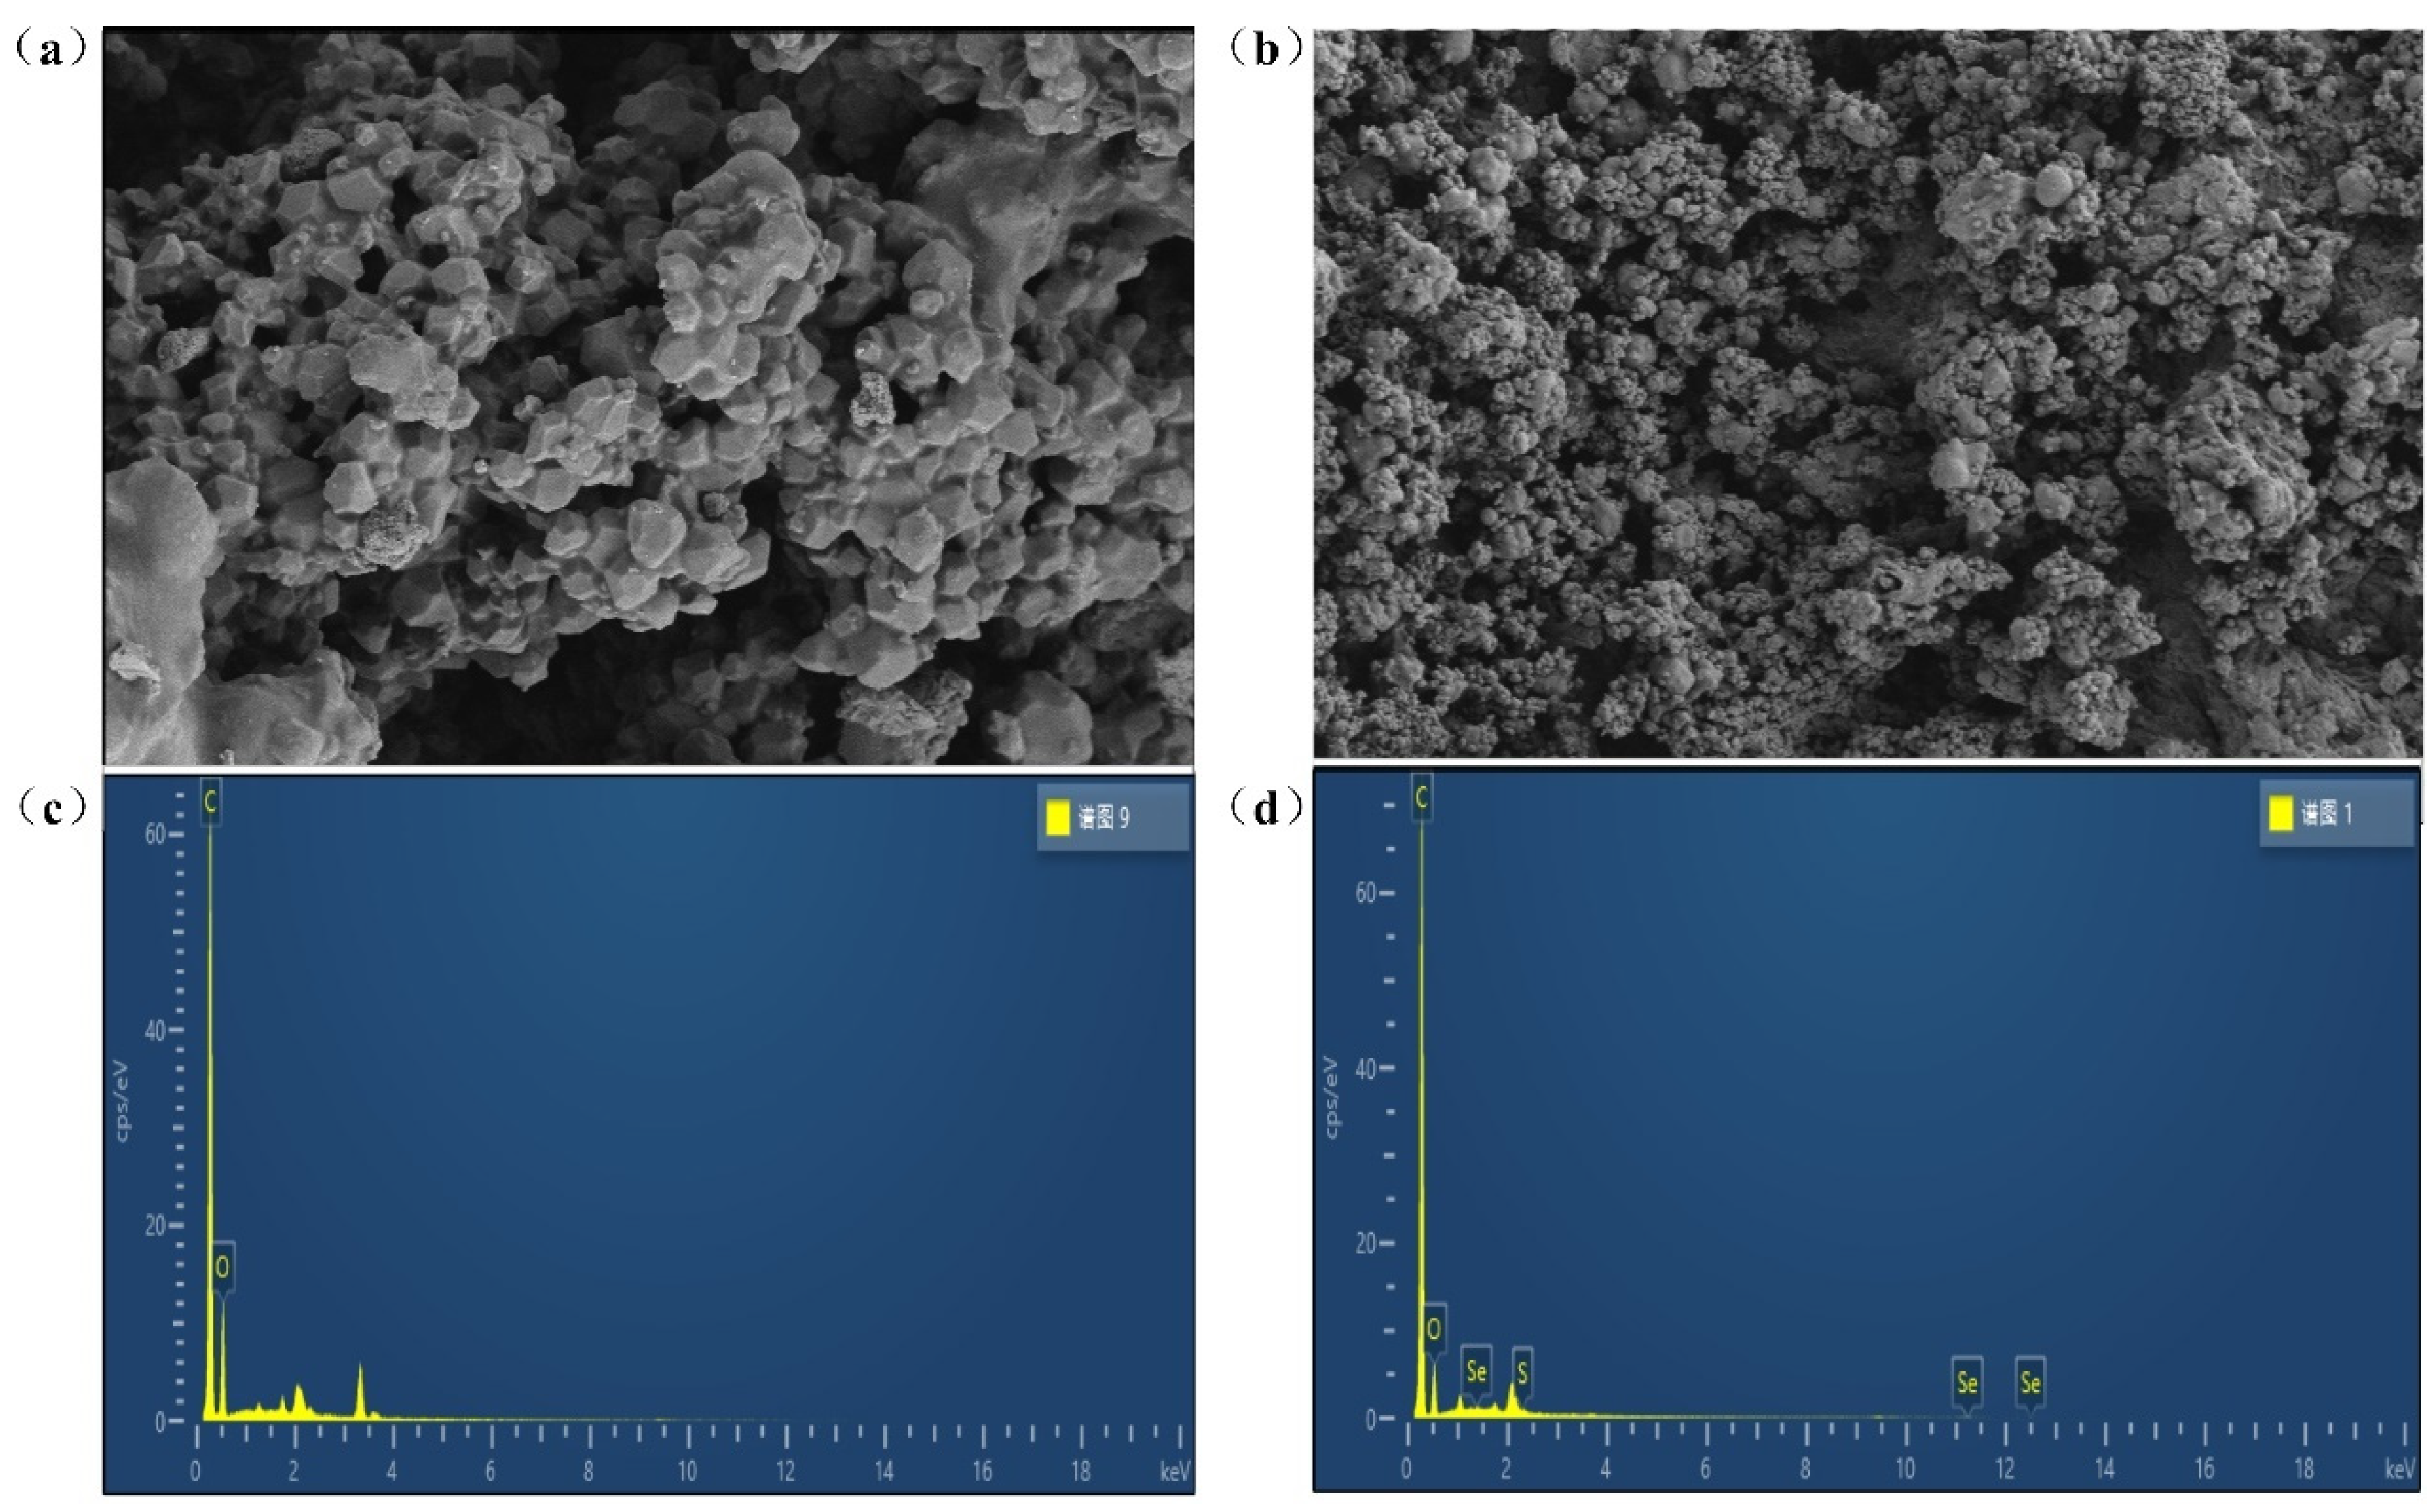
Figure 1c, the average particle sizes of GEP and Se-GEP were 819.8 ± 124.6 nm and 395.4 ± 18.8 nm, respectively. These particle size results had a good fitting with the results of SEM (
Figure 3a,b), indicated that selenized modification could decrease the volume of particles and improve physical stability.
The Zeta potential values were presented in
Figure 1d and confirmed that both GEP and Se-GEP exhibited electronegativity. The zeta potential of GEP and Se-GEP were -24.57 ± 2.58 mV and -28.17 ± 1.59 mV, respectively. The absolute ZP value of Se-GEP was larger than that of GEP could be attributed to the introduction of electronegative selenite ions.
2.2. Structural Investigation
2.2.1. UV and FT-IR Spectroscopy Analysis
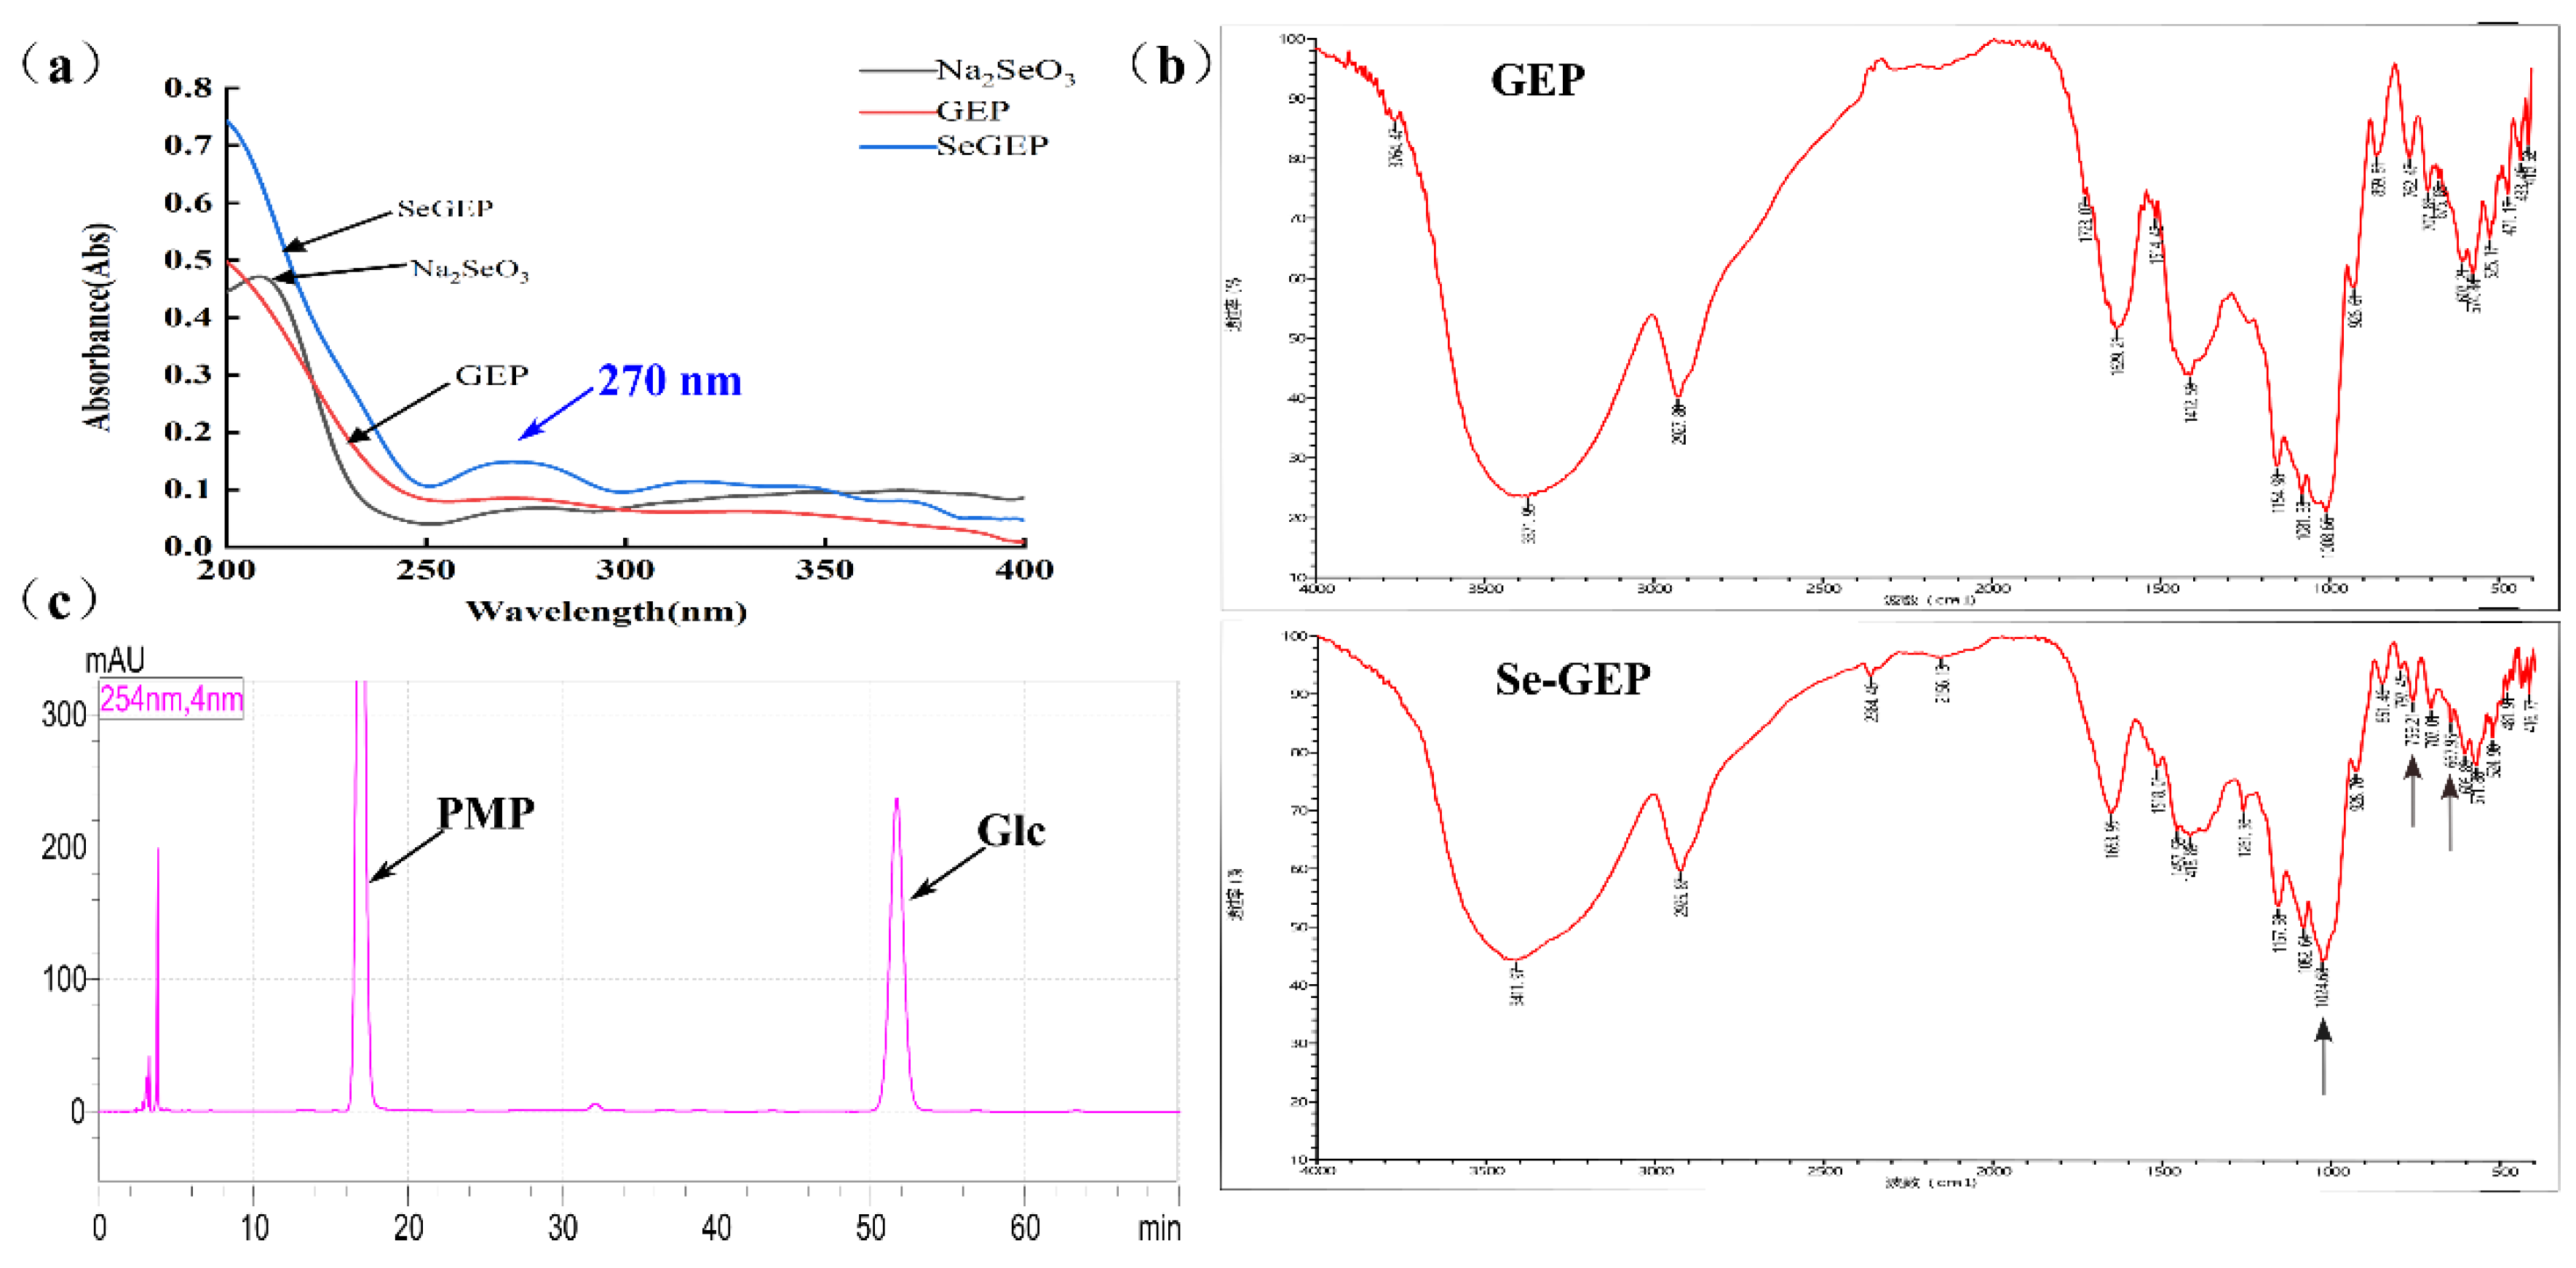
The UV spectra of GEP and Se-GEP at a concentration of 0.1 mg/mL were recorded. As depicted in
Figure 2a, GEP exhibited typical polysaccharide characteristics with no UV absorption among 200-400 nm, but by virtue of selenite group, the Se-GEP had a weak absorption at about 270 nm. The IR spectra of GEP and Se-GEP gave several characteristic absorption peaks for a polysaccharide (
Figure 2b). There were two major bands, one absorption appeared in 3000-3600 cm
-1 region attributed to O-H stretching vibration [
25], another absorption appeared in 1000-1400 cm
-1 region assigned to the C-O-C stretching vibration [
26]. The absorptions at 1008.7, 1081.3 and 1155.0 cm
-1 indicated the absence of the pyranose ring of sugar residues [
4]. As compared with GEP, the absorption peak at 667.9 cm
-1 described the Se-O-C symmetrical stretching vibration, 759.2 cm
-1 was attributed to the typical stretching vibration of Se=O group, and 1024.7 cm
-1 was the absorption of the O-Se-O bond of selenium ester [
24]. These results indicated that Se-GEP was successfully prepared.
Monosaccharide composition analysis of GEP was conducted by HPLC after complete acid hydrolysis and derivatization with 1-phenyl-3-methyl-5-pyrazolone (PMP) [
27]. The results were shown in
Figure 2c: GEP mainly consisted of glucose.
2.2.2. Morphology and Elemental Composition Analysis
SEM was often used to analyze the surface microstructure of biomaterials. In this paper, the morphological changes between GEP and Se-GEP were analyzed before and after selenylation. As shown in
Figure 3a,b, Se-GEP had a different microstructure from GEP, in which GEP had isolated solid blocks with more regular shapes, in contrast, Se-GEP had smaller blocks and dispersed loose surface. The morphological changes suggested that selenylation process might change the initial intact dense structure and led to the formation of heterogeneous-sized blocks.
The surface elemental compositions of GEP and Se-GEP were analyzed using EDX and the results were displayed in
Figure 3c,d. GEP and Se-GEP primarily consisted of C and O elements, while in Se-GEP, characteristic absorption peaks of Se and S were occurred in the EDX spectra. The presence of sulfur element signal in Se-GEP might due to our pre-sulfation reaction before selenylation progression.
2.2.3. NMR Analysis
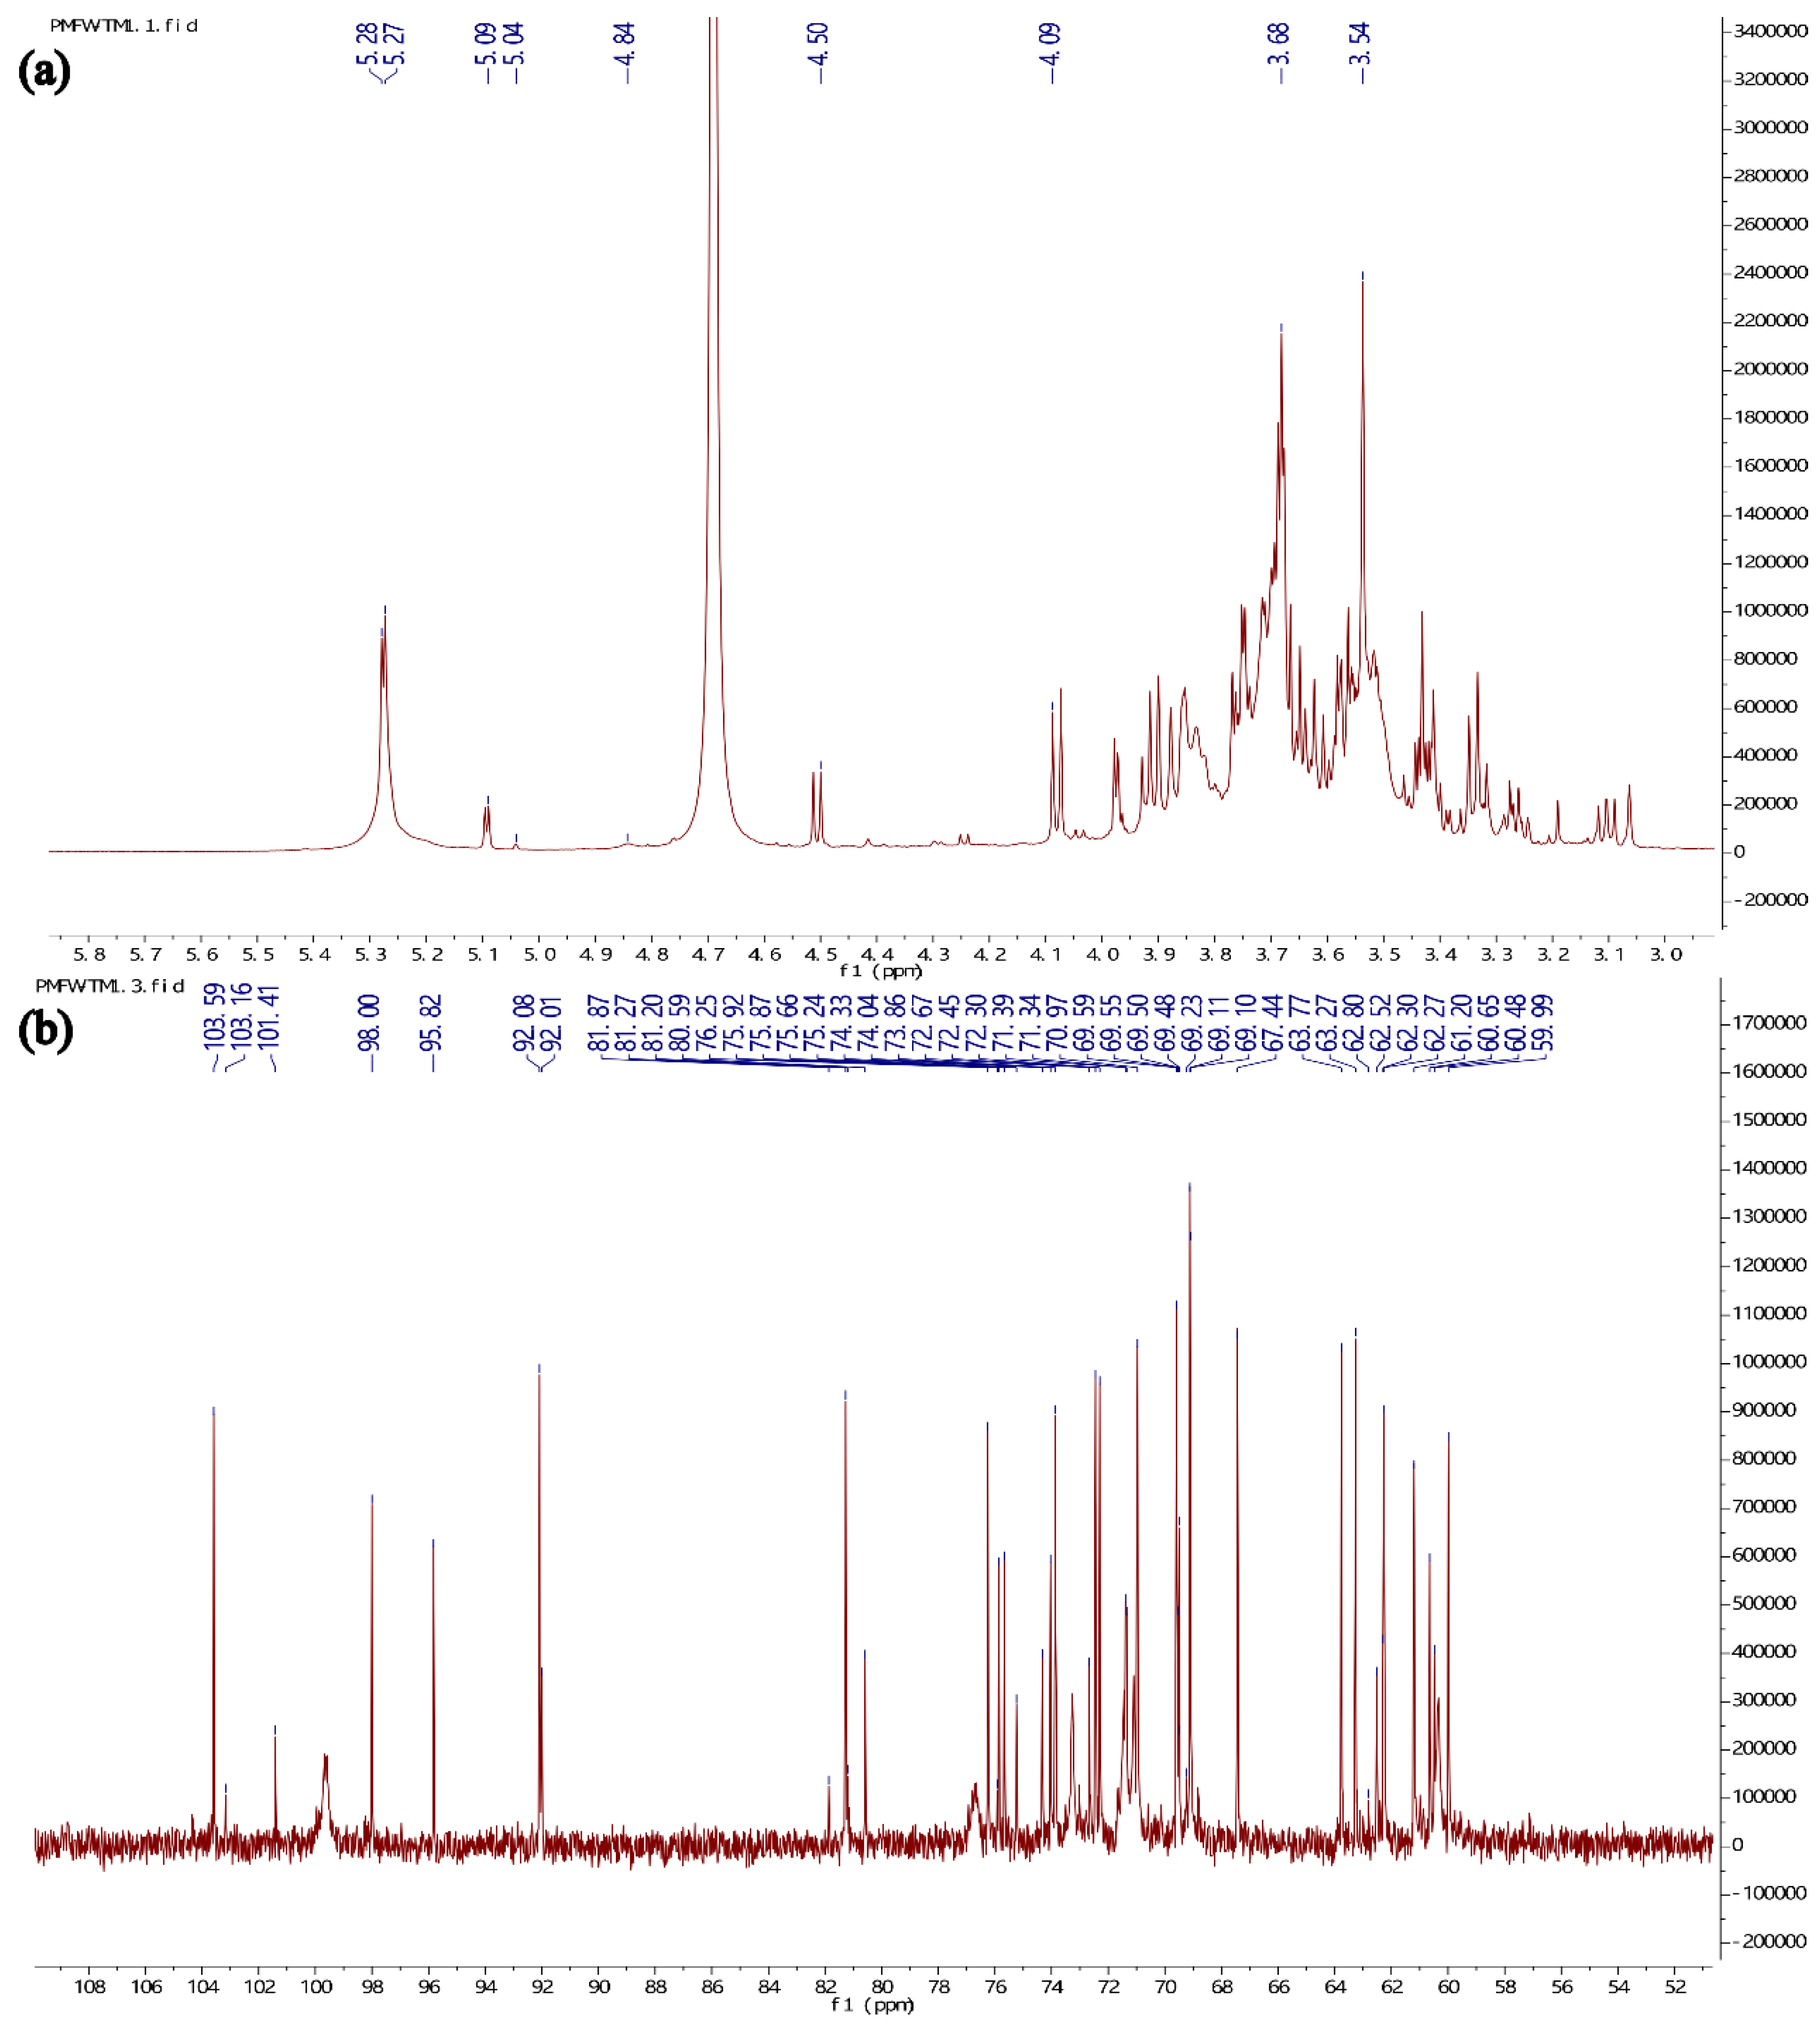
As shown in
Figure 4a, the
1H NMR spectrum characteristic signals of Se-GEP were mainly from δ
H 3.28 to 5.27 ppm, and the characteristic signals of
13C NMR spectrum were mainly in the range of δ
c 59.99 ppm to 103.59 ppm (
Figure 4b), which are typical signals in polysaccharides [
20].The
1H NMR spectrum (
Figure 4a) showed anomeric region signals at δ
H 5.28, δ
H 5.27, δ
H 5.09, δ
H 5.04, δ
H 4.84 and δ
H 4.50 suggesting that Se-GEP contains both α-type and β-type configuration of sugars, but was mainly present in the α-configuration. The existence of H
2O in the sample or HDO from the solvent gave a larger signal at δ
H 4.68.
2.2.4. I2-KI and Congo Red Test
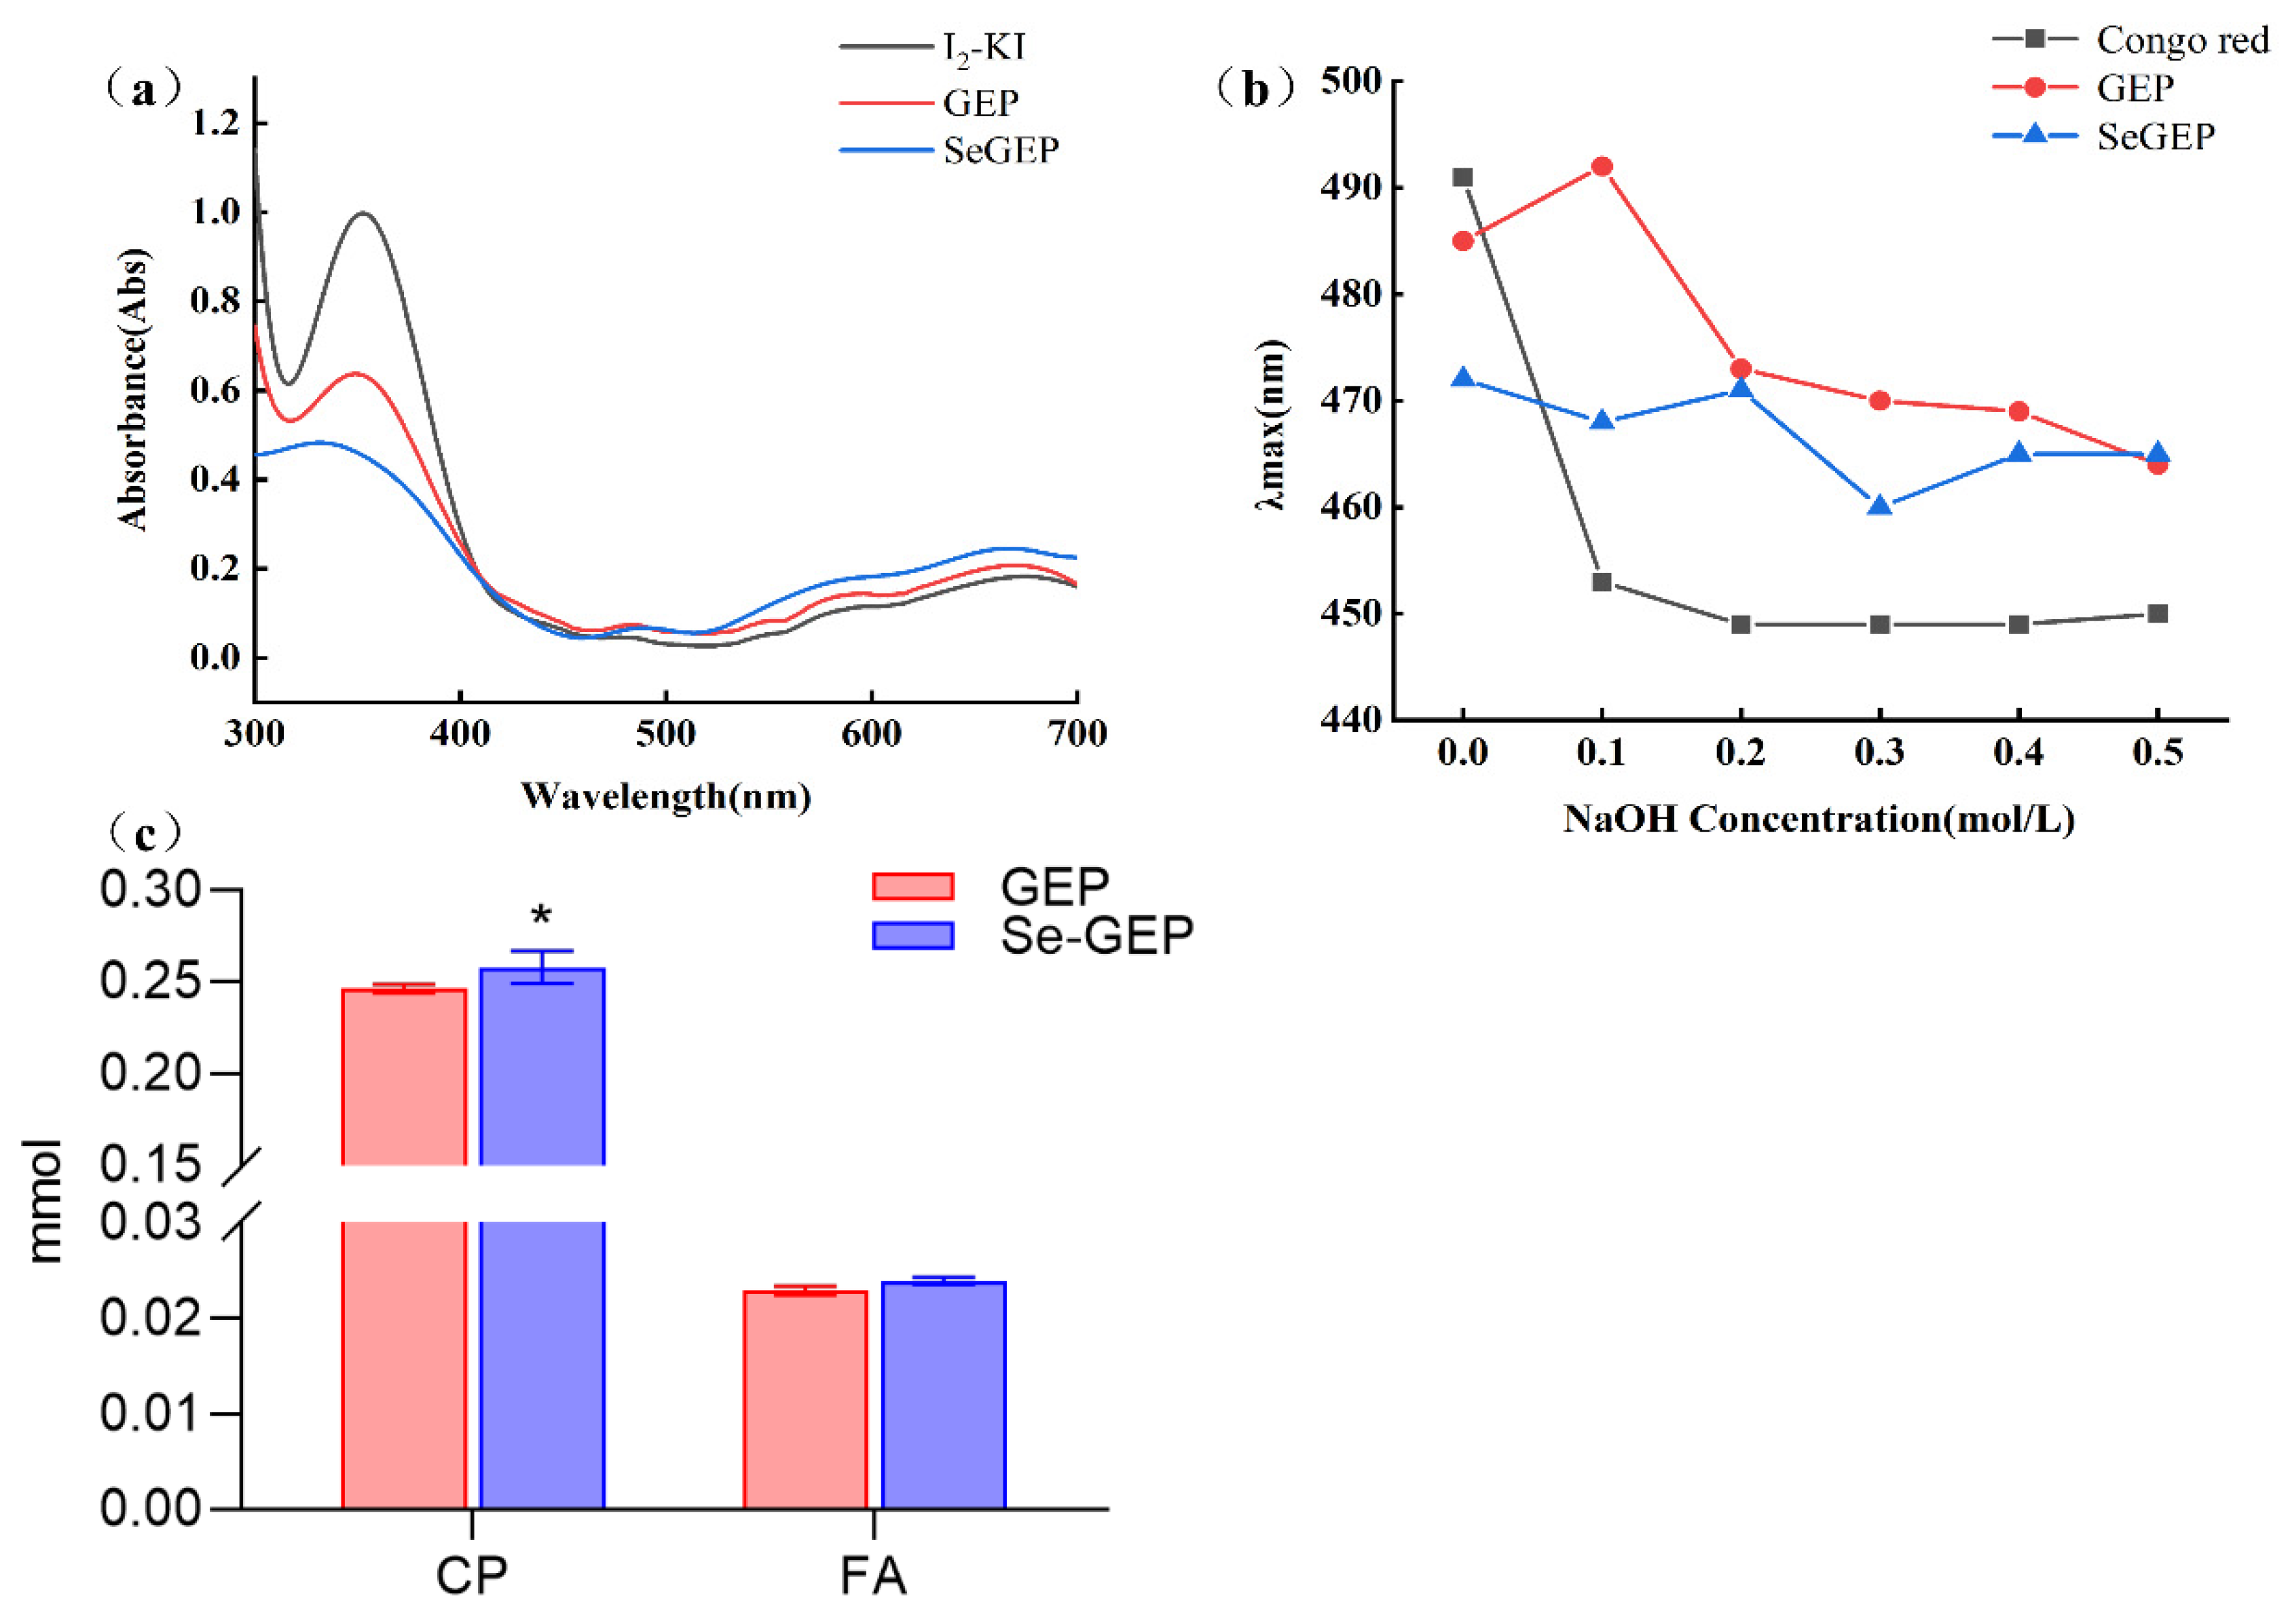
As shown in
Figure 5a, the maximum absorption peak of GEP and Se-GEP were centered at about 350 nm with no peak were observed around 565 nm, which demonstrated that GEP and Se-GEP were of high molecular weight and many branched chains attaching to the backbone [
28]. Besides, the negative reaction of GEP and Se-GEP with iodine reagent demonstrated that there were no starches present in the structure. Congo red could form complexes with polysaccharides which possessing a triple helical conformation, and as a result, leads to a bathochromic shift of the maximum absorption wavelength. As shown in
Figure 5b, there were notable shifts in λ
max for GEP and Se-GEP with the increasing NaOH concentration from 0-0.1 M and 0-0.2 M, respectively. However, descending behavior of the λ
max was happened at high concentrations of NaOH (0.2-0.5 M), which is possibly due to the breakdown of hydrogen bonding or hydrophobic interactions between Se-GEP and Congo red [
29]. These findings suggested that GEP and Se-GEP existed as both triple-helical and random coils structure.
2.2.5. Periodate Oxidation Test
Periodate oxidation has been widely used for elucidation of structures in carbohydrates as its specificity for vicinal diols [
30]. As shown in
Figure 5c, periodate oxidation of GEP and Se-GEP produced 0.0229 mmol and 0.0239 mmol formic acid (FA), respectively, which indicated the presence of 1→6 linkage or 1→linkage terminal saccharide residues. In the meantime, 0.246 mmol and 0.258 mmol of periodate was consumed respectively for GEP and Se-GEP. The consumption of periodate was more than two times of FA production indicated there might be present of 1→4 or 1→4,6 linkage in polysaccharide structure. The existence of 1→3 linkage in GEP and Se-GEP were also indicated as the fact that less than one mol periodate consumption for per mol of sugar residue.
2.3. In Vitro Effects of Se-GEP on RAW 264.7 Macrophages
2.3.1. Immunomodulatory Effects of Se-GEP on Cell Viability and Phagocytosis
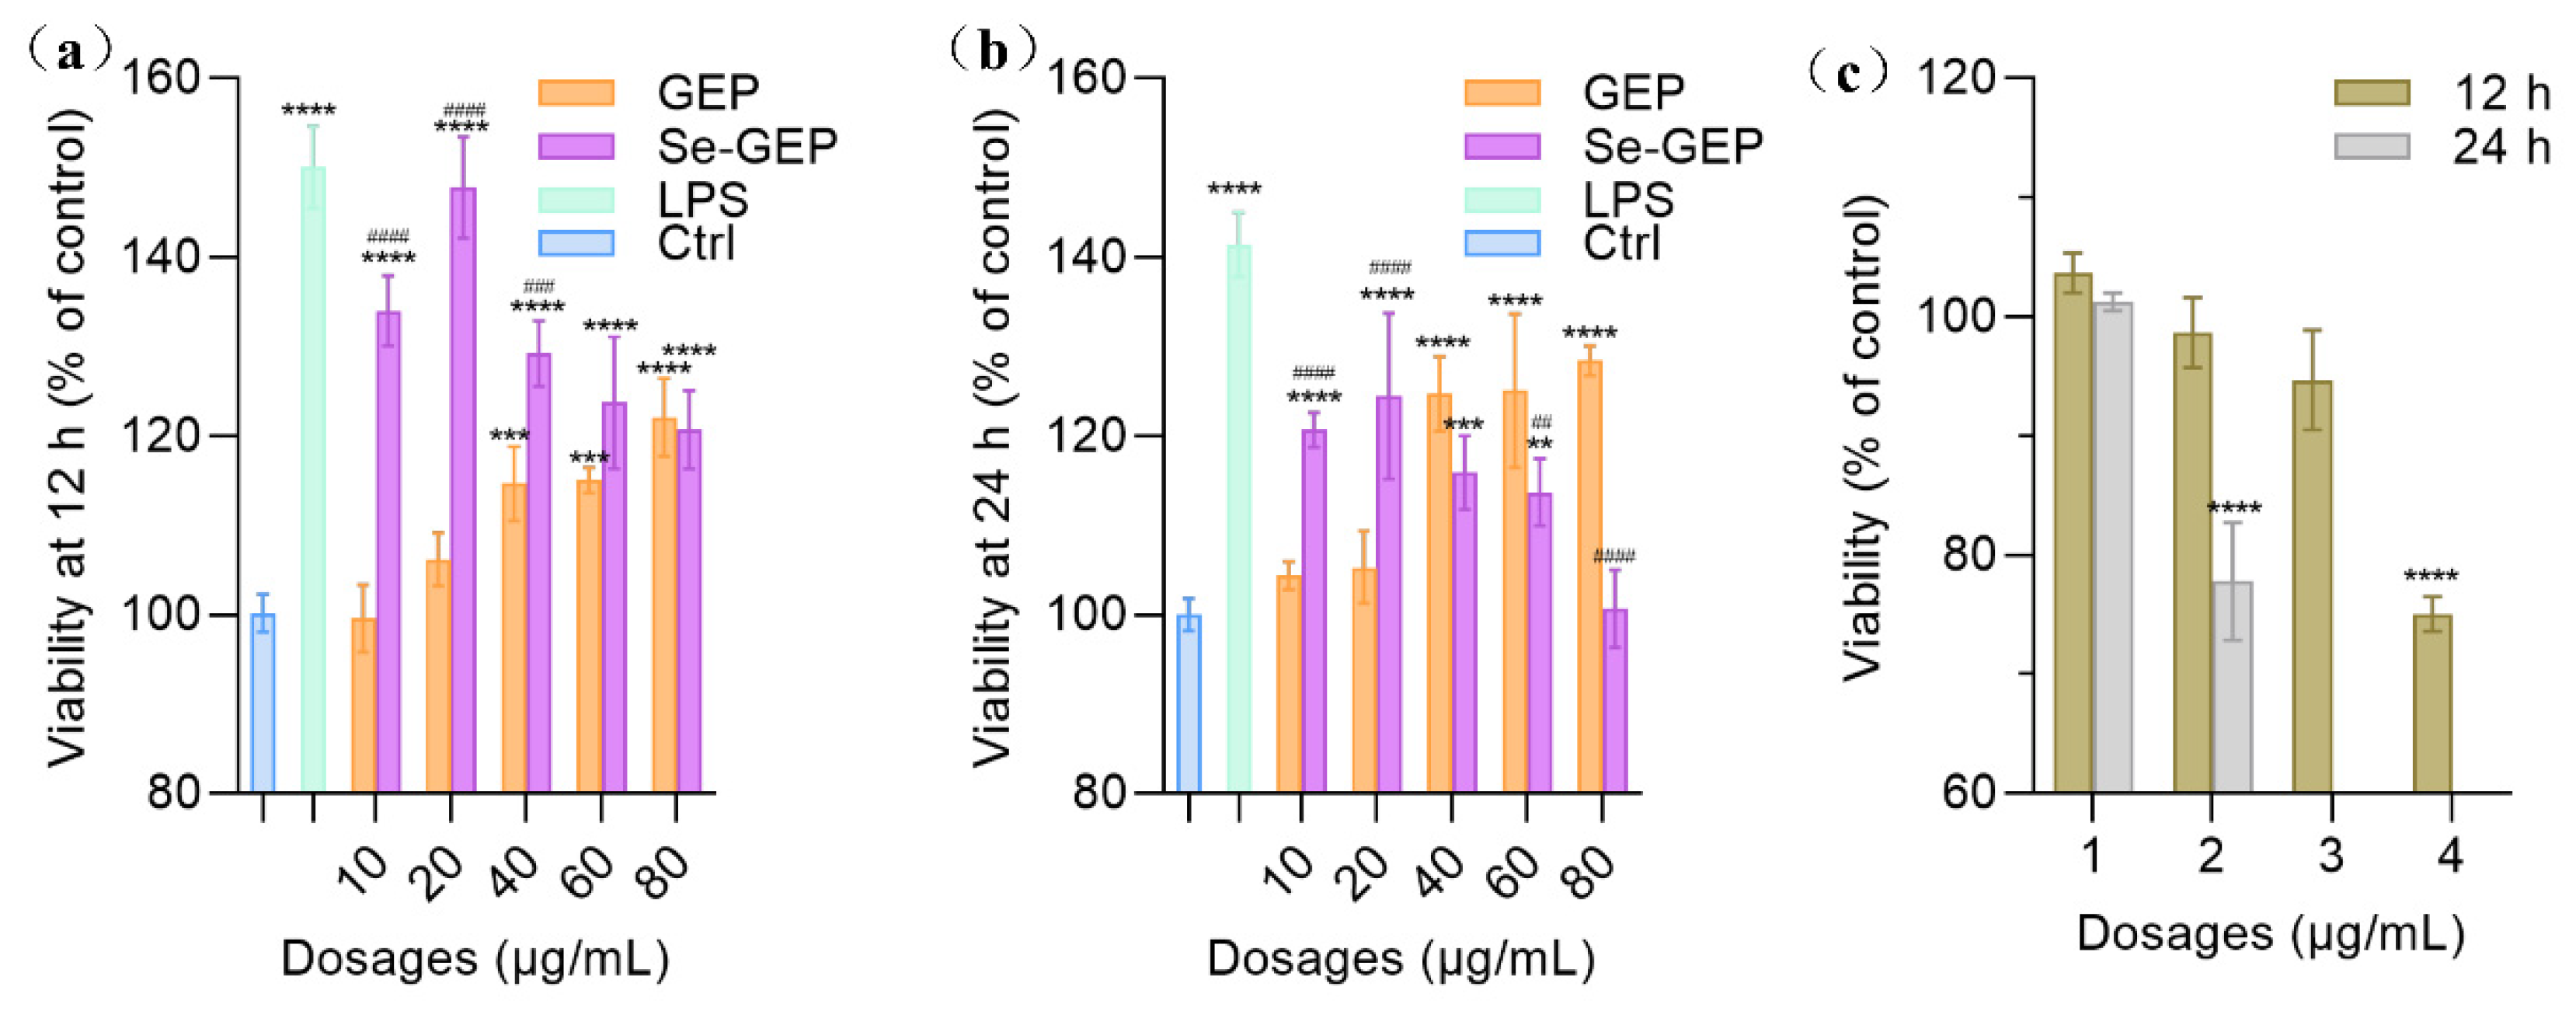
Macrophages are one of the most important immune cells and their activation has been considered to be a necessary step for immune system stimulation. The cell viability of RAW 264.7 cells were examined by CCK-8 assay with LPS (500 ng/mL) as a positive control and PBS as a negative control. As shown in
Figure 6, the cell viability of RAW 264.7 cells were increased when exposed to GEP and Se-GEP samples at 10-80 μg/mL for 12 h. The cells obtained growth promotion dose-dependently for GEP and the cell viability reached a maximum of 122.1%±3.5% at 80 μg/mL (
Figure 6a). However, the cell viability reached a maximum of 147.8%±10.4% for Se-GEP at 20 μg/mL for 12 h, which almost equally to that of the LPS group (150.1% ±9.5%). Meanwhile, the Se-GEP had higher growth promotion than GEP on the cells, especially with the dosages of 10 and 20 μg/mL, which confirmed that chemical selenylation endowed GEP with enhanced bioactivity. However, when incubation for 24 h, the high dose Se-GEP (especially for 80 μg/mL) group exhibited reduced cell viability, which might be related to selenium toxicity (
Figure 6b). When Na
2SeO
3 alone was used at 1-4 μg/mL to treat the cells for 12-24 h, it mostly exerted cytotoxicity on the RAW 264.7 cells (
Figure 6c). The treatment time for 12 h, the high-dose Na
2SeO
3 group (4 μg/mL) led to reduced cell viability to 75.1%. When the treatment time up to 24 h, the higher dose Na
2SeO
3 groups (3 and 4 μg/mL) even resulted in great cell death. These results meant that inorganic Se (i.e, the Na
2SeO
3 form) is very toxic when exposed overdose.
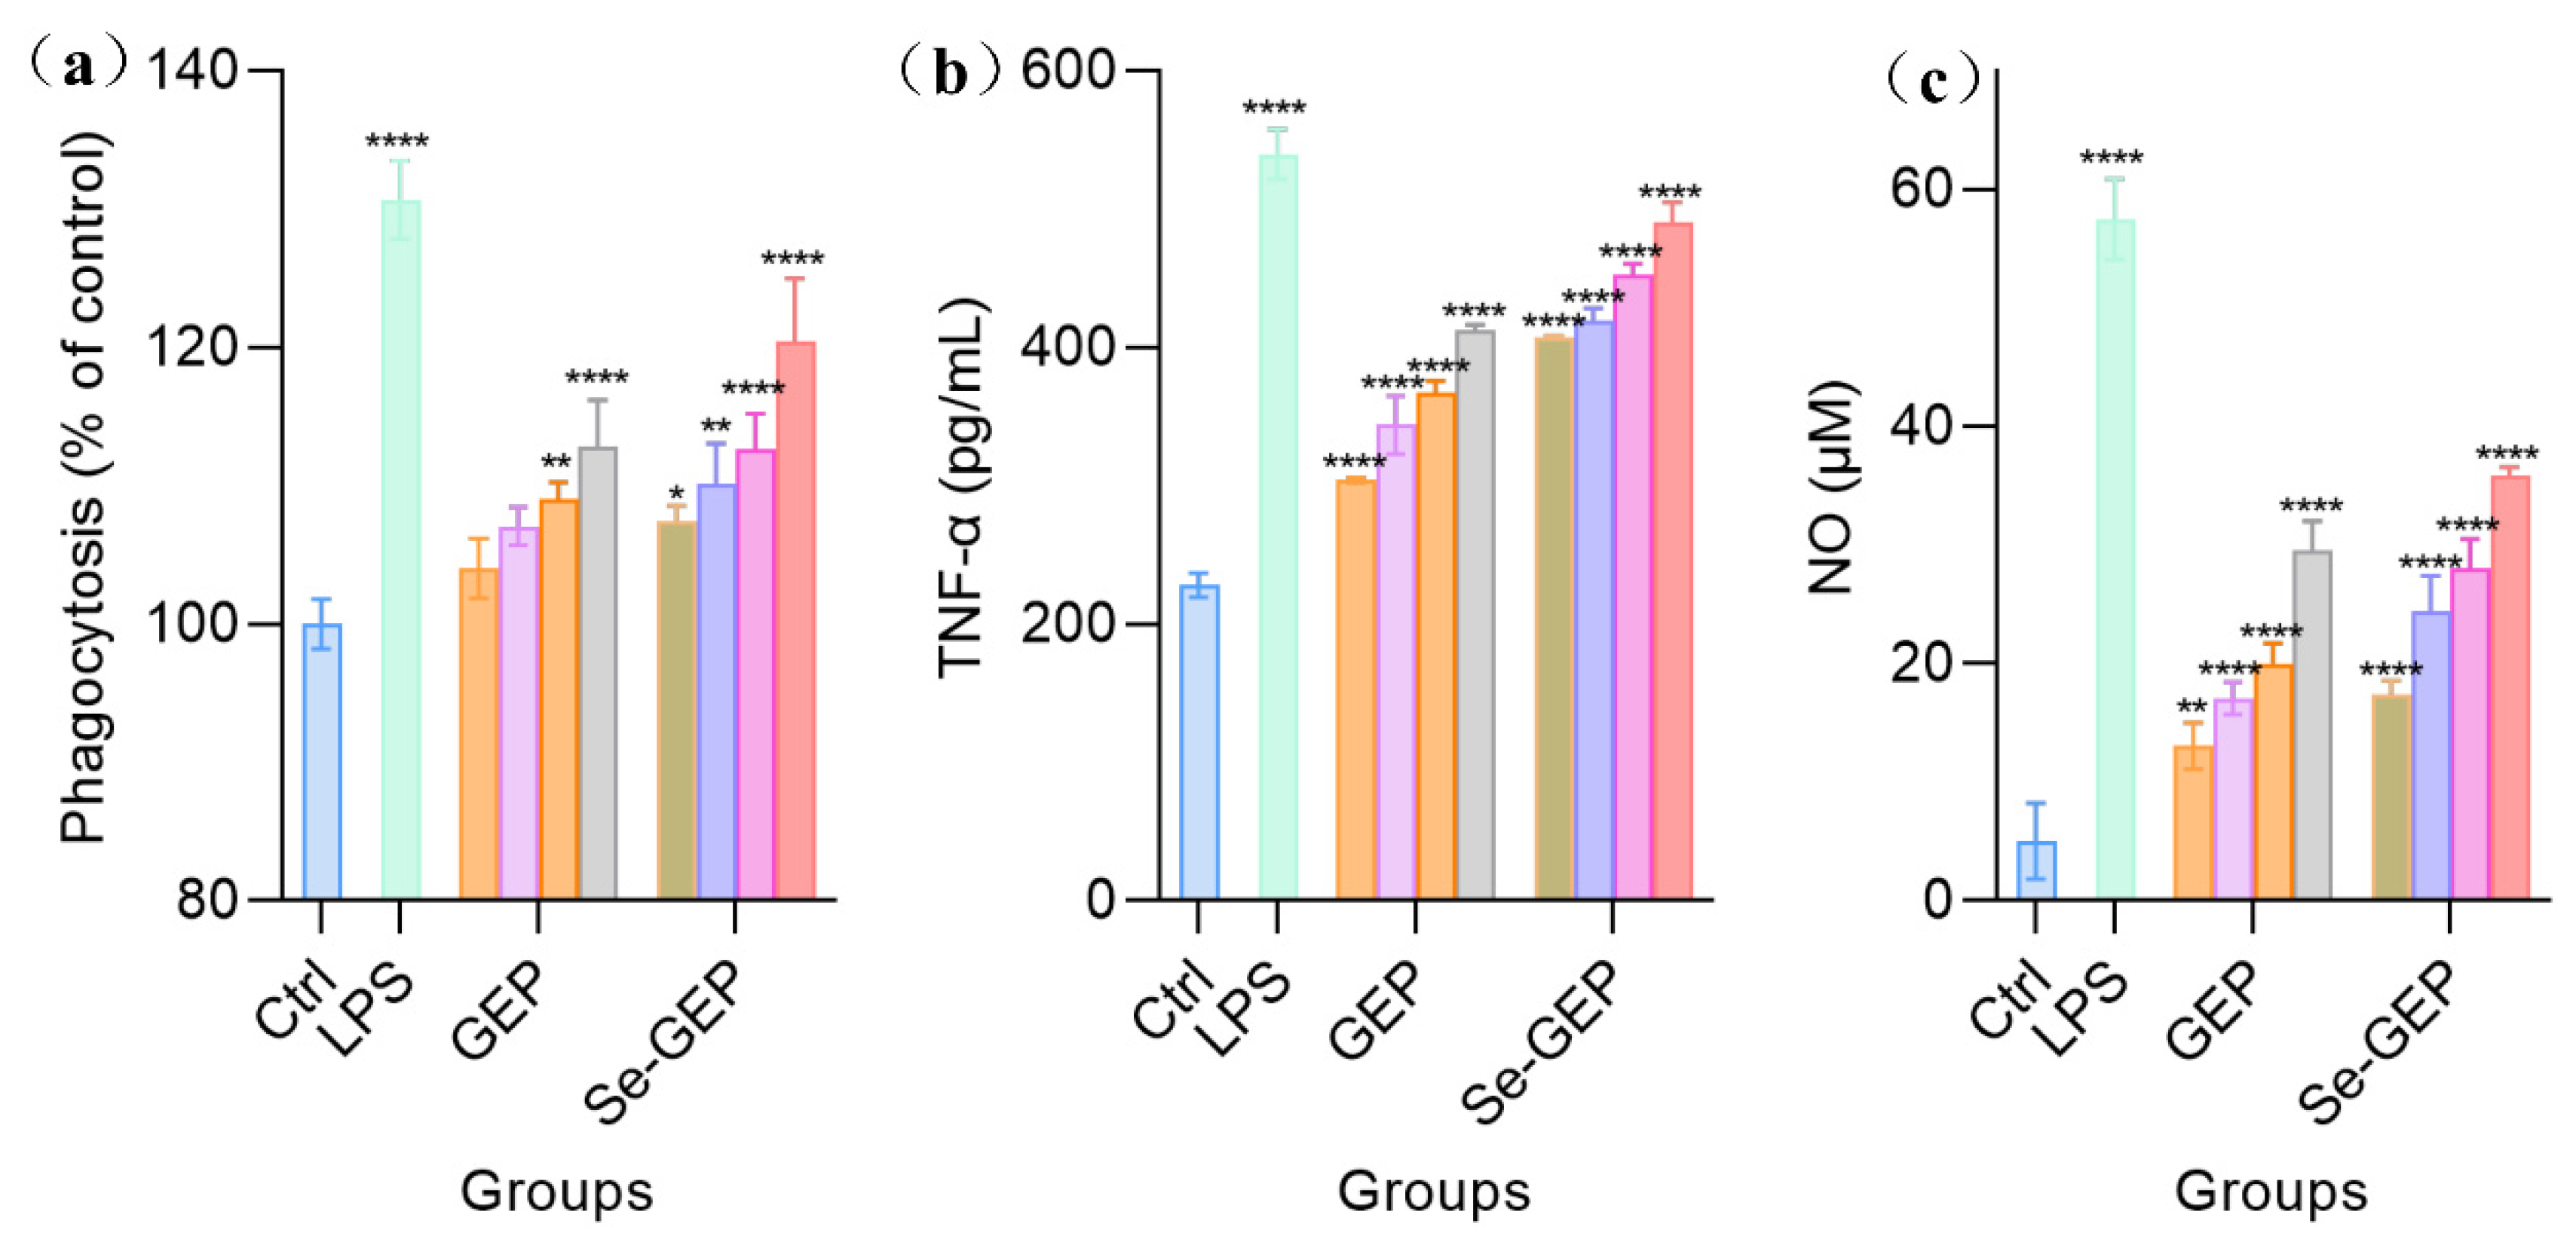
To compare the immune-regulatory potentials of GEP and Se-GEP further, the dose levels of 40, 80, 160 and 320 μg/mL for GEP and 5, 10, 15 and 20 μg/mL for Se-GEP, were selected in following cell experiments. When the RAW 264.7 cells were stimulated by GEP and Se-GEP at different dose levels for 24 h, their phagocytosis activity was enhanced in a dose-dependent manner (
Figure 7a). Compared with GEP, the Se-GEP exhibited a strong potential to enhance macrophage phagocytosis at low concentration (from 107.4% to 120.5%). Meanwhile, GEP alone could enhance macrophage phagocytosis at higher dose levels of 160 and 320 μg/mL with phagocytosis values of 109.0% and 112.9%, respectively (
Figure 7a). All of these results demonstrated that chemical selenylation of GEP could promote RAW 264.7 cell phagocytosis.
2.3.2. Immunomodulatory Effects of Se-GEP on the Secretion of NO and TNF-α
TNF-α and NO are generally considered important mediators in the immune system. The secretion of TNF-α and NO from RAW 264.7 cells was determined. As shown in
Figure 7b, GEP induced a dose-dependent increase in the secretion of NO and TNF-α in comparison with the blank PBS control. Similar results were observed for Se-GEP group at the dose levels of 5-20 μg/mL. In detail, when the RAW 264.7 cells were exposed to Se-GEP, TNF-α secretion levels were increased from 228 pg/mL (control group) to 407.4-490.5 pg/mL and the secretion level of NO was elevated from 5.1 μM (control group) to 17.4-35.8 μM. At the same time, the secretion levels of NO and TNF-α were also elevated in GEP group at different dosages, but Se-GEP had more potential than GEP to favor the secretion of these two cytokines. Thus, it is concluded that the performed selenylation endowed Se-GEP with enhanced immunomodulatory activity.
2.4. In Vivo Effects of Se-GEP on Cyclophosphamide (CTX)-Treated Mice
2.4.1. Body Weight and Feed Intake
The changes in body weights and feed intake were shown in
Table 2. The initial body weights showed no significant difference among the seven groups. Compared with the sham group, all cyclophosphamide-treated mice groups underwent significant bodyweight decrease (
P<0.0001) and feed intake reduction (
P<0.0001), which indicated that the immunosuppression model had been successfully established. After 10 days, all groups except the sham group and the vehicle group were administrated relevant polysaccharides. Compared with the vehicle group, the average mice body weights and feed intake of Se-GEP groups were significantly increased, indicating that Se-GEP effectively improved immunomodulatory activity.
2.4.2. Spleen and Thymus Index
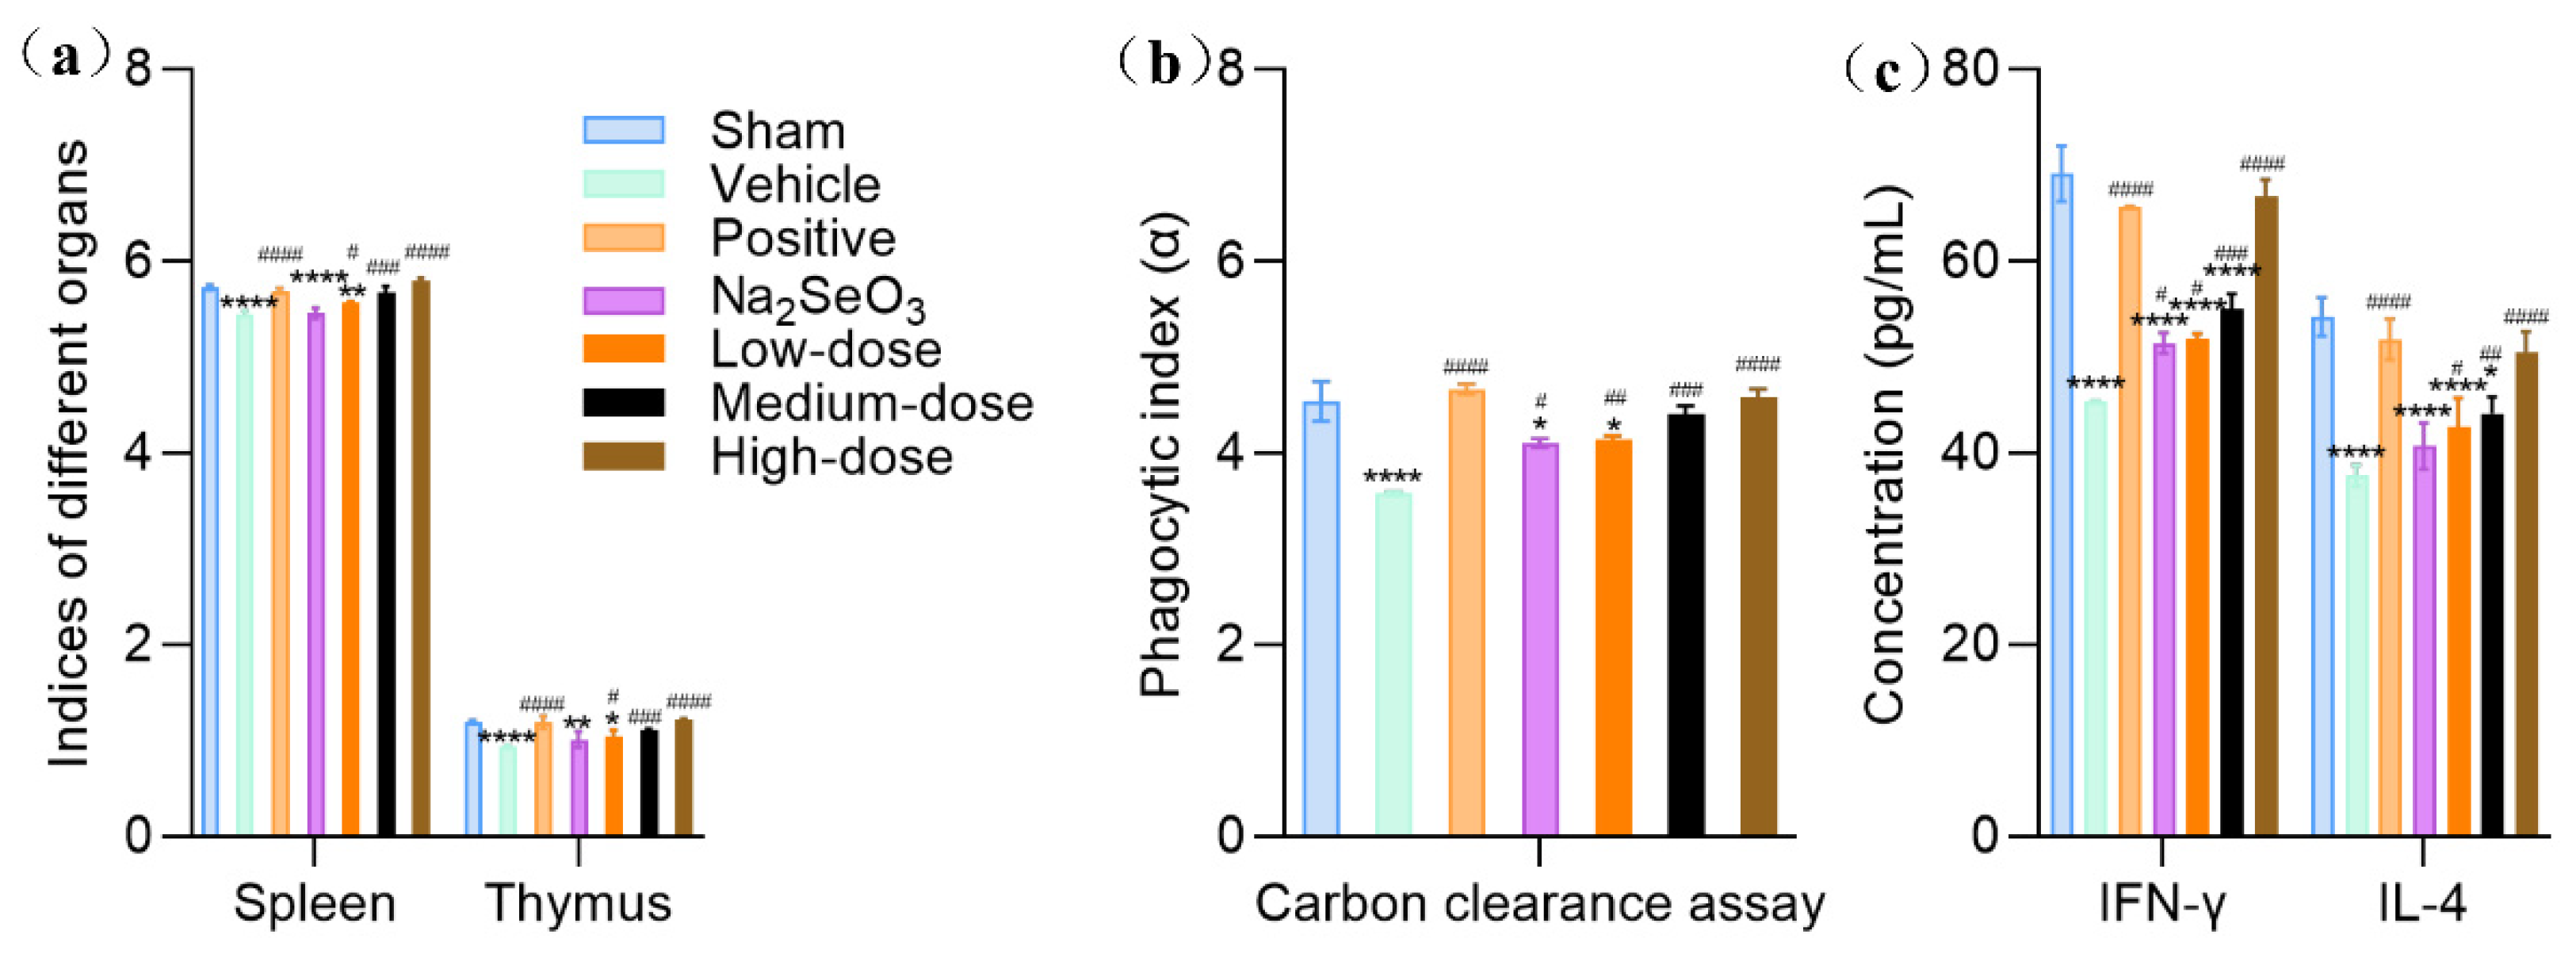
Spleen, the largest peripheric immune organ, plays an important role in the immune response. The spleen and thymus indices were adopted to evaluate the effects of Se-GEP on the immune organs. As shown in
Figure 8a, the spleen and thymus indices of the vehicle group were remarkably decreased in comparison with the normal group (
P<0.0001), showed that cyclophosphamide significantly exhibited immunosuppressive action. The administration of Se-GEP significantly increased the spleen and thymus indices in a dose-dependent manner compared with the vehicle group. The results incorporation of Se into GEP yielded great immunomodulatory effects and reverse the CTX-induced atrophy of immune organs.
2.4.3. Carbon Clearance Assay
The carbon clearance assay was used to test the phagocytic function of monocyte, with faster removal of carbon particles reflecting the enhanced phagocytic function. As shown in
Figure 8b, a significant decrease of phagocytic index (α) in the vehicle group was observed by comparing with the sham group (
P<0.0001). Se-GEP could effectively increase the phagocytic index (α) in a dose-dependent manner (100, 500 and 3000 μg/kg/d, bw). Especially at a dose of 3000 μg/kg/d, the phagocytic activity was restored from 3.57 to 4.58, which was almost equally to the sham group index (4.54). These results demonstrated that Se-GEP could improve the macrophage function in CTX-treated mice.
2.4.4. Serum IL-4 and IFN-γ Assay
Activated T-helper type (Th1) and T-helper type (Th2) lymphocytes could secret IFN-γ and IL-4, respectively, which mediate cellular and humoral immune responses, respectively. So, the levels of serum IFN-γ and IL-4 reflect the strength of cellular and humoral immunity. ELISA kits were used to determine the levels of serum IFN-γ and IL-4 with lentinan (50 mg/kg/d) as a positive control. As shown in
Figure 8c, a significant decrease of IFN-γ and IL-4 in vehicle group indicating the CTX-induced immunosuppression mice were successfully established. The administration of Se-GEP could increase the levels of IFN-γ and IL-4 significantly in a dose-dependent manner. These results indicated that the selenylation of GEP could improve both cellular and humoral immunity responses in CTX-treated mice.
3. Materials and Methods
3.1. Materials
The rhizome of G. elata were purchased from Guizhou Wumengteng Fungus Industry Co. LTD (Guizhu, China) in December 2020, and authenticated by Prof. Huaguo Chen (Guizhou Normal University). Specimen no. 2020012005 was stored at Food and Pharmaceutical Engineering Institute, Guiyang University (Guizhou, China). Dimethyl sulfoxide (DMSO), Triflouoroacetic acid (TFA), nitric acid (HNO3), sodium selenite (Na2SeO3), chlorosulfonic acid (ClHSO3), pyridine, and 1-phenyl-3-methyl-5-pyrazolone (PMP) were from Aladdin (Shanghai, China). T-series dextran standards (T-410, T-270, T-150, T-70, T-40 and T-10 with molecular weight of 410, 270, 150, 70, 40 and 10 kDa) were purchased from Sigma-Aldrich Inc. (St. Louis, Mo, USA). Dialysis tubes (MW 3500 Da) were from Viskase (USA). Other reagents were of analytical grade and commercially available.
Macrophage cell line RAW 264.7 was purchased from American Type Culture Collection (ATCC, Virginia, USA). Lipopolysaccharide (LPS, from Escherichia coli 0111:B4), and 2-(2-methoxy-4-nitrophenyl)-3-(4-nitrophenyl)-5-(2,4-disulfophenyl)-2H-tetrazolium sodium (WST-8) were purchased from Solaibao Biotech Co. Ltd (Beijing, China). Mouse ELISA kits were purchased from Sigma Chemical Co. Ltd (St. Louis, Mo, USA).
3.2. Extraction and Purification of GEP
The polysaccharides was extracted according to a previous study [
22]. In brief, the dried rhizomes of
G. elata (506 g) were defatted with 95% EtOH for three times. After air drying, the residue was reflux extracted with boiling water for 3 times. The combined supernatant was concentrated to one-fourth of its initial volume and then treated with Sevag reagent in a ration of 2:1(v/v) for several times to remove proteins. Ethanol was added to the solution to a final concentration of 80% and incubated at 4 °C for 24 h to let
G. elata polysaccharides be completely precipitated. After centrifugation, the precipitate was re-dissolved in distilled water and lyophilized as crude
G. elata polysaccharides.
The diethylaminoethyl cellulose 52 (DEAE-52) ion exchange resin column (30 cm × 3.2 cm) was used to elute crude G. elata polysaccharides with deionized water at a flow rate of 1 mL/min. The eluted aliquots were collected every 10 mL and the phenol-sulfuric acid method was used to monitor the elution. The most abundant polysaccharide fraction from DEAE-52 were collected and obtained after lyophilization as GEP with total sugar content of 93.18%±0.84%.
3.3. Preparation of S-GEP and Se-GEP
3.3.1. Preparation of S-GEP
Sulfated derivatives of GEP was prepared by the chlorosulfonic acid-pyridine (CSA-Pyr) method [
31] with modification. Briefly, GEP (1 g) was suspended in N,N,-dimethylformanide (DMF) under agitation at 25 °C for 1 h. The sulfated reagent was prepared by adding CSA to Pyr at a ratio of 1:2 (v/v) under an ice bath, and the mixture was energetically stirred at 25 °C for 1 h. Then, the sulfated reagent was added dropwise to GEP solution and the mixture was kept stirring at 25 °C for 2 h. After the reaction was finished, the reactive mixture was adjusted to pH 7 with 2 mol/L NaOH solution. Ethanol was added to the solution (3-bold volume) and kept at 4 °C for 24 h. After that, the precipitate was collected and redissolved in distilled water. The solution was dialyzed against distilled water for 24 h using 3500 Da MW cutoff dialysis bags and then lyophilized by a freeze dryer to obtain the sulfated polysaccharide and designated as S-GEP.
3.3.2. Preparation of Se-GEP
The selenylation modification by NA-SS method was performed according to previous study with some modifications [
32]. In brief, 500 mg S-GEP was added into 100 mL HNO
3 (0.3 wt%) containing 1.0 g BaCl
2 under fully stirring. The selenized reaction was then started by adding 500 mg of Na
2SeO
3 and the reaction temperature was set at 70 °C for 4 h. After the reaction, the mixture was cooled to room temperature and the pH was adjusted to 7 with 1 mol/L NaOH solution. Sodium sulfate (Na
2SO
4) was added to remove Ba
2+ and then centrifuged at 3500 rpm for 10 min. The resulting aqueous fraction was extensively dialyzed against tap water for 48 h and distilled water for 24 h until no free sodium selenium was detected when ascorbic acid (Vc) was added. Finally, the dialysate was concentrated and lyophilized to obtain selenized polysaccharide (Se-GEP).
3.4. Determination of S-GEP and Se-GEP Content
3.4.1. Determination of S-GEP Content and Degree of Substitution
The sulfur content (S%) was measured by the barium chloride (BaCl
2)-gelatin method [
33]. The degree of substitution (DS) was calculated according to the equation as follows:
3.4.2. Determination of Selenium Content
The selenium content of Se-GEP was determined by using a fluorescence spectrophotometer (RF-5301PC, Shimadzu, Japan). Firstly, Se-GEP (10 mg) was soaked in 4 mL of mixed acid (HClO4 : H2SO4 : HNO3 =1:1: 4, v/v/v) at room temperature and then digested in a microwave digestion workstation at a preset program. Subsequently, the digested sample was put into a 100 mL conical flask and heated until almost dry. The digestion solution was diluted accurately to 10 mL with 0.1 mol/L HCl after cooling. Hydroxylamine hydrochloride (HONH2·HCl, 0.5 mol/L, 4 mL) and ethylenediaminetetraacetic acid disodium (EDTA-2Na, 0.2 mol/L, 4 mL) were added to the digestion solution, respectively. After that, 2 mL of 0.1% 2,3-diaminonaphthalene (DAN) solution was added and the mixture was kept in dark place for 1 h. The mixture was heated by boiling water bath for 10 min and then cooled to room temperature, followed by adding 5 mL cyclohexane. The fluorescence intensity of cyclohexane solution was measured with the excitation and emission wavelength at 376 nm and 520 nm, respectively. Finally, the Se content of Se-GEP was calculated according to standard curve.
3.5. Physicochemical Properties of Se-GEP
3.5.1. Chemical Analysis
Total sugar content was determined by using the phenol-sulfuric acid method and D-glucose was employed as a standard [
34]. The reducing sugar content was determined by 3,5-Dinitrosalicylic acid (DNS) method using D-glucose as a standard [
24]. The content of protein was measured according to the Bradford method using bovine serum albumin (BSA) as a standard [
35]. Uronic acids content was determined using the carbazole-sulfuric acid method, with D-galacturonic acid as the reference [
36].
3.5.2. Molecular Weight Determination
Molecular weight determination was performed on a high-performance liquid chromatography (HPLC, Agilent 1260 series, Agilent Technologies, Santa Clara, CA, USA) with a TSK gel G4000 SWXL column (7.8 mm × 300 mm) and a differential refraction detector (RID, G1362A). Polysaccharide samples were dissolved in distilled water (5 mg/mL), passed through a 0.45 μm filter, and the volume injected was 10 μL. An isocratic elution with distilled water was conducted at a flow rate of 0.6 mL/min. T-series dextrans were adopted as the calibrated standards for the molecular weight measurement.
3.5.3. Particle Size and Zeta Potential Analysis
Particle size and zeta potential (ZP) were measured to estimate the stability of polysaccharide disperse system. Each polysaccharide samples were diluted with deionized water to a final concentration of 1.0 mg/mL. After centrifugation, the average particle size and ZP values were determined at 25 °C with a fixed scattering angle of 90 using a NanoZS90 zeta-sizer (Malvern Instrument Ltd., Worcestershire, UK).
3.6. Structural Characterization of Se-GEP
3.6.1. UV and FT-IR Spectroscopy Analysis
UV spectra of samples (0.1 mg/mL) were recorded on an UV-visible spectrophotometer (UV2600, Shimadzu, Japan) in the range of 200-400 nm. For FT-IR spectral measurement, the samples were prepared as KBr pellets and detected by Fourier transform infrared spectrometer (iCan 9, Tianjin, China) in a wavenumber range of 400-4000 cm-1.
3.6.2. Scanning Electron Microscopy (SEM) and Energy Dispersive X-ray Spectrometer (EDX) Analysis
The microstructures of GEP, S-GEP and Se-GEP were observed under SEM (JSM-5510, JEOL Co., Tokyo, Japan). The polysaccharides were placed on the test stage and coated with a thin-layer gold film prior to examination. Images were acquired using with an accelerating voltage of 2 kV. The surface elemental compositions of the polysaccharides were analyzed using EDX (EX-250, Horiba Ltd., Tokyo, Japan) with the same sample preparation as in SEM.
3.6.3. Nuclear Magnetic Resonance (NMR) Spectra
The NMR spectroscopy of Se-GEP was recorded on a Bruker Avance NEO spectrometer (Bruker, Karlsruhe, Germany) operating at ghe frequency of 600 MHz with tetramethylsilane (TMS) as the internal reference. Se-GEP was deuterium-exchanged by freeze drying from D2O, and then resolved in D2O for examination with a 5-mm probe at room temperature.
3.6.4. Iodine-Iodide Kalium (I2-KI) and Congo Red Reaction
The nature of the blue color in the iodine-starch reaction is performed to explore the existence of branches in the Se-GEP skeleton structure. In brief, 5.0 mL of different polysaccharides solution (1.0 mg/mL) were put into glass colorimetric tubes (25 mL) and then 1.0 mL of iodine solution (0.2% KI solution containing 0.02% I
2) were added. After drastic shaking for 5 min, the color change was detected to finger out whether the polysaccharide main chain has branches and whether it contains starch. The Congo red reaction assay was conducted to identify the triple-helix conformation of polysaccharides through the shift in the visible absorption maximum of Congo red at carious concentrations of alkali [
37]. The solutions of Se-GEP (0.5 mg/mL) in 0-0.5 mol/L NaOH containing 80 μmol/L Congo red. The absorption spectra were recorded from 190-800 nm at room temperature.
3.6.5. Periodate Oxidation
The periodate oxidation and formic acid formation tests were used to identify the Se substitution site of Se-GEP. Each 1→6 pyranose residue with hydroxyl groups on three contiguous carbon atoms undergoes periodate oxidation will liberate 1 mole of formic acid [
38]. The GEP and Se-GEP polysaccharides (50 mg) in 30 mmol/L NaIO
4 (25 mL) were kept in the dark for 7 days at room temperature. The consumption of NaIO
4 and formic acid liberation from GEP and Se-GEP were examined and compared.
3.7. In Vitro Immunomodulatory Activity Analysis
3.7.1. Cell Culturing
RAW 264.7 cells were cultured in DMEM high glucose medium supplemented with 10% (v/v) heat-inactivated fetal bovine serum (FBS), 1% (v/v) penicillin-streptomycin (5000 units/mL penicillin, 5000 μg/mL streptomycin), and incubated in a humidified atmosphere of 5% CO2 at 37 °C (NUAIR-NU-5510E, USA).
3.7.2. Cell Viability Assay
The cell viability assays of the polysaccharides were performed using a cell counting kit 8 (CCK-8, Solarbio; Beijing, China) according to the manufacturer’s instructions. Briefly, cells were seeded in a 96-well microplates at a density of 1 × 10
4 cells/well (100 μL/well) in triplicate and cultured for 2 h for their attachments. The growth medium was removed and 100 μL medium with samples at various dose levels (10, 20, 40, 60, and 80 μg/mL for GEP and Se-GEP) containing 10 μg/mL polymyxin B was added to treat well for 12- 24 h. Na
2SeO
3 at concentrations of 1-4 μg/mL were also used to treat the cells similarly. After the incubation, the medium was discarded and 10 μL CCK-8 solution was pipetted into each well, and cells were incubated in the dark for another 2 h. The medium was discarded 2 h later and 100 μL dimethyl sulfoxide (DMSO) was added to each well. The absorbance values were measured at 450 nm on a Varioshan LUX multimode microplate reader (Thermo fisher scientific, Waltham, MA, USA). The values of cell viability were calculated by the following equation with the negative control cells were designed with 100% viability.
Where A1 is the absorbance value of the treatment group, and A2 is the absorbance value of the blank group
3.7.3. Phagocytosis Assay
The phagocytic activity was evaluated by using the neutral red method. In brief, the cells (1 × 10
4 cells/well) were seeded in a 96-well plates and incubated for 2 h. After removing the medium, 100 μL/well of samples at various dose levels (5-80 μg/mL for GEP and Se-GEP) were added to treat well for 24 h. After discarding the supernatants, 100 μL neutral red solution (1%) was added into each well to incubate for 30 min. Afterwards, the supernatant was removed and the cells were washed five times with PBS (10 mmol/L, pH 7.2), and then 200 μL of lysing buffers (ethanol:acetic acid=1:1, v/v) was added to treat the cells for 2 h. The absorbance value at 540 nm wavelength was measured and the neutral red phagocytosis rate (%) was calculated as:
Where A1 is the absorbance value of the treatment group, and A2 is the absorbance value of the blank group
3.7.4. Secretion of Nitric Oxide (NO) and Cytokines
RAW264.7 cells (1 × 10⁵ cells/well) were seeded in a 96-well microplates. After 2 h of incubation, the cells were then treated with samples at different concentrations (40, 80, 160, 320 μg/mL for GEP and 5, 10, 15, 20 μg/mL for Se-GEP) in the presence and absence of LPS (1 μg/mL) for 24 h. The cell supernatants were collected and the amounts of TNF-α and nitric oxide (NO) production was detected using Mouse TNF-α, NO ELISA kit according to the manufacturer’s protocol.
3.8. In Vivo Immunomodulatory Activity Analysis
3.8.1. Animals and Experimental Design
Male ICR mice (8 weeks old and 25-30 g in weight) were purchased from Chongqing Tengxin Biotechnology Co., Ltd. (License number: SCXK2019-0010, Chongqing, China). The mice were housed in a specific pathogen-free (SPF) room with a 12 h light/dark cycle, temperature 25 °C±1°C, relative humidity 60%±10%. All mice were free access to water and standard chow, and were acclimatized for 3 days before experiments. After adaptive feeding, the mice were randomly divided into 7 groups: sham (water, i.g.), vehicle (80 mg/kg/d, i.p.), sodium selenite group (30 μg/kg, i.g.), positive control group (lentian, 50 mg/kg, i.g.), low Se-GEP group (100 μg/kg, i.g.), meddle Se-GEP group (500 μg/kg, i.g.), high Se-GEP group (3000 μg/kg, i.g.). All groups, except the sham group, were subjected to immunosuppression by administration of cyclophosphamide (80 mg/kg/d) intraperitoneally for ten consecutive days. From day 1 to day 20, all groups were orally administrated daily. After the last drug administration, all group mice were fasted for 24 h and then the blood and tissue samples were collected for analysis. The protocols for the animal studies were approved by the Institute of Laboratory Animal Resources of Guizhou Normal University (Guizhou, China).
3.8.2. Spleen and Thymus Indices
After last administration, mice were weighted and sacrificed by cervical dislocation. The spleen and thymus tissues were removed and weighted. Relative organ indices were calculated according to the follow formula:
3.8.3. Carbon Clearance Assay
The immune activity of macrophage cells function was assessed by a non-specific carbon clearance test [
39]. The mice were injected with 0.1 mL/10 g body weight of Indian ink (20%, v/v) through tail vein. Blood samples (20 μL) were collected from the retro-orbital venous plexus after 3 min (t
1) and 15 min (t
2), and then were mixed with 0.1 % sodium carbonate solution (2 mL) immediately. The absorbance of these dilutions was measured at 600 nm, where OD1 was for t
1 and OD2 was for t
2. The phagocytic index (α) was calculated as follows:
3.8.4. Serum IL-4 and IFN-γ Assay
Blood samples were collected from the mice orbital vein on the day before the last polysaccharides administration. The sera were obtained by blood sample centrifuged at 3500 rpm for 10 min at 4 °C, and the levels of IL-4 and TFN-γ were measured by using the respective ELISA kits.
3.9. Statistical Analysis
All the results data were expressed as mean ± standard deviation (SD). The group difference was analyzed by one-way ANOVA using IBM SPSS 23.0 software package (Chicago, IL, USA) and GraphPad Prism 8.0 software package (La Jolla, CA, USA). Statistical significance was considered at P<0.05 and P<0.01.
4. Conclusions
In the current study, a high selenized Gastrodia elata Blume polysaccharide, Se-GEP, was prepared through pre-sulfation before conducting the selenization modification. Se-GEP has a molecular weight of approximately 500 kDa with Se content about 2.29%, the average particle size 395.4 ± 18.8 nm, and zeta potential value -28.17 ± 1.59 mV. Structural analysis revealed that Se-GEP contains mainly glucose with α-configuration, and existed as both triple-helical and random coils condition, where selenylation reaction was mostly occurred at the C-6 position. Immunomodulatory effects of Se-GEP on RAW 264.7 cells showed that selenylation modification enhanced cell viability and phagocytosis, elevated the secretion levels of NO and TNF-α. In vivo experiment of Se-GEP on CTX-treated mice revealed that Se-GEP could improve body weight and feed intake on immunosuppressive mice, increase the spleen and thymus indices, enhance the phagocytic function, and activate both Th1 and Th2 lymphocytes. Taken together, these findings suggested that Se-GEP derived from a healthy food Gastrodia elata (G. elata) Blume with selenylation modification was a potential dietary selenium nutrient for improving human immunity.
Author Contributions
Conceptualization, F. M. and S. X.; methodology, Q. W.; software, Q. D.; validation, Q. D. and F. M.; formal analysis, Q. W.; investigation, Q. W.; resources, Y. L.; data curation, B. Z.; writing—original draft preparation, F. M.; writing—review and editing, F. M.; visualization, Y. C.; supervision, Q. D.; project administration, S. X.; funding acquisition, S. X. All authors have read and agreed to the published version of the manuscript.
Funding
This research was funded by Guizhou Provincial Science and Technology Projects (Qian Ke He Pingtai Rencai-CXTD [2022] 002, Qian Ke He JiChu [2019]1013), Guizhou Provincial Education Department (Qian Jiao Ji [2023]042), The special funding of Guiyang science and technology bureau and Guiyang University (GYU-KY [2021], GYU-KYZ [2018]-01-16, GYU-KYZ [2018]-01-20), Talent Introduction Program of Guiyang University (GYU-ZRD [2018]-022), Young and middle-aged academic backbone of Guiyang University (GYURC-20).
Institutional Review Board Statement
The animal study protocol was approved by the Ethics Committee of the Institute of Laboratory Animal Resources of Guizhou Normal University (Guizhou, China) (protocol code 2020030024 and date of approval 2020-03-16).
Informed Consent Statement
Not applicable.
Data Availability Statement
Not applicable.
Conflicts of Interest
The authors declare no conflict of interest.
References
- Coppa, E.; Celletti, S.; Sestili, F.; Mimmo, T.; Garcia Molina, M.D.; Cesco, S.; Astolfi, S. Interaction between Sulfate and Selenate in Tetraploid Wheat (Triticum turgidum L.) Genotypes. Int. J. Mol. Sci. 2023, 24. [Google Scholar] [CrossRef] [PubMed]
- Protti, S.; Fagnoni, M. Recent Advances in Light-Induced Selenylation. ACS Org. Inorg. Au 2022, 2, 455–463. [Google Scholar] [CrossRef]
- Zhan, Q.; Chen, Y.; Guo, Y.; Wang, Q.; Wu, H.; Zhao, L. Effects of selenylation modification on the antioxidative and immunoregulatory activities of polysaccharides from the pulp of Rose laevigata Michx fruit. Int. J. Biol. Macromol. 2022, 206, 242–254. [Google Scholar] [CrossRef]
- Zhang, S.; Zhang, H.; Shi, L.; Li, Y.; Tuerhong, M.; Abudukeremu, M.; Cui, J.; Li, Y.; Jin, D.-Q.; Xu, J.; et al. Structure features, selenylation modification, and improved anti-tumor activity of a polysaccharide from Eriobotrya japonica. Carbohyd. Polym. 2021, 273, 118496. [Google Scholar] [CrossRef]
- Yuan, B.; Yang, X.-q.; Kou, M.; Lu, C.-y.; Wang, Y.-y.; Peng, J.; Chen, P.; Jiang, J.-h. Selenylation of Polysaccharide from the Sweet Potato and Evaluation of Antioxidant, Antitumor, and Antidiabetic Activities. J. Agric. Food Chem. 2017, 65, 605–617. [Google Scholar] [CrossRef] [PubMed]
- Guan, Q.-Y.; Lin, Y.-R.; Li, L.-Y.; Tang, Z.-M.; Zhao, X.-H.; Shi, J. In Vitro Immunomodulation of the Polysaccharides from Yam (Dioscorea opposita Thunb.) in Response to a Selenylation of Lower Extent. Foods 2021, 10, 2788. [Google Scholar] [CrossRef]
- Liu, S.; Hu, J.; Li, M.; Zhu, S.; Guo, S.; Guo, H.; Wang, T.; Zhang, Y.; Zhang, J.; Wang, J. The role of Se content in improving anti-tumor activities and its potential mechanism for selenized Artemisia sphaerocephala polysaccharides. Food Funct. 2021, 12, 2058–2074. [Google Scholar] [CrossRef]
- Lee, J.-H.; Lee, Y.-K.; Chang, Y.H. Effects of selenylation modification on structural and antioxidant properties of pectic polysaccharides extracted from Ulmus pumila L. Int. J. Biol. Macromol. 2017, 104, 1124–1132. [Google Scholar] [CrossRef] [PubMed]
- Wei, Y.; Zhao, Q.; Wu, Q.; Zhang, H.; Kong, W.; Liang, J.; Yao, J.; Zhang, J.; Wang, J. Efficient synthesis of polysaccharide with high selenium content mediated by imidazole-based acidic ionic liquids. Carbohyd. Polym. 2019, 203, 157–166. [Google Scholar] [CrossRef]
- Zhu, S.; Hu, J.; Liu, S.; Guo, S.; Jia, Y.; Li, M.; Kong, W.; Liang, J.; Zhang, J.; Wang, J. Synthesis of Se-polysaccharide mediated by selenium oxychloride: Structure features and antiproliferative activity. Carbohyd. Polym. 2020, 246, 116545. [Google Scholar] [CrossRef]
- Feng, Y.; Qiu, Y.; Duan, Y.; He, Y.; Xiang, H.; Sun, W.; Zhang, H.; Ma, H. Characterization, antioxidant, antineoplastic and immune activities of selenium modified Sagittaria sagittifolia L. polysaccharides. Food Res. Int. 2022, 153, 110913. [Google Scholar] [CrossRef]
- Cheng, L.; Wang, Y.; He, X.; Wei, X. Preparation, structural characterization and bioactivities of Se-containing polysaccharide: A review. Int. J. Biol. Macromol. 2018, 120, 82–92. [Google Scholar] [CrossRef]
- Li, Q.; Zhu, L.; Qi, X.; Zhou, T.; Li, Y.; Cai, M.; Yan, Y.; Qian, J.-Y.; Peng, D. Immunostimulatory and antioxidant activities of the selenized polysaccharide from edible Grifola frondosa. Food Sci. Nutr. 2022, 10, 1289–1298. [Google Scholar] [CrossRef]
- Wang, J.; Zhao, B.; Wang, X.; Yao, J.; Zhang, J. Synthesis of selenium-containing polysaccharides and evaluation of antioxidant activity in vitro. Int. J. Biol. Macromol. 2012, 51, 987–991. [Google Scholar] [CrossRef] [PubMed]
- Cunha, L.; Grenha, A. Sulfated Seaweed Polysaccharides as Multifunctional Materials in Drug Delivery Applications. Mar. Drugs 2016, 14, 14030042. [Google Scholar] [CrossRef]
- Wang, K.; Liu, L.; He, Y.; Qu, C.; Miao, J. Effects of Dietary Supplementation with κ-Selenocarrageenan on the Selenium Accumulation and Intestinal Microbiota of the Sea Cucumbers Apostichopus japonicus. Biol. Trace Elem. Res. 2021, 199, 2753–2763. [Google Scholar] [CrossRef] [PubMed]
- Wang, J.; Yu, S.; Jiao, S.; Lv, X.; Ma, M.; Du, Y. κ-Selenocarrageenan prevents microcystin-LR-induced hepatotoxicity in BALB/c mice. Food Chem. Toxicol. 2013, 59, 303–310. [Google Scholar] [CrossRef]
- C, T.C. Study on the preparation of kappa-selenocarrageenan,physical and chemical properties and biochemistry activities. Acta Bioch. Bioph. Sin. 1988, 20, 259–268. [Google Scholar]
- Zhan, H.-D.; Zhou, H.-Y.; Sui, Y.-P.; Du, X.-L.; Wang, W.-h.; Dai, L.; Sui, F.; Huo, H.-R.; Jiang, T.-L. The rhizome of Gastrodia elata Blume – An ethnopharmacological review. J. Ethnopharmacol. 2016, 189, 361–385. [Google Scholar] [CrossRef] [PubMed]
- Guan, H.; Ling, X.; Xu, J.; Zhu, Y.; Zhang, J.; Liu, X. Structural Characterization of Polysaccharide Derived from Gastrodia elata and Its Immunostimulatory Effect on RAW264.7 Cells. Molecules 2022, 27. [Google Scholar] [CrossRef]
- Huo, J.; Lei, M.; Li, F.; Hou, J.; Zhang, Z.; Long, H.; Zhong, X.; Liu, Y.; Xie, C.; Wu, W. Structural Characterization of a Polysaccharide from Gastrodia elata and Its Bioactivity on Gut Microbiota. Molecules 2021, 26. [Google Scholar] [CrossRef] [PubMed]
- Li, N.; Wang, D.; Wen, X.; Chu, R.; Fan, J.; Chen, Y.; Luo, Y. Effects of polysaccharides from Gastrodia elata on the immunomodulatory activity and gut microbiota regulation in cyclophosphamide-treated mice. J. Sci. Food Agr. 2023, 103, 3390–3401. [Google Scholar] [CrossRef]
- Qiu, H.; Tang, W.; Tong, X.; Ding, K.; Zuo, J. Structure elucidation and sulfated derivatives preparation of two α-d-glucans from Gastrodia elata Bl. and their anti-dengue virus bioactivities. Carbohyd. Res. 2007, 342, 2230–2236. [Google Scholar] [CrossRef]
- Wu, C.; Zhao, M.; Bu, X.; Qing, Z.; Wang, L.; Xu, Y.; Yang, Y.; Bai, J. Preparation, characterization, antioxidant and antiglycation activities of selenized polysaccharides from blackcurrant. RSC Adv. 2020, 10, 32616–32627. [Google Scholar] [CrossRef] [PubMed]
- Wang, P.; Liao, W.; Fang, J.; Liu, Q.; Yao, J.; Hu, M.; Ding, K. A glucan isolated from flowers of Lonicera japonica Thunb. Inhibits aggregation and neurotoxicity of Aβ 42. Carbohyd. Polym. 2014, 110, 142–147. [Google Scholar] [CrossRef] [PubMed]
- Yin, J.; Chan, B.C.; Yu, H.; Lau, I.Y.; Han, X.; Cheng, S.; Wong, C.; Lau, C.B.; Xie, M.; Fung, K.; et al. Separation, structure characterization, conformation and immunomodulating effect of a hyperbranched heteroglycan from Radix Astragali. Carbohyd. Polym. 2012, 87, 667–675. [Google Scholar] [CrossRef]
- Ma, F.; Liu, H.; Xu, S.; Cheng, Y.; Fei, Q.; Chen, H. Isolation of an acidic polysaccharide from the flowers of Leucosceptrum canum Smith and its immunomodulatory activity evaluation. Int. J. Biol. Macromol. 2021, 171, 177–184. [Google Scholar] [CrossRef]
- Guo, R.; Ai, L.; Cao, N.; Ma, J.; Wu, Y.; Wu, J.; Sun, X. Physicochemical properties and structural characterization of a galactomannan from Sophora alopecuroides L. seeds. Carbohyd. Polym. 2016, 140, 451–460. [Google Scholar] [CrossRef]
- Pesek, S.; Lehene, M.; Brânzanic, A.M.V.; Silaghi-Dumitrescu, R. On the Origin of the Blue Color in The Iodine/Iodide/Starch Supramolecular Complex. Molecules 2022, 27, 27248974. [Google Scholar] [CrossRef]
- Kristiansen, K.A.; Potthast, A.; Christensen, B.E. Periodate oxidation of polysaccharides for modification of chemical and physical properties. Carbohyd. Res. 2010, 345, 1264–1271. [Google Scholar] [CrossRef]
- Chen, F.; Huang, G.; Yang, Z.; Hou, Y. Antioxidant activity of Momordica charantia polysaccharide and its derivatives. Int. J. Biol. Macromol. 2019, 138, 673–680. [Google Scholar] [CrossRef] [PubMed]
- Hou, R.; Chen, J.; Yue, C.; Li, X.; Liu, J.; Gao, Z.; Liu, C.; Lu, Y.; Wang, D.; Li, H.; et al. Modification of lily polysaccharide by selenylation and the immune-enhancing activity. Carbohyd. Polym. 2016, 142, 73–81. [Google Scholar] [CrossRef] [PubMed]
- Li, Q.-M.; Teng, H.; Zha, X.-Q.; Pan, L.-H.; Luo, J.-P. Sulfated Laminaria japonica polysaccharides inhibit macrophage foam cell formation. Int. J. Biol. Macromol. 2018, 111, 857–861. [Google Scholar] [CrossRef]
- DuBois, M.; Gilles, K.A.; Hamilton, J.K.; Rebers, P.A.; Smith, F. Colorimetric Method for Determination of Sugars and Related Substances. Anal. Chem. 1956, 28, 350–356. [Google Scholar] [CrossRef]
- Bradford, M.M. A rapid and sensitive method for the quantitation of microgram quantities of protein utilizing the principle of protein-dye binding. Anal. Biochem. 1976, 72, 248–254. [Google Scholar] [CrossRef] [PubMed]
- Blumenkrantz, N.; Asboe-Hansen, G. New method for quantitative determination of uronic acids. Anal. Biochem. 1973, 54, 484–489. [Google Scholar] [CrossRef]
- Guo, X.; Kang, J.; Xu, Z.; Guo, Q.; Zhang, L.; Ning, H.; Cui, S.W. Triple-helix polysaccharides: Formation mechanisms and analytical methods. Carbohyd. Polym. 2021, 262, 117962. [Google Scholar] [CrossRef]
- Kent, P.W. Periodate Oxidation in the Study of the Structure of Dextrans. Science 1949, 110, 689–690. [Google Scholar] [CrossRef]
- Yang, X.-m.; Yu, W.; Ou, Z.-p.; Ma, H.-l.; Liu, W.-m.; Ji, X.-l. Antioxidant and Immunity Activity of Water Extract and Crude Polysaccharide from Ficus carica L. Fruit. Plant Food. Hum. Nutr. 2009, 64, 167–173. [Google Scholar] [CrossRef]
Figure 1.
The average Mw of GEP and Se-GEP (a,b) Particle size distribution of GEP and Se-GEP (c). Zeta potential values of GEP and Se-GEP (d).
Figure 1.
The average Mw of GEP and Se-GEP (a,b) Particle size distribution of GEP and Se-GEP (c). Zeta potential values of GEP and Se-GEP (d).
Figure 2.
UV spectra of GEP and Se-GEP recorded among 200-400 nm (a). FT-IR spectra of GEP and Se-GEP measured in the frequency range of 4000~400 cm-1 (b). Chromatograms of monosaccharide composition analysis (c).
Figure 2.
UV spectra of GEP and Se-GEP recorded among 200-400 nm (a). FT-IR spectra of GEP and Se-GEP measured in the frequency range of 4000~400 cm-1 (b). Chromatograms of monosaccharide composition analysis (c).
Figure 3.
Morphological characterization of GEP and Se-GEP. Scanning electron images of GEP (a) and Se-GEP (b). surface elemental compositions of GEP (c) and Se-GEP (d).
Figure 3.
Morphological characterization of GEP and Se-GEP. Scanning electron images of GEP (a) and Se-GEP (b). surface elemental compositions of GEP (c) and Se-GEP (d).
Figure 4.
The NMR spectra of Se-GEP that were measured in 5-mm NMR tube with 0.5 mL of 99.9% D2O. 1H NMR (a); 13C NMR (b).
Figure 4.
The NMR spectra of Se-GEP that were measured in 5-mm NMR tube with 0.5 mL of 99.9% D2O. 1H NMR (a); 13C NMR (b).
Figure 5.
The I2-KI test of GEP and Se-GEP (a). The maximum absorption wavelength of Congo red test at various concentrations of NaOH (b). The periodate consumption (CP) and formic acid (FA) formation of GEP and Se-GEP during periodate oxidation (c).
Figure 5.
The I2-KI test of GEP and Se-GEP (a). The maximum absorption wavelength of Congo red test at various concentrations of NaOH (b). The periodate consumption (CP) and formic acid (FA) formation of GEP and Se-GEP during periodate oxidation (c).
Figure 6.
The viability of RAW 264.7 cells exposed to GEP, Se-GEP (a,b) or Na2SeO3 (c) for 12 h or 24 h. The data are presented as the mean ± SD. * P < 0.05, ** P < 0.01, *** P < 0.001, and **** P < 0.0001 compared with the negative control group. # P < 0.05, ## P < 0.01, ### P < 0.001, and #### P < 0.0001 compared between the GEP and Se-GEP group.
Figure 7.
Phagocytosis activity analysis (a) and secretion levels of TNF-α (b) and NO (c) of RAW 264.7 cells exposed to GEP, Se-GEP at different dosages for 24 h. The data are presented as the mean ± SD. * P < 0.05, ** P < 0.01, *** P < 0.001, and **** P < 0.0001 compared with the negative control group.
Figure 8.
Effects of Se-GEP on spleen and thymus (a) and carbon clearance assay (b) and the level of serum IFN-γ and IL-4 (c)The data are presented as the mean ± SD. * P < 0.05, ** P < 0.01, *** P < 0.001, and **** P < 0.0001 compared with the Sham control group. # P < 0.05, ## P < 0.01, ### P < 0.001, and #### P < 0.0001 compared with the vehicle group.
Table 1.
The chemical analysis of GEP and its modified products.
Table 1.
The chemical analysis of GEP and its modified products.
| Sample |
Total sugar (%) |
Protein (%) |
Reducing sugar (%) |
Uronic acid (%) |
Se content (μg/g) |
| GEP |
93.18±0.84 |
1.1±0.03 |
0.5±0.24 |
4.7±0.3 |
- |
| D-GEP |
84.28±1.03 |
1.2±0.06 |
2.4±0.55 |
6.6±0.1 |
2805±183.6 |
| S-GEP |
87.74±1.58 |
1.3±0.08 |
2.8±0.18 |
4.8±0.9 |
- |
| Se-GEP |
88.83±1.52 |
1.1±0.04 |
2.6±0.59 |
5.1±1.1 |
22900±2056 |
Table 2.
Body weight and feed intake in mice (n=8).
Table 2.
Body weight and feed intake in mice (n=8).
| Treatment Groups |
Initial Weight (g) |
Intermediate Weight (g) |
Final Weight (g) |
Feed Intake during Modeling |
Feed Intake during Recovery Phase |
| Sham |
22.3±1.02 |
25.3±2.13 |
30.5±1.42 |
15.7±1.13 |
21.0±1.61 |
| Vehicle |
22.4±1.04 |
20.8±2.11****
|
24.0±1.55****
|
8.0±1.05****
|
8.7±1.52****####
|
| Positive |
22.1±0.98 |
21.3±1.98****
|
28.0±1.98*####
|
8.4±0.95****
|
15.8±1.12****####
|
| Na2SeO3 |
21.8±1.05 |
21.1±2.15****
|
26.7±1.95****##
|
8.1±1.18****
|
13.9±1.32****####
|
| Low-dose |
22.3±1.01 |
20.4±2.02****
|
26.8±1.71****##
|
7.8±1.21****
|
15.1±1.81****####
|
| Medium-dose |
22.1±0.99 |
21.0±1.86****
|
28.2±1.99*####
|
8.4±1.95****
|
16.2±0.92****####
|
| High-dose |
22.0±0.89 |
20.4±1.85****
|
29.2±1.89####
|
8.4±0.89****
|
18.9±1.74####
|
|
Disclaimer/Publisher’s Note: The statements, opinions and data contained in all publications are solely those of the individual author(s) and contributor(s) and not of MDPI and/or the editor(s). MDPI and/or the editor(s) disclaim responsibility for any injury to people or property resulting from any ideas, methods, instructions or products referred to in the content. |
© 2023 by the authors. Licensee MDPI, Basel, Switzerland. This article is an open access article distributed under the terms and conditions of the Creative Commons Attribution (CC BY) license (http://creativecommons.org/licenses/by/4.0/).
