
Submitted:
09 July 2023
Posted:
11 July 2023
You are already at the latest version
Abstract
Social network analysis is extensively employed for the examination of relationships and networks among actors across diverse disciplines and thematic research domains. Nevertheless, the utilization of this approach in agriculture and natural resources, particularly pertaining to watershed management, has been relatively limited. The objective of this study is to conduct an analysis of the social interaction and networks of Cidanau Watershed Management (CWM) stakeholders and measure the nodes of units as individuals or organizations in relation to the role and influence of each other through a quantitative approach. The results of the data analysis show that Fkdc has a high degree of centrality and centrality betweenness. This shows that Fkdc has a strong influence and controls CWM network interaction. Conversely, Hs (households) have a low degree of centrality, and centrality betweenness values have a low influence and role in actors’ networks. According to the closeness centrality parameter, it is observed that both Households (Hs) and Universities (Univ) have exhibited the shortest geodesic distance in relation to other stakeholders within the network, thus indicating their highest level of closeness. It means that households and universities had interdependency and were controlled by others. The lowest centrality of Fkdc means that Fkdc has independence of influence and high control access over others. There are four CWM network clusters based on total link strength. Fkdc demonstrates outstanding leadership qualities, enjoys a strong reputation, and possesses a high degree of popularity within the network. Furthermore, Fkdc serves as a positive central node that effectively brings together the interests of all actors, fostering a collective commitment towards shared goals and mutual rewards. In the CWM case, Fkdc is a sustainable watershed organization that acts as a central network body and plays a fundamental role as an intermediary between networks and interactions. Ultimately, with regards to the viewpoint of CWM, the decentralization of watersheds aimed to facilitate wider public engagement by establishing Fkdc as a central network entity and assuming a crucial role as a medium for the dissemination of information, exchange of ideas, and the exertion of influence among its members.
Keywords:
social network analysis
; cidanau watershed management
; fkdc
; Banten province
1. Introduction
The field of social networking comprises interdisciplinary research that aims to forecast the configuration of relationships among social entities while also analyzing the influence of this structure on various social phenomena[1,2]. Social network analysis (SNA) serves as a tool that enables the modeling, visualization, and analysis of interactions among individuals within groups and organizations [2,3,4]. Doing social network analysis requires tools to be able to process data so that it can be visualized and represented in a form that is easy to understand [5,6]. Technological advancements have directly and profoundly impacted the field of social network analysis, enabling the creation of comprehensive frameworks for social networking and automating the analysis of social networks [7,8]. There are numerous social network analysis tools available for visualizing and obtaining optimal results. To achieve the best outcomes, it is imperative to utilize the most suitable tools for executing the analysis [2,7,8].
Several academics showed that a social network is a scientific tool that examines the types of interactions between stakeholders [10,11,12,13]. A social network is composed of individual nodes (persons, teams, or organizations) and ties (also called relationships, connections, edges, or links) between these individual nodes [7,14,15]. It offers a comprehensive analysis encompassing both the structural and mathematical aspects of these relationships. Typically, these networks are represented using graphs, wherein vertices symbolize the social entities and edges symbolize the connections formed between them [5,7]. According to [16], the immersion of people in collaboration has become one of the most powerful notions in social networks. Social network theory offers an explanation for how individuals come together to form enduring and functional societies [3,17].
This capability empowers researchers to derive insights regarding the structure, dynamics, and participation patterns inherent in these groups [14,18]. It encompasses various measures, such as degree (indicating the number of connections an individual has with other members), betweenness centrality (highlighting an individual's significance in the network as a bridge between other participants), closeness centrality (illustrating the proximity of an individual to others in the network), and eigenvector centrality (assessing an individual's prominence based on their connections with other influential individuals in the network) [3,8,19].
2. Literature Review
SNA is widely used to analyze the relationships and networks of actors in various disciplines and thematic research. Disciplines including business management, public health [3,20,21], anthropology, sociology, social psychology, communication studies, information sciences [7,8,22], have widely utilized social network analysis (SNA) to address diverse organizational and network scenarios. The number of research findings and the number of research teams dedicated to studying social networks have experienced substantial growth in the recent decade [8,23]. This can be attributed to the recognition of the social network methodology as an efficacious model for devising innovative solutions to critical [7,22]. Nevertheless, despite its value in studying these relationships, social network analysis (SNA) has seen limited applications in the context of agriculture and natural resources, such as watershed management [1,24,25].
Water and watersheds play an important part in societal economic and communal well-being [26,27]. Watershed management is a complex and challenging problem to solve, and none of the organizations and institutions shown operate completely independently of others; collectively, they impact water and the environment in a variety of ways [27,28]. It requires interdisciplinary approaches, stakeholder engagement, adaptive management strategies, and continuous learning to address the wicked nature of the problem effectively. Institutions encompass determinations regarding the inclusion of participants in decision-making processes, the manner and conditions under which actions can be undertaken, the delineation of jurisdictions for various issues, and the mechanisms through which current actions and previous decisions can be scrutinized, evaluated, and revised by relevant stakeholders [28,29].
Within each watershed, there exists an institutional landscape—an intricate yet predominantly imperceptible terrain comprising rules and organizations that shape and impact human decision-making, resource utilization, and the interplay between individuals and the natural environment[30]. According to [31,32,33], complex interactions between different actors and sectors help characterize environmental policy and decision-making. This makes stakeholders vertically change from traditional policy to comprehensive or participatory management[34,35,36]. The meaningful engagement of stakeholders, including local communities, government agencies, industries, and environmental organizations, plays a pivotal role in ensuring the success of watershed management initiatives. Inadequate involvement of these stakeholders can lead to a lack of ownership, limited support, and insufficient consideration of diverse perspectives and interests, underscoring the importance of their active participation [6,8]. The achievement of sustainable watershed management outcomes relies on the crucial elements of collaborative decision-making and active stakeholder participation [37]. While collaboration ideally entails the integration of diverse stakeholders working collectively to design and implement interventions and governance regimes, the practical implementation often leans towards a more transactional approach rather than a deeply collaborative one [30,38]. And social network analysis of the watershed stakeholder’s engagement became the key point for solving the wicked problem of watershed management
Network analysts perceive these networks as the fundamental constituents of the social realm, as they not only gather distinctive forms of data but also approach their analyses from a fundamentally distinct standpoint compared to researchers employing individualist or attribute-based perspective [1,2,4]. Social network analysis is founded on the principle that social existence is primarily and significantly shaped by relationships and the patterns that emerge from these connections [18]. Individuals engage in social networks through interactions with their families, friends, colleagues, and other individuals or groups. Social networks establish links among people based on shared interests and/or various forms of interdependencies [1,4]. Network mapping and social network analysis serve as techniques for visually representing the quality and quantity of connections within a network of partners [1,3]. They enable the observation of collaborative relationships, resource exchanges, levels of trust and value among partners, and numerous other factors.
From previous research, the failure of decentralized watershed management is caused by a lack of clear roles, responsibilities, and coordination mechanisms, which leads to fragmented and inefficient decision-making, inadequate enforcement of regulations, conflicting policies, and jurisdictional issues that can undermine the effectiveness of management efforts [39]. A major collaborative watershed governance implementation challenge is the lack of a leading organisation[30]. Watershed decentralization, in common understanding, refers to the transfer of authority for watershed management from the Central Government to the Local Government. In this perspective, the local government still holds command and control over watershed management and tends to overlook public participation. In Cidanau Watershed Management (CWM), the public urges the government to be involved and participate in the management of the Cidanau watershed, leading to the establishment of FKDC as a collaborative institution that has performed until today. It is interesting and challenging to study how actors share networks and connections, allowing public participation in CWM to endure up to the present time. We consider social networks a crucial factor in determining the success of CWM. This study emphasizes to the actors networks frame the dynamic change for sustainable CWM and propose to answering the lact of leading organisation in previoues study.
3. Materials and Methods
3.1. Research Area
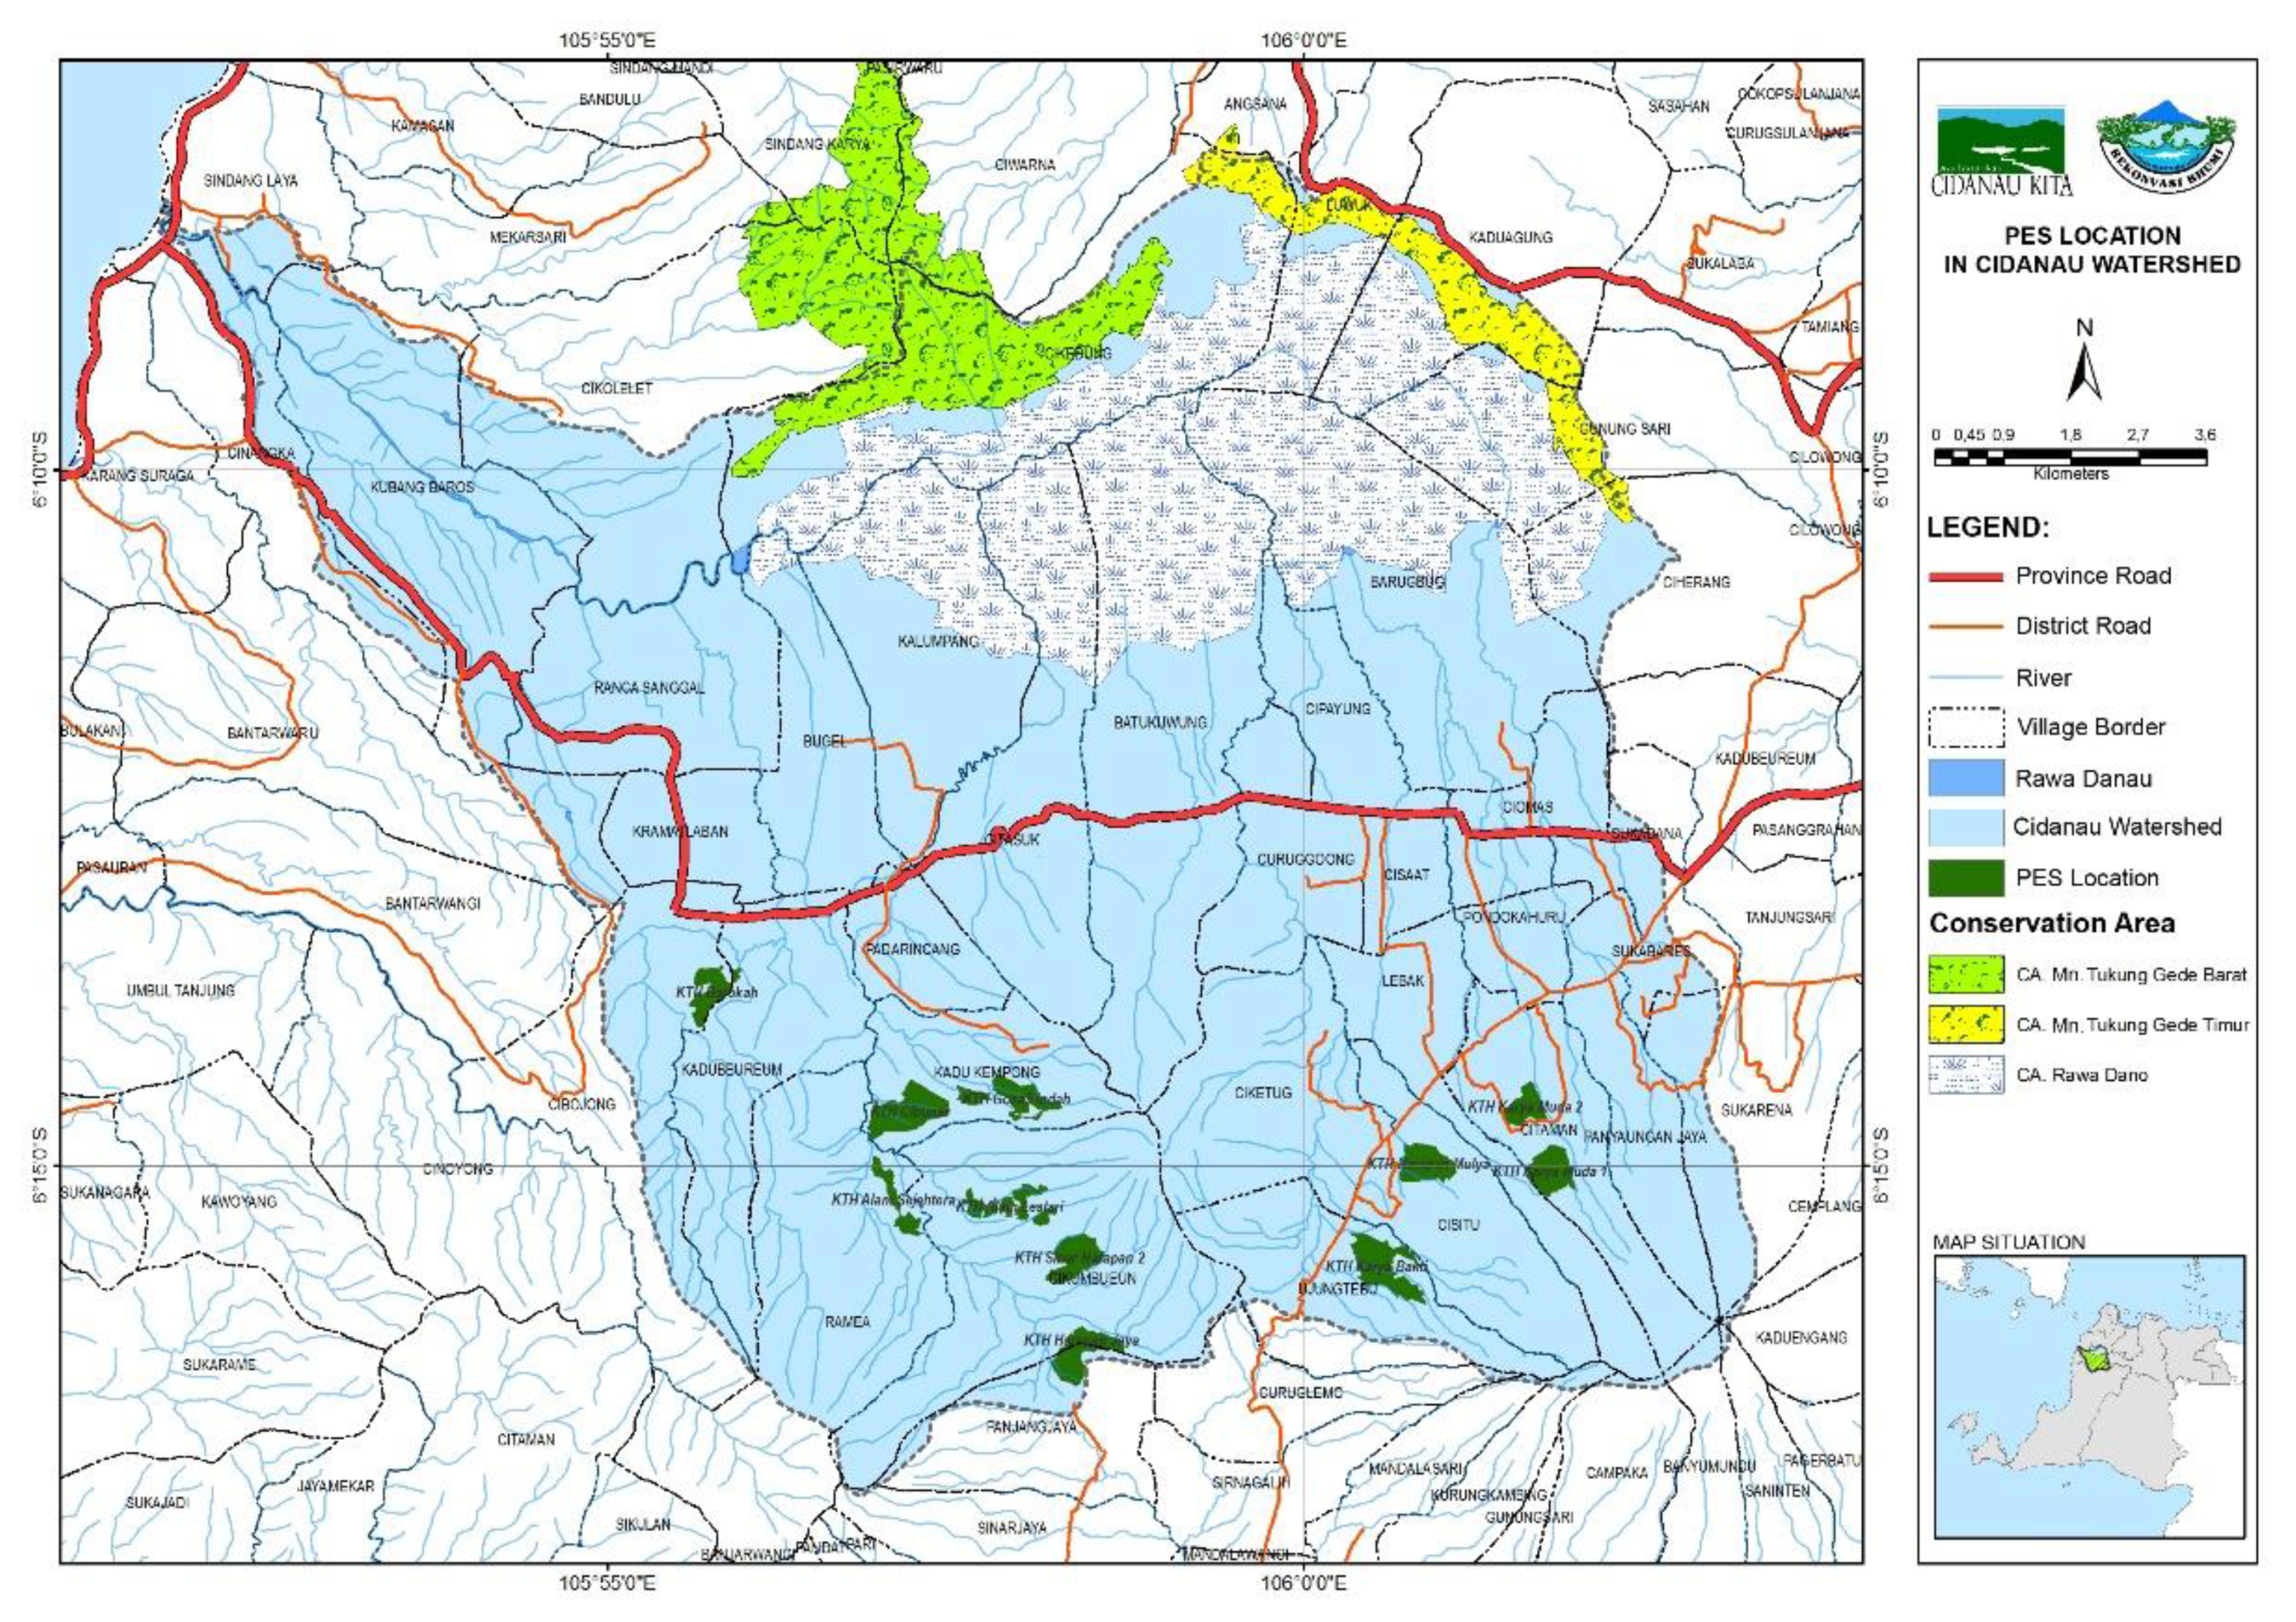
In the 1990s, there is a fast conversion from dry land and swamp forests to residential neighborhoods and agricultural rice fields in the upstream regions of the Cidanau watershed and Rawadanau swamp (midstream of Cidanau watershed) due to poverty [40,41,42]. This generates chemical build-up from fertilizers because the lack of sewage treatment degrades the water quality [43,44,45]. According to [46], rehabilitation programs, security patrols, surveillance, and infrastructure upgrades are efforts made to prevent the problem related to a top-down policy. This helps to reduce the Cidanau watershed's role and satisfy water requirements, specifically during the dry season.
The Cidanau watershed assists to deliver sufficient and high-quality water to prevent harm to upstream ecosystems [47,48,49,50,51]. Cidanau watershed is established to generate economic growth in Banten Province's western section [40,52], by supplying industrial and domestic raw water, as well as becoming a reservoir with a suitable outflow [53].
The water quality and quantity become an impediment to industrial and household demands, socioeconomic, ecological, and environmental growth if there is available water [40,54,55]. In the middle of the Cidanau watershed, there is a 2,500-hectare Rawa Danau Nature Conservations area [56]. According to [56], this area is the main reservoir that exists on Java island. Based on previous study, indicated that the Cidanau watershed become a critical raw water supply that is far more than satisfying the societies because it has an average discharge of 80–100 liters/second.
Figure 1.
Research area of CWM. Sources : Env. and Forestry Agency of Banten Province
3.2. Social Networks Analysis Method
In the context of Cidanau Watershed Management (CWM), the logical collection of real data necessitates the utilization of analysis tools and appropriate methodologies, owing to the diverse array of stakeholders involved. According to [14], social network analysis is conducted using six steps.
Figure 2.
Procedures of social network analysis. Sources: [14]
Figure 2.
Procedures of social network analysis. Sources: [14]
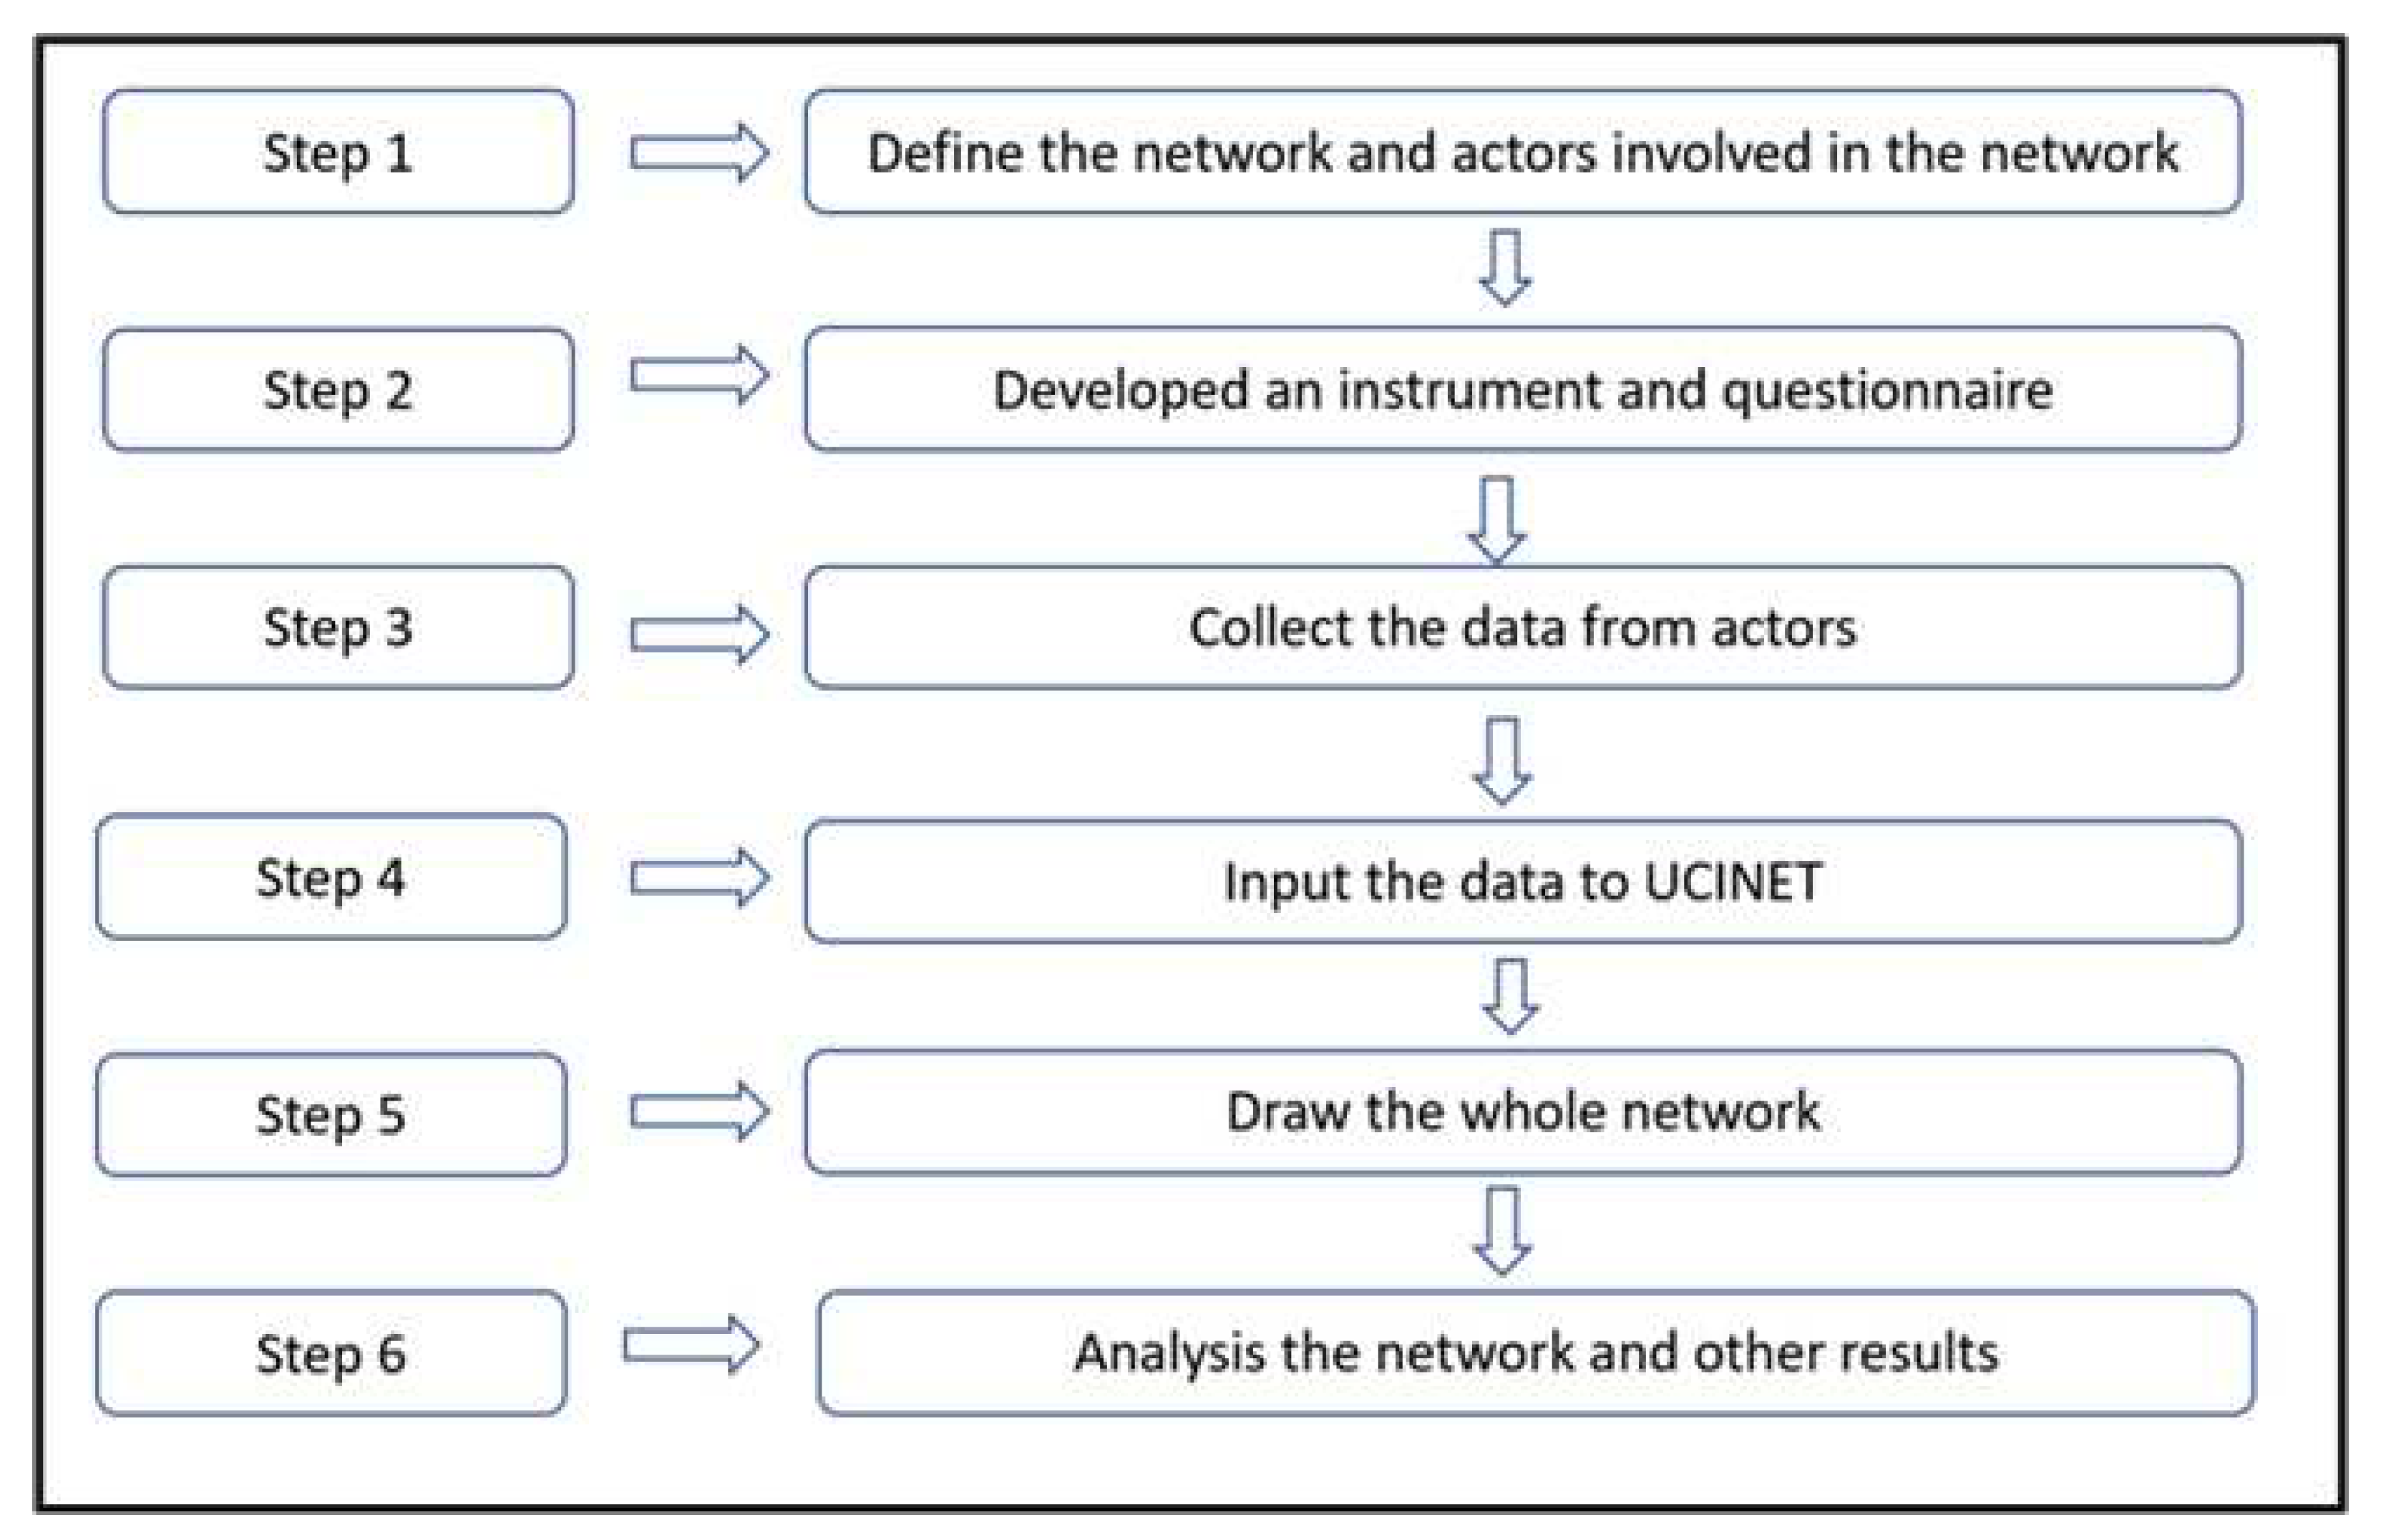
The first stage is to identify the actors (individuals, government, non-government organization, public organizations, industry, university, etc) involved in CWM. The Researchers identified 22 actors involved in CWM from upstream to downstream of the Cidanau watershed. To make it easier to analyze, the researcher uses an abbreviation (node variable) for each actor involved. Actor data involved in CWM, Table 1 displays the aforementioned information.
The second is to administer effective questionnaires or surveys to stakeholders for SNA data collection and analysis. he next step is to collect, record and store the data. After Data collection was carried out by means of a Limited Group Discussion Forum for participants/actors involved in CWM. The data generated through conversation to informant’s interview involved and understanding the trajectory on CWM to elicit facts or statements from the interviewer (see table 1). The Group Discussion Forum is conducted for representatives of actors who have knowledge and involved in CWM. Participants asked to fill in a matrix showing the relationship between one actor and another. The existence of a relationship between actors is given a score of 1, while there is no relationship between actors is given a score of 0.
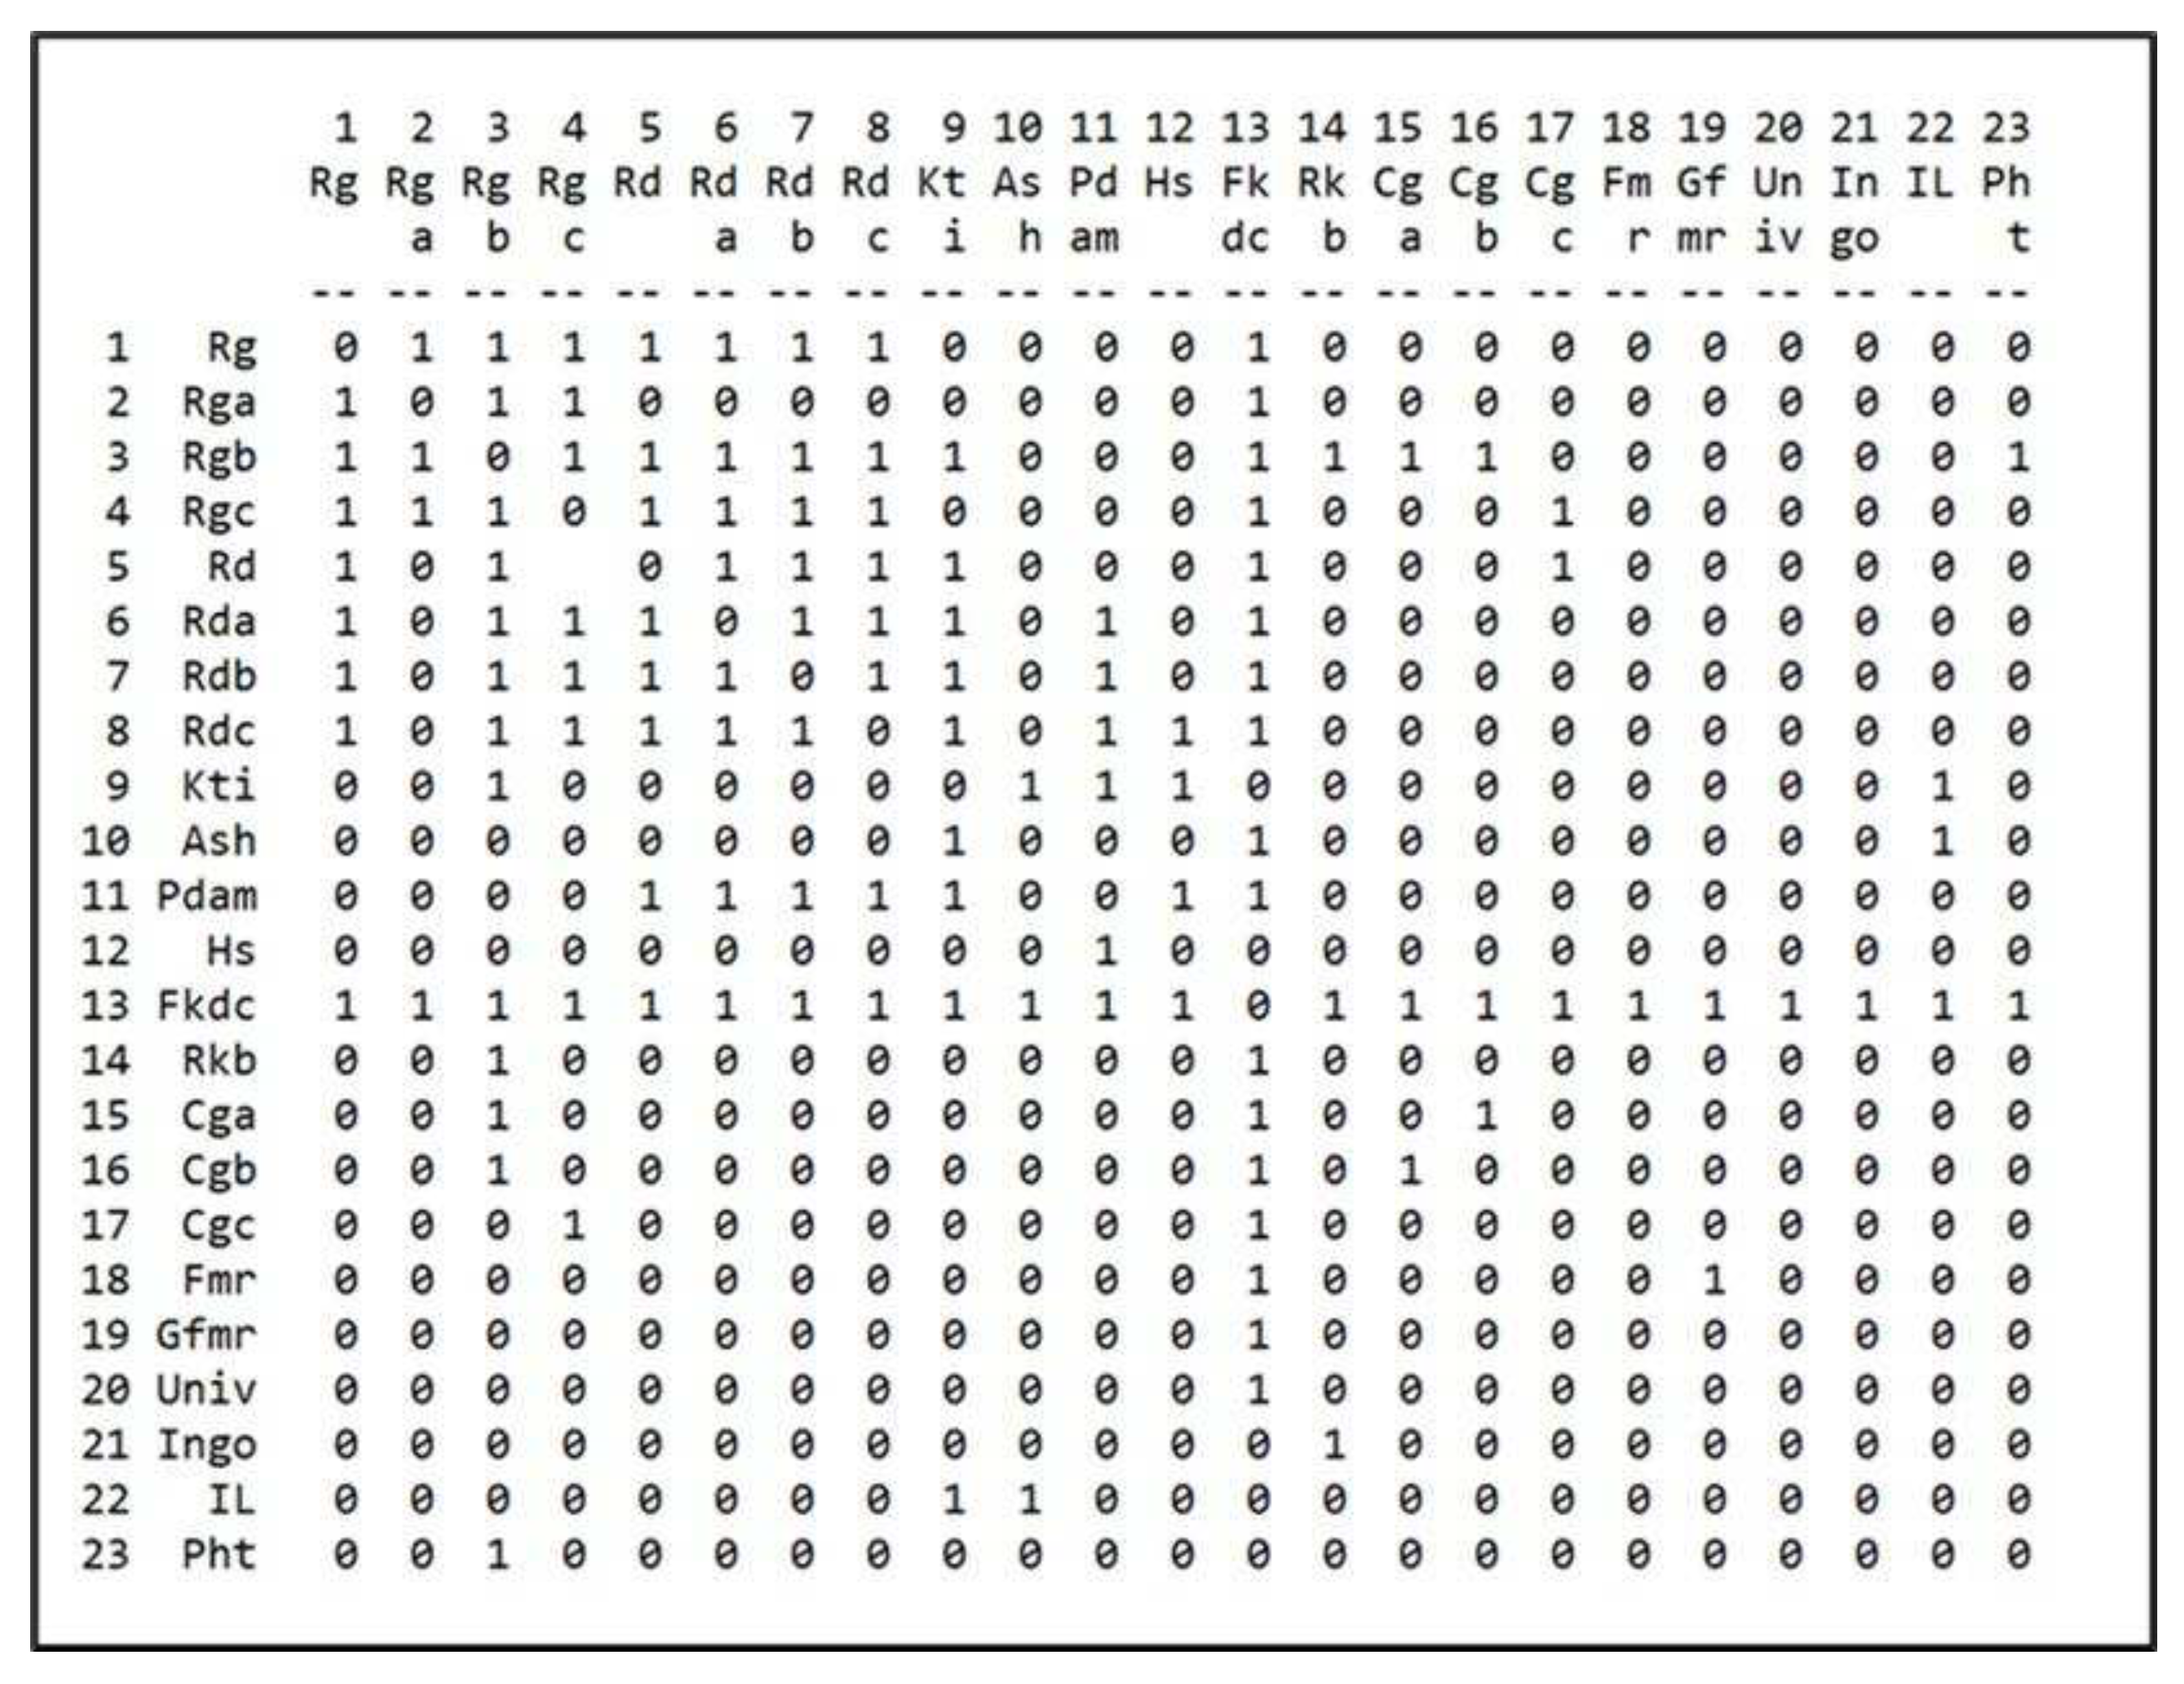
The third step involves the collection of data from actors. Specifically, data is gathered from participants who are part of the identified network, utilizing the questionnaire that was developed in Step 2. This step aims to identify both the actors and participants and the ties (which serve as a common source of information). Currently, it is customary for Social Network Analysis (SNA) to be conducted using specialized software. In such cases, the data needs to be stored in a format that is compatible with the software. This often entails storing the data in commonly used software packages like Microsoft Excel or Access. However, in situations where specialist software like UCINET is being utilized, the data is directly input into that software package. Figure 3 provides a comprehensive overview of the relationships among actors in the Contextual Web Mining (CWM) framework.
Figure 3.
Matrix data set of Cidanau watershed stakeholders
The fourth step is input data to UCINET 6 (a user-friendly SNA package for analysis of social network data) [3,57]. This step will produce a matrix of residents and their sources of information for landscaping decisions and ties between them. Presenting data in picture or diagram form is normally the easiest part of SNA. Once the information has been collected and stored then computer software can be used to generate a map (or different maps) of the network. There are also other ways in which data can be presented, including matrices, graphs, tables and plots. These are described in the following section.
Furthermore, the fifth step is to draw the network and identify the interconnection between nodes. It is important to note that SNA software can help present and display data with a view to supporting analysis, but the analysis itself needs to come from human beings. The final step is to recommend appropriate action and analyze the data which is presented and displayed by the SNA. The Data collected through limited group discussion to key actors deliberated CWM.
The present study employed a social network as a scientific methodology to evaluate the nature of relationships that exist among actor [32,34,35]. UCINET software used to analysis complex relationships among diverse individuals in a single group or social network[13,57]. UCINET is a computer program of a general purpose designed for network analysis [10,13]. UCINET is a comprehensive software package that facilitates the analysis of social network data, along with other 1-mode and 2-mode data. While it can accommodate a maximum of 32,767 nodes (with certain exceptions), the practical efficiency of various procedures tends to diminish when dealing with 5,000 - 10,000 nodes. This user-friendly program encompasses fundamental graph theoretical concepts, positional analysis, and multidimensional scaling, making it a valuable tool for social network analysis.
4. Results
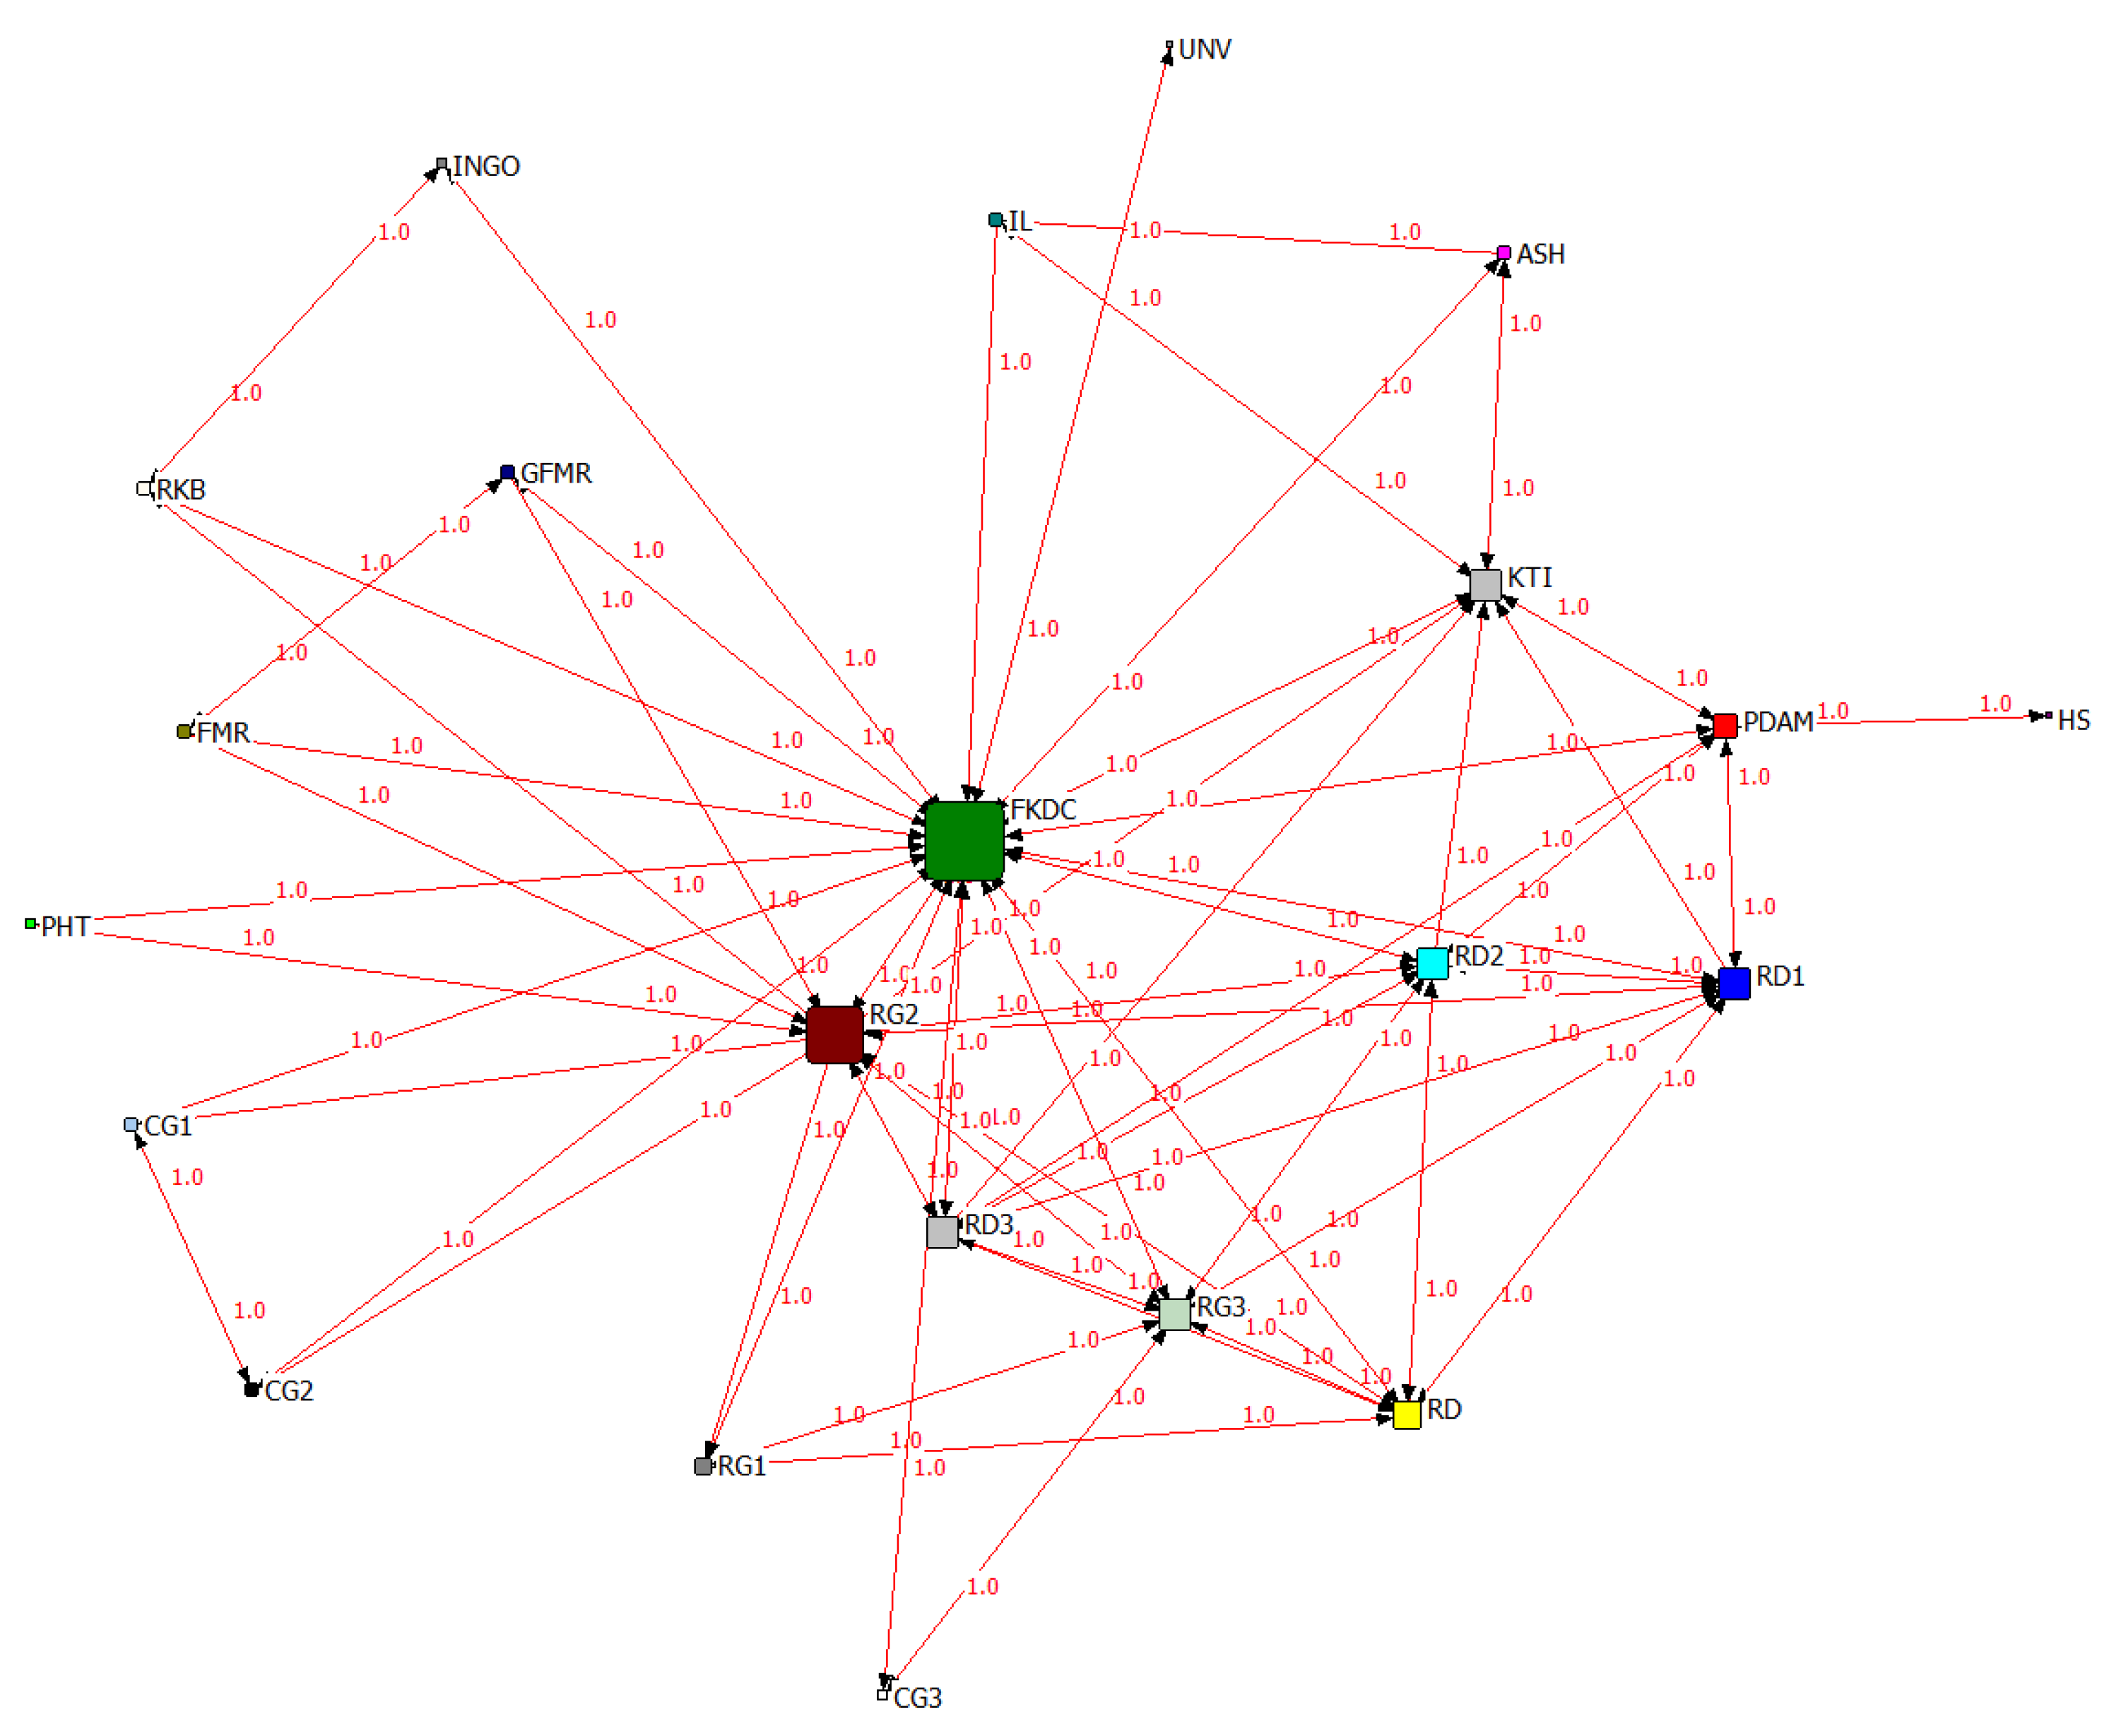
4.2. Sociogram Analysis
The sociogram visually represents the social interactions among actors in CWM by conceptualizing individuals or organizations as nodes and their relationships as ties between the nodes. In the sociogram, two nodes that have a relationship are connected by a tie, while nodes without a tie indicate the absence of a relationship. Nodes are differentiated by color, size, and shape, reflecting individual-level characteristics, whereas ties are represented by various characteristics of the relationship, such as communication frequency or relationship strength. Through the mapping of connections among actors, the network analysis reveals the variations in influence, interests, and objectives of each actor involved in CWM. Some actors possess significant influence, while others have limited influence within the CWM context. There are actors who have high influence, but there are those who have low influence in CWM. There are actors who have certain interests and there are actors who have less interest in CWM. However, all actors involved in the management of the Cidanau Watershed have made a common-sense commitment to preserve the Cidanau Watershed for sustainability.
4.2.1. Network Degree Centrality of CWM
A highly centralized network is one in which a small number of persons or organizations control a greater fraction of the connections than is proportional to their size [34]. When regarded in this node size, the metric is a useful tool for considering power and equity in a network in terms of how the network is structurally structured. Degree network centrality of CWM is measures how important a person or organization is to a network or the power of an actors in a network. Centrality used to identify essential members in a CWM network. Depending on the metric utilized, centrality measures reflect the extent to which a network is directly connected to numerous others (degree centrality), indirectly linked to many others (closeness centrality), or the degree to which an individual exercises control over information or resources within the network and acts as a critical intermediary between multiple nodes (betweenness centrality).
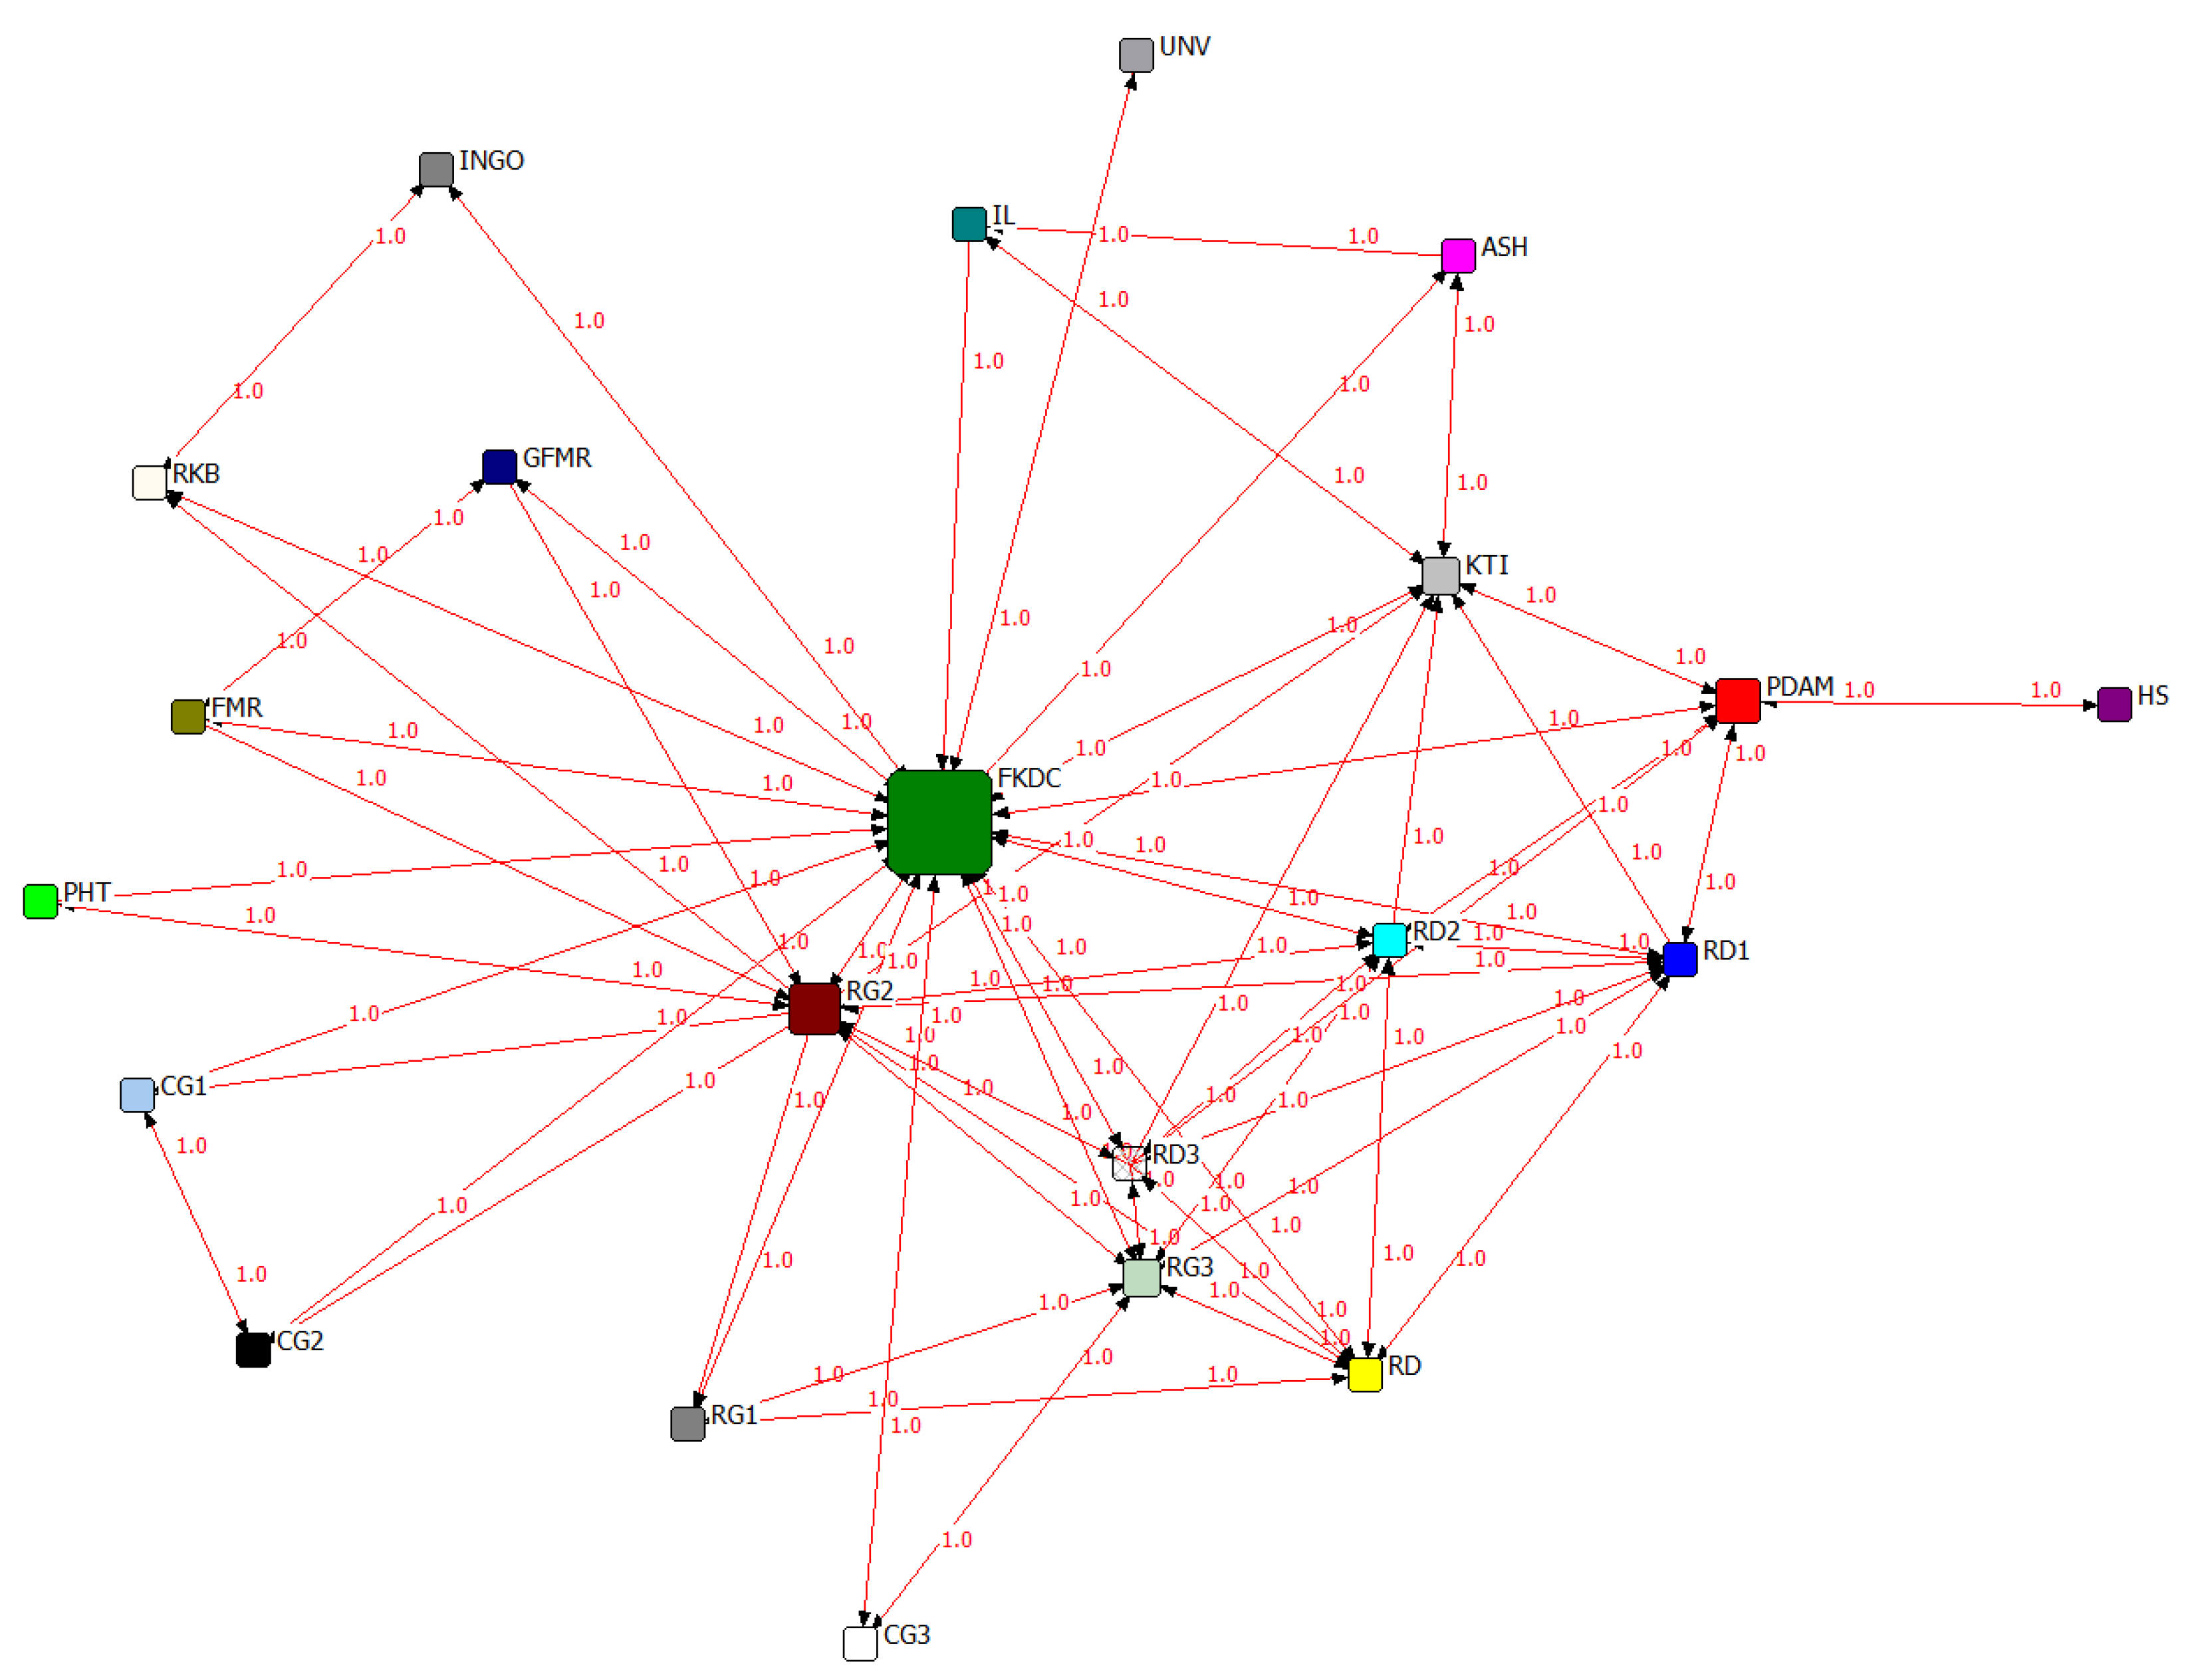
The centrality index identifies nodes that hold critical positions within a network, often associated with exceptional leadership, high popularity, or an excellent reputation within the network. Central positions always get equated with remarkable leadership, good popularity or excellent reputation in the network. Figure 4, demonstrates that Fkdc is the major node of interaction and network for all entities participating in CWM. The larger size of the Fkdc nodes signifies a higher degree centrality, indicating that node Fkfdc attained the maximum frequency. High centrality ratings define actors in networks with the most structural meaning, and these individuals are expected to play a prominent part in both simulated and real-world behaviors[5]. Furthermore, Fkdc demonstrated the highest level of trust among all other actors involved in CWM. The second highest degree centrality is Rg2, because it was the most connecting to others actor in CWM. Fkdc and RG2 had higher social influence, promoting trust links and influencing network dynamics in the management of the Cidanau watershed. The lowest degree centrality is node Hs (households), because only one ties connected to node Pdam (District water services company). Households is the passive actors and less network to other stakeholder, but it should be educated to be wise as water user.
Figure 4.
Trust network degree centrality index of CWM
4.2.2. Trust Network Due to Output Betweenness Centrality
Betweenness centrality reveals the presence of actors holding distinctive positions within a network, serving as communication bridges that other actors must pass through to connect with other network members. The greater the number of actors relying on such intermediaries for communication, the higher their influence. Nodes with high betweenness centrality values play a significant role in facilitating communication within the network. Betweenness centrality considers the number of shortest paths in the network that pass through a node, taking into account the connectivity of the node's neighbors and assigning greater value to nodes that bridge clusters.
Figure 5 illustrates that Fkdc attained the highest betweenness centrality, positioning it as one of the key actors within the trust network of stakeholders in CWM. Fkdc occupies a central position within the network, strategically positioned to exercise significant control and serve as a broker for transactions among other stakeholders. All actors are connected to Fkdc, this shows that Fkdc is trusted mediator for others in CWM network. Rg2 also has high betweenness centrality, beside Fkdc. Rg2 is a government institution at the provincial level, which acts as an intermediary for stakeholders, especially for other government institutions. Households have the lowest betweenness centrality, this is because households are passive actors (water users) and are not directly involved in CWM management. Households only indirectly connected to Pdam.
Figure 5.
Trust network due to output Betweenness Centrality.
4.2.3. The trust network exhibits output closeness centrality as a determinant factor
Closeness centrality, which is defined as the reciprocal of the average geodesic distance, serves as a measure of proximity within a network. It represents the average of all geodesic distances between a given actor and other actors in the network. A higher value in closeness centrality indicates that the node is reachable with fewer links, reflecting the actor's ability to quickly access others within the network.
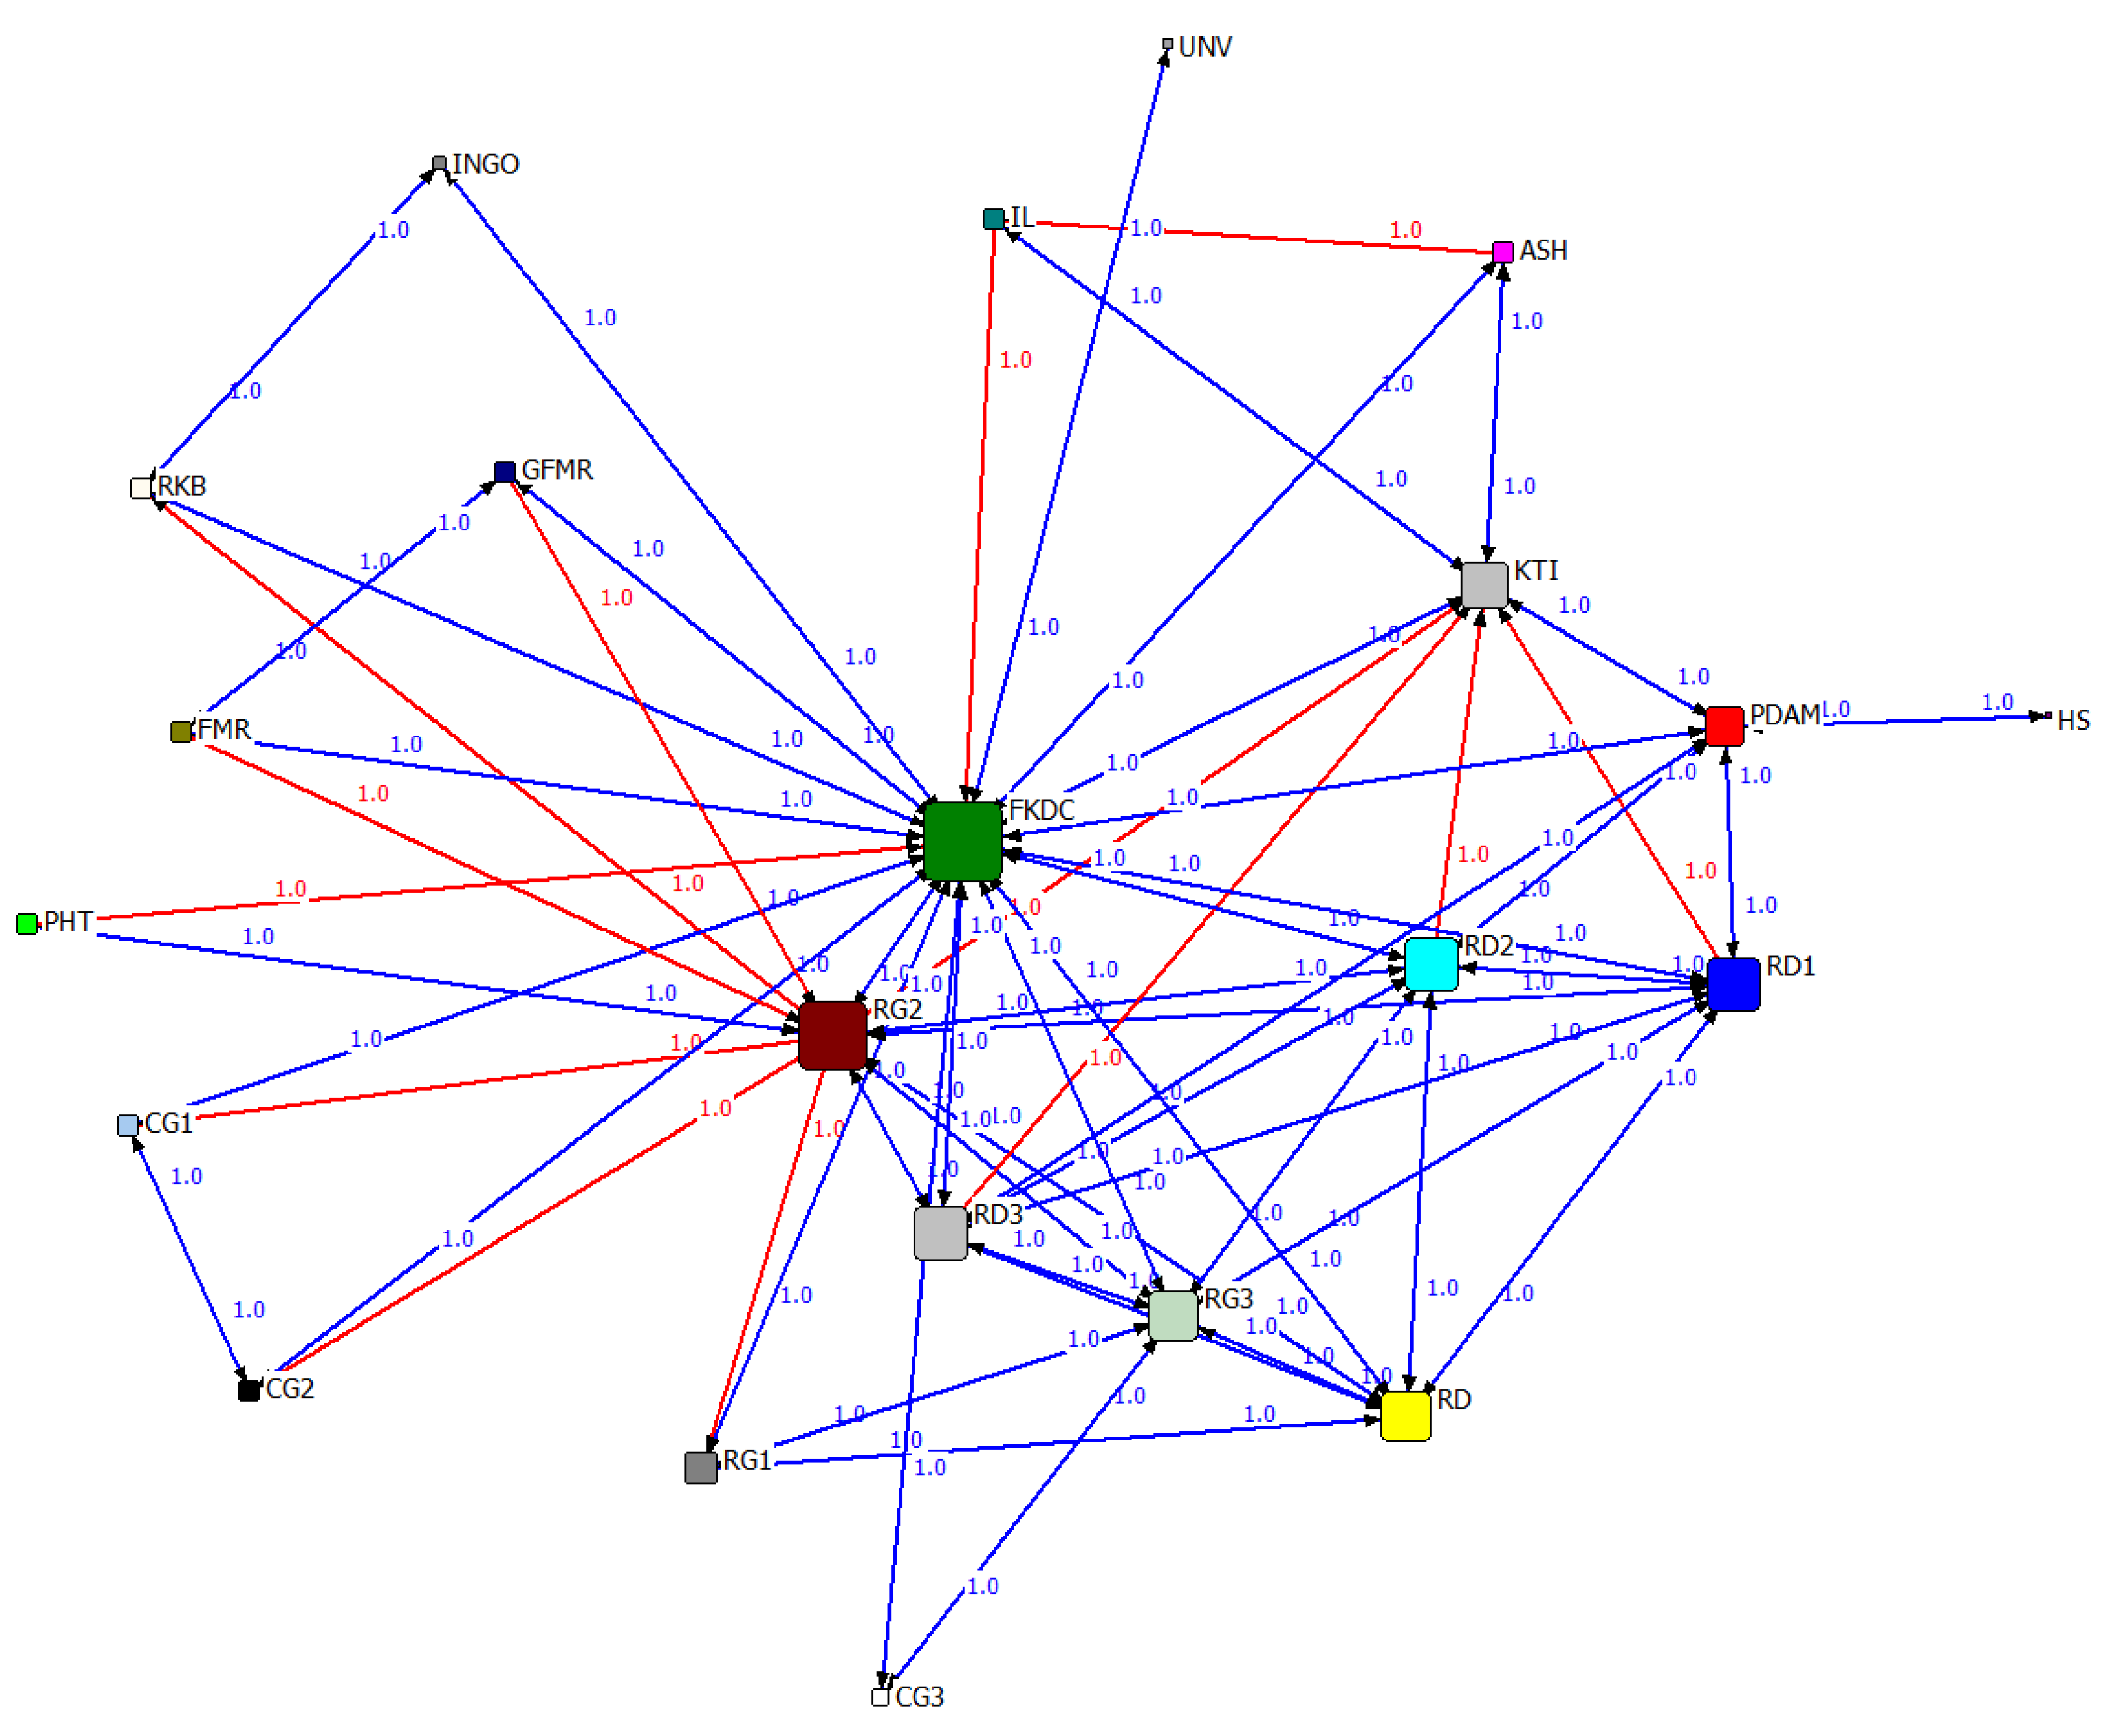
In Figure 6, it can be observed that Households (Hs) and University (Univ), represented by the purple color, have the shortest geodesic distance with other stakeholders in the network and possess the highest closeness centrality. Households, as water users, are directly connected to Pdam, the local public water services company. Similarly, the University is connected to Fkdc, which serves as the central node in the network. The high closeness centrality of these nodes indicates their effectiveness in exchanging content within the network, their easy accessibility to other nodes (stakeholders), and their crucial role in distributing information or content among other stakeholder groups in the CWM network. This implies that if an idea or information exists somewhere in the network, it is likely to reach a node with high closeness centrality after a few interactions.
Figure 6.
The trust network exhibits output closeness centrality as a determinant factor
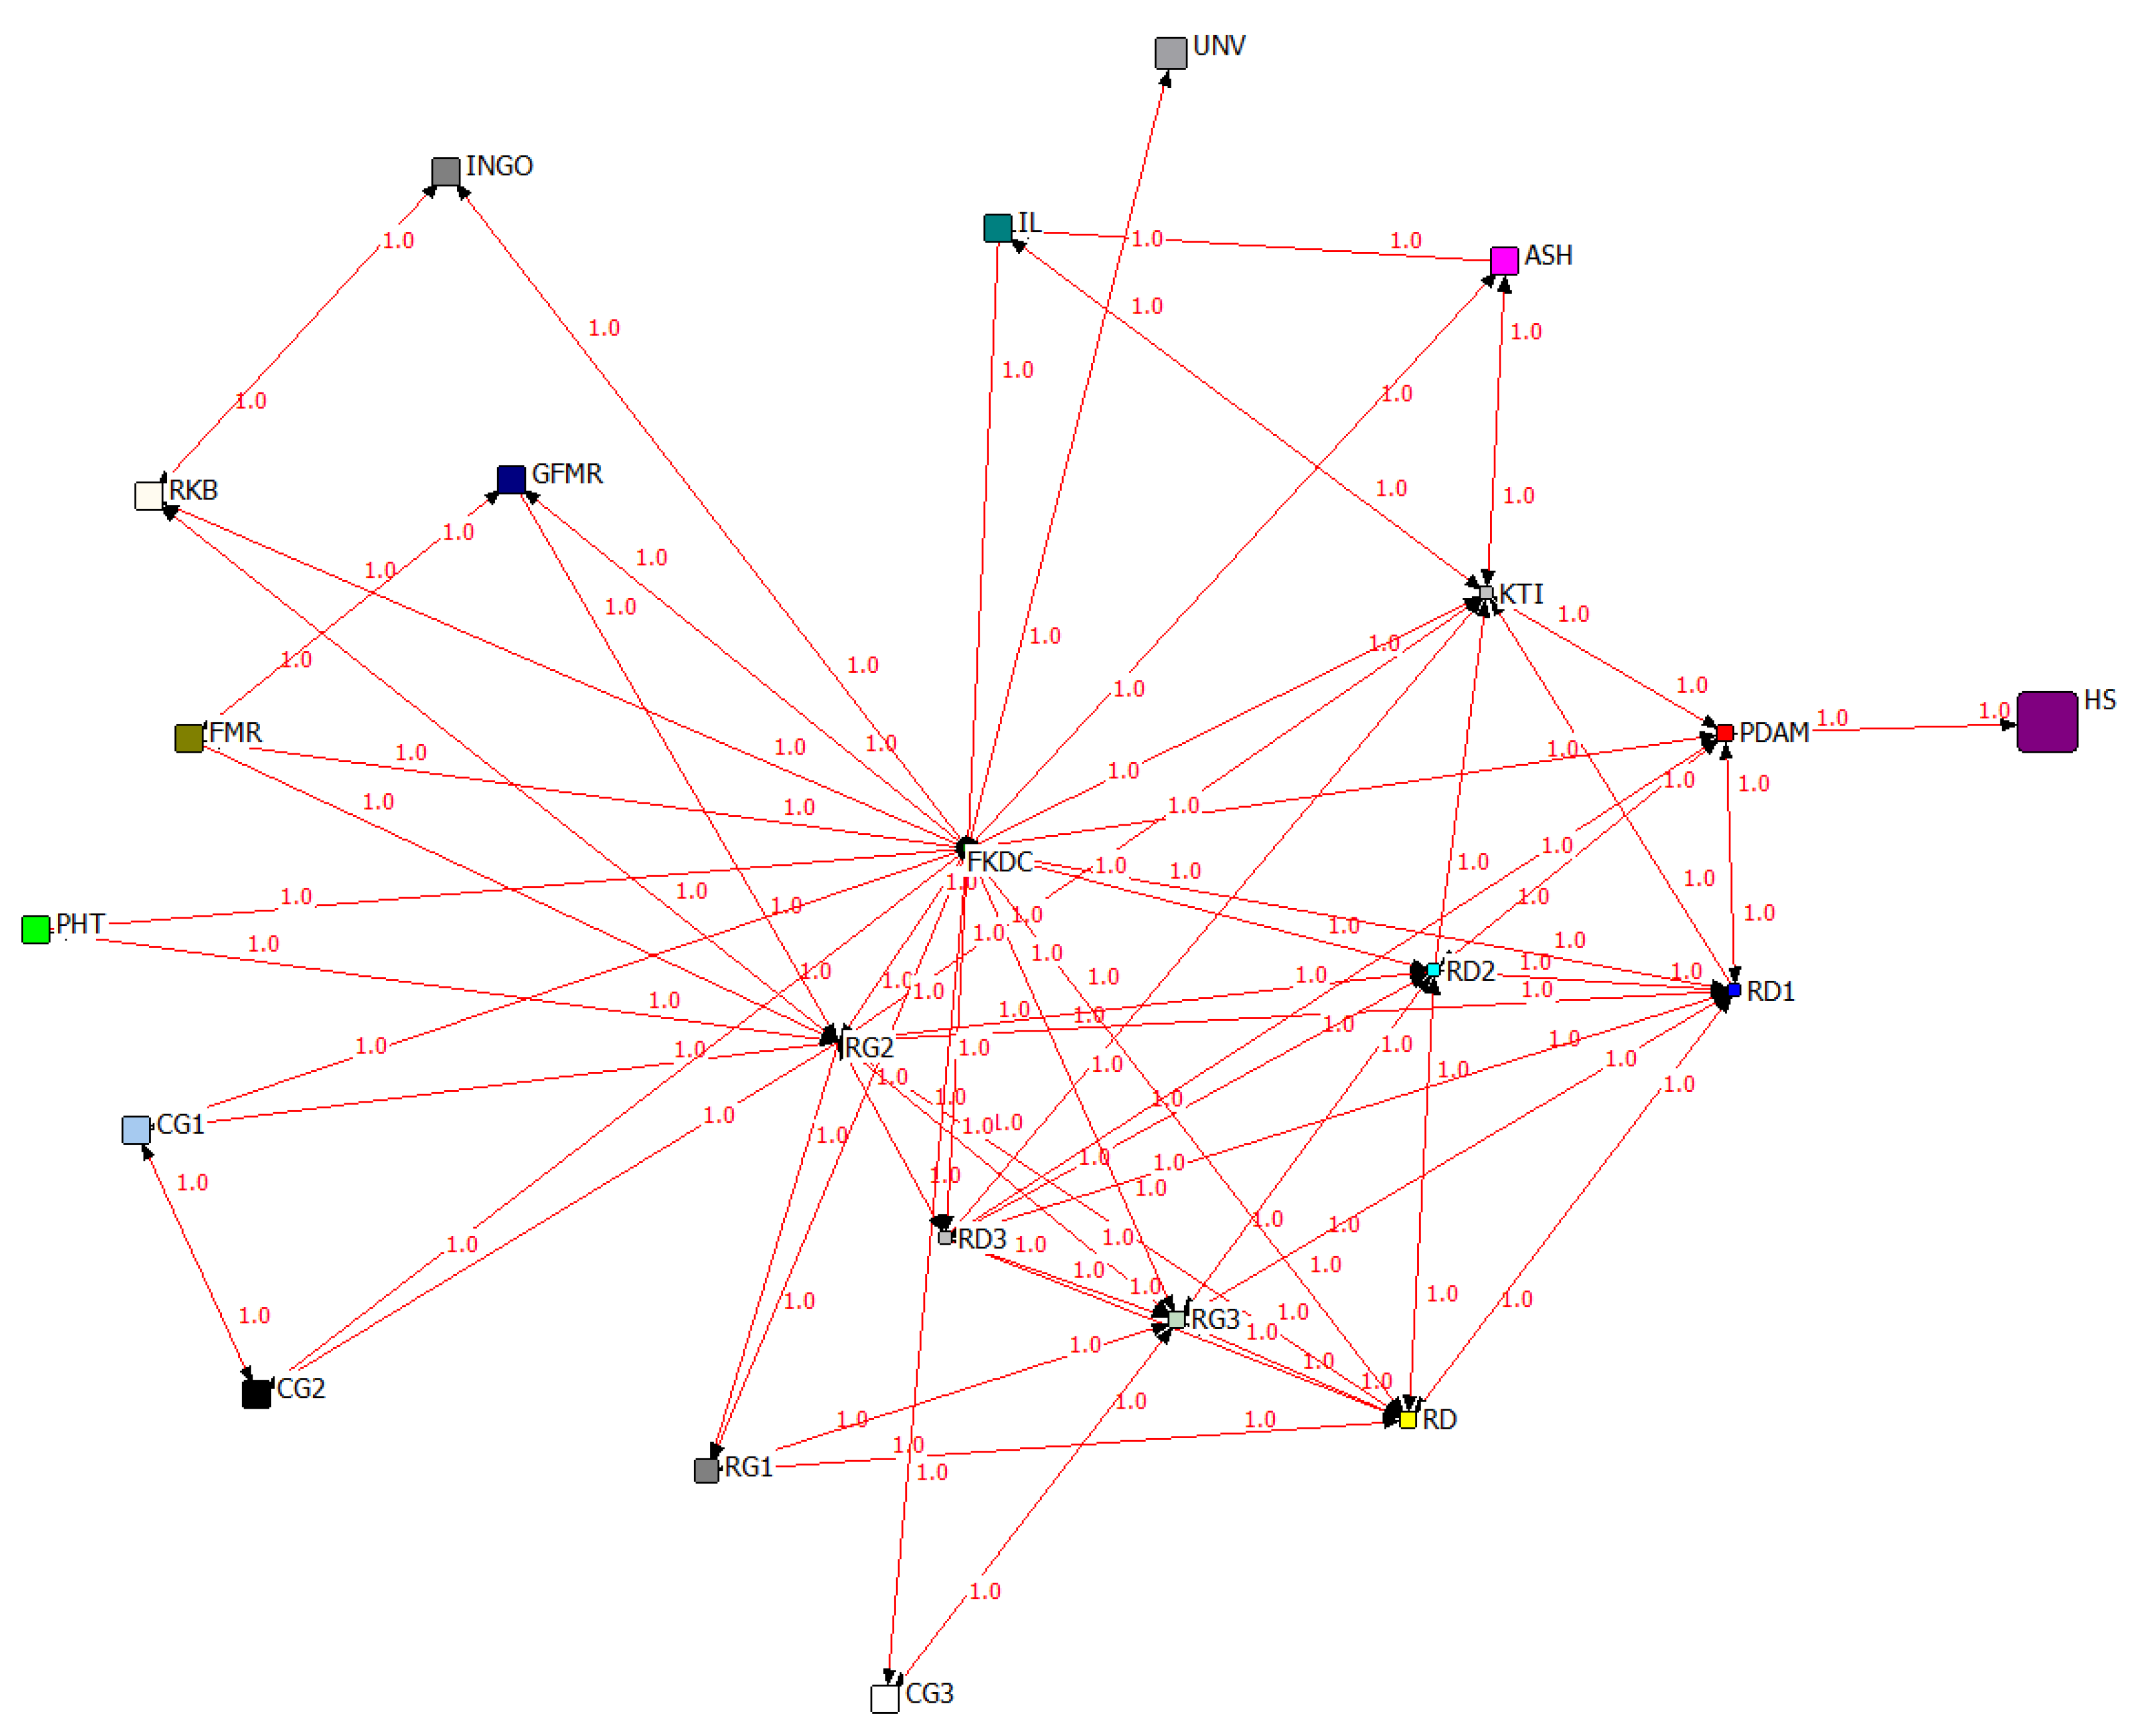
Figure 7.
The trust network demonstrates reciprocal degree as a determining factor
Reciprocal degree serves as a metric to depict the presence of reciprocal relationships among actors and the level of sustainability and cohesion within the network. In networks where an actor can select another actor in multiple instances, the links between nodes can be assigned weights. The strength of a node is measured by the cumulative weight of its links and can be seen as analogous to the degree of a node. Typically, two types of strength are considered: in strength, which represents the sum of weighted links directed towards a node, and out strength, which represents the sum of weighted links originating from a node.
Fkdc has the largest number of links (in strength), in this case Fkdc can be a facilitator node for other actors. This shows that Fkdc is a trusted and important actor in the network because almost all actors involved in CWM have ties to Fkdc. Meanwhile, in strength, Fkdc only has 2 links, namely links to Il and Pht, because both actors are parties whose level of involvement in CWM is low.
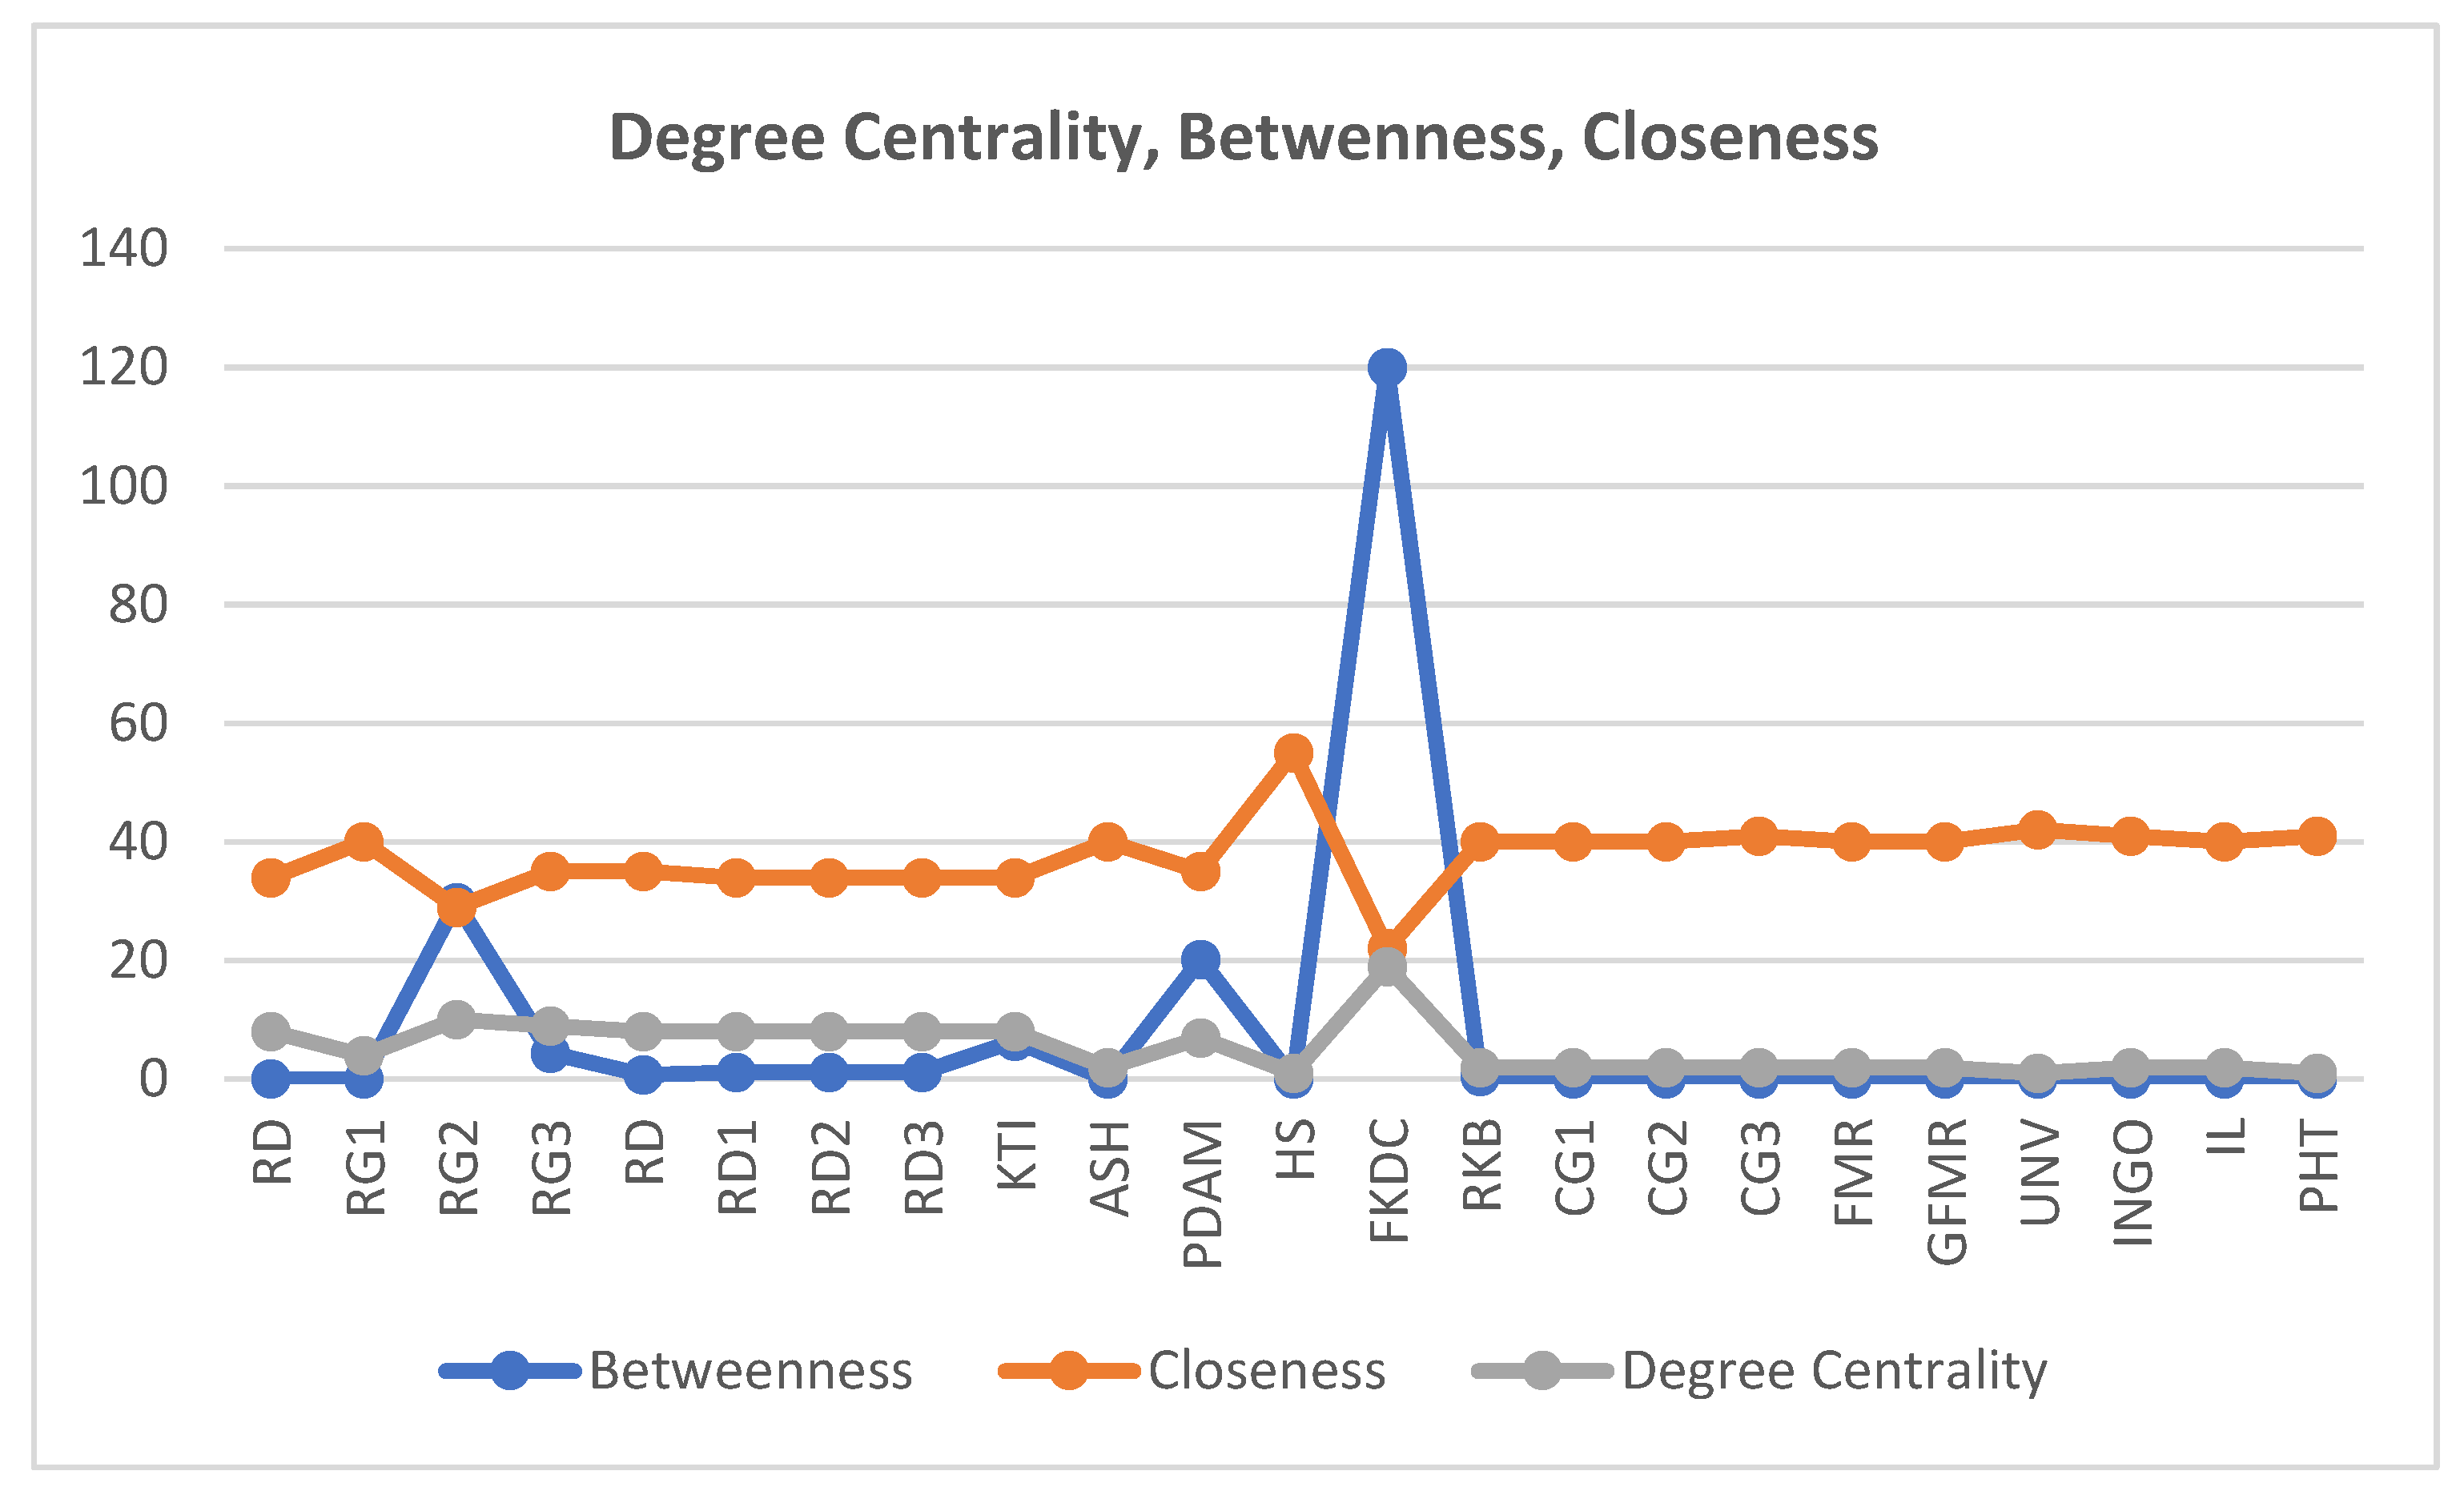
Figure 8 displays the values of betweenness centrality, closeness centrality, and degree centrality. Fkdc has the highest centrality betweenness score but the lowest centrality closeness. This shows that Fkdc has the highest degree of a node, which means it is connected to the most nodes and has the highest geodesic distance. Whereas Hs (Household) has the lowest node degree, which means it has the fewest connected nodes with the shortest geodesic distance. In contrast, households have the lowest centrality betweenness but the highest centrality closeness. The inverse of the mean geodesic distance is centrality (closeness). This implies that if an idea exists somewhere in the network, some version of it will reach a node with a high degree of closeness after a few interactions.
Figure 8.
Fkdc formalize as Cidanau watershed management.
The Fkdc was initiated by the local government elements (Rda, Rdb, Rdc), Rekonvasi Bumi (Rkb), and Krakatau Tirta Industri (Kti) to become a collective institution on performing the Cidanau watershed management. Meanwhile, decentralization is not always synonymous with the government's role in the CWM[58]. This makes the Banten Provincial government strengthen Fkdc in the connectivity network and driving the society to be involved in managing Cidanau water resources. However, the Banten government plays an important role by allowing public and private sectors to prevent conflicts and water crises in the future [59]. Certain parties were resistant to the government's domination to enable it to hinder or cause the failure of a watershed. In the CWM, FKDC is a collective institution that builds commitment and integration between stakeholders because it allows knowledge sharing and strengthens societal participation.
5. Discussion
The cognitive categories, conventions, rules, expectations, and logics that give institutions their force also condition the formation of relationships and thus the network structures that function as the skeletons of fields. [22]. Networks and interrelationships between actors are determining factors for the success of watershed management[60]. Several previous studies state that failure to build networks is the cause of failure in watershed management. According to [61,62], actors networks are important when combining human activities and natural processes. The watershed management network depends on the characteristics of the watershed, actors, and watershed management policies themselves. The more complex the watershed (area, number of actors, watershed problems), the more complicated and difficult it will be to build networks between the actors involved in a watershed management.
The Cidanau watershed has dynamics critical challenges, as well as threats because it involves 22 actors (individual, organisation, business entities, government, etc). CWM networks serve as more than mere structural frameworks and operational conduits within organizational domains. They also generate "horizontal" differentiations among individuals, organizations, and actions, while concurrently establishing "vertical" differentials in terms of. The Banten Province government has a major role in CWM, which involves public and private participation in the form of positive synergies, empowering all actors in order to prevent conflicts and environmental crises in the future and strengthening connectivity networks within and between various government institutions, non-government and communities, as well as the dynamics that support the development of watershed management knowledge and practices. The Banten Governor's Decree No. 124.3/Kep.64.-Huk/2002 formally strengthened the Cidanau multi-stakeholder communication forum (Fkdc) as a watershed organization or bridging institution to organizes and manages the CWM and to overcome classic problems on the watershed development sectors [63].
5.1. Network Cluster of CWM
Total link strength can be used to measure the linkages between entities and determine how these entities are connected to other entities. For example, if an entity has many links that connect to other entities, then that entity may have a high total link strength. Conversely, if an entity only has a few links that connect to other entities, then that entity may have a low total link strength. Total link strength can be used to group entities based on their relatedness, or to discover relationships that might not be apparent in other ways
Based on Figure 9, the researcher found actors cluster network in CWM. Clustering is based on total strength networks of a node/s. Cluster one is the Fkdc (size and green color) nodes which are the center cluster with the largest number of networks. Fkdc is a source of information and a share network for almost all actors involved in CWM. The second cluster is Rg2, Rg1, Rd, Rd1, Rd2 which is moderate influence for collaborative center network of other actors. Rg1, Rg2, Rd, Rd1, Rd2 are government institutions in provincial level and district level that have authority in implementing policies and strengthening networks in watershed management. Government institutions still have a major role in building networks between CWM stakeholders. The 3rd cluster is Kti and Pdam, which is a cluster, building a network with water users, both industry and households into three clusters. Cluster 4 is only connected to a few actors' interactions and networks, and it comprises University (Univ), farmers (Fmr), NGO (Ingo), household, Rkb, as well as Perhutani (Pht).
Figure 9.
Network cluster of CWM

5.2. The Dynamic Centre Network Body of CWM
The Fkdc was initiated by the local government elements (Rda, Rdb, and Rdc), Rekonvasi Bumi (Rkb), and Krakatau Tirta Industri (Kti) to be a collective institution for performing CWM. Meanwhile, decentralization CWM is not always synonymous with the government's role in the CWM. This drives the Banten Provincial government to strengthen Fkdc's connectivity network and encourage society to participate in the management of Cidanau's water resources. However, the Banten government plays an important role by allowing the public and private sectors to prevent conflicts and water crises in the future (Sulistyaningsih et al., 2021). Certain parties were resistant to the government's dominance, which enabled it to hinder or cause the failure of a watershed.
CWM is the first initiation of a watershed management model in Indonesia, which is based on integrated watershed management through forming a centre network body (Fkdc) as watershed organization. According to [41,63], Fkdc is also one of the Indonesian initiatives watershed organisation and established until today. Sustainability of CWM depends on development of the social network of the actors itself. The involvement of actors on CWM is influenced by the role and influence through Fkdc as centre network body.
The degree of centrality and centrality betweenness shows that Fksc is the central point of the Cidanau watershed management network. This shows that Fkdc has a vital role as a source of information, information sharing and an arena for collaboration between actors in CWM. The shared commitment in establishing Fkdc made it easier for Fkdc to be accepted as the center network body in CWM. Fkdc is a collective institution that builds commitment and integration between stakeholders because it allows knowledge sharing and strengthens societal participation These institutions help in strengthening and bridging actors and their interests [49,64,65]. In accordance with the opinion [64,66], watershed organization (WO) and a multi-stakeholder forum become one of the approaches to solving problems that arise. Also, the WO motivates stakeholders to interact, collaborate, and share knowledge [65,67,68].
Fkdc is a centrality network entity that connects upstream actors, middle stream actors and downstream actors of CWM. Upstream CWM actors is perhutani, farmer, group of farmers. Downstream actors are Pdam, hausehold, other industries. Based on figures 4.3, 4.4 and 4.5 above, it proved that Fkdc facilitates all the interests of the actors involved in CWM. Hence, Fkdc is expected to bring marginalized actors participated of the CWM.Therefore, the existence of these groups is equal to other parties because those in the upstream are often marginalized and less access to Fkdc. Fkdc become a joint institution that strengthens the farmers (Fmr) and group of farmers (Gfmr) participation through reciprocal dialog and networks in preserving the upstream Cidanau watershed landscape. This finding statement against [25] statement that farmers serve as the primary decision-makers regarding land use, including selecting from different types of ecological focus areas within greening measures, such as choosing between cash crops and field elements like hedge rows or flower strips. Their substantial influence on the effectiveness of these measures in promoting biodiversity in rural areas has been recognized. These groups are strategically crucial as they contribute to land conservation in upstream areas to uphold the integrity of the hydrological cycle. Meanwhile, Perhutani (Pht) is a state-owned enterprises institution that has been managed upstream forest state concession of Cidanau watershed need to fostering the involvement in preserving forest areas to sustaining the availability of water resources.
In other reason, sustainability of the Fkdc on CWM is determined by mutualism network and inclusive participation of all stakeholders [69]. The mutualism network establishes a shared objective among all stakeholders, with participation shown to enhance the legitimacy of recommendations and yield positive social outcomes in management practices. [25]. Fkdc helps to determine the collective action and networks of all stakeholders to achieve a common goal and mutual benefit. According [70], In situations where actors sharing the same resource exhibit divergent values and conflicting interests, it becomes imperative to comprehend the distinct perspectives of the involved actors in order to facilitate effective governance. According [71] finding, that collaboration or interaction of all actors makes it easier to bring their disparate interests together. Furthermore, it is necessary to examine the role of each stakeholder to enable the watershed model to be replicated or implemented elsewhere.
6. Conclusions
Considering the institutional landscape, each watershed exhibits a unique degree of complexity regarding the involved stakeholders, their objectives, and a shared pursuit of sustainability. In the watershed management, WO has various forms and functions. In some watersheds, the WO only functions as a project and activity coordinator, while in some others it only functions as a stakeholder facilitator. Decentralization of watershed management will not work if it fails to build a network of actors into management. Cidanau watershed decentralization is not only synonymous with transfer authority to local governments but also allows the public to be fully involved in all development sectors through forming a center network body. The network of actors is influenced by the conditions that allow all actors to sit together, build shared commitments and formulate joint management goals. In CWM case, the government supports and encourages citizens' participation by providing legal enforcement to forming Fkdc. Fkdc was initiated to bring actors' interests and concerns into the CWM. Fkdc is an entity that connects the disconnected and deliberates the miscommunicated parties to be involved in Cidanau watershed governance. The sustainability factor in CWM is determined by how Fkdc becomes a centered WO in framing public participation through an active network and interaction. Degree centrality, centrality betweenness in CWM shows Fkdc functioning as WO and center network body that unites all actors' interests in a single commitment, common aims, and shared rewards. Ultimately, with regards to the viewpoint of CWM, the decentralization of watersheds aimed to facilitate wider public engagement by establishing Fkdc as a central network entity. The sustainability of the CWM can be maintained due to the decentralization process, public involvement and participation, and the existence of Fkdc as a center network body. How does the Fkdc manage the Cidanau Watershed with its central role, and to what extent can the Fkdc survive the ever-changing situations and problems (dynamics) of the watershed, become an interesting research theme to be investigated further.
Author Contributions
BMS: conceptualization, investigation, formal analysis and writing—original draft. WI: writing, review and editing, funding acquisition, project administration, supervision. MEA: methodology, resources. BRA: data curation and software. SH: visualization, validation and redactional check. All authors have read and agreed to the published version of the manuscript.
Funding
This research funded by Nasional Research and Innovation Bureau of Indonesia Government, and the publication fee funded by University of Padjajaran, Indonesia.
Institutional Review Board Statement
Not applicable.
Informed Consent Statement
Not applicable.
Data Availability Statement
Data were mainly obtained through limited group discussion of Cidanau Watershed stakeholders.
Acknowledgments
Author delivered many Thanks Dr Laksono Tri Handoko as The Head Office of National Research and Innovation Bureau of Indonesia Government.
Conflicts of Interest
There is no conflict of interest among all authors.
References
- C. T. Butts, “Social network analysis: A methodological introduction,” Asian J. Soc. Psychol., vol. 11, no. 1, pp. 13–41, 2008. [CrossRef]
- K. Ognyanova, “Social Network Analysis Measuring, Mapping, and Modeling Collections of Connections,” Knowl. Solut. Tools, methods, approaches …, pp. 1–8, 2021, [Online]. Available: https://app.dimensions.ai/details/publication/pub.1104532919.
- A.C. Springer and J. E. de Steiguer, “Social network analysis: A tool to improve understanding of collaborative management groups,” J. Ext., vol. 49, no. 6, 2011.
- J. Scott and P. J. Carrington, Social Network Analysis, vol. 29, no. 9. Sage Publication, 2015.
- M. Elmezain, E.A. M. Elmezain, E.A. Othman, and H. M. Ibrahim, “Temporal degree-degree and closeness-closeness: A new centrality metrics for social network analysis,” Mathematics, vol. 9, no. 22, 2021. [CrossRef]
- F. Przesdzink, L.M. F. Przesdzink, L.M. Herzog, and F. Fiebelkorn, “Combining Stakeholder- and Social Network- Analysis to Improve Regional Nature Conservation: A Case Study from Osnabrück, Germany,” Environ. Manage., vol. 69, no. 2, pp. 271–287, 2022. [CrossRef]
- N. İlhan, Ş. Gündüz-Öğüdücü, and A. Ş. Etaner-Uyar, Introduction to Social Networks: Analysis and Case Studies. 2014.
- D. Camacho, Á. Panizo-LLedot, G. Bello-Orgaz, A. Gonzalez-Pardo, and E. Cambria, “The four dimensions of social network analysis: An overview of research methods, applications, and software tools,” Inf. Fusion, vol. 63, pp. 88–120, 2020. [CrossRef]
- S. Tabassum, F.S.F. S. Tabassum, F.S.F. Pereira, S. Fernandes, and J. Gama, “Social network analysis: An overview,” Wiley Interdiscip. Rev. Data Min. Knowl. Discov., vol. 8, no. 5, pp. 1–21, 2018. [CrossRef]
- Borgatti, M. Everett, and L. Freeman, “UCINET 5 for Windows: Software for Social Network Analysis,” Natick Anal. Technol., no. January, 1999.
- S. Borgatti, M.G. S. Borgatti, M.G. Everett, and L. C. Freeman, “Ucinet for Windows: Software for social network analysis (Version 6.102),” Harvard, MA Anal. Technol., no. 15, 2002. 20 October.
- A.K. Chaudhary and R. Radhakrishna, “Social network analysis: A methodology for exploring diversity and reach among extension programs and stakeholders,” J. Ext., vol. 56, no. 6, 2018.
- S. Majeed, M. S. Majeed, M. Uzair, U. Qamar, and A. Farooq, “Social Network Analysis Visualization Tools: A Comparative Review,” Proc. - 2020 23rd IEEE Int. Multi-Topic Conf. INMIC 2020, 2020. [CrossRef]
- A.C. Chaudary and L. A. Warner, “Introduction to Social Network Research: Application of Social Network Analysis in Extension,” Angew. Chemie Int. Ed. 6(11), 951–952., pp. 10–27, 2018.
- X. Fu, J. X. Fu, J. Der Luo, and M. Boos, Social Network Analysis, Interdisiplinary Approaches and Case Studies, vol. 22, no. 1954. 1994.
- C. April, S.E.E.L. C. April, S.E.E.L. Page, S.P. Borgatti, A. Mehra, D.J. Brass, and G. Labianca, “Network Analysis in the Social Sciences,” Science (80-. )., vol. 323, no. April, pp. 892–896, 2009.
- D. Kempe, J. D. Kempe, J. Kleinberg, and É. Tardos, “Maximizing the spread of influence through a social network,” Theory Comput., vol. 11, no. 4, pp. 105–147, 2015. [CrossRef]
- E. January 2005, 2014.
- F. Battiston et al., “Networks beyond pairwise interactions: Structure and dynamics,” Phys. Rep., vol. 874, pp. 1–92, 2020. [CrossRef]
- S. Zhang, K. S. Zhang, K. de la Haye, M. Ji, and R. An, “Applications of social network analysis to obesity: a systematic review,” Obes. Rev., vol. 19, no. 7, pp. 976–988, 2018. [CrossRef]
- D. E. da C. Leme, E.V. D. E. da C. Leme, E.V. da C. Alves, V. do C. O. Lemos, and A. Fattori, “Network Analysis: a Multivariate Statistical Approach for Health Science Research,” Geriatr. Gerontol. Aging, vol. 14, no. 1, pp. 43–51, 2020. [CrossRef]
- J. Owen-Smith and W. W. Powell, “Networks and Institutions,” SAGE Handb. Organ. Institutionalism, pp. 596–623, 2012. [CrossRef]
- R. Sisto, A. R. Sisto, A. Lopolito, and M. van Vliet, “Stakeholder participation in planning rural development strategies: Using backcasting to support Local Action Groups in complying with CLLD requirements,” Land use policy, vol. 70, no. 17, pp. 442–450, 2018. 20 July. [CrossRef]
- Home Office, “Social network analysis: How to guide,” Inf. Policy Team, no. January, p. 13, 2016, [Online]. Available: https://assets.publishing.service.gov.uk.
- J. Hauck, J. J. Hauck, J. Schmidt, and A. Werner, “Using social network analysis to identify key stakeholders in agricultural biodiversity governance and related land-use decisions at regional and local level,” Ecol. Soc., vol. 21, no. 2, 2016. [CrossRef]
- L. Guppy and K. Anderson, “Global Water Crisis,” Water Resour., no. 2012, pp. 2015–2016, 2017.
- M. T. Herzog, J.W. M. T. Herzog, J.W. Labadie, and N. S. Grigg, “Social Network Analysis Workshop for Water and Resource Management,” no. 227, 2014.
- Comte, F. Colin, O. Grünberger, J.K. Whalen, R. Harto Widodo, and J. P. Caliman, “Watershed-scale assessment of oil palm cultivation impact on water quality and nutrient fluxes: a case study in Sumatra (Indonesia),” Environ. Sci. Pollut. Res., vol. 22, no. 10, pp. 7676–7695, 2015. [CrossRef]
- E. Schlager and W. Blomquist, Embracing watershed politics. Coloado: University Press of Colorado, 2008.
- R. Rojas, G. R. Rojas, G. Bennison, V. Gálvez, E. Claro, and G. Castelblanco, “Advancing collaborative water governance: unravelling stakeholders’ relationships and influences in contentious river basins,” Water (Switzerland), vol. 12, no. 12, pp. 1–25, 2020. [CrossRef]
- Ö. Bodin and J. Norberg, “Information network topologies for enhanced local adaptive management,” Environ. Manage., vol. 35, no. 2, pp. 175–193, 2005. [CrossRef]
- Lienert, F. Schnetzer, and K. Ingold, “Stakeholder analysis combined with social network analysis provides fine-grained insights into water infrastructure planning processes,” J. Environ. Manage., vol. 125, pp. 134–148, 2013. [CrossRef]
- S. Sayles and J. A. Baggio, “Social-ecological network analysis of scale mismatches in estuary watershed restoration,” Proc. Natl. Acad. Sci. U. S. A., vol. 114, no. 10, pp. E1776–E1785, 2017. [CrossRef]
- Fatemi, K. Rezaei-Moghaddam, and H. R. Pourghasemi, “Social networks` analysis of rural stakeholders in watershed management,” Environ. Dev. Sustain., vol. 23, no. 12, pp. 17535–17557, 2021. [CrossRef]
- C. Prell, K. C. Prell, K. Hubacek, and M. Reed, “Stakeholder analysis and social network analysis in natural resource management,” Soc. Nat. Resour., vol. 22, no. 6, pp. 501–518, 2009. [CrossRef]
- C. Ansell and J. Torfing, “Introduction: Theories of governance,” Handb. Theor. Gov., pp. 1–17, 2016. [CrossRef]
- G. Bentrup, “Evaluation of a collaborative model: A case study analysis of watershed planning in the Intermountain West,” Environ. Manage., vol. 27, no. 5, pp. 739–748, 2001. [CrossRef]
- J. Fisher et al., “Collaborative Governance and Conflict Management: Lessons Learned and Good Practices from a Case Study in the Amazon Basin,” Soc. Nat. Resour., vol. 33, no. 4, pp. 538–553, 2020. [CrossRef]
- T. Gebregergs, K. T. Gebregergs, K. Teka, G. Taye, E. Gidey, and O. Dikinya, “Status and challenges of integrated watershed management practices after-project phased-out in Eastern Tigray, Ethiopia,” Model. Earth Syst. Environ., vol. 8, no. 1, pp. 1253–1259, 2022. [CrossRef]
- Y. Kunihiko, I. Y. Kunihiko, I. Masaya, and B. I. Setiawan, “in Cidanau Effects Economic of Recent West Java, Southeast Indonesia : Asia Watershed, of the Crisis Abstract Conservation of water quality and quantity is needed in Cidanau Watershed, West Java of Indonesia, for the sake of agricultural and industria,” vol. 44, no. 44, pp. 27–41, 2003.
- Laila, K. Murtilaksono, and B. Nugroho, “Kelembagaan Kemitraan Hulu Hilir Untuk Pasokan Air Das Cidanau, Provinsi Banten,” J. Penelit. Sos. dan Ekon. Kehutan., vol. 11, no. 2, pp. 137–152, 2014. [CrossRef]
- K. Yoshino and Y. Ishioka, “Guidelines for soil conservation towards integrated basin management for sustainable development: A new approach based on the assessment of soil loss risk using remote sensing and GIS,” Paddy Water Environ., vol. 3, no. 4, pp. 235–247, 2005. [CrossRef]
- A.Heryansyah, “Anasisis Kapasitas Reservoir Untuk Suplai Air : Studi Kasus Das Cidanau,” pp. 2–5, 2005.
- H. Arien, G. H. Arien, G. Akira, M. Masakazu, and Y. Muhamad, “Development of a Watershed Water Quality Model in Indonesia nited Graduate School, Tokyo University of Agriculture and Technology ( Utsunomiya University ) increasing the need for water resources, and at the same purifier, are deeply diminishing. Prop,” Trans JSDRE, no. 251, pp. 573–582, 2007.
- T. Kato, H. T. Kato, H. Soumura, and A. Goto, “Water Quality Forecast Model of Cidanau Watershed, Indonesia, for Watershed Management Planning,” Water Qual. Forecast Model Cidanau Watershed, Indones. Watershed Manag. Plan., vol. 2002, no. 43, pp. 3–12, 2002. [CrossRef]
- R. N. Khairiah, L.B. R. N. Khairiah, L.B. Prasetyo, Y. Setiawan, and N. Kosmaryandi, “Monitoring Model of Payment for Environmental Service (PES) Implementation in Cidanau Watershed with stands Density Approach,” Procedia Environ. Sci., vol. 33, pp. 269–278, 2016. [CrossRef]
- J. Heyde, M. J. Heyde, M. Lukas, and M. Flitner, “Payments for Environmental Services in Indonesia: A Review of Watershed-Related Schemes,” vol. working pa, no. 186, 2012.
- R. Lapeyre, R. R. Lapeyre, R. Pirard, and B. Leimona, “Payments for environmental services in Indonesia: What if economic signals were lost in translation?,” Land use policy, vol. 46, pp. 283–291, 2015. [CrossRef]
- Munawir and, S. Vermeulen, Fair deals for watershed services in Indonesia. International Institute for Environment and Development (UK), 2007.
- Sunaedi, S.P. Hadi, and A. N. Bambang, “Essential Water Supply Resources through Payment for Environment Services Program in the Cidanau Watershed, Banten Province, Indonesia,” IOP Conf. Ser. Earth Environ. Sci., vol. 145, no. 1, 2018. [CrossRef]
- D. Wulansari, “Optimasi penggunaan lahan di das cidanau banten desi wulansari,” 2015.
- R. Lapeyre, R. R. Lapeyre, R. Pirard, and B. Leimona, “Payments for Environmental Services in Indonesia: What if economic signals were lost in translation?,” Soc. Serv. Rev., vol. 85, no. 2, pp. ii–ii, 2011. [CrossRef]
- Sunaedi, S.P. Hadi, and A. N. Bambang, “Community-Based Environmental Management Through the Payments for Environmental Services Program in Cidanau Watershed, Banten Province, Indonesia,” IOP Conf. Ser. Earth Environ. Sci., vol. 338, no. 1, 2019. [CrossRef]
- Hartanto, R.M. Delinom, and H. Hendarmawan, “Kualitas Air pada Puncak Musim Kemarau di Daerah Rawa Danau Kabupaten Serang,” Ris. Geol. dan Pertamb., vol. 29, no. 1, p. 13, 2019. [CrossRef]
- Hartanto, B.Y.C.S.S. Syah Alam, R.F. Lubis, and H. Hendarmawan, “The origin and quality of the groundwater of the rawadanau basin in Serang Banten, Indonesia,” Rud. Geol. Naft. Zb., vol. 36, no. 2, pp. 11–24, 2021. [CrossRef]
- B. Priyanto and T. Titiresmi, “Beberapa Aspek Rawa Danau Sebagai Sumber Air Baku,” J. Tek. Ling, vol. 7, no. 3, pp. 277–283, 2006.
- Stephen P Borgatti, Martin G Everett, and Linton C Freeman, “Ucinet for Windows: Software for social network analysis (Version 6.102),” Harvard, MA Anal. Technol., no. 15, 2002. 20 October.
- N. Annahar, I. N. Annahar, I. Widianingsih, C. Paskarina, and E. A. Muhtar, “A bibliometric review of inclusive governance concept,” Cogent Soc. Sci., vol. 9, no. 1, 2023. [CrossRef]
- T. Sulistyaningsih et al., “Formulating Sustainable Watershed Governance Model: A Meta-analysis of Watershed Governance,” Acad. J. Interdiscip. Stud., vol. 10, no. 2, pp. 90–104, 2021. [CrossRef]
- Widianingsih, C. Paskarina, R. Riswanda, and P. B. Putera, “Evolutionary Study of Watershed Governance Research: A Bibliometric Analysis,” Sci. Technol. Libr., vol. 40, no. 4, pp. 416–434, 2021. [CrossRef]
- Erdogan, “Stakeholder Involvement in Sustainable Watershed Management,” Adv. Landsc. Archit., 2013. [CrossRef]
- M. H. T. C. Gamboa, “Stakeholder engagement to enhance integrated water management in the context of a river basin in Portugal,” 2014, [Online]. Available: http://usir.salford.ac.uk/id/eprint/33222/.
- Pujatmiko, “Efektifitas forum DAS dalam membantu kelembagaan pengelolaan DAS ( studi kasus Forum Komunikasi DAS Cidanau di Provinsi Banten ),” no. 1, pp. 1–2, 2006.
- W. Medema, J. W. Medema, J. Adamowski, C. Orr, A. Furber, A. Wals, and N. Milot, “Building a foundation for knowledge co-creation in collaborative water governance: Dimensions of stakeholder networks facilitated through bridging organizations,” Water (Switzerland), vol. 9, no. 1, 2017. [CrossRef]
- A.L. Davies and R. M. White, “Collaboration in natural resource governance: Reconciling stakeholder expectations in deer management in Scotland,” J. Environ. Manage., vol. 112, pp. 160–169, 2012. [CrossRef]
- B.Ferreyra and P. Beard, “Participatory evaluation of collaborative and integrated water management: Insights from the field,” J. Environ. Plan. Manag., vol. 50, no. 2, pp. 271–296, 2007. [CrossRef]
- M. Okumah, A.S. M. Okumah, A.S. Yeboah, and O. Amponsah, “Stakeholders’ willingness and motivations to support sustainable water resources management: Insights from a Ghanaian study,” Conserv. Sci. Pract., vol. 2, no. 3, pp. 1–14, 2020. [CrossRef]
- W. D. Leach, N.W. W. D. Leach, N.W. Pelkey, and P. A. Sabatier, “Stakeholder Partnerships as Collaborative Policymaking: Evaluation Criteria Applied to Watershed Management in California and Washington,” J. Policy Anal. Manag., vol. 21, no. 4, pp. 645–670, 2002. [CrossRef]
- N. Annahar, I. N. Annahar, I. Widianingsih, E.A. Muhtar, and C. Paskarina, “The Road to Inclusive Decentralized Village Governance in Indonesia,” Sustain., vol. 15, no. 11, 2023. [CrossRef]
- D. W. Cash, W.N. D. W. Cash, W.N. Adger, F. Berkes, P. Garden, L. Lebel, and P. Olsson, “Scale and Cross-Scale Dynamics : Governance and Information in a Multilevel World,” no. 16, 2006. 20 March. [CrossRef]
- D. Gordon, S. D. Gordon, S. McKay, G. Marchildon, R. Sacha Bhatia, and J. Shaw, “Collaborative governance for integrated care: Insights from a policy stakeholder dialogue,” Int. J. Integr. Care, vol. 20, no. 1, pp. 1–11, 2020. [CrossRef]

Table 1.
Present the Stakeholder involved in CWM.
 |
Disclaimer/Publisher’s Note: The statements, opinions and data contained in all publications are solely those of the individual author(s) and contributor(s) and not of MDPI and/or the editor(s). MDPI and/or the editor(s) disclaim responsibility for any injury to people or property resulting from any ideas, methods, instructions or products referred to in the content. |
© 2023 by the authors. Licensee MDPI, Basel, Switzerland. This article is an open access article distributed under the terms and conditions of the Creative Commons Attribution (CC BY) license (http://creativecommons.org/licenses/by/4.0/).
Copyright: This open access article is published under a Creative Commons CC BY 4.0 license, which permit the free download, distribution, and reuse, provided that the author and preprint are cited in any reuse.


