
Submitted:
22 June 2023
Posted:
23 June 2023
You are already at the latest version
Abstract
The aim of this study was to analyse the biocompatibility of a material based on lactic acid (PLA)/polyhydroxybutyrate(PHB)/thermoplastic starch (TPS) in combination with additives (plasticizers: acetyltributyl citrate (ATBC) and oligomeric lactic acid ( OLA)). Three types of materials were tested: I: PLA/PHB/TPS + 25% OLA, II: PLA/PHB/TPS + 30% ATBC, III: PLA/PHB/TPS + 30% OLA. The 3D printing itself was preceded by the creation of filaments from granulate and the design of samples. A filament production machine – Composer 450 (3devo; The Netherlands) was used to produce the filaments. Experimental samples were produced by FDM technology on a 3D printer DeltiQ2 (Trilab, Czech Republic). The evaluation of the biocompatibility of the materials included cytotoxicity tests such as the monitoring of viability, proliferation, morphology of cells, and their settlement on the surface of the materials. The cell line 7F2 osteoblasts (Mus musculus) was used in the experiments. Based on the tests, results confirmed the significant influence of plasticizers and their proportions in the mixtures. PLA/PHB/ATBC + 25% OLA was evaluated as the optimal material for biocompatibility with 7F2 osteoblasts. The tested biomaterials have the potential for further investigation, with a possible change in the proportion of the plasticizer, which has a fundamental impact on their biological properties.
Keywords:
biocompatibility
; PLA/PHB/TPS polymer scaffolds
; plasticizers
1. Introduction
Biological testing of samples is an important part of assessing the safety and toxicity of various materials and substances. The aim of these tests is to determine the effect a given material or substance has on biological systems. Protection against potential biological hazards that could arise from the use of medical devices is imperative before clinical use, but the scope of these hazards is wide and complex. In order to minimize the risk, all their known and foreseeable dangers are identified and then their risks are evaluated. Currently, it is necessary to comply with ISO standards, focusing on the implementation of biological evaluation of materials [1]. The standards cover specific aspects of biological evaluations and related tests. All are subject to regular inspection. ISO 10993 applies to the evaluation of materials and devices where direct or indirect contact with the body is expected during use. There are a wide variety of assays that are used to biologically test samples, including cytotoxicity, genotoxicity, immunotoxicity, and hemocompatibility assays. Typically, tests are performed in a laboratory using cells and tissues that are exposed to the material. Subsequently, various parameters are monitored, such as cell growth, changes in genetic material, or the production of various chemical substances that may indicate toxicity. Although the ISO 10993 standard series is the most widely accepted reference for biocompatibility testing worldwide, the requirements for biocompatibility testing differ in some countries (e.g., China, America, Canada) [2,3,4]. Biological testing of samples is important not only for assessing the safety of different materials but also for the development of innovative, non-toxic materials with a higher degree of biocompatibility. It also allows monitoring of potential adverse effects of materials and substances already used in the medical environment to minimize risks to patients and staff. Biological testing includes two basic categories of tests used in medicine and scientific research - in vivo and in vitro tests. Both types of tests are used by researchers in the study of diseases, the effects of materials on humans, and the development of medicines. Each type of test has its advantages and disadvantages, so their use depends on the specific needs and objectives of the test. Currently, a combination of both types of tests is used to maximize accuracy and reliability, and to minimize animal experiments [5,6]. Before assessing biological safety, it is necessary to know the exact chemical and physical composition of the controlled material. Part of the characterization of the material is information on its chemical composition, which is necessary to identify the potential adverse effects of the individual components. Cytotoxicity can be determined by assessing cell morphology, cell growth, reproduction, and measuring cell activity or cell damage. Various cell lines are available for these tests [4,5].
Lactic acid (PLA) material has been studied very intensively in recent decades and is classified as GRAS (generally regarded as safe) [7]. In practice, it is increasingly used, thanks to more economical methods of its production and its easy use in 3D printing [8]. PLA material can be easily modified with various additives, fillers, plasticizers, lubricants, and pigments. Shortly after its first synthesis, the material was used only for medical applications as bioresorbable materials (surgical sutures) or implants. In a wide range of biomedical applications, PLA continues to be used for the production of sutures, but also stents, screws, pins, nails, supporting materials for cell growth, and soft tissue implants [9]. Biodegradable materials are a suitable alternative, providing temporary support and long-term tissue growth [10, 11]. PLA is a common choice for such applications due to its long degradation time and non-toxicity.
Polyhydroxybutyrate (PHB) is a biodegradable polymer. The application of PHB is mainly in the area with high requirements for the composition and exact content of the polymer composition. Among the most important properties of PHB, considering its usability, are the degradation properties and decomposability of the material. Due to its high degree of biocompatibility, it is used in the form of surgical implants, matrices, and in the tissue engineering for the growth and proliferation of cells, as well as surgical threads, fibers, and tissues for wound healing. In the pharmaceutical industry, it is used for the production of microcapsules for pills [12,13,14]. After synthesis, PHB in powder form is mixed with additives and converted into granules, which can be further processed and mixed. As mentioned above, PHB, like PLA, is prone to degradation at temperatures close to the melting temperature of the materials in question. Therefore, it is necessary to pay attention to temperature control during processing. Processing procedures significantly affect the mechanical properties and morphology of the polymer [14].
The preparation of polymer mixtures is a frequently used technique in the industrial sector. In this procedure, it is possible to obtain polymers with improved and adapted chemical, physical, and mechanical properties by appropriate regulation of the mass ratio of individual polymer components. The preparation of a mixture of two polymer materials strictly correlates with their miscibility, i.e., the respective solubility parameters. With uniform parameters, good miscibility of the materials is expected, which also depends on the processing temperature, the mass ratio of the mixtures, molecular weights, and crystallinity [15]. In the case of medically applied material, modification, and processing of biopolyesters should be performed in a way that does not change their biocompatibility and biodegradability [16,17,18,19,20]. A less favourable feature of the resulting PLA/PHB mixture is fragility and lower strength, which significantly limits their use. To improve the processing and properties of PLA/PHB, active compounds and various types of additives such as plasticizers are often incorporated into the polymer matrix. Several plasticizers are used for PLA, mainly in concentrations between 10-30% by weight, such as glycerol, oligomeric lactic acid (OLA), poly(ethylene glycol) (PEG), citrate esters, low molecular weight additives such as aromatic compounds, including D - limonene, carvacrol, thymol. PHB plasticization is improved by glycerol, glyceryl triacetate, and PEG, acetyl tributyl citrate (ATBC). By incorporating such additives, the transition temperature will be lowered, and their workability and flexibility will be improved. However, the effect of plasticizers reduces the PLA/PHB polymer chain interaction, thereby reducing its barrier properties [21]. Currently, there is an industrial trend to replace traditional with natural plasticizers [15, 22].
Abdelwahab et al. [23] combined PLA (Mw = 52 000 g.mol-1) with PHB (Mw = 425 000 g.mol-1) in a ratio of 75:25, while the mixture was characterized by two values Tg. This mixture was further plasticized with a polyester plasticizer (Lapol 108, Mw= 80 000 g.mol-1) constituting 7% by weight. This plasticizer lowered the Tg of PLA from 62 °C in the PLA/PHB blend to 58 °C and the elongation increased from 7% to 15%. Arrieta et al. [24],23] created a mixture of PLA (Mw = 217 000 g.mol-1) with PHB (Mw = 416 000 g.mol-1) in a ratio of 75:25, while 15% of the weight, in three different cases, consisted of the additives: D- limonene (Mw = 136 g.mol-1), PEG (Mw = 300 g.mol-1) and ATBC ( Mw = 402 g.mol-1). The plasticization of both polymers improved in all cases. D-limonene decreased the Tg of PLA from 58 °C in the PLA/PHB blend to 39 °C and the elongation increased from 2% to 8%. PEG reduced Tg to 25 °C and a ratio elongation of 6%, while ATBC reduced Tg to 31 °C but achieved up to 180% ratio elongation. Increased plasticization is caused by their similarity in solubility parameters (ATBC - 20.2 MPa). At high temperatures during the processing of the polymer, gradual evaporation of the plasticizer may occur, because they are less thermally stable than the polymer matrices. Therefore, the use of aromatic compounds as additives to PLA/PHB blends presents a disadvantage related to their low molecular weights and high volatility during melting processes. Armentano et al. [25] mixed PLA and PHB in a ratio of 85:15 and added carvacrol at 10% by weight. After treatment, the remaining amount of carvacrol was determined using high-performance liquid chromatography (HPLC). It was found that about 25% of the carvacrol was lost from the contents.
2. Materials and Methods
The tested scaffolds were prepared from a mixture in the form of filaments, where the largest proportion was a combination of materials: PLA/PHB/TPS in a ratio of 75:25:20 and plasticizers: acetyltributyl citrate (ATBC) and oligomeric lactic acid (OLA)). Three types of samples of the studied materials were made: sample I: PLA/PHB/TPS + 25% OLA, sample II: PLA/PHB/TPS + 30% ATBC, sample III: PLA/PHB/TPS + 30% OLA, see Table 1.
2.1. Preparation of filaments and samples
Filaments were manufactured at the Department of Biomedical Engineering, Technical University in Košice according to the study by Kohan et al. 2022 [26]. Each type of the compared mixed polymer materials was prepared in the form of granules with a weight of approximately 10 g. In this form, the material was placed in a moisture analyser Radwag 50/1 (RADWAG, Radom, Poland), where it was dried. The whole process lasted 60 minutes at 80 °C. This procedure was performed due to the hydrophilic properties of PHB, to remove excess water. Material with increased resistance was obtained by drying.
Filaments were created from granulate in a COMPOSER 350 filament maker (3devo, The Netherlands). The complete production of fibers took place in an air-conditioned room with a temperature of 18 °C. In the tube, a nitrided steel screw gradually mixed and moved the material through several heat zones. These four extruder temperature zones include: Zone 1: 175 °C, Zone 2: 180 °C, Zone 3: 175 °C and Zone 4: 155 °C. The resulting mixture was then pushed through a nozzle with a circular cross-section, resulting in the desired filament. The extruded material was gradually wound onto a coil and cooled. The result was a fibre with a diameter of 1,75 ± 0,05 mm.
The modeling of the samples was carried out in the Magics program (Materialise, Ghent, Belgium). The samples were designed in a cylindrical shape with a diameter of 8 mm and a height of 2 mm, while the thickness of the layer was set at 0,2 mm and the filling of the scaffolds was 50%. The individual layers of the sample were each time rotated by 90° relative to the previous bottom layer. The modelled object was converted to .STL format (stereolithographic format), suitable for further modifications. After modeling the sample, it was formatted from .STL to G-code, which is supported by the 3D printer and based on which the printer obtains the necessary information to print the scaffold. Formatting and preparation of the sample took place in the KISSlicer program, in which the type of material and printing technology were initially defined. Subsequently, in the “Slice Settings” section, the sample was divided into a certain number of slices representing the individual layers of the print, and we chose the position of the sample on the printer plate. Finally, a G-code was generated in the program, which was used to print the cylindrical scaffold, and its final production was done by 3D printing.
2.2. 3D printing of samples (scaffolds)
According to the study by the authors Findrik Balogolová et al. 2022 [27] printing parameters are individually depended on the type of extruded material. The same G-code was used for all samples, which controlled the printer based on previously defined requirements. The printing parameters were chosen to suit the behavior of each material and to be able to compare them. The nozzle of the 3D printer had a diameter of 0,4 mm. The substrate temperature was set to 70 °C and the printing speed to 20 mm/s, while these parameters were the same for all materials. The printing time of one scaffold lasted 2 minutes and 20 seconds. The individually set parameters included the temperature of the head and the height of the Z-offset of the nozzle. Below in Table 2 we list the main parameters of printing.
During printing, 20 pieces of samples I, II and III were created from each material (Figure 1)
The macroscope (LEICA WILD M3Z) image provided us with visual information about the morphology of the printed samples. The sampling was carried out at the Faculty of Materials, Metallurgy and Recycling, Technical University in Košice. As a representative sample, we present sample I. (PLA/PHB/TPS + 25% OLA).
For the material of sample I (PLA/PHB/TPS + 25% OLA), its appearance was visually evaluated in comparison with the desired appearance of the scaffold. The scaffold had a circular diameter, and a grid was visible on its surface, which was evenly distributed over the entire surface. The grid consisted of horizontal and vertical strips of fibers that meet to form smaller squares. The fibers approaching the edges increased their diameter and in contact with the edge were more melted or partially not connected at all. The surface of the scaffold was smooth, with larger cracks in some fibers. The end of the last thread was visible on the edge, where the nozzle of the 3D printer finished extruding the material. Its pores were tiny and placed on a grid at regular intervals, forming smaller chambers.
2.3. Sterilization of samples (scaffolds)
The evaluated samples (PLA/PHB/TSB scaffold and plasticizer) were tested in a 96-well culture plate and a 24-well culture plate after 3D printing. For each sample type, 10 wells were allocated in the case of a 96-well culture plate and 8 wells in the case of a 24-well culture plate. For testing the scaffolds by co-cultivation with cell lines, the samples were sterilized by heat (70 °C) for 1 hour and then by UV radiation in a laminar box for 2 hours.
2.4. Cell processing and cultivation
To determine the biocompatible properties of materials based on PLA/PHB/TPS and plasticizer, the commercial cell line 7F2 osteoblasts isolated from the bone marrow of Mus musculus (ATCC-CRL-12557; American Type Culture Collection, USA) were used. The 7F2 osteoblast line stored in liquid nitrogen at -196 °C was thawed in a standard manner. Thawed cells were centrifuged (10 minutes/1250 rpm, laboratory temperature). The supernatant containing FBS and cryoprotective medium with dimethylsulfoxide (DMSO) was removed.
7F2 osteoblasts were resuspended in 1 ml of culture medium Dulbecco’s Modified Eagle’s Medium containing glucose (DMEM - high glucose; Sigma-Aldrich), 10% fetal bovine serum (FBS) (Sigma-Aldrich), 1% antibiotic/antimycotic (ATB+ATM (penicillin-streptomycin-amphotericin B; Biowest, USA) and 1% L-glutamate (Biowest). Cells were seeded in a 25 cm2 culture flask (T-25; TPP) at a concentration of ~1 x 10⁴ cells. Cells were cultured at 37 °C and an atmosphere of 5% CO2. Cells that did not adhere to the surface of the culture flask after 24 hours were removed. Metabolized culture medium was changed every two to three days. Cell growth was monitored microscopically (Zeiss Axiovert 200, Zeiss, Germany). Cells were cultured until reaching 80-90% confluence.
After reaching approximately 80-90% confluence, the cells were passaged into a culture bottle with a culture area (75 cm2). An enzymatic method of trypsinization was used to separate the cells adhered to the surface of the culture bottle. After washing, 1 ml of 0.25% trypsin EDTA (Biowest) was added to the cells. Cells with trypsin were incubated at 37 °C for 3 minutes during which the trypsin acted on the cells causing them to detach from the surface of the culture flask. To inactivate trypsin, FBS (Sigma-Aldrich) was added to the cells at a ratio of 1:1 [v/v] trypsin EDTA:FBS. The cell suspension was transferred to a 15 ml centrifuge tube (TPP) and centrifuged (10 minutes/1250 rpm, laboratory temperature). The supernatant was removed, and the cell pellet was dissociated in 1 ml of culture medium (DMEM – high glucose, 10% FBS, 1% ATB+ATM, 1% L-glutamate), in which the number of cells was determined.
2.5. Cell growth on samples (PLA/PHB/TSB scaffold and plasticizer)
After reaching 80-90% confluence, the cells were trypsinized according to the above procedure. After trypsinization, the cell pellet was resuspended in 1 ml of culture medium (DMEM – high glucose, 10% FBS, 1% ATB+TM, 1% L-glutamate) and the number of cells was determined using a hemocytometer. These 7F2 osteoblasts were used to monitor their growth on a sample (PLA/PHB/TSB scaffold and plasticizer).
Cells (10 000 cells/well) were added to the sterilized samples (Plastic/PHB/TSB scaffold and plasticizer) in a 24-well culture plate. The cell suspension was placed directly on the sample so that the cells preferentially colonize it and not the area around the biomaterial. 500 µl of culture medium DMEM – high glucose, 10% FBS, 1% ATB+TM, 1% L-glutamate was added to the cells. Cells were cultured at 37 °C and 5% CO2 atmosphere. The culture medium was changed every other day. The growth of 7F2 osteoblasts on the samples was monitored for 14 days. The control was 500 µl of culture medium without cells. The medium sample represented the negative control. Positive and negative control were measured in parallel.
2.6. Morphology of cells on samples (Plastic scaffold from PLA/PHB/TSB and plasticizer)
Cell morphology and possible changes in shape due to their growth in the presence of biomaterial were monitored using methyl violet. Staining was performed in duplicate on the sixth day of cell culture. Culture medium was removed from two wells for each sample and cells were washed twice with 1X PBS (Sigma-Aldrich). 100 µl of 0.5% methyl violet (Sigma-Aldrich) was added to the cells and incubated for 15 min at room temperature with constant mixing (5 rpm). After incubation, the dye was removed from the wells and the cells were washed three times with 1xPBS (Sigma-Aldrich). The shape of the cells was observed using a microscope (inverted microscope Zeiss Axiovert 200, Zeiss).
2.7. Viable cell count and test
The proliferation of 7F2 osteoblasts was measured using a standard colorimetric test according to the study by Trebuňová et al. [28]. Growth curves were constructed for 7F2 osteoblast cells on three types of samples, namely: sample I. (PLA/PHB/TSB + 25% OLA), II. (PLA/PHB/TSB + 30% ATBC), and III. (PLA/PHB/TSB + 30% OLA) and control. The metabolic activity of the cells on all three types of samples compared to the control was monitored for 14 days. The number and viability of cells was determined using a hemocytometer with trypan blue (Sigma Aldrich, USA) in a ratio of 1:9 trypan blue to cell suspension.
2.8. Scanning electron microscopy
After 6 days of cultivation tracking the growth of 7F2 osteoblasts on the samples (PLA/PHB/TSB scaffold and plasticizer), we visualized cell colonization by scanning electron microscopy. The culture medium was removed, and the cells were washed twice with 1x PBS (Sigma-Aldrich). Subsequently, cells with biomaterials were fixed with a solution of 2.5% glutaraldehyde (Sigma-Aldrich) in 0.1 M PBS (Sigma-Aldrich) for 2 hours at room temperature. After fixation, cells with biomaterials were washed three times with 0.1 M PBS (Sigma-Aldrich) for 5 min each time and with constant agitation (5 rpm). Cells on the samples were post-fixed for 1 hour in 1% osmium oxide in 0.1 M PBS (Sigma-Aldrich) at room temperature. Subsequently, the cells were washed three times with 1xPBS (Sigma-Aldrich) for 5 minutes each time and with constant mixing (5 rpm). The samples were dehydrated for 20 minutes at room temperature using ethanol (Ethanol absolute for analysis EMSURE® ACS, ISO, Reag. Ph Eur; Sigma-Aldrich) with increasing concentration: 50% ethanol; 70% ethanol, 90% ethanol, 95% ethanol; and 100% ethanol. After removing the ethanol, the samples were kept in a dry environment until analysis by scanning electron microscopy (SEM). Samples in a culture medium without cells served as a control (K) to monitor possible degradation of the material.
The morphology of the surface of the prepared samples, their macrostructure, and especially their settlement by cells was observed by scanning electron microscopy (SEM) (microscope JEOL JSM-35 CF, Japan) at an acceleration voltage of 25 kV.
2.9. Statistical analysis
The data are presented as the mean ± SEM (Standard Error of the Mean). Significant differences between groups of means were analyzed by ANOVA. Statistical significance was assumed at the 0.95 IC (Interval Confidence).
3. Results
After thawing, the 7F2 osteoblast cell line was plated on a T-25 culture flask at a concentration of ~1 x 10⁴ cells (Figure 3). The non-adherent cells after seeding initially had a typical round to oval shape (Figure 3A), after 1 hour the adherence of a larger part of the cell population on the surface of the culture bottle and the formation of cell protrusions were observed (Figure 3B).
On the third day of cultivation, the cells in the culture flask reached 60% confluence. Large cells of irregular stellate shape with various long protrusions were observed, between which intercellular connections were formed (Figure 4).
On the eighth day of culture, the cells formed a confluent layer (>95%) with multiple cell junctions (Figure 5).
After passage, 7F2 osteoblast cells in the number of 10,000 cells per well were seeded on a 24-well plate as control (cells), and cells seeded on samples I. (PLA/PHB/TSB + 25% OLA), II. (PLA/PHB/TSB + 30% ATBC), and III. (PLA/PHB/TSB + 30% OLA). Growth curves representing the activity of 7F2 osteoblast cells were determined by MTT assay for all three samples compared to the control. Number of cells on monitored samples I., II., III., and control was evaluated after the 5th, 9th, 12th, and 14th day. When comparing cell growth on samples I., II., and III. compared to the control, the smallest decrease in cells occurred in the cells on sample I., but with the increasing number of days, the growth curve of cells on sample III. approaches the growth curve of cells on samples I. After five days there was a decrease in the number of cells on all samples, but further after nine days there was an increase in cells on samples I. and III., and a decrease on sample II. For sample II. the decrease in the number of cells was more prominent than that of cells on samples I. and III. From the curves on the graph (Figure 6), we conclude that sample I. (PLA/PHB/TSB + 25% OLA) appears to be the best for the growth of 7F2 osteoblast cells.
The results of cell adhesion and cell proliferation of 7F2 osteoblasts are shown in Figure 7. Six independent experiments of cells co-cultured with samples I. (PLA/PHB/TSB + 25% OLA), II. (PLA/PHB/TSB + 30% ATBC) and III. (PLA/PHB/TSB + 30% OLA) and control (pure 7F2 osteoblast cells) were conducted. Metabolic activity was measured and compared after cell seeding. Figure 7 shows the metabolic activity of the cell population seeded on all three samples compared to the control. The detected differences between the samples were evaluated graphically using box plots and ANOVA. From the graphs in Figure 7, it is clear that sample I has the largest average values on each measurement day. On the 5th day of measurement, the number of cells is greater in sample II. compared to sample III., but in the following days the number of cells is already greater for sample III. In sample II. the greatest variability of values and also outliers were demonstrated.
Statistically significant differences between sample groups I., II. and III. were evaluated using ANOVA, the result for each day of measurement is p<0.05 (5. day – p=0.0000, 9. day – p=0.0000, 12. day – p=0.0000, 14. day – p=0.0000), that means, that there is a statistically significant difference between the groups. On the 5th and 9th day, there were statistically significant differences between all observed groups from each other (p<0.05). On the 12th and 14th days, statistically significant differences were confirmed only between the groups on the I. and II.; and II. and III. (p<0.05), so the differences between the groups on samples I and III are not statistically significant (12th day p=0.3714, 14th day p=0.1938).
The growth of 7F2 osteoblast cells on samples I, II and III (scaffolds from biomaterials based on PLA/PHB/TSB and an additive of 25% OLA, 30% ATBC and 30% OLA) and their settlement was monitored on the first day, the eighth, the eleventh day ( Figure 8, Figure 9 and Figure 10) during 14 days in a 24-well culture plate microscopically. Figure 11 shows the degradation of biomaterials for individual samples I, II and III.
Immediately after the seeding of 7F2 osteoblast cells on individual samples, a typical round shape of non-adherent cells was observed in a density that should be sufficient to populate the biomaterials (Figure 8).
On the eighth day after seeding the cells on the biomaterial, changes in the proliferative activity of the cells between individual samples were observed. The highest proliferation was observed in the case of cells populating sample I (PLA/PHB/TSB + 25% OLA), where elliptical cells with protrusions predominated (Figure 9A). The proliferative activity of cells populating sample III (PLA/PHB/TSB + 30% OLA) was lower compared to cells in sample I, with larger number of dying cells of round to oval shape without projections (Figure 9C). Minimal cell proliferation and thus colonization of the sample by cells was observed in sample II (PLA/PHB/TSB + 30% ATBC), where only dying cells of round to oval shape without protrusions were observed (Figure 9B).
On the eleventh day after seeding cells on biomaterial, the most significant changes in proliferation were observed. The proliferative activity of the cells on sample I (PLA/PHB/TSB + 25% OLA) decreased slightly, which was related to the observed small amount of dying cells (Figure 10A). We also observed a slight decrease in cell proliferation in the case of cells populating sample III (PLA/PHB/TSB + 30% OLA) (Figure 10C). In sample II (PLA/PHB/TSB + 30% ATBC) only dying cells were observed (Figure 10B).
Biomaterials without seeded cells served as a control (K) to monitor possible changes in biomaterials or their degradation. Samples I and III on the 14th day of growth showed minimal degradation changes (Figure 11A,C). The exception was sample II, which showed signs of slight degradation, or the release of cells into the medium (Figure 11B).
3.1. Monitoring changes in the morphology of 7F2 osteoblasts after their growth on the samples (Plastic scaffold from PLA/PHB/TSB and plasticizer)
The growth of cells on biomaterials can be associated with changes in their morphology, by which they adapt to the surface of the used biomaterial. Alternatively, changes in the shape of osteoblasts after their growth on biomaterials were monitored using methyl violet, for microscopic, morphological evaluation. Osteoblasts growing in a culture plate without the presence of samples (Figure 12) were used as a positive control to evaluate changes in the shape of osteoblasts growing on samples I, II, and III. The cells showed an irregular star shape of various sizes with numerous protrusions and clearly visible oval nuclei.
On the 11th day, the highest representation of irregular star-shaped cells with protrusions, which was similar to the shape of osteoblasts growing on culture plastic, was observed in the case of cells cultured in the presence of sample I (PLA/PHB/TSB + 25% OLA). To a lesser extent, round and oval-shaped cells were represented (Figure 13A). Cells populating sample II (PLA/PHB/TSB + 30% ATBC) showed the greatest difference in shape compared to the positive control. We observed a large representation of small dying cells of oval and round shape (Figure 13B). Cells growing on sample III (PLA/PHB/TSB + 30% OLA) showed the greatest variability in shape. Irregular star-shaped cells with protrusions, elliptical-shaped cells, and dying oval and round-shaped cells were also present to a greater extent (Figure 13C).
3.2. Evaluation by electron microscopy
After 14 days of cultivation monitoring the growth of 7F2 osteoblasts on samples I (PLA/PHB/TSB + 25% OLA), II (PLA/PHB/TSB + 30% ATBC) and III (PLA/PHB/TSB + 30% OLA) the cells were on individual samples evaluated by scanning electron microscopy. In sample I (PLA/PHB/TSB + 25% OLA), a significantly higher number of cells attached to the material was observed, in a relatively high density (Figure 14A). In the case of sample II (PLA/PHB/TSB + 30% ATBC) and sample III (PLA/PHB/TSB + 30% OLA), there was a minimal number of cells on the surface of the material, with a low density (Figure 14B,C).
4. Discussion
The observed PLA/PHB/TPS materials in combination of OLA and ATBC plasticizers in three variations are optimally observed in a minimum 14-day experiment in order to draw final conclusions about the degree of their compatibility and cytotoxicity. The result of the experiment is knowledge about their suitability for clinical use in the human body. A similar topic was addressed by Kohan et al. [26], where they performed cytotoxicity and cell proliferation tests on PLA/PHB + HA/TCP polymers, using L929 mouse fibroblasts. The results showed that the materials are not cytotoxic, and the metabolic activity of the cells is greater than 70% in all cases. These results are complemented by another study with a similar composition of materials as in our experiment, by Čulenová et al. [29], where the results of the MTT test (after 24, 48 and 72 hours) pointed to the fact that the material composition of the sample PLA/PHB (60:40) + TPS (30%) had no significant effect on cell proliferation. A slight decrease in the proliferation level during 48 hours of culture was attributed to their adaptation process. The collective of authors evaluated in their study that the material, especially TPS, did not have a toxic effect on cell culture. Authors Manikandan et al. [30] performed cytotoxicity testing on biopolymers based on lactic and glycolic acid (PLGA) and determined the effect of the composition of these biopolymers on cytotoxicity. The authors used cells cultured in vitro and compared the cytotoxicity of a biopolymer with a higher proportion of glycolic acid to a biopolymer with a higher proportion of lactic acid. The results showed that the biopolymer with a higher proportion of glycolic acid had lower cytotoxicity than the biopolymer with a higher proportion of lactic acid. These results are important for the application of these biopolymers in regenerative medicine and tissue engineering, as cytotoxicity can be a critical factor in evaluating the safety and efficacy of these materials. In a study by Moorkoth et al. [31] cytotoxicity was tested using CHO-K1 cells. Testing was performed using PLA and PHB based materials with additives. The material was exposed to cell cultures and their growth and survival were subsequently monitored. Cytotoxicity was evaluated based on the amount of released enzymes and their effect on the cells. No significant change in viability was observed in any of the tested concentrations, which indicates that the cells are viable, resistant to exposure to the used nanoparticles.
The plasticizers had a significant impact on the mechanical properties of the samples, which greatly influenced their biological properties as well. For example, the authors of Arrieta et al. [32] observed the effects of OLA on a PLA/PHB (75:25) blend plasticized with three different concentrations of OLA. OLA improves the crystallization rate of PLA and ensures a better interaction between PLA and PHB. The morphology, structure, thermal stability, and mechanical properties of the materials were evaluated. 20% of the weight of OLA caused certain fiber defects, in the form of spherical pores, which reduced the mechanical properties of the material. The PLA/PHB mixture with OLA in 15% by weight had the best results in the studied areas. In our experiment, also when observing the samples (I (PLA/PHB/TSB + 25% OLA), III (PLA/PHB/TSB + 30% OLA)), there were defects in the fibers, which could be related to its higher amount in the given mixtures. Nuria Burgos et al. [33] mixed PLA/PHB (85:15) with carvacrol and OLA at 15% by weight of the mixture. The content of these additives positively influenced the permeability and hydrophobic properties of the samples. Authors Armentano et al. [25] addressed the effect of OLA on the processing properties of PLA in PLA/PHB blends, where they confirmed the claim that OLA is one of the most promising options for improving the properties of PLA without compromising biodegradation. They confirmed their experimental results and [34] found that the addition of OLA to PLA/PHB blends significantly reduces their Tg values, which confirmed the plasticizing effect of OLA. Similarly, different ratio of OLA was added to the PLA/PHB blend. At a content of 15% and 20% by weight, OLA did not cause a significant change in thermal stability. By increasing its content to 30% by weight, the temperature stability decreased, but the proportional elongation increased up to 370%. We can observe the change in temperature stability in our experiment when observing the samples by SEM analysis. Likewise, at 30% OLA content, the temperature stability of sample III (PLA/PHB/TSB + 30% OLA) decreased compared to sample I (PLA/PHB/TSB + 25% OLA).
Authors Findrik Balogová et al. [35] were engaged in studying of the cytotoxicity of PLA/PHB materials using additives - ATBC and TAC. When monitoring cell growth, ATBC (20% by weight) in PLA/PHB (85:15) and PLA/PHB (50:50) blends had an inhibitory effect on cell growth. The release of oil droplets into the substrate was also observed. The conclusion of the presented experiment also correlates with the mentioned results, where in the case of sample II (PLA/PHB/TSB + 30% ATBC) the most noticeable decrease in cell proliferation and viability was recorded. The components that were also released from sample II had an impact on the given properties of the cells, their morphology and settlement on the sample. Burgos et al. [36] studied the properties of PLA/PHB using different plasticizers, including ATBC and OLA. ATBC added at 15% by weight to a PLA/PHB (75:25) blend achieved a significant increase in ductility compared to other plasticizers at this ratio, achieving up to 180% elongation. At the PLA/PHB ratio (85:15) a larger percentage of plasticizer was used, first OLA at 15% by weight and later specifically OLA at 30% by weight. In the mixture with 15% by weight of OLA, the ductility result was very limited, at a higher 30% by weight OLA content, a highly elastic material was formed, with a relative elongation of about 350%. Samples I (PLA/PHB/TSB + 25% OLA) and III (PLA/PHB/TSB + 30% OLA) in the presented experiment showed optimal elasticity during 3D printing, which follows their increased ratio of OLA in the mixture. Authors Arrieta et al. [37] studied the mutual effects of PLA and PHB in their blends. PHB at a ratio of 25% by weight increased the hydrophobicity and PLA reduced the brittleness of PHB and improved its workability. However, the PLA/PHB blends still remained brittle and plasticizers had to be added to the blend to improve processability and tensile properties. The research showed that ATBC (15% by weight) was designed as one of the most effective plasticizers for PLA, PHB and PLA/PHB blends, which was one of the reasons for its use in our study.
With the help of SEM, it is also possible to observe a more detailed morphology of the cells inhabiting the material. A visual representation of the cell population of the biomaterials captured a significantly increased number of cells in the population of sample I (PLA/PHB/TSB + 25% OLA). In the case of samples II (PLA/PHB/TSB + 30% ATBC) and III (PLA/PHB/TSB + 30% OLA), only a minimal number of cells was observable on the surface. SEM also provided us with information about the morphology of individual scaffolds. The morphology of the sample was closest to the 3D .STL model in the case of sample I (PLA/PHB/TSB + 25% OLA). In the case of sample II (PLA/PHB/TSB + 30% ATBC), we observed shape variability and smaller spherical pores in the structure, which are probably related to the insufficient miscibility of PLA/PHB with the given plasticizer or its high ratio in the mixture. The most relevant changes occurred in the case of sample I (PLA/PHB/TSB + 25% OLA), where the PHB phase is difficult to distinguish from the PLA matrix, which indicates a uniform distribution of the components in the composite. Sample III (PLA/PHB/TSB + 30% OLA), from SEM analysis, shows the presence of fiber-like structures on the surface of the sample, which indicates that part of the molten PLA pellets has deformed into fiber-like structures inside the PHB matrix. Authors D’Anna et al. [38] dealt with the microscopic analysis of SEM photographs of PLA/PHB materials and their additives. They investigated mixtures of PLA and PHB materials at different mass ratios, which helped us in the analysis of SEM images. Similarly, authors Kohan et al. [26] observed the distribution of the ceramic component in the PLA/PHB composite using SEM analysis. Through SEM, authors Čulenová et al. [29] observed the surface of the PLA/PHB/TPS material and the visible concentration of cell distribution. They located the largest concentration of cells in the middle of the scaffold, while their morphology was similar to fibroblasts. The rougher surface of the samples was attributed to the presence of TPS in the mixture. From the results, they concluded that the mixture of materials is biocompatible and has potential for applications in tissue engineering. Authors Mosnáčková et al. [39] used SEM to visualize changes in the morphology of cells and their possible damage.
3D printing parameters are equally important aspects in the scaffold production process. The quality of the filament is largely dependent on its composition, temperature, extrusion speed and other parameters. Since in our experiment the printing speed and air pressure were set to the same value for all materials, it is assumed that the fiber diameter depends only on the viscosity of the material. In general, viscosity is expected to decrease with temperature, which has been confirmed experimentally. For sample II (PLA/PHB/TSB + 30% ATBC) the nozzle temperature was set to 188 °C, while for samples I (PLA/PHB/TSB + 25% OLA) and III (PLA/PHB/TSB + 30% OLA) were at a temperature of 183 °C. At a lower temperature, the layers of applied biomaterial in sample III (PLA/PHB/TSB + 30% OLA) separated and were not connected to each other. In the work of Kovalčík et al. [40] materials PHB, PHBV and PHBH were investigated in order to determine their suitability for use in FDM additive manufacturing. The results were that PHB and PHBV are not suitable for FDM due to massive viscosity drop and molecular weight losses. On the other hand, the thermal stability of PHBH was comparable to that of PLA. The FDM-fabricated PHBH scaffolds had excellent mechanical properties, were non-cytotoxic, and supported large proliferation of mouse embryonic fibroblast cells for 96 h. Hydrolytic degradation of PHBH and PLA scaffolds tested in synthetic gastric juice for 52 days confirmed faster degradation of PHBH than PLA. These results suggest that PHBH could be used to fabricate scaffolds by FDM with application in tissue engineering.
The above studies were performed on materials with a similar composition to the samples of our experiment. Testing the biocompatibility of the mixture of polymeric, resorbable materials PLA/PHB/TSB using the plasticizer OLA in two proportions and PLA/PHB/TSB using the plasticizer ATBC is an innovative topic, due to the unique composition of the materials and plasticizers used. Based on the results, the given materials are considered suitable for further testing and possible application in tissue engineering and implantology. The samples showed, depending on their composition, different minimum levels of toxicity and biocompatibility. Plasticizers and other additives had a significant effect on the biological properties of PLA/PHB materials. In conclusion, we achieved comparable results of the impact of biomaterials on the osteoblast cell line.
5. Conclusions
In our study, three types of samples were evaluated, which contained the base material PLA/PHB/TPS – 75:25:20 and plasticizers: ATBC and OLA, three types of samples of the studied materials: sample I (PLA/PHB/TPS + 25% OLA, sample II (PLA/PHB/TPS + 30% ATBC), sample III (PLA/PHB/TPS + 30% OLA). We observed their effects on the 7F2 osteoblast cell line. Testing was preceded by the production of filaments of individual materials I, II and III and modeling samples in the Magics program.
Growth curves recording the proliferative activity of 7F2 osteoblast cells were followed for all three samples compared to the control. When comparing cell proliferation on samples I., II. and III. compared to the control, the minimal decrease in cell proliferation occurred in the observed sample I., but with the increasing number of days, the growth curve of the cells in sample III. approaches the growth curve of cells on samples I. After five days there was a decrease in the number of cells on all samples, but after nine days , there was an increase in cells on samples I. and III.; a decline in cells on sample II. For sample II. the decrease in the number of cells was more prominent than that of cells on samples I. and III. From this, we conclude that sample I. (PLA/PHB/TSB + 25% OLA) appears to be the best for the growth of 7F2 osteoblast cells.
To monitor the survival of 7F2 osteoblast cells during their growth on samples I, II and III, methyl violet reagent was added to the culture medium and cell suspension in the presence of the material. The results show information about the differences between the given materials. The composition of sample I (PLA/PHB/TPS + 25% OLA) had no significant inhibitory effect on cell proliferation. It decreased only slightly over the days, which was showed in the minimal amount of dying cells. We found that the tested material in batch I (PLA/PHB/TPS + 25% OLA) was non-toxic and biocompatible for cell culture. The material in sample III (PLA/PHB/TPS + 30% OLA) showed a greater decrease in proliferation and a greater number of dying cells, and in the case of material in sample II (PLA/PHB/TPS + 30% ATBC) only dying cells and minimal proliferation were observed. The faster death of cells and their lowest proliferation in the case of the material in sample II may be related to its slight degradation - the release of its components into the medium, which was not observed in the materials in samples I and III. The release of the components is probably related to the composition of the material in sample II, due to the different type of plasticizer (ATBC). As a result, we conclude that the material in sample II does not provide sufficient conditions for cell proliferation and subsequent viability. Cell growth is also associated with a change in their natural morphology (irregular star-shaped shape of various sizes with numerous protrusions and clearly visible oval nuclei). The results on the 14th day of cell cultivation on biomaterials confirmed the connection between cell growth and changes in their morphology. In the case of material in samples I (PLA/PHB/TPS + 25% OLA), we observed cells most similar to cells cultured without the presence of material. We observed the greatest variability in shape in the case of the material in sample III (PLA/PHB/TPS + 30% OLA) and in the case of the material in sample II (PLA/PHB/TPS + 30% ATBC) it was only small, oval, and dying cells. By scanning microscopy, in the case of the material in sample I (PLA/PHB/TPS + 25% OLA), a significantly higher number of cells inhabiting the material was observed, in a relatively high density. In the case of materials in samples II (PLA/PHB/TPS + 30% ATBC) and III (PLA/PHB/TPS + 30% OLA), a minimal number of cells, with a low density, was observed on the surface.
From the results, we conclude that the material in sample I (PLA/PHB/TPS + 25% OLA) showed the most suitable biocompatible properties and is suitable for further investigation within the scope of its application in implantology. We conclude that the optimal properties of the material in sample I are related to the type and lower ratio of the used plasticizer (OLA 25%). The material in sample II (PLA/PHB/TPS + 30% ATBC) showed the least optimal properties, namely the highest number of dying cells in the shortest time horizon, as well as the largest structural changes after observation by SEM analysis. The properties that the material in sample II showed in this experiment present a lower degree of biocompatibility and we assume that they are related to the use of a different plasticizer in the mixture (ATBC 30%), compared to samples I and III. The study of these materials could continue with possible changes in the proportion of plasticizer in the mixtures. The results of the biocompatibility tests that the material in sample III (PLA/PHB/TPS + 30% OLA) showed in short-term exposures are acceptable. Each of the given materials has the potential for further study, and with a slight change in their additives, it is possible that they will achieve the desired properties to be part of the human body in the future.
Author Contributions
“Conceptualization, M.T.; methodology, P.P. and A.F.B.; software, G.I.; validation, D.B., J.D.; formal analysis, M.T.; investigation, P.H.; data curation, G.I.; writing—original draft preparation, M.T and J.D.; writing—review and editing, M.T.; visualization, D.B.; supervision, M.T.; project administration, J.Z.; funding acquisition, M.T. and J.Z. All authors have read and agreed to the published version of the manuscript.”
Funding
This study was created with the support of projects KEGA 018TUKE – 4/2023, VEGA 1/0599/22 and APVV-22-0340.
Data Availability Statement
There are no additional research data.
Conflicts of Interest
The authors declare no conflict of interest.
References
- Seyfert, U. T.; Biehl, V.; Schenk, J. In Vitro Hemocompatibility Testing of Biomaterials According to the ISO 10993-4. Biomol. Eng. 2002, 19(2), 91–96. [Google Scholar] [CrossRef] [PubMed]
- Ghasemi-Mobarakeh, L.; Kolahreez, D.; Ramakrishna, S.; Williams, D. Key Terminology in Biomaterials and Biocompatibility. Biomater. Tissue Eng. AndRegenerative Med. 2019, 10, 45–50. [Google Scholar] [CrossRef]
- International Organization for Standardization. Biological Evaluation of Medical Devices: Evaluation and Testing Within a Risk Management Process; ISO, 2018.
- De Jong, W. H.; Carraway, J. W.; Geertsma, R. E. 6 - In Vivo and in Vitro Testing for the Biological Safety Evaluation of Biomaterials and Medical Devices. In Biocompatibility and Performance of Medical Devices (Second Edition); Boutrand, J. P., Ed.; Woodhead Publishing, 2020; pp 123–166. [CrossRef]
- Li, W.; Zhou, J.; Xu, Y. Study of the in Vitro Cytotoxicity Testing of Medical Devices. Biomed. Rep. 2015, 3(5), 617–620. [Google Scholar] [CrossRef] [PubMed]
- van de Stolpe, A.; den Toonder, J. Workshop Meeting Report Organs-on-Chips: Human Disease Models. Lab. Chip, 2013; 13, 18, 3449–3470. [Google Scholar] [CrossRef]
- Martino, V. P.; Jiménez, A.; Ruseckaite, R. A. Processing and Characterization of Poly(Lactic Acid) Films Plasticized with Commercial Adipates. J. Appl. Polym. Sci. 2009, 112(4), 2010–2018. [Google Scholar] [CrossRef]
- Tümer, E. H.; Erbil, H. Y. Extrusion-Based 3d Printing Applications of Pla Composites: A Review. Coatings 2021, 11(4), 390. [Google Scholar] [CrossRef]
- Seligra, P. G.; Lamanna, M.; Famá, L. PLA-FMWCNT Bionanofilms with High Modulus and Great Properties to Apply in Packaging and Biomedicine. Procedia Mater. Sci. 2015, 8, 383–390. [Google Scholar] [CrossRef]
- Gregor, A.; Filová, E.; Novák, M.; Kronek, J.; Chlup, H.; Buzgo, M.; Blahnová, V.; Lukášová, V.; Bartoš, M.; Nečas, A. Designing of PLA Scaffolds for Bone Tissue Replacement Fabricated by Ordinary Commercial 3D Printer. J. Biol. Eng. 2017, 11(1), 1–21. [Google Scholar] [CrossRef]
- Diomede, F.; Gugliandolo, A.; Cardelli, P.; Merciaro, I.; Ettorre, V.; Traini, T.; Bedini, R.; Scionti, D.; Bramanti, A.; Nanci, A. Three-Dimensional Printed PLA Scaffold and Human Gingival Stem Cell-Derived Extracellular Vesicles: A New Tool for Bone Defect Repair. Stem Cell Res. Ther. 2018, 9(1), 1–21. [Google Scholar] [CrossRef]
- Rodriguez-Contreras, A. Recent Advances in the Use of Polyhydroyalkanoates in Biomedicine. Bioengineering 2019, 6(3), 82. [Google Scholar] [CrossRef]
- Pryadko, A. S.; Botvin, V. V.; Mukhortova, Y. R.; Pariy, I.; Wagner, D. V.; Laktionov, P. P.; Chernonosova, V. S.; Chelobanov, B. P.; Chernozem, R. V.; Surmeneva, M. A. Core-Shell Magnetoactive PHB/Gelatin/Magnetite Composite Electrospun Scaffolds for Biomedical Applications. Polymers 2022, 14(3), 529. [Google Scholar] [CrossRef]
- Mikova, G.; Chodak, I. Properties and Modification of Poly (3-Hydroxybutanoate). Chem. Listy 2006, 100(12), 1075. [Google Scholar]
- Turco, R.; Santagata, G.; Corrado, I.; Pezzella, C.; Di Serio, M. In Vivo and Post-Synthesis Strategies to Enhance the Properties of PHB-Based Materials: A Review. Front. Bioeng. Biotechnol. 2021, 8. [Google Scholar] [CrossRef] [PubMed]
- Mosnáčková, K.; Opálková Šišková, A.; Kleinová, A.; Danko, M.; Mosnáček, J. Properties and Degradation of Novel Fully Biodegradable PLA/PHB Blends Filled with Keratin. Int. J. Mol. Sci. 2020, 21(24), 9678. [Google Scholar] [CrossRef]
- Zhuikov, V. A.; Akoulina, E. A.; Chesnokova, D. V.; Wenhao, Y.; Makhina, T. K.; Demyanova, I. V.; Zhuikova, Y. V.; Voinova, V. V.; Belishev, N. V.; Surmenev, R. A. The Growth of 3T3 Fibroblasts on PHB, PLA and PHB/PLA Blend Films at Different Stages of Their Biodegradation in Vitro. Polymers 2020, 13(1), 108. [Google Scholar] [CrossRef] [PubMed]
- Boey, J. Y.; Mohamad, L.; Khok, Y. S.; Tay, G. S.; Baidurah, S. A Review of the Applications and Biodegradation of Polyhydroxyalkanoates and Poly (Lactic Acid) and Its Composites. Polymers 2021, 13(10), 1544. [Google Scholar] [CrossRef]
- Balogová, A. F.; Trebuňová, M.; Živčák, J.; Hudák, R. Basic biodegradation methods of materials.
- Balogová, A. F.; Mitrík, L.; Trebuňová, M.; Dancáková, G.; Schnitzer, M.; Živčák, J. Polymer materials and their usage in veterinary practice.
- Arrieta, M. P.; Fortunati, E.; Dominici, F.; López, J.; Kenny, J. M. Bionanocomposite Films Based on Plasticized PLA–PHB/Cellulose Nanocrystal Blends. Carbohydr. Polym. 2015, 121, 265–275. [Google Scholar] [CrossRef]
- Arrieta, M. P.; Samper, M. D.; Aldas, M.; López, J. On the Use of PLA-PHB Blends for Sustainable Food Packaging Applications. Materials 2017, 10 (9). [CrossRef]
- Abdelwahab, M. A.; Flynn, A.; Chiou, B.-S.; Imam, S.; Orts, W.; Chiellini, E. Thermal, Mechanical and Morphological Characterization of Plasticized PLA–PHB Blends. Polym. Degrad. Stab. 2012, 97(9), 1822–1828. [Google Scholar] [CrossRef]
- Arrieta, M. P.; López, J.; Hernández, A.; Rayón, E. Ternary PLA–PHB–Limonene Blends Intended for Biodegradable Food Packaging Applications. Eur. Polym. J. 2014, 50, 255–270. [Google Scholar] [CrossRef]
- Armentano, I.; Fortunati, E.; Burgos, N.; Dominici, F.; Luzi, F.; Fiori, S.; Jiménez, A.; Yoon, K.; Ahn, J.; Kang, S. Bio-Based PLA_PHB Plasticized Blend Films: Processing and Structural Characterization. LWT-Food Sci. Technol. 2015, 64, 980–988. [Google Scholar] [CrossRef]
- Kohan, M.; Lancoš, S.; Schnitzer, M.; Živčák, J.; Hudák, R. Analysis of PLA/PHB Biopolymer Material with Admixture of Hydroxyapatite and Tricalcium Phosphate for Clinical Use. Polymers 2022, 14(24), 5357. [Google Scholar] [CrossRef] [PubMed]
- Findrik Balogová, A.; Trebuňová, M.; Ižaríková, G.; Kaščák, Ľ.; Mitrík, L.; Klímová, J.; Feranc, J.; Modrák, M.; Hudák, R.; Živčák, J. In Vitro Degradation of Specimens Produced from PLA/PHB by Additive Manufacturing in Simulated Conditions. Polymers 2021, 13(10), 1542. [Google Scholar] [CrossRef]
- Trebunova, M.; Gromošová, S.; Bačenková, D.; Rosocha, J.; Živčák, J. Biocompatibility of the Human Mesenchymal Stem Cells with Bovine Bone Tissue at the Cellular Level in Vitro. Lékař Tech.-Clin. Technol 2018, 48, 59–65. [Google Scholar]
- Culenova, M.; Birova, I.; Alexy, P.; Galfiova, P.; Nicodemou, A.; Moncmanova, B.; Plavec, R.; Tomanova, K.; Mencik, P.; Ziaran, S. In Vitro Characterization of Poly (Lactic Acid)/Poly (Hydroxybutyrate)/Thermoplastic Starch Blends for Tissue Engineering Application. Cell Transplant. 2021, 30, 09636897211021003. [Google Scholar] [CrossRef] [PubMed]
- Manikandan, N. A.; Pakshirajan, K.; Pugazhenthi, G. Preparation and Characterization of Environmentally Safe and Highly Biodegradable Microbial Polyhydroxybutyrate (PHB) Based Graphene Nanocomposites for Potential Food Packaging Applications. Int. J. Biol. Macromol. 2020, 154, 866–877. [Google Scholar] [CrossRef]
- Moorkoth, D.; Nampoothiri, K. M. Synthesis, Colloidal Properties and Cytotoxicity of Biopolymer Nanoparticles. Appl. Biochem. Biotechnol. 2014, 174, 2181–2194. [Google Scholar] [CrossRef]
- Arrieta, M. P.; Perdiguero, M.; Fiori, S.; Kenny, J. M.; Peponi, L. Biodegradable Electrospun PLA-PHB Fibers Plasticized with Oligomeric Lactic Acid. Polym. Degrad. Stab. 2020, 179, 109226. [Google Scholar] [CrossRef]
- Burgos, N.; Armentano, I.; Fortunati, E.; Dominici, F.; Luzi, F.; Fiori, S.; Cristofaro, F.; Visai, L.; Jiménez, A.; Kenny, J. M. Functional Properties of Plasticized Bio-Based Poly (Lactic Acid) _poly (Hydroxybutyrate)(PLA_PHB) Films for Active Food Packaging. Food Bioprocess Technol. 2017, 10, 770–780. [Google Scholar] [CrossRef]
- Armentano, I.; Fortunati, E.; Burgos, N.; Dominici, F.; Luzi, F.; Fiori, S.; Jiménez, A.; Yoon, K.; Ahn, J.; Kang, S. Processing and Characterization of Plasticized PLA/PHB Blends for Biodegradable Multiphase Systems. 2015.
- Balogová, A. F.; Hudák, R.; Tóth, T.; Schnitzer, M.; Feranc, J.; Bakoš, D.; Živčák, J. Determination of Geometrical and Viscoelastic Properties of PLA/PHB Samples Made by Additive Manufacturing for Urethral Substitution. J. Biotechnol. 2018, 284, 123–130. [Google Scholar] [CrossRef] [PubMed]
- Burgos, N.; Tolaguera, D.; Fiori, S.; Jiménez, A. Synthesis and Characterization of Lactic Acid Oligomers: Evaluation of Performance as Poly (Lactic Acid) Plasticizers. J. Polym. Environ. 2014, 22, 227–235. [Google Scholar] [CrossRef]
- Arrieta, M. P.; López, J.; López, D.; Kenny, J. M.; Peponi, L. Effect of Chitosan and Catechin Addition on the Structural, Thermal, Mechanical and Disintegration Properties of Plasticized Electrospun PLA-PHB Biocomposites. Polym. Degrad. Stab. 2016, 132, 145–156. [Google Scholar] [CrossRef]
- D’Anna, A.; Arrigo, R.; Frache, A. PLA/PHB Blends: Biocompatibilizer Effects. Polymers 2019,, 11. [Google Scholar] [CrossRef] [PubMed]
- Mosnáčková, K.; Opálková Šišková, A.; Kleinová, A.; Danko, M.; Mosnáček, J. Properties and Degradation of Novel Fully Biodegradable PLA/PHB Blends Filled with Keratin. Int. J. Mol. Sci. 2020, 21. [Google Scholar] [CrossRef]
- Kovalcik, A.; Sangroniz, L.; Kalina, M.; Skopalova, K.; Humpolíček, P.; Omastova, M.; Mundigler, N.; Müller, A. J. Properties of Scaffolds Prepared by Fused Deposition Modeling of Poly (Hydroxyalkanoates). Int. J. Biol. Macromol. 2020, 161, 364–376. [Google Scholar] [CrossRef]
Figure 1.
Printed samples of materials (I, II, III).
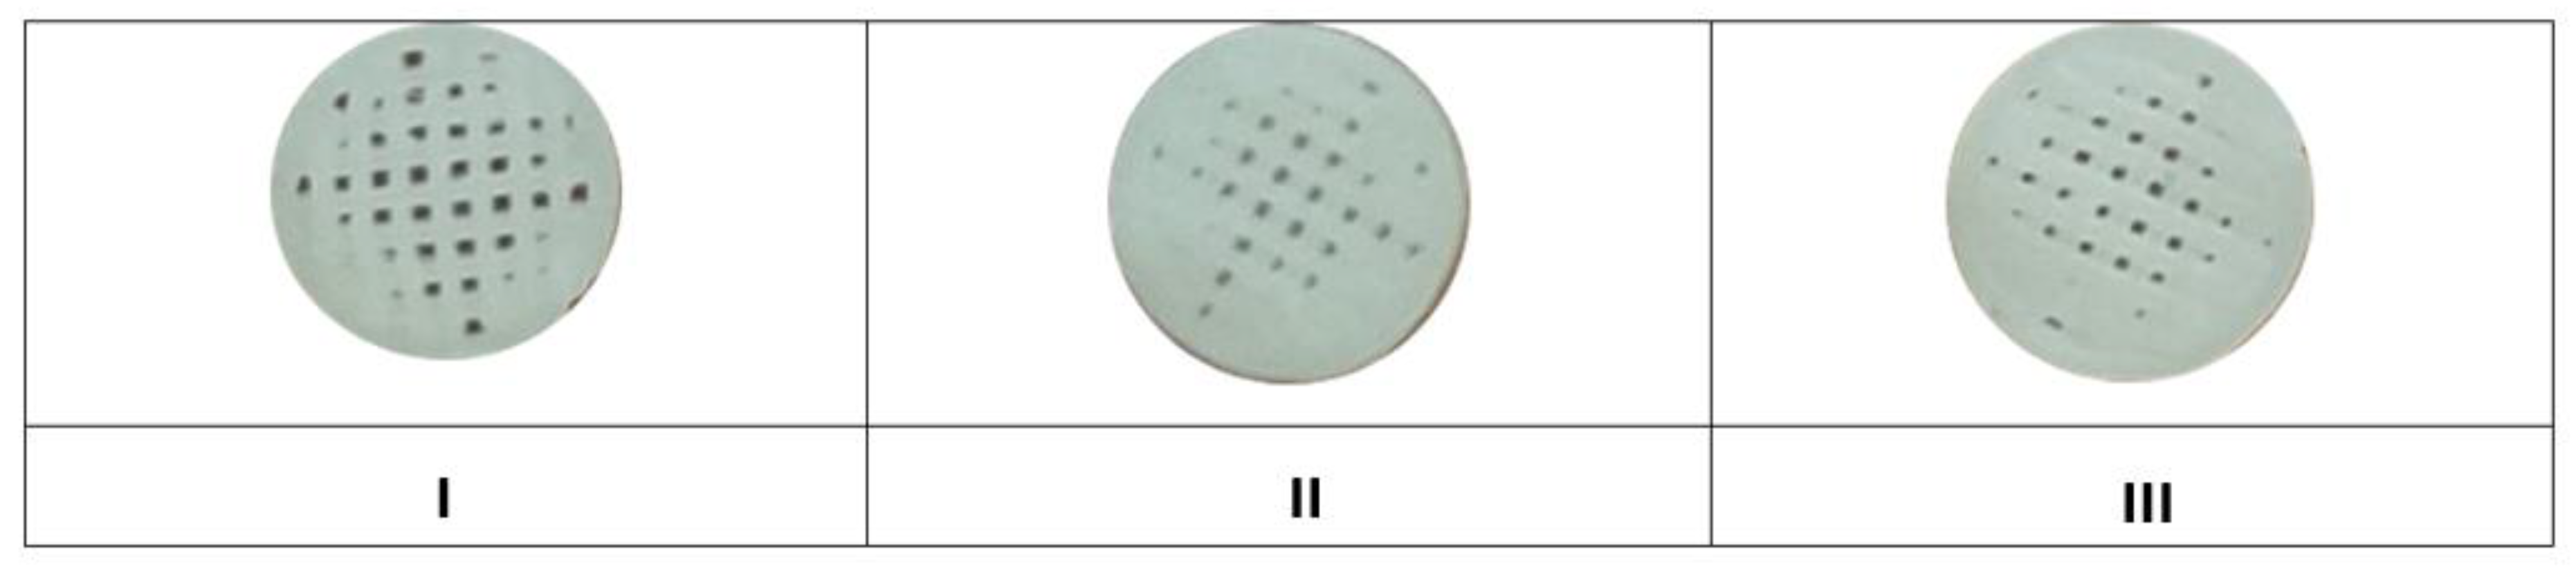
Figure 2.
Macroscopic image of sample I (PLA/PHB/TPS + 25% OLA) at different magnifications.
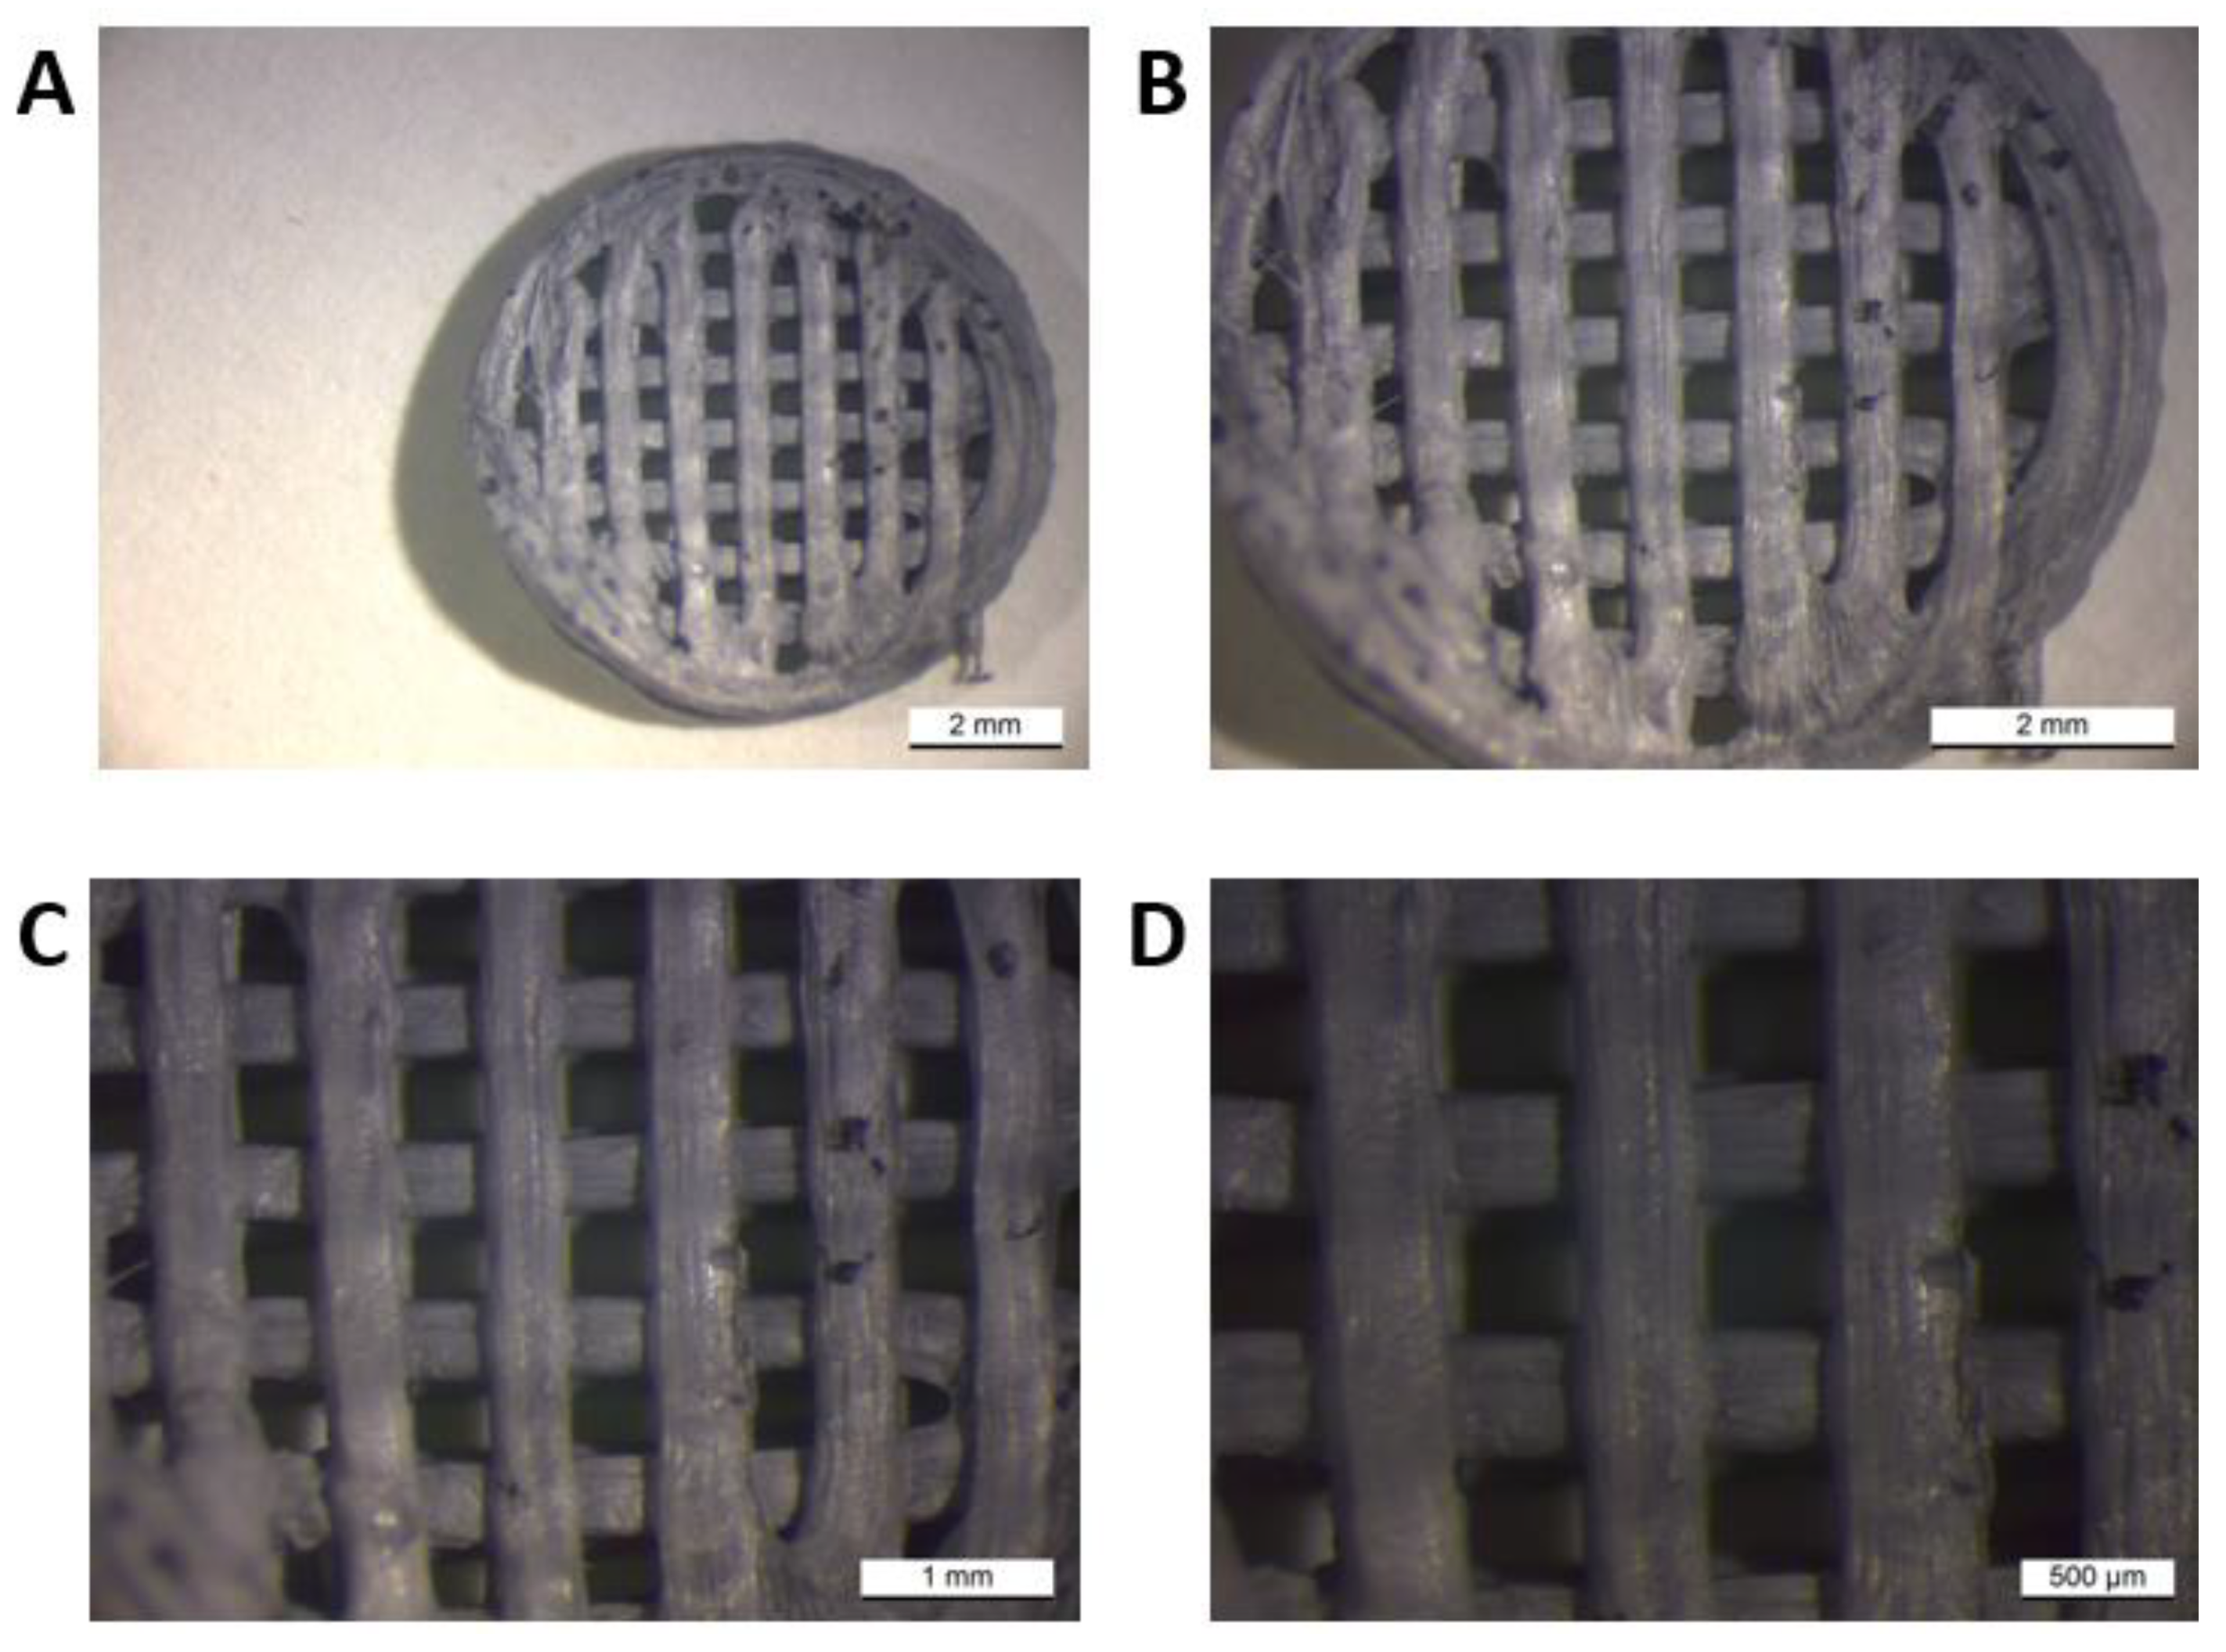
Figure 3.
7F2 osteoblast cell line the first day after thawing, (A) – 7F2 osteoblast cell line directly after plating on a T-25 culture flask. Scale - 50 µm. (B) - 7F2 osteoblast cell line 1 hour after plating on a T-25 culture flask. Arrows show an example of a cell adhered to the surface of a culture bottle (1) and the formation of cell protrusions (2). Scale - 50 µm.
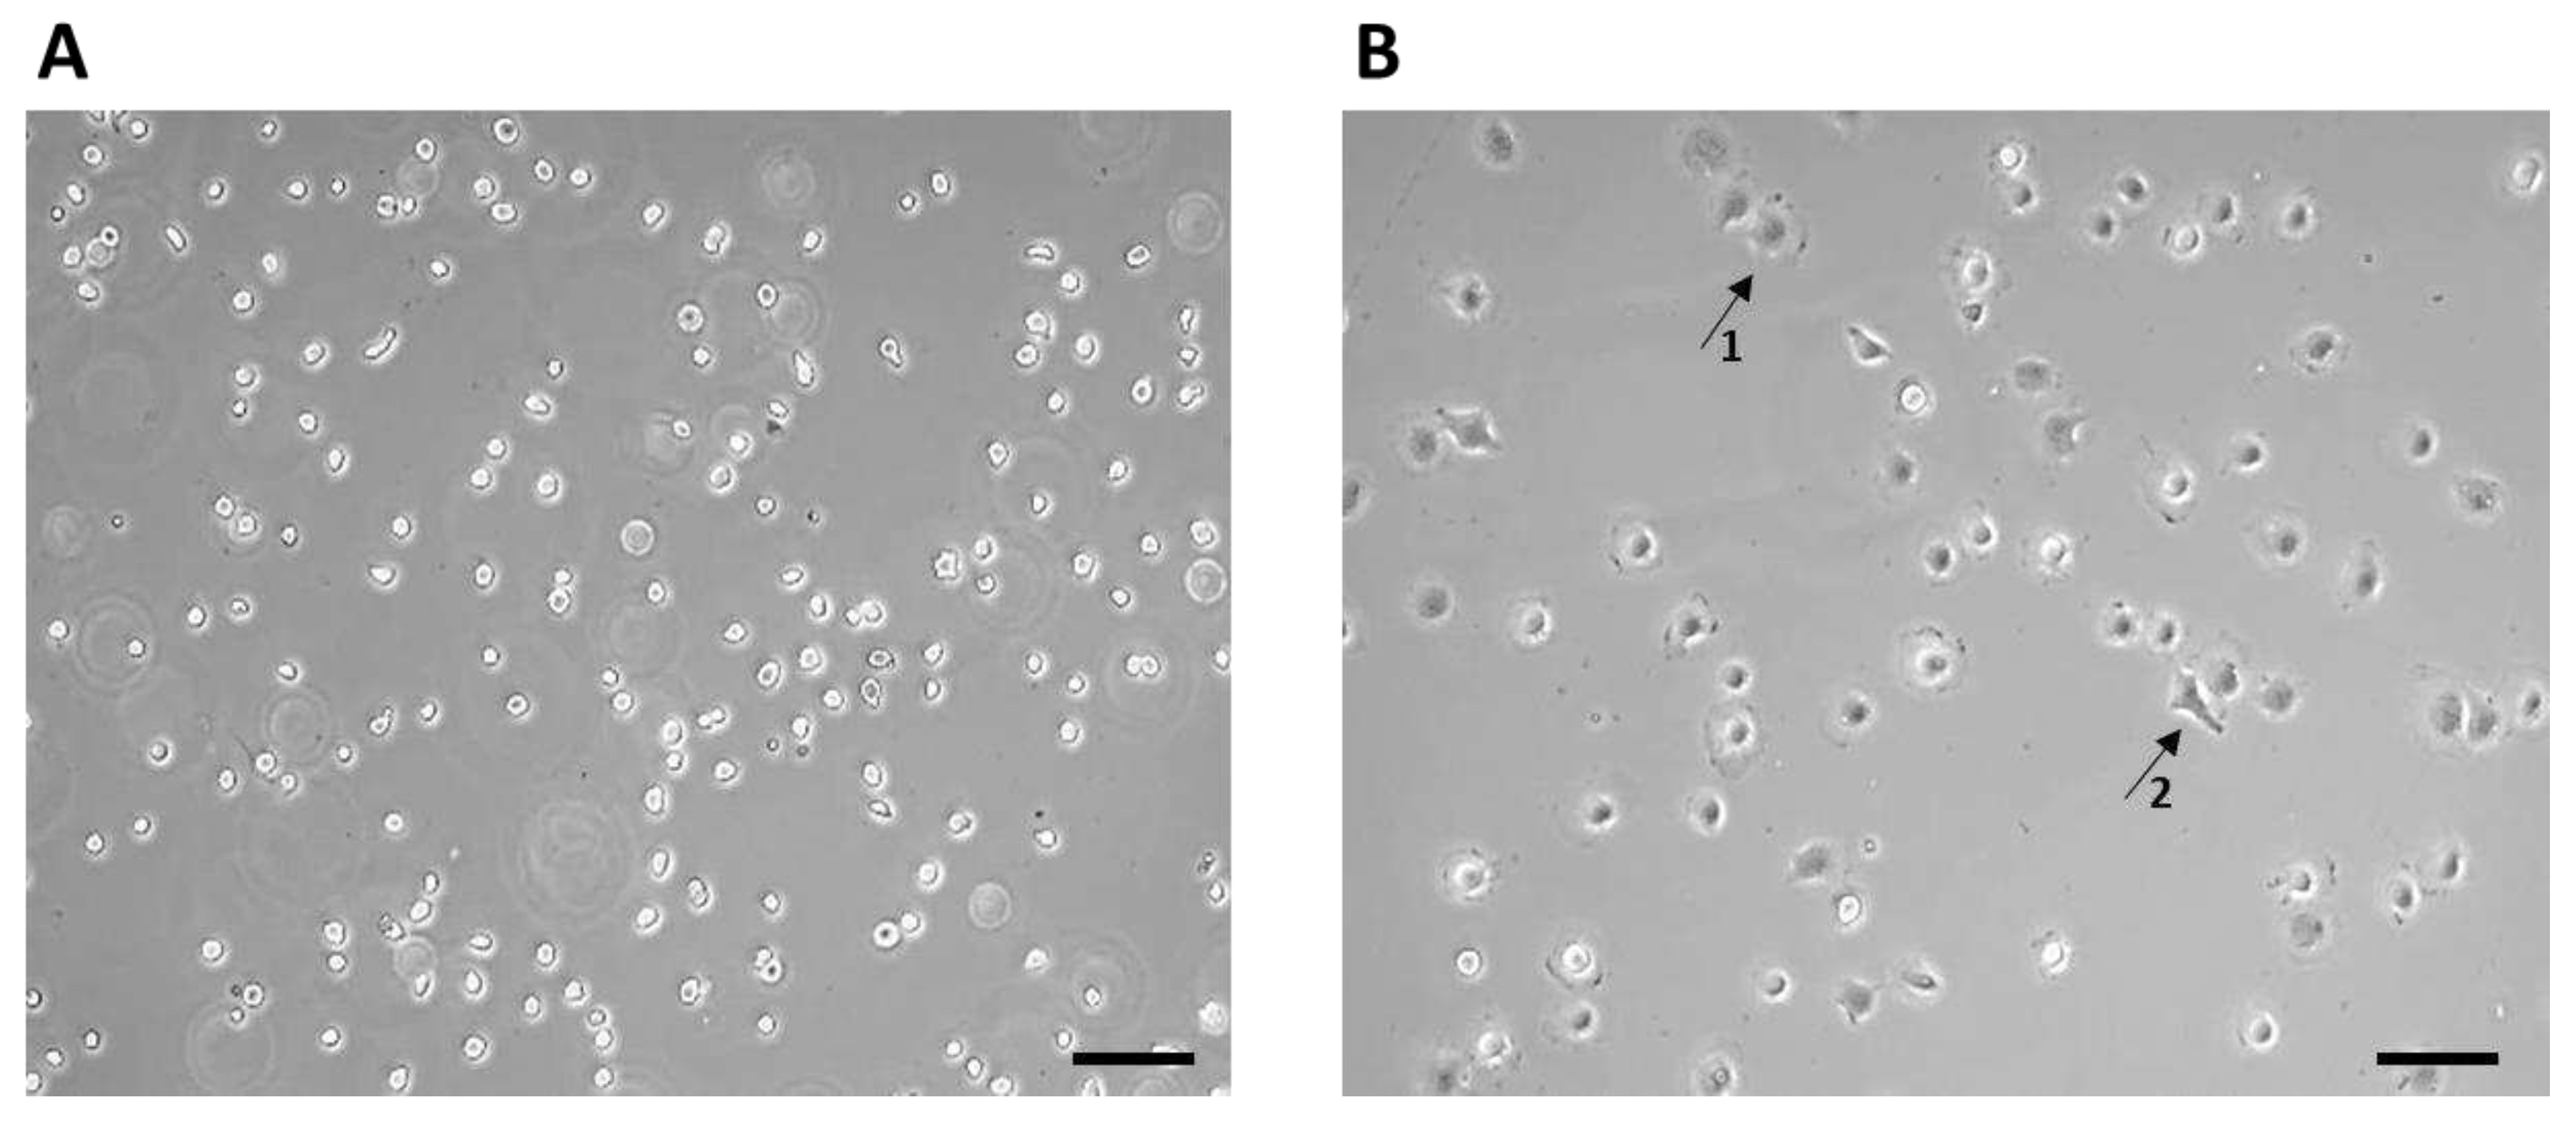
Figure 4.
7F2 osteoblast cell line on the third day after thawing, 7F2 osteoblasts acquired an irregular star-shaped shape with numerous protrusions forming intercellular contacts. (A) Scale bar - 50 µm; (B) Scale bar - 20 µm.
Figure 4.
7F2 osteoblast cell line on the third day after thawing, 7F2 osteoblasts acquired an irregular star-shaped shape with numerous protrusions forming intercellular contacts. (A) Scale bar - 50 µm; (B) Scale bar - 20 µm.
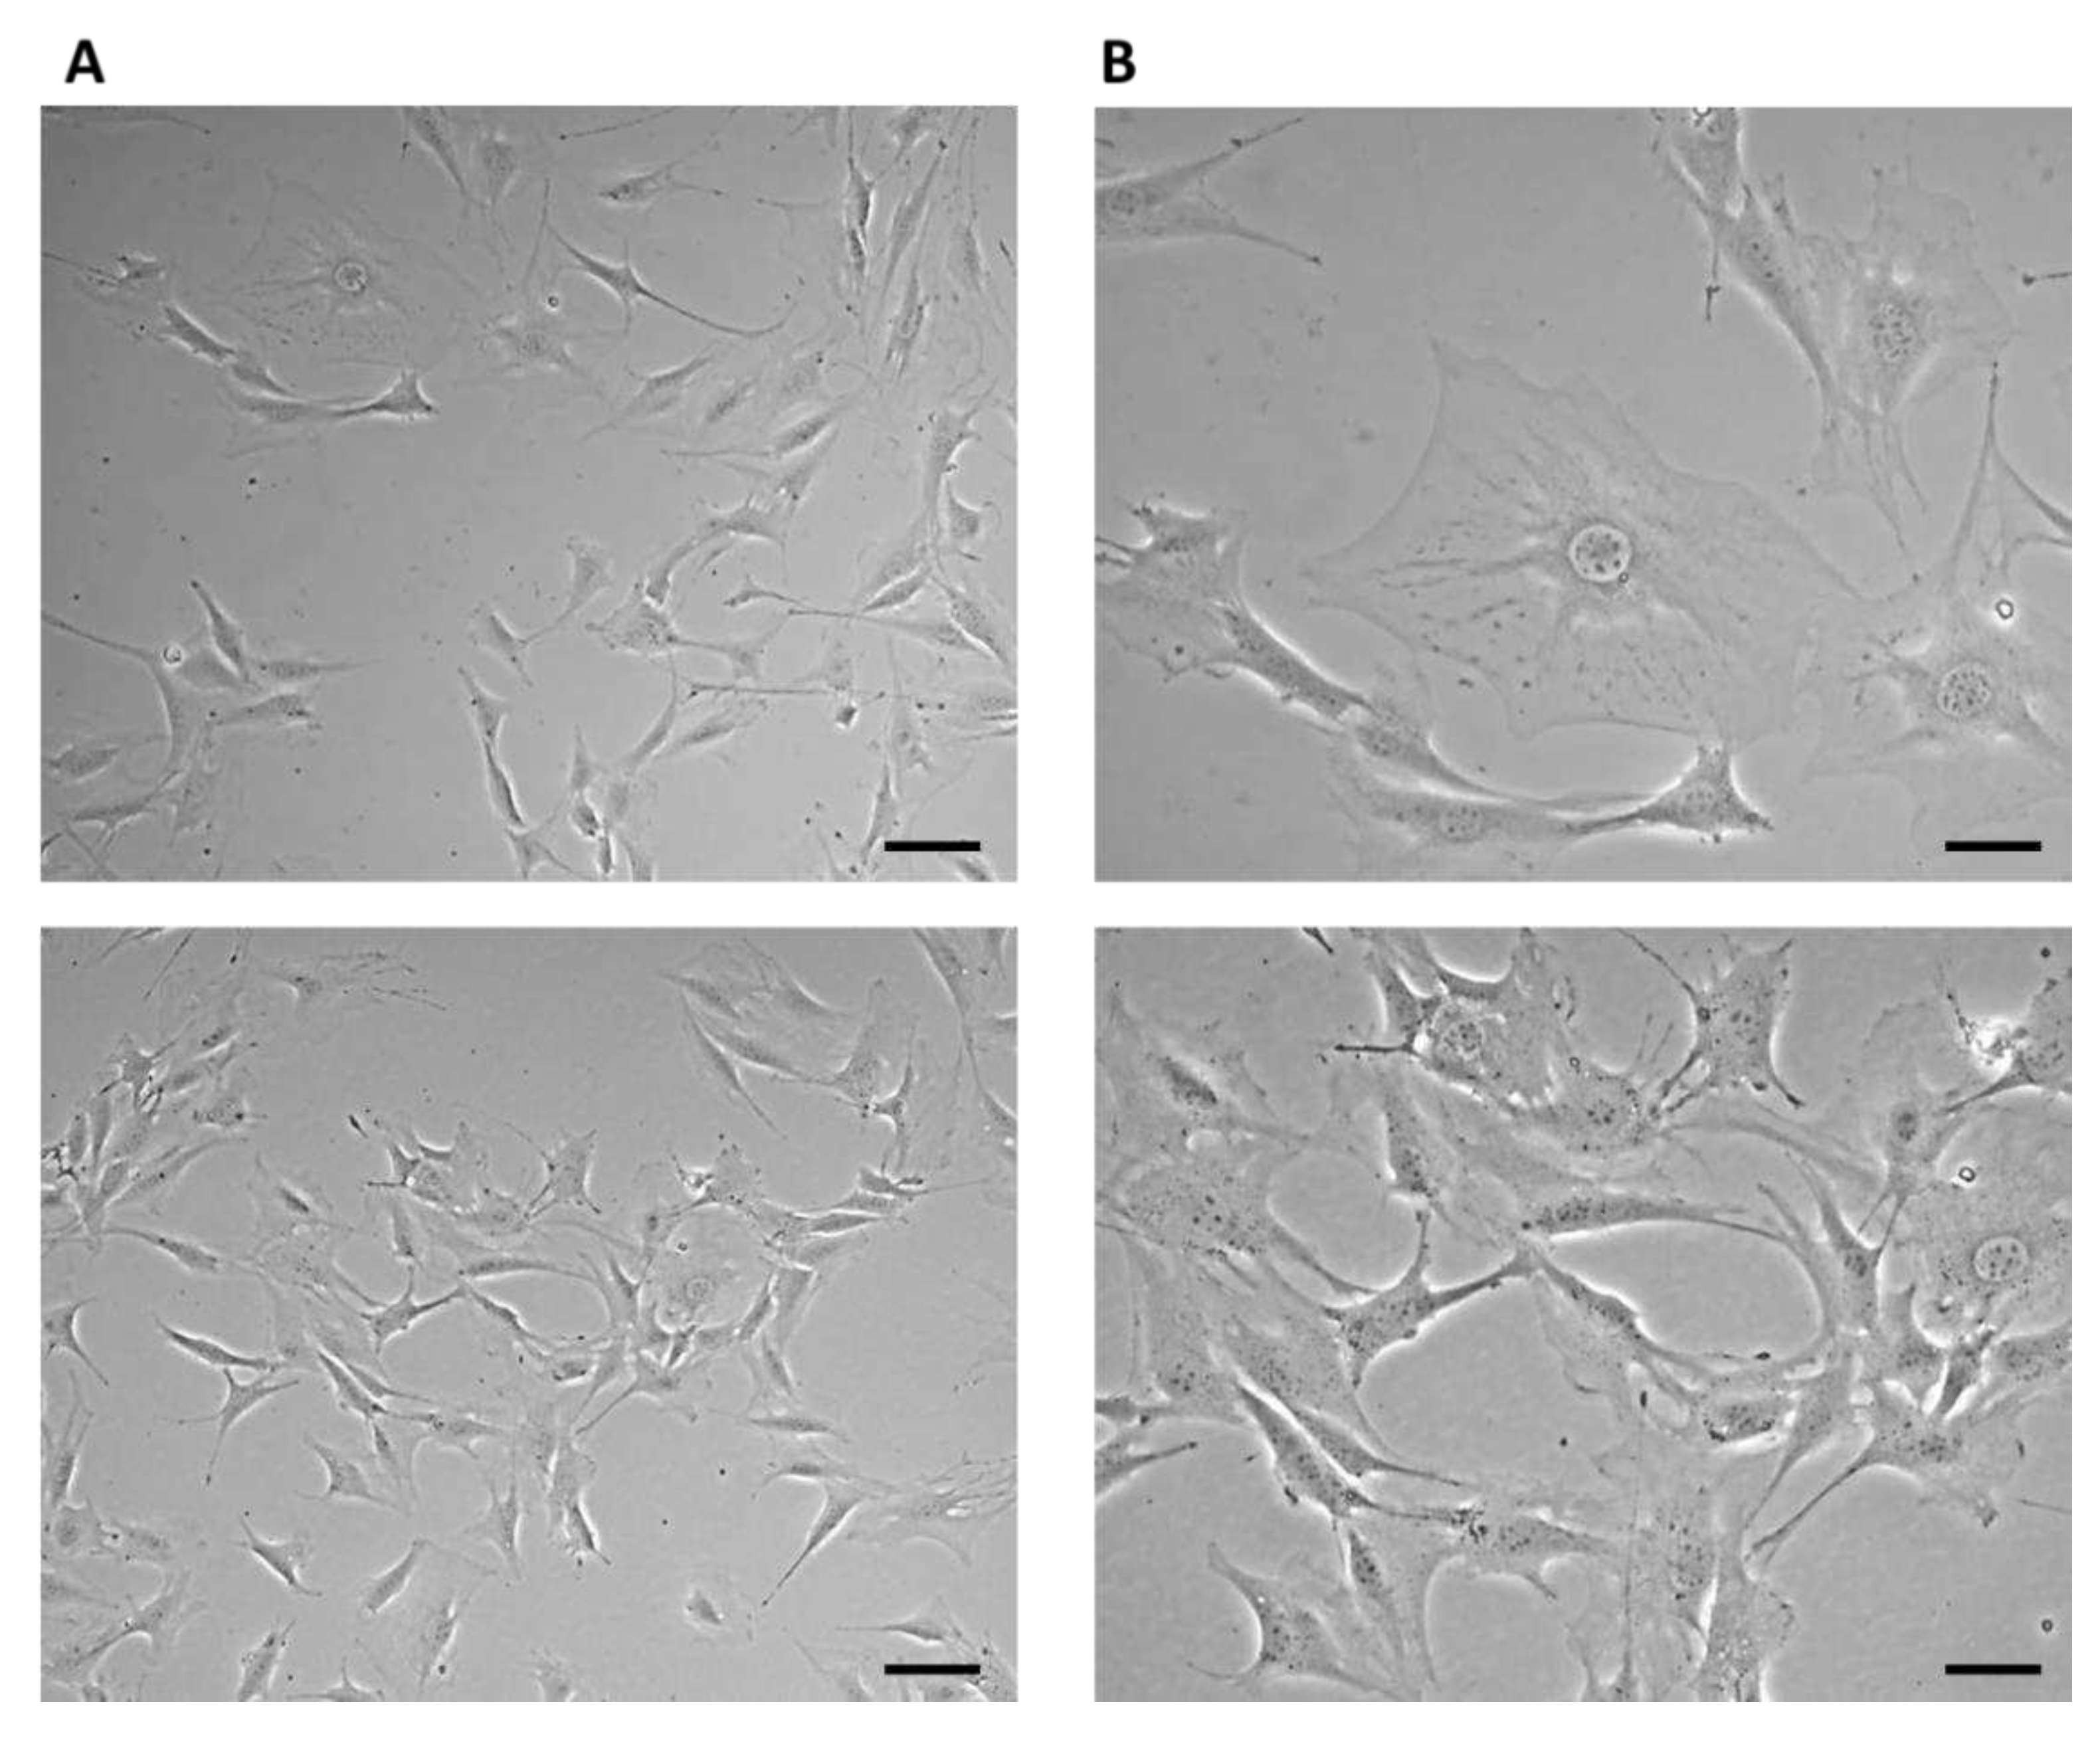
Figure 5.
Cell line 7F2 osteoblasts on the eighth day of culture (A) Scale bar - 50 µm; (B) Scale bar - 20 µm.
Figure 5.
Cell line 7F2 osteoblasts on the eighth day of culture (A) Scale bar - 50 µm; (B) Scale bar - 20 µm.
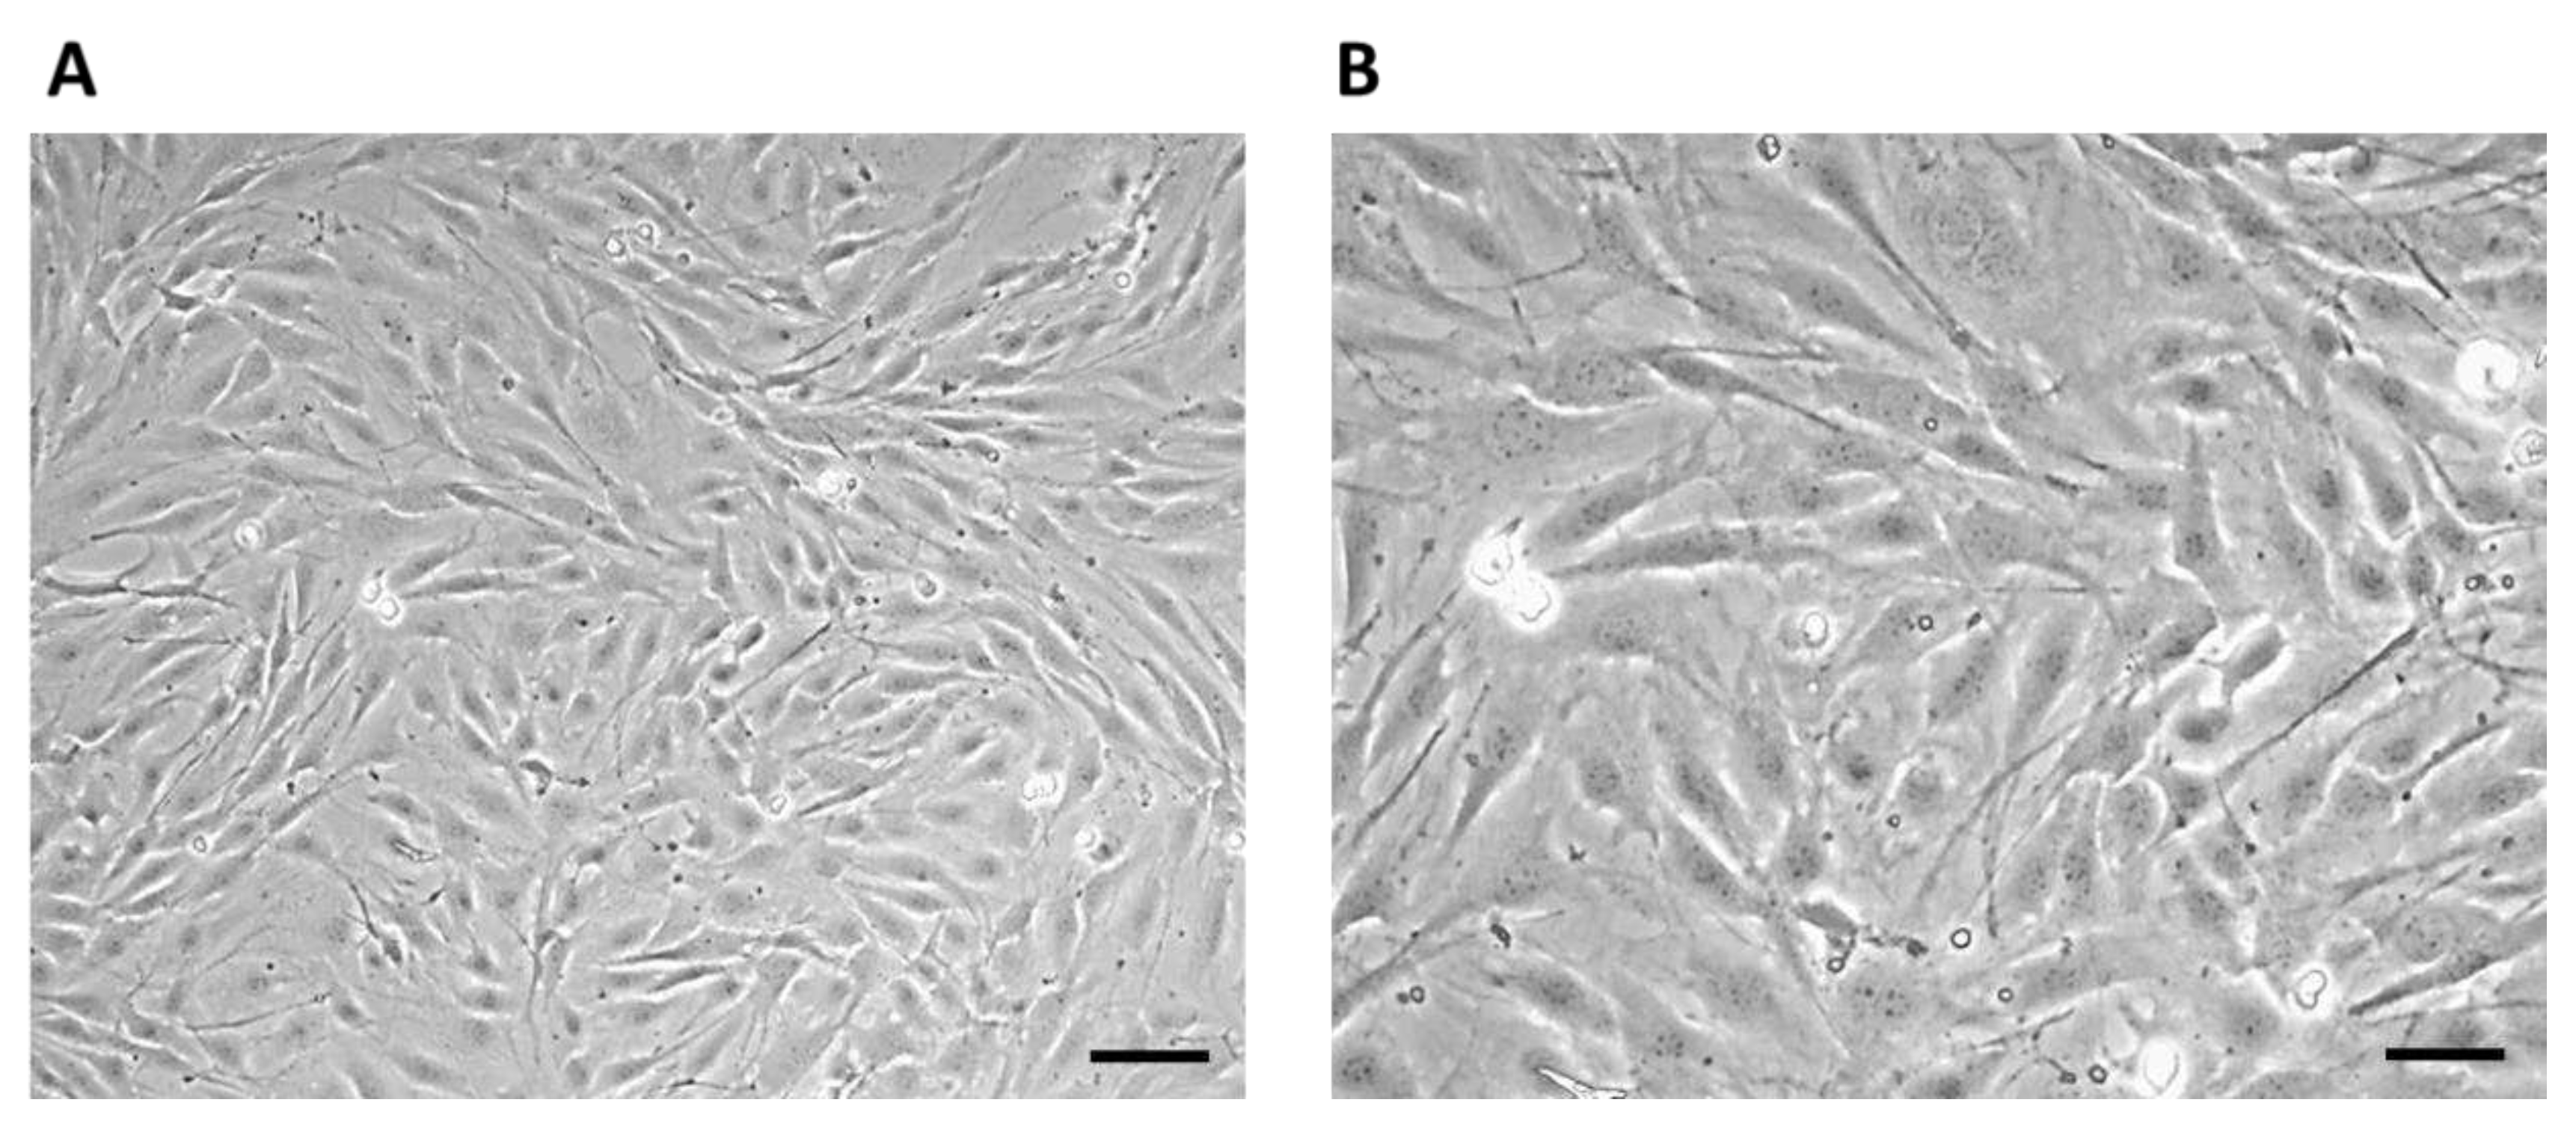
Figure 6.
Growth curves of 7F2 osteoblast cells. The data represent the mean ± SEM (Standard Error of the Mean) of six independent experiments.
Figure 6.
Growth curves of 7F2 osteoblast cells. The data represent the mean ± SEM (Standard Error of the Mean) of six independent experiments.
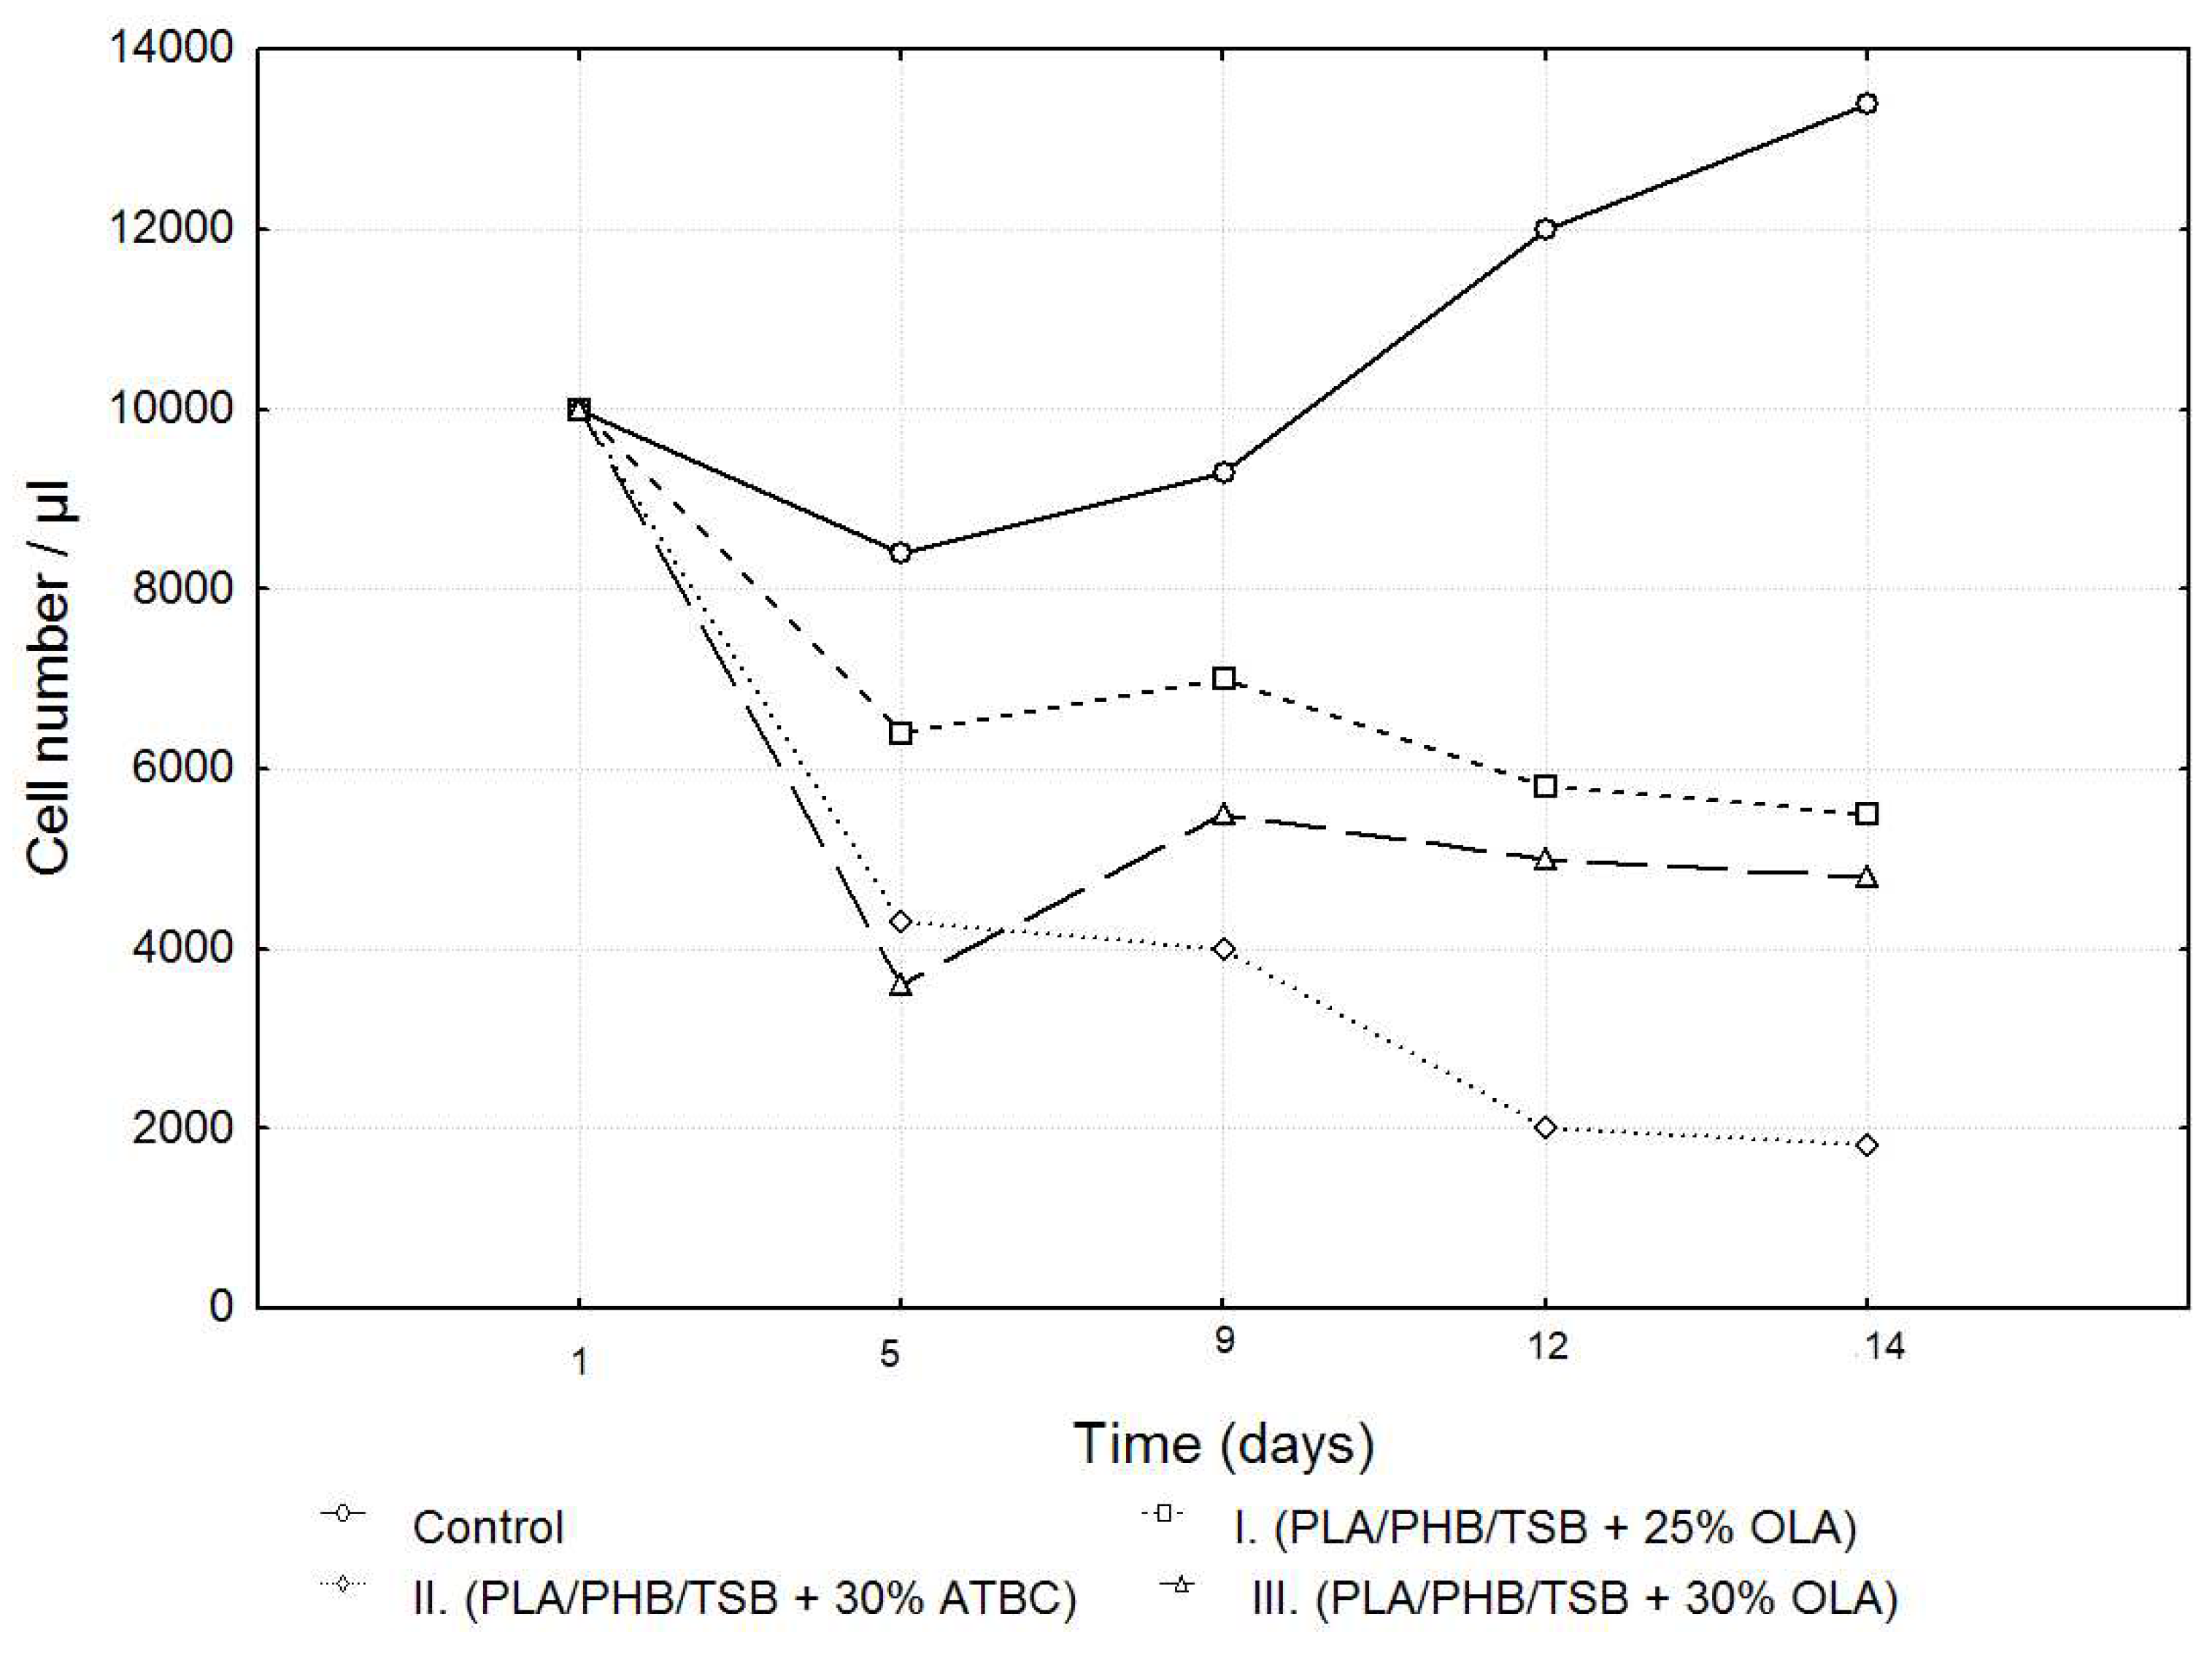
Figure 7.
Metabolic activity of 7F2 osteoblast cells co-cultured on samples I., II. and III. Bars represent the mean ± 0.95 IC (Interval Confidence) of six independent experiments. Statistical significance was assessed using ANOVA (°<0.05).
Figure 7.
Metabolic activity of 7F2 osteoblast cells co-cultured on samples I., II. and III. Bars represent the mean ± 0.95 IC (Interval Confidence) of six independent experiments. Statistical significance was assessed using ANOVA (°<0.05).
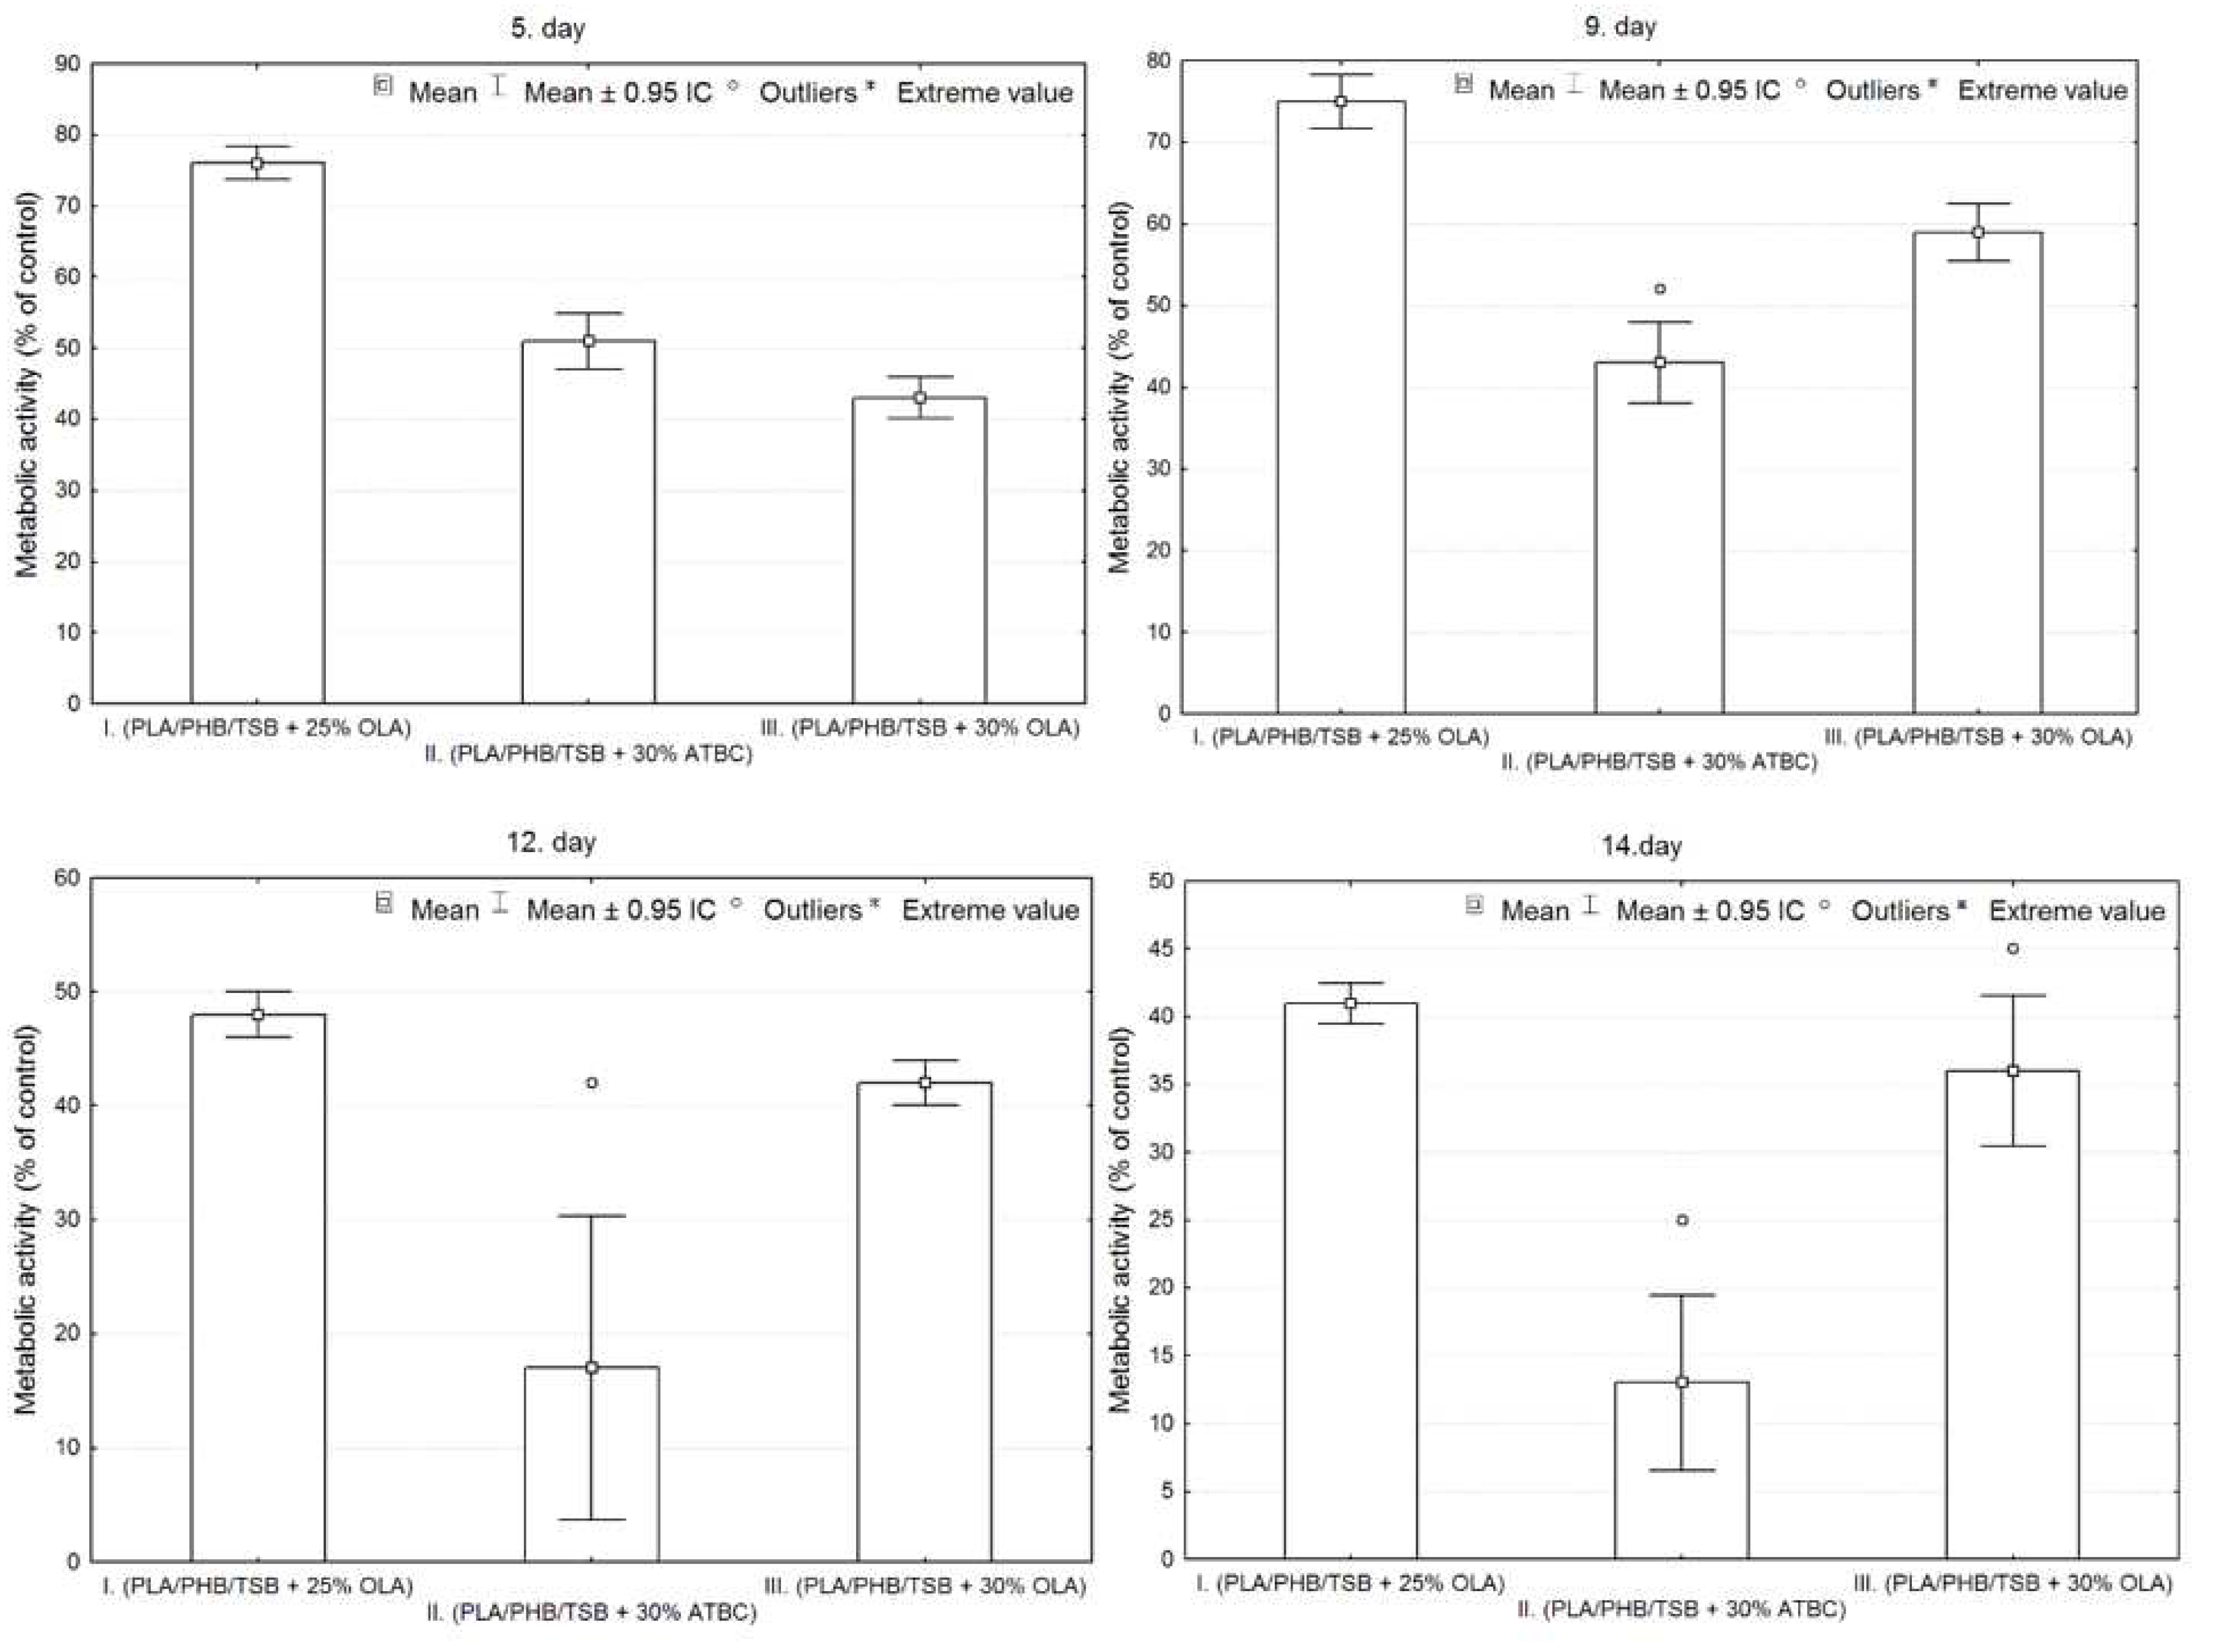
Figure 8.
Proliferation of 7F2 osteoblasts on samples the first day after seeding. A) 7F2 osteoblast cells on sample I (PLA/PHB/TSB + 25% OLA); B) 7F2 osteoblast cells on sample II (PLA/PHB/TSB + 30% ATBC); C) 7F2 osteoblast cells on sample III (PLA/PHB/TSB + 30% OLA). Scale bar: I – 100 µm; II – 50 µm.
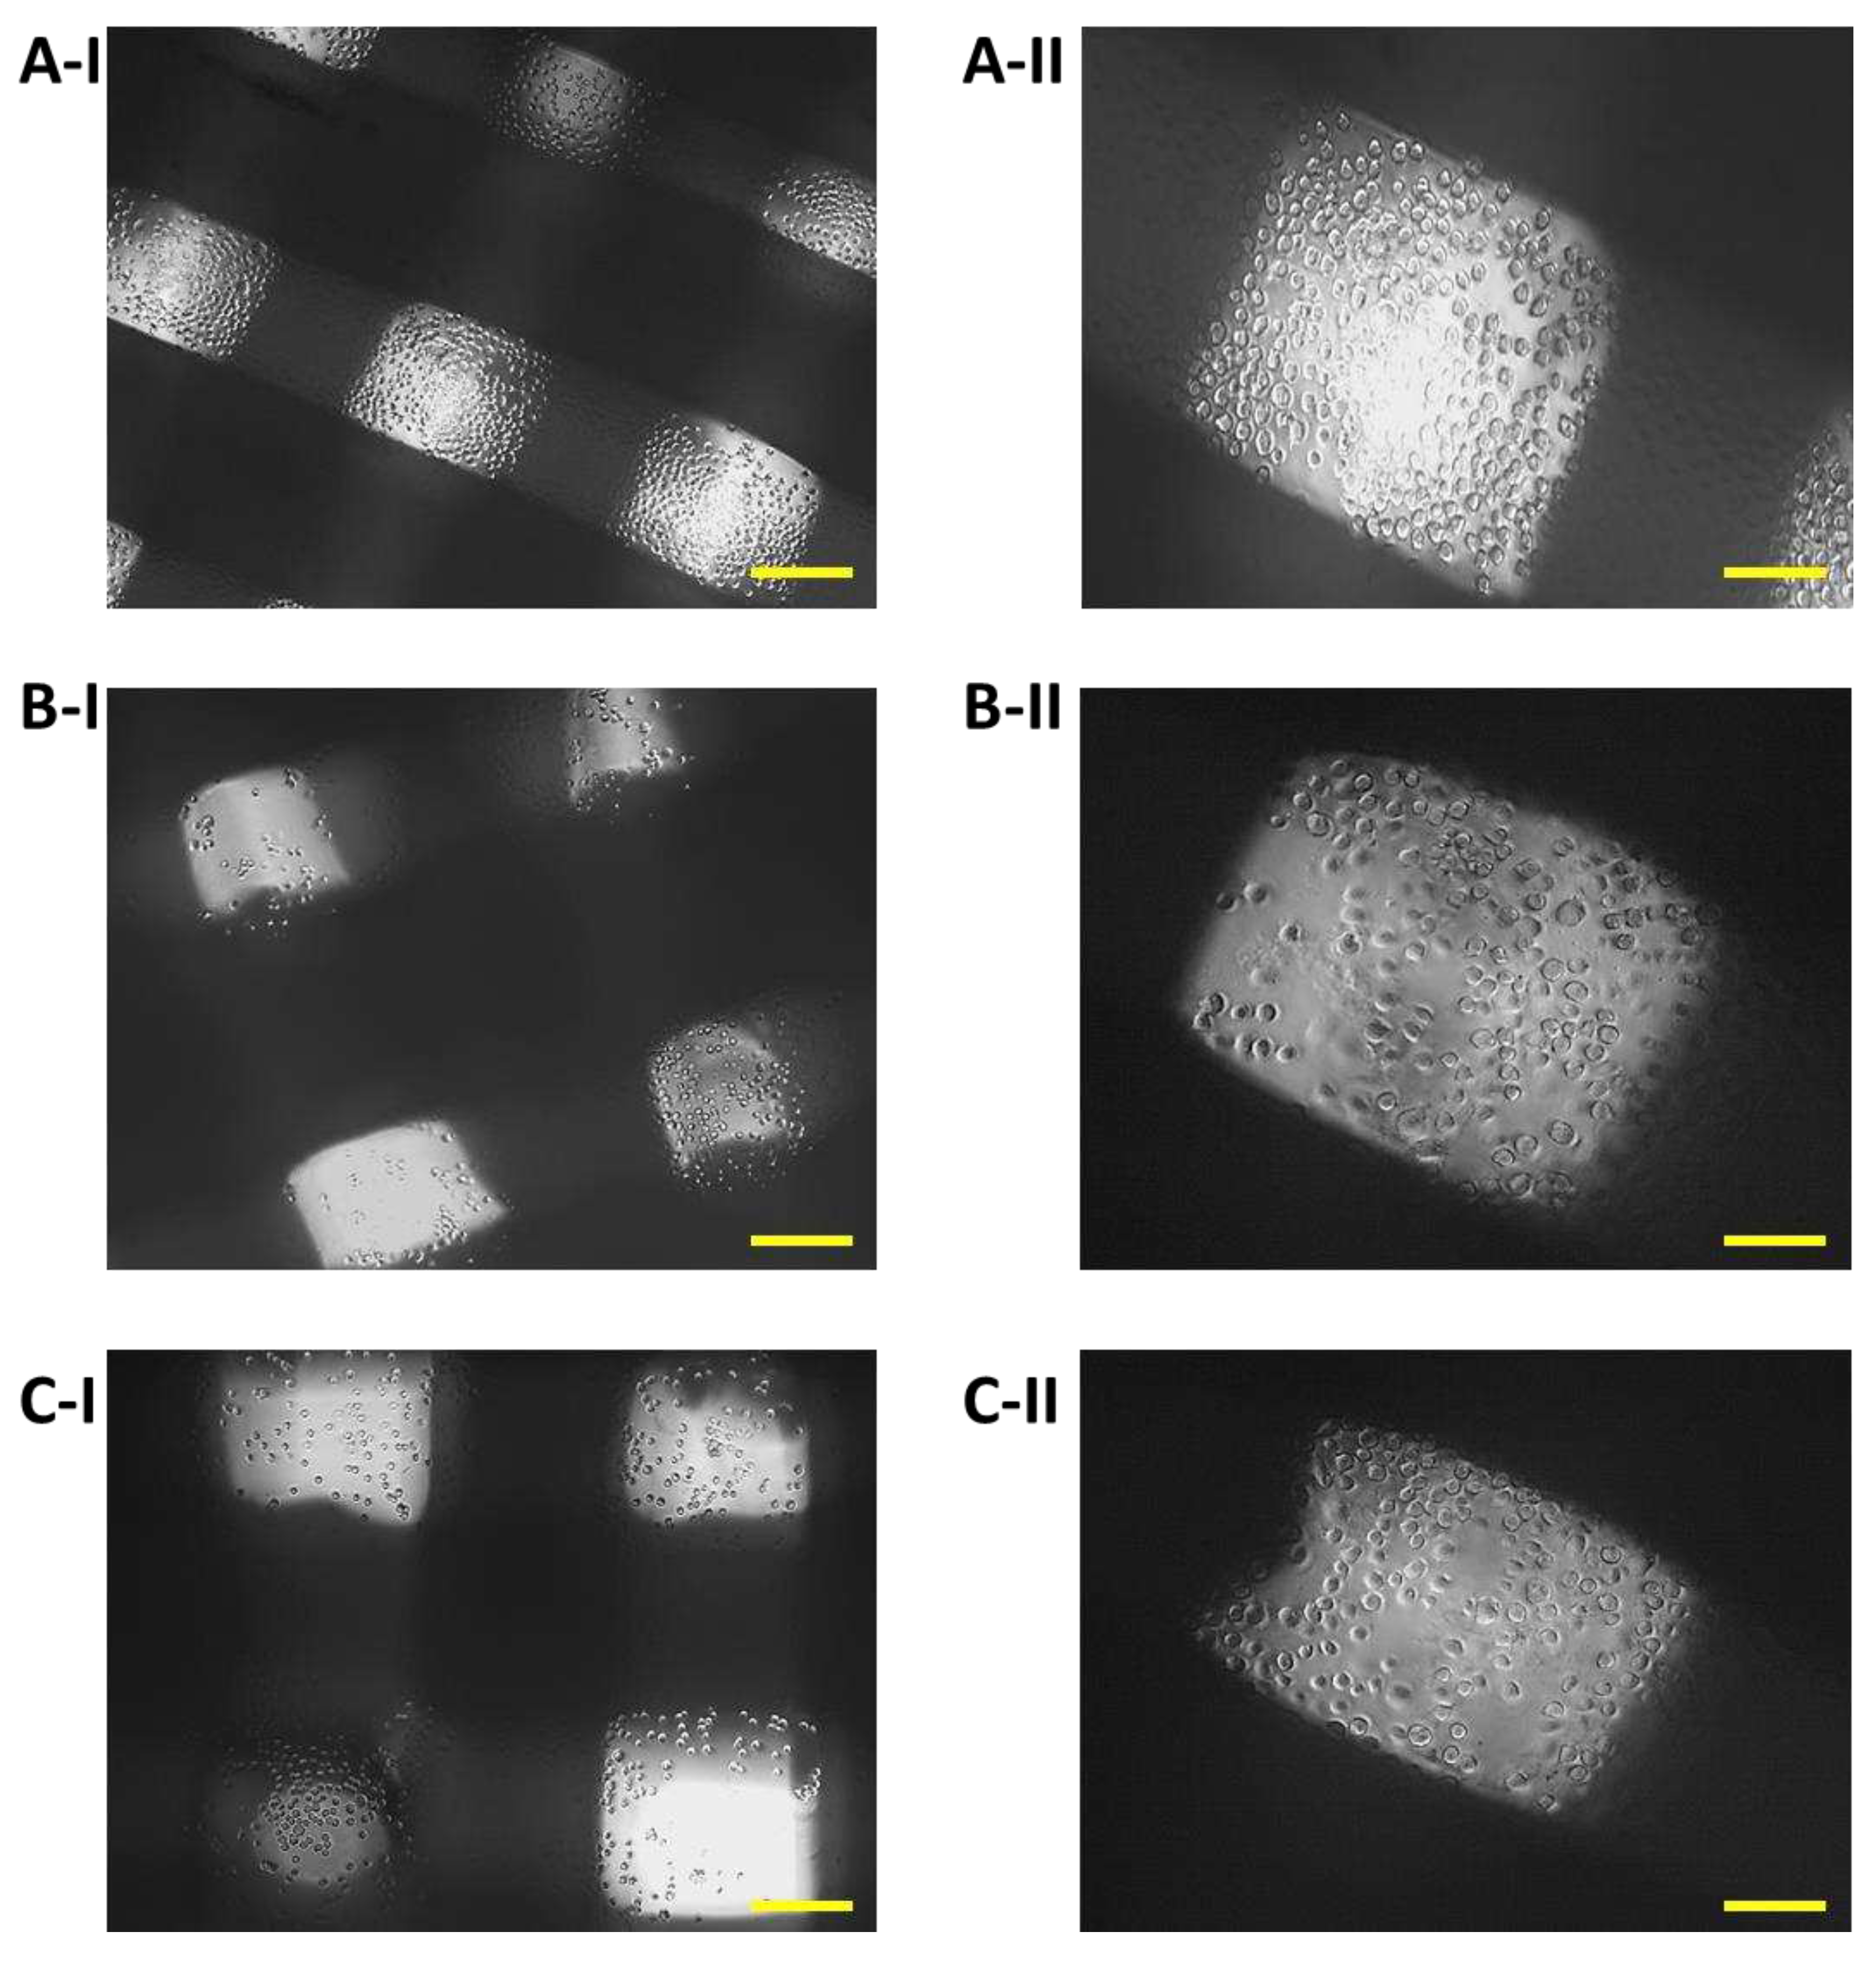
Figure 9.
Proliferation of 7F2 osteoblasts on samples on the eighth day after seeding, A) osteoblasts on sample I (PLA/PHB/TSB + 25% OLA) – best proliferative activity; B) osteoblasts on sample II (PLA/PHB/TSB + 30% ATBC) – without cell proliferation; C) osteoblasts on sample III (PLA/PHB/TSB + 30% OLA) – moderate cell proliferation. Scale bar: I – 100 µm; II – 50 µm.
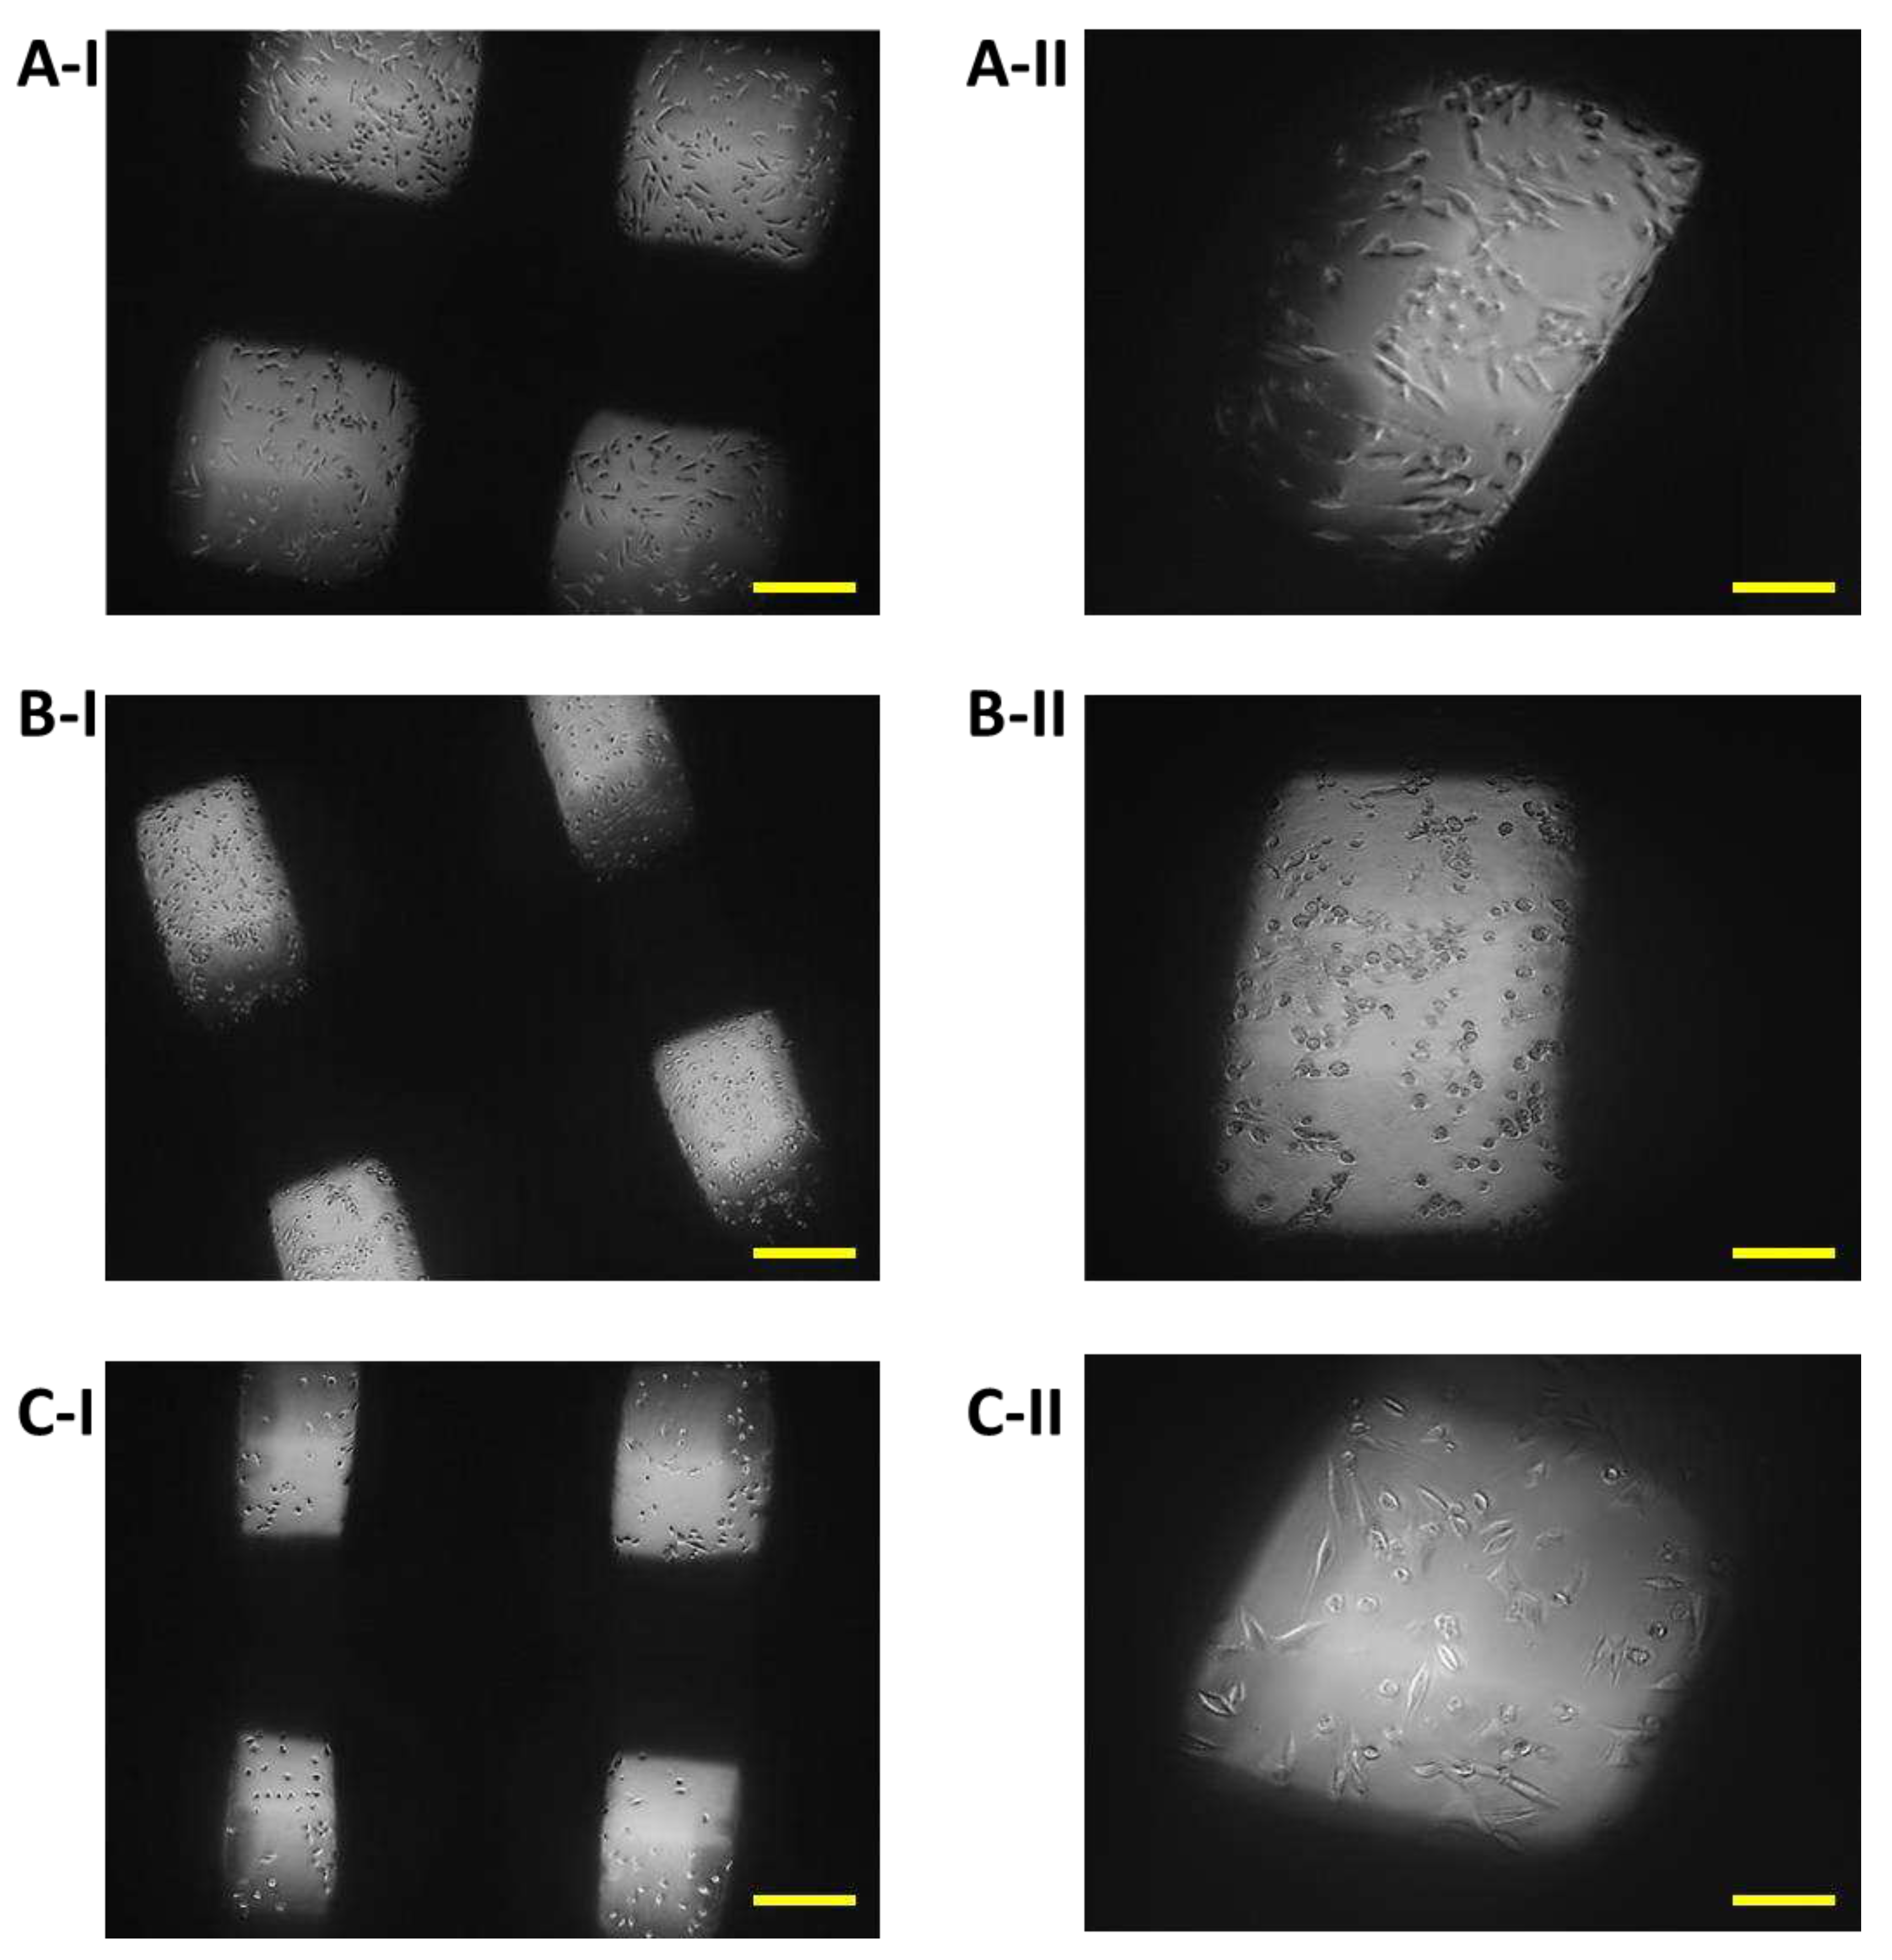
Figure 10.
Proliferation of 7F2 osteoblasts on samples on the eleventh day after seeding, A) osteoblasts on sample I (PLA/PHB/TSB + 25% OLA) – lower rate of cell proliferation; B) osteoblasts on sample II (PLA/PHB/TSB + 30% ATBC) – no cell proliferation; C) osteoblasts on sample III (PLA/PHB/TSB + 30% OLA) – lower rate of cell proliferation. Scale bar: I – 100 µm; II – 50 µm.
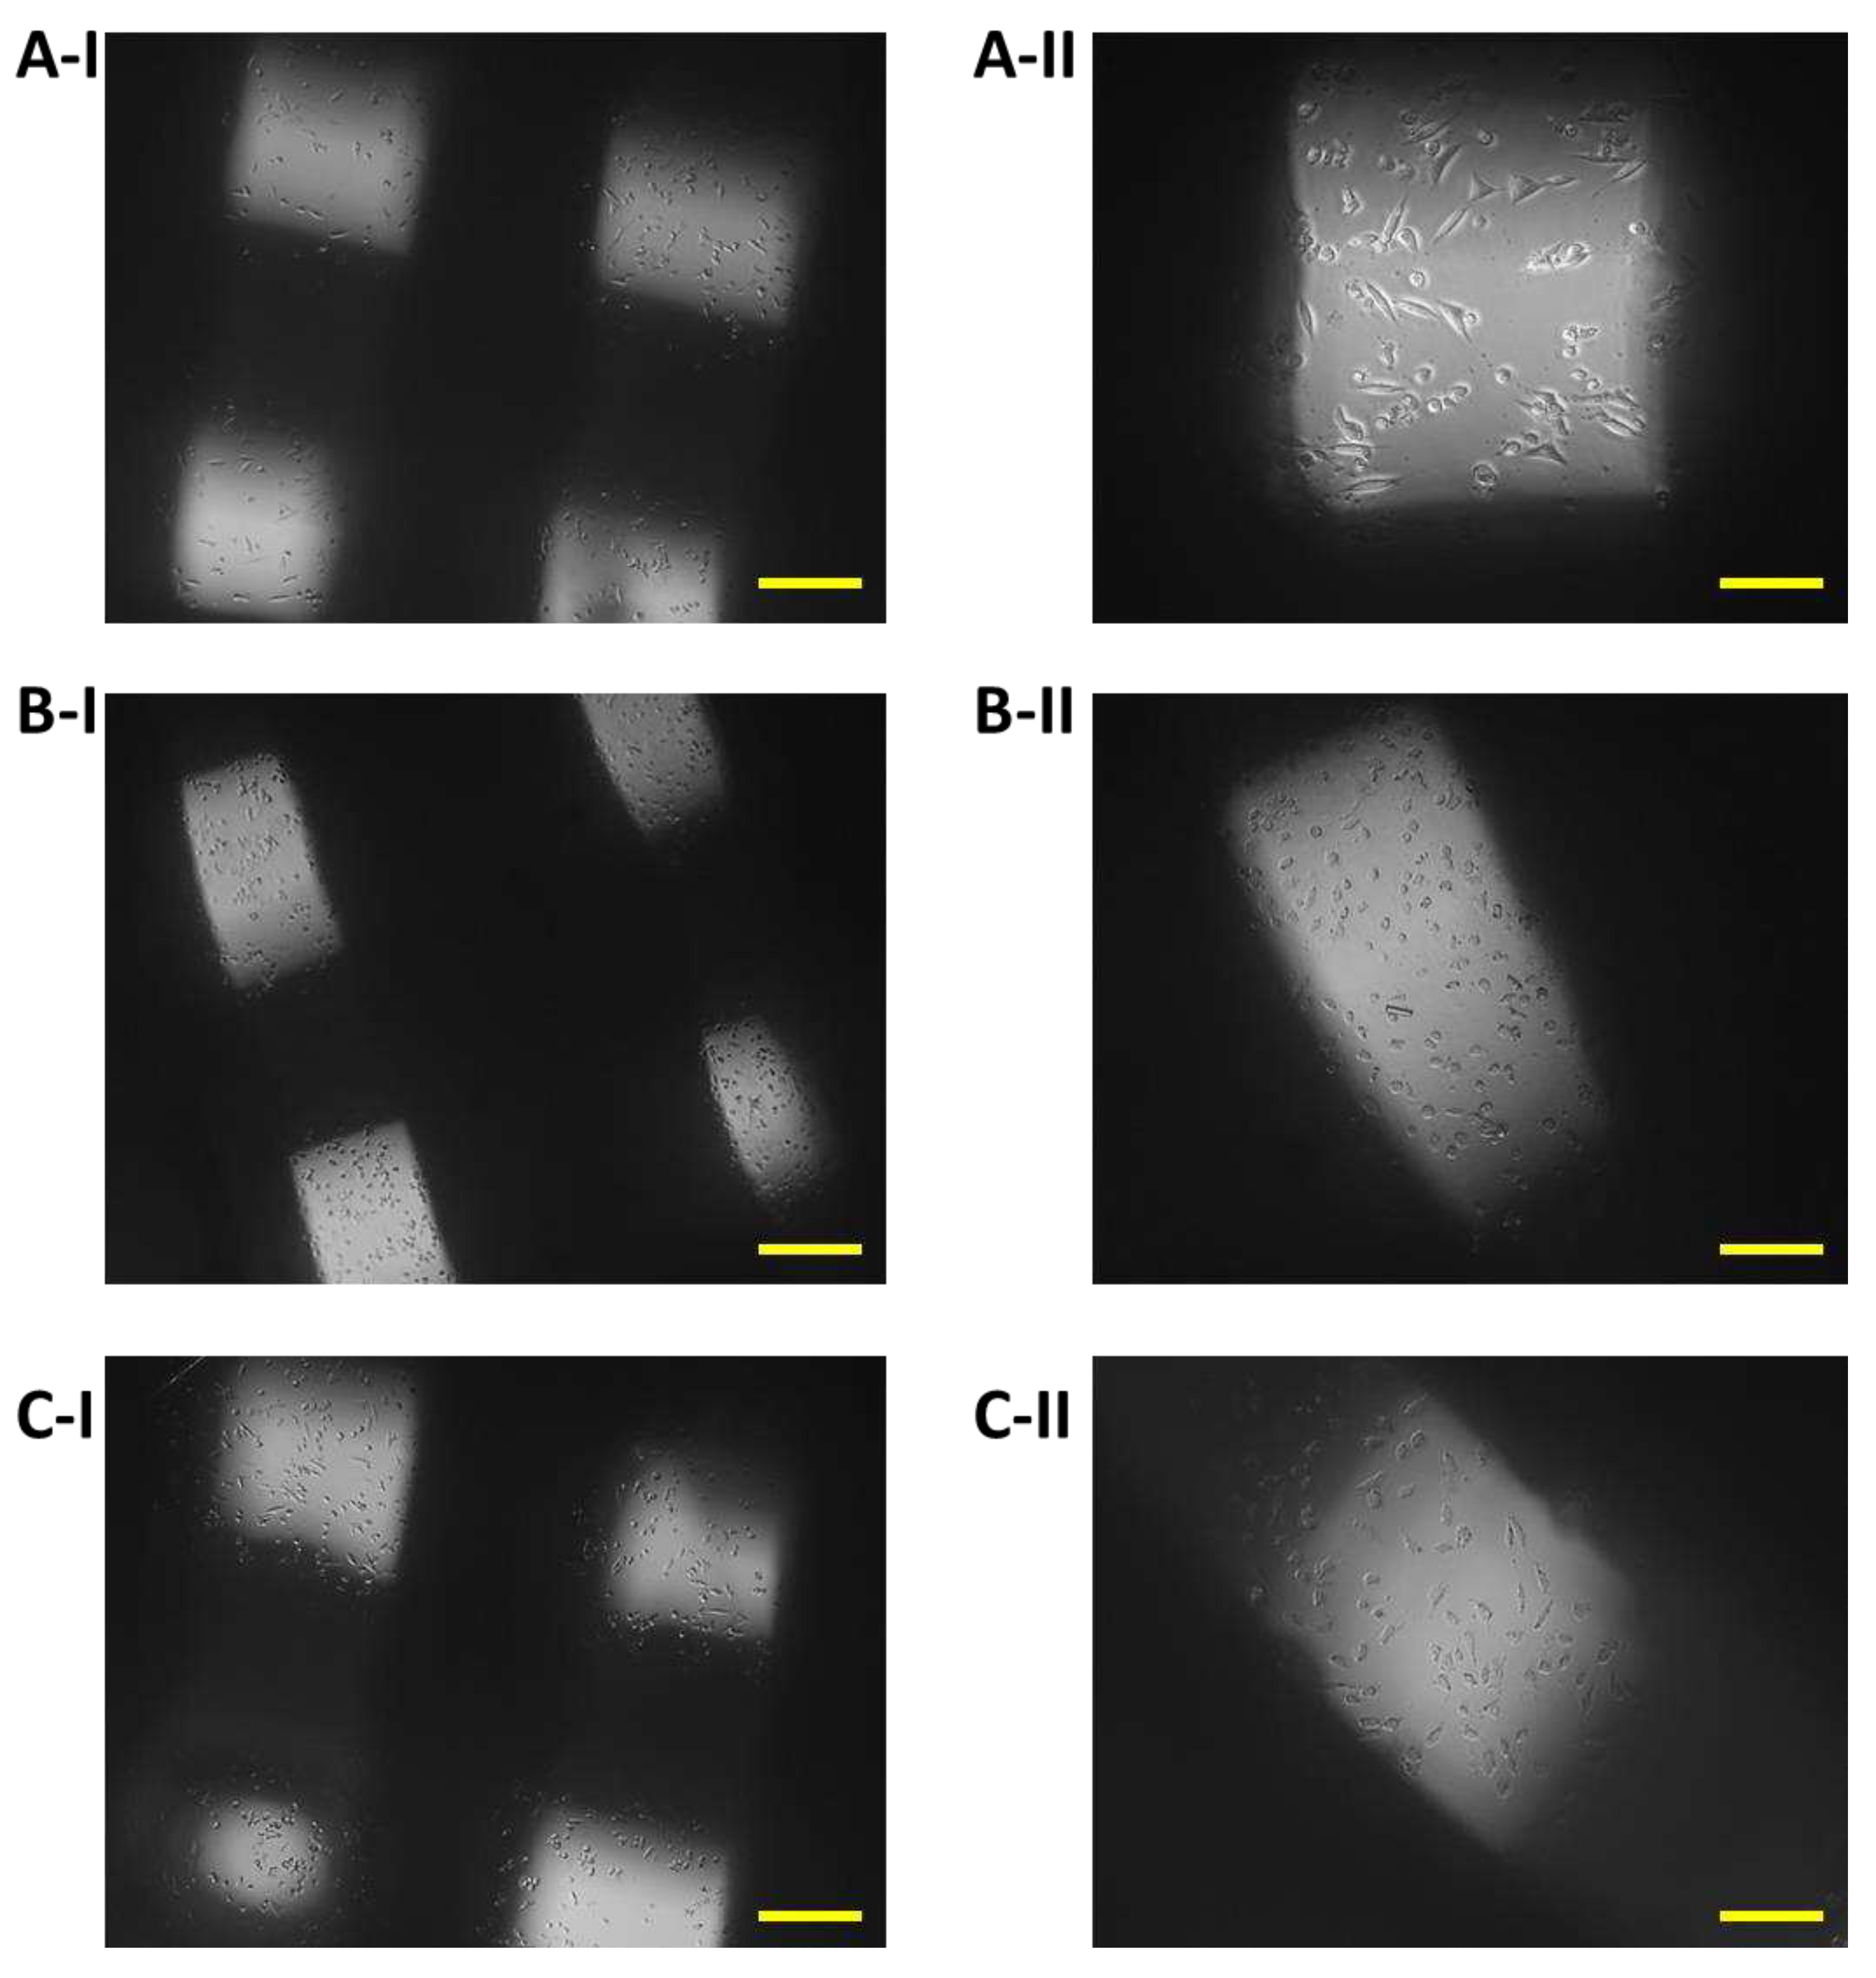
Figure 11.
Changes in biomaterials on the fourteenth day in the culture medium, A) sample I (PLA/PHB/TSB + 25% OLA); B) sample II (PLA/PHB/TSB + 30% ATBC); C) sample III (PLA/PHB/TSB + 30% OLA). Scale bar: I – 100 µm; II – 50 µm. Samples I and III showed no changes, sample II showed signs of degradation.
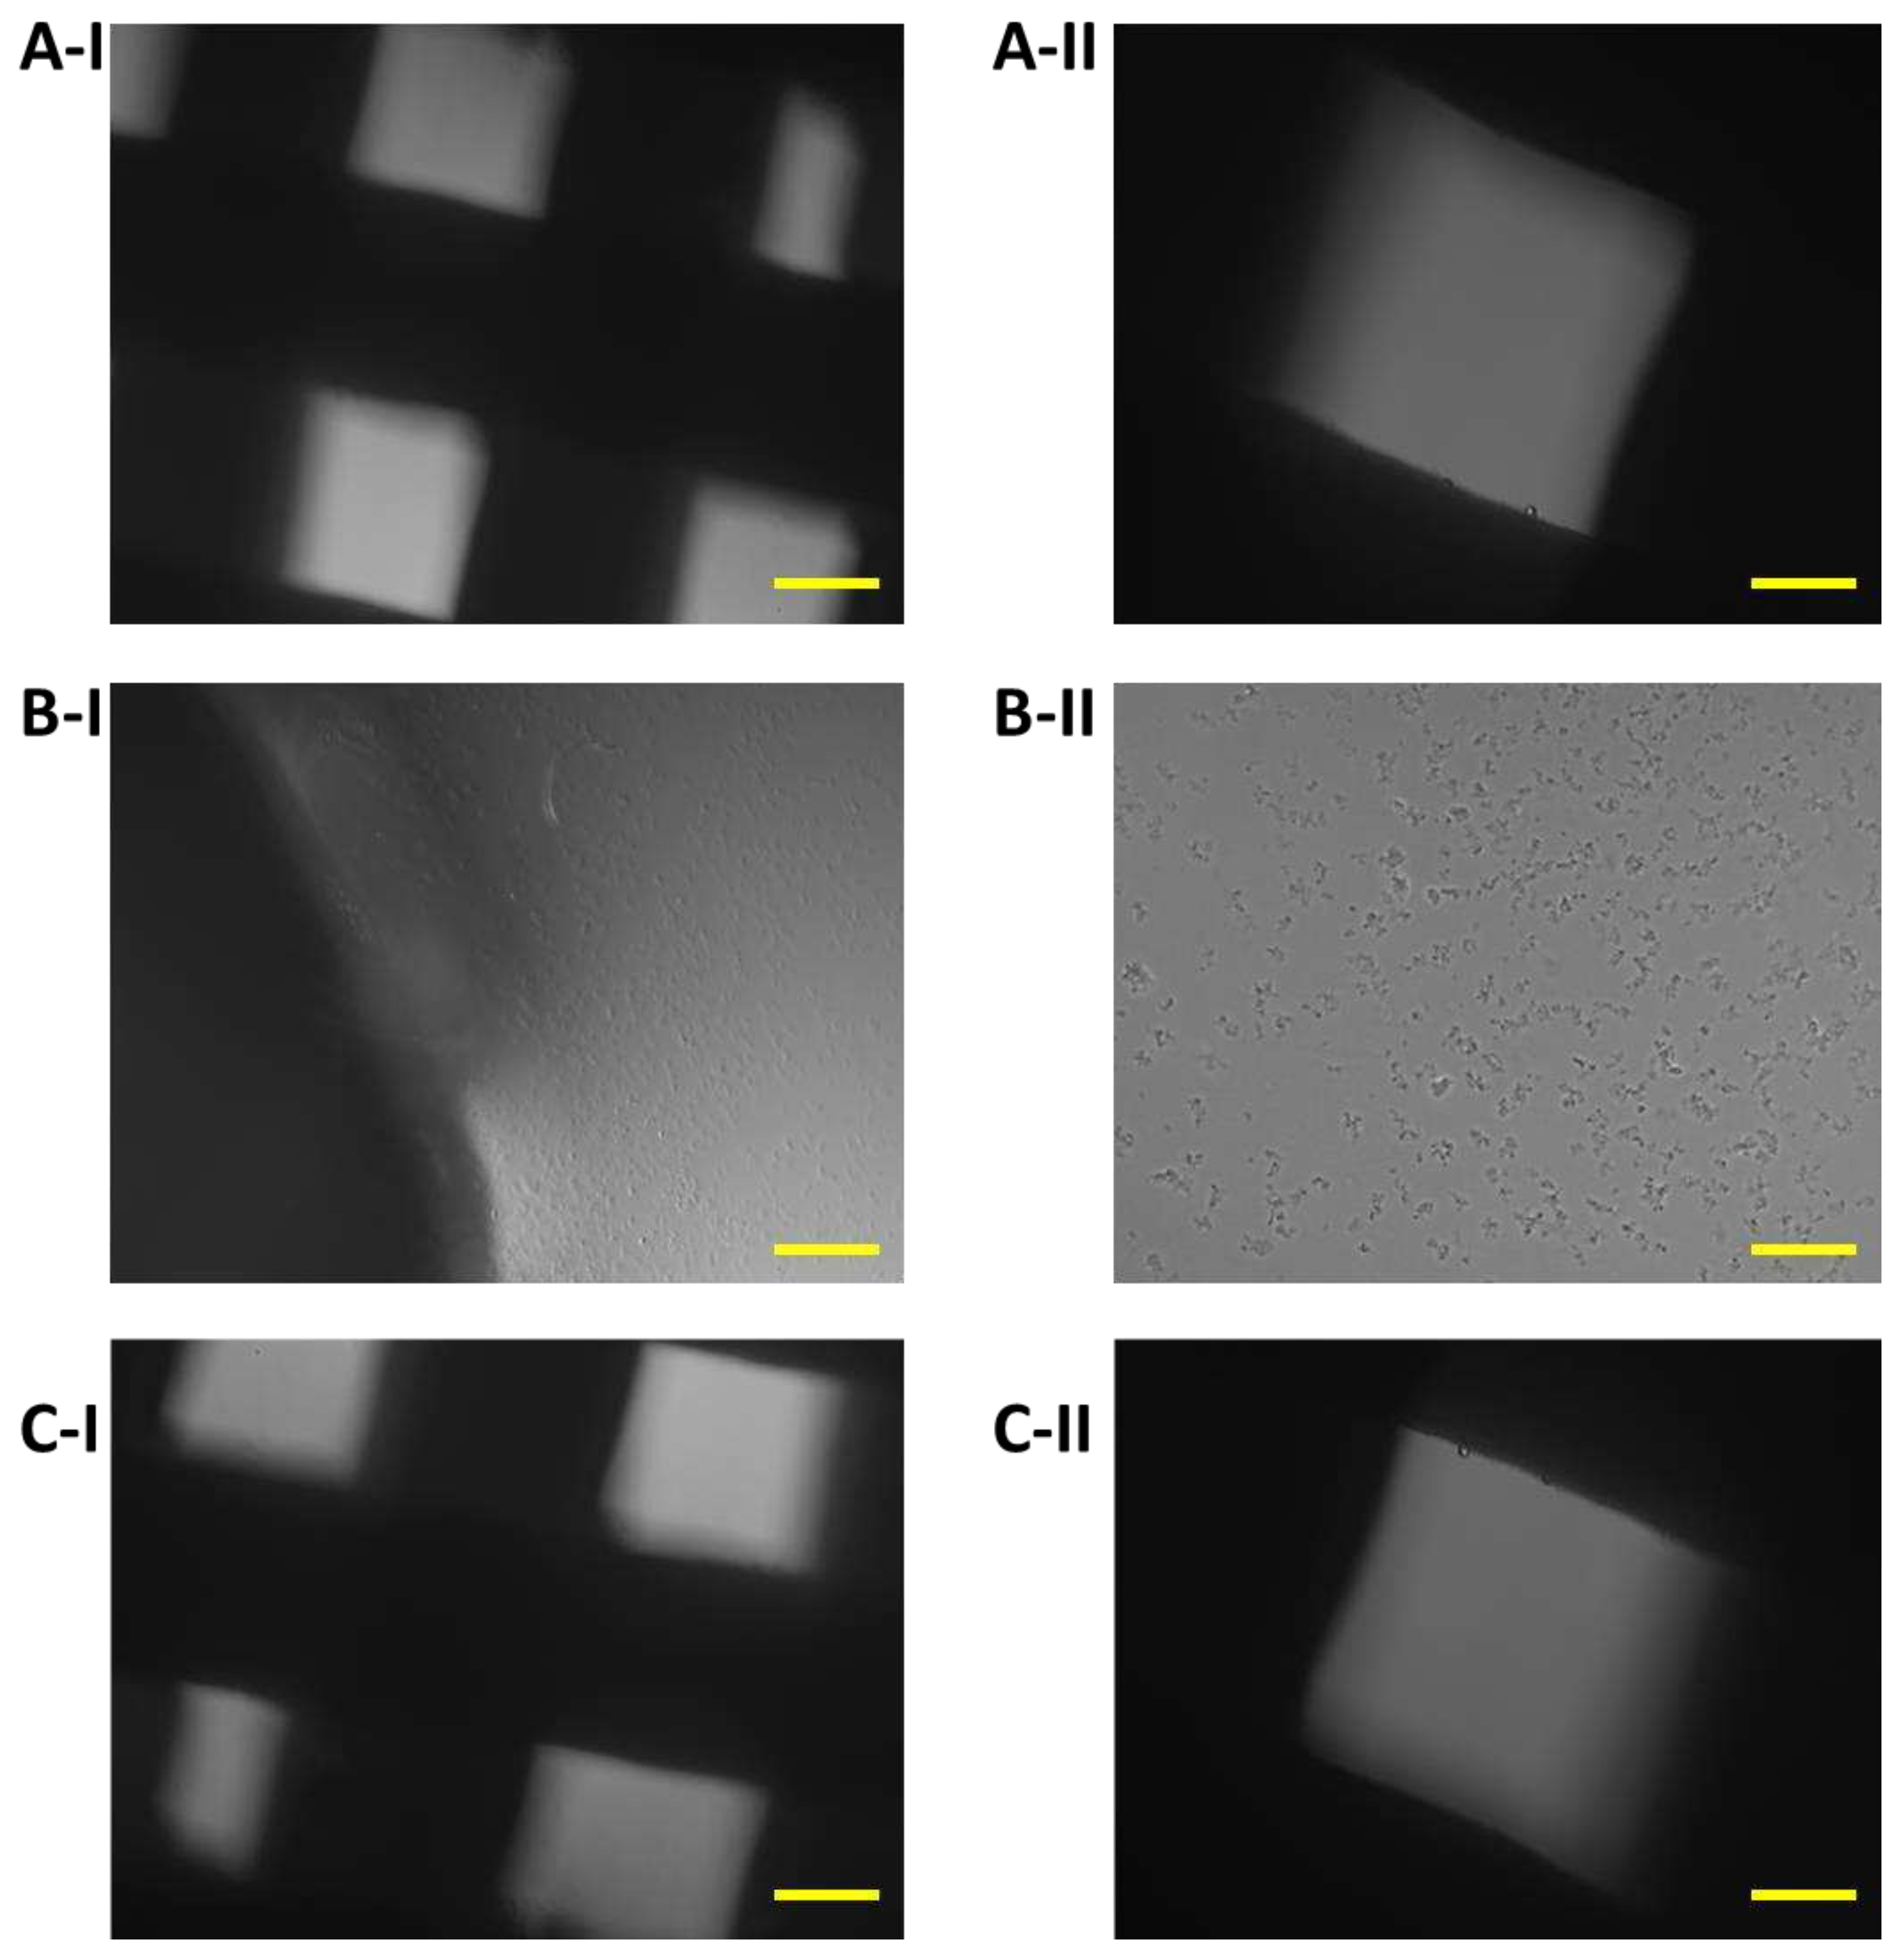
Figure 12.
7F2 osteoblasts on the 6th day of their growth. Osteoblasts growing in a 24-well culture plate without the presence of samples represented a positive control for the assessment of osteoblast growth on samples I, II and III. A) 50 µm magnification; B) 20 µm magnification.
Figure 12.
7F2 osteoblasts on the 6th day of their growth. Osteoblasts growing in a 24-well culture plate without the presence of samples represented a positive control for the assessment of osteoblast growth on samples I, II and III. A) 50 µm magnification; B) 20 µm magnification.
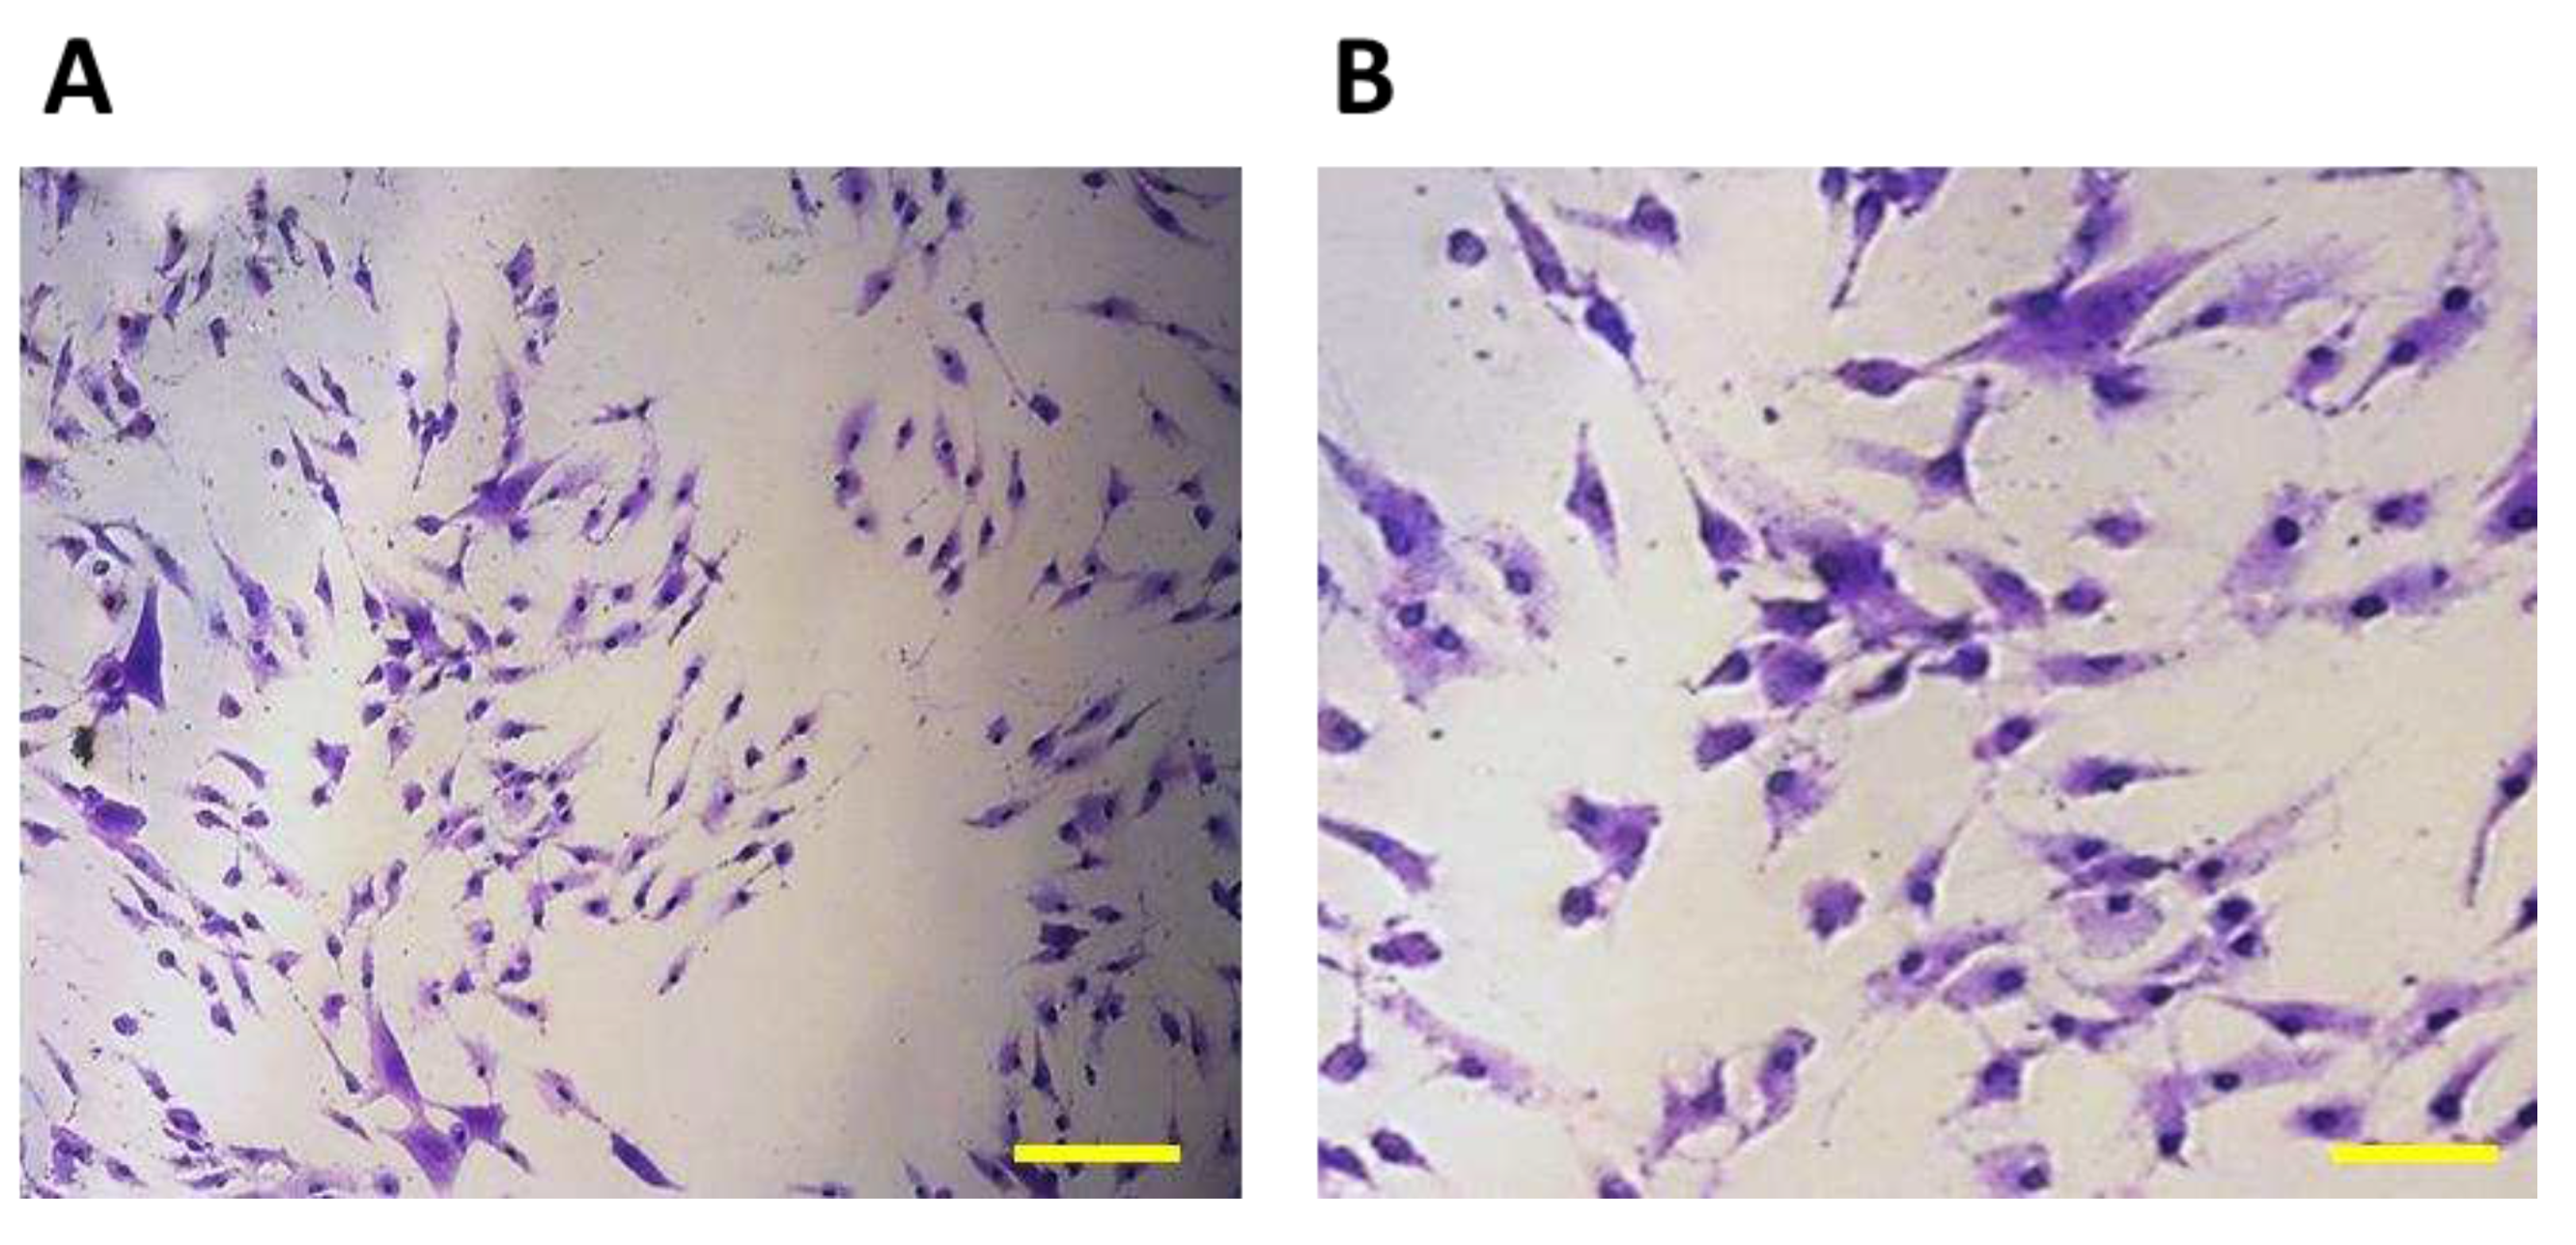
Figure 13.
Morphology of 7F2 osteoblasts on day 11 of their growth on samples I (PLA/PHB/TSB + 25% OLA), II (PLA/PHB/TSB + 30% ATBC) and III (PLA/PHB/TSB + 30% OLA). A) osteoblasts on sample I – irregular star-shaped cells with prominent cell protrusions; B) osteoblasts on sample II – a small number of oval and round cells; C) osteoblasts on sample III – irregular star-shaped cells and oval to round cells. Scale bar: I – 100 µm; II – 50 µm; III – 20 µm.
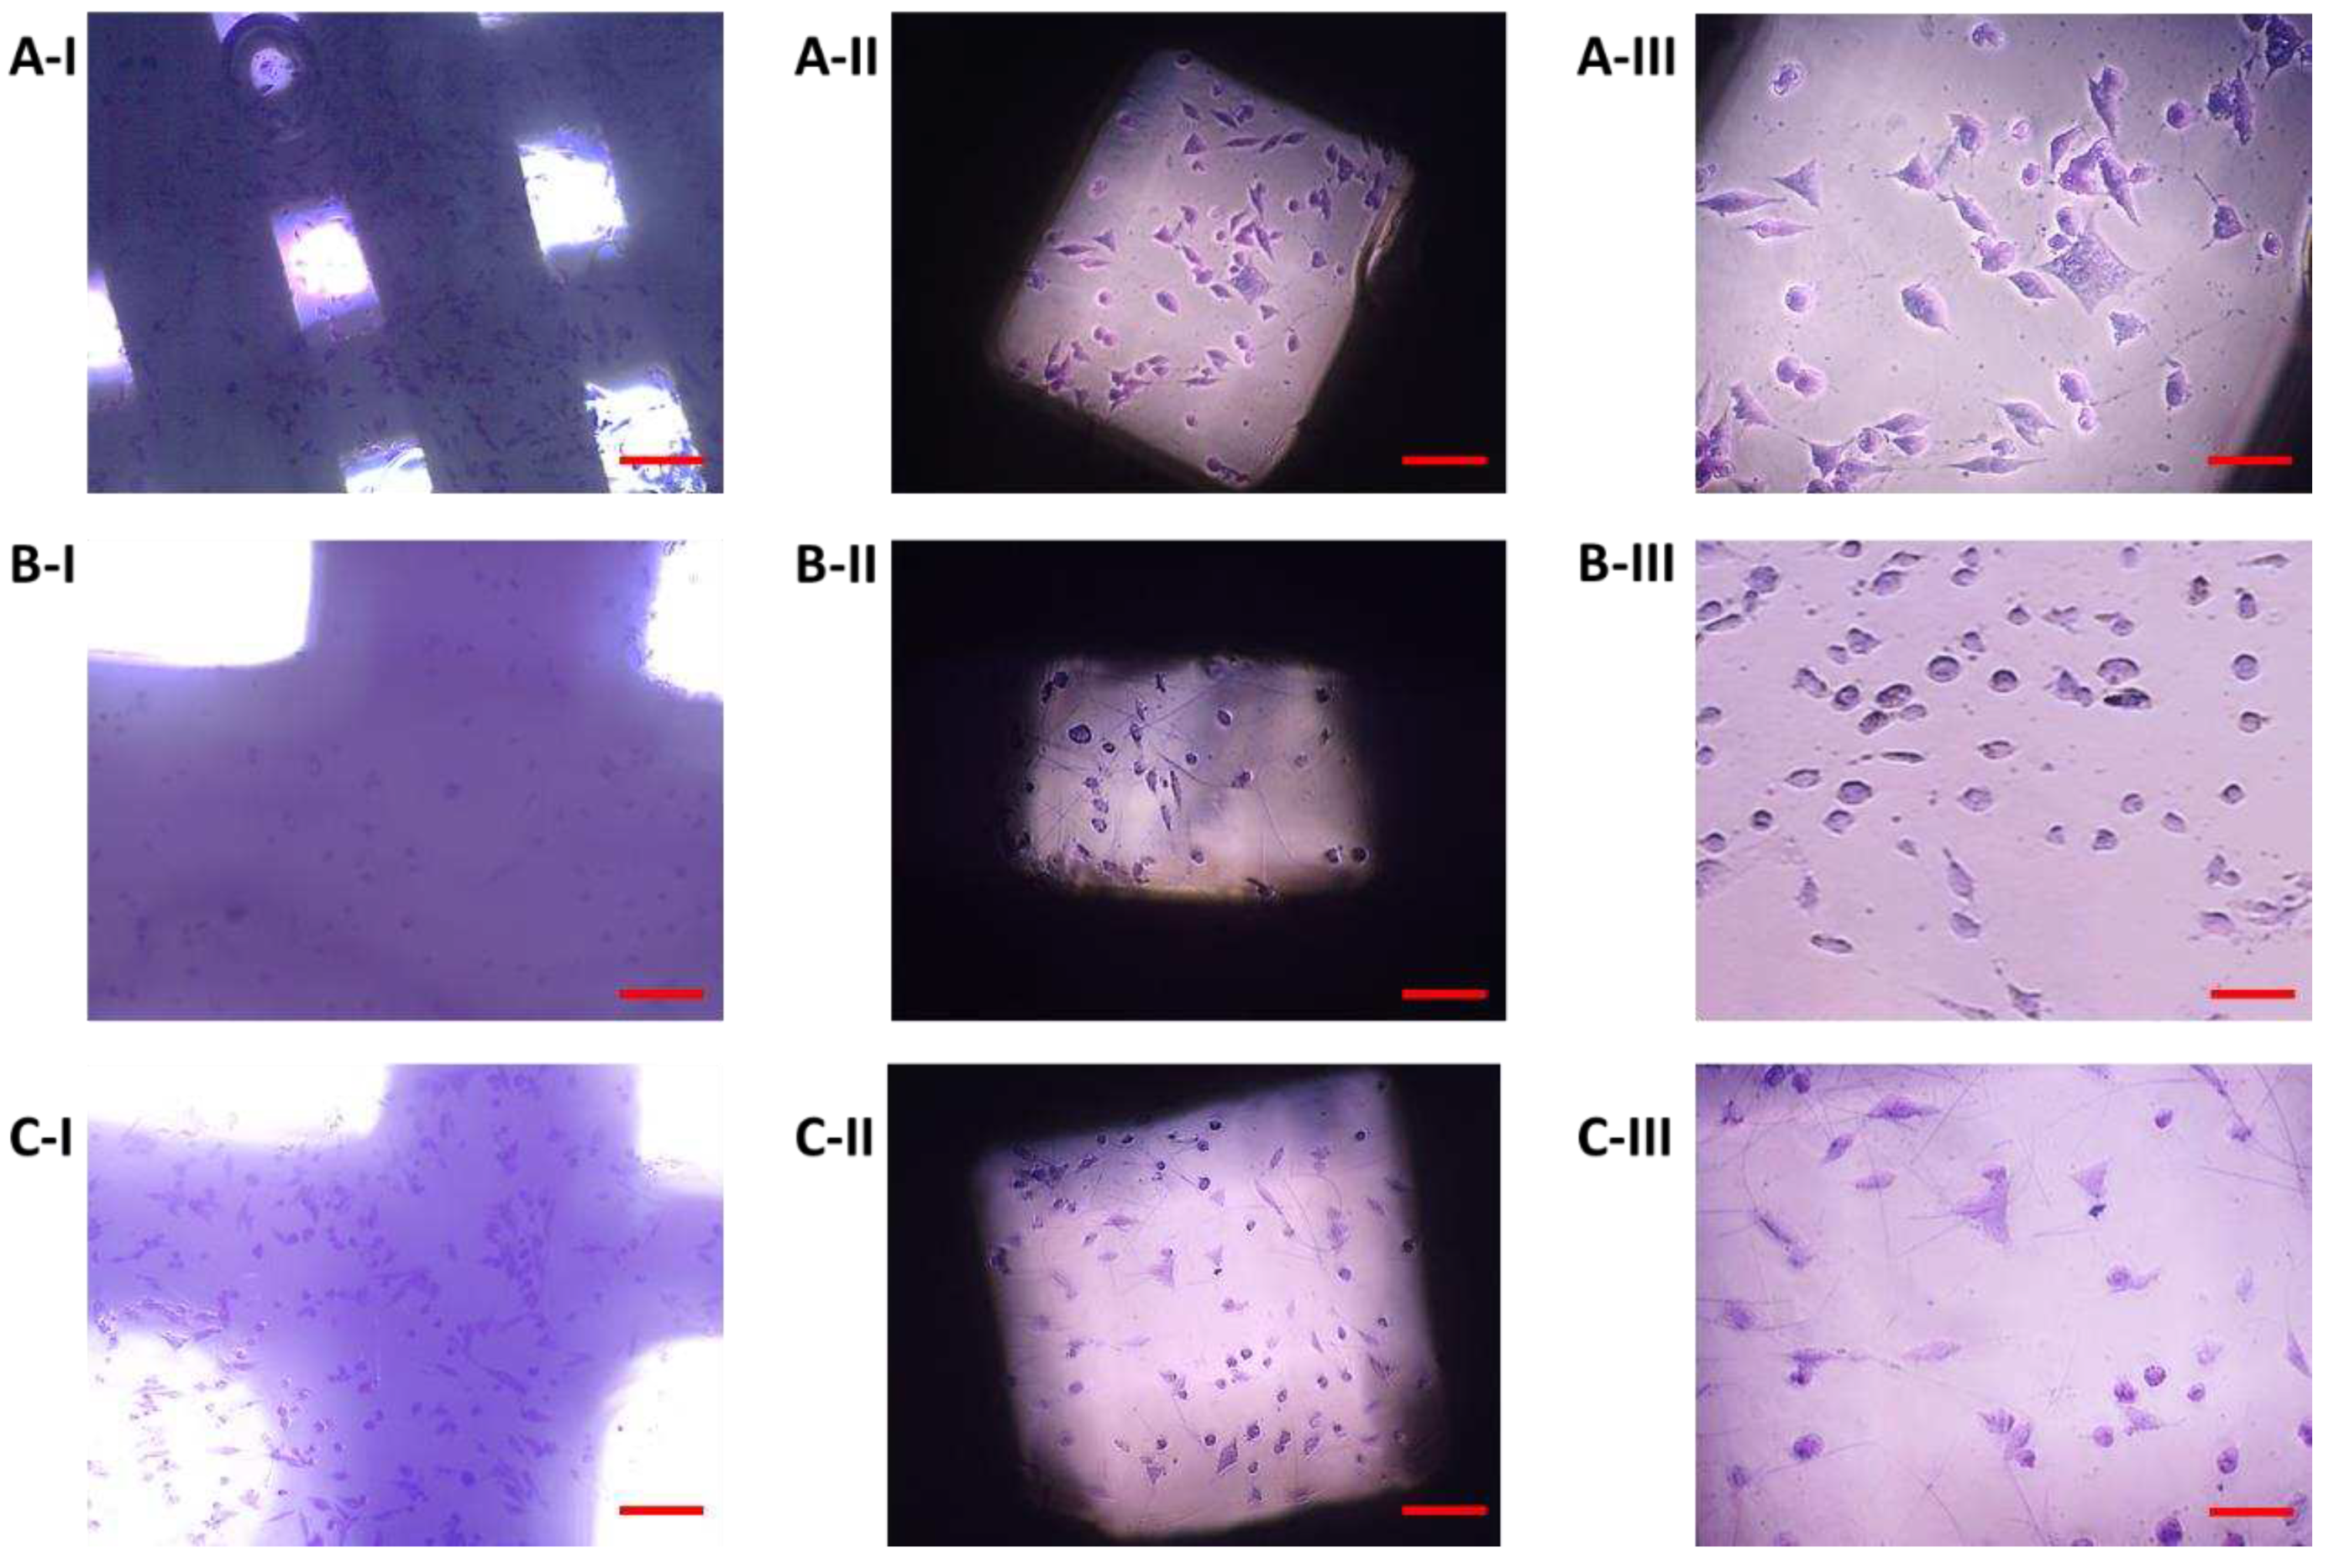
Figure 14.
Colonization of samples I (PLA/PHB/TSB + 25% OLA), II (PLA/PHB/TSB + 30% ATBC) and III (PLA/PHB/TSB + 30% OLA) by 7F2 osteoblast cells SEM, A) sample I – a large number of cells on the surface; B) sample II - low number of cells on the surface of slightly degraded material; C) sample III – low number of cells.
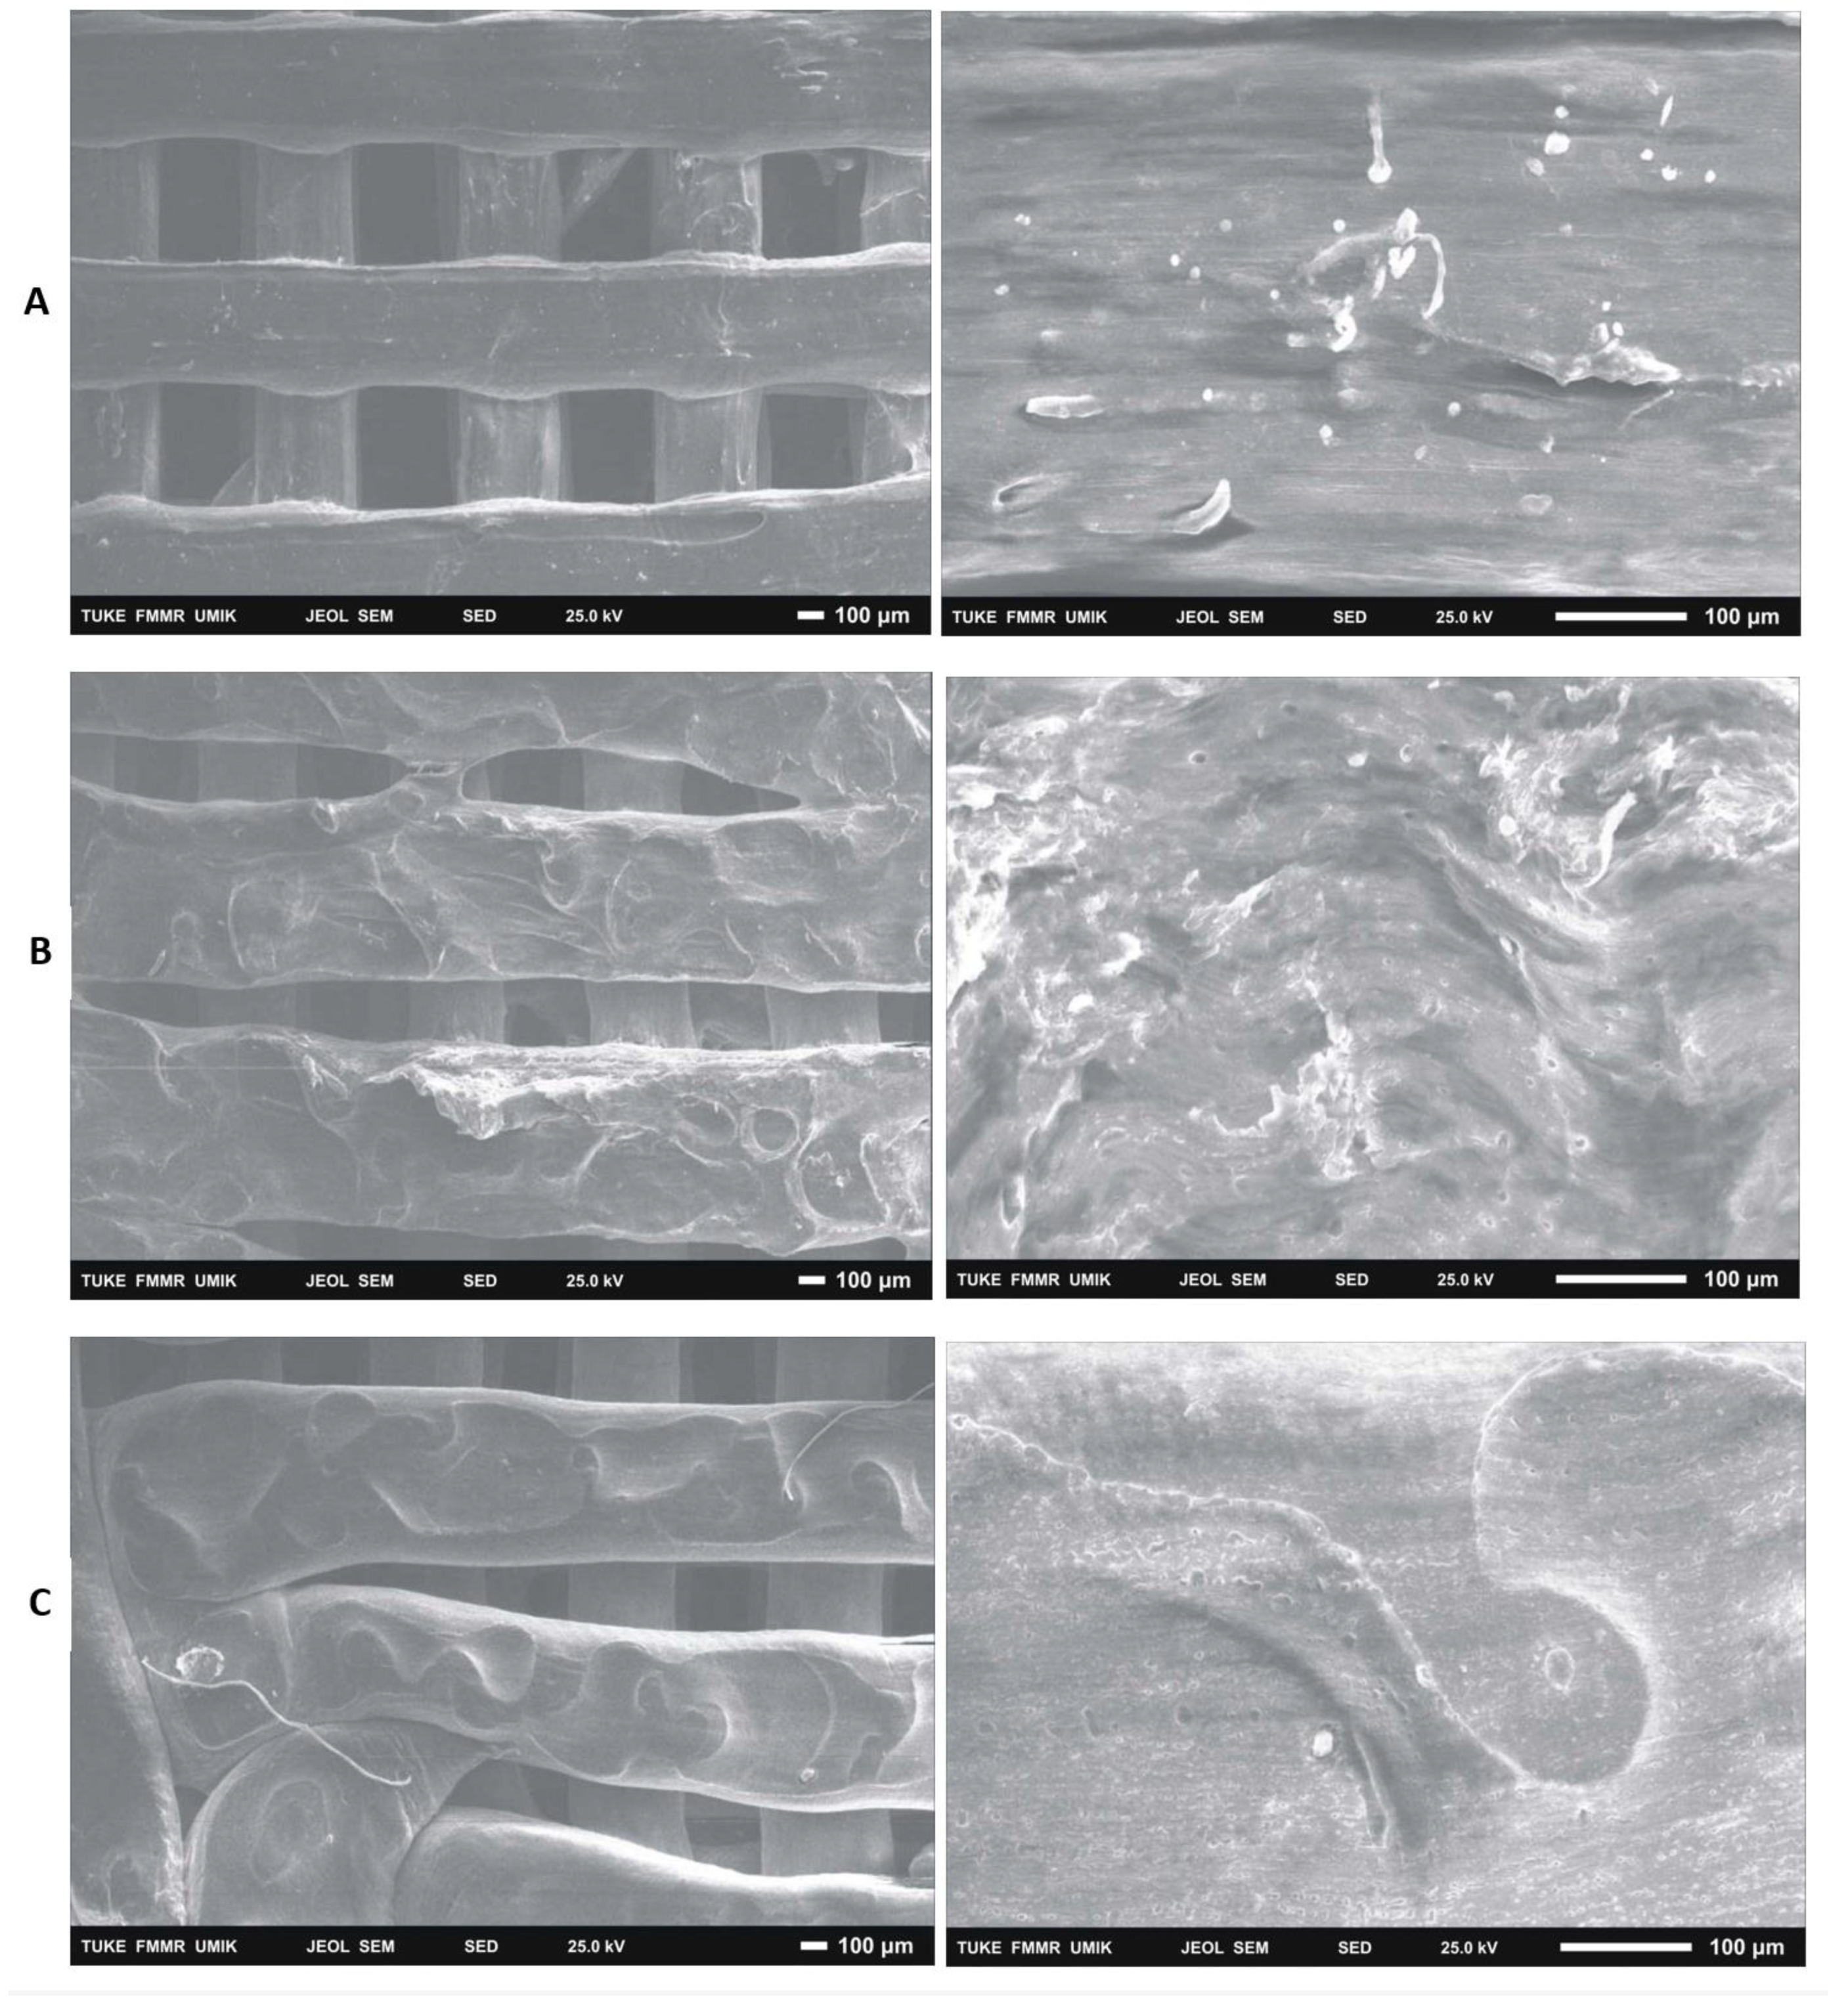

Table 1.
Contents of materials 111, 145 and 146.
| samples | PLA( wt .%) | PHB( wt .%) | TPS( wt .%) | Plasticizer( wt .%) |
|---|---|---|---|---|
| I | 75 | 25 | 20 | 25 OLA |
| II | 75 | 25 | 20 | 30 ATBC |
| III | 75 | 25 | 20 | 30 OLA |
Table 2.
Individual printing parameters for specific materials.
| Sample | Print speed (mm/s) | Platform temperature (°C) | Head Temperature (°C) | Nozzles diameter (mm) | Z-offset (mm) | Number of samples (pcs) |
|---|---|---|---|---|---|---|
| I | 20 | 70 | 183 | 0.4 | -3 | 20 |
| II | 188 | -2.8 | ||||
| III | 183 | -2.7 |
Disclaimer/Publisher’s Note: The statements, opinions and data contained in all publications are solely those of the individual author(s) and contributor(s) and not of MDPI and/or the editor(s). MDPI and/or the editor(s) disclaim responsibility for any injury to people or property resulting from any ideas, methods, instructions or products referred to in the content. |
© 2023 by the authors. Licensee MDPI, Basel, Switzerland. This article is an open access article distributed under the terms and conditions of the Creative Commons Attribution (CC BY) license (http://creativecommons.org/licenses/by/4.0/).
Copyright: This open access article is published under a Creative Commons CC BY 4.0 license, which permit the free download, distribution, and reuse, provided that the author and preprint are cited in any reuse.


