Preprint
Article

The Role of Water Quality on the Water-Agriculture-Health Nexus: An Assessment of Surface Water in Vaalharts, South Africa

Altmetrics

Downloads

211

Views

76

Comments

0

This version is not peer-reviewed

Submitted:

22 June 2023

Posted:

23 June 2023

You are already at the latest version

Alerts
Abstract
This paper evaluated the quality and suitability of surface water in the Vaalharts area, South Africa, for human consumption, drinking, and irrigation purposes. Water quality constituents include water pH, EC, TDS, HCO3-, Cl-, SO4, Mg, Ca, k, Na, NO3, F, Fe, PO4, As, Al, Mn, Cr, Cu, Zn, B, Cd, Hg, Pb, N, Sb, Se, and the biological parameter included E. coli along surface waters as well as canals and dams. Sodium Adsorption Ratio, Sodium Percentage, Permeability Index, Residual Sodium Carbonate, Kelley’s Ratio, Magnesium Hazard, and Potential salinity irrigation water parameters indicated that the majority of the water samples are suitable for irrigation. The water quality index values showed that the majority of the samples are unsuitable for drinking but suitable for irrigation and industrial uses. E. coli in the surface water samples in the study area show unsafe water quality with high and very high risk for human health. Based on the classifying criterion of the Heavy Metal Pollution Index and Heavy Metal Evaluation Index, all the water samples are above the critical limit, therefore, unsuitable for human consumption. The carcinogenic risk (CR) concentrations of As, Cr and Cd were above the target risk.
Keywords: 
Subject: Environmental and Earth Sciences  -   Other

1. Introduction

Globally, the demand for water is increasing, driven by a rising global population, rapid urbanization, rapid industrialization, agriculture, climate change, changing diets and economic growth. According to [1] this demand is expected to grow by more than 50% by 2050. The preservation of this resource has been a key concern around the world; it is a requirement for Sustainable Development Goals (SDG) such as SDG 2 (zero hunger), 3 (good health and well-being), 6 (clean water and sanitation), 11 (sustainable cities and communities), 13 (combating climate change and its impacts),14 (life below water) and 16 (Peace, justice and strong institutions). Most of these goals are interlinked by water [2,3]. The rate of freshwater deterioration caused by anthropogenic activities is increasing in tandem with the ever-increasing demand for water resources. River water quality is decreasing as a result of the addition of industrial effluents comprising organic contaminants and heavy metals. Metal contamination in aquatic ecosystems, both natural and manmade, needs to characterize its environmental impact [4,5]. In this context, Water quality is significant in the water-agricultural and human health sectors, where the use of poor-quality water in agriculture is the main pathway to food quality and security is impacted since irrigation with contaminated water affects crop yields and poses a risk to human health. Surveying water contaminated by heavy metals (HM) has been one of the most serious topics for environmental experts in recent years [6,7]. Heavy metal contamination of surface water can degrade the quality of drinking and irrigation water supplies [8]. Although some heavy metals play an important role in human beings such as Iron (haemoglobin in the blood, healing, immune function and synthesis of DNA), Fluoride (reduces the incidence of tooth decay) Copper (production of energy from carbohydrates and protein, formation of bone), Zinc (formation of enzymes, helps clot blood, maintains a sense of taste and smell), Chromium (functioning of the thyroid gland) and Manganese (helps grow bones and heals wounds by boosting collagen production) [9,10], their accumulation in water resources may cause hazards to human nutrition and health [11,12]. High intake of concentrations above the required amounts (Cr, Zn, F, As, Mn) of these heavy metals and other hazardous substances can create negative health effects such as cancer, lung diseases, renal diseases, hypertension, gastrointestinal bleeding, neurological disorder, dental enamel degradation, skeletal fluorosis, respiratory tract diseases, sensitive and fragile skin, reproductive effects [11,13,14,15,16,17]. Thus, several researchers in South Africa and all throughout the world focused on the potential human health risks assessments created from trace elements in contaminated waters [18,19,20,21,22,23,24]. Despite the contamination of water with heavy metals, bacterial proliferation can be observed as well in drinking water. This phenomenon has been described for faecal indicators such as coliform bacteria, especially Escherichia coli, and poses the problem of respecting sanitary regulations regarding water quality [25,26]. Escherichia coli (E. coli) is a pathogen that causes illnesses in people. This is most often caused by the spread of gut flora when the patient has another deficiency or condition. Some E. coli strains, however, can cause diarrhoea. All of these infections are the result of direct or indirect faecal-oral transmission from other humans or animals [27]. Water contamination is a serious problem today in South Africa. The water resources in the Vaalharts irrigation scheme are relatively more contaminated than other areas in South Africa due to the higher population and, therefore, intense agriculture and industrial activities in this region [28,29].The quality of water in the Vaalharts area is determined by several parameters such as lithostratigraphy formation, recharging water, mineralogy, and the impact of anthropogenic activities [30,31,32]. Moreover, the chemical composition of surface and groundwater is influenced by various hydrogeochemical processes such as precipitation, dissolution, desorption, sorption and residence time during water-rock interaction [33]. This can be prejudicial to the Vaalharts area where water resources are limited due to a semi-arid region. Surface water researchers have used several methods to assess water quality depending on the various uses of water (drinking, irrigation etc). Some of these methods using different mathematical approaches include water quality indices, such as Sodium adsorption ratio (SAR), Residual sodium carbonate (RSC), Magnesium Hazard (MH), Kelley’s ratio (KR), Sodium percentage (Na%), and Potential salinity (PS), Permeability Index (PI) [34,35,36,37,38,39,40,41] to investigate the suitability for irrigation purposes. Furthermore, several numerical models have been used to analyze water quality for drinking purposes. The water quality index (WQI) is a numerical model to evaluate water quality using several water quality parameters (Physico-chemical parameters, major ions and heavy metals) [12,42]. Similarly, Heavy Metal Pollution Index (HMPI) and the Heavy Metal Evaluation Index (HMEI) measure and delimit the suitability of drinking water based on trace element concentrations [43,44,45]. The Risk Assessment is defined as the process of estimating the nature and probability of adverse health effects in individuals of various ages (infants, children, and adults) who may be exposed to chemicals in polluted environmental media over a specified time period [46,47,48,49,50,51]. Researchers have performed health risk evaluations through three steps, namely: Average Daily Dose (ADD), Hazard Quotient (HQ), Hazard Index (HI) and Cancer Risk (CR). These steps assist in the determination of the impact of contaminant toxicity on humans. The purpose of this article is to demonstrate the importance of water quality for drinking and irrigation purposes and its impact on health (i) to evaluate surface water suitability for irrigation usages, (ii) to assess drinking water quality using different approaches to water quality indices and indexes, and (iii) to estimate the carcinogenic and non-carcinogenic human health risks from ingesting and cutaneous absorption of different heavy metals found in surface water.

2. Materials and Methods

2.1. Site Description

The Vaalharts irrigation scheme is situated in both the Northern Cape and North West provinces of South Africa, close to small towns Hartswater and Jan Kempsdorp and includes the communities of Jan Kempdorp, Hartswater, Vryburg, Spitskop, Springboknek, Pampierstad Taung, Pudimoe, Magagong, Ganspan and the edge of Delportshoop. The altitude range between 1070 and 1160 meters above sea level. The Vaalharts region is recognized for its semi-arid climate, with 400 for yearly rainfall [52], cold winters, and long warm summers [53]. The summer months (November to April) see the most rain, with a mean monthly rainfall of 48 mm and mean lowest and maximum temperatures of 4.4°C and 38.8°C, respectively. The average yearly evaporation is above 2 300mm. The Vaalharts Irrigation Scheme is one of the oldest and an important irrigation scheme in South Africa, which covers an area of 37100 hectares. Therefore, the research area is compounded by four zones (Vaalharts 29,181 hectares; Spitskop 1,663 hectares; Barkly West 2,555 hectares; and Taung 6,424 hectares, of which only 3,700 hectares have so far been developed) [54]. The Vaalharts area is located at the junction of the Vaal and Hart Rivers and is traversed by numerous canals. Water is diverted from the Vaal River near Warrenton to the Vaalharts Canal, where it is distributed to irrigated farms until it reaches the Dry Harts River (Figure 1). Another canal, Barkly West, irrigates territory near the Vaal River [55]. The Vaalharts area also includes the Vaalharts Canal System from the weir to the Vryburg Waterworks, the Barkly West Canal, and a portion of the Harts River from the Taung Dam to the confluence with the Vaal River (Figure 1) [55]. Irrigation water for the scheme is deflected from the Vaalharts weir between Warrenton and Christiana. The weir receives water from the Bloemhof Dam, which is augmented by the Vaal Dam. The principal dams of this area are Taung Dam, Vaalharts Dam, Bloemhof Dam and Spitskop Dam. The upstream Vaal River is impacted by many activities such as mining, industry and various other urban effluents [56]. These negative influences could potentially assign the quality of the surface water downstream into the Vaalharts Valley area. The principal crops grown in the Vaalharts Valley area are maize, wheat, cotton, barley, lucerne, groundnuts, olives, pecan nut, watermelon, citrus and some vegetables (tomatoes and onions) through irrigation farming. The Vaalharts irrigation scheme is characterized by deep sandy soils prone to salinisation and water-logging due to insufficient natural drainage. These waterlogging and salinity problems warrant serious attention if their agricultural potential is to be sustained [57,58]. The study area is known for two main types of soils, namely Clovelly/Sunbury and Hutton. According to [59], the soil type in this area is composed of 68% fine sand, 22% medium and coarse sand, 8% clay, and 2% silt. The classification of lithostratigraphy in the study area is covered by two main Supergroups: The Ventersdorp and Griqualand West Supergroups, which form the bedrock of the Harts River Valley. The Ventersdorp supergroups contain the Taung and Hartswater Group, which consists of a granite-pebble conglomerate, calcrete tuffaceous sediments, andesitic lava arkose and chert, and volcanic and sedimentary material alternates. The Griqualand West Supergroup is divided into three formations, namely Vryburg Siltstone, Schmidtsdrift and Ghaap Plateau Dolomite, which consist of shale, quartzite, dolomite limestone and chert. The lithology between the Ventersdorp and the Griqualand is yet to be verified due to the enormous overburden of Dwyka (tillites and shales) and Quaternary deposits [60,61,62].
According to [63] the hydrogeology of the Vaalharts region is characterized by a non-stratified and unconfined aquifer with a very shallow water table (about 1.5mdgl). Pump testing in the study area revealed [60] the following hydraulic parameters: hydraulic conductivity (K) of 13.43 m/d, aspecific storage (S) of the order of 10-1, and transmissivity (T) of 70 m2/s. The variation in aquifer thickness as determined by the aquiclude was found to be directly responsible for waterlogging in certain areas.

2.2. Water Point and Analysis

The data of surfacewater samples were collected with the collaboration of Vaalharts Water Use Association, Sedibeng Water North West Region and Clean Stream Environmental Services in Stellenbosch. Water samples were collected during the wet periods (December 2021). A total of 11 sampling points were identified from surface waters (Vaal and Hart Rivers), canals and dams (Taung Dam, Vaalhart Dam, Bloemhof Dam, Spitskop Dam). The water points were geographically selected considering the industrial activities, pollution sites and recharging and discharging area (Figure 1). In the laboratory, the water samples were analyzed for various parameters such as pH, alkalinity, electrical conductivity (EC), total dissolved solids (TDS), bicarbonates (HCO3-), sulphate (SO4), magnesium (Mg), calcium (Ca), potassium (k), chloride (Cl), sodium (Na), nitrate (NO3), fluoride (F), iron (Fe), phosphate (PO4), arsenic (As), aluminium (Al), manganese (Mn), chromium (Cr), Copper (Cu), zinc (Zn), boron (B), cadmium (Cd), mercury (Hg), lead (Pb), nickel (N), antimony (Sb) selenium (Se) and the biological parameter was included E.coli. The selection of hydrochemical compositions to be measured must take into account the South African National Standards (SANS) and the World Health Organization (WHO).

2.3. Evaluation of Water Quality for Irrigation Purposes

The suitability of water for irrigation is determined by the influence of water’s mineral contents on both soil and plants. It can be calculated by using salinity properties and some indices like Salinity Hazard (SH), sodium adsorption ratio (SAR), sodium percentage (Na%), magnesium ratio (MR), permeability index (PI), Kelley’s Ratio (KR), potential salinity (PS) and residual sodium carbonate (RSC)[34,35,36,37,38,39,40,41]. These parameters are calculated using Eqs. 1–7 and the classification shows in Table 1
-
S A R = N a + ( C a 2 + + M g 2 + ) / 2
-
Na% = (Na++K+)/(Ca2++Mg2++Na++K+) *100
-
RSC= (HCO3-+CO32-)-(Ca2++Mg2+)
-
P I = N a + + H C O 3 ( C a 2 + + M g 2 + + N a + ) * 100
-
MR= Mg2+/(Ca2++Mg2+)*100
-
KR=Na+/(Ca2++Mg2+)
-
PS= Cl- + 0.5*SO42-
All concentrations are given in meq/L.

2.4. Evaluation of Surface Water Quality for Drinking Purposes

2.4.1. Water Quality Index (WQI)

The (WQI) is regarded as a good approach for obtaining a comprehensive picture of river water quality for drinking purposes and human health [12,42,64]. In the Vaalharts area, 23 parameters (Physico-chemical parameters, major ions and heavy metal) were used to estimate the WQI.
The WQI is calculated as follows
WQI = Σ [Wi × (Ci/Si)] × 100
Wi= wi/ Σwi
Where, Wi is denoted weight, wi is the weight of each parameter, Σwi is the sum of the wi. Ci is the trace element of the water sample, and Si represents the drinking water standard specified by SANS/WHO. According to [23,65,66] five classifications are presented in Table 2.

2.4.2. Escherichia coli (E. coli) in Drinking Water Sample

The E.Coli is one of the most significant biological bacteria that can cause various infections in human health (such as diarrhoea, harmless, food poisoning, and flora of the gut) and animals. The transmission of E. coli is generally waterborne or foodborne. Therefore, E. coli is widely used as an indicator of water and food samples that can contain inadmissible levels of faecal contamination. According to the [67] decimal categories of potential health risk, are less than 1E. coli/100 mL indicates safe or very low risk, between 1–10E. coli/100 mL is considered a medium risk and relatively safe, more than 10 to 100 E. coli/100 mL is considered high risk and unsafe, and more than 100E. coli/100 mL indicates very high risk and unsafe. This microbial water quality data allows for action to be taken to improve the quality of unsafe water and thereby reduce the risk of enteric infectious disease from waterborne exposure sources. As a result, E. coli has been reinserted into the regulations for drinking water. Depending on environmental conditions (temperature, microorganisms, etc.), E. coli can survive in potable water for 4 to 12 weeks. Parasites are significantly less sensitive to oxidants than bacteria and viruses.

2.4.3. Heavy Metal Pollution Index (HMPI)

Water quality was also evaluated in relation to the appearance of heavy metals analysed in river water samples. The following expression was used to determine the (HMPI): [43]
HMPI= i = 1 n Q i × W i Σ W i
Q= (Ci/Si)/100
Wi= k/Si
Where n: is the number of trace element parameters considered; Qi is the sub-index of the ith trace element parameter; Ci is the trace element of the water sample; Si represents South African National Standards [68] and World Health Organization [67]. The classification of the level of contamination is illustrated in Table S1 [69].

2.4.4. Heavy Metal Evaluation Index (HMEI)

The HMEI was derived using the equation below.
HMEI = n Σi =1 HM conc. ∕ HMMPC
Where HM Conc. = the monitored concentration of a particular heavy metal and HM MPC = the maximum permissible concentration of the same heavy metal. The classification of surface water quality based on HMEI indicates in Table S1 [70].

3. Assessment of Human Health Risk

Dermal and oral absorption are the most important modes of exposure to heavy metals in the aquatic environment [71,72]. Ingestion and dermal absorption of water are generally expressed by the processes of daily water consumption and showering. The assessment of human health risks consists of three steps: (1) Average Daily Dose (ADD); (2) Hazard Quotient (HQ) and Hazard Index (HI); and (3) Cancer Risk (CR) were estimated using the formula from the US Environmental Protection Agency [73,74,75].

3.1. Average Daily Dose (ADD)

There are three ways that a person might be exposed to the risk of tracing metals in water: through ingestion, through inhalation, and through skin contact (e.g. shower) [76,77]. Formulas 1 and 2 were used to compute the dosages absorbed through the ingestion and dermal absorption pathways [74,75].
ADD ingestion =Cw × IR × EF × ED/ BW × AT
ADD dermal =Cw × SA × Kp × ET × EF × ED × / BW × AT
Description values and units of factors used in Equationa (1)–(2) (Table S2) [22,74].

3.2. Hazard Quotient (HQ)

Based on the ADD, risk characterization is quantified by the carcinogenic and non-carcinogenic health risks to humans [78]. For the non-carcinogenic risks (adult and children) of heavy metals, the (HQ) was determined by comparing exposure of contaminants from each exposure (ingestion, dermal contact) way with the corresponding reference dose (RfD) using the three Equations (3), (4) and (5). The sum of each heavy metal’s non-carcinogenic risk was expressed as a hazard index (HI) using the Formula (6) [67,75,79,80].
QHingestion = ADDingestion /RfDingestion
QHdermal = ADDdermal /RfDdermal
RfDdermal = RfDingestion *ABSg
HI= QHingestion + QHdermal
Where: ABSg (Gastrointestinal absorption factor) and Kp (dermal permeability coefficient in the water) the classification of the value of HQ or HI is indicated in Tables S3 and S4 [74,81,82].

3.3. Cancer Risk (CR)

According to [83] CR is introduced as the incremental probability that an individual is developing any sort of cancer over a lifetime. So, the CR is estimated by calculating the different ADD of heavy metal multiplied by Slope Factor (SF) using Equation (7) and the total CR is the sum of CR of all exposure pathways Equation (8) [73,80]:
CR=ADD x SF
CRtotal=Σ (ADD x SFing) + (ADD x SFder)
Table S5 shows the SF values for computing the CR of the trace elements in this area.

4. Results and Discussion:

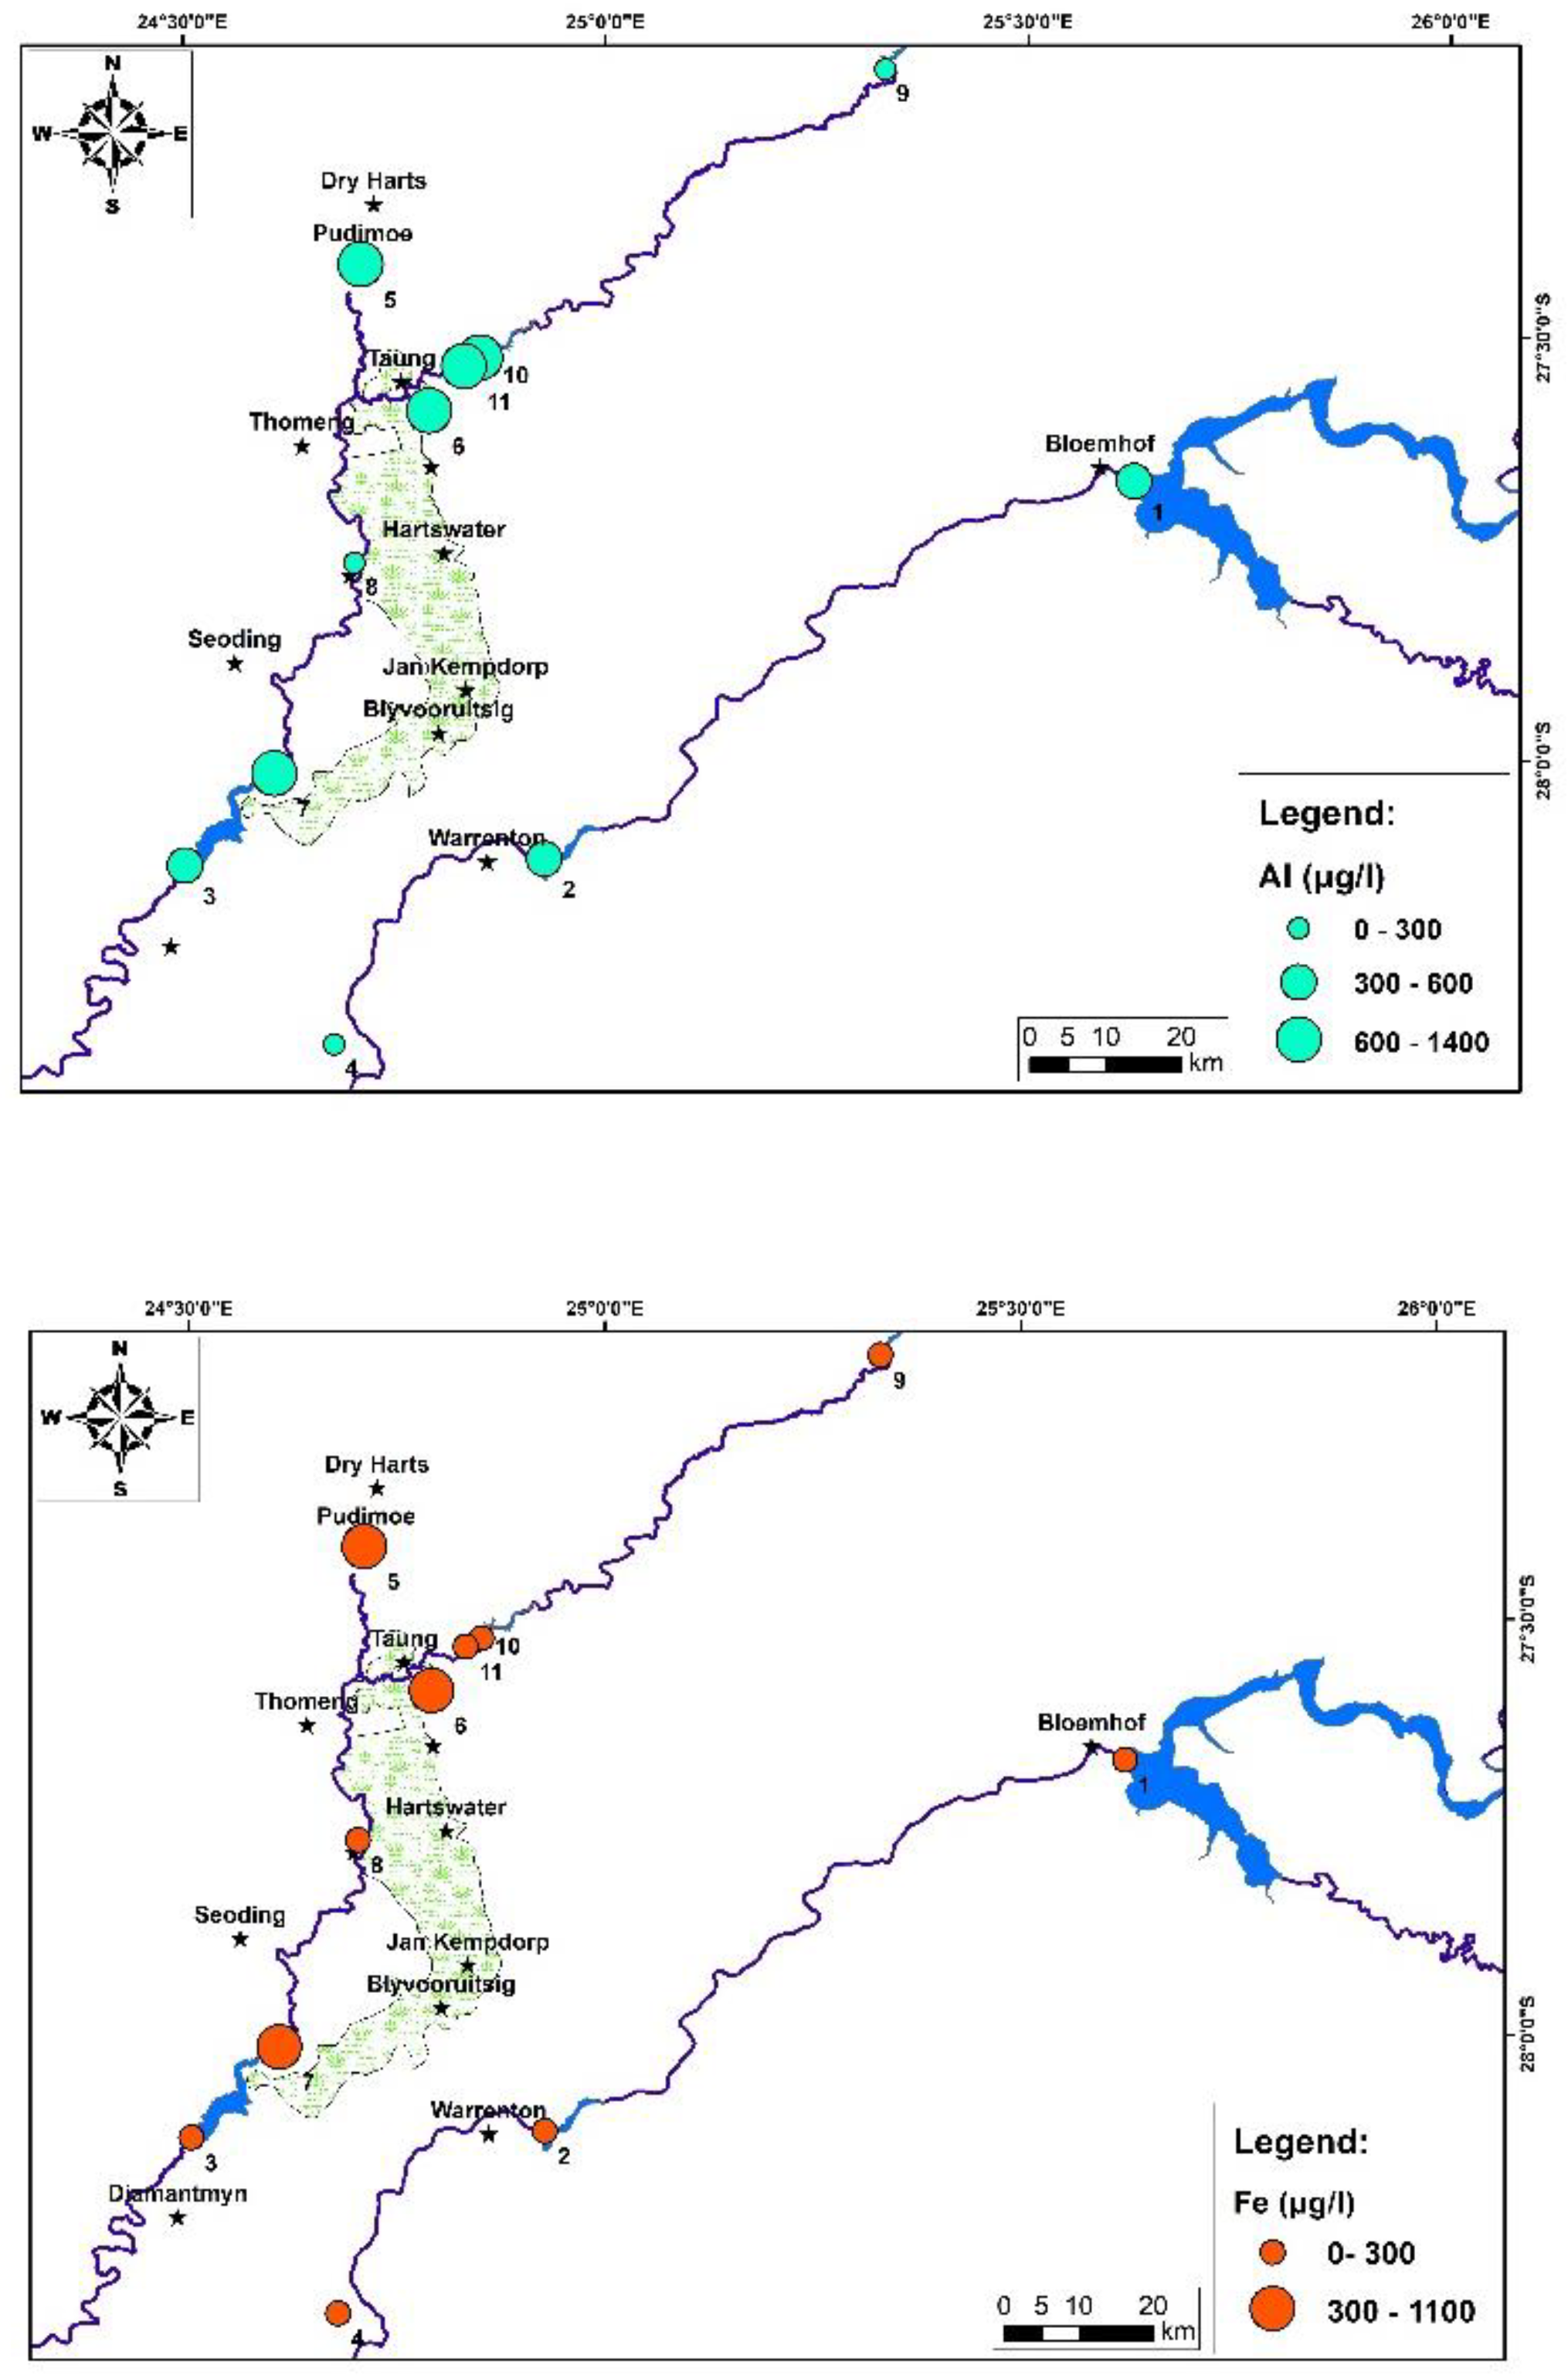
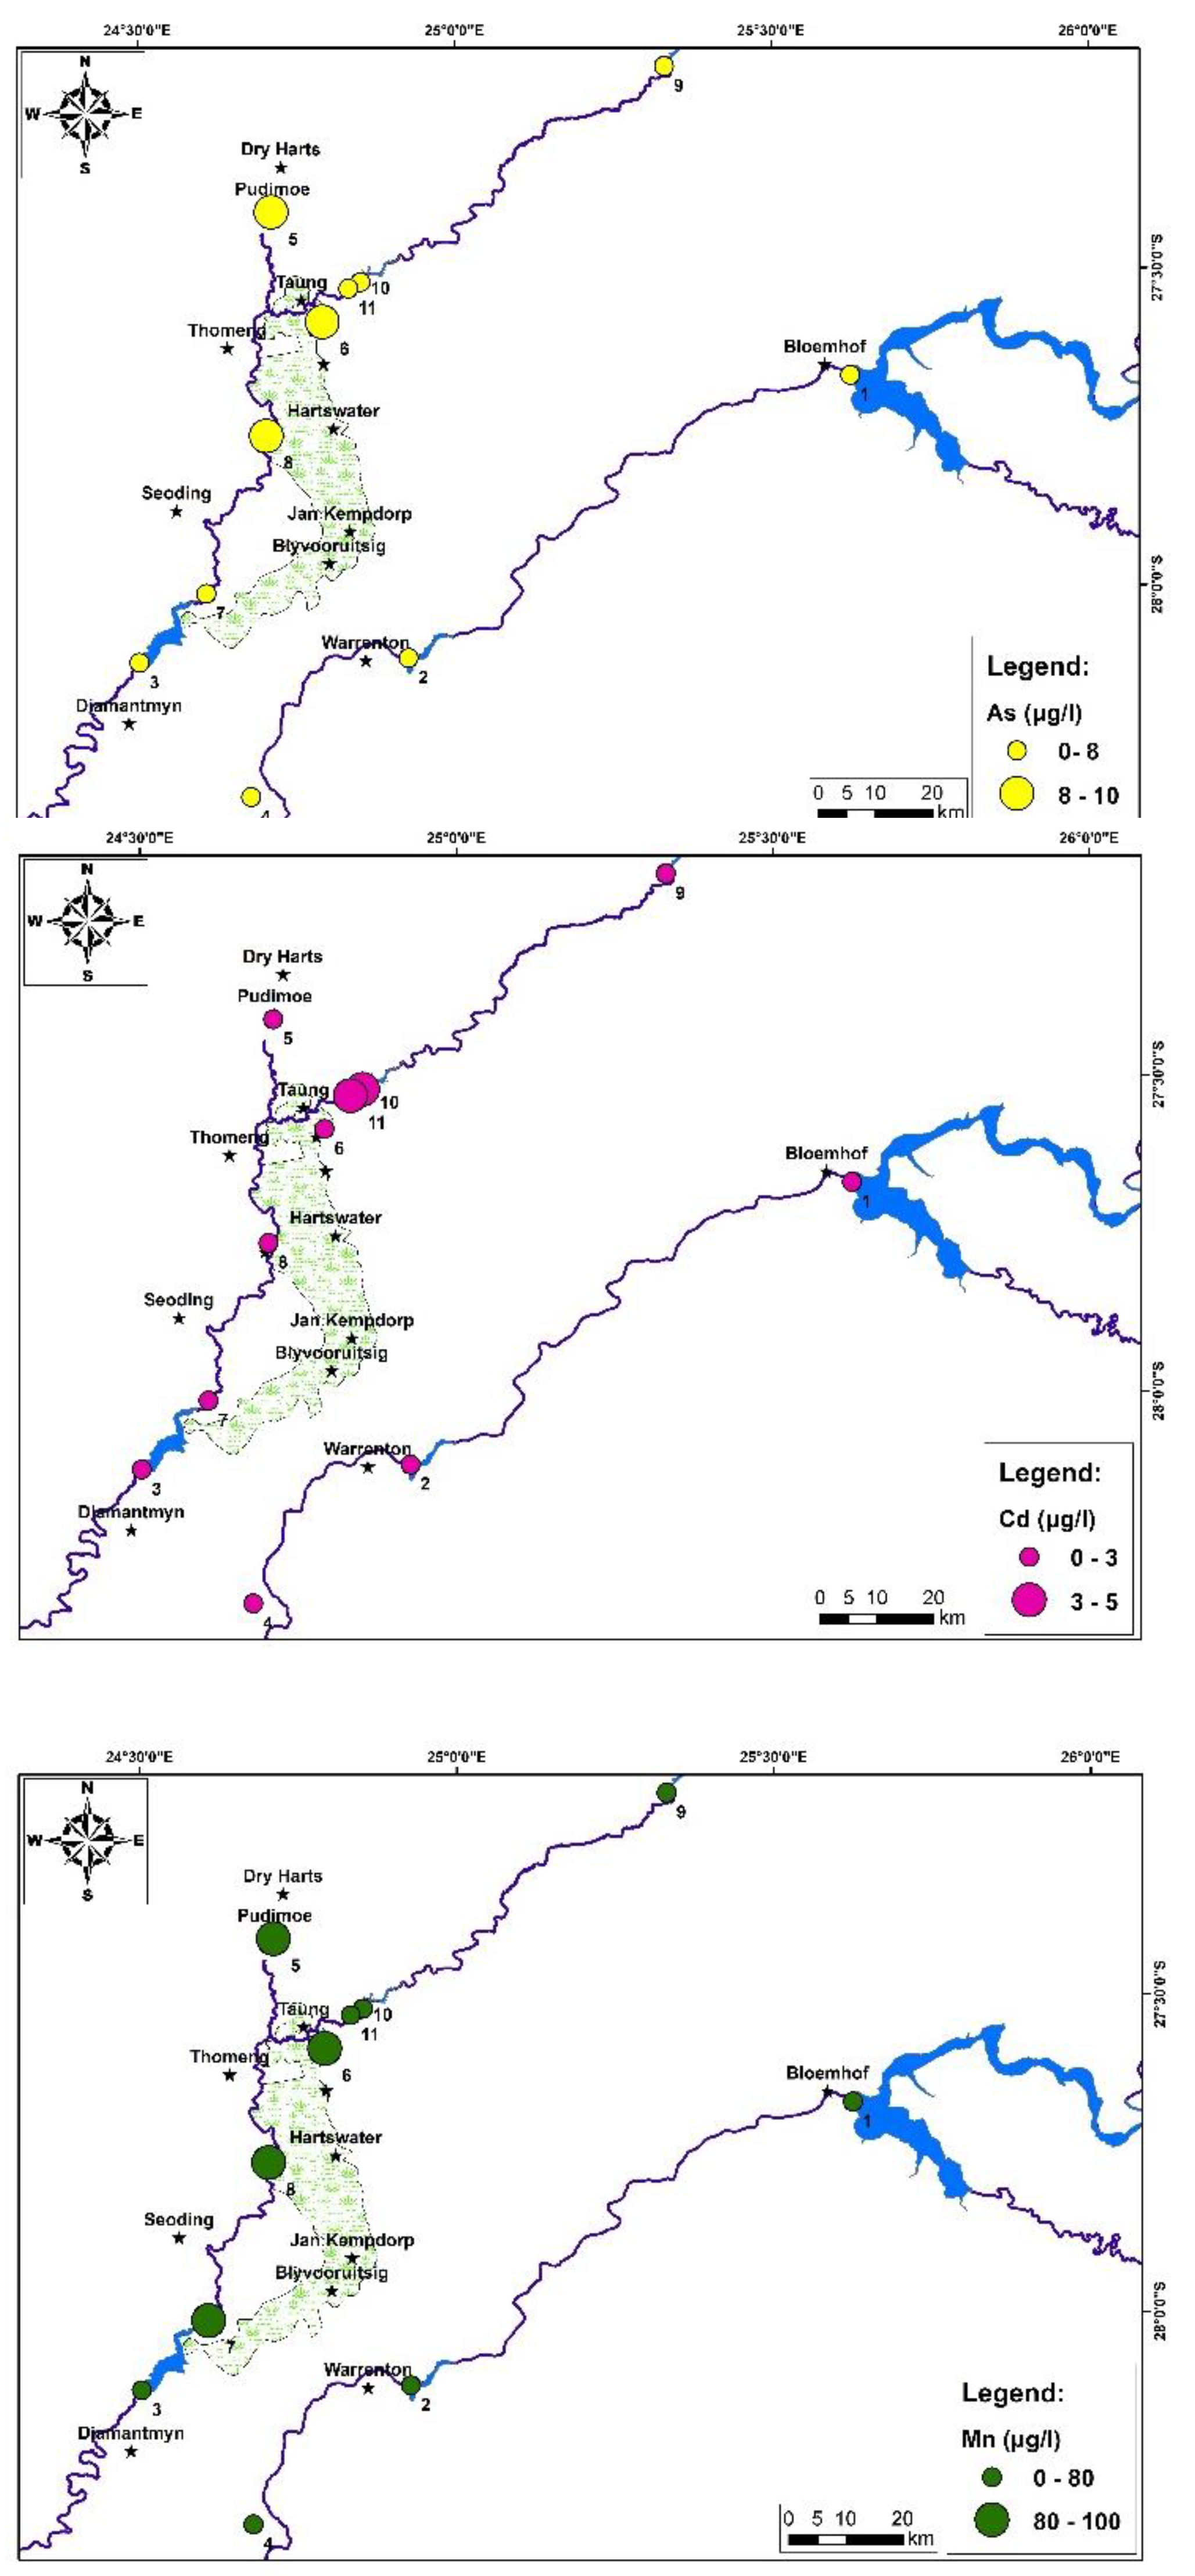
The descriptive physical parameters, major ions and heavy metals of surface water samples are summarized in Table S6. The (TDS) and (EC) of the area showed a high concentration,36 and 112 mS/m, respectively, which denotes the presence of variable amounts of dissolved salts. The pH reveals that the water is alkaline, with an average pH value 8.43. The major ions dominance pattern was in the order of NO3 <K<Mg<Ca<Na<Cl<SO4<HCO3.The average concentration of each ion is 0.89; 9.12; 23.27; 41.63; 48.92; 50.89; 86; 141.7, respectively. According to the [67,68] the majority of values are below the permissible limit. In the present study, the order of heavy metals enrichment in the water is Al < Fe < F < PO4< Zn< B< Mn< Cu< As< Sb< Se< Pb< Hg< Ni< Cr < Cd. Aluminium is highly enriched in the surface water of Vaalharts area. As seen in Table S6, the Aluminium concentrations in water ranged from 200 to 1400 ug/L with an average range of 860.44 ug/L. Most samples have Al values higher than [67,68] drinking water standard limits. Iron (Fe) content from 40 to 1100 ug/l (mean 319). 50% of samples have iron concentrations above the standard limit. In addition, the manganese water concentration in the Vaalharts area varied from 10 to 100 ug/l. The measured water arsenic values varied from 3.2 to 10 ug/l. Cadmium concentration ranged between 1 to 5 ug/l. About 50 % of samples for manganese, arsenic and cadmium were close to the desirable limit of 100 ug/L of Mn, 10 ug/l of As and 3 ug/l of Cd respectively [68]). Hence these higher concentrations were classified as unfit for human consumption. [84] reported that the different factories caused the increased concentrations of Al, Fe, As, Cd and Mn in Vaal and Harts rivers, showing that the industrial effluent discharges in the area led to increased pollution of water in the river. The high concentration of aluminium, iron, arsenic, cadmium, and manganese in the area can lead to chronic poisoning, nerve damage, pulmonary embolism, cardiovascular disease, impaired mental development of children, bronchitis, kidney disorders, anaemia, and neurological maladies [16,85,86,87,88,89]. The rest of the heavy metals (as fluoride (F), phosphate (PO4), chromium (Cr), Copper (Cu), zinc (Zn), bore (B), mercury (Hg), lead (Pb), nickel (N), antimony (Sb) selenium (Se)) observed in the study area have low concentrations and are below the drinking water guideline levels established by [67,68].
Figure 2. Spatial distribution maps for the concentration of Heavy metals in surface water.
Preprints 77401 g002aPreprints 77401 g002b
The descriptive statistic of the surface water quality indices for irrigation in the Vaalharts area is presented in Table 1. The EC and TDS are the most important useful criteria to evaluate water quality [90,91]. The high concentration of salinity in water has a negative impact on the osmotic activity of plants in the soil and also inhibits plants’ ability to take up water and nutrients [92,93]. The water points in the research area revealed an important concentration of EC. According to [94] classification, surface water has moderate to high EC values and unsuitable water for irrigation purposes (Table 1). Therefore, these high salt values in water play a negative role in crop yield and cause soil degradation [77,91]. These results of high salinity in the area are in agreement with increased rock-water interactions along flow pathways, return flows, and poor water quality from the highly industrialized Vaal River. This can cause issues when using pressurized irrigation, which does not allow the salts to be ‘flushed’. Farmers stopped cultivating tobacco a few years ago due to the chlorine content of the water [56]. Drainage systems had to be installed throughout the area. A Water Research Commission initiative is presently underway to assist farmers in selecting the appropriate crops for their soil salinity (VHWUA). For the current study, Sodium adsorption ratio (SAR) values range between 0.84 and 2.25 meq/l. Water samples with SAR value lower than 10 meq/l suggest an excellent quality for irrigation (Table 1). On the other hand, the sodium percentage (Na%) varies from 29.20 to 41.49 meq/l (Table S6). Water classification shows that all of the samples are considered as excellent water quality. The Permeability Index (PI) is an important irrigation water assessment index used to quantify the suitability of water for irrigation purposes. The permeability of soil is impacted by long-term use of irrigation water and is influenced by Na, Ca, Mg and HCO3 contents in the soil [37,95]). The PI values for the surface water samples analyzed vary from 18.71 to 48.87%, with an average of 31.81% (Table 1) indicating unsuitable to suitable water quality with moderate concerns due to insufficient soil management and inappropriate drainage. Furthermore, sodium, carbonate, and bicarbonate are considered harmful elements to the structure of soil and plant growth [91]. High values of Residual Sodium Carbonate (RSC) may markedly alter water quality and affect its suitability for irrigation. In this area, the RSC values ranged from -5.25 to 0.47 meq/l, which makes the water suitable for irrigation. The high magnesium concentration (Mg) in water affects soil quality by increasing its alkalinity and decreasing productivity [96,97,98]. About 73 % of the water samples used in this study have Mg % values less than 50%, classifying them as suitable water for irrigation. The rest of the samples are unsuitable for irrigation. Kelley’s ratio is also an important parameter to evaluate irrigation suitability. All of the water samples have KR<1 (Table 1), which makes them suitable for irrigation. Water suitability is determined not only by the concentrations of soluble salts in water, but also by the proportion of solute accumulation in soils after irrigation, which measures the concentrations of Cl and SO4. The PS values of water samples are higher than 15 (Table 1), [37]. The results indicate that surface water is unsuitable for irrigation purposes.
The suitability of surface water resources for drinking, household, and industrial (involving food processing) use was evaluated. The WQI ranged from 8.46 to 83.10 in the current study, with an average of 50.36, and is thus divided into six water classes ranging from excellent to unfit for drinking [23,65,66] (Table 2). Results show that the majority of water samples belong to the fair water category and hence are unsuitable for drinking but suitable for irrigation and industrial. However, 6 samples fall in the good water category and are therefore relatively suitable for domestic, irrigation, and industrial uses but not acceptable for drinking. The higher WQI values found in 2 samples (6 (Bogosing) and 7 (kgomosto)) of deteriorated quality were mostly due to higher aluminium, iron, and fluoride concentrations. Hence, they would require appropriate treatment before use.
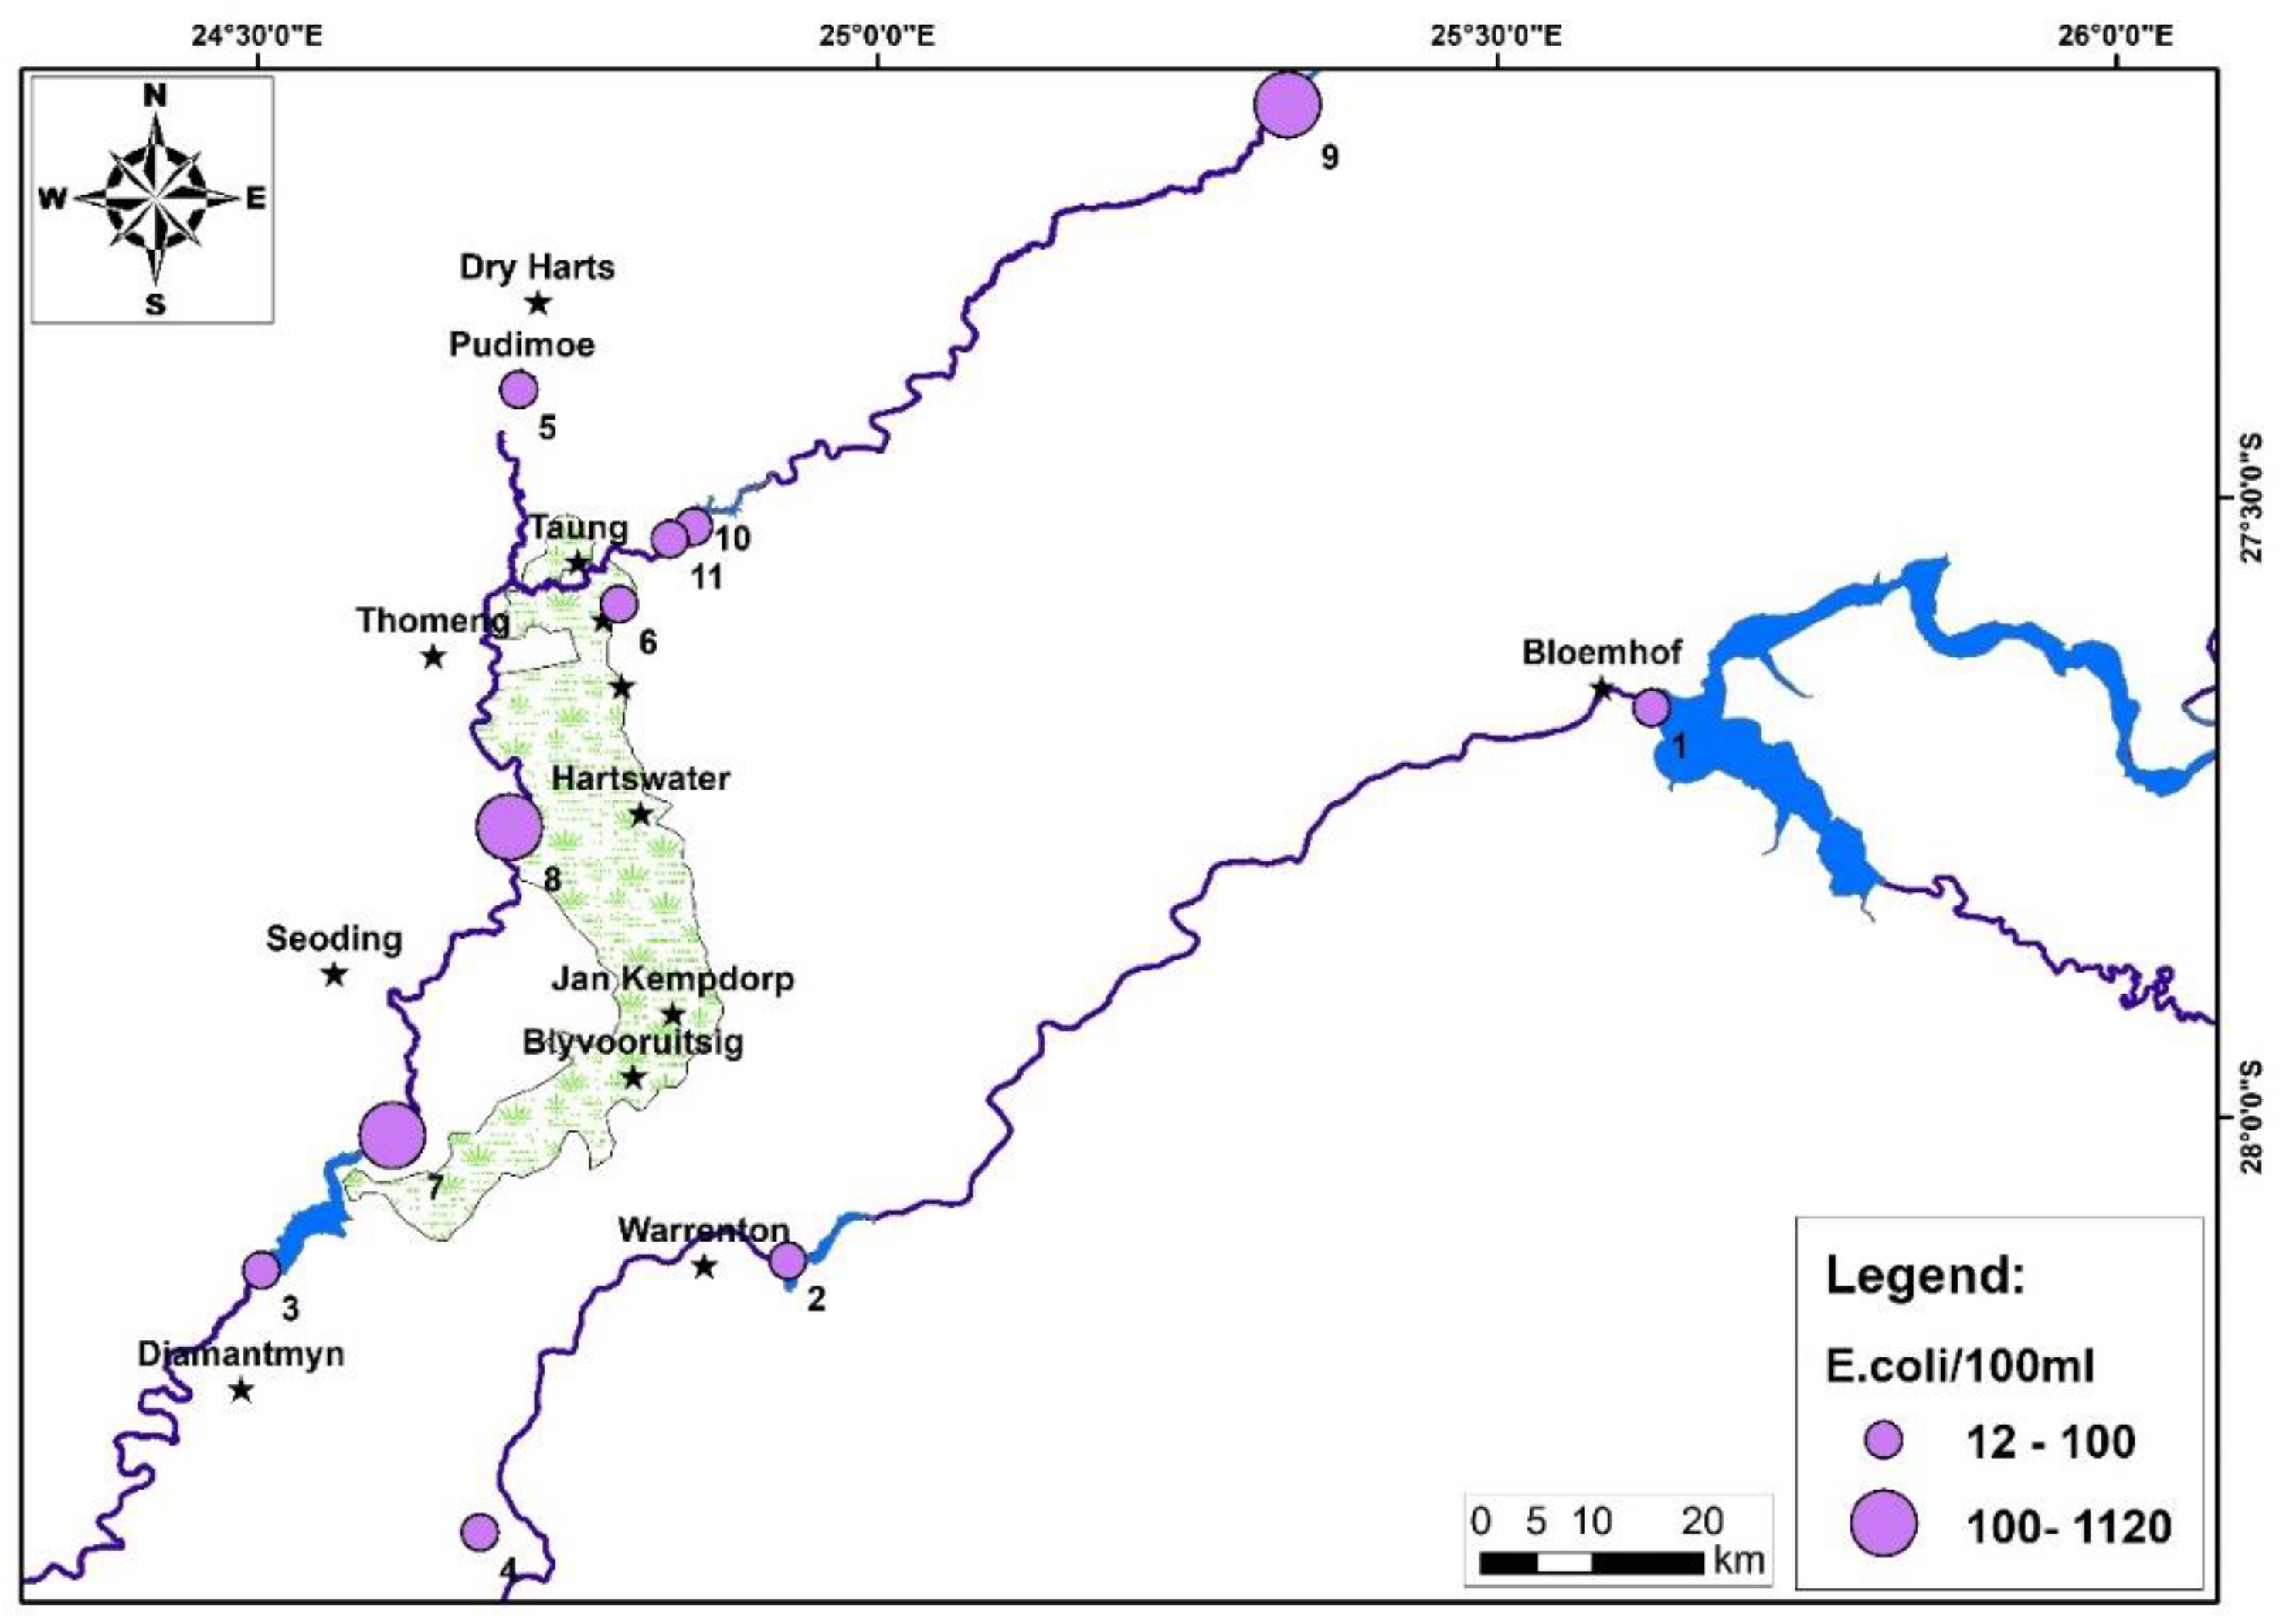
Based on [67], the results of the concentration of E. coli in the surface water samples indicate that the values range from 12 to 1120, referring to unsafe water quality with high and very high risk (Figure 3). A high E coli count may be attributed to the accumulation of sewage from the upstream municipalities. The high concentration of E.coli shown in Bloemhof, Vaalharts, Spitskop, Taung and Wentzel Dams may be the wastewater from its catchment and eutrophication.
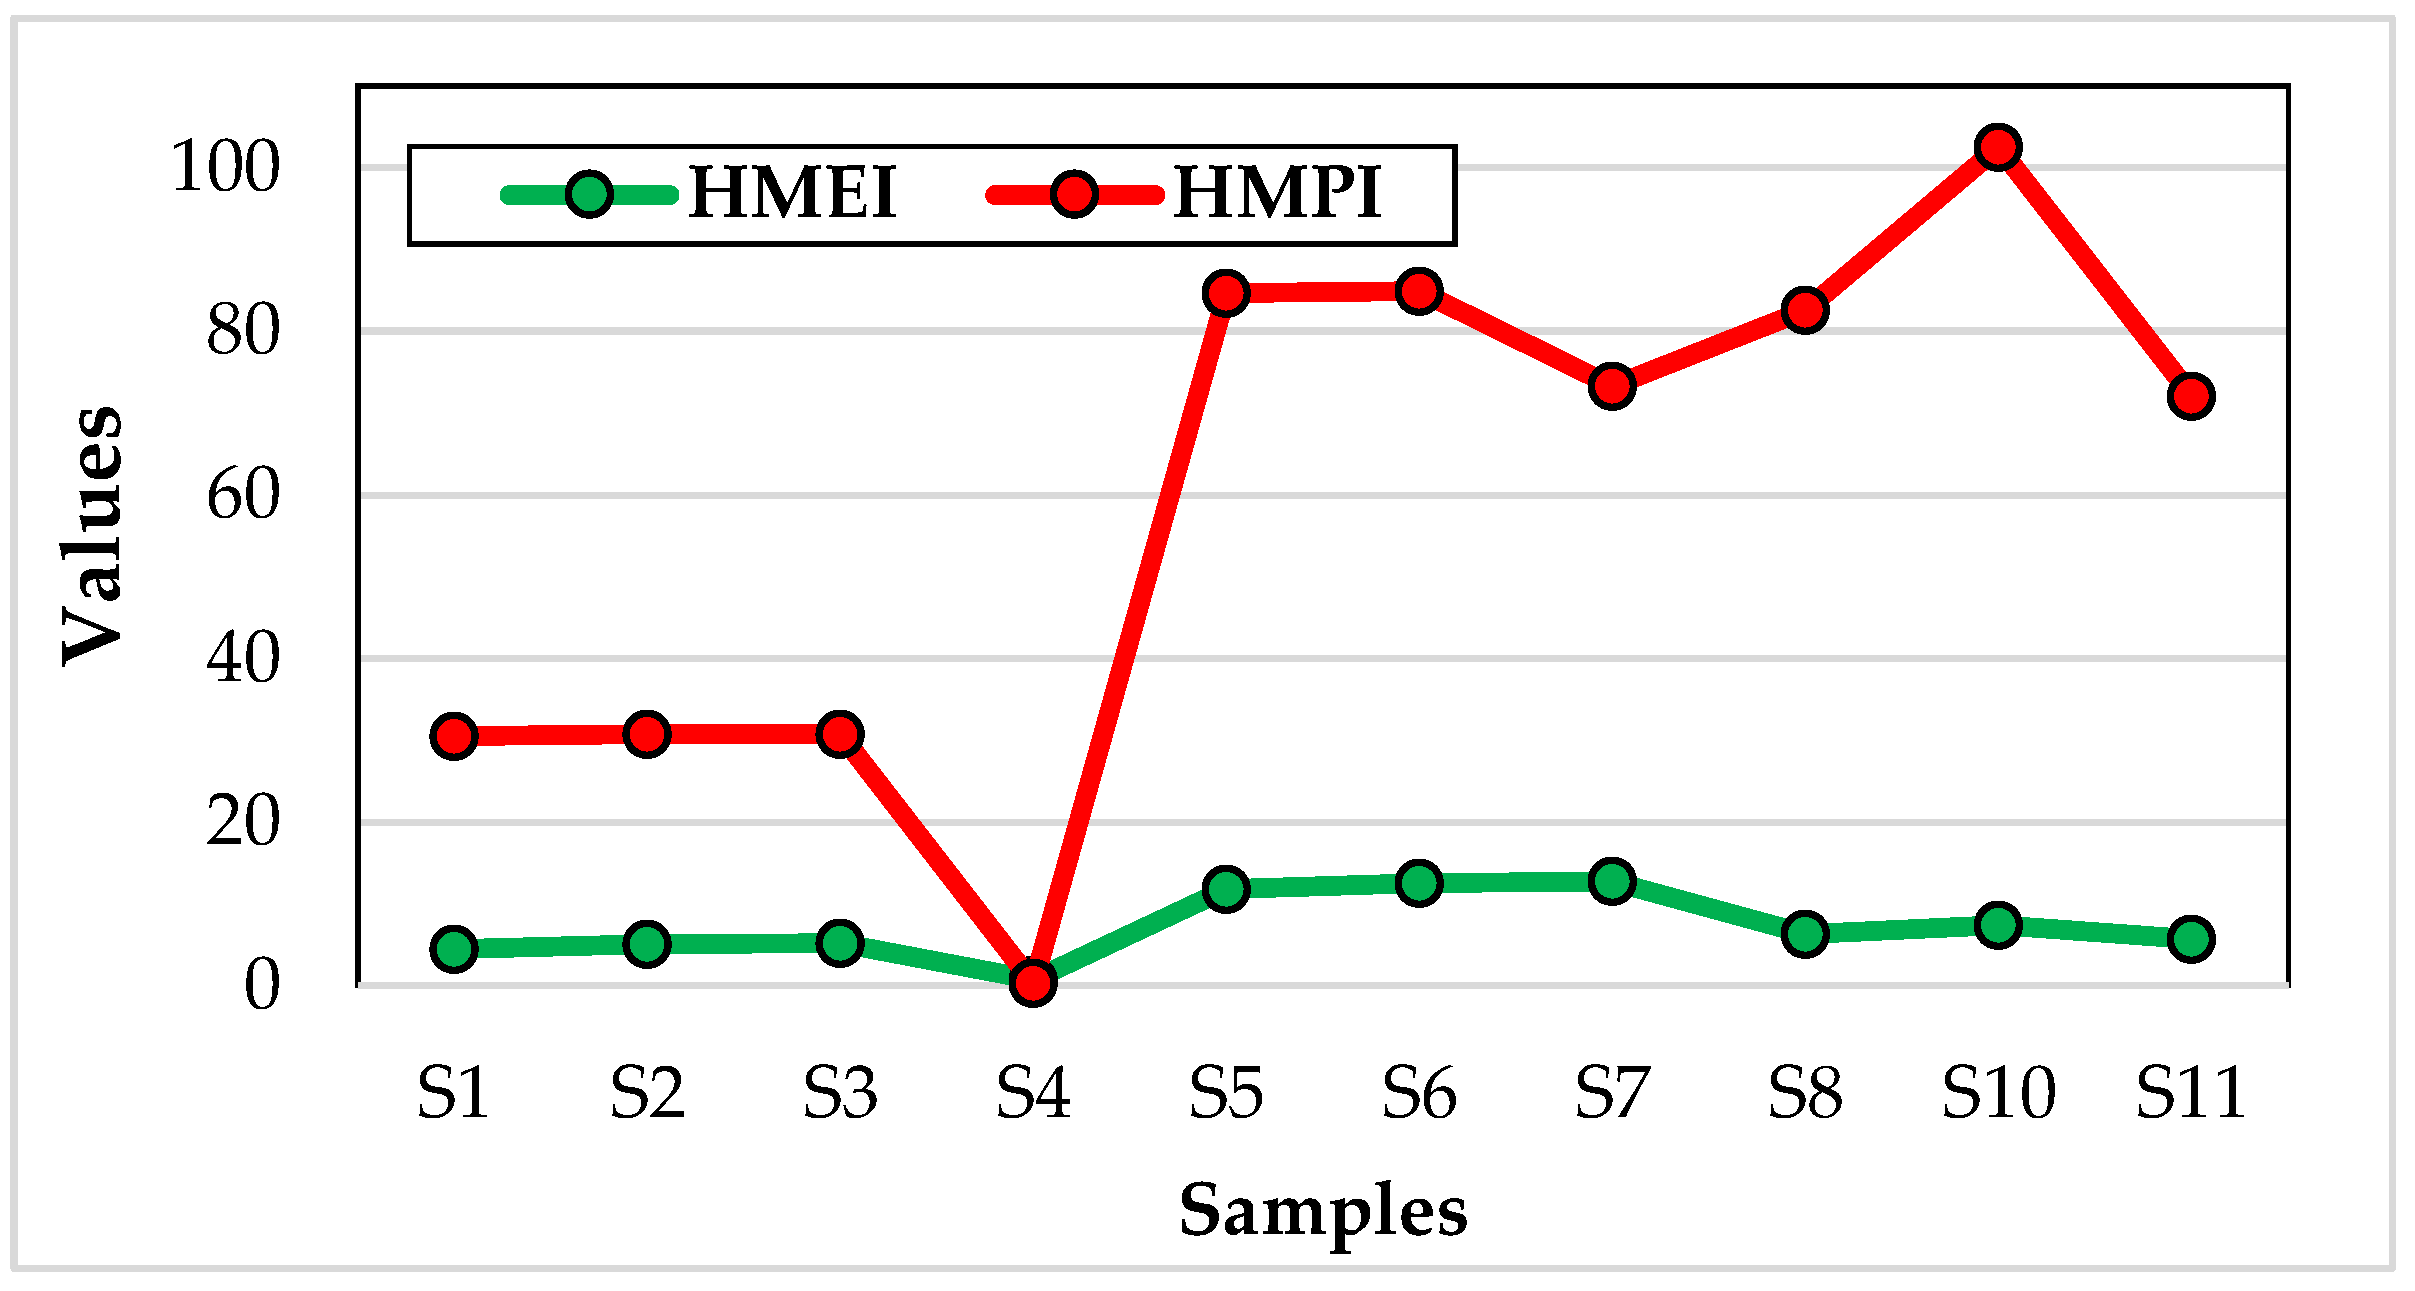
The HMPI for the surface water in the Vaalharts area deviates from 30.54 to 102,53, with mean values of 65 for 16 heavy metals. Based on the classifying criterion of HMPI [69], all the water samples are above the critical value of 30, therefore unsuitable for human consumption (Table 3 and Figure 4). The HMEI is calculated based on integrating the parameters’ upper and maximum admissible [69,99]. The HMEI values ranged from 4.45 to 12.73, with a mean concentration of 7. The index results showed that 40% of samples are above the limit of 10, which represents high pollution extent (Table 3 and Figure 4).
The value of non-carcinogenic health risks for adults and children in the study area is presented in Table 4. Although the (ADD) assessment revealed that the mean Al, Fe, F and Cu exposure ingestion and the dermal dose were high for both adults and children, the average values from the HQ assessment show that the order of impact of these heavy metals causes chronic health hazards is As>F>Cd>Mn (oral ingestion) and Cd>Mn>Cr>As (dermal) were 0.7;0.3;0.1;0.08 and 1.52; 1.04; 0.54; 0.36 respectively for adult and As<F<Cd<Pb<Mn and Cd<Mn<Cr<As<Al were 2.8;1.23;0.6;0.38;0.33 and 45.04;30.75;16.001;10.82;1.81 for children. According to HQ, the principal heavy metals predisposing adult and child populations to unfavorable health issues were Cd, As, F, and Mn. The results of HI (Table 4 and Figure 5) show, for the adult population of the study area, the majority of samples pose medium to high chronic risk predisposing consumers to ingestion and dermal absorption of trace elements. However, for the children population, all the samples have high to very high chronic risk due to trace element ingestion and dermal exposure. Hence, according to this assessment, children are much more exposed to chronic risk than adults. Cadmium (Cd), arsenic (As), fluoride (F), and manganese (Mn) contributed a higher percentage of the HI, thus amplifying the potential risk. The HI has proven to be a very useful tool for assessing overall surface water pollution. It indicates that surface water is severely contaminated by heavy metal leaching from industrial, agricultural and domestic activities.
Table S7 presents the results of the Cancer Risk probability (CR) of five metals (As, Cr, Cd Ni, Pd) for adult and children populations. The totality of point waters has high As, Cr and Cd cancer risk and about 50% have high Ni cancer risk for both adults and children based on the acceptable range for cancer risk of <1*10-6 to 1*10-4 [79,100]). All of the samples have high cancer for children but have negligible cancer risk for adults due to Pb contamination.

5. Conclusions

Surface water samples were studied to assess the health risk and evaluate water quality for irrigation and drinking purposes in the Vaalharts area. With the exception of salinity hazard (Sh), permeability index (PI), potential salinity (PS), and magnesium index (MH), the samples were assessed as irrigation water acceptable by all irrigation water quality indices utilized in the Vaalharts region. The heavy metal content in the studied area shows the following order: Al < Fe < F < PO4< Zn< B< Mn< Cu< As< Sb< Se< Pb< Hg< Ni< Cr < Cd. The contents of Al, Fe, As, Cd and Mn exceeded the SANS 2015 and WHO 2011 drinking water standard limits. The high values of this content are shown in Spitskop Bloemhof, Vaalharts, Taung and Wentzel Dams. Indeed, the WQI indicates most of the samples (about 80%) are of fair water quality, hence are unsuitable for drinking but suitable for irrigation and industrial. Based on the HMPI, all of the water points were above the critical value. However, HMEI indicates 40% of samples were above the limit of 10, which represents high pollution extent. HQ value of As, Cd, F, and Mn impacted chronic disease potentiality more than the other heavy metals. On the basis of HI, children have higher chronic non-carcinogenic health risks than the adult population. Approximately 80% of the samples showed high chronic health risks for child consumers. Based on the CR, all samples have high As, Cr and Cd cancer risk for both adults and children, while 100% have low Pb cancer risk for children. The current study could be useful to local governments responsible for water (quality) management. Furthermore, this study points out the need for decision-makers to develop a mitigation strategy to limit the spread of water resource contamination and preserve the entire ecosystem. In order to protect and maintain public health, this study strongly suggests that contaminated surface water needs to be treated before consumption. In conclusion, given the importance of water quality in the Sustainable Development Goals (SDG 6 in particular, 6.3 (improve water quality) and 6.5 (implement integrated water resource management), societal needs to focus on the development of hydrological and hydrogeology sciences [101].

Supplementary Materials

The following supporting information can be downloaded at the website of this paper posted on Preprints.org. Table S1: Title: Classification of HMEI and HMPI; Table S2: Title: Human exposure parameter values Table S3:Title: RfD and Kc for the analysed heavy metals; Table S4: Title: Classification of chronic (non-carcinogenic) risk; Table S5: Title: Slope factor values; Table S6: Title: Physico-chemical parameters, major ions, heavy metal and E. coli data of surface water in the study area; Table S7: Title: Cancer risk of trace metals by ingestion and dermal absorption pathway .

Author Contributions

Conceptualization, N.M. and A.N.; methodology N.M and A.N.; software, N.M.; validation, N.M., A.N. and G.V.; data curation, N.M.; writing—original draft preparation, N.M.; writing—review and editing, N.M., A.N and G.V; visualization, N.M.; supervision, A.N, G.V; project administration, G.V.; funding acquisition, G.V. All authors have read and agreed to the published version of the manuscript

Funding

This research was funded by National Research Foundation (NRF) of South Africa and the Dutch Research Council (de Nederlandse Organisatie voor Wetenschappelijk Onderzoek - NWO).

Data Availability Statement

Not applicable.

Acknowledgments

This work is based on the research supported wholly by the National Research Foundation (NRF) of South Africa and the Dutch Research Council (de Nederlandse Organisatie voor Wetenschappelijk Onderzoek - NWO). Project UID 129352. The NRF and NWO are thanked for their financial contribution. Any opinion, finding, conclusion or recommendation expressed in this material is that of the author(s) and the NRF and NWO do not accept any liability in this regard.

Conflicts of Interest

The authors declare that they have no conflict of interest.

References

  1. Ferroukhi, R.; Nagpal, D.; Lopez-Peña, A.; Hodges, T.H; Mohtar, R.; Daher, B.; Mohtar, S.; Keulertz, M. Renewable Energy in the Water, Energy anf Food Nexus. www.irena.org/Publications 2015.
  2. UN-Water. Water and sanitation interlinkages across the 2030 Agenda for sustainable development. Geneva: UN-Water 2016.
  3. United Nations. Sustainable development goal 6 synthesis report 2018 on water and sanitation. New York: United Nations 2018.
  4. Charkhabi, A.H.; and Sakizadeh M. Assessment of spatial variation of water quality parameters in the most polluted branch of the Anzali wetland, northern Iran. Polish J. Environ. Stud. 2006, 15: 395-403.
  5. Mary-Lou, T.W.; Taillefert, M. Remote in situ voltammetric techniques to characterize the biogeochemical cycling of trace metals in aquatic systems. J. Environ. Monit 2008, 10: 30-54. [CrossRef]
  6. Muhammad, S.; Shah, M.T.; Khan, S. Health risk assessment of heavy metals and their source apportionment in drinking water of Kohistan region, northern Pakistan. Microchem J 2011, 98, 334–43. [CrossRef]
  7. Khan, S.; Maria, S.; Noor, J.; et al. Drinking water quality and human health risk in Charsadda district, Pakistan. J Clean Prod 2013, 60:93–101.
  8. Atafar, Z.; Mesdaghinia, A.; Nouri, J.; et al. Effect of fertilizer application on soil heavy metal concentration. Environ Monit Assess 2010,160(1–4):83–9. [CrossRef]
  9. Aggett, P.J. Iron. In: Erdman JWJ, Macdonald IA, Zeisel SH, eds. Present Knowledge in Nutrition. 10th ed. Ames: Wiley-Blackwell 2012,506-520.
  10. Anderson, G.J.; Darshan, D.; Wilkins, S.J.; Frazer, D.M. Regulation of systemic iron homeostasis. How the body responds to changes in iron demand. Biometals 2007, 20 (3-4):665-674. [CrossRef]
  11. Kwong, W.T.; Friello, P.; Semba, R.D. Interactions between iron deficiency and lead poisoning: idemiology and pathogenesis. Sci. Total Environ 2004. 330, 21–37. [CrossRef]
  12. Carvalho, V.S.D.; Santos, I.F.D.; Almeida, L.C.; Souza, C.T.D.; Júnior, J.B.D.S.; Souza, L. A.; Santos, L.O.D.; Ferreira, S.L.C. Spatio-temporal assessment, sources and health risks of water pollutants at trace levels in public supply river using multivariate statistical techniques. Chemosphere 2021, 282, 130942.
  13. Kazantzis, G. Cadmium, osteoporosis and calcium metabolism. Biometals 2004,17, 398–493. [CrossRef]
  14. El Sikaily, A.; El Nemr, A.; Khaled, A.; Abdelwehab, O. Removal of toxic chromium from wastewater using green algea Ulva lactuca and its activated carbon. J Hazard Mater 2007 148(1-2);216-228. [CrossRef]
  15. Yadav, K.K.; Kumar, V.; Gupta, N.; Kumar, S.; Rezania, S.; Singh, N. Human health risk assessment: study of a population exposed to fluoride through groundwater of Agra city, India. Regul. Toxicol. Pharmacol 2019. 106, 68–80. [CrossRef]
  16. Hossain, M.; Patra, P.K. Contamination zoning and health risk assessment of trace elements in groundwater through geostatistical modelling. Ecotoxicol. Environ. Saf 2020. 189, 110038. [CrossRef]
  17. He. X.; Li, P. Surface water pollution in the middle Chinese Loess Plateau with special focus on hexavalent chromium (Cr6+): occurrence, sources and health risks. Expo Health 2020. [CrossRef]
  18. Bhutiani, R.; Kulkarni, D.B.; Khanna, D.R.; Gautam, A. Water quality, pollution source apportionment and health risk assessment of heavy metals in groundwater of an industrial area in North India. Expo. Health 2016, 8, 3–18. [CrossRef]
  19. Rahman, M.S.; Biswas, P.K.; Al Hasan, S.M.; Rahman, MM.; et al. The occurrences of heavy metals in farmland soils and their propagation into paddy plants. Environ. Monit. Assess 2018. 190, 201. [CrossRef]
  20. Zhu, L.; Yang, M.; Chen, X.; Liu, J. Health risk assessment and risk control: drinking groundwater in Yinchuan Plain, China. Expo. Health 2019 11 (1), 59–72. [CrossRef]
  21. Shams, M.; Tavakkoli Nezhad, N.; Dehghan, A.; Alidadi, H.; Paydar, M.; Mohammadi, A. A.; et al. Heavy metals exposure, carcinogenic and non-carcinogenic human health risks assessment of groundwater around mines in Joghatai, Iran. Int. J. Environ. Anal. Chem 2020. 1–16. [CrossRef]
  22. Mthembu, P.P.; Elumalai, V.; Brindha, K.; Li P. Hydrogeochemical processes and trace metal contamination in groundwater: impact on human health in the Maputaland coastal aquifer, South Africa. Expo Health 2020. [CrossRef]
  23. Mthembu, P.P.; Elumalai, V.; Li, P.; Uthandi, S.; Rajmohan, N.; Chidambaram, S. Integration of Heavy Metal Pollution Indices and Health Risk Assessment of Groundwater in Semi-arid Coastal Aquifers, South Africa. Exposure and Health 2022, 14:487–502. [CrossRef]
  24. Cui, L.; Li, J.; Gao, X.; Tian, B.; Zhang, J.; Wang, X.; Liu, Z. Human health ambient water quality criteria for 13 heavy metals and health risk assessment in Taihu Lake. Front. Environ. Sci. Eng. 2022, 16, 41. [CrossRef]
  25. Le Chevallier, M.W.; Babcock, T. M.; Lee, R. G. Examination and characterization of distribution system biofilms. Appl. Environ. Microbiol 1987. 53:2714–2724. [CrossRef]
  26. Le Chevallier, M.W. Coliform regrowth in drinking water: a review. J. Am. Water Works Assoc 1990. 82:74–86. [CrossRef]
  27. Jones, D.L. Potential health risks associated with the persistence of Escherichia coli O157 in agricultural environments. Soil Use Manage. 1999, 15, 76–83. [CrossRef]
  28. Maisela, R.J. Realizing agricultural potential in land reform: the case of vaalharts irrigation scheme in the northern cape province (Magister Philosophiae in Land and Agrarian Studies, University of the Western Cape (UWC), South Africa 2007.
  29. Verwey, P.M.J.; Vermeulen, P.D. Influence of irrigation on the level, salinity and flow of groundwater at Vaalharts Irrigation scheme. Water SA 2011, 37(2), pp.155-164. Pretoria. [CrossRef]
  30. Kouras, A.; Katsoyiannis, I.; Voutsa, D. Distribution of arsenic in groundwater in the area of Chalkidiki, Northern Greece. Journal of Hazardous Materials 2007. [CrossRef]
  31. Scotcher, J.S.B. The green choice living farms Reference 2009/2010 version. World Wide Fund for Nature and Conservation International 2009.
  32. Goldblatt, A. Agriculture: Facts and Trends: South Africa. CEO WWF-SA 2010.
  33. Sharif, M.U.; Davis, R.K.; Steele, KF.; Kim, B.K.T.M.; Fazio, J.A. Inverse geochemical modelling of groundwater evolution with emphasis on arsenic in the Mississippi River Valley alluvial aquifer, Arkansas (USA). J Hydrol 2008 350:41–55. [CrossRef]
  34. Todd, D.K. Groundwater hydrology, 2nd edn. Wiley, New York 1980. 535p.
  35. Al-Salim, T.H. Groundwater quality of areas selected NE of Mousl city used for irrigation and drinking purposes, Al-Rafidain Eng 2009, 17(3).
  36. Aghazadeh, N.; Mogaddam, A. A. Assessment of groundwater quality and its suitability for drinking and agricultural uses in the Oshnavieh area, Northwest of Iran. J Environ Prot 2010, 1, 30. [CrossRef]
  37. Doneen, L.D. Notes on water quality in Agriculture Published as a Water Science and Engineering Paper 4001, Department of Water Science and Engineering, University of California 1964.
  38. Raghuanth, H, M. Groundwater, 2nd edn. New Age International Limited Publishers, New Delhi 1987.
  39. Szabolcs, I.; Darab, C. The influence of irrigation water of high sodium carbonate content of soils. In: Proceedings of 8th international congress of ISSS, transmission, vol 2, 1964. pp 803–812.
  40. Kelley, W,P.; Brown, S,M.; Liebig, G,F. Chemical effects of saline irrigation water on soils. Soil Sci 1940. 49: 95-107.
  41. Meireles, A.C.M.; Andrade, E.M.; Chaves, L.C.G.; Frischkorn, H.; Crisostomo, L.A. A new proposal of the classification of irrigation water. Revista Ciencia Agronomica 2010, 41(3), 349–357. [CrossRef]
  42. Ustaoglu, F.; Tepe, Y.; Tas, B. Assessment of stream quality and health risk in a subtropical Turkey river system: a combined approach using statistical analysis and water quality index. Ecol. Indic. 2020, 113, 105815. [CrossRef]
  43. Sheykhi, V.; Moore, F. Geochemical characterization of Kor river water quality, Fars Province, Southwest Iran. Water Quality. Exposure and Health 2012, 4(1), 25–38. [CrossRef]
  44. Kumar, D.; Singh, A.; Jha, R.K.; Sahoo, B. B.; Sahoo, S. K.; Jha, V. Source characterization and human health risk assessment of nitrate in groundwater of middle Gangetic Plain India. Arabian Journal of Geosciences, 2019 12(11), 339. [CrossRef]
  45. Li, L.L.; Jun, W.; Jian, L.; Kexin, Li.; Zhang, X.; Xiuyun, M.; Chunliang, G.; Juan, X. Water quality evaluation and ecological-health risk assessment on trace elements in surface water of the northeastern Qinghai-Tibet Plateau. Ecotoxicology and Environmental Safety 2022. [CrossRef]
  46. Duggal, V.; Rani, A.; Mehra, R.; Balaram, V. Risk assessment of metals from groundwater in northeast Rajasthan. J Geol Soc India 2017, 90, 77–84. [CrossRef]
  47. Li, P.; Li, X.; Meng, X.; Li, M.; Zhang, Y. Appraising groundwater quality and health risks from contamination in a semiarid region of Northwest China. Expo. Health 2016, 8, 361–379. [CrossRef]
  48. Zhang, Y.; Wu, J.; Xu, B. Human health risk assessment of groundwater nitrogen pollution in Jinghui canal irrigation area of the loess region, northwest China. Environment and Earth Science 2018, 77, 273. [CrossRef]
  49. Zhou, Y.; Wei, A.; Li, J.; Yan, L.; Li, J. Groundwater Quality Evaluation and Health Risk Assessment in the Yinchuan Region, northwest China. Exposure Health 2016 8, 443–456. [CrossRef]
  50. Zhou, Y.; Li, P.; Chen, M.; Dong, Z.; Lu, C. Groundwater quality for potable and irrigation uses and associated health risks in southern part of Guan County, North China Plain. Environ Geochem Health 2010. [CrossRef]
  51. Ji, Y.; Wu, J.; Wang, Y.; Elumalai. V.; Subramani, T. Seasonal variation of drinking water quality and human health risk assessment in Hancheng City of Guanzhong Plain, China. Expo. Health 2020, 12, 469–485. [CrossRef]
  52. Schulze, R; Lynch, S; Maharaj M. Monthly rainfall and its inter-annual variability, Pretoria, South Africa 2006.
  53. Barnard, J.H.; Van rensburg, L.D.; Bennie, A.T.P.; Du preez, C.C. Simulating water uptake of irrigated field crops from non-saline water table soils: validation and application of the model SWAMP. Agric. Water Manage 2013, 126 19–32. [CrossRef]
  54. Seshoka, J.; de Lange ,W.; Faysse, N. The transformation of irrigation boards into water user associations in South Africa: Case Studies of the Lower Olifants, Great Letaba and Vaalharts Water User Associations. Working Paper 72. Colombo, Sri Lanka: International Water Management Institute 2004.
  55. Turton, T.; Meissner, R. A hydropolitical History of South Africa’s Major International River Basins. Pretoria, South Africa: AWIRU. Unpublished paper 2003.
  56. WRC (Water Research Commission). (2016): South African Mine Water Atlas. WRC Project 2016 No. K5/2234//3.
  57. Herold, C.E.; Bailey A.K. Long-Term Salt Balance of the Vaalharts Irrigation Scheme. Water Research Commission 1996.
  58. Ellington R.G. Quantification of the impact of irrigation on the aquifer underlying the vaalharts irrigation scheme, Master at the University of the Free State, South Africa, 2003.
  59. Streutker, A. The Dependence of Permanent Crop Production on Efficient Irrigation and Drainage at the Vaalharts Government Water Scheme. Water SA 1997, 3 (2).
  60. Gombar, O.; Erasmus C. Vaalharts Ontwaterings ,Projek, Pretoria 1976.
  61. Kent, L; De Grys, A. The Stratigraphy of South Africa. Handbook 8. Part 1: Lithostratigraphy of the Republic of South Africa, South West Africa/Namibia, and the Republics of Bophuthatswana, Transkei, and Venda. Pretoria: Geological Survey, Dept of Mineral and Energy Affairs, South Africa, 1980.
  62. Schutte, I.C. The Geology of the Christiana Area. Explanation of Sheet 2724 Scale 1:250 000. Council for Geoscience, Pretoria 1994.
  63. Ellington, R.; Usher, B.; Van Tonder, G. Quantification of the impact of irrigation on the groundwater resource in the Vaalharts Irrigation Scheme, Pretoria: WRC Report 1322/2/04, 2004.
  64. Xiao, J.; Wang, L.; Deng, L.; Jin, Z. Characteristics, sources, water quality and health risk assessment of trace elements in river water and well water in the Chinese Loess Plateau. Sci. Total Environ 2019. 650, 2004–2012. [CrossRef]
  65. Brown, R.I.C.E.; McClellan, N.I.; Deinniger R.A., et al. A water quality index crashing physiological barrier. Indicators of Environmental Quality 1972, 1, 173–182.
  66. Rostami, A.A.; Isazadeh, M.; Shahabi, M.; Nozari, H. Evaluation of geostatistical techniques and their hybrid in modelling of groundwater quality index in the Marand Plain in Iran. Environ Sci Pollut Res 2019. [CrossRef]
  67. WHO. Guidelines for drinking water quality, 4th edn. World Health Organization, 2011 Geneva.
  68. SANS. South Africa National Standard 2015. Drinking water; part 1: Microbiological, physical, aesthetic and chemical determinants; part 2: application of SANS 241-1. Available online: https:// www. mwa. co. th/ download/ prd01/ iDW standard/ South Africa and Water Standard SANS 241- 2015. pdf.
  69. Edet, A.E.; Offiong, O.E. Evaluation of water quality pollution indices for heavy metal contamination monitoring. A study case from Akpabuyo-Odukpani area, Lower Cross River Basin (southeastern Nigeria). Geo Journal 2002 57, 295–304. [CrossRef]
  70. Prasanna, M.V.; Praveena, S.M.; Chidambaram, S.; Nagarajan, R.; Elayaraja, A. Evaluation of water quality pollution indices for heavy metal contamination monitoring: a case study from Curtin Lake, Miri City, East Malaysia. Environ Earth Sci 2012 67, 1987–2001. [CrossRef]
  71. Giri, S.; Singh, A.K. Assessment of human health risk for trace metals in fish and shrimp collected from Subarnarekha river, India. Int J Environ Health Res 2014, 24:429–449. [CrossRef]
  72. Kim, E.; Little, J. C.; Chiu, N. Estimating exposure to chemical contaminants in drinking water. Environmental Science & Technology 2004, 38, 1799–1806. [CrossRef]
  73. US EPA. Risk Assessment Guidance for Superfund. Vol I: Human Health Evaluation Manual (Part A). U.S. Environmental Protection Agency 1989.
  74. USEPA. Risk assessment guidance for superfund volume I: human health evaluation manual (part769E) United States Environmental Protection Agency 2004 .http://www.epa.gov/oswer/riskassessment/ragse/pdf/introduction.pdf.
  75. USEPA. Human Health Risk Assessment: Risk-Based Concentration Table. United States Environmental Protection Agency 2010. http://www.epa.gov/reg3hwmd/risk/human/rb-concentration_table/Generic_Tables/.
  76. Zeng, X.; Liu, Y.; You, S.; Zeng, G.; Tan, X.; Hu, X.; Hu, X.; Huang, L.; Li, F. Spatial distribution, health risk assessment and statistical source identification of the trace elements in surface water from the Xiangjiang River, China.Environ Sci Pollut Res 2015, 22:9400–9412. [CrossRef]
  77. Khelifi, F.; Mokadem, N.; Liu, G,; Yousaf, B.; Zhou, H.; Ncibi, K.; Hamed, Y. (2021): Occurrence, contamination evaluation and health risks of trace metals within soil, sediments and tailings in southern Tunisia, International Journal of Environmental Science and Technology 2021. [CrossRef]
  78. Li, S.; Zhang, Q. Risk assessment and seasonal variations of dissolved trace elements and heavy metals in the Upper Han River, China. Journal of Hazardous Materials 2010, 181(1), 1051–1058. [CrossRef]
  79. US-EPA (US Environmental Protection Agency). A risk assessment– multi way exposure spreadsheet calculation tool. Washington, DC: United States Environmental Protection Agency 1999.
  80. USEPA. Risk characterization handbook. EPA 100-B-00-002. Accessed November United States Environmental Protection Agency 2013.
  81. Wu, B.; Zhao, DY.; Jia, HY.; Zhang, Y.; Zhang, XX.; Cheng, SP. Preliminary risk assessment of trace metal pollution in surface water from Yangtze River in Nanjing Section, China. Bull Environ Contam Toxicol 2009 82, 405–409. [CrossRef]
  82. Wang, J.; Liu, GJ.; Liu, HQ.; Lam, PKS. Multivariate statistical evaluation of dissolved trace elements and a water quality assessment in the middle reaches of Huaihe river, Anhui, China. Sci Tot Environ 2017, 583:421–431. [CrossRef]
  83. Chen, S.C.; Liao C.M. Health risk assessment on humans exposed to environmental polycyclic aromatic hydrocarbons pollution sources. Science of the Total Environment, 2006 112 – 123. [CrossRef]
  84. Bekker, F. Quarterly water quality survey on the lower orange river. First quarterly survey for the 2021 period Feb/Mar 2021. Report reference 2021: Orange/C/2021.Clean Stream Environment Service. Stellenbosch (South Africa).
  85. Wade, T.J.; Xia, Y.; Mumford, J.; Wu, K.; Le, X.C.; Sams, E. ; et al. Cardiovascular disease and arsenic exposure in Inner Mongolia, China: a case-control study. Environ. Health 2015,14, 35. [CrossRef]
  86. Hanna, A.M.; LaChance, J.; Sadler, R.C.; Champney Schnepp, A. Elevated blood lead levels in children associated with the flint drinking water crisis: a spatial analysis of risk and public health response. Am. J. Public Health 2016, 106, 283–290. [CrossRef]
  87. Wu, H.; Liao, Q.; Chillrud, S.N.; Yang, Q.; Huang, L.; Bi, J.; et al. Environmental exposure to cadmium: health risk assessment and its associations with hypertension and impaired kidney function. Sci. Rep 2016. 6, 29989. [CrossRef]
  88. Adeyeye, O.; Xiao, C.; Zhang, Z.; Liang, X. State, source and triggering mechanism of iron and manganese pollution in groundwater of Changchun, Northeastern China. Environ. Monit. Assess 2020, 192, 619. [CrossRef]
  89. Rahman, M.F.; Mahmud, M.J.; Sadmani, A.H.M.A.; Chowdhury, A.I.; Anderson, W.B.; Bodruzzaman, A.B.M.; et al. Previously unrecognized potential threat to children from manganese in groundwater in Rohingya refugee camps in Cox’s Bazar, Bangladesh. Chemosphere 2021, 266, 129128. [CrossRef]
  90. Michael, A.M. Irrigation theory and practices. Vikash Publishing House Pvt. Ltd., New Delhi 1992, pp 686–740.
  91. Besser, H.; Mokadem, N.; Redhouania, B.; Rhimi, N.; Khlifi, F.; Ayadi, Y.; Omar, Z.; Bouajila, A.; Hamed, Y. GIS-based evaluation of groundwater quality and estimation of soil salinization and land degradation risks in an arid Mediterranean site (SW Tunisia). Arab J Geosci 2017 10:350:. [CrossRef]
  92. Bauder T.A., Waskom R.M., Davis J.G. Irrigation water quality criteria. Colorado State University, US Department of Agriculture 2007.
  93. Costa, J.L.; Aparicio, V.C. Quality assessment of irrigation water under a combination of rain and irrigation. Agric Water Manag 2015, 159:299–306. [CrossRef]
  94. FAO. Water quality for agriculture; irrigation and drainage paper 29 Rev. 1. FAO 1985, Rome 174p.
  95. Vasanthavigar, M.; Srinivasamoorthy, K.; Vijayaragavan, K.; Rajiv Gandhi, R.; Chidambaram, S.; Anandhan, P.; Manivannan, R.; Vasudevan, S. Application of water quality index for groundwater quality assessment: Thirumanimuttar sub-basin, Tamilnadu, India 2010. Environ Monit Assess 2010, 171:595–609. [CrossRef]
  96. Ayers, R.S.; Westcot D.W. Water quality for agriculture. FAO Irrigation and Drainage Paper 1985, 29:1–144.
  97. Nagaraju, A.; Sunil Kumar, K.; Thejaswi, A. Assessment of groundwater quality for irrigation: a case study from Bandalamottu lead mining area, untur District, Andhra Pradesh, South India. Appl Water Sci 2014 4: 385–396. [CrossRef]
  98. Ramesh, K.; Elango L. Groundwater quality and its suitability for domestic and agricultural use in Tondiar river basin, Tamil Nadu, India. J. Environ Monit Assess 2012 184:3887–3899. [CrossRef]
  99. Singha S., Pasupuleti S., Singha S.S., Kumar S. Effectiveness of groundwater heavy metal pollution indices studies by deep-learning. J. Contam. Hydrol 2020. 235, 103718. [CrossRef]
  100. Rahman, M.M.; Islam, M.A.; Bodrud-Doza, M.; et al. Spatio-temporal assessment of groundwater quality and human health risk: a case study in Gopalganj, Bangladesh. Expo Health 2017. [CrossRef]
  101. Sivapalan, M.; Blöschl, G. The growth of hydrological understanding: technologies, ideas, and societal needs shape the field. Water Resources Research, 2017 53 (10), 8137–8146. [CrossRef]
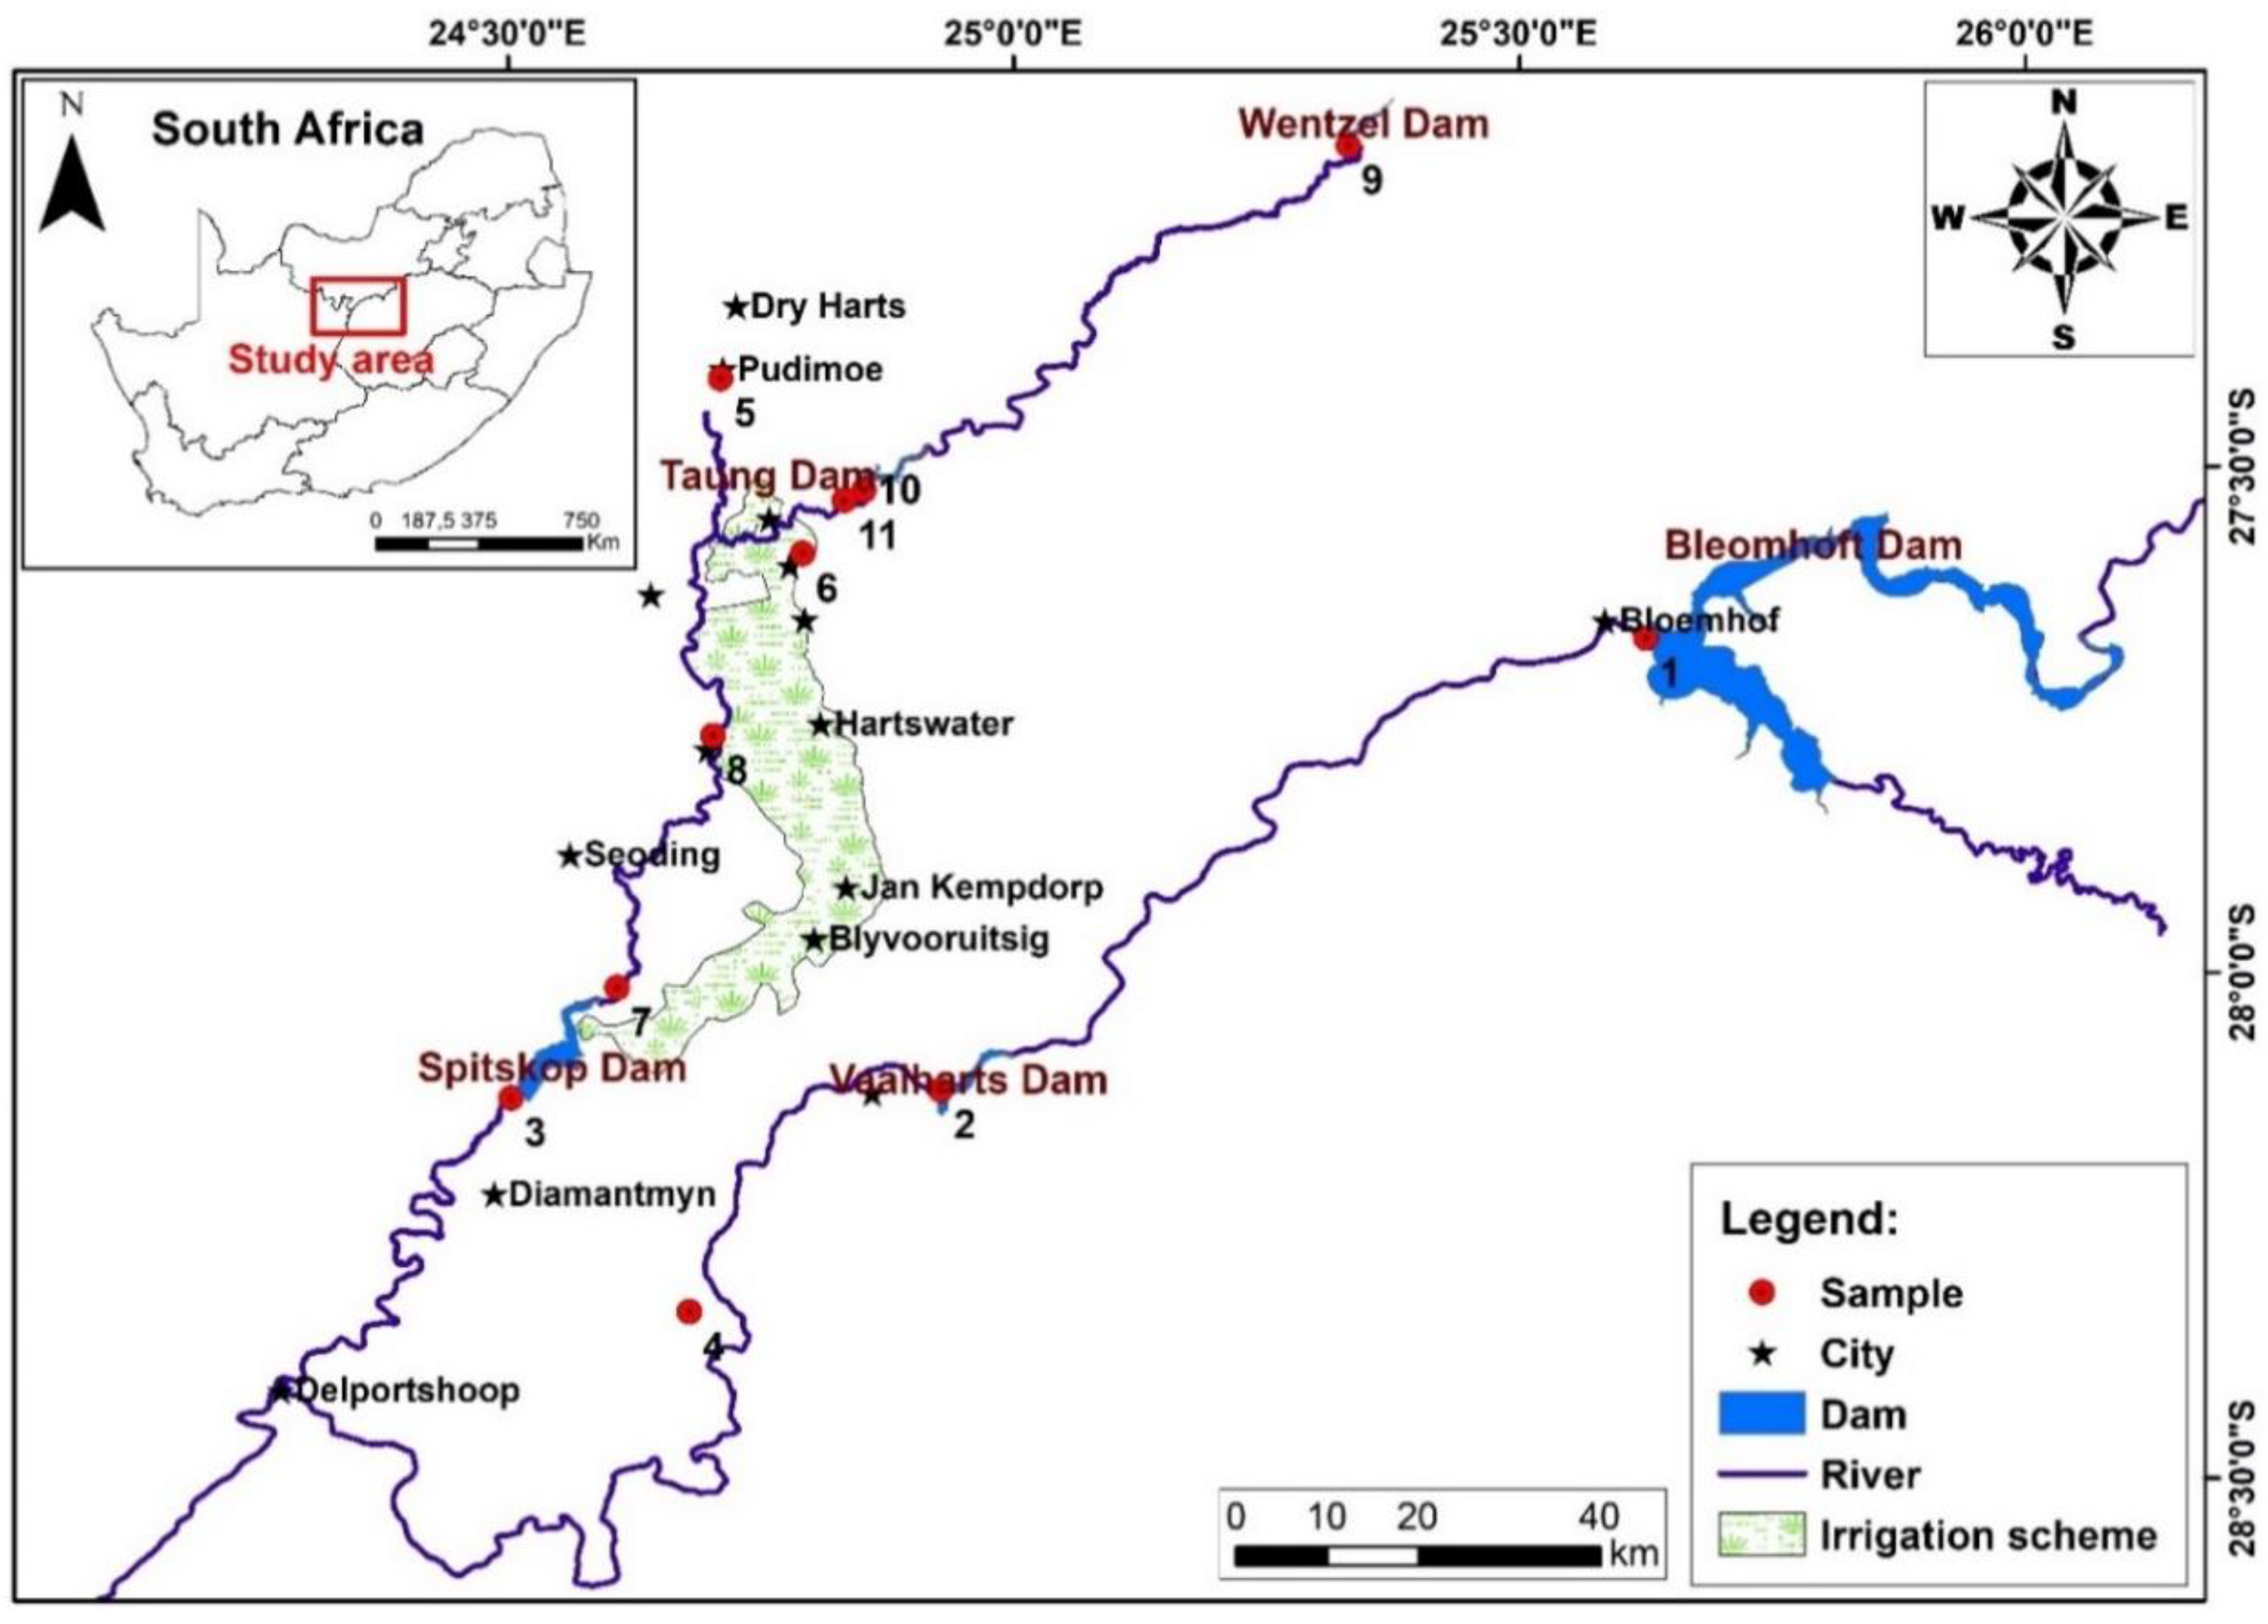
Figure 1. Study area.
Preprints 77401 g001
Figure 3. Spatial distribution of E. coli in the study area .
Preprints 77401 g003
Figure 4. HMPI and HMEI index.
Preprints 77401 g004
Figure 5. Assessment of noncarcinogenic health risks in the study area.
Preprints 77401 g005
Table 1. Classification of groundwater quality based on suitability of water for irrigation purpose.
Criteria Class Water Quality No of samples
Na% < 20 Excellent 11
20-40 Good
40-60 Permissible
60-80 Doudtful
> 80 Unsuitable
SAR < 10 Excellent 11
10--18 Good
18-26 Doudtful
>26 Unsuitable
RSC < 1,25 Good 11
1,25 Doudtful
> 2,5 Unsuitable
MR < 50 Safe 8
> 50 Unsafe 3
PI > 75 Class I
25-75 Class II 8
< 25 Class III 3
KR < 1 Suitable 11
1--2 Marginal suitable
> 2 Unsuitable
PS < 3 Good
3--15 Medium 1
> 15 Not recommended 10
EC <250 low
(μS/cm) 250-750 Medium 9
750-2250 High 2
>2250 Very high
Table 2. WQI classification of the surface water and possible ranges of use [65].
QWI Water quality Possible ranges of uses No of Samples
0-25 Excellent Drinking, irrigation and industrial 1
25-50 Good Domestic, irrigation and industrial 2
50-75 Fair Irrigation and industrial 6
70-100 Poor Irrigation 2
100-150 Very poor Restricted use for irrigation 0
>150 Unfit for drinking Proper treatment is required before use 0
Table 3. The result of surface water based on HMEI and HMPI.
Samples HMEI HMPI
1 4,45 30,5425
2 5,03333333 30,77498
3 5,2375 30,80668
4 0,716 0,264201
5 11,7671429 84,71713
6 12,5838095 84,94176
7 12,7338095 73,34104
8 6,3547619 82,63595
9 0 0
10 7,42072619 102,5304
11 5,70420238 72,07097
Table 4. the result of Heavy metals hazard quotients (HQ) and Hazard index (HI) for both adults and children.
Samples Adult Children
∑HQ ing ∑HQ der HI ∑HQ ing ∑HQ der HI
1 1,069207 2,606938 3,676146 4,945441 76,90968 81,85512
2 1,074481 2,619452 3,693933 4,965578 77,27886 82,24444
3 1,074933 2,620525 3,695458 5,542647 77,3105 82,85315
4 0,034514 0,19821 0,232724 1,282466 5,84758 7,130046
5 1,598265 4,939994 6,538259 7,540822 145,7393 153,2801
6 1,585636 4,492906 6,078542 7,492603 132,5493 140,0419
7 0,603601 4,211413 4,815014 3,743014 124,2447 127,9878
8 1,524092 4,346879 5,870971 5,81926 128,2413 134,0605
9 - - - - - -
10 0,885555 3,492052 4,377607 3,381211 103,0222 106,4034
11 0,68949 2,664164 3,353654 2,632597 78,59795 81,23055
Disclaimer/Publisher’s Note: The statements, opinions and data contained in all publications are solely those of the individual author(s) and contributor(s) and not of MDPI and/or the editor(s). MDPI and/or the editor(s) disclaim responsibility for any injury to people or property resulting from any ideas, methods, instructions or products referred to in the content.
Copyright: This open access article is published under a Creative Commons CC BY 4.0 license, which permit the free download, distribution, and reuse, provided that the author and preprint are cited in any reuse.
Prerpints.org logo

Preprints.org is a free preprint server supported by MDPI in Basel, Switzerland.

Subscribe

© 2024 MDPI (Basel, Switzerland) unless otherwise stated