
Submitted:
25 June 2023
Posted:
26 June 2023
You are already at the latest version
Abstract
'Huangguan' pear has significant social and economic value, and phosphorus, as one of the three main mineral elements of plants, has an irreplaceable effect on the normal growth of 'Huangguan' pear trees. The objective of this study was to predict the content of phosphorus in the pulp and peel of ‘Huangguan’ pears nondestructively and conveniently by using near-infrared spectroscopy (900–1700 nm) technology. First, twelve algorithms are used to preprocess the original spectral data, and the partial least squares regression algorithm and the gradient boosting regression tree algorithm are used to build a full-band prediction model based on the original spectral data and the processed spectral data. The characteristic wavelengths were extracted using genetic algorithms, followed by establishing a characteristic wavelength prediction model. The prediction accuracy of the models was evaluated according to the coefficient of determination R² and the relative analysis error RPD. The study found that the best prediction model for predicting phosphorus content in the pulp of 'Huangguan' pear was MSC-GA-PLSR, which had R²=0.843 and RPD=1.857 in the modelling set and R²=0.989 and RPD=7.041 in the prediction set. The best prediction model for predicting phosphorus content in the peel of ‘Huangguan’ pear was SG+SNV+FD-GA-PLSR, which had R²=0.991 and RPD=7.470 in the modelling set and R²=0.974 and RPD=4.414 in the prediction set, and the effect was good and met expectations. The results demonstrated that near-infrared spectroscopy could successfully achieve nondestructive detection of phosphorus content in the pulp and peel of 'Huangguan' pears.
Keywords:
'Huangguan' pear
; phosphorus
; near-infrared spectroscopy
; modelling
; content prediction
1. Introduction
'Huangguan' pear (Pyrus Bret Schneider Rehd cv. Huangguan) is of excellent quality, and as early as 1997, in China, it passed the examination and approval of the Hebei Province Forest Fine Seed Examination Committee and was put into production. It has been cultivated in a large area in China. In recent years, the 'Huangguan' pear industry in Dangshan County, Anhui Province, has ushered in vigorous development, and the 'Huangguan' pear in Dangshan County has good development prospects. Phosphorus plays an important role in the growth and development of pear fruits [1,2], which can promote the ripening and development of pear fruits and improve the ability of fruit trees to resist cold, drought, and salinity. The imbalance of phosphorus in the fruit of the 'Huangguan' pear may cause consequences such as small fruit, low yield, and reduced appearance quality of fruit, and most of the application of phosphate fertilizer in production is based on production experience, and there is no direct quantitative real-time detection technology. If the phosphorus content in the fruit can be easily measured through nondestructive testing technology during the critical period of ripening of the 'Huangguan' pear and fertilization and other measures can be adjusted accordingly, it will help to improve the yield and quality of the 'Huangguan' pear, thereby promoting the development of the 'Huangguan' pear industry.
For the detection of mineral element content in pear fruit, the commonly used methods are inductively coupled plasma‒mass spectrometry [3,4], atomic absorption spectroscopy [5,6], UV/VIS spectrophotometer measurement [7,8], etc. Although these methods can accurately determine the mineral element content in the fruit, they all require destructive sampling of the sample, which can only be carried out in the laboratory and cannot be directly detected in the field, which is time-consuming and labor-intensive, and it is difficult for farmers to master and apply. If the mineral elements in the pear pulp and peel can be detected in real time during the critical period of pear fruit development, it is undoubtedly of great significance to guide actual production. At present, the detection of fruit mineral elements of 'Huangguan' pear is mainly concentrated on product quality testing in the laboratory, and there is no relevant application that can provide real-time detection data for the fruit growing process.
Compared with traditional mineral element detection and analysis methods, near-infrared spectroscopy detection technology is convenient and fast, does not require destructive sampling, and can detect multiple components at the same time, which has good application prospects [9,10,11]. In 1986, scientists Batten and Blakeney pioneered the use of near-infrared spectroscopy to analyse nitrogen in rice tissue to find optimized fertilization strategies. Jie Wang et al. [12] used visible-near-infrared spectroscopy combined with partial least squares regression to establish a full-band (350 nm ~ 2500 nm) pear leaf N content prediction model and estimated the N content in supplementary topdressing over time to adjust the application measures of nitrogen fertilizer and improve the yield and quality of pear fruit. Maria Cristina A. Costa et al. [13] used the diffuse reflectance spectral region in the near-infrared spectrum combined with partial least squares regression for modelling training and analysis and efficiently predicted the mineral content of Ca, Mg, Zn, P, and K in Brazilian bee pollen, and the determination coefficient R² of the standard model was greater than 0.87, which could replace the previous standard measurement method. C. Lastras et al. [14] used near-infrared spectroscopy combined with the improved partial positive partial least squares regression algorithm to predict the content of major mineral elements Ca, Fe, and Mg and the content of fatty acids in lentils. A large number of experiments have proven that the use of near-infrared spectroscopy technology can achieve nondestructive testing of mineral element content in fruits and vegetables.
Based on near-infrared spectroscopy, this paper takes the pulp and peel of 'Huangguan' pear as the research object and models and predicts the phosphorus content in the pear pulp and peel. According to the sample, the detection value of phosphorus content, the original spectral data and the preprocessed spectral data, respectively, the Partial Least Squares Regression algorithm and the Gradient Boosted Regression Tree algorithm were used to establish a full-band prediction model for phosphorus content in pear pulp and peel, and after preliminary selection, the prediction model with better fitting effect was selected. Then, the characteristic wavelength prediction model was extracted by the Genetic Algorithm, and the characteristic wavelength prediction model was established. Finally, the coefficient of determination R² and the relative analysis error RPD of each model were compared. The best prediction model of phosphorus content in the pulp and peel of 'Huangguan' pear was developed, and the feasibility of near-infrared spectroscopy detection technology in the detection of mineral elements in pear fruit was further analysed to provide guidance for specific production practice.
2. Materials and Methods
2.1. Test Pear Fruit Samples
The pear fruit samples in this experiment were from 18 'Huangguan' pear trees from the fourth team of Dangshan County Horticultural Farm in Suzhou City, Anhui Province (34.442516°N, 116.367097°E), and the plants were in good condition and free of obvious diseases and pests. In early August, the pear fruits were picked and transported back to the laboratory, and 65 samples with good fruit shape, no diseases and pests, and no mechanical damage were selected, and the surface of the fruit was scrubbed and numbered for later use.
2.2. Near-Infrared Spectral Data Acquisition
In this experiment, a reflective miniature handheld near-infrared spectrometer was used to acquire 228 bands in the wavelength range of 900-1700 nm with a spectral resolution of 3.89 nm. The signal-to-noise ratio is 5000:1.
Figure 1.
‘NIR-S-G1’ miniature spectrum acquisition instrument.

In order to accurately reflect the phosphorus content in pear fruit samples, it is necessary to reasonably divide the sampling area. Taking the equatorial line of the fruit as the reference line, the long axis is selected evenly about 7.5 cm,Three elliptical regions with a minor axis of about 5.5 cm, and 5 spectral acquisition points are uniformly selected within each elliptical region, as shown in Figure 2. The spectral data were collected sequentially, and the average of the 5 reflection spectral data was used as the original modeled spectral data of a single elliptical region. After acquisition, spectral data is exported and numbered for later modelling.
2.3. Near-Infrared Spectroscopy Data Preprocessing
Original spectral data are susceptible to environmental interference [15]. The Original spectral data need to be processed, including Savitzky‒Golay convolution smoothing (SG) [16,17], multiple scattering modelling (MSC) [18,19], standard normal variant (SNV) [20], logarithmic transformation (LG) [21], first derivative (FD) [22] and second derivative (SD) [23], SG+SNV, SG+MSC, and SG+MSC, and SG+MSC+SD, SG+MSC+FD, SG+SNV+FD, SG+SNV+FD, SG+SNV+SD, combined with two single preprocessing algorithms or three, to preprocess the original spectral data and analyse the effect of each pretreatment method by trial.
2.4. Characteristic Wavelength Extraction
The collected Original spectral data contain a large amount of internal information about pear fruits, but there are inevitably some wavelengths that are weakly or irrelevant to the target chemical composition in the sample, noise interference is inevitable in the process of collecting spectra, and various factors affect the accuracy of later modelling [24,25]. This trial is based on the genetic algorithm (GA) [26]. The full-band model that meets the prediction standard is extracted from the characteristic wavelength, and then the characteristic wavelength model is established to further optimize the model.
2.5. Detection of Phosphorus Content in Pear Pulp and Peel
After collecting the spectral data of all pear fruit samples, the pulp and peel were sampled within the delimitation range of each pear fruit skin mentioned in Figure 2, packed in zip lock bags, marked with numbers, and sent to Anhui Geological Experiment Institute for the detection of phosphorus contents of mineral elements in the pulp. The detection method was inductively coupled plasma emission spectrometry.
2.6. Establishment of Prediction Models for Phosphorus Content in the Pulp and Peel of 'Huangguan' Pear
In this experiment, A quantitative prediction model for mineral element content in pear fruit was established by partial least squares regression algorithm (PLSR) [27,28,29] and gradient boosted regression tree algorithm (GBRT) [30]. PLSR algorithm has less sample requirements, can handle multi-faceted complex models, can process reflection indicators and formation indicators at the same time, and can realize multiple linear regression analysis, principal component analysis and correlation analysis between two sets of variables at the same time, which is suitable for establishing predictive models. GBRT algorithm is a decision tree-based boosting algorithm, which can process various numerical and categorical large features as well as continuous and discrete target variables, and has certain robustness to abnormal data and outliers, and can better predict the target variable.
2.7. Model Effect Evaluation Indicators
This paper uses the coefficient of determination (R²) and residual prediction deviation (RPD) as the evaluation index of model grade, wherein the range of the coefficient of determination is (0,1), the closer the coefficient of determination to 1 indicates that the model fitting effect is better, the residual prediction deviation, also known as relative analysis error, is the ratio of standard deviation (SD) to the root mean square error of prediction (RMSEP).
According to the RPD evaluation level proposed by Chang et al. [28], the prediction ability of the model was evaluated: when the ERPD ≥ 2 and R² ≥ 0.8, the model prediction effect is very good, and the model belongs to the Class A model, which can be applied to the corresponding quantitative prediction. When 1.4 ≤ ERPD <2 and 0.5 ≤ R² < 0.8, the predictive ability of the model is medium, and the model belongs to the Class B model. When the ERPD < 1.4 and R² < 0.5, the model prediction effect is relatively poor, and the model belongs to the C class model and cannot be applied to quantitative prediction.
3. Results
3.1. Analysis of Phosphorus Content Detection in the Pulp and Peel of 'Huangguan' Pear
The reasonable division of samples has an important impact on the accuracy of the later model [31]. In this paper, The 65 pear pulp and peel phosphorus content test samples were randomly divided into a model set and a prediction set with a ratio of 8:2. The modelling set had a total of 52 samples, and the prediction set had a total of 13 samples. The division of subsequent modelling sets and prediction sets is also based on the KS sample division method. Table 1 shows that the data distribution of the two sample sets has a certain gradient, and the mean and standard deviation of the samples of the modelling set and the prediction set are relatively close, which shows the modelling set and the verification set. The data distribution structure is similar, which is conducive to the rational interpretation of the prediction results. However, it can also be seen that the phosphorus content of the peel in this sample is generally higher than the phosphorus content in the pulp, and the phosphorus data in the peel are more discrete.
3.2. Original Spectral Data Analysis
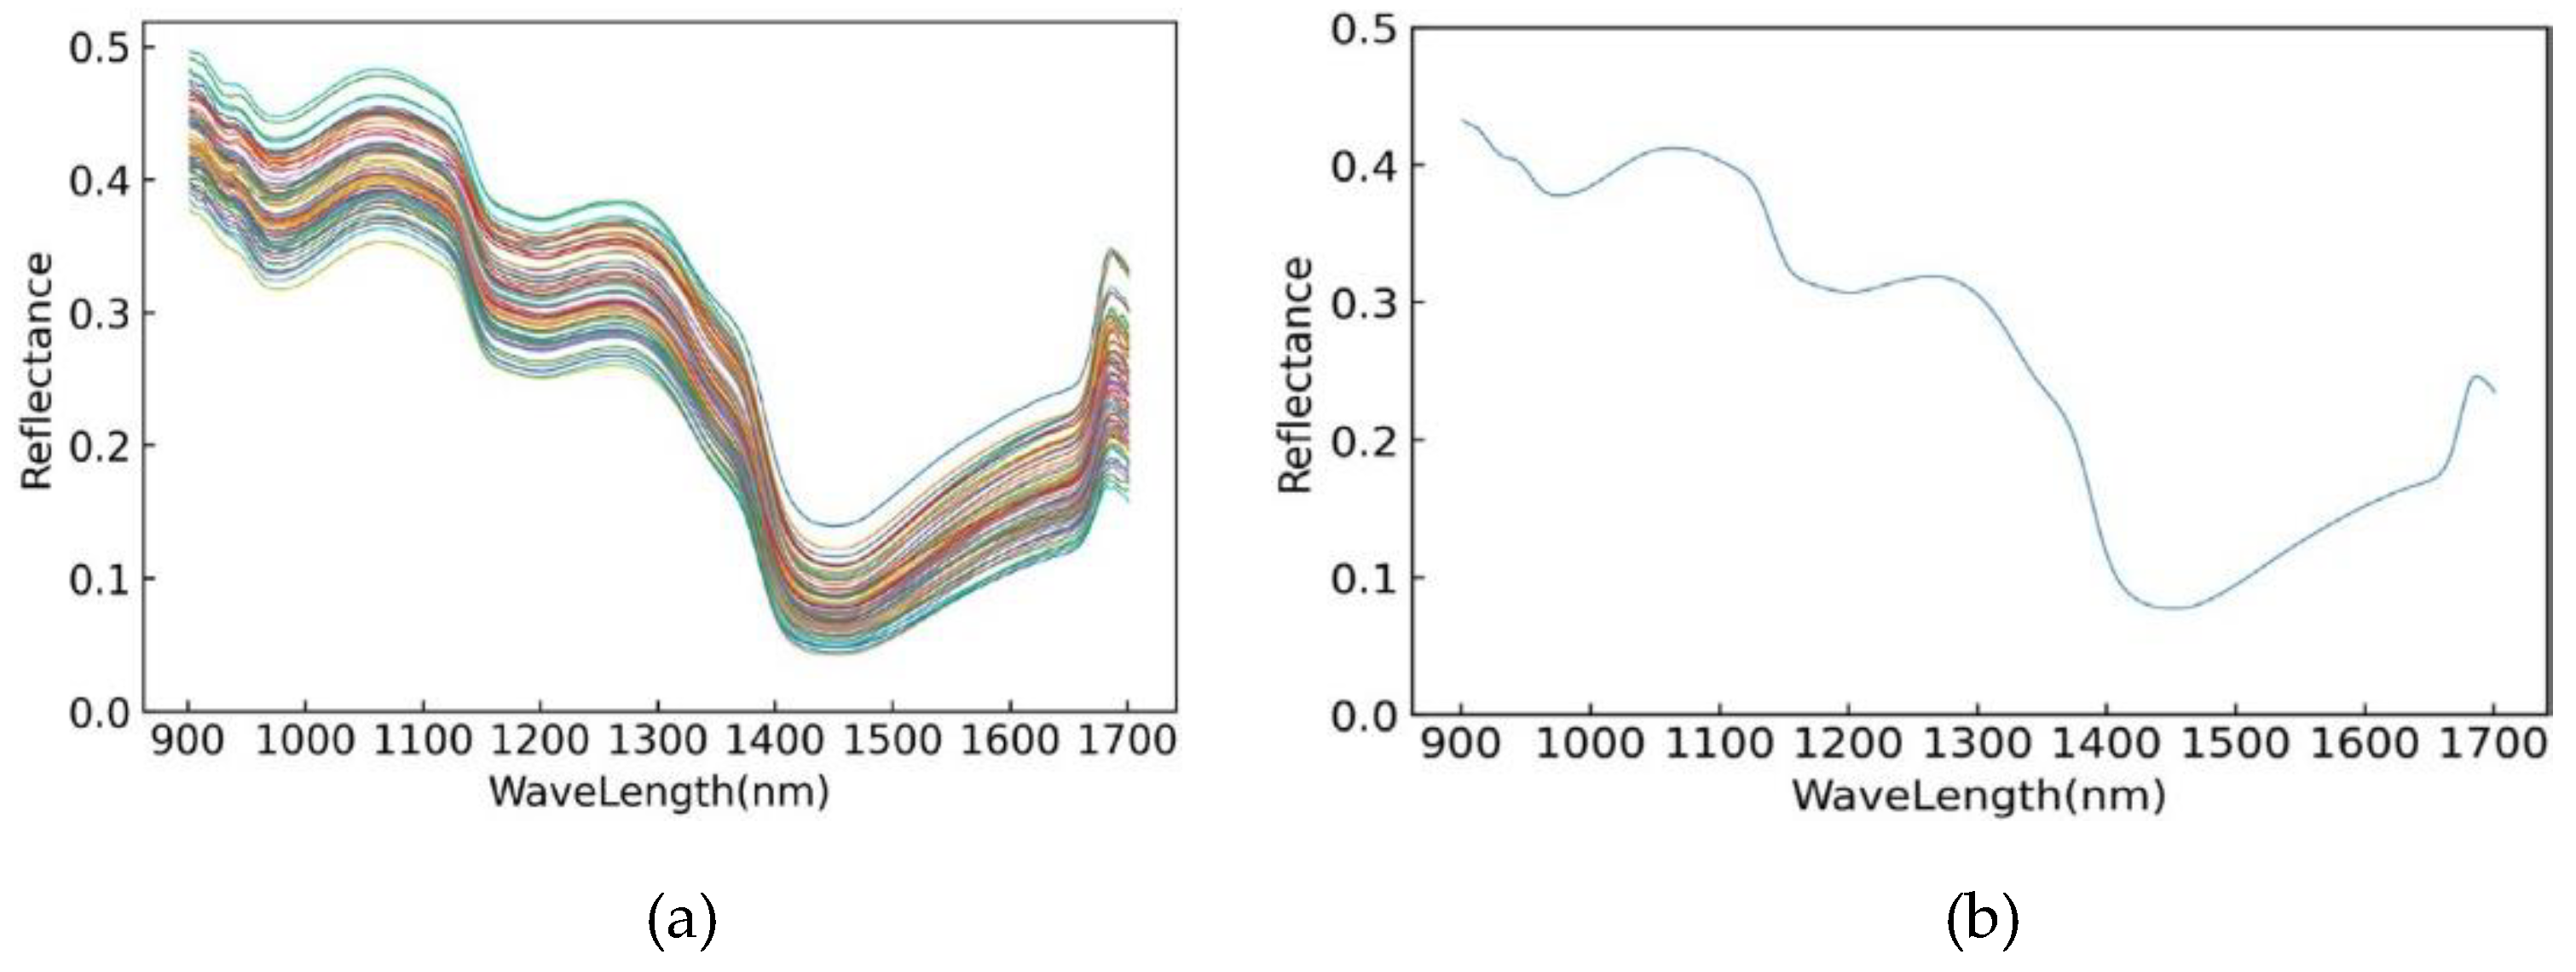
According to the above experiment, the following original spectral curve and average spectral curve can be obtained. Overall, the original spectral curves reflect similarity in the reflectance spectral data of all samples, with small differences from sample to sample, indicating that the samples contained similar levels of mineral elements. The reflectance spectral data reached maximum and minimum values at wavelengths of approximately 900 nm and 1450 nm, respectively, and the spectral curves had obvious curve troughs at 960 nm, 1200 nm, 1440 nm, and 1680 nm and peaks at 1050 nm, 1260 nm and 1680 nm, which may be related to the compounds in pear fruits. The entire spectral curve richly reflects the internal information of the pear fruit.
Figure 3.
Original spectral reflectance map (a) and average spectral reflectance map (b) of all tested ‘Huangguan’ pears.
Figure 3.
Original spectral reflectance map (a) and average spectral reflectance map (b) of all tested ‘Huangguan’ pears.
3.3. Analysis of Spectral Data Preprocessing Results
The spectral curve obtained after 12 pretreatment methods is shown in Figure 4.
According to the specific effect map, it can be seen that the spectral data after SG treatment are smoother because SG can remove some irrelevant noise based on the original spectral data, and the spectral data after MSC and SNV pretreatment can reduce the scattering effect caused by uneven particle distribution and different particle sizes on the sample surface. However, the corresponding noise influence of the spectral curve after derivative processing also increases, the signal-to-noise ratio decreases, and the second-derivative processing even produces a more severe noise impact than the first-derivative processing.
3.4. Full-Band Modelling
In this paper, the partial least squares regression (PLSR) algorithm and the gradient boosting regression tree (GBRT) algorithm were used to establish a prediction model for mineral content.
Based on the original spectral data and 12 preprocessed spectral data, according to the PLSR algorithm and GBRT algorithm, a total of 52 prediction models for predicting phosphorus content in pear pulp and peel were established, and the R² and RPD of the prediction sets and modelling sets were used as the evaluation index. The specific results are shown in Table 2 and Table 3.
3.4.1. Full-Band Modelling for Pear Pulp
According to the results of the above 13 prediction models with the PLSR algorithm, it can be seen that the R² of the Original-PLSR prediction model is 0.621, the RPD is 1.276, and the model grade is C, which cannot be directly used for quantitative prediction, while the four predictive models of MSC-PLSR, SNV-PLSR, SG+SNV-PLSR, SG+MSC-PLSR have met level B, which can be used as predictive models, indicating that MSC, SNV, SG+SNV, SG+MSC treatment has a good modelling effect for the original spectral curve. From the results, the pretreatment of the original spectral curve is not that the more pretreatment methods are superimposed, the better the effect, and the optimal treatment needs to be further judged.
Based on the original spectral data and the spectral data after 12 preprocessing steps, according to the GBRT algorithm, a total of 13 prediction models for predicting phosphorus content in pear pulp were established, and the R² and RPD of the prediction set and modelling set were used as the evaluation indicators. None of the 13 modelling models met the criteria for quantitative prediction, which proved that GBRT was not suitable for constructing a prediction model of phosphorus in pear pulp under these experimental conditions.
3.4.2. Full-Band Modelling for Pear Peel
It can be seen from the modelling results that the original spectral data cannot be directly used for the modelling and prediction of the phosphorus content of pear peel under this experimental condition, and some preprocessing can improve the fitting effect of the prediction model, among which were the 13 prediction models established by the PLSR algorithm, FD-PLSR, SG+SNV+FD-PLSR, which reached level B. None of the 13 modelling models established by met the criteria for quantitative prediction, which proved that GBRT was not suitable for constructing a prediction model of phosphorus in pear peel under this experimental condition. The prediction results show that the modelling effect of spectral data after preprocessing is not necessarily better than that of the original spectral data modelling, and pretreatment can improve the accuracy of the prediction model but needs to be further verified by experiments.
3.5. Extraction of Characteristic Wavelengths
According to the above research results for predictive models that predict phosphorus content in pear pulp, the PLSR model established by eight pretreatments, FD, SD, SG, LG, SG+MSC+FD, SG+MSC+SD, SG+SNV+FD, SG+SNV+SD, did not meet the quantitative prediction criteria and was not suitable for the prediction of phosphorus content of 'Huangguan' pear pulp, and the 13 prediction models established by GBRT did not meet the prediction criteria and were not suitable for prediction. MSC-PLSR, SNV-PLSR, SG+SNV-PLSR, SG+MSC-PLSR, the four prediction models initially meet the prediction standards, and for predictive models that predict phosphorus content in pear peel, FD-PLSR, SG+SNV+FD-PLSR, the two models initially reached the prediction standard of phosphorus content in pear peel, and the remaining 24 prediction models did not meet the prediction standard and were not suitable as prediction models. GA is used to process the characteristic wavelengths to further optimize the prediction models.
3.5.1. Extraction of Characteristic Wavelengths for Pear Pulp

Table 4.
Extraction results of the characteristic spectral data of the pear pulp phosphorus content prediction model.
Table 4.
Extraction results of the characteristic spectral data of the pear pulp phosphorus content prediction model.
| Feature Extraction Methods | Models | Extract the Number of Characteristic Wavelengths | Specific Characteristic Band/nm |
|---|---|---|---|
| GA | SNV-PLSR | 114 | 909.36, 913.25, 917.14, 924.89, 933.92, 937.78, 941.64, 945.50, 953.19, 960.87, 969.80, 977.45, 981.26, 985.07, 992.68, 1009.10, 1012.88, 1020.43, 1024.19, 1031.71, 1044.21, 1062.87, 1070.30, 1082.65, 1086.34, 1097.41, 1101.08, 1104.76, 1108.43, 1116.98, 1124.29, 1131.58, 1135.22, 1138.85, 1154.56, 1161.78, 1165.38, 1168.98, 1179.76, 1184.53, 1195.25, 1198.82, 1209.49, 1213.03, 1221.30, 1228.36, 1235.41, 1245.94, 1249.45, 1254.11, 1261.10, 1268.06, 1278.48, 1285.41, 1290.02, 1296.91, 1300.36, 1303.79, 1307.23, 1310.66, 1314.08, 1317.50, 1322.06, 1335.68, 1339.07, 1363.83, 1367.19, 1380.58, 1395.02, 1414.87, 1429.11, 1438.93, 1478.88, 1482.09, 1489.56, 1492.76, 1495.95, 1505.50, 1511.85, 1516.07, 1522.39, 1525.54, 1528.69, 1531.84, 1538.11, 1544.37, 1548.54, 1551.65, 1560.98, 1573.36, 1580.55, 1583.62, 1586.69, 1589.76, 1592.82, 1595.88, 1601.98, 1609.08, 1615.14, 1618.17, 1624.21, 1627.22, 1630.23, 1633.23, 1640.23, 1643.22, 1646.21, 1649.19, 1652.17, 1655.14, 1661.08, 1667.98, 1673.88, 1698.27 |
| MSC-PLSR | 119 | 909.36, 921.02, 924.89, 937.78, 957.03, 960.87, 964.70, 981.26, 988.88, 992.68, 996.48, 1000.27, 1005.32, 1012.88, 1016.66, 1020.43, 1024.19, 1031.71, 1035.47, 1039.22, 1051.68, 1062.87, 1066.58, 1070.30, 1074.01, 1086.34, 1104.76, 1120.63, 1131.58, 1138.85, 1142.48, 1146.11, 1150.94, 1154.56, 1158.17, 1165.38, 1168.98, 1176.17, 1179.76, 1184.53, 1188.11, 1198.82, 1205.93, 1209.49, 1216.58, 1221.30, 1224.83, 1235.41, 1238.92, 1242.44, 1254.11, 1257.61, 1261.10, 1275.02, 1278.48, 1281.95, 1300.36, 1317.50, 1328.87, 1332.28, 1335.68, 1339.07, 1342.46, 1345.85, 1363.83, 1367.19, 1377.24, 1380.58, 1391.69, 1395.02, 1398.34, 1401.65, 1404.96, 1411.57, 1422.55, 1425.83, 1438.93, 1453.04, 1456.28, 1459.52, 1469.22, 1472.44, 1486.36, 1489.56, 1492.76, 1499.14, 1502.32, 1508.68, 1516.07, 1525.54, 1528.69, 1544.37, 1554.77, 1560.98, 1567.18, 1577.47, 1586.69, 1595.88, 1598.93, 1601.98, 1618.17, 1621.19, 1624.21, 1627.22, 1630.23, 1633.23, 1637.23, 1640.23, 1643.22, 1649.19, 1652.17, 1665.02, 1676.82, 1679.76, 1682.70, 1688.55, 1691.47, 1698.27, 1701.18 | |
| SG+MSC-PLSR | 114 | 909.36, 921.02, 941.64, 945.50, 953.19, 960.87, 964.70, 969.80, 992.68, 996.48, 1000.27, 1009.10, 1012.88, 1016.66, 1020.43, 1024.19, 1031.71, 1039.22, 1044.21, 1055.42, 1059.14, 1062.87, 1066.58, 1070.30, 1078.95, 1082.65, 1090.04, 1093.72, 1104.76, 1108.43, 1131.58, 1135.22, 1146.11, 1150.94, 1154.56, 1165.38, 1168.98, 1179.76, 1184.53, 1188.11, 1191.68, 1198.82, 1202.38, 1205.93, 1209.49, 1213.03, 1221.30, 1231.88, 1238.92, 1242.44, 1249.45, 1257.61, 1264.58, 1268.06, 1281.95, 1293.47, 1300.36, 1303.79, 1307.23, 1314.08, 1322.06, 1328.87, 1332.28, 1342.46, 1345.85, 1352.60, 1373.89, 1383.92, 1388.36, 1391.69, 1395.02, 1398.34, 1401.65, 1414.87, 1418.16, 1422.55, 1425.83, 1429.11, 1432.39, 1445.45, 1453.04, 1456.28, 1459.52, 1462.76, 1475.66, 1478.88, 1482.09, 1489.56, 1508.68, 1516.07, 1522.39, 1525.54, 1534.98, 1548.54, 1551.65, 1570.27, 1577.47, 1583.62, 1586.69, 1595.88, 1598.93, 1615.14, 1621.19, 1624.21, 1627.22, 1633.23, 1643.22, 1649.19, 1652.17, 1655.14, 1661.08, 1676.82, 1679.76, 1691.47 | |
| SG+SNV-PLSR | 108 | 905.47, 909.36, 917.14, 924.89, 945.50, 953.19, 960.87, 969.80, 981.26, 985.07, 996.48, 1005.32, 1009.10, 1016.66, 1020.43, 1024.19, 1027.96, 1031.71, 1039.22, 1047.95, 1055.42, 1070.30, 1074.01, 1082.65, 1086.34, 1090.04, 1093.72, 1116.98, 1120.63, 1150.94, 1161.78, 1165.38, 1172.58, 1176.17, 1179.76, 1184.53, 1188.11, 1191.68, 1195.25, 1202.38, 1205.93, 1213.03, 1216.58, 1221.30, 1224.83, 1228.36, 1264.58, 1268.06, 1275.02, 1278.48, 1300.36, 1310.66, 1314.08, 1328.87, 1332.28, 1345.85, 1352.60, 1370.54, 1373.89, 1380.58, 1383.92, 1391.69, 1404.96, 1414.87, 1418.16, 1422.55, 1425.83, 1429.11, 1435.66, 1462.76, 1465.99, 1472.44, 1478.88, 1482.09, 1486.36, 1489.56, 1495.95, 1519.23, 1522.39, 1528.69, 1531.84, 1534.98, 1538.11, 1544.37, 1548.54, 1551.65, 1554.77, 1557.88, 1560.98, 1567.18, 1577.47, 1580.55, 1586.69, 1598.93, 1612.11, 1615.14, 1618.17, 1621.19, 1624.21, 1633.23, 1640.23, 1646.21, 1649.19, 1658.11, 1667.98, 1670.93, 1673.88, 1676.82, 1682.70, 1688.55 |
Using the genetic algorithm, 114, 119, 114, and 108 characteristic spectra were extracted from the spectral curves preprocessed by SNV, MSC, SG+SNV, and SG+MSC, respectively, and the extraction points under the spectrum are shown in Figure 5.
According to Figure 5, the extracted spectral points have no obvious regular distribution on the original spectral curve, but most of them are concentrated between 900 nm~1100 nm, 1150 nm~1300 nm, and 1500 nm~1650 nm. Although the four spectral extracted characteristic wavelength points are different, most of them are concentrated in the above three regions, indicating that the wavelength interval reflects most of the spectral information.
3.5.2. Extraction of Characteristic Wavelengths for Pear Peel
Table 5.
Traction results of the characteristic spectral data of the pear peel phosphorus content prediction model.
Table 5.
Traction results of the characteristic spectral data of the pear peel phosphorus content prediction model.
| Feature Extraction Methods | Models | Extract the Number of Characteristic Wavelengths | Specific Characteristic Band/nm |
|---|---|---|---|
| GA | FD-PLSR | 111 | 901.57, 917.14, 924.89, 941.64, 953.19, |
| 957.03, 960.87, 964.70, 969.80, 981.26, | |||
| 988.88, 992.68, 1005.32, 1009.10, 1016.66, | |||
| 1024.19, 1027.96. 1051.68, 1059.14, 1062.87, | |||
| 1070.30, 1074.01, 1078.95, 1090.04, 1101.08, | |||
| 1108.43, 1116.98, 1124.29, 1135.22, 1146.11, | |||
| 1158.17, 1176.17, 1179.76, 1209.49, 1213.03, | |||
| 1216.58, 1221.30, 1249.45, 1257.61, 1261.10, | |||
| 1268.06, 1278.48, 1285.41, 1290.02, 1296.91, | |||
| 1307.23, 1310.66, 1322.06, 1335.68, 1357.10, | |||
| 1363.83, 1367.19, 1373.89, 1377.24, 1380.58 , | |||
| 1395.02, 1401.65, 1404.96, 1408.27, 1418.16, | |||
| 1422.55, 1425.83, 1429.11, 1432.39, 1442.19, | |||
| 1448.70, 1456.28, 1459.52, 1462.76, 1472.44, | |||
| 1489.56, 1492.76, 1495.95, 1499.14, 1505.50, | |||
| 1516.07, 1525.54, 1531.84, 1538.11, 1541.25, | |||
| 1548.54, 1551.65, 1554.77, 1567.18, 1570.27, | |||
| 1583.62, 1592.82, 1609.08, 1615.14, 1618.17, | |||
| 1621.19 ,1624.21, 1627.22, 1637.23, 1643.22, | |||
| 1655.14, 1661.08, 1665.02, 1673.88, 1691.47, | |||
| 1695.36, | |||
| SG+MSC+FD-PLSR | 111 | 909.36, 913.25, 921.02, 930.06, 933.92, | |
| 937.78, 941.64, 953.19, 957.03, 969.80, | |||
| 973.63, 977.45, 981.26, 985.07, 992.68, | |||
| 1016.66, 1020.43, 1027.96, 1035.47, 1039.22, | |||
| 1044.21, 1047.95, 1051.68, 1055.42, 1062.87, | |||
| 1066.58, 1070.30, 1086.34, 1093.72, 1112.10, | |||
| 1116.98, 1120.63, 1124.29, 1138.85, 1150.94, | |||
| 1172.58, 1176.17, 1179.76, 1184.53, 1191.68, | |||
| 1209.49, 1213.03, 1221.30, 1235.41, 1242.44, | |||
| 1245.94, 1249.45, 1254.11, 1264.58, 1268.06, | |||
| 1271.54, 1275.02, 1278.48, 1285.41, 1290.02, | |||
| 1296.91, 1314.08, 1317.50, 1322.06, 1325.47, | |||
| 1339.07, 1357.10, 1360.47, 1367.19, 1383.92, | |||
| 1388.36, 1395.02, 1401.65, 1414.87, 1422.55, | |||
| 1425.83, 1429.11, 1438.93, 1445.45, 1448.70, | |||
| 1456.28, 1462.76, 1472.44, 1482.09, 1489.56, | |||
| 1495.95, 1502.32, 1508.68, 1511.85, 1522.39, | |||
| 1531.84, 1534.98, 1541.25, 1554.77, 1557.88, | |||
| 1567.18, 1577.47, 1589.76, 1592.82, 1609.08, | |||
| 1618.17, 1621.19, 1624.21, 1627.22, 1630.23, | |||
| 1637.23, 1640.23, 1643.22, 1646.21, 1652.17, | |||
| 1661.08, 1665.02, 1670.93, 1673.88, 1676.82, | |||
| 1685.63 |
The genetic algorithm was used to extract the characteristic wavelengths of the two models that preliminarily matched the prediction of phosphorus in the peel, namely, the FD-PLSR and SG+MSC+FD-PLSR models, and 111 characteristic wavelength points were extracted from both models. The distribution of the specific characteristic wavelength extraction points is shown in Figure 6.
As shown in Figure 6, the GA algorithm performs feature extraction on the spectra pretreated by the FD and SG+MSC+FD methods and extracts 111 characteristic spectral points. For the spectrum after FD pretreatment, the extracted characteristic spectral points are mainly concentrated in the intervals of 950-1100 nm, 1200-1300 nm, and 1450-1650 nm. For the spectrum after SG+MSC+FD pretreatment, the characteristic spectrum extraction points are mainly concentrated between 1000-1100 nm and 1300-1650 nm, and the intervals of the extracted characteristic spectral sites after the two pretreatments are roughly the same, indicating that these spectral bands contain the main characteristic information for predicting phosphorus content in the peel.
3.6. Characteristic Wavelength Modelling
Based on the above results, a total of 4 models initially meet the standard of predicting the phosphorus content in the pulp of ‘Huangguan’ pear, namely, MSC-PLSR, SNV-PLSR, SG+SNV-PLSR, and SG+MSC-PLSR. There are two models that initially meet the standard of predicting phosphorus content in the peel, namely, FD-PLSR and SG+MSC+FD-PLSR. The following will be modelled and model evaluated by the data extracted by the GA algorithm, and the specific results are as follows.
3.6.1. Characteristic Wavelength Modelling of Phosphorus Content in Pear Pulp
Table 6.
Modelling results of phosphorus content of pear pulp based on characteristic wavelengths.
| Feature Extraction Methods | Models | Modelling Set | Prediction Set | Level of Models | ||
|---|---|---|---|---|---|---|
| R² | RPD | R² | RPD | |||
| GA | SNV-PLSR | 0.806 | 1.690 | 0.988 | 6.483 | A |
| MSC-PLSR | 0.843 | 1.857 | 0.989 | 7.041 | A | |
| SG+MSC-PLSR | 0.786 | 1.619 | 0.987 | 6.152 | A | |
| SG+SNV-PLSR | 0.672 | 1.351 | 0.995 | 10.447 | A | |
After the models were extracted by GA features, the four prediction models obtained reached the A prediction grade, which can be used to predict the phosphorus content in the pulp of the 'Huangguan' pear.
Figure 7.
Model prediction of phosphorus content in pear pulp sample. (a) SNV-GA-PLSR; (b) MSC-GA-PLSR; (c) SG+MSC-GA-PLSR; (d) SG+SNV-GA-PLSR.
Figure 7.
Model prediction of phosphorus content in pear pulp sample. (a) SNV-GA-PLSR; (b) MSC-GA-PLSR; (c) SG+MSC-GA-PLSR; (d) SG+SNV-GA-PLSR.
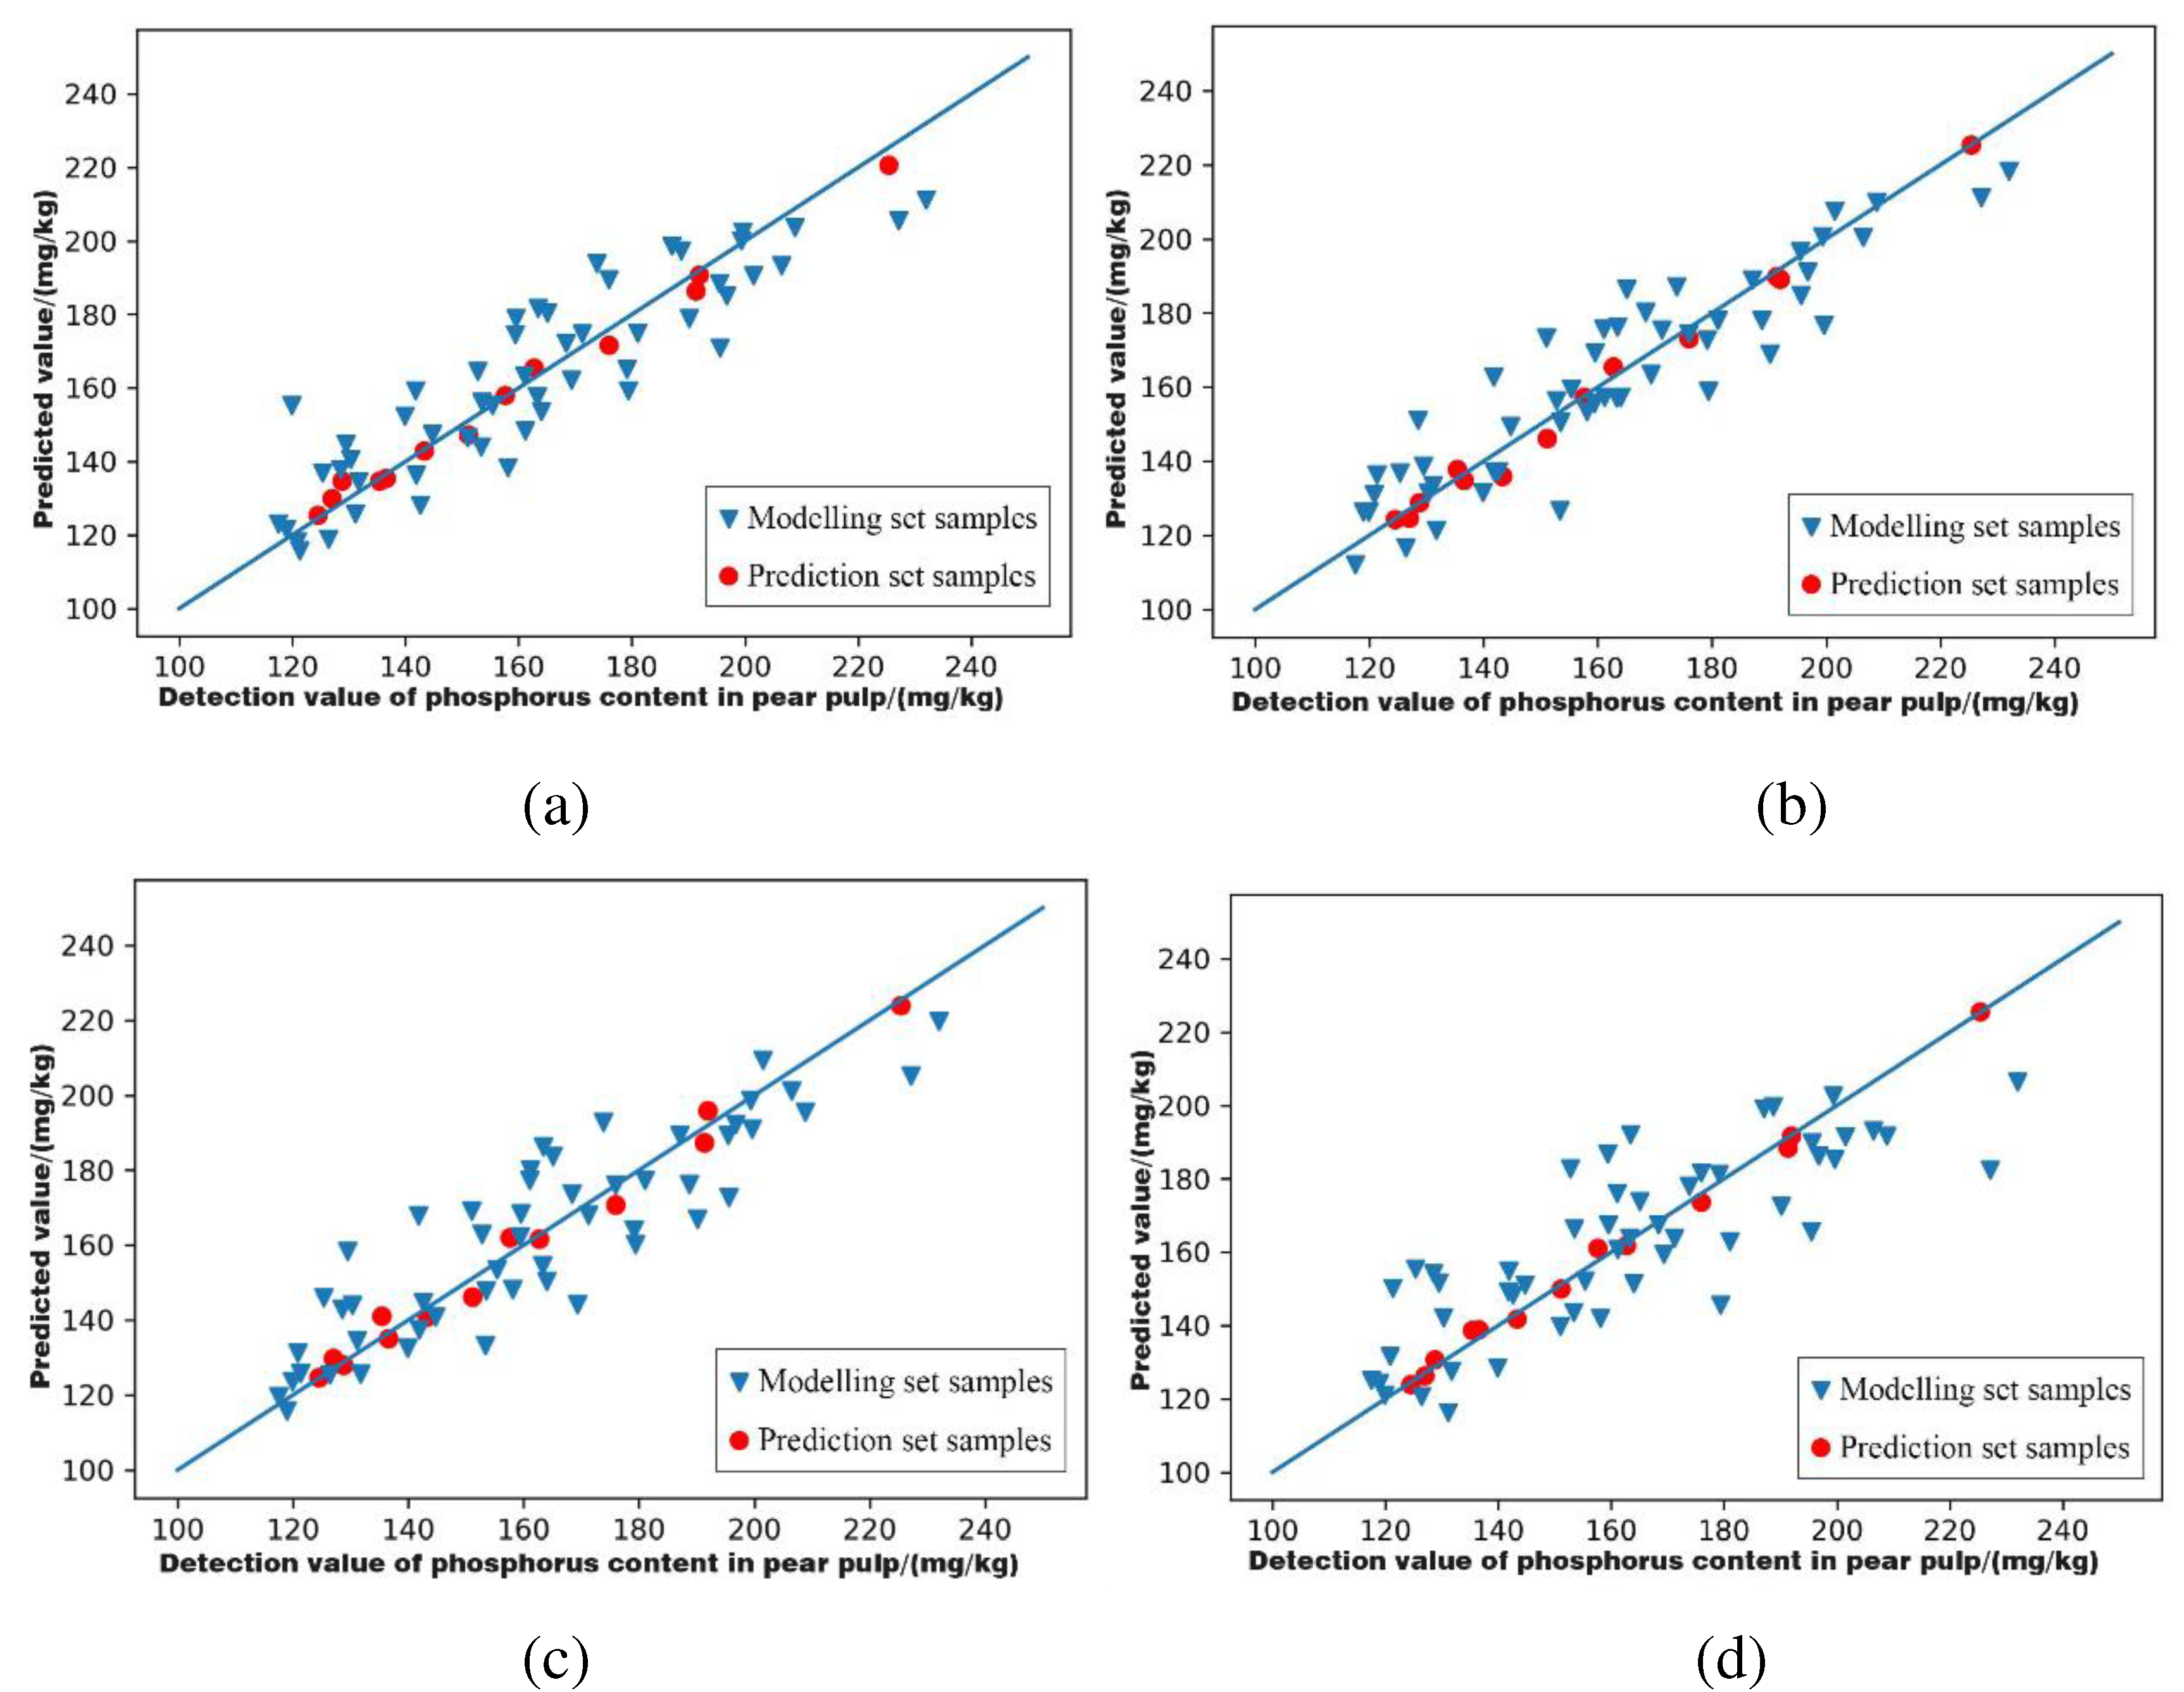
As shown in Figure 6, the data for both the modelling and prediction sets are distributed near the regression line, indicating that the model fits well.
3.6.2. Characteristic Wavelength Modelling of Phosphorus Content in Pear Peel
Table 7.
Modelling results of phosphorus content of pear peel based on characteristic wavelengths.
| Feature Extraction Methods | Models | Modelling Set | Prediction Set | Level of Models | ||
|---|---|---|---|---|---|---|
| R2 | RPD | R2 | RPD | |||
| GA | FD-PLSR | 0.986 | 5.997 | 0.959 | 3.529 | A |
| SG+MSC+FD-PLSR | 0.991 | 7.47 | 0.974 | 4.414 | A | |
It can be seen from the table that the accuracy of the model extracted by the GA algorithm has been significantly improved, and both models have reached grade A.
As shown in Figure 8, both the modelling set data and the prediction set data are distributed near the regression line, and the model fits well.
From the above analysis and comparison, it can be seen that for this sample condition, the optimal prediction model of mineral element phosphorus content in the pulp of 'Huangguan' pear is to use the GA algorithm to extract characteristic wavelengths from the spectral data curve preprocessed by MSC, and then combine the prediction model established by PLSR method - MSC-GA-PLSR, modelling set of R²=0.843, RPD=1.857, prediction set R²=0.989, RPD=7.041, the fitting effect of the Prediction set is slightly better than the Modelling set, the Prediction set meets the prediction criteria of the class A model, and the prediction effect is the best in the above four models. The best model for predicting phosphorus content in the peel was after SG+MSC+FD pretreatment. Using GA feature extraction and then the model established by PLSR, the modelling set was R²=0.991, RPD=7.47, and the prediction set was R²=0.974. RPD=4.414, the modelling set and the prediction set have achieved good results and can be used as predictive models.
4. Discussion
As one of the three major mineral elements, phosphorus plays a very important role in the growth of the 'Huangguan' pear. Phosphorus can promote flower bud differentiation, help the growth and development of pear fruits, and improve the ability of pear fruit trees to resist cold, drought, and salinity [32]. The rationality of phosphorus content in pear fruit trees is a necessary condition for achieving abundant and excellent production in the pear industry. Timely detection of phosphorus content in the pulp of 'Huangguan' pear and adjustment of fertilization, bagging, and other measures are of great significance to the improvement of fruit quality in the later stage. Compared with the traditional laboratory physical and chemical detection methods, this paper focuses on the visible near-infrared (900 nm~1700 nm) spectroscopy technology that has great potential in nondestructive testing in recent years, and takes 65 'Huangguan' pear pulp with good growth in Dangshan County, Anhui Province as test samples The 12 methods include Savitzky‒Golay convolutional smoothing (SG), Multiple Scattering Modelling (MSC), and Standard Normal Transformation Standard Normal Variety (SNV), Logarithmic Transformation (LG), First Derivative (FD), Second Derivative Transformation Second Derivative, SD), two single preprocessing algorithms combining SG+SNV, SG+MSC, and three single preprocessing methods combining SG+MSC+SD, SG+MSC+FD, SG+SNV+FD, SG+SNV+SD, SG+SNV+SD to preprocess the original spectral data and then use Partial Least Squares Regression (PLSR) and Gradient Boosting Regression Tree (GBRT), To establish a prediction model for mineral element content, establish a full-band prediction model, and preliminarily screen out four prediction models for pulp, two prediction models for peel that meet the prediction criteria, and then extract the characteristic wavelength through Genetic Algorithms (GA), establish a characteristic wavelength prediction model, and further improve the accuracy of the model.
After research and evaluation, the prediction effect of MSC-GA-PLSR on phosphorus content in pear pulp was the best among all established models, and the R²=0.843 and RPD=1.857 of the modelling set were the prediction set R²=0.989, RPD=7.041. The prediction effect of SG+MSC+FD-GA-PLSR on phosphorus content in pear peel was the best among all established models, and the R²=0.991 and RPD=7.470 of the modelling set were the prediction set R²=0.974, RPD=4.41. The simulations established by GBRT did not meet the prediction criteria, indicating that GBRT was not suitable for predicting phosphorus content in ‘Huangguan’ pear fruits under these experimental conditions. At the same time, in this experiment, in addition to using the GA algorithm to make the characteristic wavelength data of the spectral band, we also tried to use the differential evolution algorithm to make the characteristic wavelength, but to achieve good results, the model fitting effect after the differential evolution algorithm extracted the characteristic wavelength decreased. In the extraction of feature wavelengths, we can see that the extraction of feature wavelengths after different pretreatments is slightly different, but most of the extracted feature wavelengths are concentrated between 900 nm~1100 nm, 1150 nm~1300 nm, and 1500 nm~1650 nm, indicating that the spectral information related to the phosphorus content in 'Huangguan' pear may be concentrated between these three bands. The literature shows [33] that in the range of 900 nm~1700 nm, there are some chemical bonds with saturation activity, such as X-H bonds, C=O bonds of esters, and C=N bonds of amines. Given the lack of research on the detection of mineral elements in pear fruit, this test can provide some theoretical reference for the detection of mineral elements in pear fruit by near-infrared spectroscopy.
5. Conclusions
The results of this paper prove that the nondestructive prediction of phosphorus content in the pulp and peel of 'Huangguan' pear can be quickly and accurately achieved by near-infrared spectroscopy. This study can provide part of the theoretical basis for near-infrared spectroscopy in the nondestructive detection of mineral elements in the '‘Huangguan’' pear fruit, and subsequent research will further expand the number and range of samples and further improve the universality and accuracy of the model. A variety of pear fruit samples will be used to determine the mineral element content of N, K, Ca, Fe and so on, to construct a broad, comprehensive pear fruit mineral element detection model, combined with a computer, small portable near-infrared spectrometer, build a variety of models, further realize field direct detection, will Test theory is applied to actual production.
Author Contributions
Conceptualization, L.JL., and J.F. ; Methodology, L.L. ; Software, X.J. ; Validation, C.L., H.Z. ; Formal Analysis, J.X. ; Investigation, B.J. ; Resources, L.L. ; Data Curation, F.J. ; Writing – Original Draft Preparation, L.L. ; Writing – Review & Editing, F.J., W.H. ; Visualization, L.L. ; Supervision, Z.Y. ; Project Administration, L.L. ; Funding Acquisition, L.JL., and J. F contributed equally to this paper. All authors have read and agreed to the published version of the manuscript.
Funding
This research was supported by the Key Research Project of Natural Science in Colleges and Universities of the Anhui Provincial Department of Education in 2021 (KJ2021A0188), Anhui Agricultural University Talent Project (rc322213), the China Agriculture Research System of MOF and MARA.
Institutional Review Board Statement
Not applicable.
Informed Consent Statement
Not applicable.
Data Availability Statement
The datasets generated for this study are available on request to the corresponding author.
Conflicts of Interest
The authors declare no conflict of interest.
References
- Raese, J.T. Phosphorus deficiency symptoms in leaves of apple and pear trees as influenced by available soil phosphorus. Communications in Soil Science and Plant Analysis 2002, 33, 461–477. [Google Scholar] [CrossRef]
- Ilic, R.; Glisic, I.; Radovanovic, M.; Milosevic, N.; Milosevic, T. Response of pear trees to different fertilization treatment. Mitteilungen Klosterneuburg 2022, 72, 102–117. [Google Scholar]
- Huang, J.-R.; Li, P.; Wen, J.-H.; Hu, X.; Chen, Y.-J.; Yin, D.-H.; Lian, H.-Z. Determination of arsenic species in mainstream cigarette smoke based on inductively coupled plasma mass spectrometry. Spectroscopy Letters 2018, 51, 252–256. [Google Scholar] [CrossRef]
- Wang, T.; Ge, Z.; Wu, J.; Li, B.; Liang, A. Determination of tungsten in bulk drug substance and intermediates by ICP-AES and ICP-MS. Journal of pharmaceutical and biomedical analysis 1999, 19, 937–943. [Google Scholar] [CrossRef] [PubMed]
- Hang, L.; Xu, Z.-y.; Hang, W.; Huang, B.-l. Recent Technical and Application Development of Atomic Spectrometry in China. Spectroscopy and Spectral Analysis 2019, 39, 1329–1339. [Google Scholar] [CrossRef]
- List, G.R.; Evans, C.D.; Kwolek, W.F. Copper in edible oils: trace amounts determined by atomic absorption spectroscopy. Journal of the American Oil Chemists' Society 1971, 48, 438–441. [Google Scholar] [CrossRef]
- Shi, Z.; Chow, C.W.K.; Fabris, R.; Liu, J.; Jin, B. Applications of Online UV-Vis Spectrophotometer for Drinking Water Quality Monitoring and Process Control: A Review. Sensors 2022, 22. [Google Scholar] [CrossRef]
- Zhu, X.; Chen, L.; Pumpanen, J.; Keinanen, M.; Laudon, H.; Ojala, A.; Palviainen, M.; Kiirikki, M.; Neitola, K.; Berninger, F. Assessment of a portable UV-Vis spectrophotometer's performance in remote areas: Stream water DOC, Fe content and spectral data. Data in brief 2021, 35, 106747–106747. [Google Scholar] [CrossRef]
- Bec, K.B.; Huck, C.W. Advances in Near-Infrared Spectroscopy and Related Computational Methods. Molecules 2019, 24. [Google Scholar] [CrossRef]
- Mosca, F.; Fumagalli, M. Near infrared spectroscopy: what applications? La Pediatria medica e chirurgica : Medical and surgical pediatrics 2002, 24, 419–421. [Google Scholar]
- Xu, G.T.; Yuan, H.F.; Lu, W.Z. Development of modern near infrared spectroscopic techniques and its applications. Spectroscopy and Spectral Analysis 2000, 20, 134–142. [Google Scholar] [PubMed]
- Wang, J.; Zhao, H.-b.; Shen, C.-w.; Chen, Q.-w.; Dong, C.-x.; Xu, Y.-c. Determination of Nitrogen Concentration in Fresh Pear Leaves by Visible/Near-Infrared Reflectance Spectroscopy. Agronomy Journal 2014, 106, 1867–1872. [Google Scholar] [CrossRef]
- Costa, M.C.A.; Morgano, M.A.; Ferreira, M.M.C.; Milani, R.F. Quantification of mineral composition of Brazilian bee pollen by near infrared spectroscopy and PLS regression. Food Chemistry 2019, 273, 85–90. [Google Scholar] [CrossRef] [PubMed]
- Lastras, C.; Revilla, I.; Gonzalez-Martin, M.I.; Vivar-Quintana, A.M. Prediction of fatty acid and mineral composition of lentils using near infrared spectroscopy. Journal of Food Composition and Analysis 2021, 102. [Google Scholar] [CrossRef]
- Zhou, Y.; Fu, X.-p.; Ying, Y.-b. Effect of humidity on detection of near-infrared spectra. Spectroscopy and Spectral Analysis 2007, 27, 2197–2199. [Google Scholar]
- Zhao, A.-x.; Tang, X.-j.; Zhang, Z.-h.; Liu, J.-h. Optimizing Savitzky-Golay Parameters and Its Smoothing Pretreatment for FTIR Gas Spectra. Spectroscopy and Spectral Analysis 2016, 36, 1340–1344. [Google Scholar] [CrossRef]
- Seo, J.S. Salient Chromagram Extraction Based on the Savitzky-Golay Filter for Cover Song Identification. Journal of Multimedia Information System 2022, 9, 69–72. [Google Scholar] [CrossRef]
- Huang, F.; Song, H.; Guo, L.; Guang, P.; Yang, X.; Li, L.; Zhao, H.; Yang, M. Detection of adulteration in Chinese honey using NIR and ATR-FTIR spectral data fusion. Spectrochimica Acta Part a-Molecular and Biomolecular Spectroscopy 2020, 235. [Google Scholar] [CrossRef]
- Ning, H.; Wang, J.; Jiang, H.; Chen, Q. Quantitative detection of zearalenone in wheat grains based on near-infrared spectroscopy. Spectrochimica Acta Part a-Molecular and Biomolecular Spectroscopy 2022, 280. [Google Scholar] [CrossRef]
- Bi, Y.; Yuan, K.; Xiao, W.; Wu, J.; Shi, C.; Xia, J.; Chu, G.; Zhang, G.; Zhou, G. A local pre-processing method for near-infrared spectra, combined with spectral segmentation and standard normal variate transformation. Analytica Chimica Acta 2016, 909, 30–40. [Google Scholar] [CrossRef]
- Liu, W.; Chang, Q.-R.; Guo, M.; Xing, D.-X.; Yuan, Y.-S. Detection of leaf nitrogen content of summer corn using visible/near infrared spectra. Journal of Infrared and Millimeter Waves 2011, 30, 48–54. [Google Scholar] [CrossRef]
- Dol, I.; Knochen, M.; Vieras, E. Determination of lithium at ultratrace levels in biological fluids by flame atomic emission spectrometry. Use of first-derivative spectrometry. The Analyst 1992, 117, 1373–1376. [Google Scholar] [CrossRef]
- Fan, H.; Sheng, L.Q.; Tong, H.W.; Jin, Z.X.; Liu, S.M. Determination of benzo(a)pyrene in cigarette mainstream smoke by second-order-derivative synchronous fluorescence. Spectroscopy and Spectral Analysis 2005, 25, 1627–1629. [Google Scholar] [PubMed]
- Ai, N.; Jiang, Y.; Omar, S.; Wang, J.; Xia, L.; Ren, J. Rapid Measurement of Cellulose, Hemicellulose, and Lignin Content in Sargassum horneri by Near-Infrared Spectroscopy and Characteristic Variables Selection Methods. Molecules 2022, 27. [Google Scholar] [CrossRef] [PubMed]
- Shi, J.-y.; Zou, X.-b.; Zhao, J.-w.; Yin, X.-p.; Chen, Z.-w. A New Method of Characteristic Wavelength Sub-Range Selection of Near Infrared Spectroscopy. Spectroscopy and Spectral Analysis 2010, 30, 3199–3202. [Google Scholar] [CrossRef]
- Smith, B.M.; Gemperline, P.J. Wavelength selection and optimization of pattern recognition methods using the genetic algorithm. Analytica Chimica Acta 2000, 423, 167–177. [Google Scholar] [CrossRef]
- Patchava, K.C.; Benaissa, M.; Behairy, H. Improving the prediction performance of PLSR using RReliefF and FSD for the quantitative analysis of glucose in Near Infrared spectra. Annual International Conference of the IEEE Engineering in Medicine and Biology Society. IEEE Engineering in Medicine and Biology Society. Annual International Conference 2015, 2015, 2379–2382. [Google Scholar] [CrossRef]
- Chang, C.W.; Laird, D.A.; Mausbach, M.J.; Hurburgh, C.R. Near-infrared reflectance spectroscopy-principal components regression analyses of soil properties. Soil Science Society of America Journal 2001, 65, 480–490. [Google Scholar] [CrossRef]
- Al-Shidhani, S.; Rehman, N.U.; Mabood, F.; Al-Broumi, M.; Hussain, H.; Hussain, J.; Csuk, R.; Al-Harrasi, A. Quantification of Incensole in Three Boswellia Species by NIR Spectroscopy Coupled with PLSR and Cross-Prediction by HPLC. Phytochemical Analysis 2018, 29, 300–307. [Google Scholar] [CrossRef] [PubMed]
- Xu, X.; Lin, M.; Xu, T. Epilepsy Seizures Prediction Based on Nonlinear Features of EEG Signal and Gradient Boosting Decision Tree. International Journal of Environmental Research and Public Health 2022, 19. [Google Scholar] [CrossRef] [PubMed]
- Li, G.; Mu, L.; Zhou, M.; Zhao, J.; Wu, S.; Lin, L. New strategy of sample set division in spectroscopy analysis--SWNW. Infrared Physics & Technology 2021, 117. [Google Scholar] [CrossRef]
- Brunetto, G.; Nava, G.; Ambrosini, V.G.; Comin, J.J.; Kaminski, J. THE PEAR TREE RESPONSE TO PHOSPHORUS AND POTASSIUM FERTILIZATION. Revista Brasileira De Fruticultura 2015, 37, 507–516. [Google Scholar] [CrossRef]
- Li, Y.-z.; Min, S.-g.; Liu, X. Study on the methods and applications of near-infrared spectroscopy chemical pattern recognition. Spectroscopy and Spectral Analysis 2007, 27, 1299–1303. [Google Scholar] [PubMed]
Figure 2.
Schematic diagram showing the acquisition points for spectral sampling.
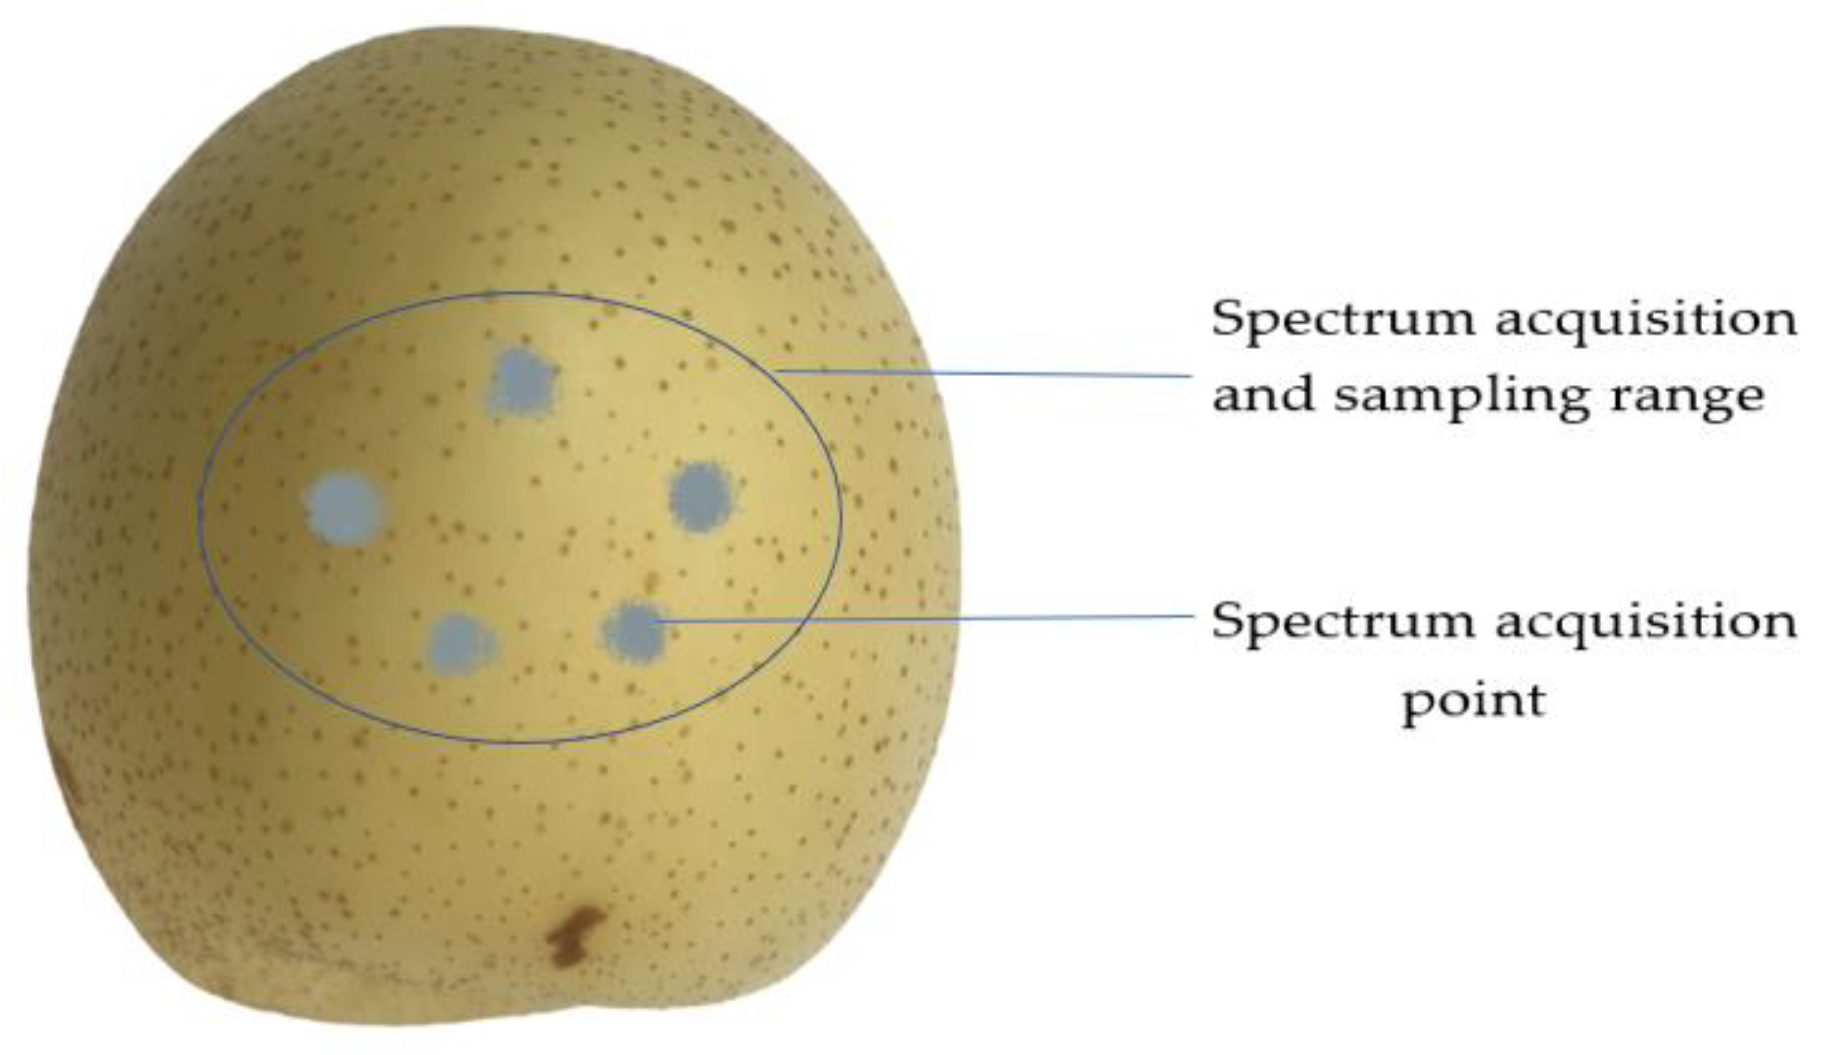
Figure 4.
Spectral graphs after transformation based on different preprocessing methods. (a) FD, (b) SD, (c) MSC, (d) SNV, (e) SG, (f) LG, (g) SG+MSC, (h) SG+SNV, (i) SG+MSC+FD, (j) SG+MSC+SD, (k) SG+SNV+FD, (l) SG+SNV+SD.
Figure 4.
Spectral graphs after transformation based on different preprocessing methods. (a) FD, (b) SD, (c) MSC, (d) SNV, (e) SG, (f) LG, (g) SG+MSC, (h) SG+SNV, (i) SG+MSC+FD, (j) SG+MSC+SD, (k) SG+SNV+FD, (l) SG+SNV+SD.
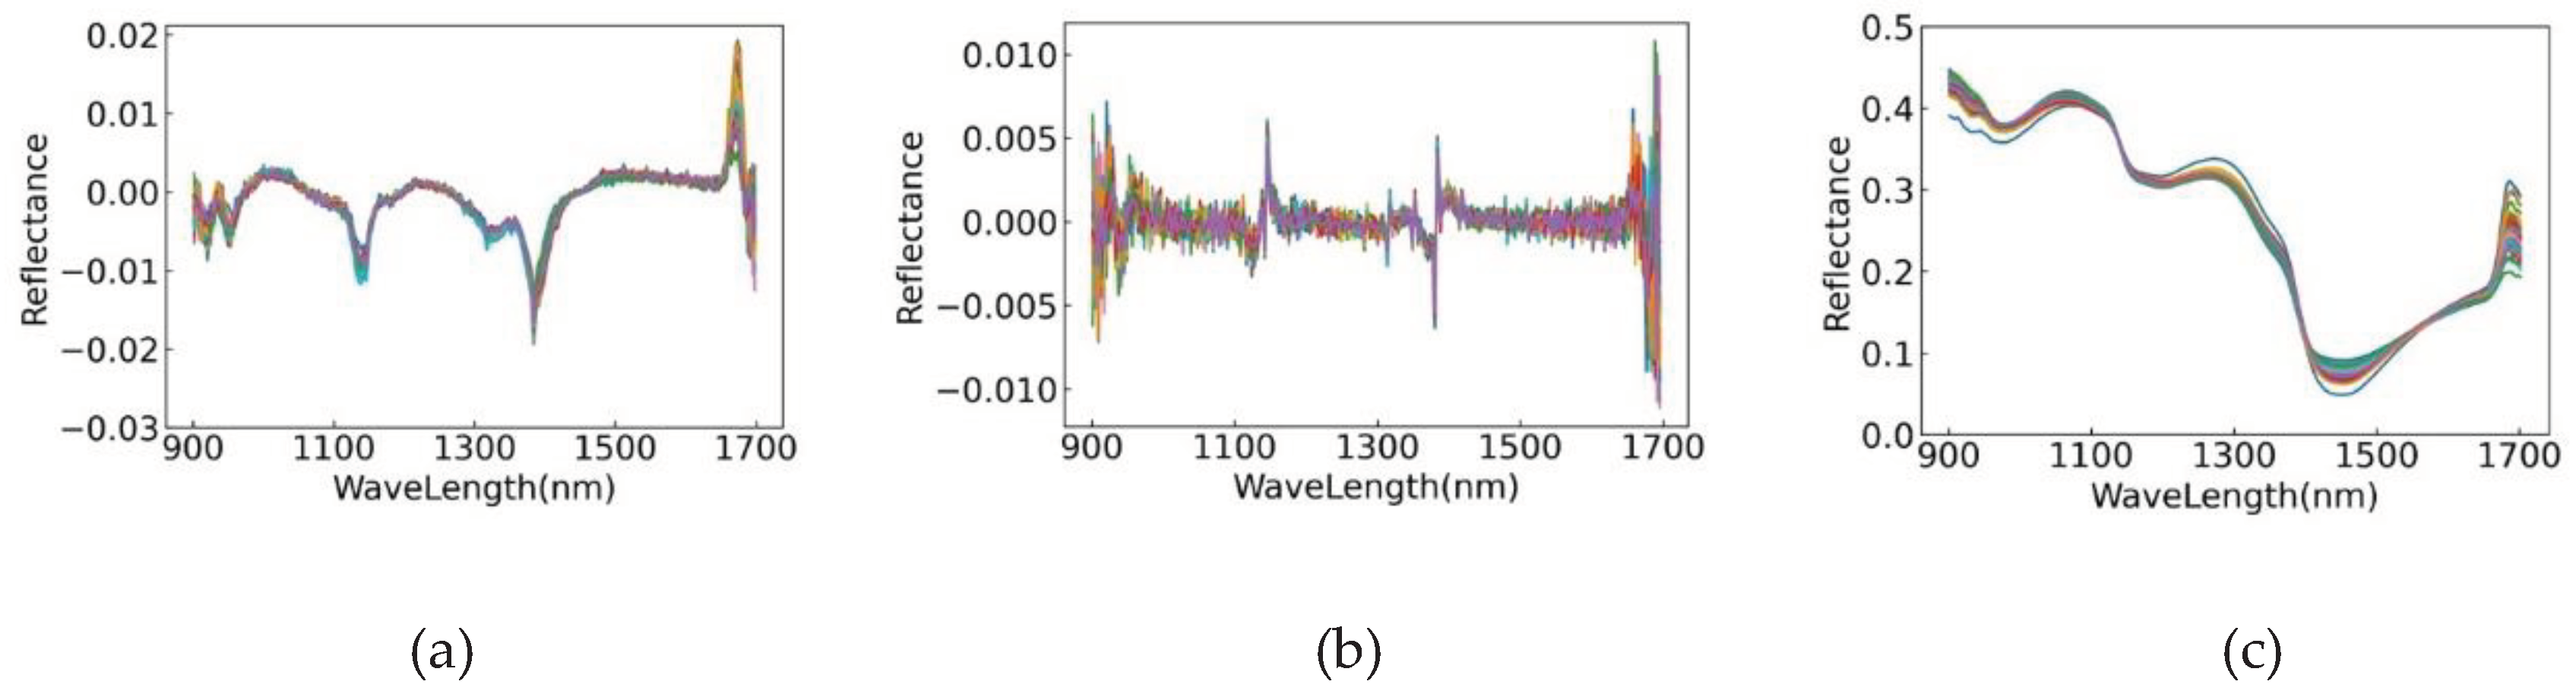
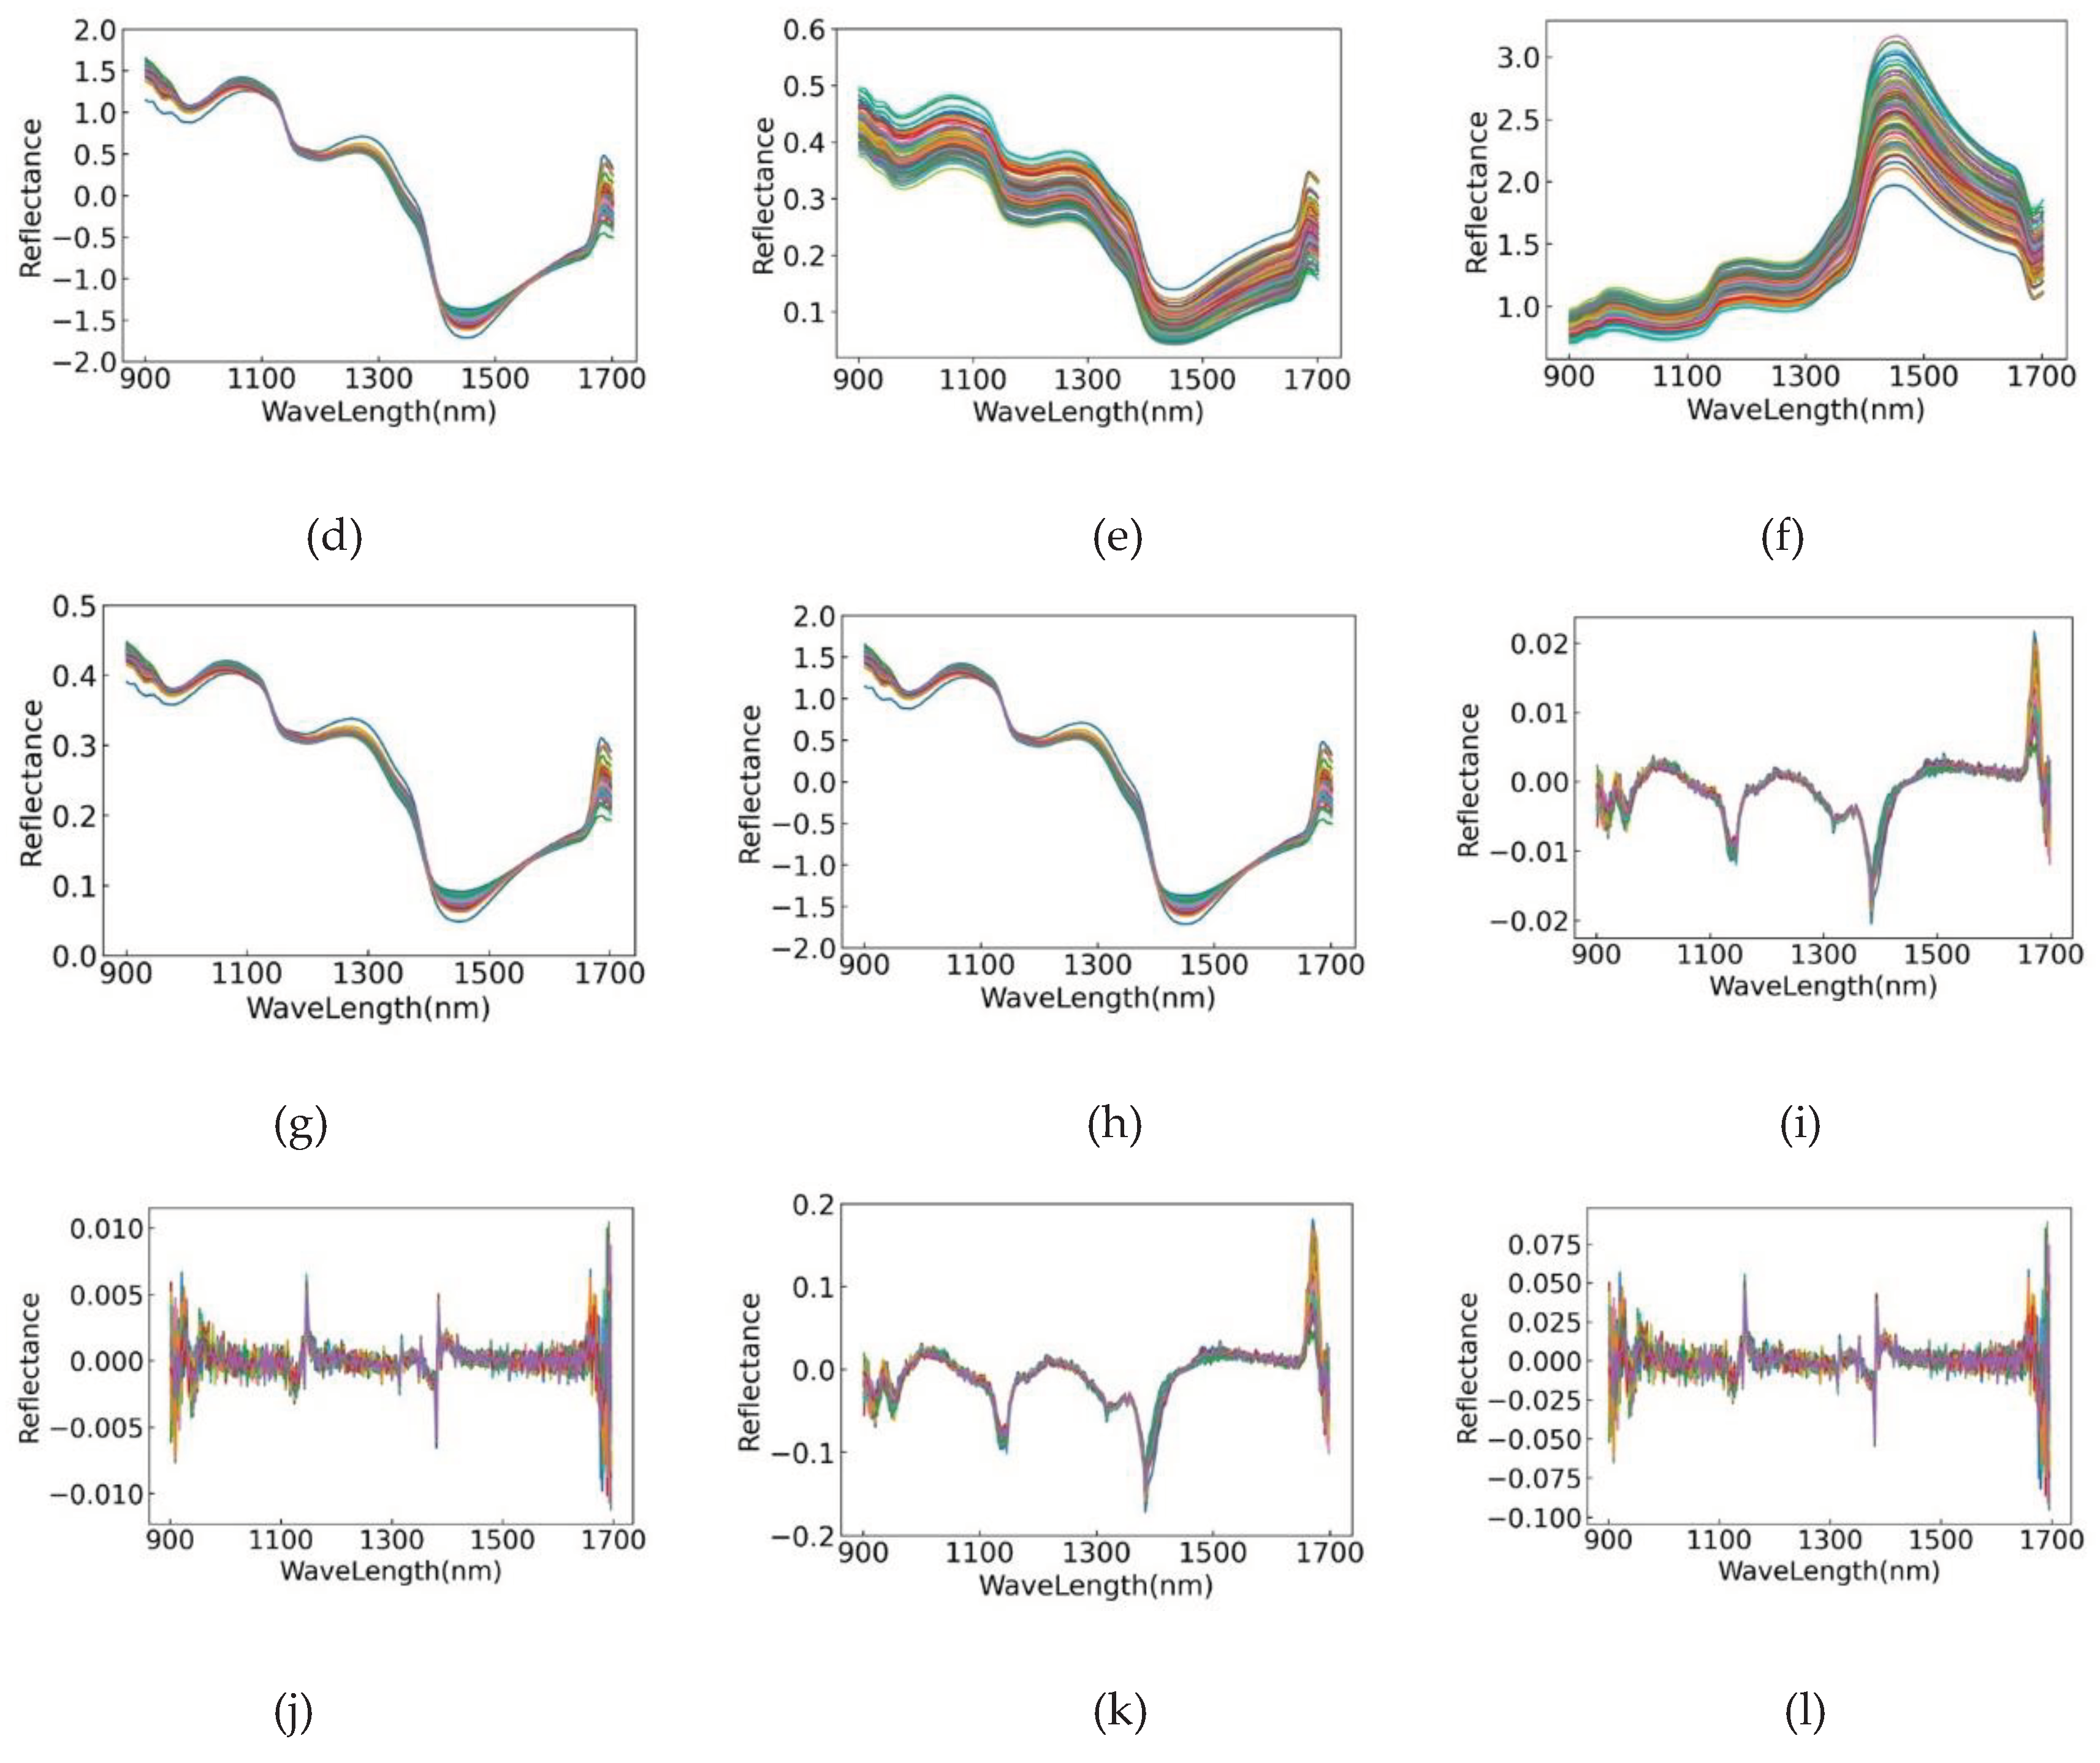
Figure 5.
Characteristic wavelength distribution of the prediction models for the content of phosphorus in pear pulp. (a) SNV-GA-PLSR; (b) MSC-GA-PLSR; (c) SG+MSC-GA-PLSR; (d) SG+SNV-GA-PLSR.
Figure 5.
Characteristic wavelength distribution of the prediction models for the content of phosphorus in pear pulp. (a) SNV-GA-PLSR; (b) MSC-GA-PLSR; (c) SG+MSC-GA-PLSR; (d) SG+SNV-GA-PLSR.
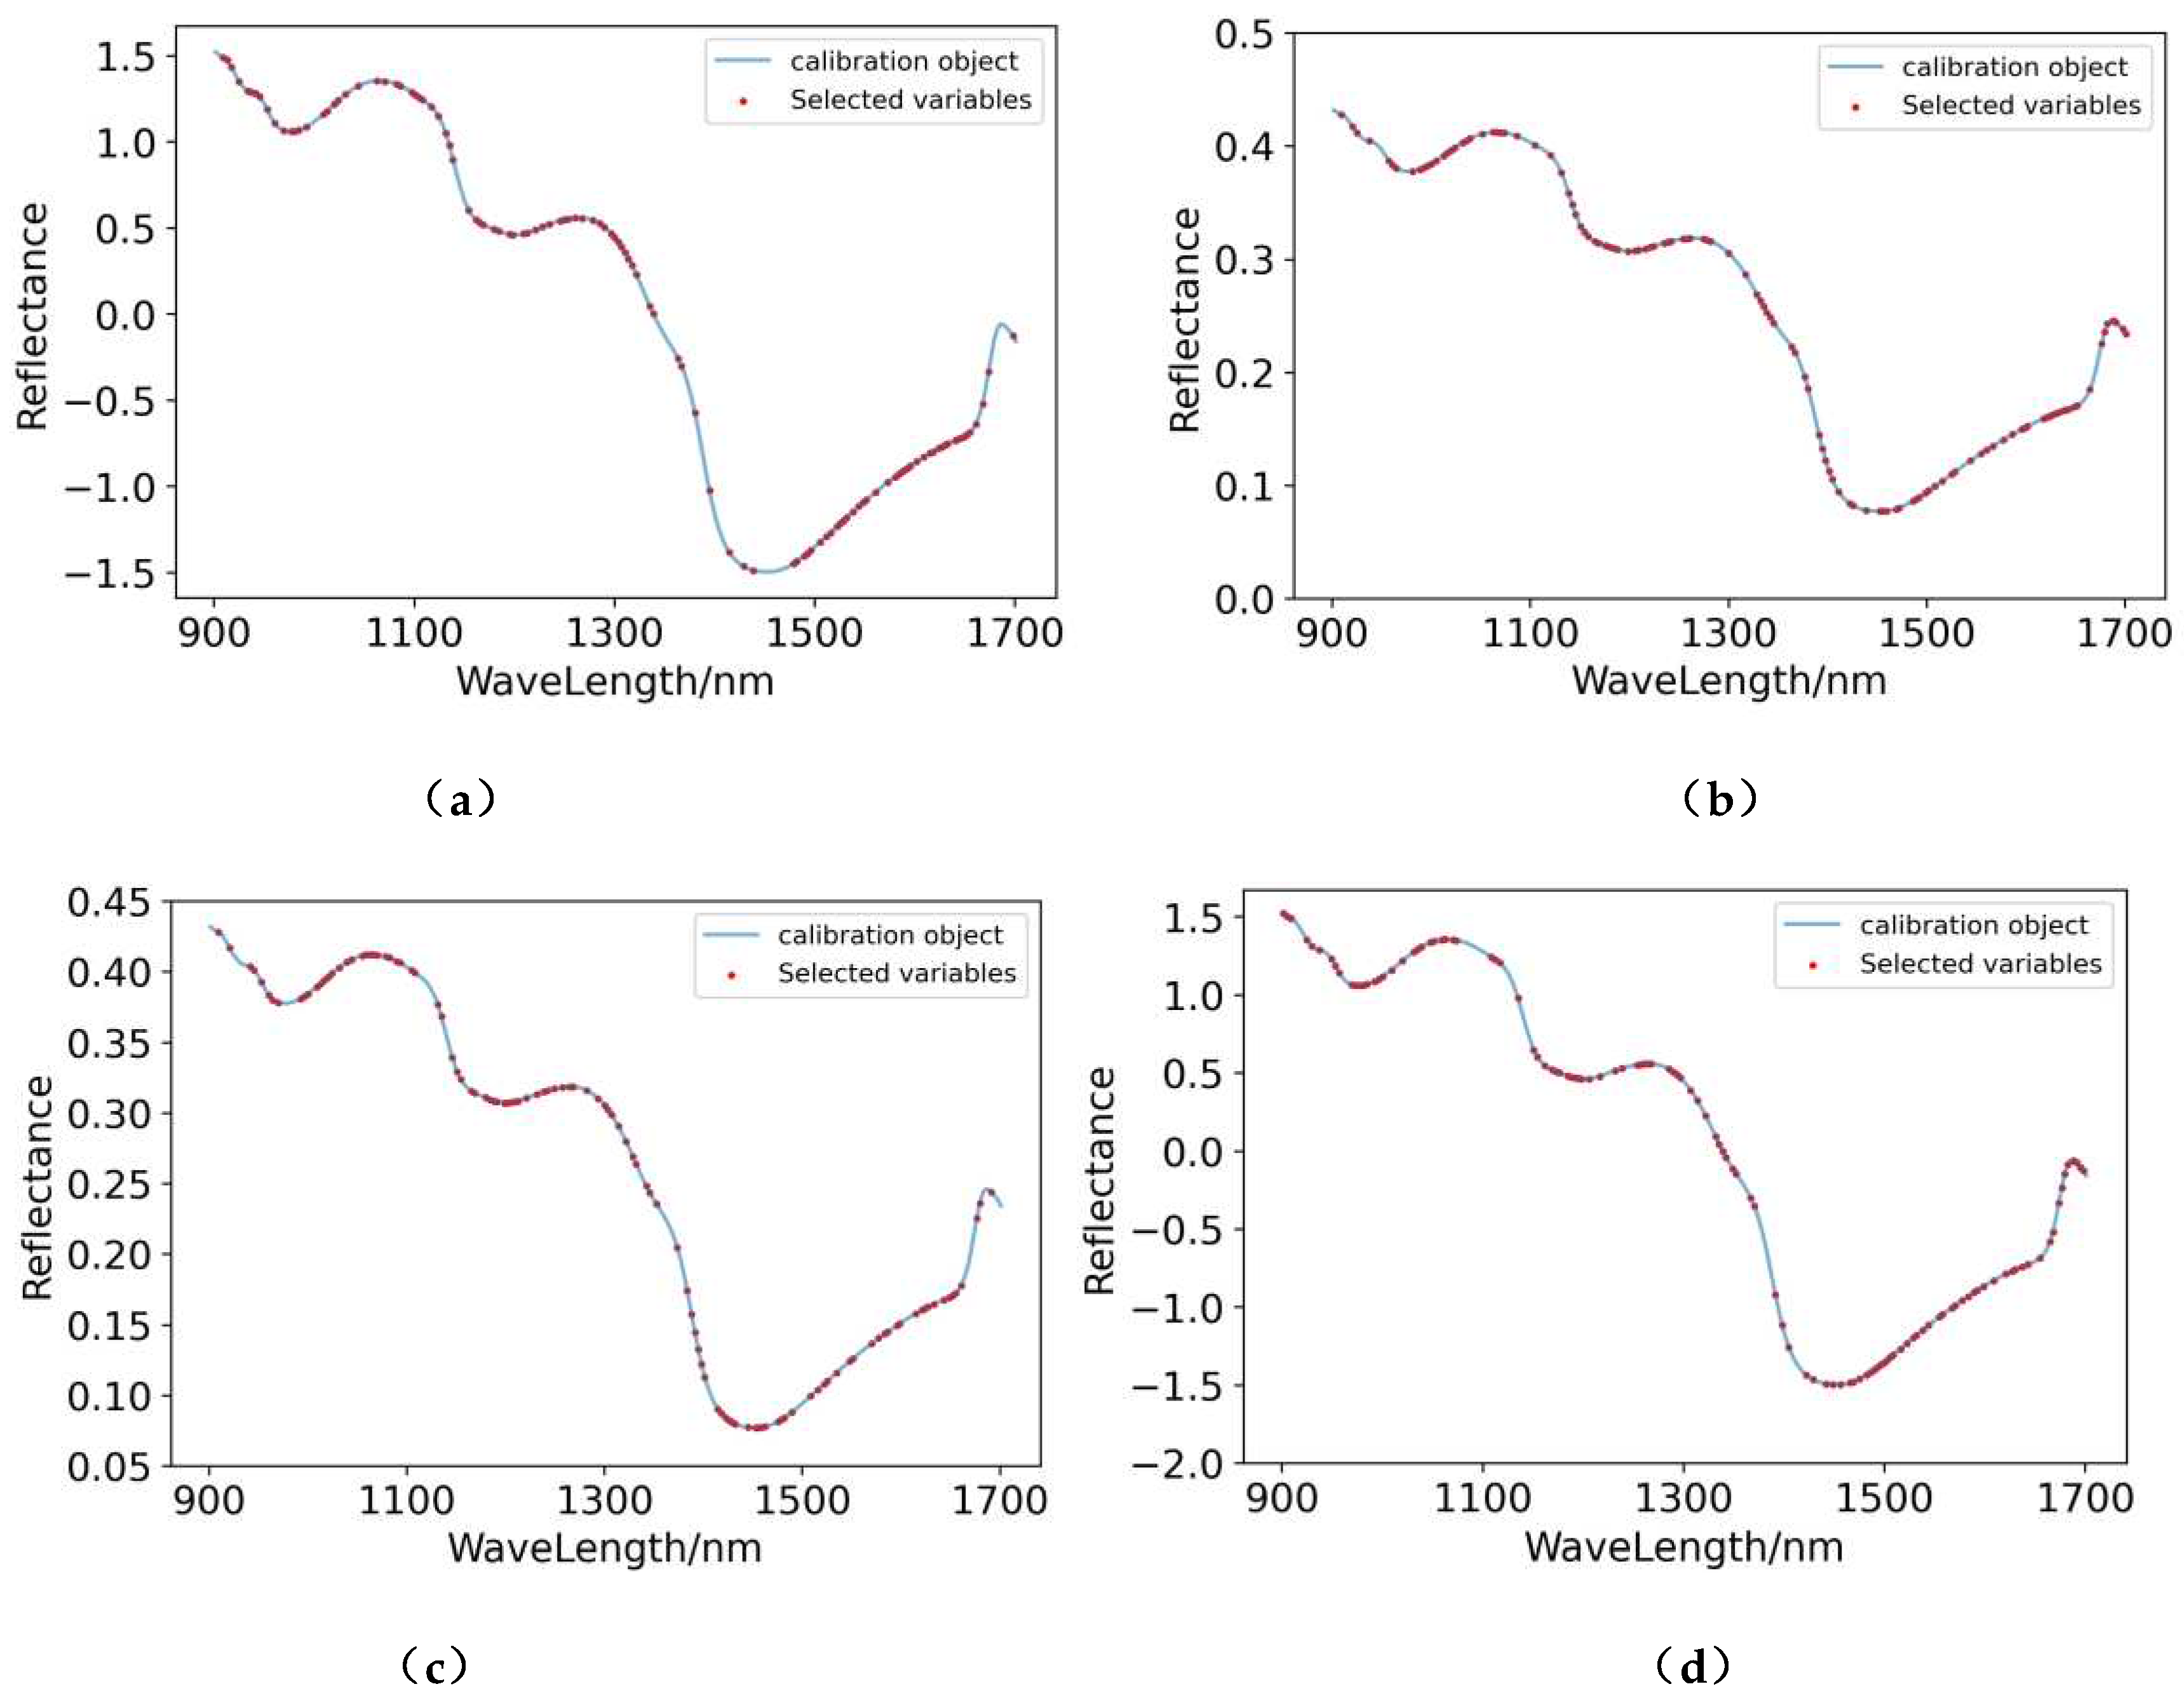
Figure 6.
Characteristic wavelength distribution of the prediction models for the content of phosphorus in pear peel: (a) FD-GA-PLSR; (b) SG+MSC+FD-GA-PLSR.
Figure 6.
Characteristic wavelength distribution of the prediction models for the content of phosphorus in pear peel: (a) FD-GA-PLSR; (b) SG+MSC+FD-GA-PLSR.
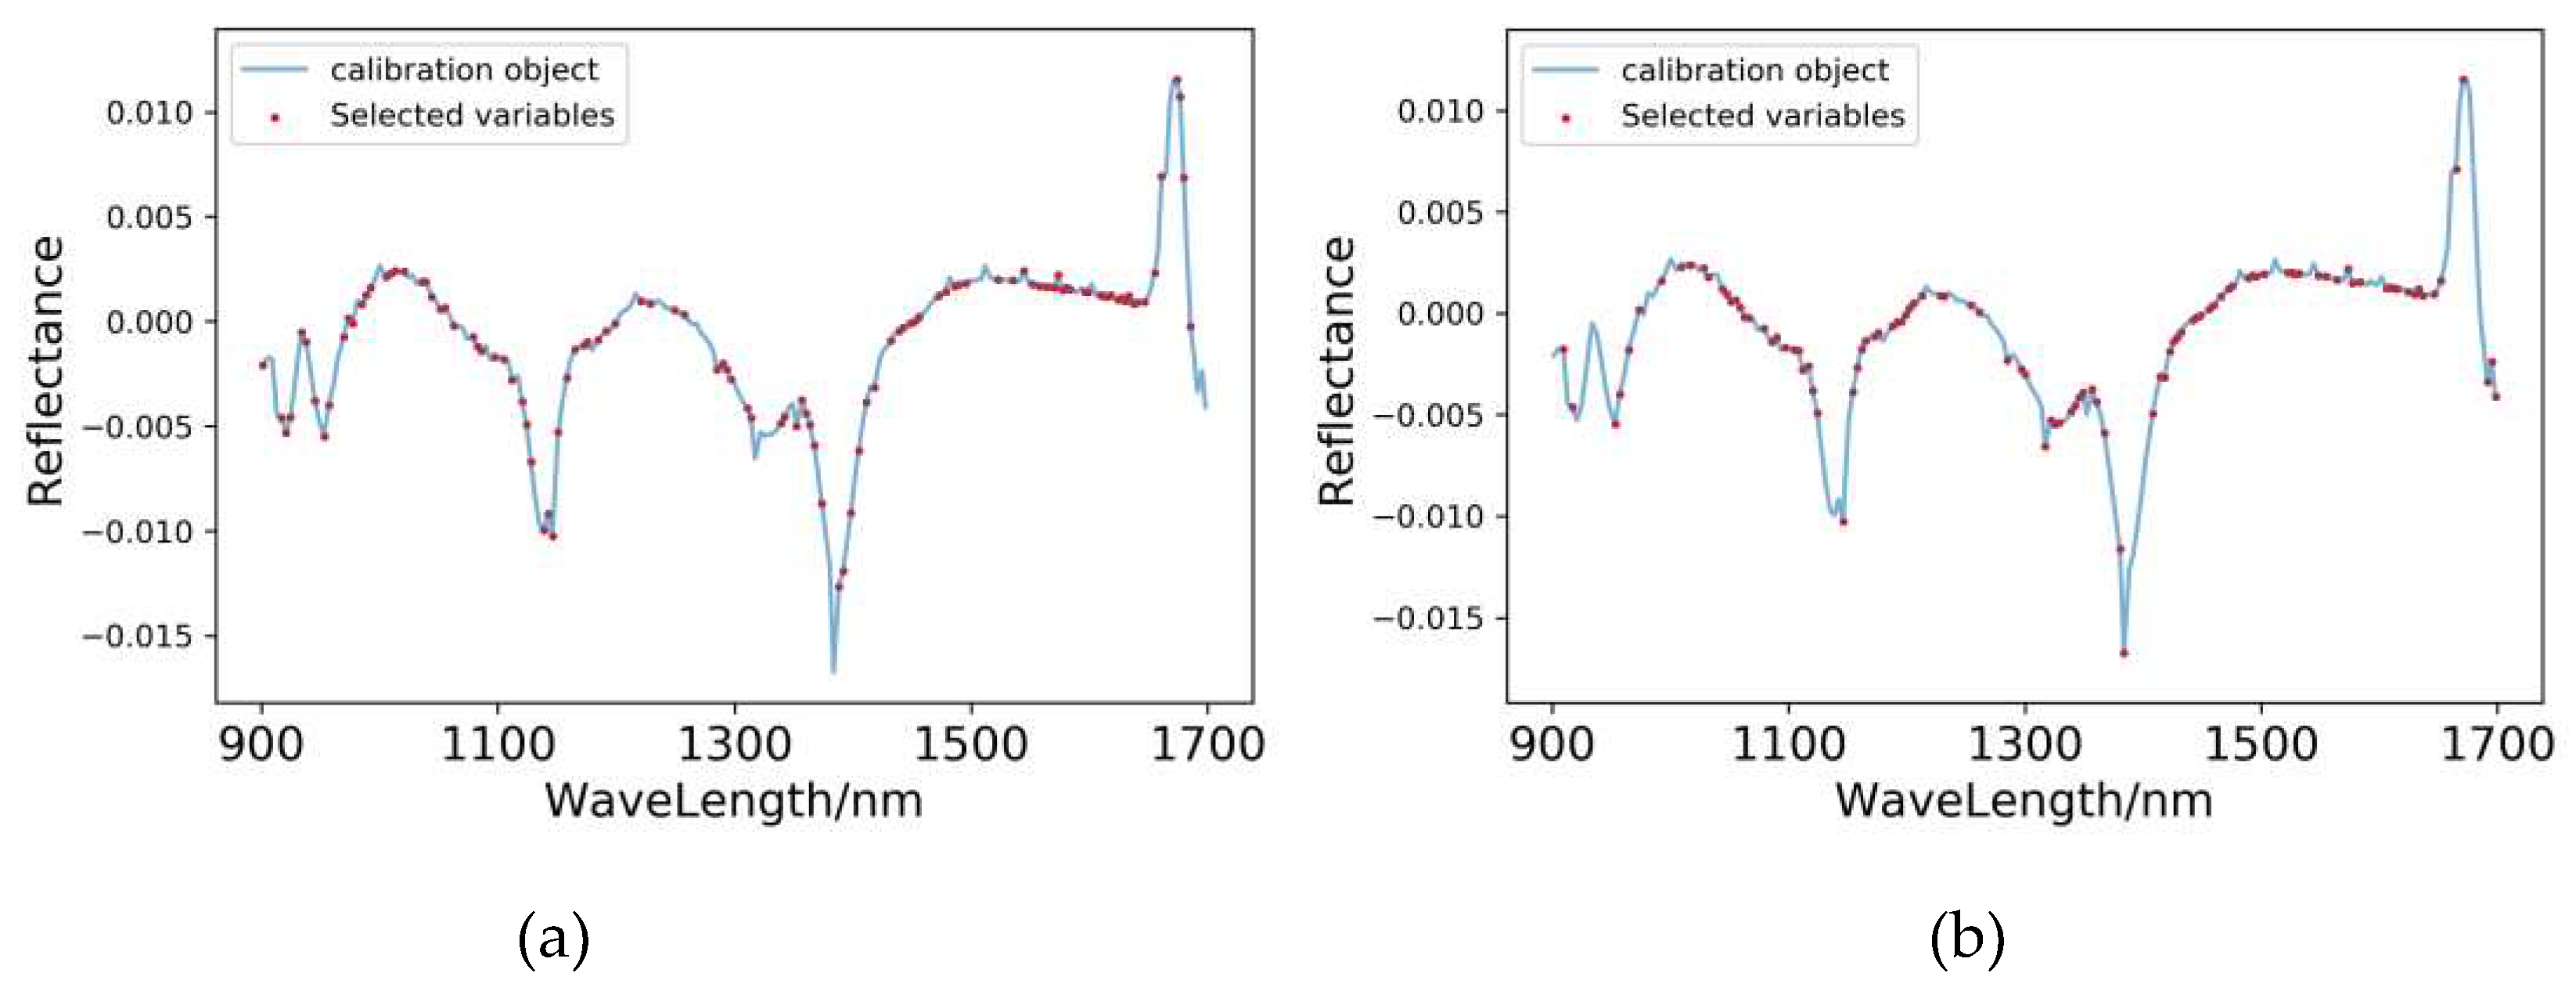
Figure 8.
Model prediction of phosphorus content in pear peel samples. (a) FD-GA-PLSR; (b) SG+MSC+FD-GA-PLSR.
Figure 8.
Model prediction of phosphorus content in pear peel samples. (a) FD-GA-PLSR; (b) SG+MSC+FD-GA-PLSR.
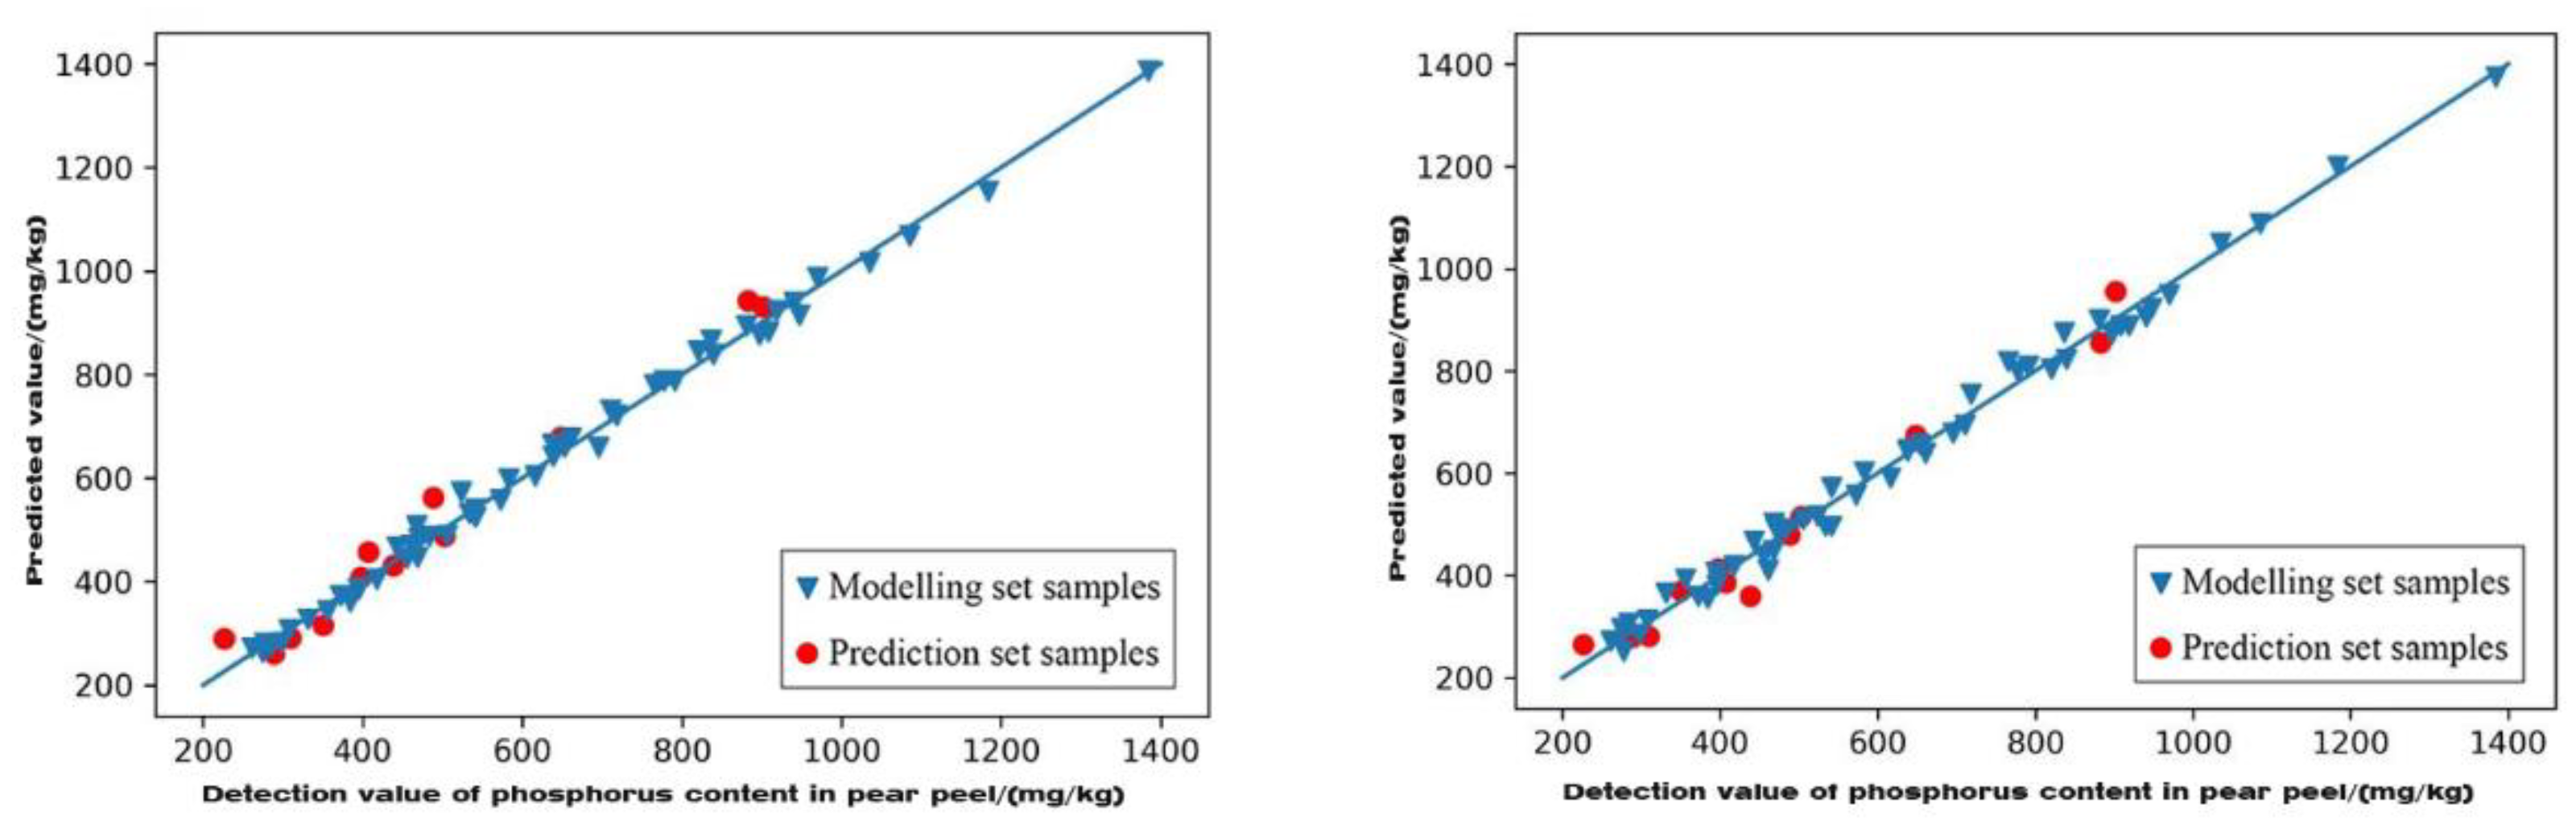
Table 1.
Classification of phosphorus content detection specimens in pear pulp and peel and parameter statistics.
Table 1.
Classification of phosphorus content detection specimens in pear pulp and peel and parameter statistics.
| Sets | Sample Size | Maximum (mg/kg) |
Minimum (mg/kg) |
Average (mg/kg) |
Standard Deviation |
|---|---|---|---|---|---|
| Totals | 65 | 232.00 | 117.55 | 161.69 | 29.18 |
| Modelling set(pulp) | 52 | 232.00 | 117.55 | 162.67 | 29.02 |
| Prediction set(pulp) | 13 | 225.32 | 124.50 | 157.78 | 29.49 |
| Modelling set(peel) | 52 | 1384.45 | 261.10 | 628.97 | 258.81 |
| Prediction set(peel) | 13 | 226.50 | 901.85 | 471.10 | 208.90 |
Table 2.
PLSR and GBRT prediction results are based on the phosphorus content of pear pulp in the full band of near-infrared spectroscopy.
Table 2.
PLSR and GBRT prediction results are based on the phosphorus content of pear pulp in the full band of near-infrared spectroscopy.
| Modelling Methods for Phosphorus Content of Pear Pulp | Preprocessing Methods | Modelling Set | Prediction Set | Level of Models | ||
|---|---|---|---|---|---|---|
| R² | RPD | R² | RPD | |||
| PLSR | Original | 0.412 | 1.097 | 0.621 | 1.276 | C |
| SNV | 0.887 | 2.165 | 0.836 | 1.821 | B | |
| FD | 0.730 | 1.462 | 0.479 | 1.140 | C | |
| MSC | 0.877 | 2.087 | 0.787 | 1.622 | B | |
| SD | 0.728 | 1.459 | 0.359 | 1.071 | C | |
| SG | 0.412 | 1.097 | 0.621 | 1.276 | C | |
| LG | 0.443 | 1.116 | 0.454 | 1.122 | C | |
| SG+MSC | 0.877 | 2.087 | 0.787 | 1.622 | B | |
| SG+SNV | 0.887 | 2.165 | 0.836 | 1.821 | B | |
| SG+MSC+FD | 0.640 | 1.302 | 0.488 | 1.146 | C | |
| SG+MSC+SD | 0.741 | 1.491 | 0.378 | 1.080 | C | |
| SG+SNV+FD | 0.647 | 1.311 | 0.488 | 1.146 | C | |
| SG+SNV+SD | 0.647 | 1.311 | 0.488 | 1.146 | C | |
| GBRT | Original | 0.784 | 1.610 | 0.159 | 1.013 | C |
| SNV | 0.874 | 2.057 | 0.228 | 1.027 | C | |
| FD | 0.997 | 13.737 | 0.258 | 1.035 | C | |
| MSC | 0.999 | 14.857 | 0.358 | 1.071 | C | |
| SD | 0.965 | 3.827 | 0.217 | 1.024 | C | |
| SG | 0.784 | 1.610 | 0.159 | 1.013 | C | |
| LG | 0.784 | 1.610 | 0.129 | 1.008 | C | |
| SG+MSC | 0.999 | 7.098 | 0.358 | 1.071 | C | |
| SG+SNV | 0.874 | 2.057 | 0.228 | 1.027 | C | |
| SG+MSC+FD | 0.985 | 5.743 | 0.118 | 1.007 | C | |
| SG+MSC+SD | 0.948 | 3.141 | 0.629 | - | ||
| SG+SNV+FD | 0.992 | 8.166 | 0.240 | 1.030 | C | |
| SG+SNV+SD | 0.156 | 1.000 | 0.037 | - | ||
Note: "-" indicates that the value is invalid.
Table 3.
PLSR and GBRT prediction results are based on the phosphorus content of pear peel in the full band of near-infrared spectroscopy.
Table 3.
PLSR and GBRT prediction results are based on the phosphorus content of pear peel in the full band of near-infrared spectroscopy.
| Modelling Methods for Phosphorus Content of Pear Peel | Preprocessing Methods | Modelling Set | Prediction Set | Level of Models | ||
|---|---|---|---|---|---|---|
| R² | RPD | R² | RPD | |||
| PLSR | Original | 0.417 | 1.100 | 0.404 | 1.093 | C |
| SNV | 0.791 | 1.634 | 0.436 | 1.111 | C | |
| FD | 0.716 | 1.432 | 0.708 | 1.416 | B | |
| MSC | 0.741 | 1.489 | 0.486 | 1.144 | C | |
| SD | 0.664 | 1.337 | 0.582 | 1.230 | C | |
| SG | 0.417 | 1.100 | 0.404 | 1.093 | C | |
| LG | 0.411 | 1.097 | 0.393 | 1.088 | C | |
| SG+MSC | 0.741 | 1.489 | 0.486 | 1.144 | C | |
| SG+SNV | 0.791 | 1.634 | 0.436 | 1.111 | C | |
| SG+MSC+FD | 0.826 | 1.774 | 0.738 | 1.482 | B | |
| SG+MSC+SD | 0.622 | 1.277 | 0.501 | 1.155 | C | |
| SG+SNV+FD | 0.826 | 1.774 | 0.536 | 1.185 | C | |
| SG+SNV+SD | 0.622 | 1.277 | 0.502 | 1.156 | C | |
| GBRT` | Original | 0.999 | 22.366 | 0.493 | 1.199 | C |
| SNV | 0.998 | 15.819 | 0.253 | 1.034 | C | |
| FD | 0.999 | 22.366 | 0.432 | 1.109 | C | |
| MSC | 0.999 | 22.366 | 0.333 | 1.061 | C | |
| SD | 0.999 | 22.366 | 0.512 | 1.173 | C | |
| SG | 0.943 | 3.005 | 0.423 | 1.199 | C | |
| LG | 0.992 | 7.922 | 0.275 | 1.040 | C | |
| SG+MSC | 0.999 | 22.366 | 0.333 | 1.061 | C | |
| SG+SNV | 0.984 | 5.613 | 0.251 | 1.033 | C | |
| SG+MSC+FD | 0.999 | 22.366 | 0.313 | 1.053 | C | |
| SG+MSC+SD | 0.999 | 22.366 | 0.332 | 1.060 | C | |
| SG+SNV+FD | 0.905 | 2.351 | 0.313 | 1.053 | C | |
| SG+SNV+SD | 0.973 | 4.333 | 0.264 | 1.037 | C | |
Disclaimer/Publisher’s Note: The statements, opinions and data contained in all publications are solely those of the individual author(s) and contributor(s) and not of MDPI and/or the editor(s). MDPI and/or the editor(s) disclaim responsibility for any injury to people or property resulting from any ideas, methods, instructions or products referred to in the content. |
© 2023 by the authors. Licensee MDPI, Basel, Switzerland. This article is an open access article distributed under the terms and conditions of the Creative Commons Attribution (CC BY) license (http://creativecommons.org/licenses/by/4.0/).
Copyright: This open access article is published under a Creative Commons CC BY 4.0 license, which permit the free download, distribution, and reuse, provided that the author and preprint are cited in any reuse.


