1. Introduction
The emergence of high-speed railway (HSR) has stimulated economic development in Asia, Europe and America. While at the same time, it has also caused an increasing number of annoyances to the daily lives of residents along the railway line [
1], affected the normal operation of surrounding precision instruments [
2] as well as the integrity protection of the ancient buildings and cultural relics [
3,
4]. Therefore, the prediction and evaluation of environmental vibration are of great significance for the planning of new HSR lines and environment management during the operating period of existing HSR.
In 1971, Lang [
5] provided the attenuation formula of the vibration level with distance based on field measurement results. ISO14837 [
6] focused on the emission-propagation-immission mechanisms of waves from the train-track system (source) to the building (receiver). Although the empirical formula is very convenient and practical [
7,
8,
9], the prediction accuracy is not enough, especially for some specific soil conditions [
10,
11]. Thus, the analytical and numerical prediction methods have been more and more popular. To better understand the vibration source, an improved track vibration model based on the semi-analytical finite element (SAFE) allows multiple layers of support and the accurate shape of the rail cross-section to be considered [
12]. Also, the influence of the vehicle speed, observation location, rail irregularity, subgrade-bed stiffness, and vehicle type on the ground vibration are investigated thoroughly by some semi-analytical vehicle-track-ground coupling models [
13,
14,
15]. Since the vibration of track structure and underlying soil induced by HSR trains differs a lot from those by low-speed trains, the numerical methods such as 3D/2.5D finite element method (FEM) [
16,
17], the FEM combining boundary element method (FEM-BEM) [
18], the TLM-perfectly matched layers (TLM-PML) [
19], and some hybrid methods [
20] have been proposed.
Due to the complex in the generation and propagation of ground vibrations, most of the traditional prediction methods are very time-consuming. With the development of computer science, the feasibility of machine learning technique in predicting the railway-induced environmental vibration has been proved [
21,
22]. Among the algorithms of the machine learning method, the support vector machine [
23], the neural networks [
24,
25] and the random forest [
26,
27] have been widely applied to efficiently predict the soil vibration and analyze the influencing factors. Silka et al. established the RNN-LSTM neural network model, by which the prediction accuracy of ground vibration is up to 99% on its validation set [
28]. However, there are many hyperparameters in the machine-learning method [
29] and the diagnostic effectiveness depends much on the appropriate set of hyperparameters [
30]. Lyu et al. proposed a complete Bayesian optimization framework to handle multi-objective optimization problems [
31]. The advantages of Bayesian optimization have also been validated by experiments [
32,
33,
34].
Although Bayesian optimization methods are paid more and more attention, but few are used in the prediction of environmental vibration induced by elevated high-speed railway. In addition, the single machine learning algorithm is often tried, but few comparisons and verifications of different algorithms are performed. In this paper, the field measurement of ground-borne vibrations from elevated high-speed railway is firstly carried out, by which the ground vibration characteristics are analyzed and the experimental database is obtained. Subsequently, three kinds of machine-learning algorithms are respectively utilized in developing machine-learning prediction models of ground vibrations, and their efficiency and accuracy are compared. Finally, by comparing the effectiveness of random search optimization and Bayesian optimization, the integrated machine-learning prediction method is proposed and further validated by experimental database.
2. Materials & Methods
2.1. Overview
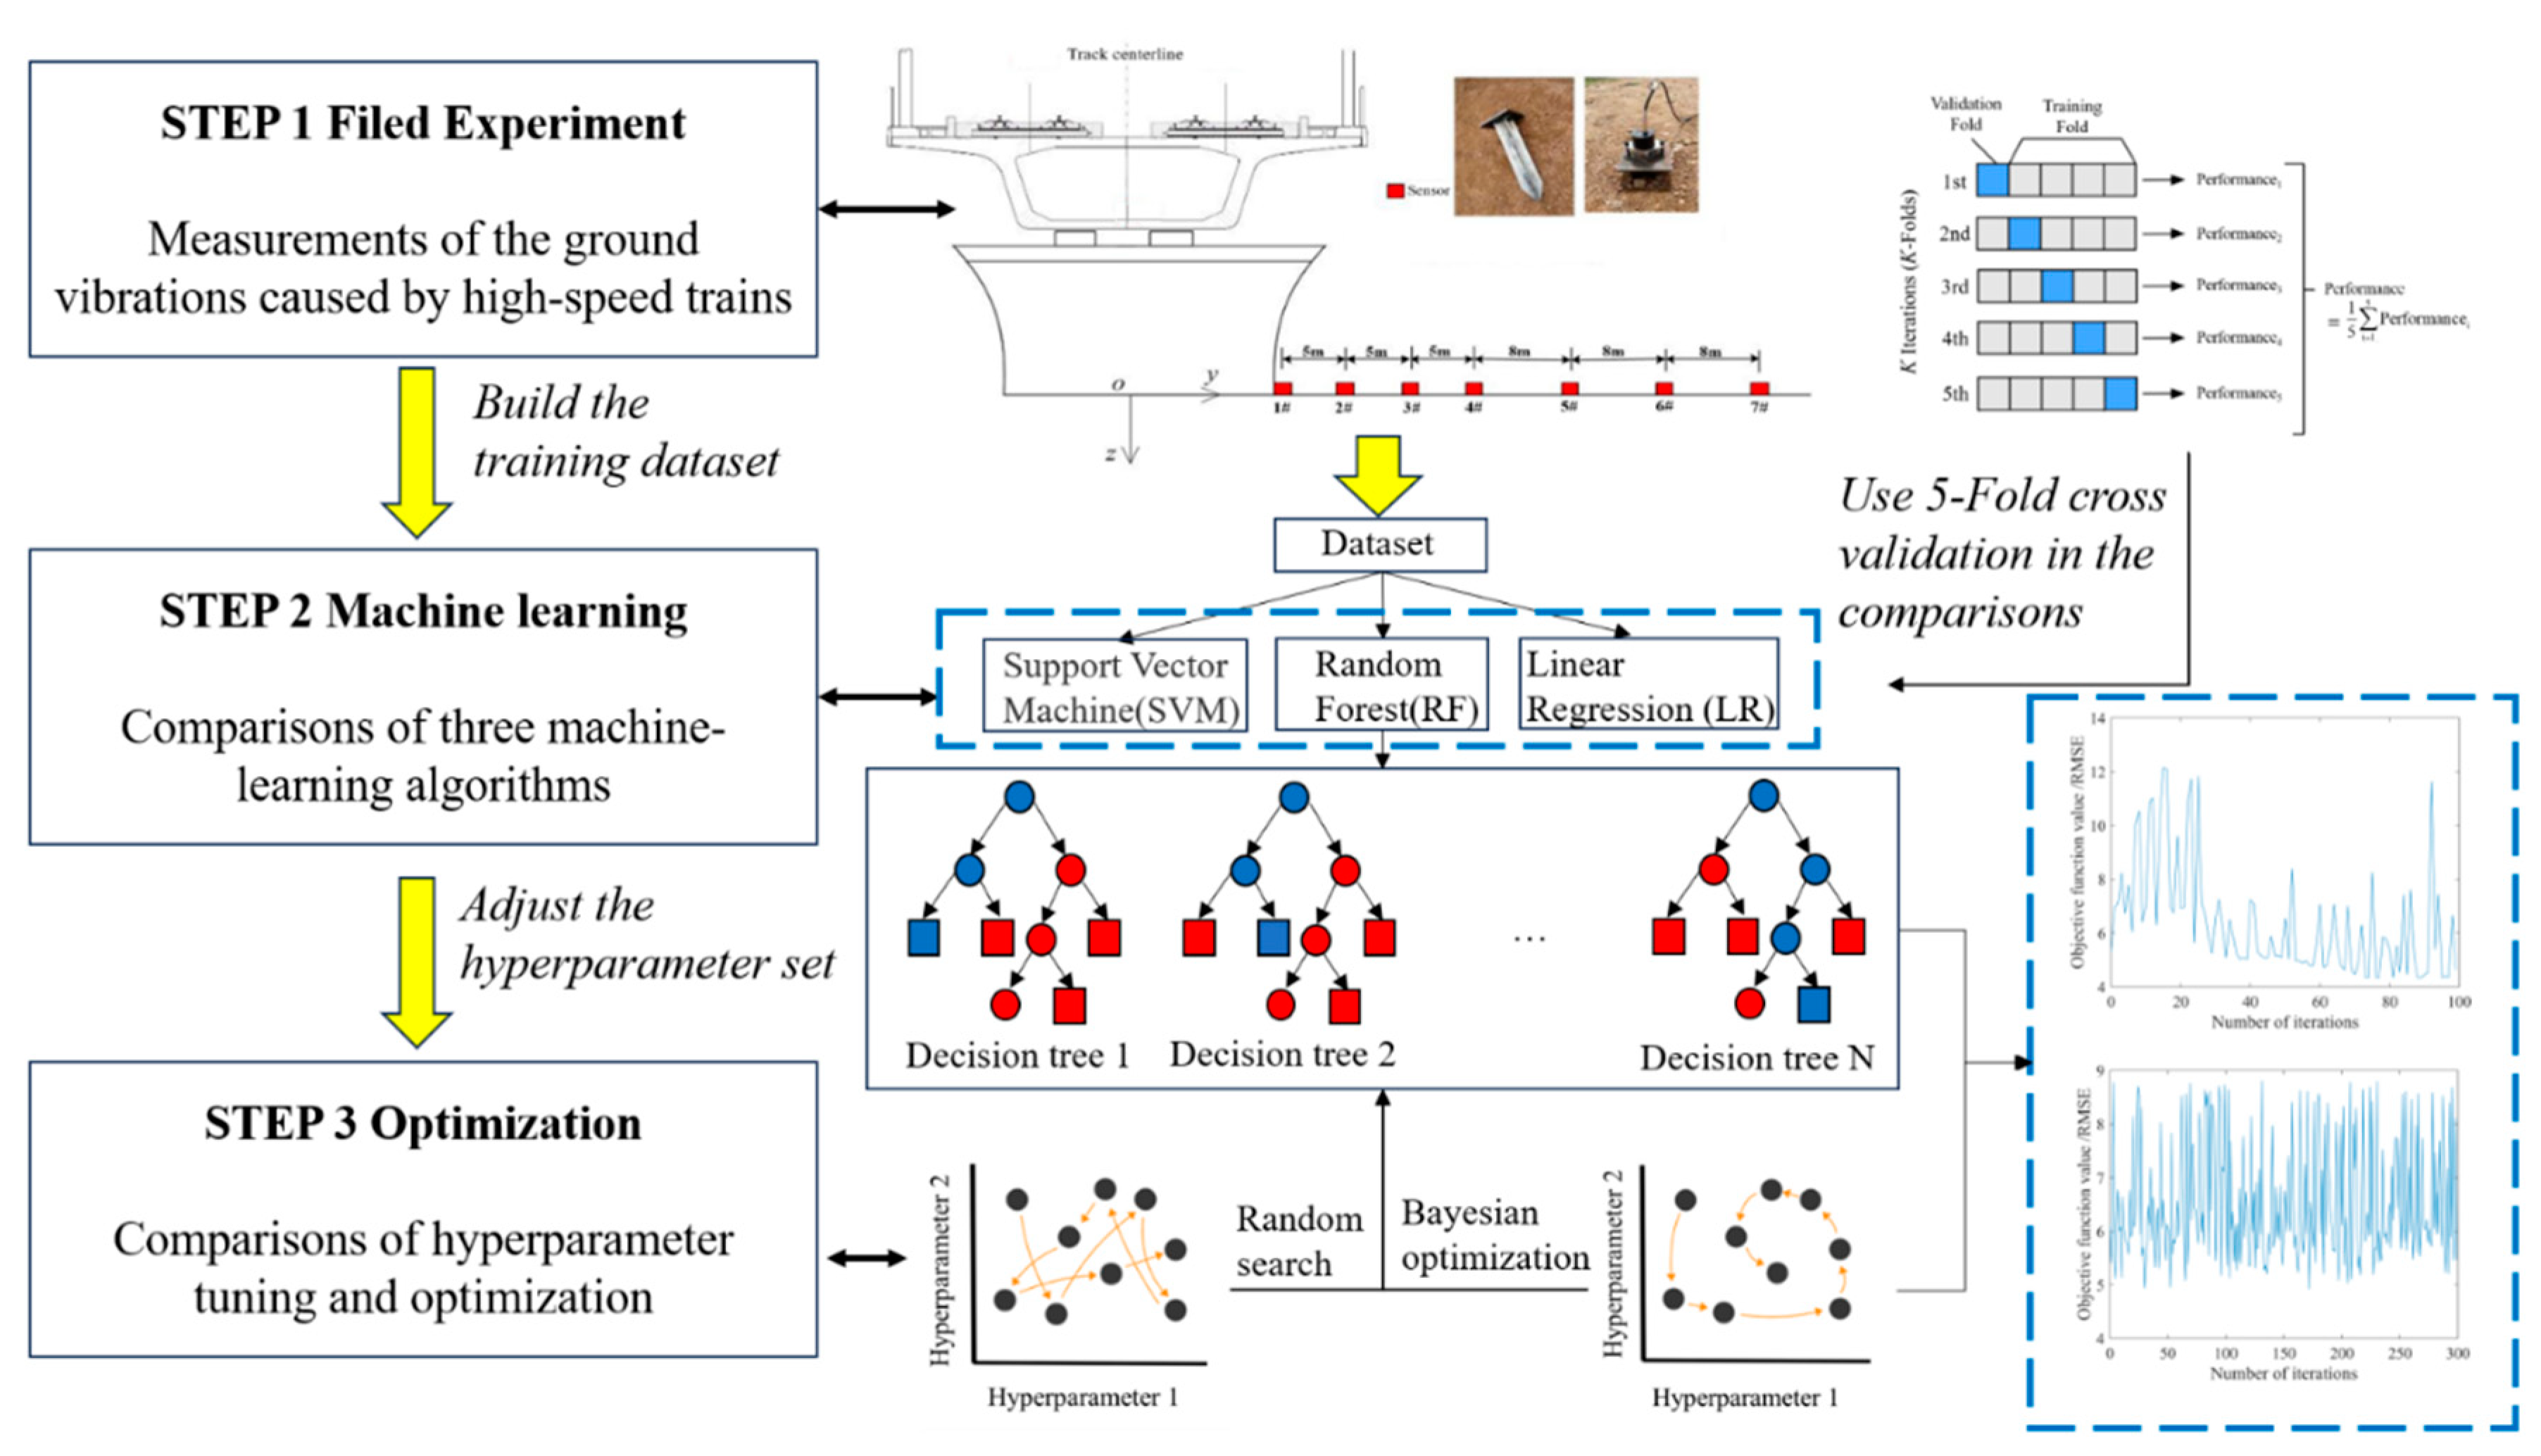
The emergence of high-speed railway (HSR) has caused an increasing number of annoyances to the daily lives, so the prediction and evaluation of environmental vibration are of great significance. A field experiment is firstly carried out to measure the ground vibrations caused by high-speed trains to get the dataset. Then, a data-driven model combined with BO and Random Forest algorithm was proposed to analyze and predict the environmental vibrations of high-speed railway. The analysis procedure shown in
Figure 1 can be divided in the following steps:
- (1)
A field experiment is carried out to measure the ground vibrations caused by high-speed trains running on bridge, during the test, a total of 14 sets of valid data were collected, in which the high-speed train traveled at the speed of 200–335km/h.
- (2)
Then, the environmental vibration characteristics are analyzed in view of ground accelerations and weighted vibration levels. And some assessments of environmental vibrations are generated from experimental datasets.
- (3)
Based on the assessments, factors with great effects are selected as input features for the machine-learning prediction model, and the initial dataset is generated.
- (4)
The data set is used to create prediction models with three different machine-learning algorithms of linear regression, support vector machine and random forest. And those models are compared using 5-fold cross-validation, it turns out random forest has the best performance.
- (5)
Two optimized vibration prediction model is created on the basis of random forest algorithm, and the random forest hyperparameters are optimized with the mean value of 5-fold cross-validation as the objective function of BO and RS each. The performance of two optimized models is compared.
- (6)
It turns out Bayesian optimization has excellent performance and high efficiency in achieving efficient and in-depth optimization of parameters, and can be combined with the RF machine learning algorithm to effectively predict the environmental vibrations induced by the high-speed railway.
2.2. Experimental Analysis of Ground Vibration by Elevated HSR
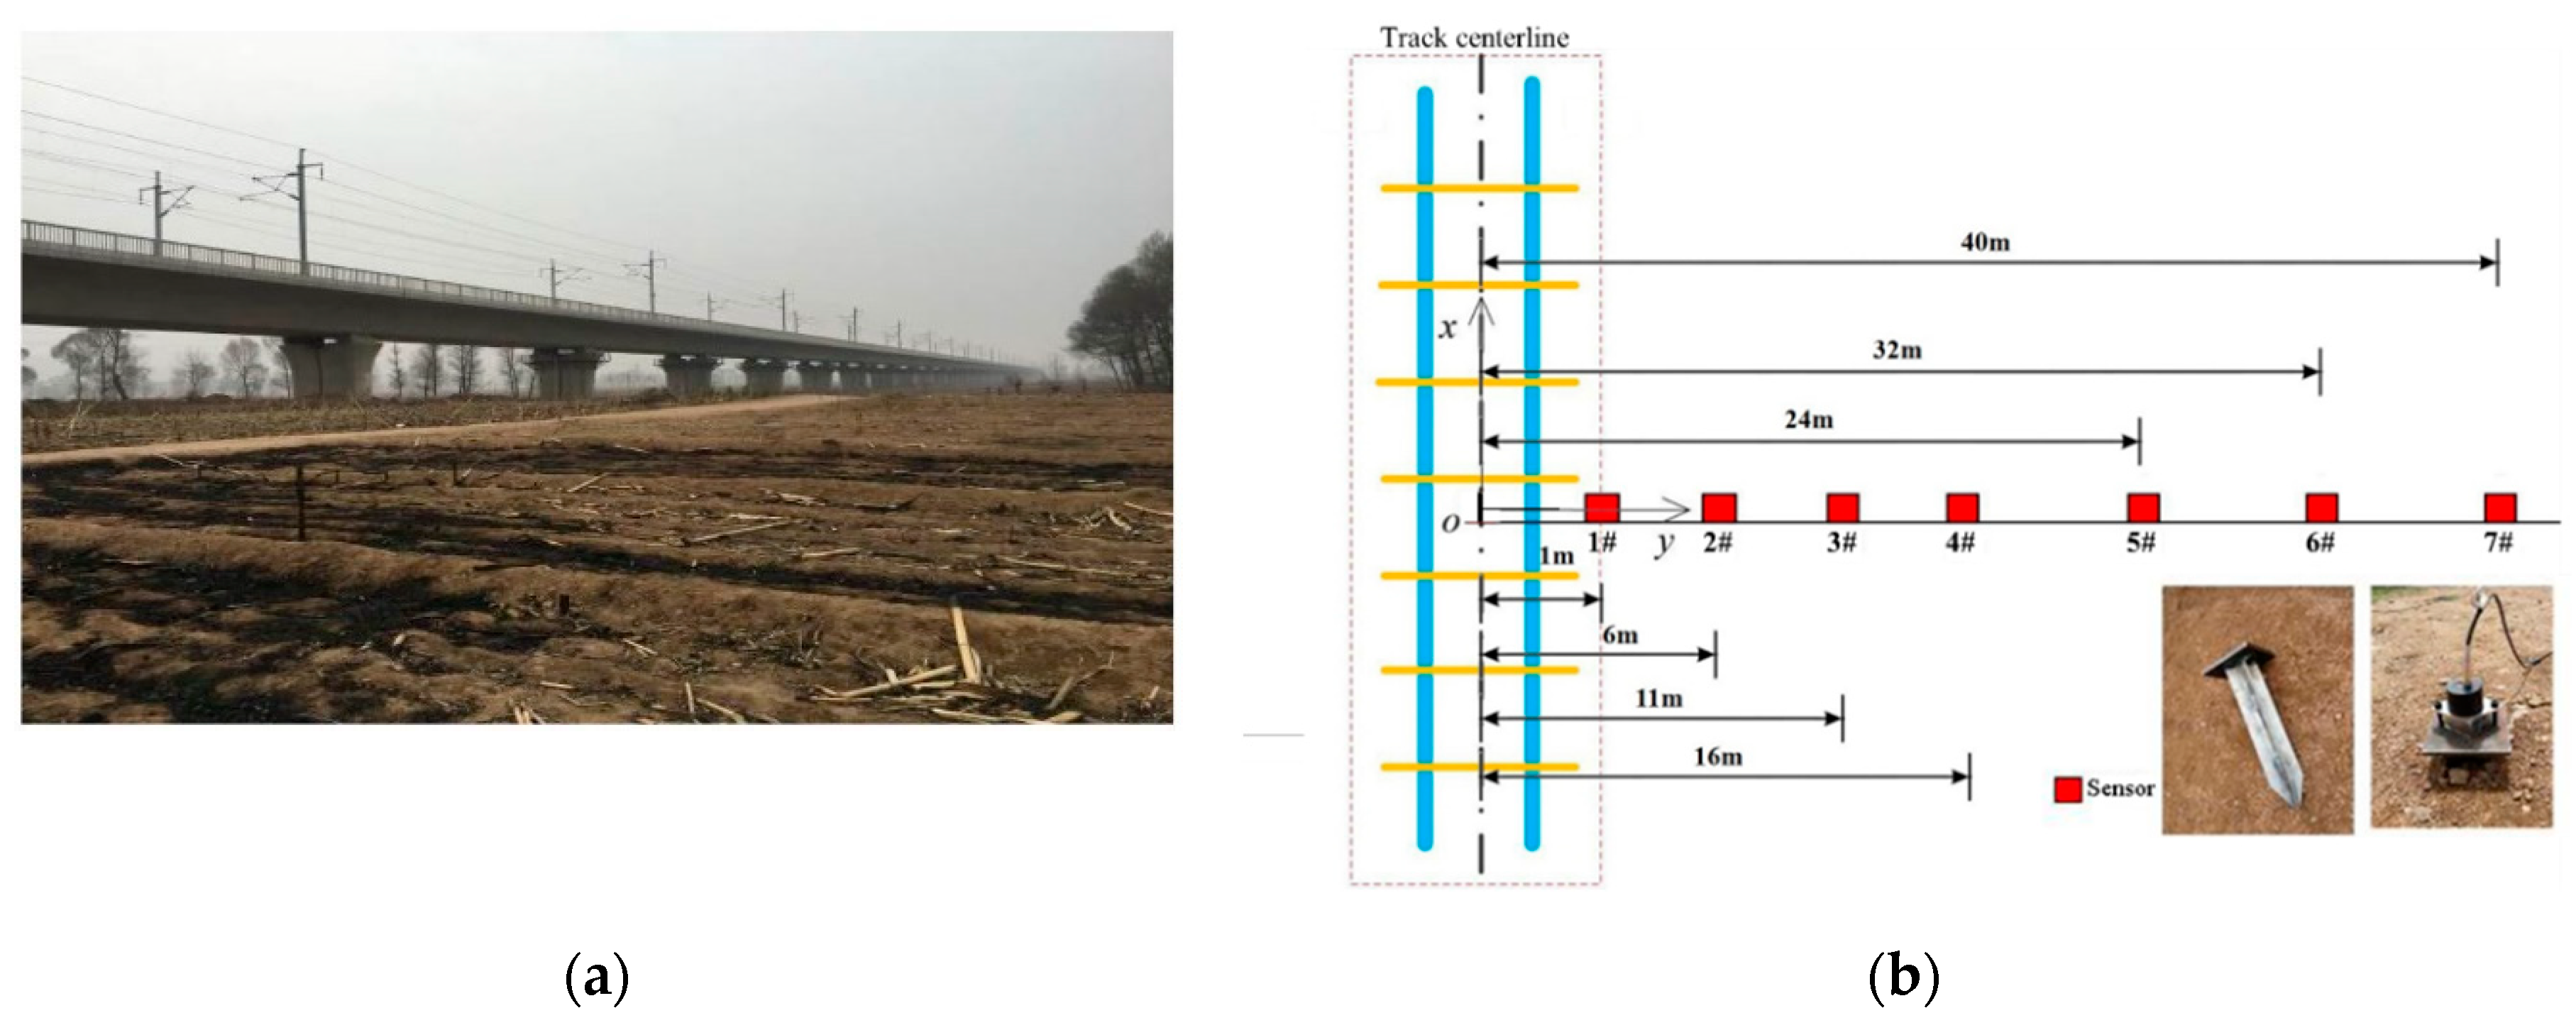
The experimental field is an open farmland with flat terrain near Datong-Xi’an high-speed railway (
Figure 2a), in which the HSR concrete bridge consists a series of simply supported beam with the standard span of 32m and double track lines.
The layout of seven measuring points on the ground surface is shown in
Figure 2b. The intersection of the pier centerline and the ground horizontal line is referred to be the coordinate origin, the train running direction is defined as the horizontal x-axis, the transverse direction perpendicular to the track is the y-axis, and the vertical downward direction is the z-axis. Herein, the distance between the measurement points and the track centerline is denoted by D, so the measuring point of D=1m is located at the bottom of pier since the pier diameter is 2m.
The sensors used for measuring the ground vibrations are 941B-typed acceleration sensors, and three sensors are simultaneously installed at each measuring point to meas-ure the vibration accelerations in the x-, y- and z- directions as shown in
Figure 2. In addi-tion, INV3020S 28-bit network distributed synchronous acquisition instrument is used for data acquisition in the experiment, and the sampling frequency is 512Hz.
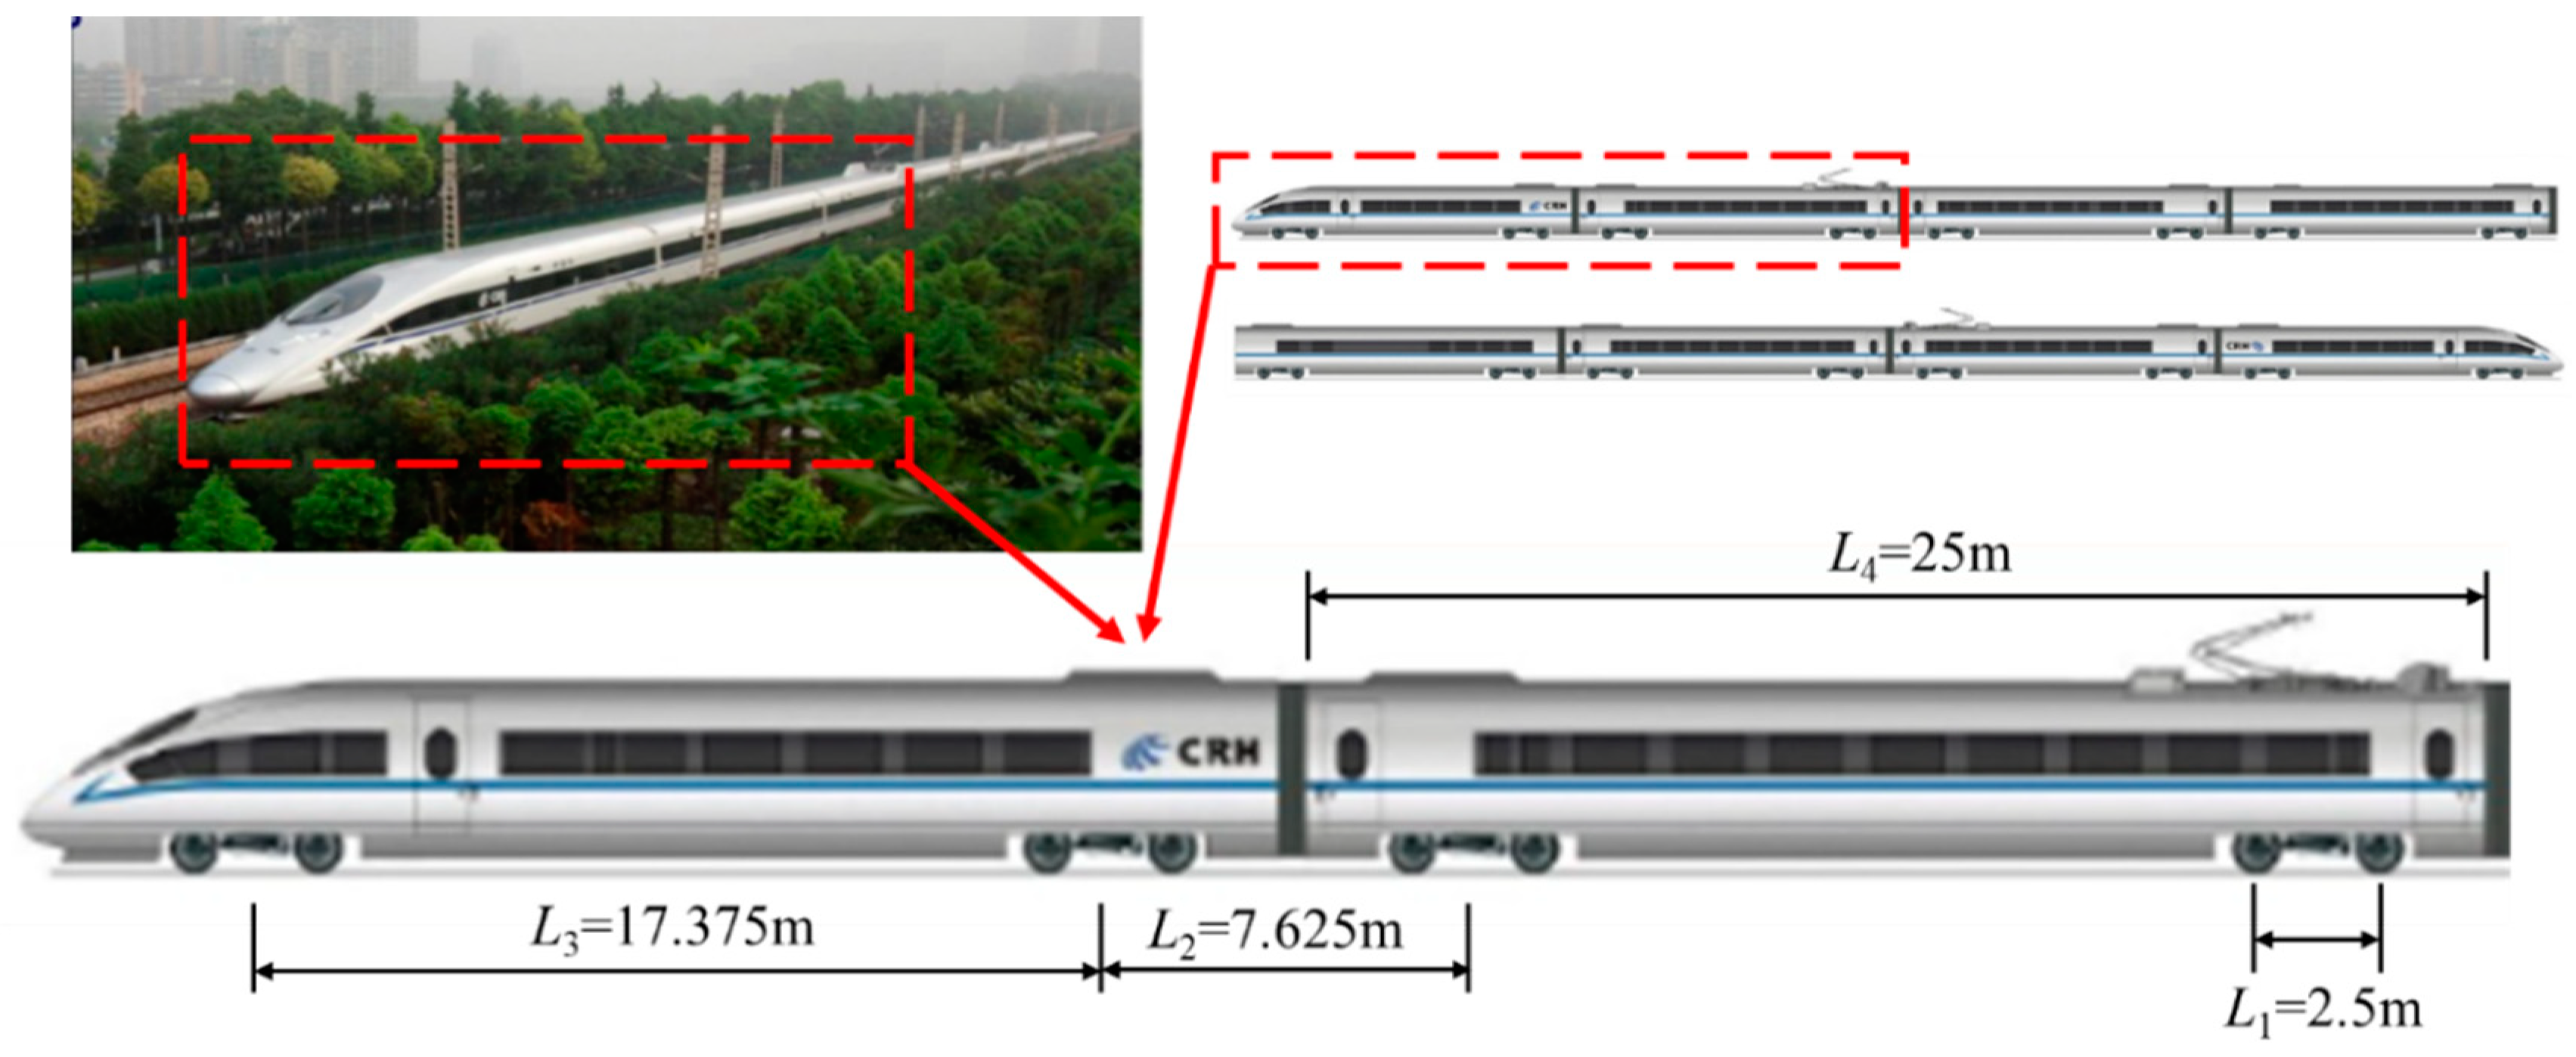
During the test, the high-speed train is CRH380A with 8-car train formation, and the axle load of the vehicle is about 140kN. As shown in
Figure 3, the vehicle wheelbase L1=2.5m, the center distance between adjacent bogies of adjacent vehicles L2=7.625m, the center distance between front and rear bogies of the same vehicle L3=17.375m, the total length of a single car L4=25m. During the test, a total of 14 sets of valid data were collected, in which the high-speed train traveled at the speed of 200–335km/h.
2.3. Developing of Machine-Learning Prediction Method
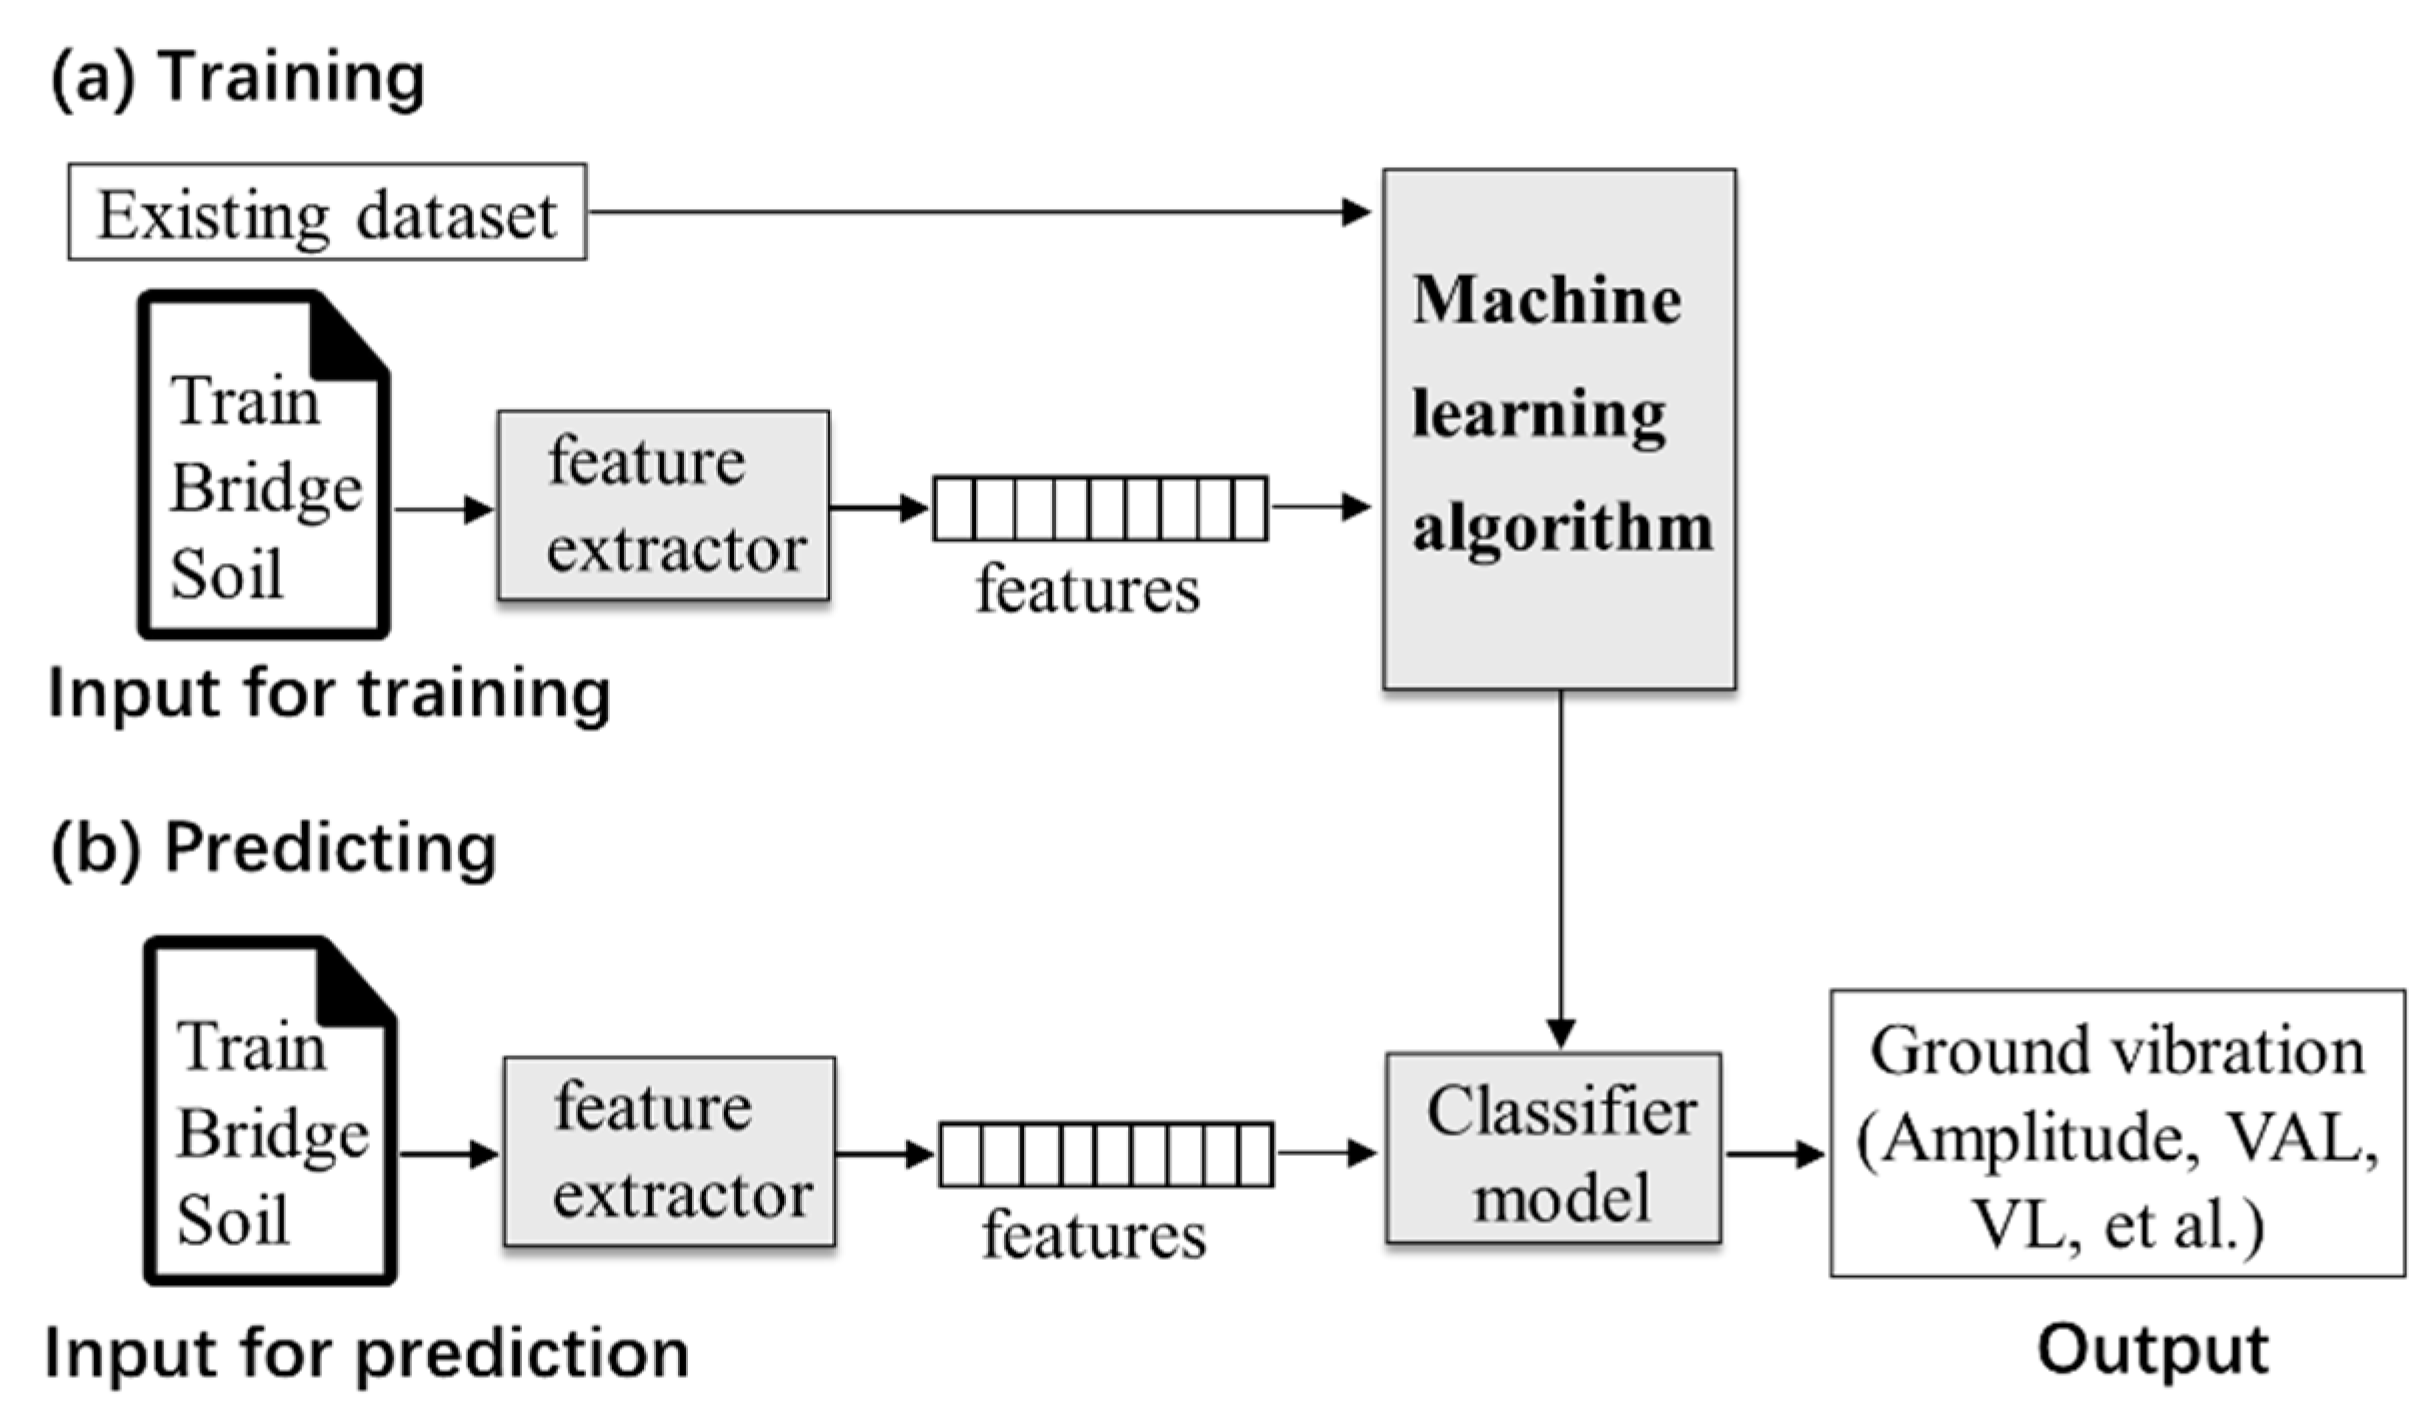
In order to effectively predict the environmental vibrations induced by the HSR train in a variety of conditions, the machine-learning technique is introduced in the following section. Machine learning can automatically predict ground vibrations based on large number of existing sampling data by means of computer training and learning. The pro-posed prediction procedure is shown in
Figure 4.
As shown in
Figure 6, the input dataset for training is formed from the experimental data, including site soil parameters, deterministic parameters of high-speed railway and bridge, and the output dataset for prediction mainly include amplitude, VAL, VL of ground vibration. Then the expected prediction can be obtained by machine learning from large number of training sample patterns when some known site condition and train and bridge parameters are putting in.
In the following, the reliability of linear regression (LR), support vector machine (SVM) and random forest (RF) are discussed and their advantages are compared in solv-ing the environmental vibration problems. The LR is a kind of quantitative statistical analysis method to describe the linear dependence between variables. Different from line-ar regression, the SVM algorithm adopts a non-linear mapping kernel function to map the data from the input space to a high-dimensional feature space. In the high-dimensional space, the samples are linearly separable and nonlinear treatment is possible with kernel functions.
Different from the above two algorithms, the RF algorithm constitutes multiple deci-sion trees with random data, and the final classification results are obtained by voting. RF is an ensemble learning algorithm for solving classification and regression problems. Except that the training data of each tree is random, the split fields of each node in the tree are random, that is, the feature dimensions of the selected samples are different when the tree is split. With the introduction of these two randomness, there are obvious differences among the decision trees of the random forest, which makes better generalization perfor-mance.
In order to compare the accuracy of above three algorithms, fifty sets of experimental data of ground vibrations are used as the training dataset. Also, the train speed V (200km/h-335km/h), the distance D from measuring point to pier center (1m-40m), the central frequency fc (1–100Hz) and the vibration direction are taken as eigenvalues, and the VAL of ground vibration is taken as prediction value.
2.4. Hyperparameter Tuning and Optimization Method
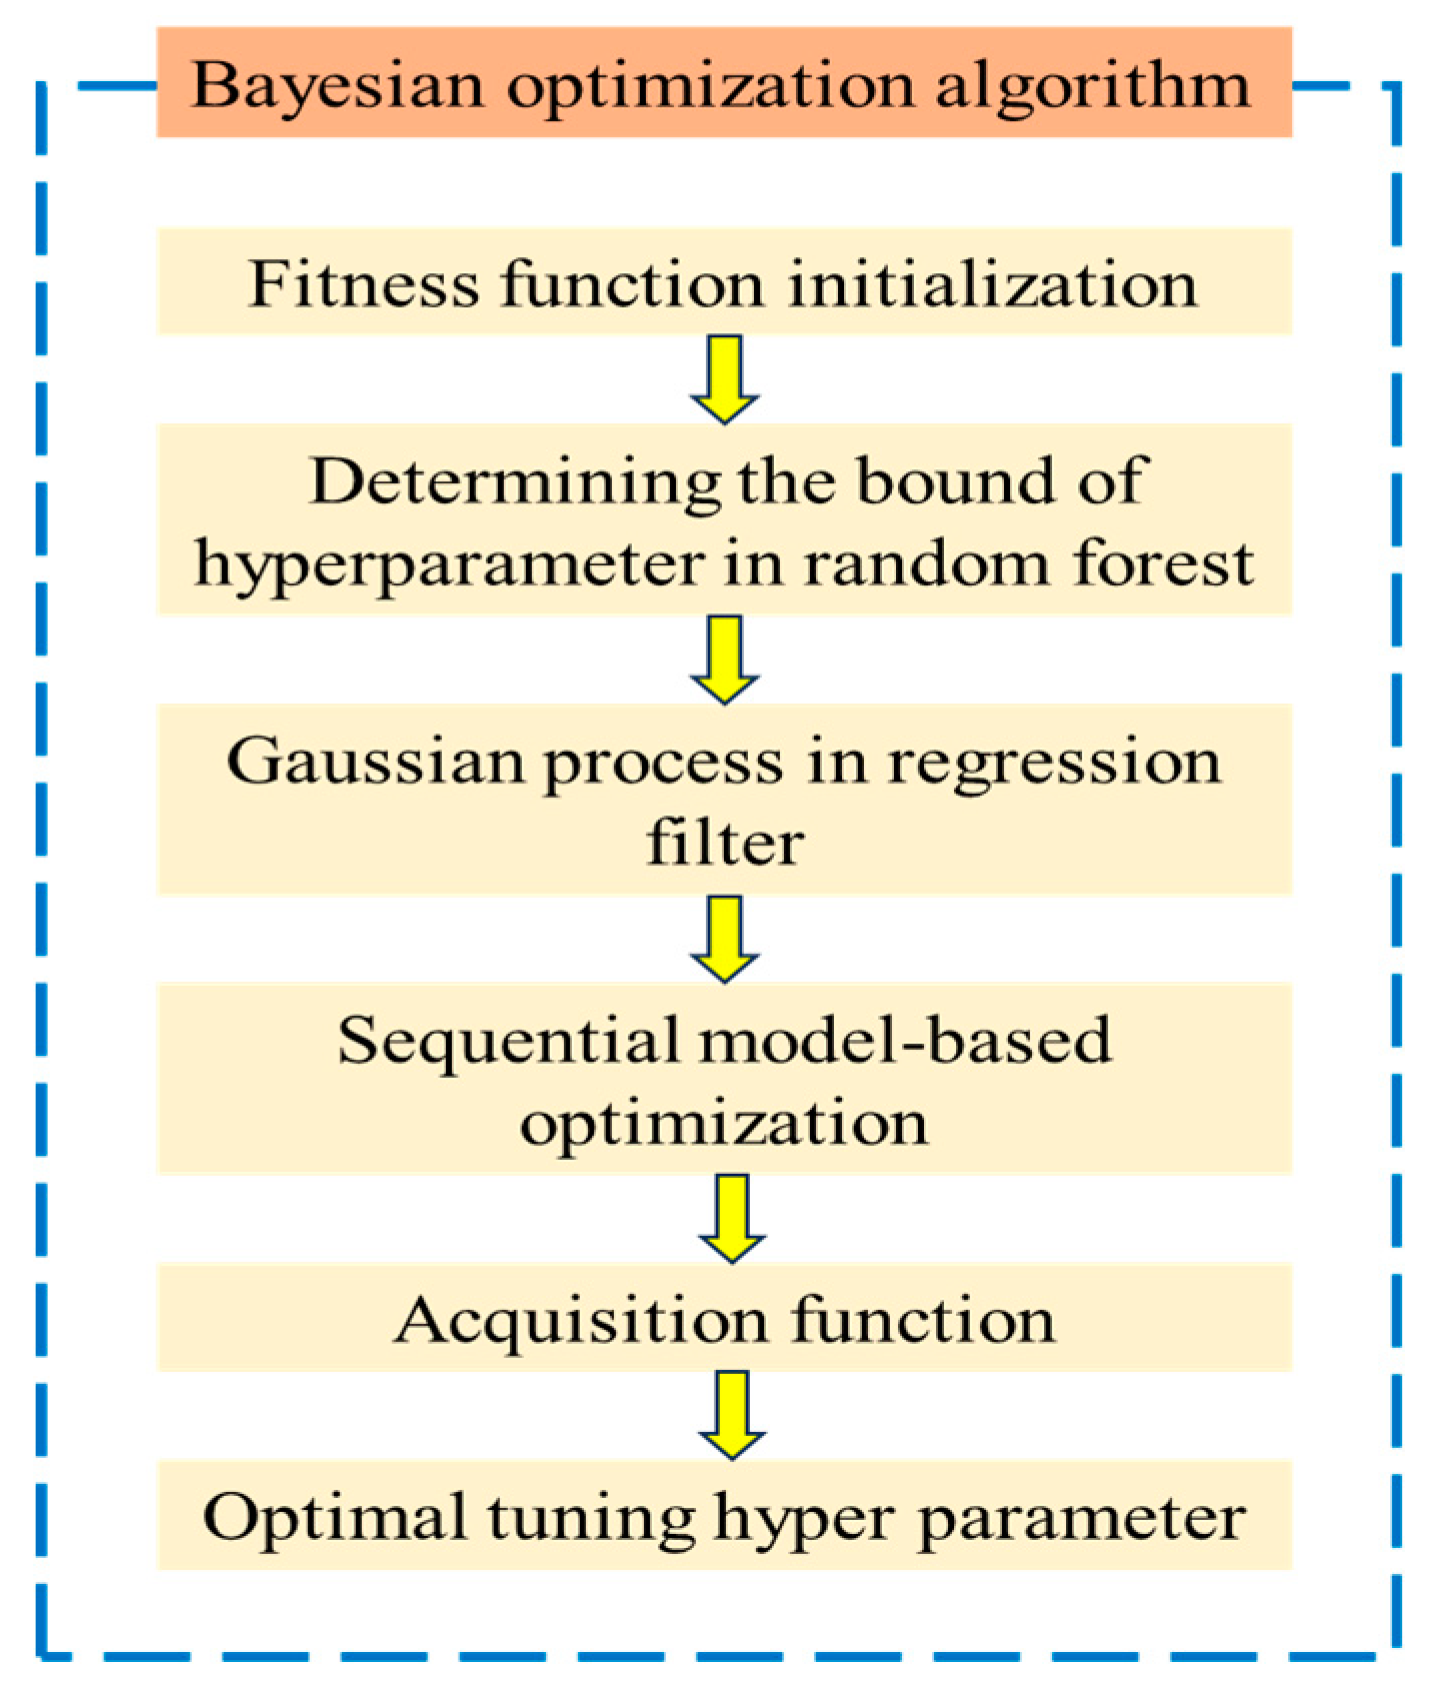
In machine learning prediction models, if the hyperparameters cannot be chosen and found correctly, the underfitting or overfitting problems might be caused. Currently, two common optimization methods for hyperparameter sets are grid search39 and random search40. Grid search determines the optimal value by finding all the points in the search range, while random search doesn’t test all the values between the upper bound and the lower bound, but randomly selects sample points in the search range. When the number of searches is the same, random search will try more parameter values than grid search. However, grid search and random search will ignore the information of the previous point when testing a new point, but Bayesian optimization41 algorithm uses a completely dif-ferent method from grid search and random search when searching for the optimal pa-rameters, and it uses Gaussian process as the probabilistic model and probability of im-provement as the acquisition function that can make full use of the previous information.
In the hyperparameters of random forest, “n_estimators” is defined as the number of decision trees, and it is easy to be ill-fitted if “n_estimators” is too small. In general, the more decision trees there are, the better the algorithm is, but the computing cost will also increase. When the number of trees exceeds a critical value, the effect of the algorithm is not significantly better. In addition, “max_features” is the maximum feature number to be considered when the optimal model of the decision tree is constructed, is the size of the random subset of features to be considered when dividing nodes. “min_samples_split” is the minimum number of samples divisible by nodes, and “max_depth” is the maximum depth of decision tree. The above four hyperparameters are selected to be optimized and the range of every parameter is shown here.
3. Results and discussion
3.1. Characteristics Analysis of Measured Ground Vibrations
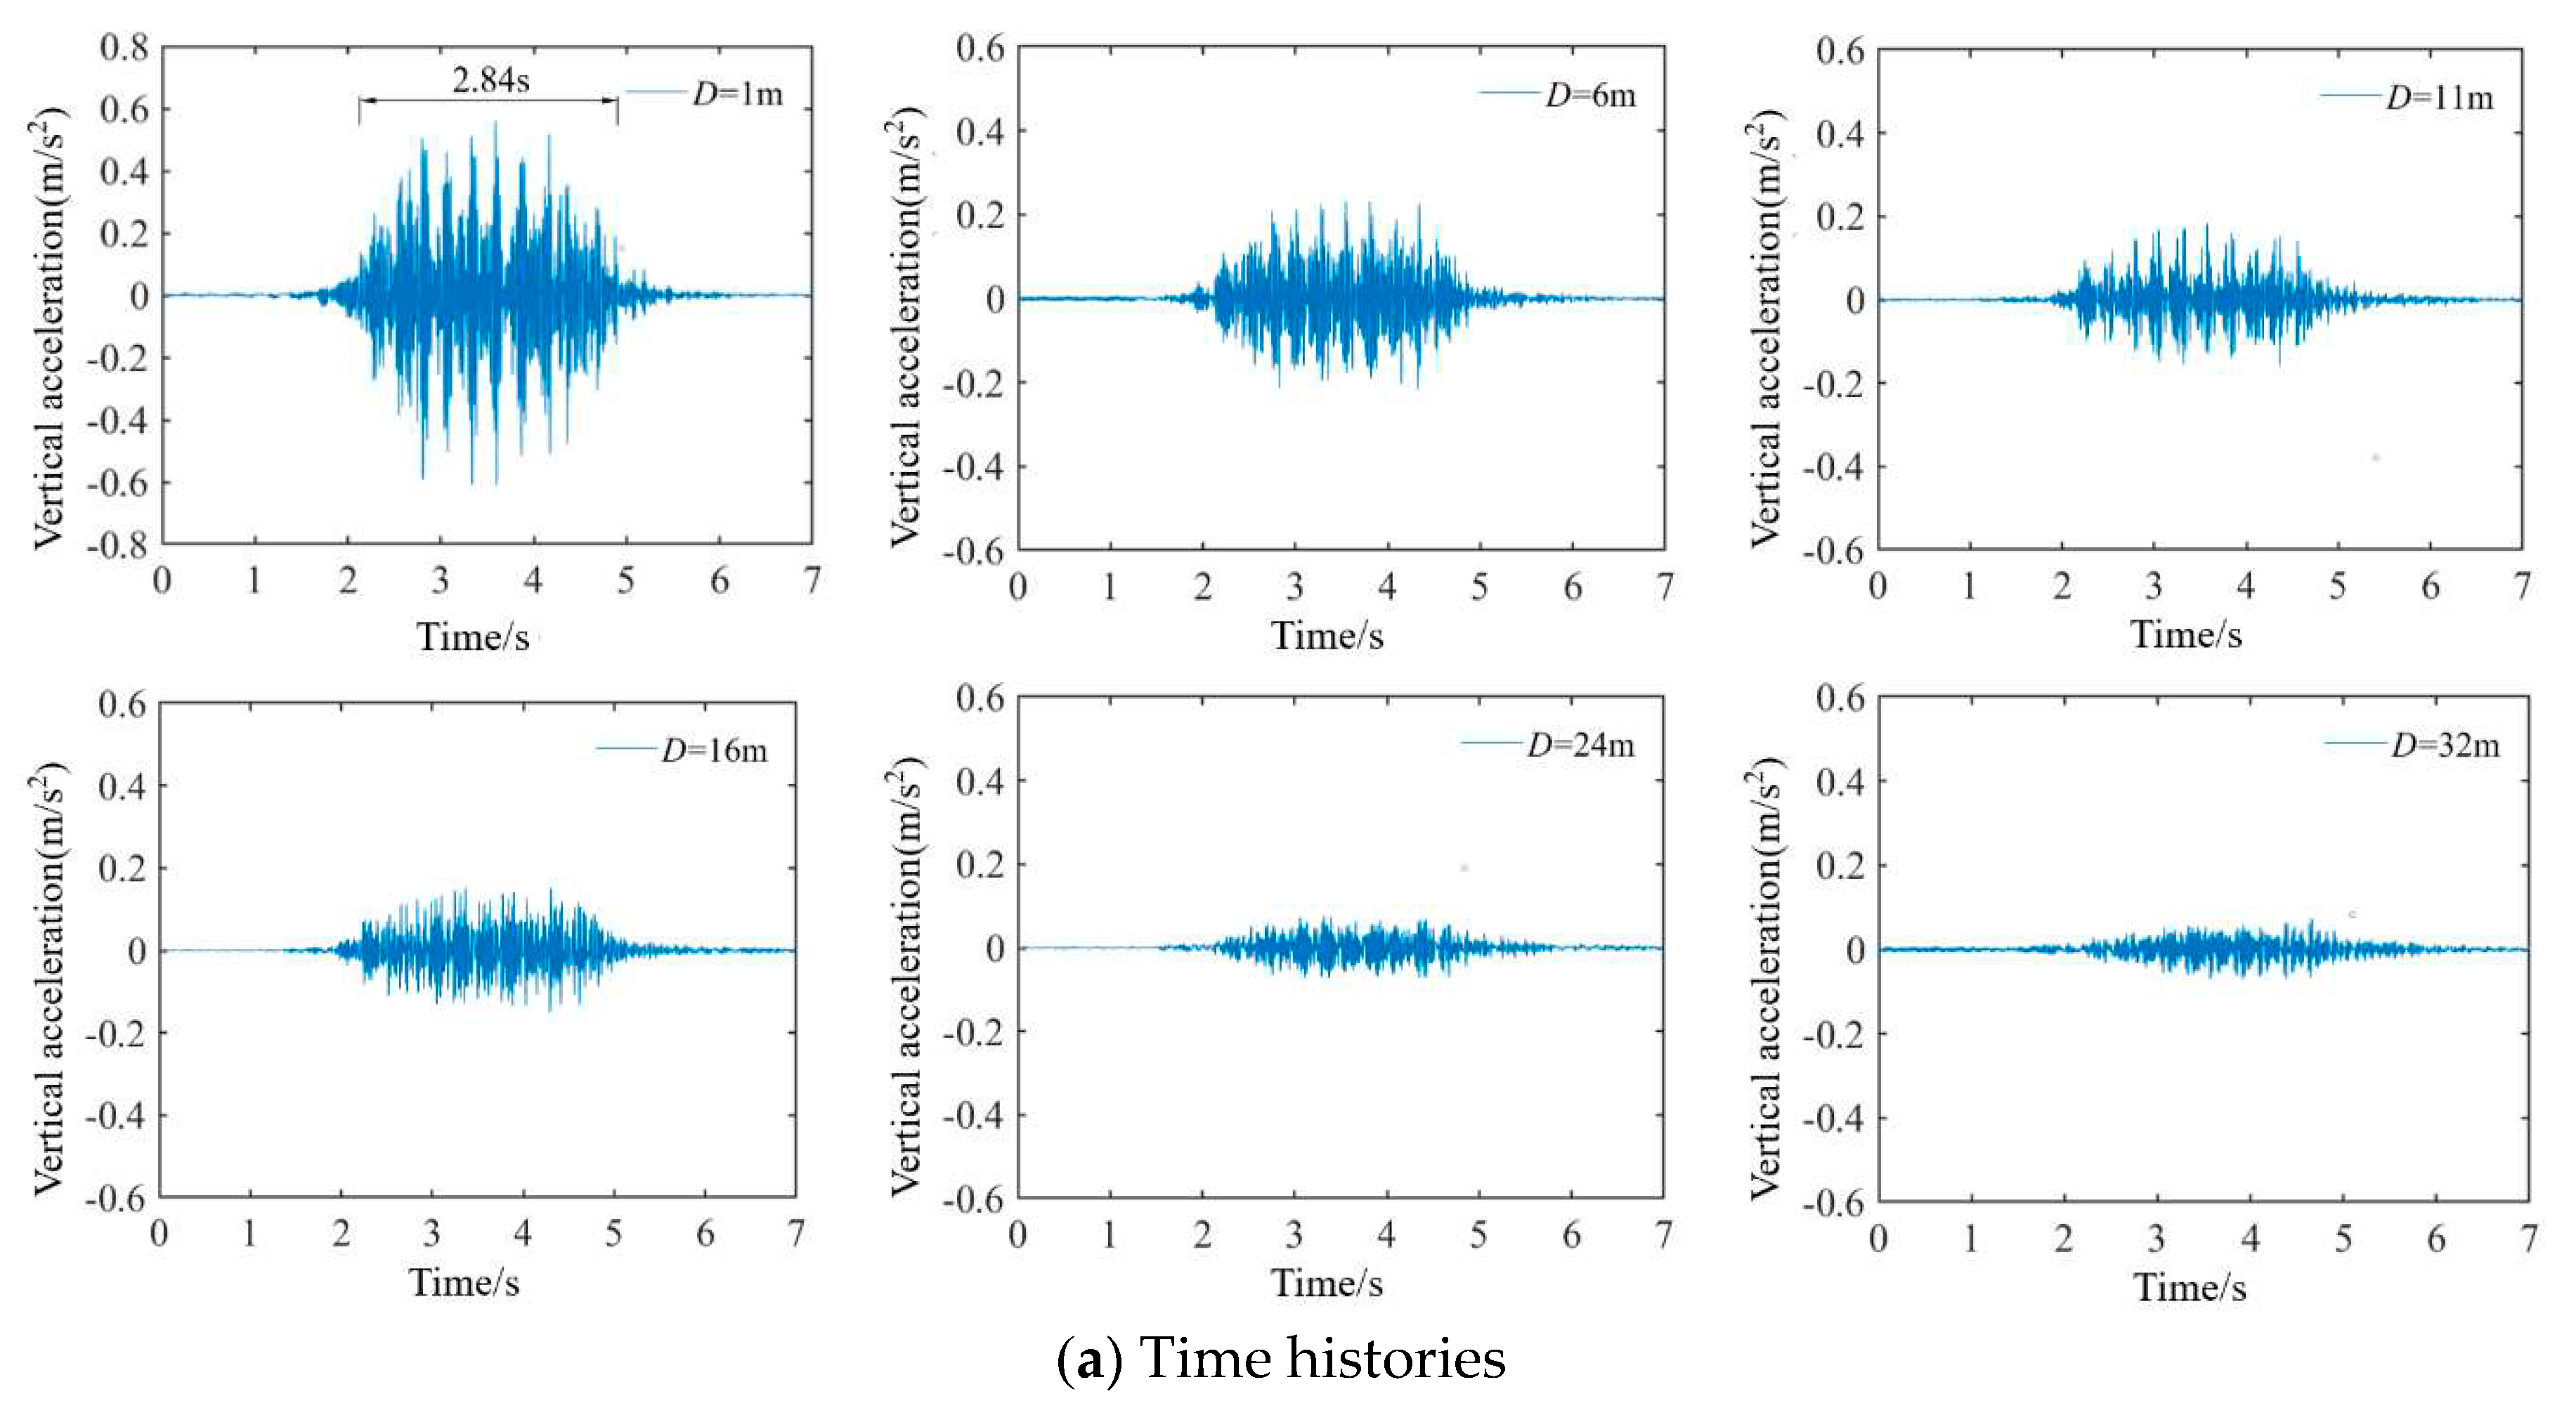
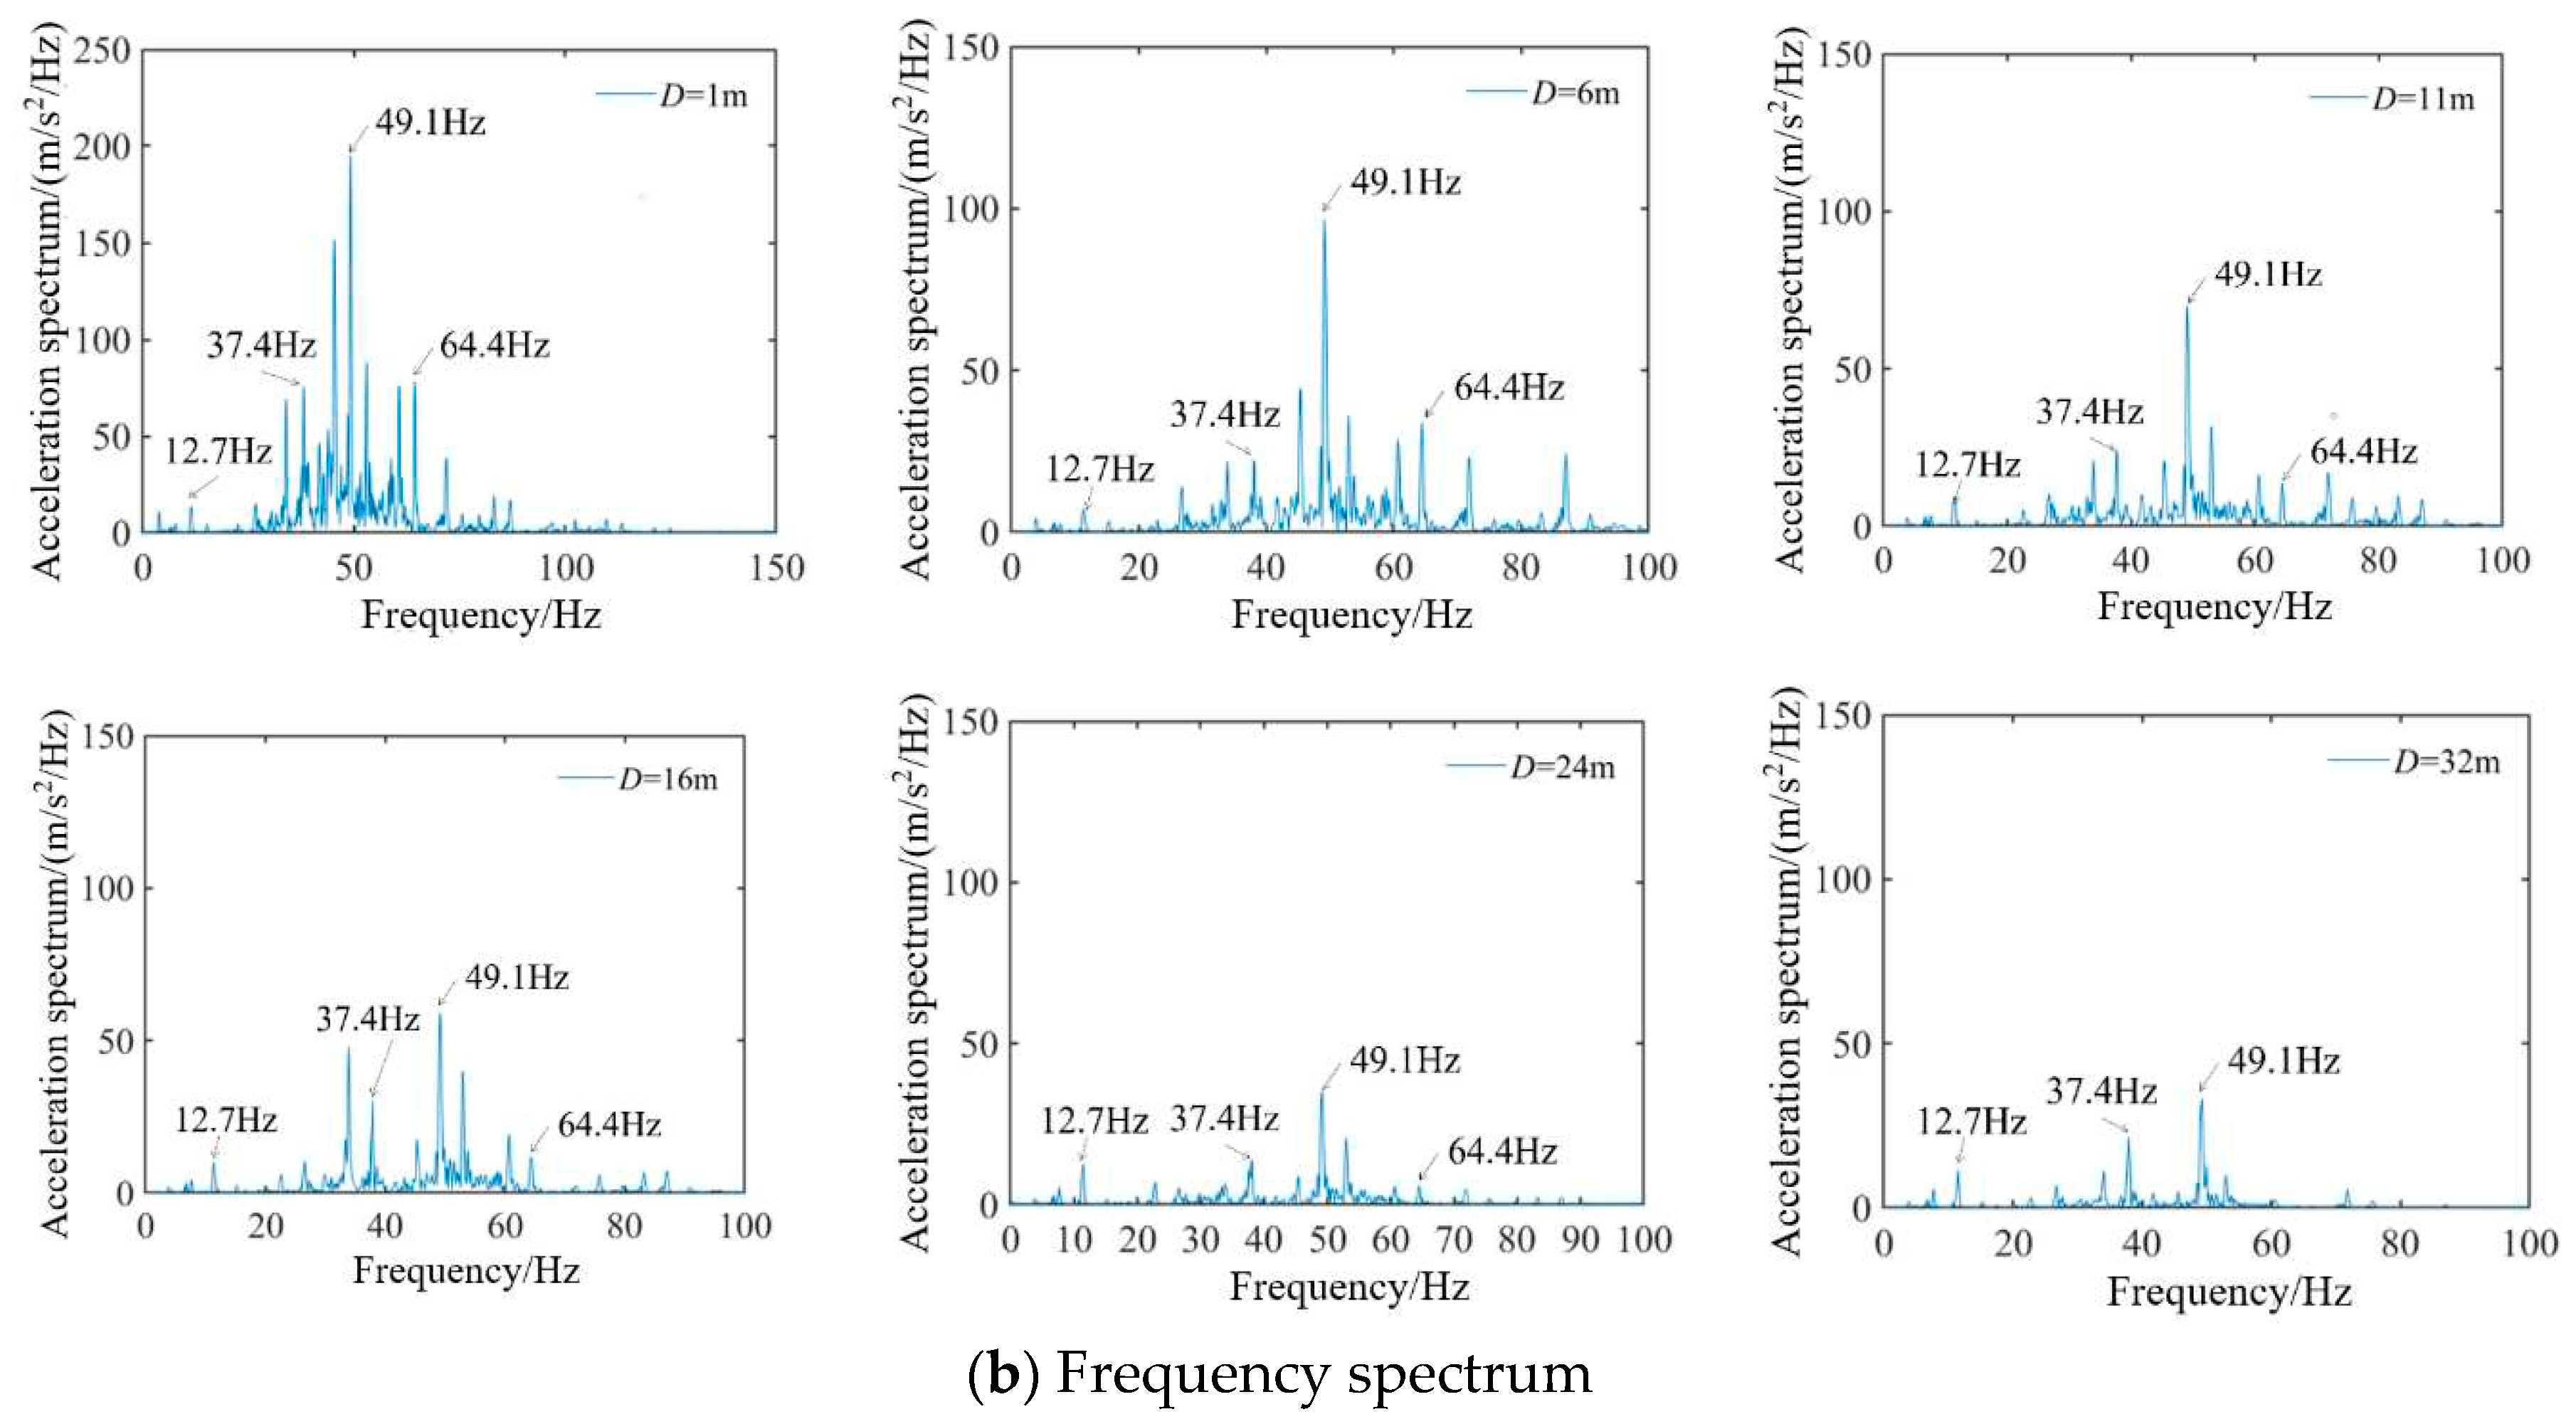
Figure 6 shows the time histories and Fourier spectra of vertical ground accelerations at different distances
Ds when the train speed is
V=335km/h. From the time histories of acceleration from
D = 1m to
D = 32m on the ground, it can be seen that the peak value of acceleration decreases rapidly, while from
D = 11m to
D = 32m, the attenuation gradually slows down.
It can also be seen from
Figure 6a that there is obvious cyclic loading phenomenon as a result of train axles for the vertical ground acceleration, and the loading time is about 2.84s at the location of
D = 1m on ground, which is just equal to the theoretical calculation time of 8 vehicles crossing the bridge
, indicating that the measured loading time is consistent with the theoretical loading time.
From the spectra of ground accelerations (
Figure 6b), it can be seen that the vibration wave with high-frequency components of 30–100Hz decay rapidly with the increase of distance, while that with low-frequency components of 0–30Hz decays more slowly and propagates farther.
Since the periodic excitation frequency from the running train can be calculated by
fi=
V/
Li (
i=1, 2, 3, 4, and
Li can be seen in
Figure 3) [
35,
36], the wheelbase loading frequency is
f1=37.2Hz, the loading frequency from periodic center distance between adjacent trains is
f2=12.2Hz, the loading frequency from periodic center distance between front and rear bogies of the same train is
f3=5.4Hz, and the loading frequency from periodic carriage length is
f4=3.72Hz. It can be interestingly observed from
Figure 3b that several dominant frequencies in the spectra of ground vibration just correspond to the periodic loading frequencies from the train, and the exciting frequency
f1 and
f2 are dominant in the four kinds of periodic frequencies excited by trains.
3.2. Assessment of Environmental Vibrations Generated from the HSR Bridge
Since the one-third octave spectrum can reflect the distribution of vibration energy within different frequency bandwidth, it is usually used to evaluate the influence of environmental vibration on people’s living. According to international standard ISO 8041 [
37], the evaluation indicators of vibration acceleration level (VAL, units: dB) in one-third octave is adopted herein, which can be calculated as
where,
a0 represents the reference acceleration defined as 10
-6m/s
2;
arms represents the time-averaged root-mean-square (RMS) acceleration and can be calculated by
where,
ai(
t) denotes the instantaneous vibration acceleration in a specified axis as a function of the instantaneous time
t;
T is the duration of the measurement.
Take a set of experimental data under the train speed
V=300km/h as an example, and the VALs of all the measuring points on ground in the three directions are shown in
Figure 4. It can be found that the variation of VALs with frequencies have similar tendency, but the vertical vibrations are obviously greater than those horizontal (
x-direction) and transverse (
y-direction) vibrations.
Also, the characteristic frequencies corresponding to the vibration peaks in
Figure 4, usually called as predominant frequencies, are 2.5Hz, 3.15Hz, 6.3Hz, 10Hz, 31.5Hz, 50Hz for the horizontal and transverse ground vibration, and 3.15Hz, 6.3Hz, 10Hz, 50Hz for the vertical ground vibrations. Evidently, the environmental vibration has the low-frequency properties, and the frequency band between 50–80Hz is the dominant attenuation zones of environmental vibrations.
According to the sensitivity degree of human body to environmental vibration with different frequencies in different directions, it is necessary to consider the frequency-weighted acceleration in evaluating the impact of environmental vibration on the human body [
38]. Therefore, the overall vibration effect of rail traffic on nearby environment is evaluated by the frequency-weighted vibration level (VL), which is further put forward as:
where
represents the frequency-weighted RMS acceleration and can be calculated by
in which
ki represents the weighting factor for the
i-th one-third-octave band [
37];
armsi is the RMS value of vibration acceleration in the
i-th one-third-octave band; and
n is the one-third-octave band numbers.
Figure 8 shows the VL contours of ground responses with the train speed and the distance. It can be observed from density distribution of the contours that the ground vibrations along
x-direction attenuate rapidly within
D=6m and those along
y-direction and
z-direction attenuate rapidly within
D=11m for all the train speeds. Moreover, when the distance
D is greater than 26m, most of the environmental vibrations are less than 70dB, and attenuate slowly with the distance. In addition, the VL increases with train speed within
D=6m, and the increase tendency becomes more and more gentle when
D is greater than 11m.
3.3. Determination of the Optimal Machine Learning Algorithm
In evaluating the performance of the machine learning algorithm, the following indexes are often used: mean square error (MSE), root mean square error (RMSE), absolute mean error (MAE) and determination coefficient (R
2). They can be calculated by the following formulae:
where,
is the difference between real value in the test set and the predicted value;
m is the number of measurements. Obviously, the smaller the indicators MSE, RMSE and MAE are, the better the fitting effect of the prediction model is; the value range of R
2 is between 0 and 1, and generally speaking, the larger R
2 is, the better the fitting effect of the model is.
When the regression fitting effect of the machine learning algorithm is evaluated, the same data set not only carries on the training, but also carries on the error estimation of the model, which is very inaccurate. To overcome this problem, a K-fold cross-validation approach is proposed herein. In the method, the original data is divided into K groups (generally equally divided), and each divided subset of data is considered to be a validation set separately, while the remaining K-1 groups of subset data are used as training sets. Thus, the K models can be obtained, and the average classification accuracy of the final validation set of these K models is used as the performance index, which improves the generalization performance of the regression model in machine learning algorithm.
In the following, the data set is randomly divided into training set and test set in a ratio of 7:3, with 2822 training set samples and 1210 test set samples. The training data sets are trained using LR, SVM (including
linear kernel, polynomial kernel and gaussian radial basis function), decision tree regression and RF, respectively. In addition, a 5-fold cross-validation is used to assess the performance of each regression diagnostic model: the training set is divided into 5 aliquots, and the model was trained with 80% data at a time; using 20% data to test the accuracy of fault diagnosis model. The comparison of indicators for several machine learning algorithms is shown in
Table 2.
It can be found from
Table 1 that the MSE, RMSE, MAE of RF algorithm are the smallest among six kinds of machine learning algorithms while R
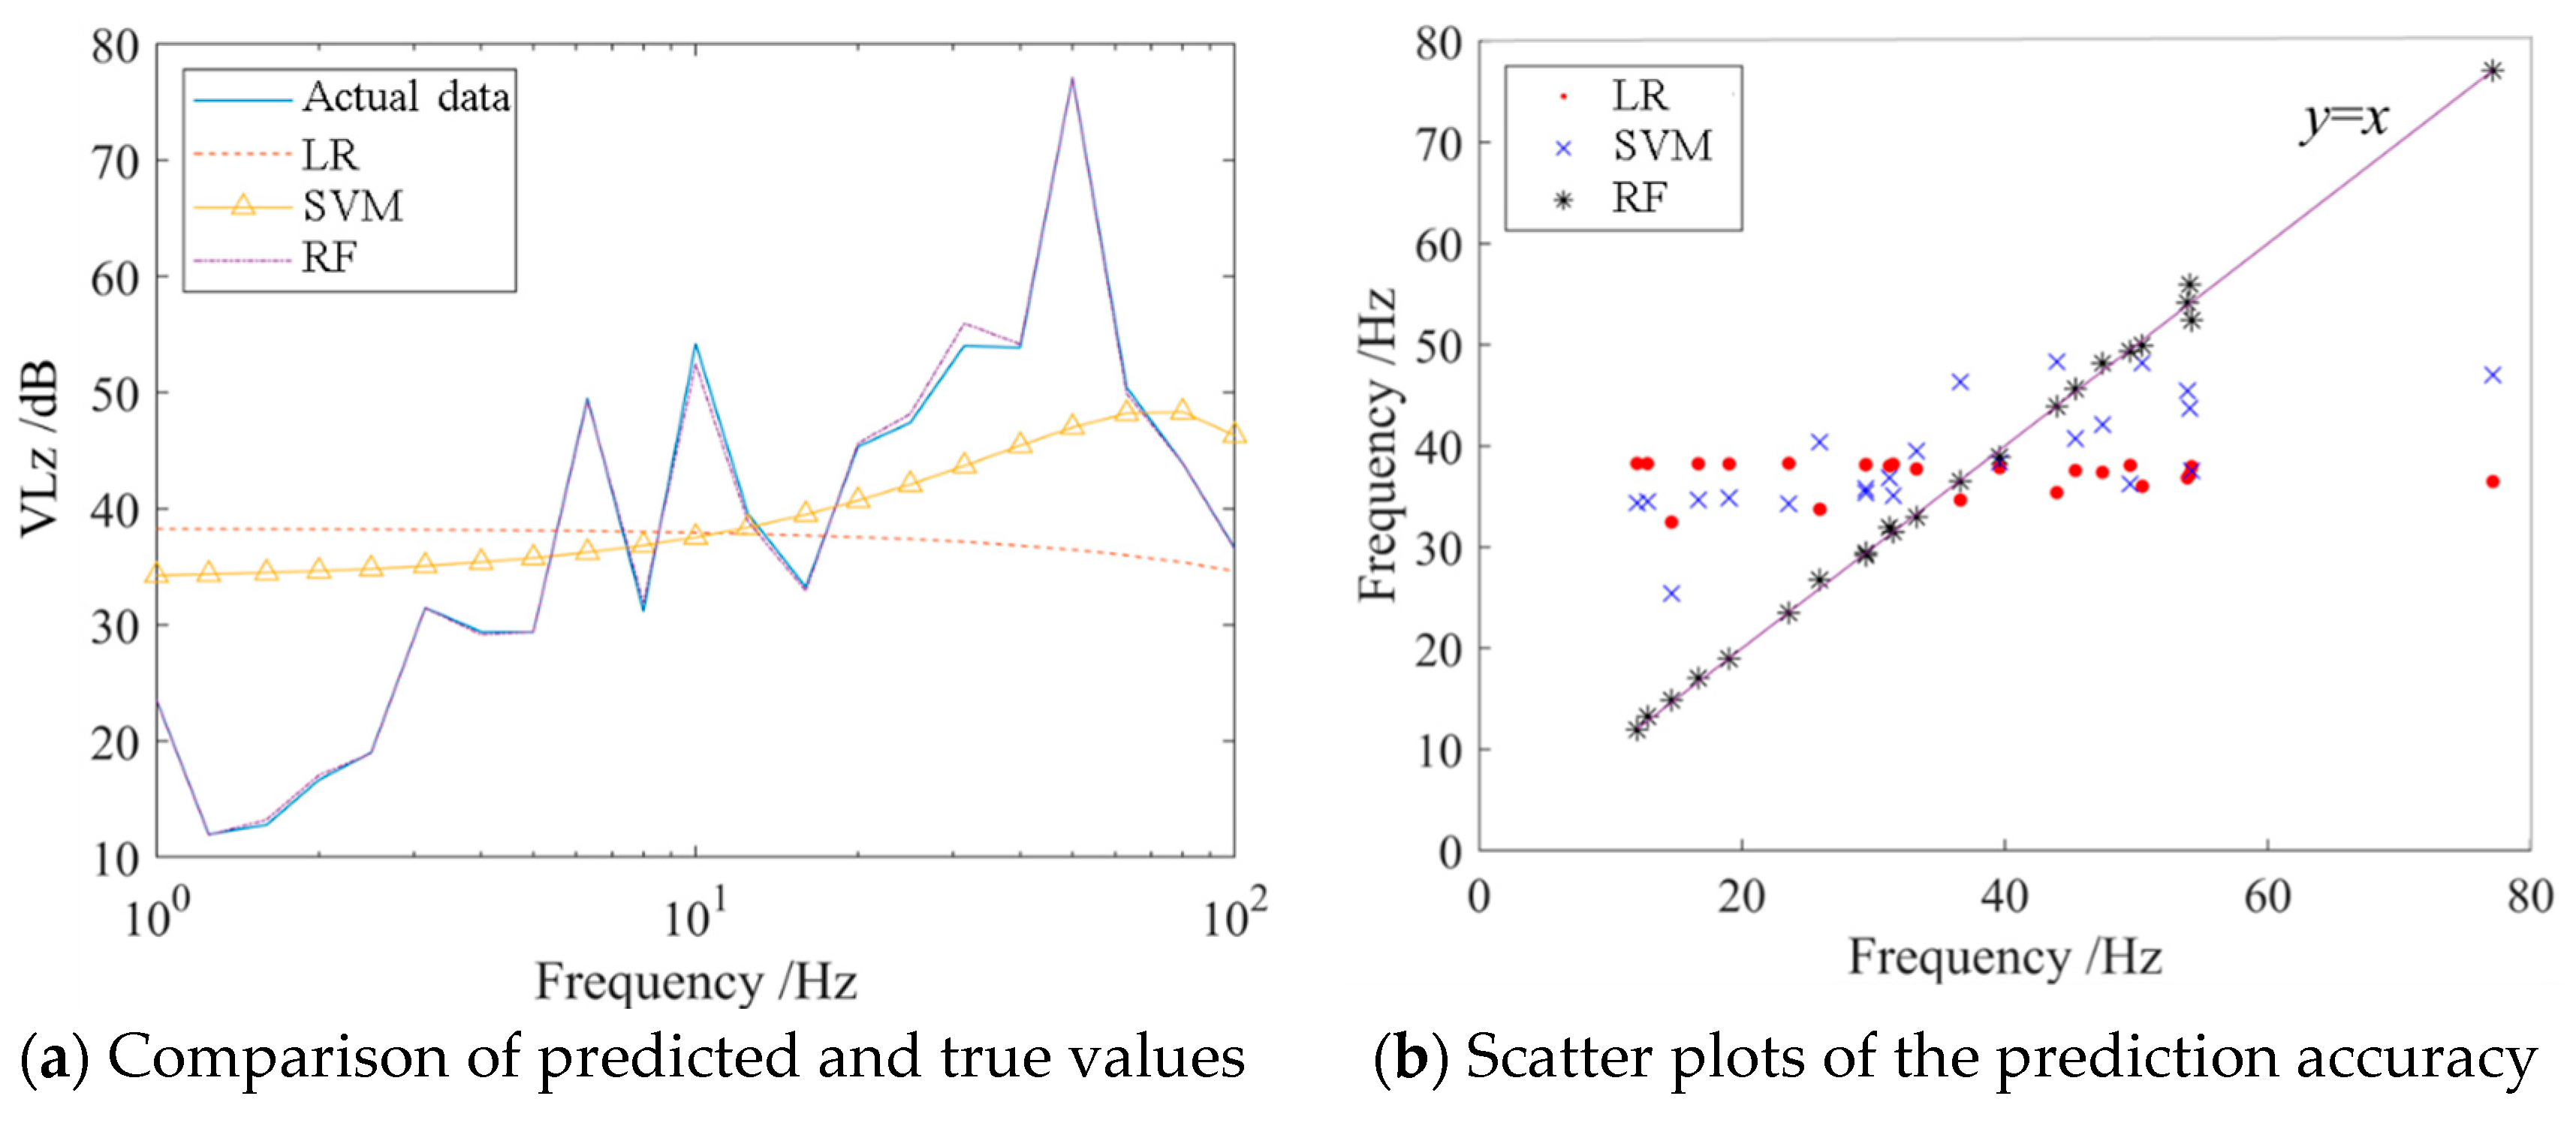
2 is the greatest, which indicates the RF is the optimal algorithm in the predicting the environmental vibrations induced by high-speed railway. In order to further investigate the prediction performance of LR, SVM, and RF, the prediction values are compared with the actual data, as shown in
Figure 8.
Figure 9a reflects the fit goodness of three kinds of machine learning algorithms with the experiment actual data, and
Figure 9b illustrates the proximity of predicted values to the true data (straight line
y = x). It can be observed that the random forest (RF) algorithm has the best performance and best prediction effect among the above mentioned four kinds of algorithms. Therefore, the random forest is chosen for the follow-up work.
3.4. Determination of the Optimal Machine Learning Algorithm
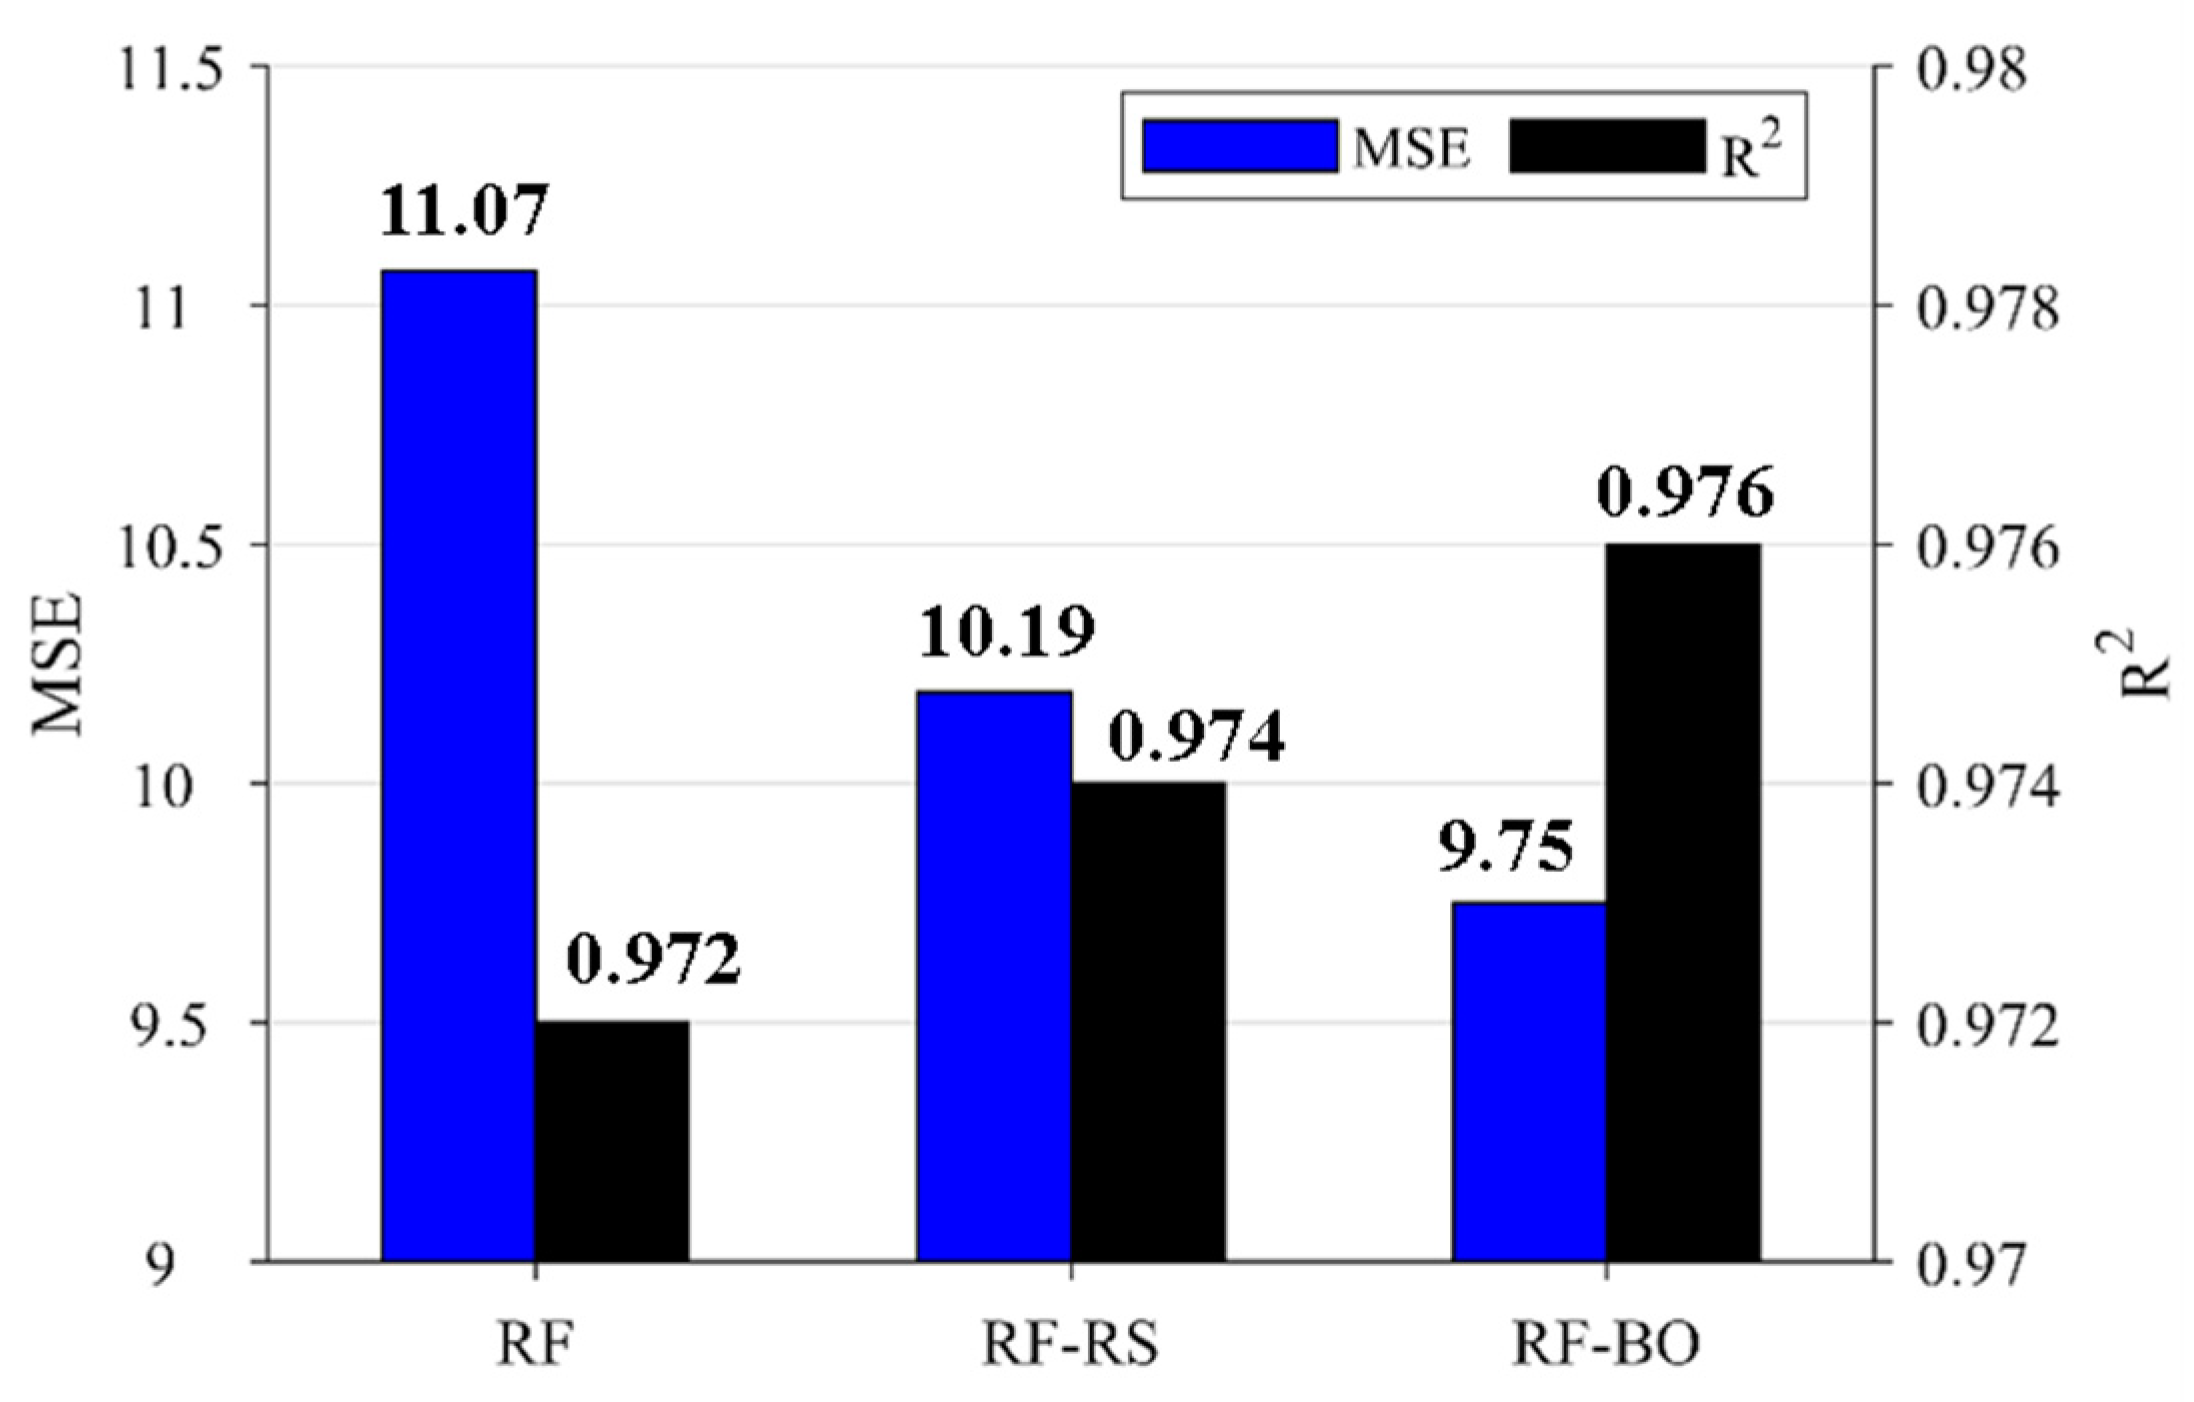
In this paper, two kinds of optimization methods for RF prediction model are respectively applied: Bayesian optimization (BO) and random search (RS). The RMSE of 5-fold cross validation is taken as the objective function, in which 100 iterations are performed in the BO method, while 300 iterations are performed in the RS method. Firstly, the optimal combination of RF parameters is obtained by means of random search and Bayesian optimization. Then the prediction performance of RF model is evaluated under the optimal RF parameters, as shown in
Figure 10. It can be seen that objective function MSE can reach 9.75 by Bayesian optimization and 10.19 by random search optimization, and also the determination coefficient R
2 can be up to 0.976 by Bayesian optimization, higher than that by RF and RF-RS. Therefore, the Bayesian optimization can search the optimal parameter set, and can make the cross-validation of RF in the training set so accurate that the prediction accuracy can be higher on the test data.
All in all, because of the active optimization strategy, Bayesian optimization algorithm can avoid the evaluation of many useless sampling points, accurately describe the distribution of the objective function, and efficiently find the optimal parameter combination. Random search parameters depend on the number of sampling times, the random sampling point is not easy to fall on the optimal combination, so the hit ratio of the optimal parameters is not as good as Bayesian optimization. So, the RF machine learning algorithm based on Bayesian optimization is strongly suggested in the prediction of environmental vibrations induced by high-speed railway.
4. Conclusions
In this paper, the on-site vibration experiment of high-speed railway was carried out, and the characteristics and attenuation law of ground vibration are analyzed. A prediction model is constructed by the random forest algorithm based on Bayesian optimization, and thus an effective prediction method based on experimental dataset and machine learning is proposed for environmental vibrations caused by HSR train, and the following conclusions can be drawn:
- (1)
The cyclic loading of vehicles can be observed obviously in the time history of ground acceleration when the observation point is close to the center line of bridge pier. Also, the periodic exciting frequencies produced by the characteristic parameters of HSR train can be obviously found as the predominant frequencies in the frequency spectra of ground vibrations;
- (2)
For the ground vibration generated by the elevated HSR railway, the medium-high frequency component within 30–200Hz attenuates rapidly with the increase of distance, while the low frequency component within 0–30Hz attenuates slowly and travels far;
- (3)
Compared with the linear regression and support vector regression, the random forest algorithm in machine learning has higher prediction accuracy and is the preferred method in intellectual prediction of environmental vibration;
- (4)
The Bayesian optimization has excellent performance and high efficiency in achieving efficient and in-depth optimization of parameters, and can be combined with the RF machine learning algorithm to effectively predict the environmental vibrations induced by the high-speed railway.
Author Contributions
Conceptualization, Y.C. and B.L.; methodology, Y.C. and B.L.; software, Y.C. and B.L.; validation, B.L., Q.X. and Y.Z.; formal analysis, B.L.; investigation, B.L.; resources, Y.C.; data curation, B.L.; writing—original draft preparation, Y.C. and B.L.; writing—review and editing, Y.C. and B.L.; visualization, B.L.; supervision, Q.X. and Y.Z.; project administration, B.L., Q.X. and Y.Z.; funding acquisition, Y.C. All authors have read and agreed to the published version of the manuscript.”
Funding
The research is supported by the grant of Natural Science Foundation of Beijing Municipality (L221023).
Institutional Review Board Statement
Not applicable.
Informed Consent Statement
Not applicable.
Data Availability Statement
Not applicable.
Conflicts of Interest
The authors declared no potential conflicts of interest with respect to the research, authorship, and/or publication of this article.
References
- Çelebi, E.; Zülfikar, A.C.; Göktepe, F.; Kırtel, O.; Faizan, A.A.; İstegün, B. In-situ measurements and data analysis of environmental vibrations induced by high-speed trains: A case study in North-Western Turkey. Soil Dyn. Earthq. Eng. 2022, 156, 107211. [Google Scholar] [CrossRef]
- Ulgen, D.; Ertugrul, O.; Ozkan, M. Measurement of ground borne vibrations for foundation design and vibration isolation of a high-precision instrument. Measurement 2016, 93, 385–396. [Google Scholar] [CrossRef]
- Gregorini, A.; Paganoni, S.; Zappa, E.; Cigada, A.; Canali, F. Effects of environmental vibration on ancient stained-glass windows. J. Cult. Heritage 2022, 56, 65–74. [Google Scholar] [CrossRef]
- Zhang, C.; Zhang, N.; Zhang, Y.; Liu, X. Prediction of Traffic Vibration Environment of Ancient Wooden Structures Based on the Response Transfer Ratio Function. Sensors 2022, 22, 8414. [Google Scholar] [CrossRef] [PubMed]
- Lang, J. Results of measurements on the control of structure-borne noise from subways: the 7th International Congress on Acoustics, Budapest, 1971.
- International Organization for Standardization. Mechanical vibration: Ground-borne noise and vibration arising from rail systems-Part1: General guidance (ISO 14837-1). 2005.
- Yulong, H.; Qing, Z.; Lizhong, Y. Environmental vibration test and analysis of viaduct bridge of 350km/h high-speed railway. Noise Vibration and Control 2012; 32(1): 170-173. [CrossRef]
- Connolly, D.; Costa, P.A.; Kouroussis, G.; Galvin, P.; Woodward, P.; Laghrouche, O. Large scale international testing of railway ground vibrations across Europe. Soil Dyn. Earthq. Eng. 2015, 71, 1–12. [Google Scholar] [CrossRef]
- Lutz, Auersch. Simple and fast prediction of train-induced track forces, ground and building vibrations. Rail. Eng. Science 2020; 28(3): 232-250. [CrossRef]
- Li, X.; Cao, G.; Zu, Y. Tests for vibration transmission characteristics of a high-speed railway track-bridge-soil system. Journal of Vibration and Shock 2019; 38(17):58-64.
- Niu, D.; Deng, Y.; Mu, H.; Chang, J.; Xuan, Y.; Cao, G. Attenuation and propagation characteristics of railway load-induced vibration in a loess area. Transp. Geotech. 2022, 37. [Google Scholar] [CrossRef]
- Li, W.; Dwight, R.A.; Zhang, T. On the study of vibration of a supported railway rail using the semi-analytical finite element method. J. Sound Vib. 2015, 345, 121–145. [Google Scholar] [CrossRef]
- Yao, H.L.; Hu, Z.; Lu, Z.; Zhan, Y.X.; Liu, J. Prediction of Ground Vibration from High Speed Trains Using a Vehicle–Track–Ground Coupling Model. Int. J. Struct. Stab. Dyn. 2016, 16, 1550051. [Google Scholar] [CrossRef]
- Gao, G.; Song, J.; Chen, G.; Yang, J. Numerical prediction of ground vibrations induced by high-speed trains including wheel–rail–soil coupled effects. Soil Dyn. Earthq. Eng. 2015, 77, 274–278. [Google Scholar] [CrossRef]
- Gao, G.; Zhang, J.; Chen, J.; Bi, J. Investigation of saturation effects on vibrations of nearly saturated ground due to moving train loads using 2.5D FEM. Soil Dyn. Earthq. Eng. 2022, 158, 107288. [Google Scholar] [CrossRef]
- Bucinskas, P.; Andersen, L. Dynamic response of vehicle-bridge-soil system using lumped-parameter models for structure-soil interaction, Computers and Structures 2020; 238: 106270. [CrossRef]
- Colaço, A. ; Pedro, A C.; Paulo, A M.; Calçada, R. Vibrations induced by railway traffic in buildings: Experimental validation of a sub-structuring methodology based on 2.5D FEM-MFS and 3D FEM. Engineering Structures 2021; 240: 112381. [CrossRef]
- Romero, A.; Galvín, P.; António, J.; Domínguez, J.; Tadeu, A. Modelling of acoustic and elastic wave propagation from underground structures using a 2.5D BEM-FEM approach. Eng. Anal. Bound. Elements 2017, 76, 26–39. [Google Scholar] [CrossRef]
- Barbosa, J.; Park, J.; Kausel, E. Perfectly matched layers in the thin layer method, Computer Methods in Applied Mechanics and Engineering 2012; 217-220: 262-274. [CrossRef]
- Bencharif, R.; Hadid, M.; Mezouar, N. Hybrid BEM-TLM-PML method for the dynamic impedance functions calculation of a rigid strip-footing on a nearly saturated poroelastic soil profile. Eng. Anal. Bound. Elements 2020, 116, 31–47. [Google Scholar] [CrossRef]
- Connolly, D.; Kouroussis, G.; Woodward, P.; Giannopoulos, A.; Verlinden, O.; Forde, M. Scoping prediction of re-radiated ground-borne noise and vibration near high speed rail lines with variable soils. Soil Dyn. Earthq. Eng. 2014, 66, 78–88. [Google Scholar] [CrossRef]
- Galvín, P.; Mendoza, D.; Connolly, D.; Degrande, G.; Lombaert, G.; Romero, A. Scoping assessment of free-field vibrations due to railway traffic. Soil Dyn. Earthq. Eng. 2018, 114, 598–614. [Google Scholar] [CrossRef]
- Yao, J.; Xia, H.; Zhang, N.; Yu, B. Prediction on building vibration induced by moving train based on support vector machine and wavelet analysis. J. Mech. Sci. Technol. 2014, 28, 2065–2074. [Google Scholar] [CrossRef]
- Paneiro, G.; Durão, F.O.; e Silva, M.C.; Neves, P.F. Artificial neural network model for ground vibration amplitudes prediction due to light railway traffic in urban areas. Neural Comput. Appl. 2018, 29, 1045–1057. [Google Scholar] [CrossRef]
- Fang, L.; Yao, J.; Xia, H. Prediction on soil-ground vibration induced by high-speed moving train based on artificial neural network model. Adv. Mech. Eng. 2019, 11, 1–10. [Google Scholar] [CrossRef]
- Yao, J.; Fang, L. Building Vibration Prediction Induced by Moving Train with Random Forest. J. Adv. Transp. 2021, 2021, 6642071. [Google Scholar] [CrossRef]
- Xu, Z.; Ma, M.; Zhou, Z.; Xie, X.; Xie, H.; Jiang, B.; Zhang, Z. Prediction of Metro Train-Induced Tunnel Vibrations Using Machine Learning Method. Adv. Civ. Eng. 2022, 2022, 4031050. [Google Scholar] [CrossRef]
- Siłka, J.; Wieczorek, M.; Woźniak, M. Recurrent neural network model for high-speed train vibration prediction from time series. Neural Comput. Appl. 2022, 34, 13305–13318. [Google Scholar] [CrossRef]
- Liang, RH.; Liu, WF.; Ma, M.; Liu, WN. An efficient model for predicting the train-induced ground-borne vibration and uncertainty quantification based on Bayesian neural network. Journal of Sound and Vibration 2021; 495: 115908. [CrossRef]
- Shahriari, B.; Swersky, K.; Wang, Z.; Adams, R.P.; de Freitas, N. Taking the Human Out of the Loop: A Review of Bayesian Optimization. Proc. IEEE 2016, 104, 148–175. [Google Scholar] [CrossRef]
- Lyu, W.; Xue, P.; Yang, F.; Yan, C.; Hong, Z.; Zeng, X.; Zhou, D. An Efficient Bayesian Optimization Approach for Automated Optimization of Analog Circuits. IEEE Trans. Circuits Syst. I: Regul. Pap. 2018, 65, 1954–1967. [Google Scholar] [CrossRef]
- Ouyang, LH. ; Park. C.; Ma, Y.; Ma, YZ.; Wang, M. Bayesian hierarchical modelling for process optimization. International Journal of Production Research 2020; 59 (15):4649-4669. [CrossRef]
- Miranda-Valdez, I.Y.; Viitanen, L.; Mac Intyre, J.; Puisto, A.; Koivisto, J.; Alava, M. Predicting effect of fibers on thermal gelation of methylcellulose using Bayesian optimization. Carbohydr. Polym. 2022, 298, 119921. [Google Scholar] [CrossRef]
- Hickish, B.; Fletcher, D.I.; Harrison, R.F. Investigating Bayesian Optimization for rail network optimization. Int. J. Rail Transp. 2020, 8, 307–323. [Google Scholar] [CrossRef]
- Xia, H.; Chen, J.G.; Xia, C.Y.; Inoue, H.; Zenda, Y.; Qi, L. An experimental study of train-induced structural and environmental vibrations of a rail transit elevated bridge with ladder tracks. Proc. Inst. Mech. Eng. Part F: J. Rail Rapid Transit 2010, 224, 115–124. [Google Scholar] [CrossRef]
- Wang, P.; Wei, K.; Wang, L.; Xiao, J. Experimental study of the frequency-domain characteristics of ground vibrations caused by a high-speed train running on non-ballasted track. Proc. Inst. Mech. Eng. Part F: J. Rail Rapid Transit 2016, 230, 1131–1144. [Google Scholar] [CrossRef]
- International Organization for Standardization. Human response to vibration-Measuring instrumentation-Part 1: General purpose vibration meters (ISO 8041-1). 2017.
- International Organization for Standardization. Mechanical vibration and shock-Evaluation of human exposure to whole-body vibration-Part1: General requirements (ISO 2631-1). 1997.
- Shi, Y.; Zhao, G.; Wang, M.; Xu, Y. An adaptive grid search algorithm for fitting spherical target of terrestrial LiDAR. Measurement 2022, 198, 111430. [Google Scholar] [CrossRef]
- Abakarov, A.; Sushkov, Y.; Almonacid, S.; Simpson, R. Thermal processing optimization through a modified adaptive random search. J. Food Eng. 2009, 93, 200–209. [Google Scholar] [CrossRef]
- Fakhrmoosavi, F.; Kamjoo, E.; Kavianipour, M.; Zockaie, A.; Talebpour, A.; Mittal, A. A stochastic framework using Bayesian optimization algorithm to assess the network-level societal impacts of connected and autonomous vehicles. Transp. Res. Part C: Emerg. Technol. 2022, 139, 103663. [Google Scholar] [CrossRef]
|
Disclaimer/Publisher’s Note: The statements, opinions and data contained in all publications are solely those of the individual author(s) and contributor(s) and not of MDPI and/or the editor(s). MDPI and/or the editor(s) disclaim responsibility for any injury to people or property resulting from any ideas, methods, instructions or products referred to in the content. |
© 2023 by the authors. Licensee MDPI, Basel, Switzerland. This article is an open access article distributed under the terms and conditions of the Creative Commons Attribution (CC BY) license (http://creativecommons.org/licenses/by/4.0/).
