Submitted:
25 June 2023
Posted:
26 June 2023
You are already at the latest version
Abstract
Keywords:
1. Introduction
2. Study area, data and Methods
2.1. Study area
2.2. Data
2.3. Artificial screening method for foehn weather processes
2.4. Selection of three-element threshold Method
2.5. Inspection methods
3. Results
3.1. Climatic characteristics of foehn in Urumqi
3.1.1. Time characteristics of foehn weather processes
3.2. Establishment of three-element identification standard for foehn in Urumqi
3.2.1. Characteristics of WD and WS during the foehn and non-foehn
3.2.2. Characteristics of Δθ and ΔP between DS and US during foehn and non-foehn periods
3.3. Establishment of identification standard for foehn in Urumqi
3.4. Construction of probability predictors for foehn in Urumqi
4. Conclusions
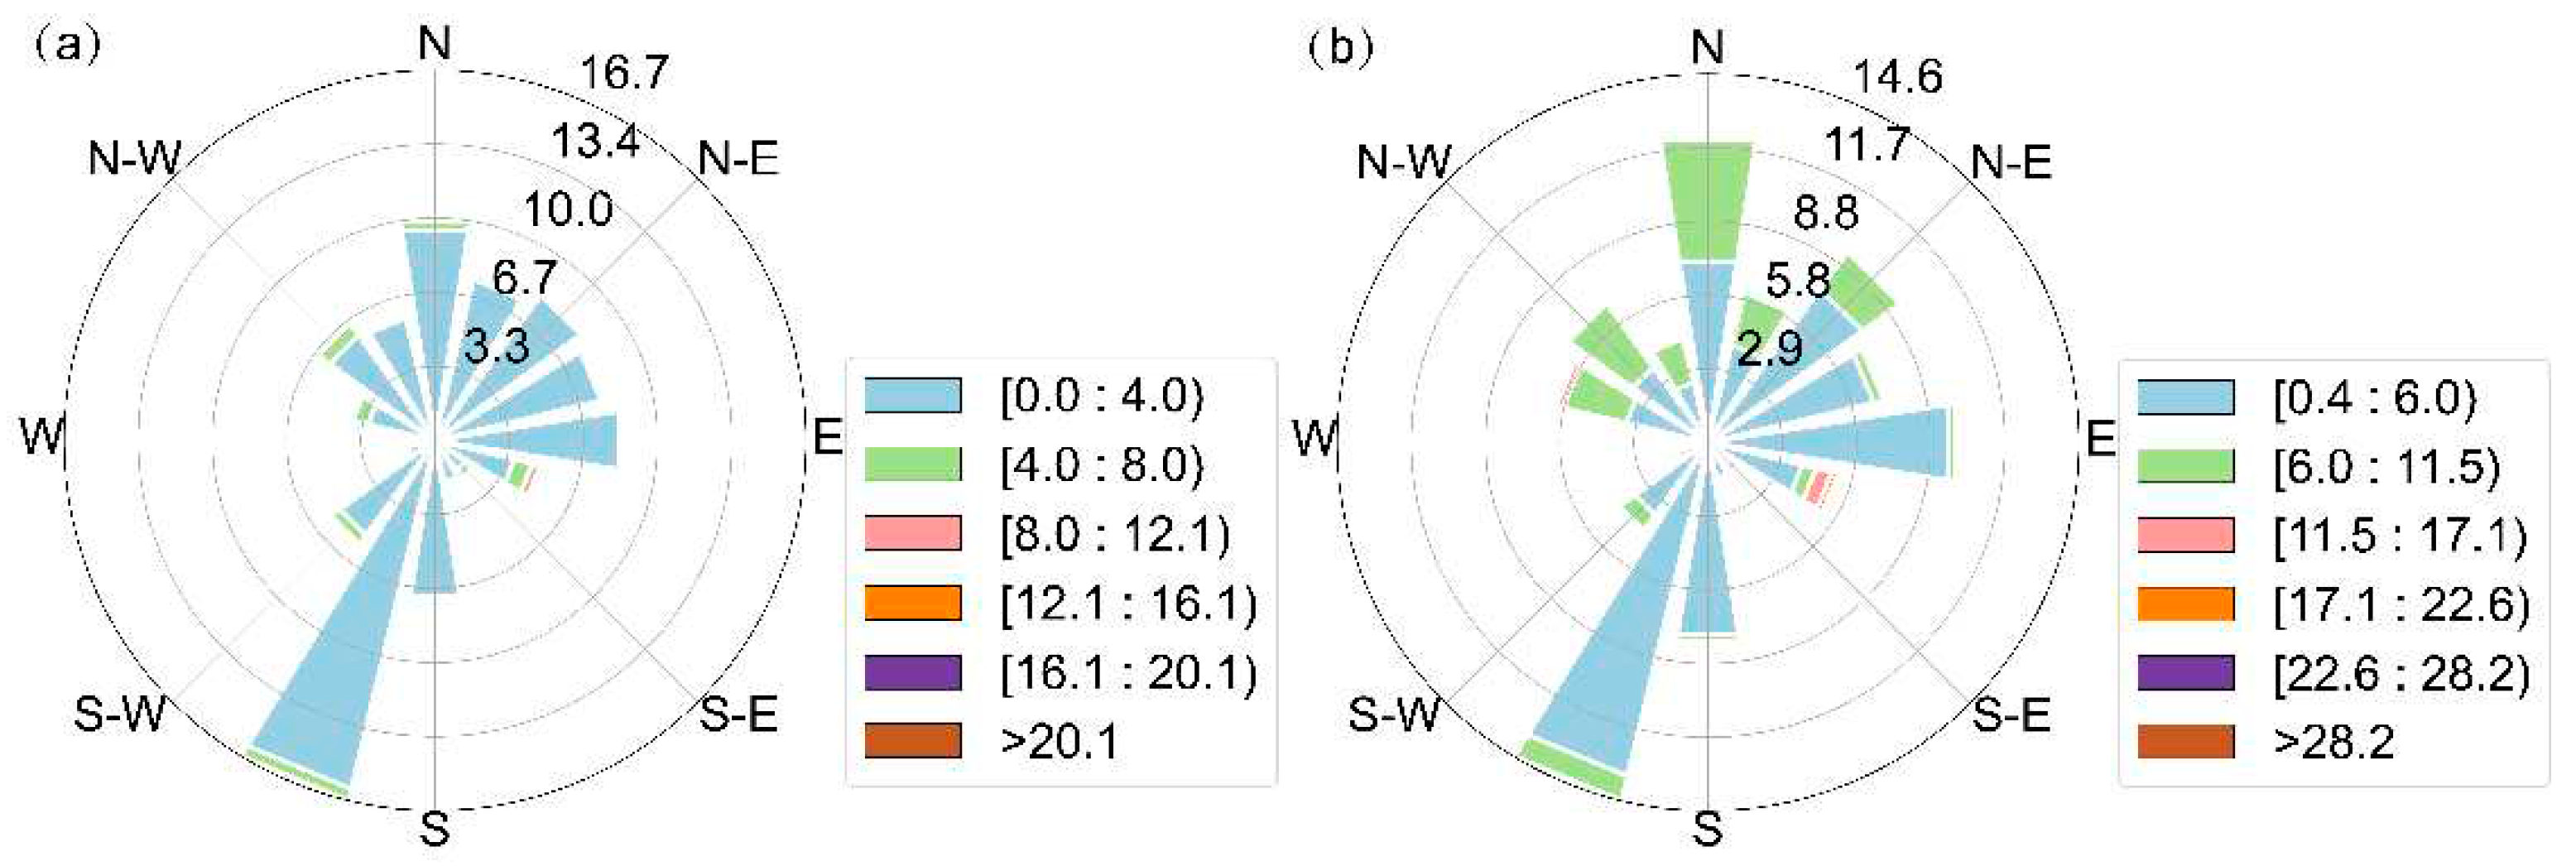
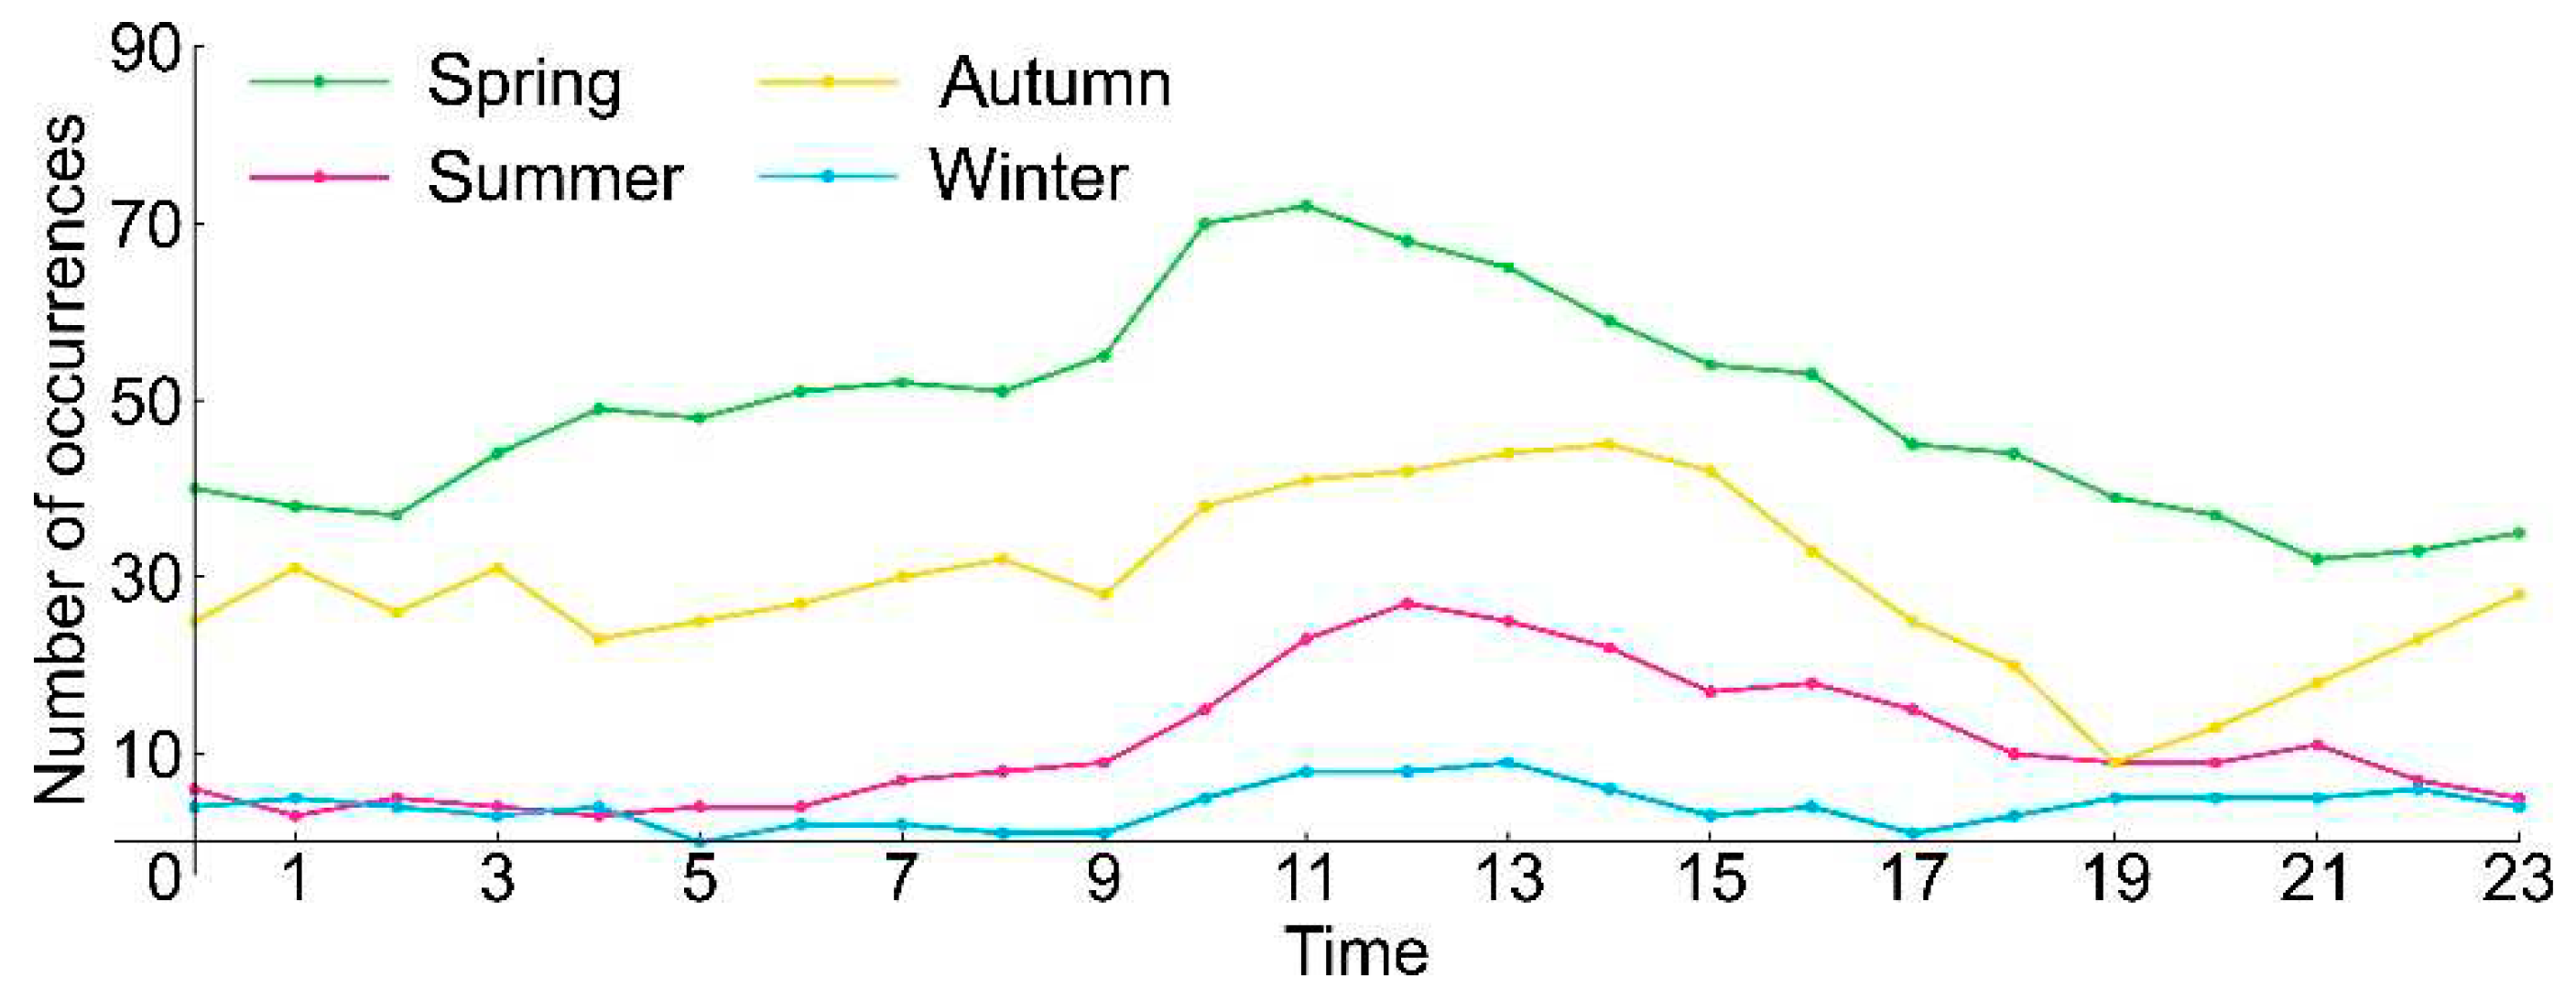
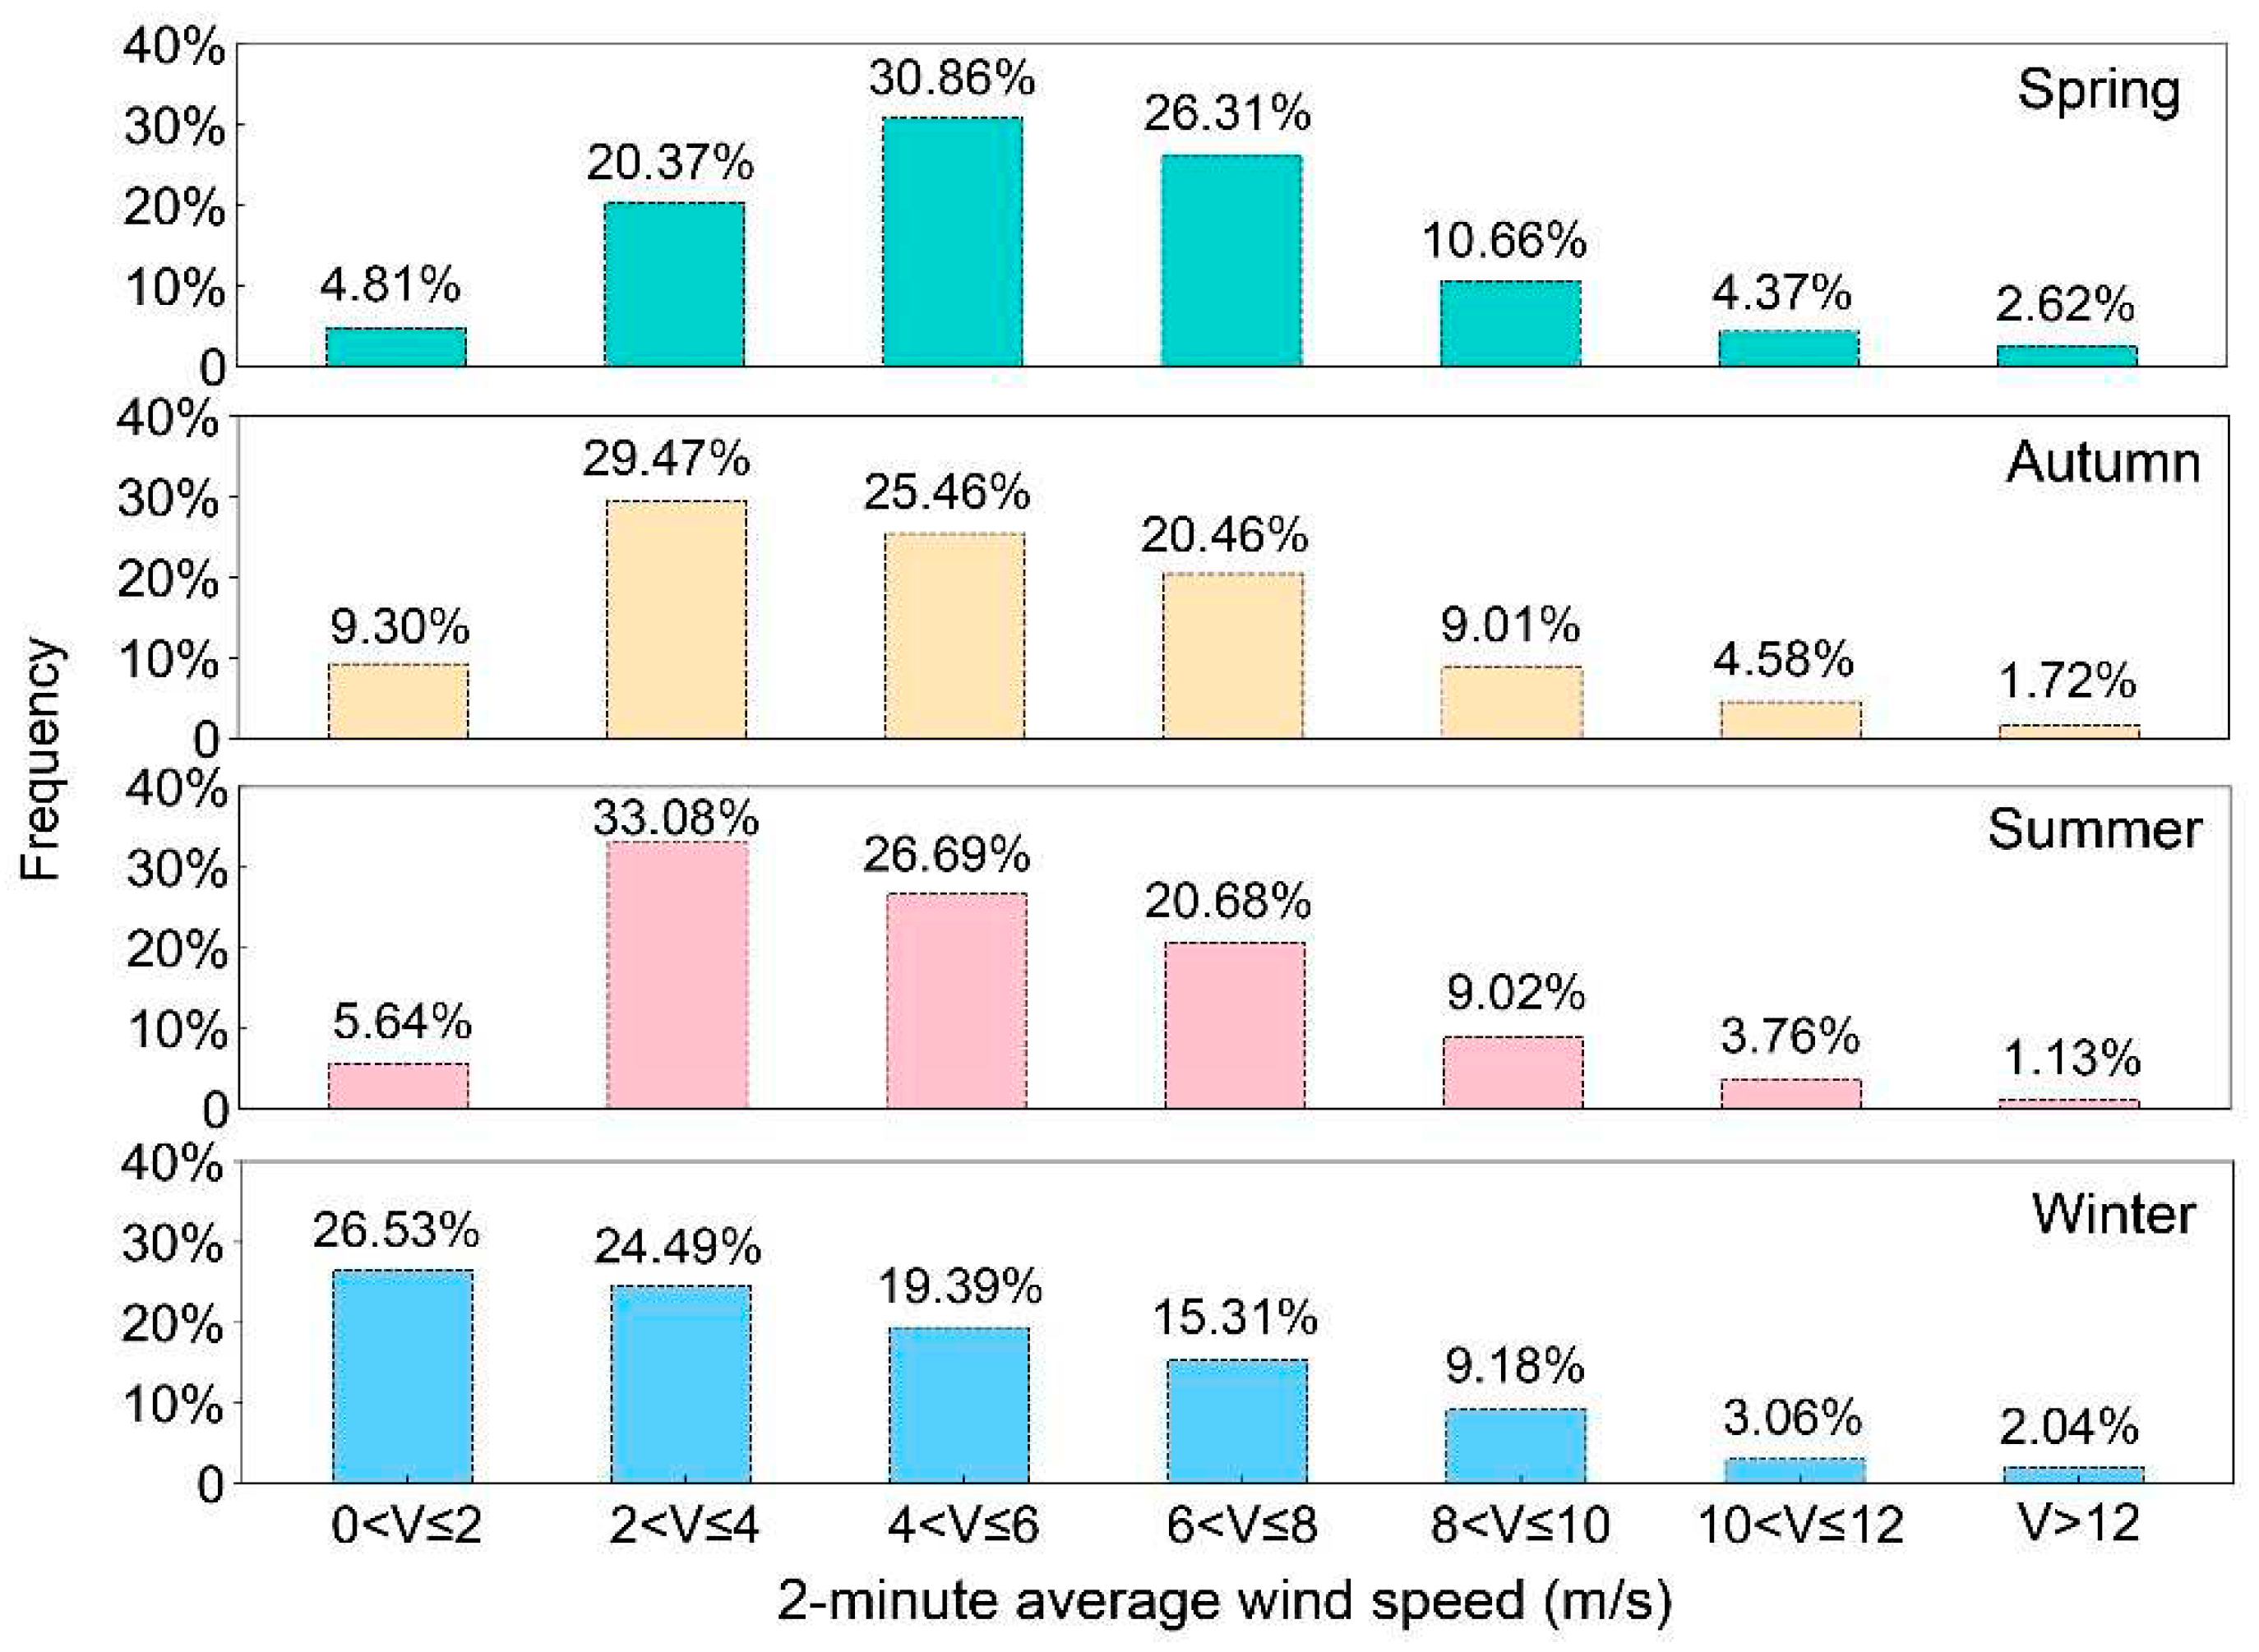
- The strong wind weather dominates in Urumqi, especially the wind in southeast direction, and the WS is much greater than the northwest WD,WS. The maximum of 2 -minutes average WS reached 20.1 m/s in the past 15 years, and the maximum of the maximum WS reached 28.2 m/s WS in the past 5 years, which are the WD of southeast. In the past 15 years, there were a total of 3110 hours of foehn in Urumqi, and the frequency of foehn during the daytime is about 1.4 times that nighttime (1816/1294 hours at day/night). There were 182-hour foehn with the 2-minutes average WS more than 10.8 m/s. In addition, the 24-hour (a day) numbers of foehn in spring are larger than that other seasons, and the WS of foehn is stronger (weaker) in spring (Winter).
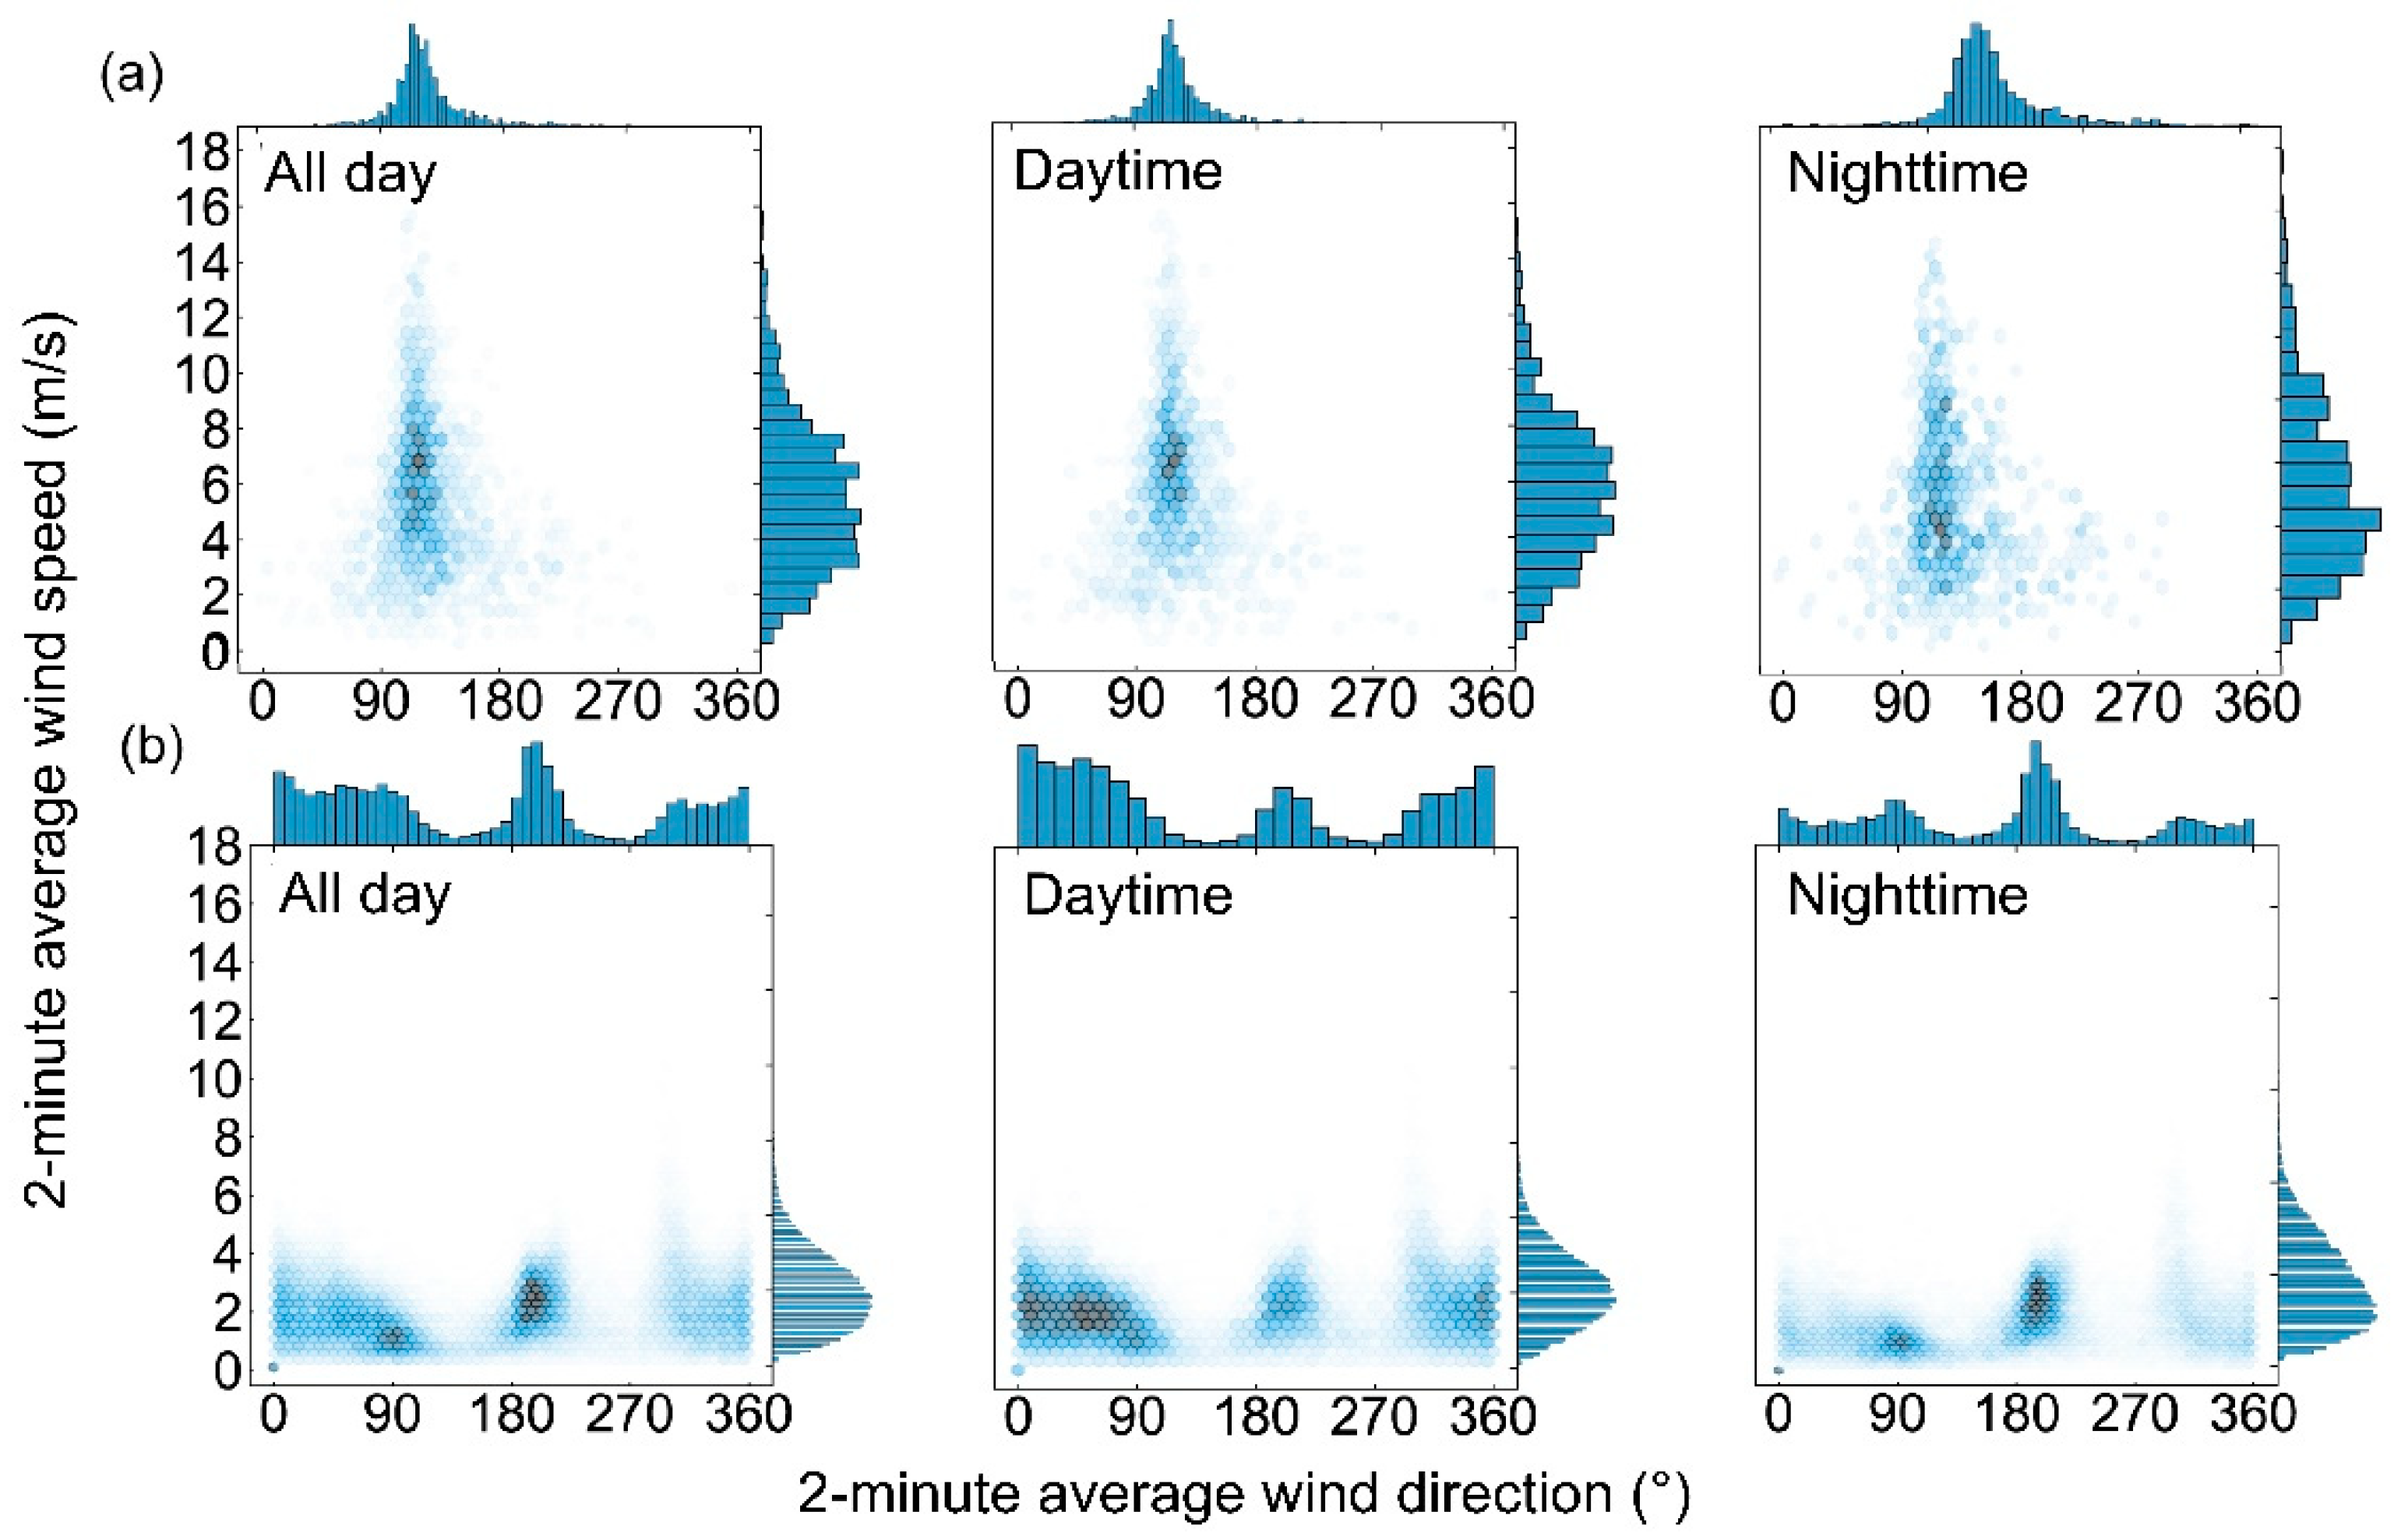
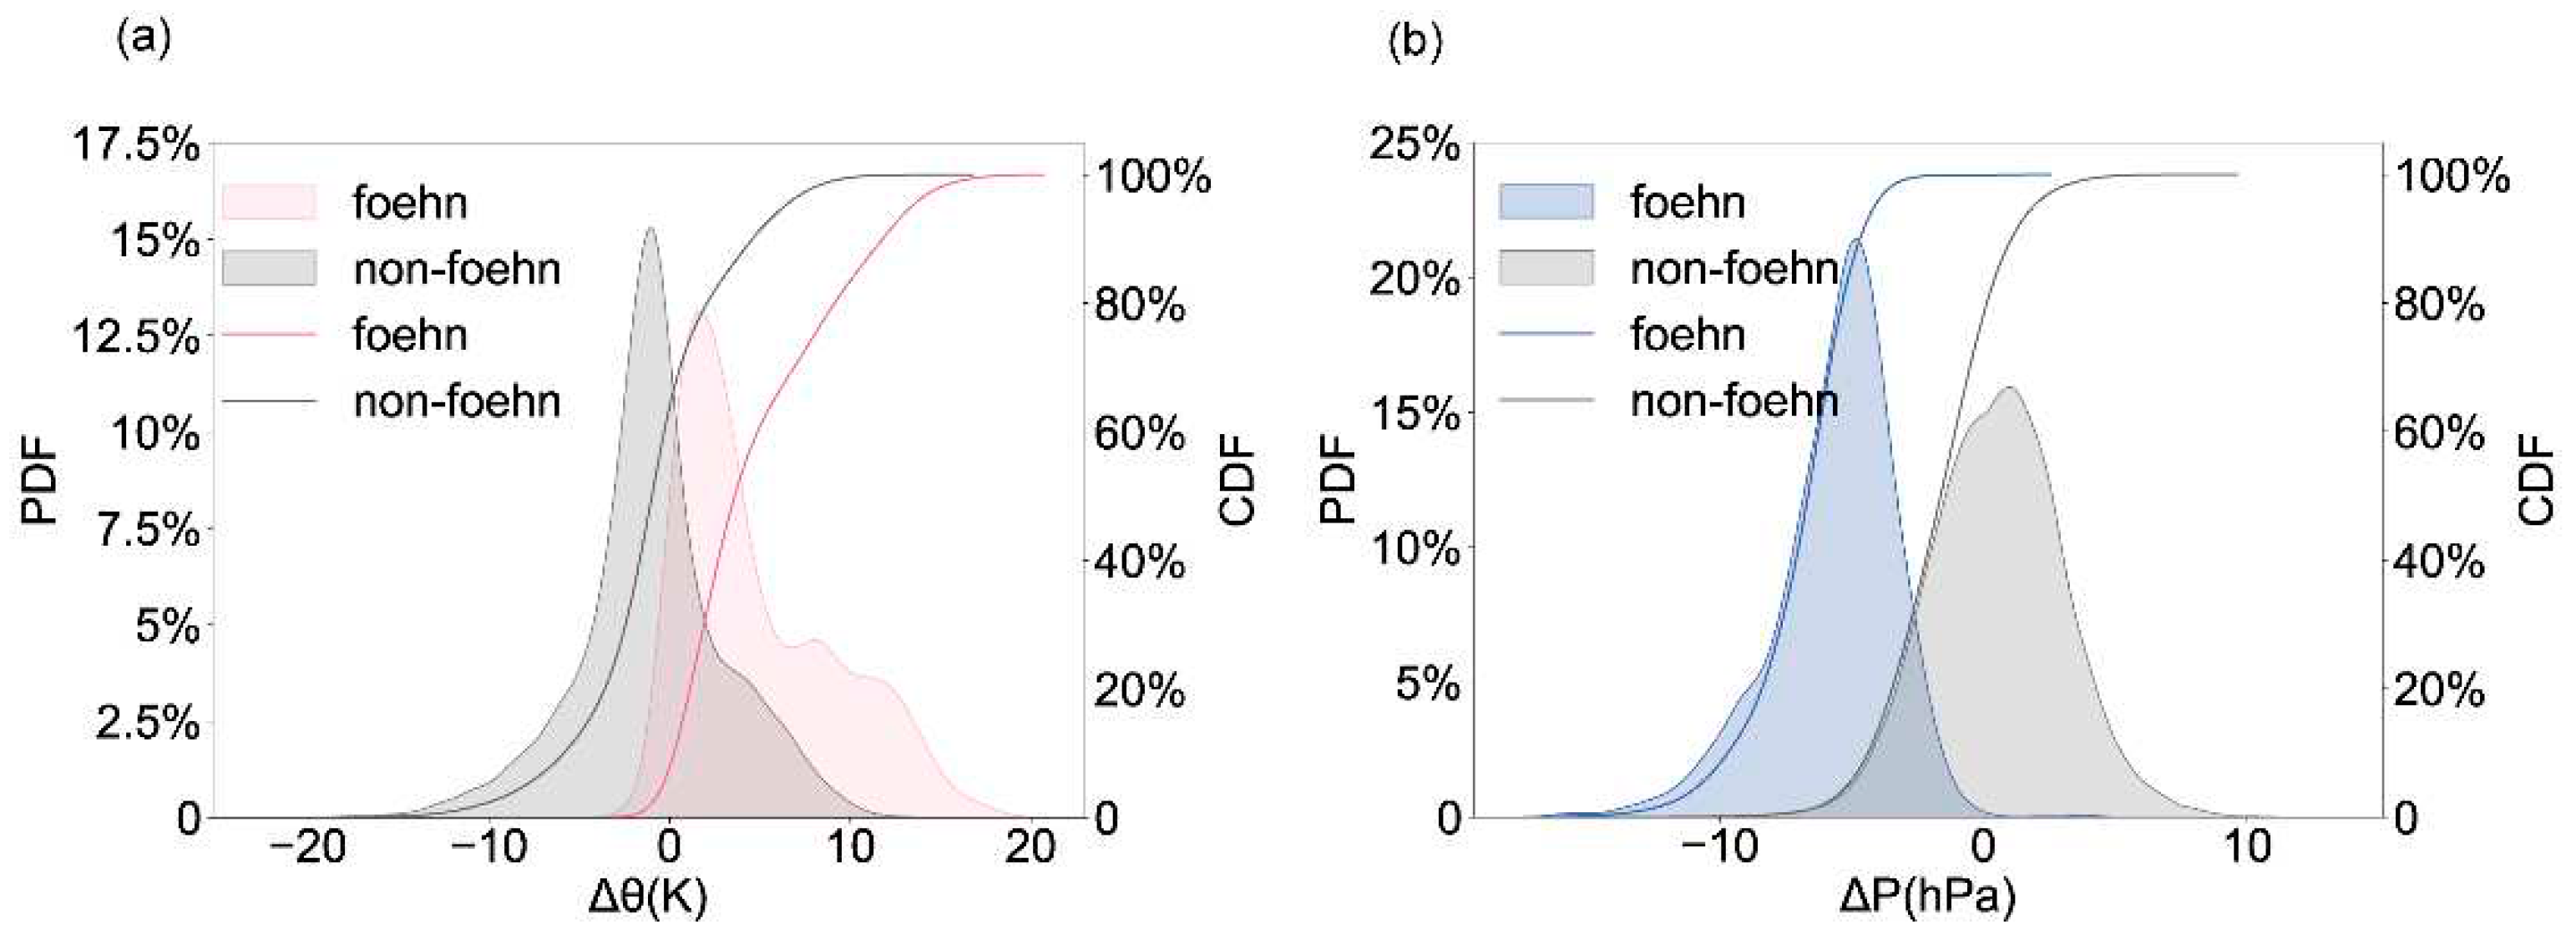
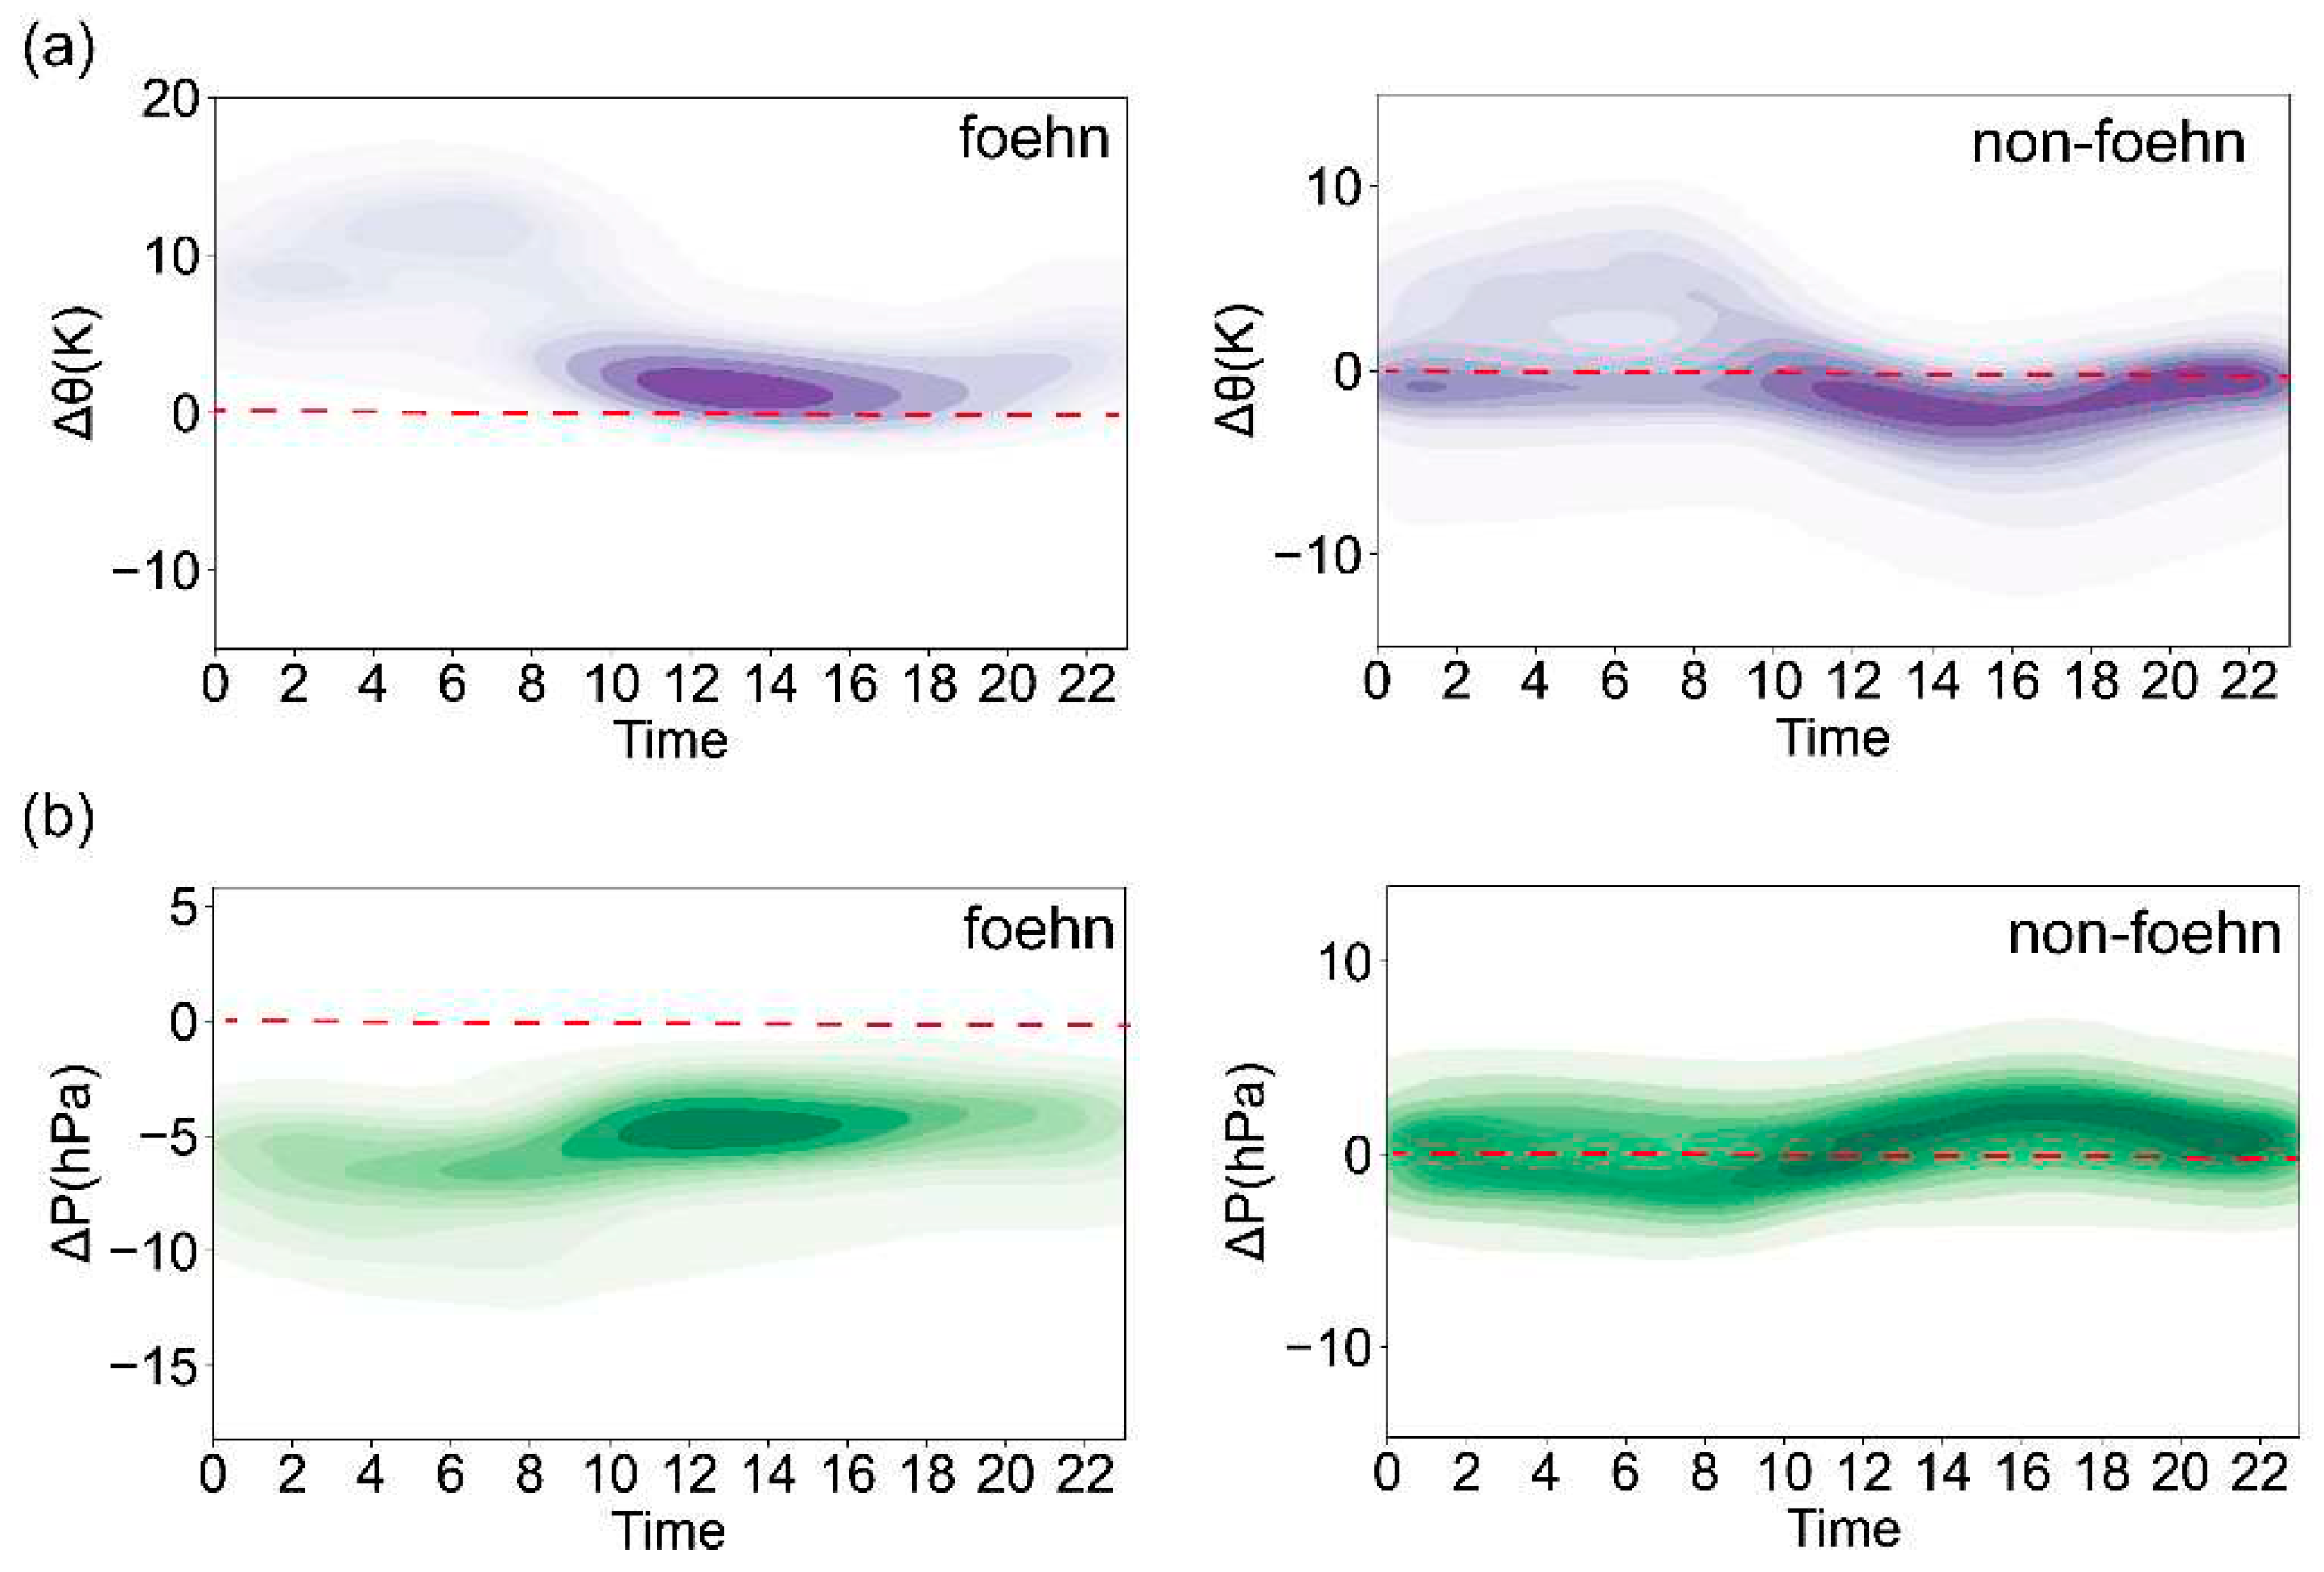
- During the foehn period, the WD is mostly concentrated between 90° and 170°, and the average WS is dominantly distributed between 4–8 m/s. The WD of the foehn is concentrated (scattering) and the WS is relatively high (low) during the daytime (nighttime). During non-foehn period, there are significant mountain winds between 180° and 225°, with the WS of around 2–4 m/s, mostly occurring from 22:00 to 10:00 the next day. The ΔP between DS and US is mainly positive (negative) value during the foehn (non-foehn), and there is also a certain probability of a positive value at night, which is mainly caused by the moutain winds during the non-foehn. Therefore, the foehn can be distinguished from the non-foehn by setting the additional threhold of Δθ, except for WD and WS.
- The three-element identification standard for foehn in Urumqi are: 94 °≤ 2-minute average WD ≤168°, 2-minute average WS ≥ 2.0 m/s, and Δθ ≥ 0.29 K between DS and US. This identification accuracy is 82.96% (hit rate is 89.50%) for 5-year time sequence of foehn in Urumqi from 2008 to 2012, and the hit rate is 100% for the strong wind (i.e., 2-minute average WS ≥10.8 m/s). The test results indicate that this method has a better capability on the identification of foehn in Urumqi.
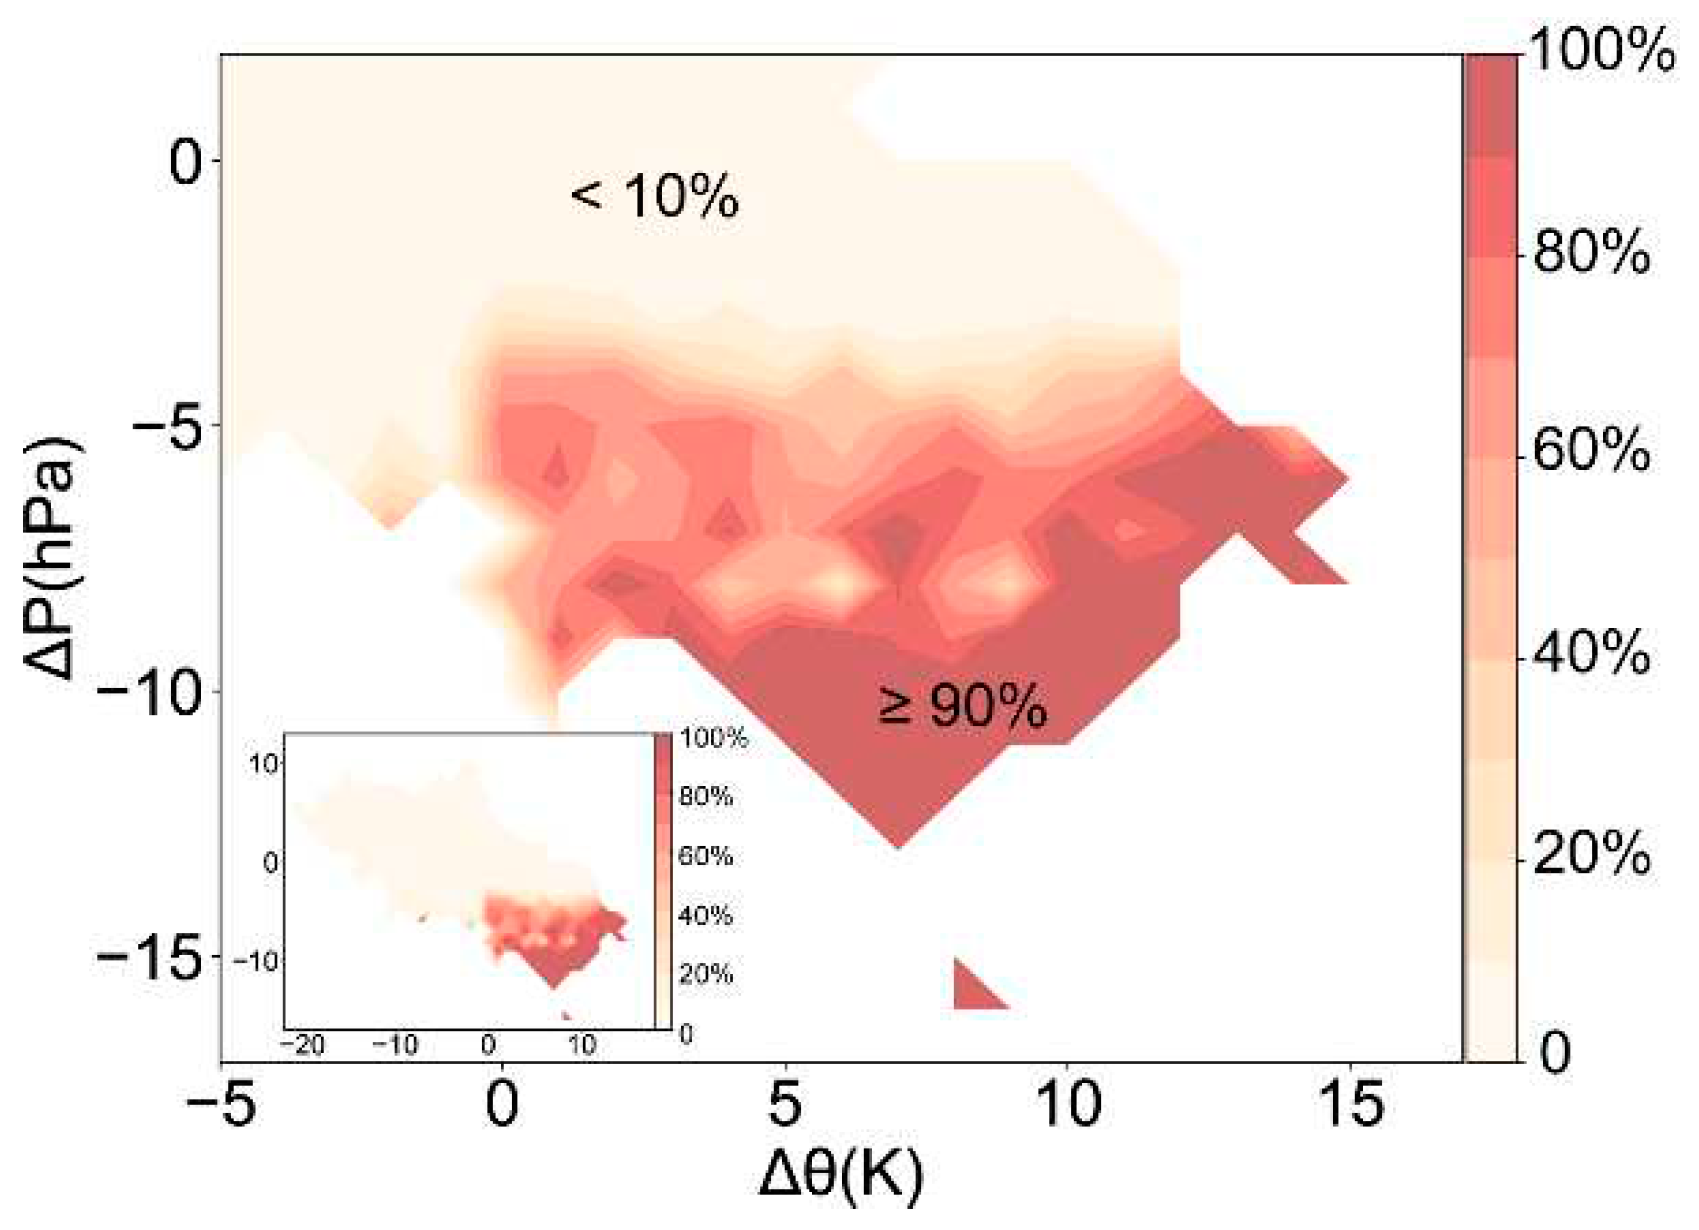
- The ΔP and Δθ between DS and US present certain significance on predicting foehn. The joint probability of ΔP and Δθ can diagnose foehn more accurate than single predictor. When Δ P ≤ -12 hPa and Δθ ≥ 5 K, the probability of foehn occurrence is more than 90%.
Author Contributions
Funding
Data Availability Statement
Conflicts of Interest
References
- Brinkmann, W., 1971: What is a foehn? Weather, 26, 230 – 239. [CrossRef]
- Seibert, R. . South foehn studies since the ALPEX experiment. Meteorol. Atmos. Phys, 1990; 43, 91–103. [Google Scholar]
- Nishi, A. , & Kusaka, H. Future changes of the extreme high-temperature events influenced by foehns in Niigata, Japan. Atmospheric Science Letters, 2023; 24, e1137. [Google Scholar] [CrossRef]
- KONG Fanchao, LIAN Zhiluan. Statistical Characteristics and Formation Mechanisms of Night Warming Events at Yunding Winter Olympic Stadium in Chongli [J]. Chinese Journal of Atmospheric Sciences (in Chinese), 2022; 46, 191–205. [CrossRef]
- Luo R,Zheng Y G,Chen M.Mechanism of a rare night sudden intense warming event in Beijing and surrounding area. Meteor Mon, 2020; 46, 478–489, (in chinese). [CrossRef]
- LI Xia, ZHAO Keming, ZHONG Shiyuan, YU Xiaojing, FENG Zhimin, ZHONG Yuting, MAULEN Ayitken, and LI Shuting.Evolution of Meteorological Conditions during a Heavy Air Pollution Event under the Influence of Shallow Foehn in Urumqi, China. ADVANCES IN ATMOSPHERIC SCIENCES, 2023; 40, 29–43. [CrossRef]
- LI Xia, XIA Xiangao, ZHONG Shiyuan. Shallow foehn on the northern leeside of Tianshan Mountains and its influence on atmospheric boundary layer over Urumqi, China — A climatological study. Atmospheric Research, 2020; 240, 1–17.
- LI Xia, XIA Xiang’ao, WANG Lei, et al. The role of foehn in the formation of heavy air pollution events in Urumqi, China. J. Geophys. Res. Atmos. 2015; 120, 5371–5384. [CrossRef]
- DOU Xinying, BIN Jianhua, JIANG Jun. The Meteorological Causes of the Collapse of Iron tower in Urumqi Electronic Network. Xinjiang Meteorology, 2005; 28, 32–34. [CrossRef]
- WANG Nan, YANG Hongru, ZHOU Jianjun. Quantitative Study on Impact of Severe Weather on Flight Delay at Urumqi Airport. Journal of Arid Meteorology, 2018, 36(4): 684-693. DOI: CNKI:SUN:GSQX.0.2018-04-019.
- ZHANG Guangxing, ZHANG Dalin, SUN Shufang. On the Orographically Generated Low-Level Easterly Jet and Severe DownslopeStorms of March 2006 over the Tacheng Basin of Northwest China. Monthly Weather Review, 2018; 146, 1667–1682. [CrossRef]
- ZHANG Keying, MA Youxin, LIU Yuhong, et al. Agricultural Significance of Incineration Effect in Ailao Mountain ( Southwest Monsoon Mountain ), China.Mountain Research,1993, 11(2):81-87. http://ir.xtbg.org.cn/handle/353005/2284.
- Mikutta, C.A. ,Pervilhac, C.;Znoj, H.,Federspiel, A., Müller, T.J.The Impact of FoehnWind on Mental Distress among Patients in a Swiss Psychiatric Hospital. Int. J. Environ.Res. Public Health, 2022; 19, 10831. [Google Scholar] [CrossRef]
- ZHANG Jiabao, SU Qiyuan, SUN Shenqing, et al. Xinjiang short-term weather forecast guidebook.Urumqi, Xinjiang People's Publishing House, 1986: 341-347.
- DIAO Ping. The statistical characteristics and forecast of southeast gale in Urumqi in spring. Xinjiang Meteorology, 1991, 14(10): 16-18. DOI: CNKI:SUN:XJQX.0.1991-10-003.
- MENG Qihui, LYU Bin, DIAO Ping. Research on the Distribution Law of Southeast Gale in Urumqi Area. Xinjiang Meteorology, 1995, 18(1): 6-10. DOI: CNKI:SUN:XJQX.0.1995-01-001.
- B. W. Atkinson, J. Wu Zhang.Mesoscale shallow convection in the atmosphere, Reviews of Geophysics,1996.34(4):403-431. [CrossRef]
- Drechsel.S;Mayr.G.J. Objective Forecasting of Foehns for a Subgrid-Scale Alpine Valley[J]. Weather and Forecasting, 2008; 23, 205–218. [CrossRef]
- Schultz, D. M. , and Doswell.C. A. Analyzing and forecasting Rocky Mountain lee cyclogenesis often associated with strong winds[J]. Wea. Forecasting, 2000; 15, 152–173. [Google Scholar]
- Lentink.H.S.Extremefoehn in Switzerland:a climatology and the relation to large scale flow.[D]. University Utrecht,Switzerland, 2012:1-65. https://studenttheses.uu.nl/handle/20.500.12932/15889.
- Richner, H. and Th. Gutermann. Statistical analysis of foehn in Altdorf, Switzerland.,Int. Conf. AlpineMeteorol., 2007, Chamb´ery, France,457–460.
- Richner H., P. Hächler. Understanding and Forecasting Alpine Foehn.Mountain Weather Research and Forecasting, Springer Atmospheric Sciences,2013, 219-260.
- Tobias Milz, Marte Hofsteenge, Marwan Katurji, and Varvara Vetrova. Foehn Analysis using Unsupervised Deep Anomaly Detection. EGU General Assembly, 2023. [CrossRef]
- MICHAEL, S., SEBASTIAN S., ROGER O., JOHANNES J..Nowcasting Foehn Events Using the AdaBoost Machine Learning Algorithm. WEATHER AND FORECASTING. 2017, 32, 1079–1099. [CrossRef]
- ZHAO Shilin, WANG Rongke, GUO Yanbo, et al.The Foehn in the Middle Rang of Taihang Mountain. Meteor Mon, 1993; 19, 3–6.
- WANG Zongming, DING Yihui, ZHANG Yingxin, et al. Statistical Characteristics and Mechanism Analysis of Foehn Weather in the Eastern Foothills of Taihang MountainⅡ:Case analysis of the influence of leeward wave on the generation and propagation of Foehn. Plateau Meteorology, 2012; 31, 555–561.
- LI Di,ZHANG Qiaoyu,HE Kai,SUN Jing,ZHAO Zhinan.Analysis of Temporal and Spatial Characteristics of Foehn in Xingtai City. Journal of Agricultural Catastrophology, 2022; 12, 122–124. [CrossRef]
- ZHAO Zhanhong,MA Hongqing,DING Zhengzhen,XU Yiguo.The Influence of the Foehn on the Temperature of Baoding Area. SHANXI SCIENCE AND TECHNOLOGY, 2016; 31, 88–91. [CrossRef]
- XIONG Xianping,WANG Shuyun,ZHANG Wei.Analysis of Foehn Characteristics in Middle Section of Taihang Mountains Based on Background Method. METEOROLOGICAL SCIENCE AND TECHNOLOGY, 2020; 48, 433–437. [CrossRef]
- WAN Yu, CAO Xing, DOU Xinying, et al. The Application of ECMWF Refined Net Numerical Forecast Data in the Southeast Gale in Urumqi. Desert and Oasis Meteorology, 2014; 8, 32–38. [CrossRef]
- TANG Hao, WANG Xu, CHU Changjiang, et al. Formation mechanism of a southeast gale event in Urumqi urban area: The coupling of gravity wave and ultra-low level jet. Arid Land Geography, 2019; 42, 1229–1238.
- SUN Mingjing, LI Ruqi, LIU Junzhe, et al. Analysis of Comparison Between the Two Kinds of the Southeasterly Gale Cases in Spring in Urumqi. Desert and Oasis Meteorology, 2017, 11(5): 38-45. DOI: CNKI:SUN:XJQX.0.2017-05-007.
- DIAO Xiaoyun, FENG Lihua, FAN Ruirui, et al. Diagnostic analysis of southeast gale in Urumqi in March 2017. Xinjiang Farm Research of Science and Technology, 2018, (02): 44-45. DOI: CNKI:SUN:XJLK.0.2018-02-028.
- AYITKEN Maulen,LI Xia,MUSA Yusuf,LI Shuting,ZHONG Yuting.Temporal and Spatial Characteristics of Foehn on the North Slope of the Tianshan Mountains of China and Prediction Ability of European Fine Grid Numerical Products. Mountain Research, 2022; 40, 823–834. [CrossRef]
- Bougeault, P., P. Binder, and J. Kuettner, Eds., 1998: MAP science plan. MeteoSwiss,64 pp. [Available from MAP Programme Office, MeteoSwiss, CH-8044, Zurich, Switzerland].
- Vergeiner, J. South foehn studies and a new foehn classification scheme in the Wipp and Inn valley.[D]. University of Innsbruck, Innsbruck, Austria, 2004:1-111.
- Mayr, G. J. , and Coauthors. Gap flow measurements during the Mesoscale Alpine Programme[J]. Meteor. Atmos. Phys. 2004; 86, 99–119. [Google Scholar] [CrossRef]
- Lentink.H.S.Extreme foehn in Switzerland:a climatology and the relation to large scale flow.[D]. University Utrecht, Switzerland, 2012:1-65.
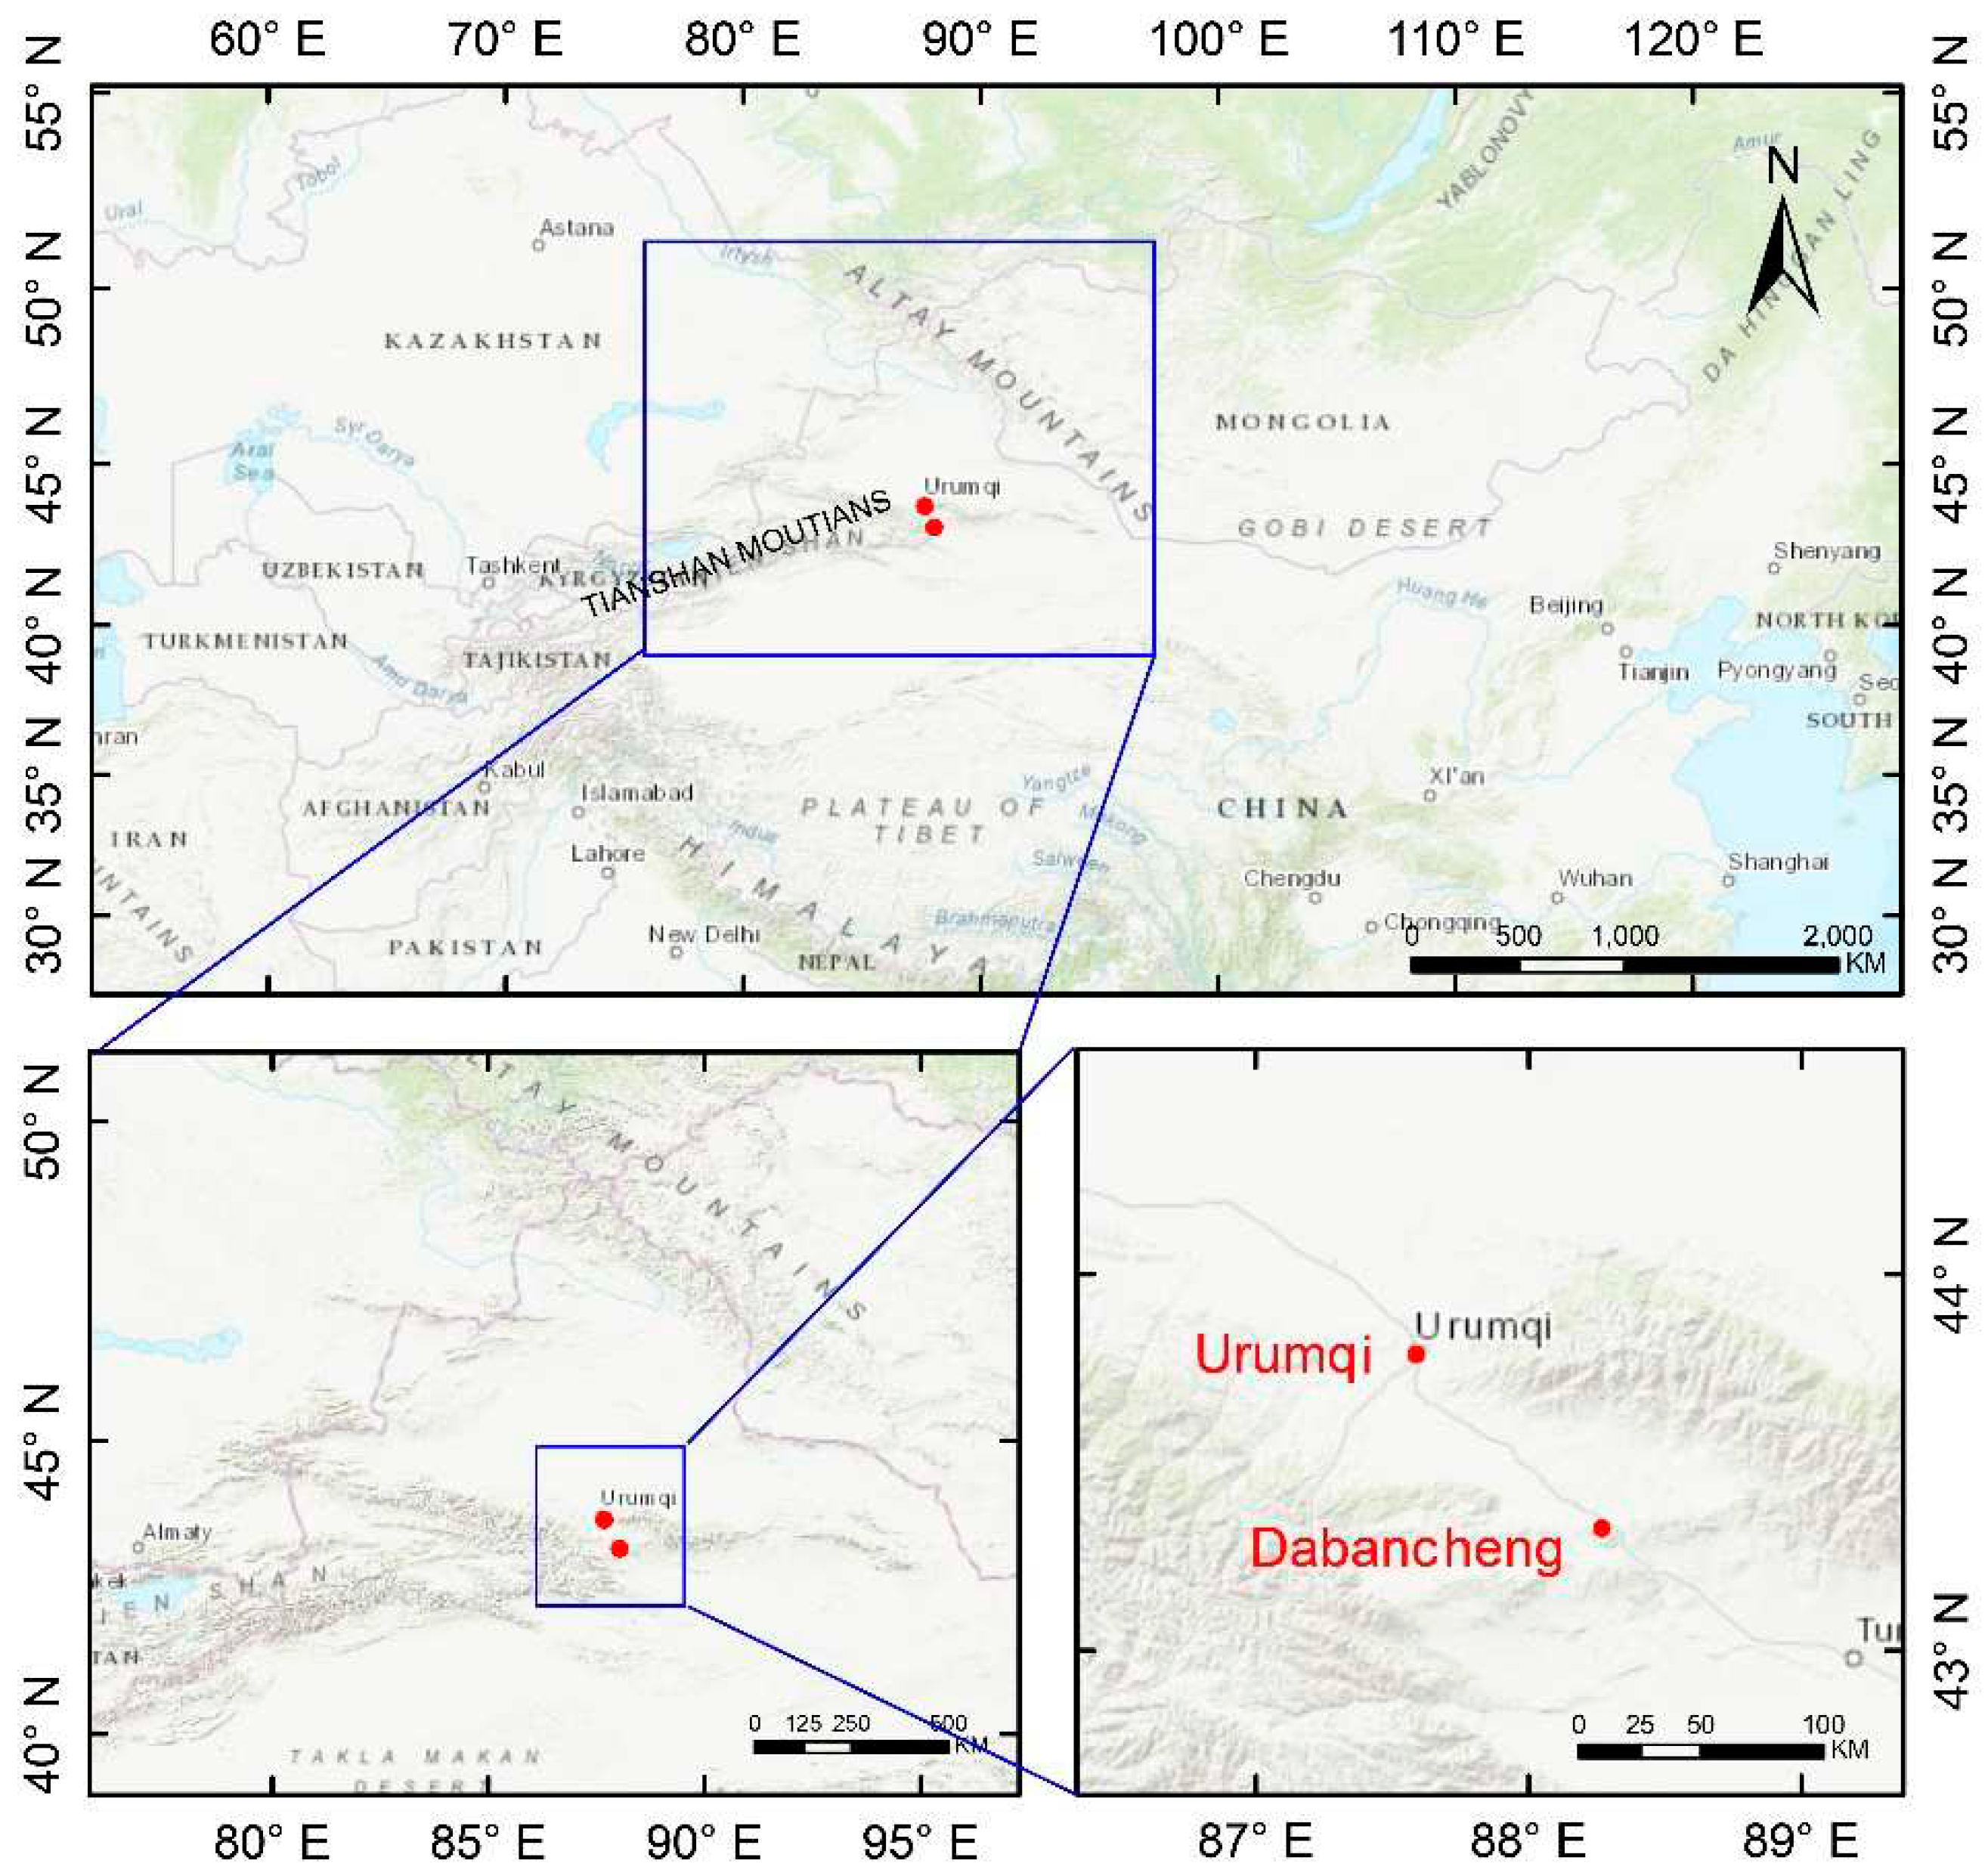
| Site | longitude /° | latitude /° | height above sea level /m |
|---|---|---|---|
| Dabancheng Station (upstream station, US) |
88.32 | 43.35 | 1105.3 |
| Urumqi Station (downstream station, DS) |
87.65 | 43.78 | 935.9 |
| Three- element threshold | Accuracy | Hit rate | False-alarm rate | Missing rate | |
|---|---|---|---|---|---|
| All day All day Daytime Nighttime |
94°≤WD≤168°, WS≥2.0 m/s, ΔP≤-0.28 hPa 94°≤WD≤168°, WS≥2.0 m/s, Δθ≥0.29 K 91°≤WD≤157°, WS≥2.2 m/s, Δθ≥0.05 K 101°≤WD≤176°, WS≥2.0 m/s, Δθ≥2.29 K |
67.97% 82.96% 83.63% 73.27% |
69.44% 89.50% 85.51% 73.53% |
3.03% 8.09% 2.56% 9.71% |
30.56% 10.50% 14.49% 20.47% |
| 2-minute average WD (°) | 2-minute average WS (m/s) | Δθ (K) | |
|---|---|---|---|
| foehn | 94≤WD≤168 | WS≥2.0 | Δθ≥0.29 |
Disclaimer/Publisher’s Note: The statements, opinions and data contained in all publications are solely those of the individual author(s) and contributor(s) and not of MDPI and/or the editor(s). MDPI and/or the editor(s) disclaim responsibility for any injury to people or property resulting from any ideas, methods, instructions or products referred to in the content. |
© 2023 by the authors. Licensee MDPI, Basel, Switzerland. This article is an open access article distributed under the terms and conditions of the Creative Commons Attribution (CC BY) license (http://creativecommons.org/licenses/by/4.0/).


