1. Introduction
Antigua and Barbuda is a small dual-island nation in the Caribbean, the most northeastern of the Lesser Antilles [
1]. Of the total population, 97% is on Antigua, although the islands are comparable in land area, with the island of Antigua having an area of 281km
2 and the island of Barbuda having an area of 161km
2 [
2]. The tropical climate has very little variation throughout the year, with the median temperature in any month not falling below 25℃, based on measurements from the past 30 years [
3]; Antigua receives around 2,782 hours of sunshine a year [
4]. Key environmental issues for Antigua and Barbuda include water management, with minimal freshwater resources on the islands, with the impacts of deforestation from colonial sugar plantations allows rainfall to run off more quickly [
5]. Susceptibility to tropical storms and hurricanes further exacerbates these environmental issues, leading to increasing efforts toward resilience and adaptation to climate change. One potential solution the nation has looked into for water purification is using wind power for desalination, which would require a significant additional amount of electricity [
6] but would increase resilience.
Electricity generation in Antigua and Barbuda is nearly completely reliant on imported petroleum products. Diesel energy comprises 89% of the 87.45 MW of installed capacity for the nation [
7]. The electricity production and distribution are operated by two companies: Antigua Power Company (APC) and Antigua Public Utilities Authorities (APUA) [
8]. APC is the private company that owns the generating capacity, whereas APUA is the utility company that distributes the electricity and charges for its consumption. The companies work together very closely, as APC sells the electricity it produces to APUA to then sell to its customers. These plants, combined with other small backup generators that are owned by individuals and businesses, contribute to the nation emitting just under 200,000 metric tonnes of carbon dioxide per year from the electricity sector, and 650,000 metric tonnes total from the energy sector. The nation is hoping to reduce that number drastically as it sets a goal of reducing emissions in the energy sector [
7].
Antigua and Barbuda’s commitments to the Paris Agreement as outlined in their NDC include targets of becoming a net-zero nation by 2040 and having 86% renewable energy generation in the electricity sector by 2030. Additional targets to be achieved by 2030 identified explicitly in the NDC include having 100 MW of renewable energy capacity for the grid, targets to construct 20 MW of wind energy, 50 MW of renewable energy capacity owned by farmers who can sell to others, and 100 MW of renewable energy capacity owned by social investment entities such as non-governmental organizations, bus associations, or any other businesses registered as social investors. The NDC also identifies the need to establish a framework to achieve these goals by 2024. Finally, a specific goal relevant to the current work is that 30,000 homes, or 50% of pre-2020 homes, should have back-up renewable energy systems for at least 4–6 hours of energy. The solar resource for Antigua is approximately 6 kWh/m
2/day, and therefore, solar PV is a well-suited technology for this goal. In 2020, the residential sector in Antigua consumed 103 GWh of energy [
9]. With the current total household count at 30,213, this implies an average of 3,400 kWh of energy consumed per household [
10].
However, with increased consumption of electricity in homes and introduction of electric vehicles (EVs), which the nation aims to progress towards, it is likely the annual household consumption will increase. An average personally owned vehicle would require just over 1,750 kWh in a year [
11,
12]. Combined, a household would require around 5,250 kWh per year. In Antigua, a solar panel can produce upwards of 1,500 kWh/kW
peak [
13]. Thus, a 4 kW array of solar panels will produce about 6,000 kWh in a year. This will be larger than the required 5,250 kWh households from past data and EV introduction, which will give room for the electrification of homes. With the NDC target of 30,000 homes having solar PV systems, approximately 120 MW of rooftop solar PV will have to be installed to achieve this NDC target.
Recent legislation and policies including the National Energy Policy and Environmental Protection and Management Act [
9] set out goals of reducing carbon emissions from the energy sector by 62% by 2027 and 90% by 2030 [
9]. These and other policies cover the plans of protecting their local environments, implementing renewable energy into their energy system, ensuring affordable, equitable, and accessible energy to all, and developing standards for buildings and vehicles to increase their energy efficiency.
To achieve the goals of transitioning to renewable energy and reducing carbon emissions in the energy sector, it is necessary to understand which technologies would best fit the nation’s renewable resources. With solar energy being a viable and abundant resource, both solar photovoltaics (solar PV) and concentrated solar power (CSP) are considered in this work, along with wind energy, which is also a part of the NDC targets [
14]. These three sources, along with energy storage technologies (batteries and hydrogen) will be the most viable low-carbon and market ready options for power generation in the country based on the nations’ renewable resources.
Geothermal energy and hydropower are two technologies that neighboring islands utilize, given the abundance of geothermal resources in parts of the Caribbean. However, Antigua and Barbuda (together with Barbados) do not have geothermal energy as an electricity generating option [
14]. Hydropower is also not an available resource in Antigua and Barbuda, although some nearby nations have been able to take advantage of that resource.
2. Methodology
2.1. Electric Grid Simulation Model Description
PyPSA (Python Power System Analysis) is an open-source Python framework used to model energy systems [
15]. In the case of Antigua, we have used PyPSA to investigate the cost-optimal mix of solar PV, wind, and CSP, together with energy storage, with the aim of achieving 100% renewable electricity and zero emission [
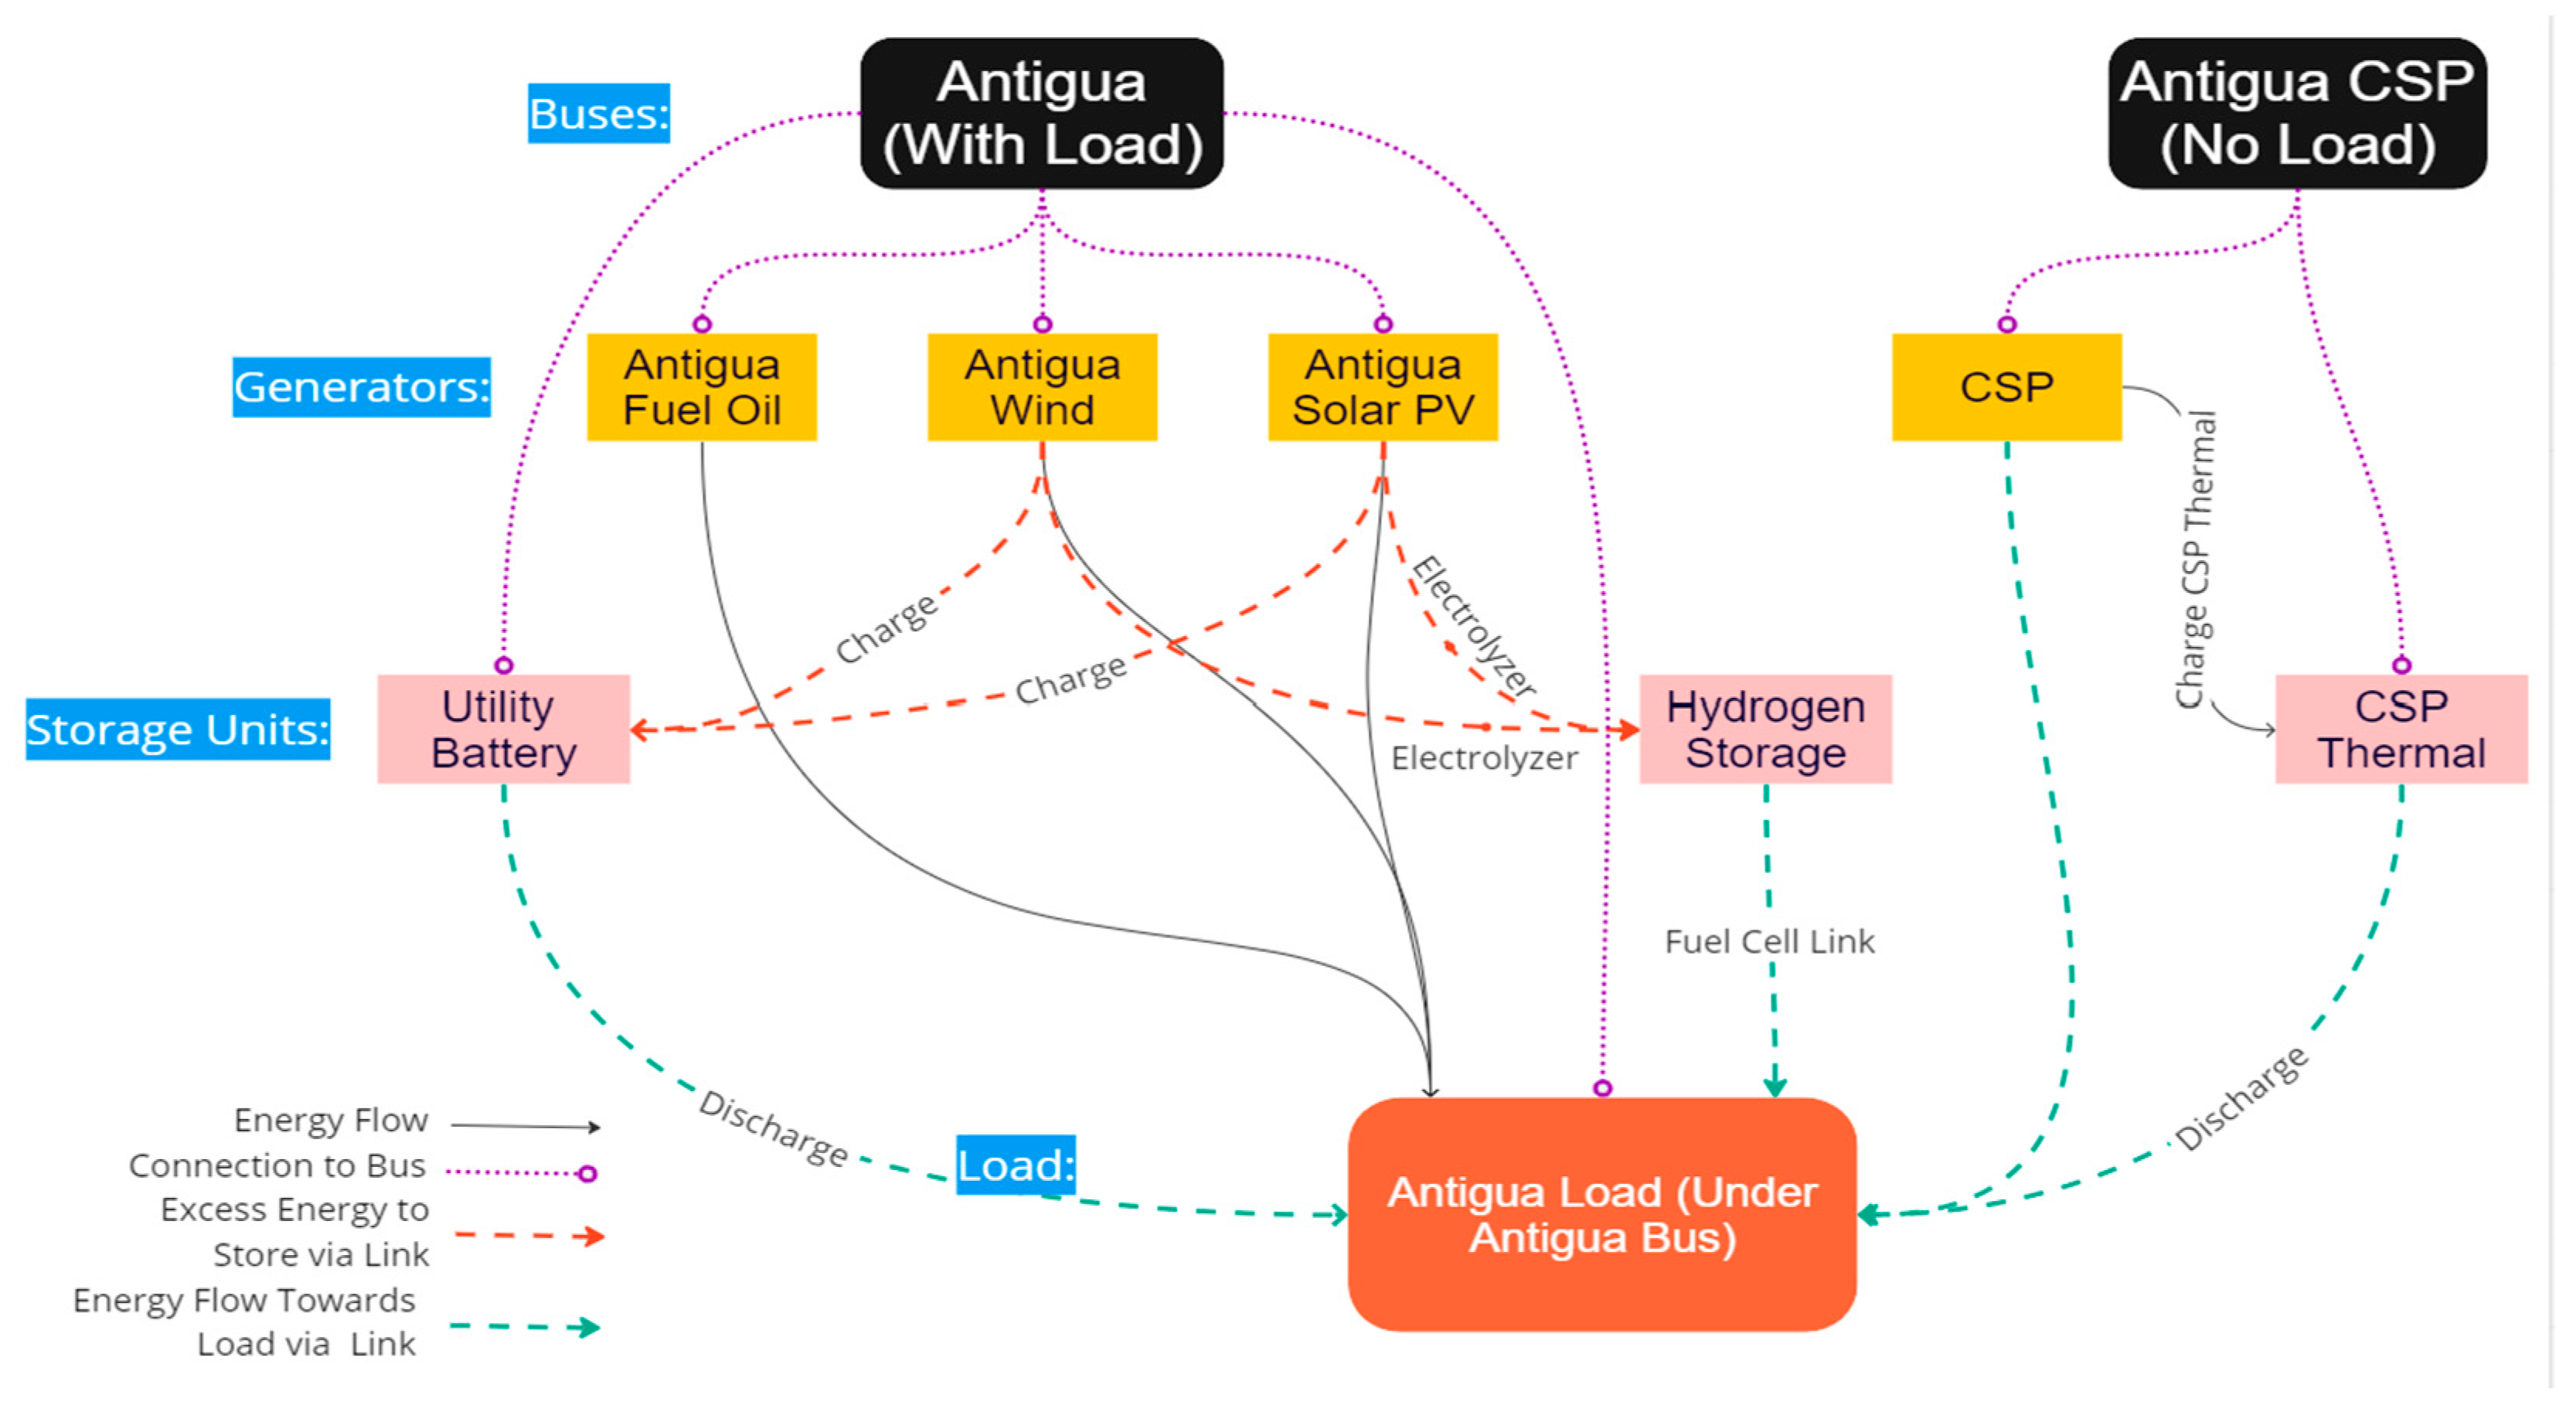
15] in the timeframe of 2035-2040. In PyPSA, the system is configured with several components: buses, loads, generators, links, and stores. Each bus has generators (plants that produce electricity) and loads connected to it, as well as energy storage (stores); links connect buses to one another. There are two buses in this scenario, with one being electricity (Antigua) and a separate bus, Antigua CSP. A schematic of the process flow is shown in
Figure 1.
For the Antigua bus, there is a load, Antigua Load, which contains the hourly electricity demand data for the country. There are three generators under the Antigua bus, which include: a generator for diesel power generation (Antigua Fuel Oil), a wind-based generator (Antigua Wind), and a solar PV based generator (Antigua PV). Wind and solar PV can charge the Antigua battery storage or create hydrogen storage since they are all under the Antigua bus. The Antigua CSP bus has no load connected to it but has a generator for concentrating solar power (CSP). Stores under each of the buses are available in which the variable renewable sources (CSP, wind, and solar PV) can add energy to if they produce more energy than the load in a given hourly interval. The CSP generator can charge the CSP Thermal stores since they are both under the same bus. Finally, any of the generators can meet the demand of the Antigua Load. When the load is larger than all the incoming power, the stores are able to meet the remaining loads. There are links to and from each of these stores that can take into account the capital costs, which is zero for utility batteries and CSP storage although the capital costs for these storage technologies is nonzero that represent charging and discharging the batteries or CSP storage tanks. Process efficiencies associated with charging and discharging of the batteries and the conversion of electricity to hydrogen and then hydrogen back to electricity are assigned to the links. Since there is no load for the Antigua CSP bus, the energy generated by the CSP generator will either try to meet the Antigua Load through the link with efficiency equal to 100% because it is realistically no different than the other generators supplying to the demand or charge the CSP Thermal storage. When the CSP Thermal is required, it is also then transferred through the same link with 100% efficiency.
2.2. Load Description
Load data used in the model is based on estimates of typical loads for Antigua, but hourly load data as needed for the model are not publicly available. Thus, a load model was used to represent the approximate load pattern for every hour of the year in Antigua, based on actual open-source hourly data for Martinique [
16], which has been scaled to Antigua based on the total and peak demands that are publicly available [
14]. Although the two countries differ greatly in population, load patterns are similar. To gain an estimation for the demand profile for the year 2035, the model was multiplied by a factor of 1.2 to account for both growing power demand of approximately 10% based on past trends and an estimated additional 10% load based on increased vehicle electrification [
17]
1. This constant factor assumes that the load profile remains the same into the future, an assumption that may not hold under higher penetration of electric vehicles (EVs) and grid interactivity that are also included as targets in their NDC [
18].
2.3. Generator Descriptions
The current electricity production system in Antigua is heavily reliant on heavy fuel oil generators. To address the NDC targets, we construct several model scenarios that do not allow for any fossil fuels, which implies large amounts of solar and wind energy, together with storage. For every scenario, hourly generation was needed to determine how the variable renewable energy sources, wind, solar PV, and CSP, will contribute to satisfying the demand for each hour of the year.
CSP is a technology that has not been used in the Caribbean, but Antigua and the Caribbean receive a lot of direct sunlight. Spain has many CSP plants in Alvarado, Majadas, and Orellana [
19], which share similar climates, getting a similar amount of total sun hours in a year as Antigua [
20]. Thus, it is logical to test if this technology will decrease costs of energy for Antigua. This technology also has very long storage time in some plants such as the DEWA IV CSP-PV hybrid plant in Dubai that has 10 hours of storage for its trough CSP, so it can hold energy to distribute for the late peak demand that occurs most days in Antigua [
21]. Utility batteries today are essentially held to 6 hours of storage at best but are estimated to reach up to around 10 hours of storage in the future [
22]. However, CSP thermal storage has reached up to 14 hours in some plants, and research is being done to extend these times as well [
23]. This combination of reasons motivates including CSP in this analysis and is specifically relevant for Antigua where there are no other dispatchable renewable energy resources to complement wind and solar PV.
An hourly output of each generator was needed for PyPSA modeling. The solar PV and solar CSP used hourly output for the systems using the NASA POWER database which has hourly data for various weather conditions from several years for Antigua [
24]. Wind energy hourly generation estimates were taken from renewables.ninja reanalysis data for Antigua [
13]. As input to PyPSA, each source is scaled to unity and can then be used to calculate the system output depending on the capacity installed.
2.4. Stores Descriptions
PyPSA has two types of storage methods available: (i) storage units based on fixed hours of storage and variable power, and (ii) stores with a fixed output power and variable number of hours of storage for each unit. The latter was used for this present study. Capital costs of the technologies in units of $US/MWh were provided as inputs. The amount of energy in the storage units at the first hour of the model was set to be equal to the energy stored in the last hour of the model for the optimization to avoid end effects of storage either having to be initially charged or to avoid seeking a solution in which all stored energy was discharged at the end of the modeling period. The model was constructed for an annual period, allowing annual cycling in a multi-year simulation.
Both utility-scale batteries and hydrogen were used as storage technologies in this study, in addition to thermal storage from CSP capacity. Utility-scale batteries were only given a limitation in two of the groupings of scenarios done in this analysis. That limit was set to 6 hours of storage for the scenario where all the renewable energy technologies considered in this work were included and 10 hours for sensitivity tests. This type of storage is compatible with wind and solar PV energy. The CSP thermal storage was given a limit of 24 hours for all the scenarios to reflect common dual 12-hour storage tanks that are used in many CSP plants around the world [
25]. The charge and discharge efficiencies of the batteries were 95% (which results in 90.25% overall efficiency) [
26], with efficiencies being implemented through the PyPSA links.
For energy storage and electricity production with hydrogen, the model included electrolysis, hydrogen storage, and fuel cells for converting hydrogen back to electricity. The efficiency of electricity to hydrogen through electrolysis is set at 75% and then the fuel cell turning the hydrogen back to electricity has an efficiency of 60% [
27]. The electrolysis and fuel cell technologies will be characterized through the links connected to and from the hydrogen store, which takes into consideration each of these efficiencies and capital costs. Since hydrogen can be stored essentially indefinitely, the storage size can be much higher. The hydrogen storage was not given any limitations for that reason.
The CSP plant generates thermal energy that is then converted into useful electrical energy before reaching the grid. However, since the power generated from the “CSP” generator has already taken this into account, the storage will be in terms of useful energy rather than in terms of thermal energy.
2.5. Technology Economics
The following tables outline the capital costs of each type of technology. There is also a marginal operating cost, mainly fuel, associated with the diesel generator, which is included in
Table 1. Costs for all technologies are estimates for the period of interest, in about 2035, and therefore necessarily very approximate. However, we consider these estimates to be conservative, as wind and PV systems have already achieved these cost levels in larger countries today. Capital costs for the stores are shown in
Table 2.
To interpret the results given from PyPSA, a levelized cost of electricity (LCOE) was calculated by dividing the total, CRF adjusted cost of the system between capital and marginal costs by the total yearly demand in MWh. Since the model is creating an energy system based on only one year of data, the capital costs of all technologies need to be modified to represent a real levelized cost of electricity. Thus, the capital cost values above were multiplied by a capital recovery factor (CRF) using a discount rate of 7%. Further details are described in
Appendix B.
2.6. Limits on Technologies
A set of constraints were implemented in the model corresponding to minimum capacities in (renewable) technologies already installed, as well as maximum capacities as estimated from physical and technological limits. For example, wind energy was set to maximum values in increments of 25 MW to understand how the solar PV, CSP, and storage technologies would respond to the extra demand the wind was not covering. However, wind energy capacity of larger than about 50 MW appears unlikely given concerns about the tourism industry. Solar PV capacity was not given a limit as the results proved to be reasonable with the inclusion of rooftop solar PV. Government identified lands for renewable energy have been identified including land near the Parham Ridge Wind farm and the existing solar PV Bethesda array, which equate to around 0.8 km
2 of land [
17]. Between approximately 90 km
2 of agricultural land on the island, parking areas, and commercial buildings, and more, land areas of up to 4 km
2 could be utilized for the remaining land needs for solar PV [
32]. Storage limits were based on realistic limitations of the current technologies.
2.7. Land Use Description
Antigua’s total area of 281 km
2 is also a limited resource to be considered, and consequently for each of the scenarios, the total land area requirement was estimated. In this analysis, only solar PV and CSP were taken into consideration. The direct land use of wind turbines is small, although the effective use of land and the visual footprint can be quite large. The land area used per MW was determined to be 17,000m
2/MW (1.7 hectares/MW) [
33] for solar PV and 26,000m
2/MW (2.6 ha/MW) for CSP [
23].
2.8. Job Creation and Destruction
Important to the energy system transition is the concept of a “just transition” from the current paradigm. Although the just transition involves many aspects, such as societal engagement and democratic processes, one key piece is that of changes in employment [
34]. Employment impacts in the electricity sector in Antigua and Barbuda were calculated for each scenario using multipliers that were assigned to the different technologies based on construction and installation, operation and maintenance, and fuel supply. There is also a regional factor that considers the current workforce capabilities of the nation. As Antigua and Barbuda has minimal solar PV and no other renewable sources installed, there will be a lack of experience in the installation and maintenance within the workforce to begin this transition. Then, as time goes on and the workers gain experience, the number of people needed for the same amount of work will decrease.
Appendix C details all the factors that contribute to each of these defined categories. These factors are defined in jobs/MW for operation and maintenance for the overall capacity of each technology or job-years/MW for construction and installation for the capacity added each year for each technology. For each scenario, a logistic growth to the final capacities as given in the optimization was used to estimate yearly job additions for each technology, as well as the jobs needed for operation and maintenance [
35].
3. Results
3.1. Current Electricity System
Scenarios were developed with the assumption of finding electricity system configurations that are consistent with the NDC goals of 86% renewable energy generation of all electricity and 30,000 homes with solar systems [
18]. To compare the different scenarios on an equivalent basis, a model of the current electricity system was created as a baseline. In all cases, a “green field” approach was used, with the assumption that no current system is in place. Therefore, the total cost and levelized costs shown in our results will be based on an annualized accounting with all capital and marginal costs accounted for. Thus, the model that is based on the real optimal system in Antigua including fuel oil generators is a likely counterfactual that would assume replacing current capacities a decade in the future; the assumption is that new generators would have to be bought by then even if the country were to continue down a business-as-usual pathway. In the case of fuel oil generators, the marginal cost is taken as US
$0.17/kWh, and is a significant fraction of the total annualized cost.
Table 3 gives the LCOE found by the model when constrained to technologies currently in use, as well as the corresponding LCOE in the year 2035 with the assumed increase of demand by 20% and assuming that no more solar will be installed in that time. As would be expected, the LCOE will remain the same; these results are useful as a baseline to compare with other scenarios and tell us what the relative costs would be for maintaining or replacing the current system.
3.2. Wind, Solar PV, and Batteries Scenarios
In the first set of scenarios, only solar PV, wind and batteries are included. These technologies are the most common renewable energy sources that are widely used today and are explicitly included in Antigua and Barbuda’s NDC goals. Thus, it was important to understand if these technologies alone would create a reliable and economical system.
Table 4 shows the results of three scenarios with these technologies alone, differing in the maximum amount of wind capacity allowed as part of the solution space.
These scenarios were arranged in a way that increased the wind capacity from 25 up to 100 MW. All these scenarios are at or below the LCOE of the baseline system by about 15%. However, the storage times were not limited in this scenario, which allows an estimate of the kinds of storage needed to bridge periods of low wind and solar resource that may occur at some hours of the year. As seen in
Table 4, storage times of up to nearly 30 hours are required for each of the scenarios. An assumed 70 MW was given for the maximum output of the batteries, given the system peak load of 67.7 MW. These scenarios are not very reliable solutions for an energy system based on battery storage, which might be limited to 8-12 hours, even in the future and even with newer technologies such as Redox-Flow batteries [
36].
3.3. Introduction of CSP with Wind, Solar PV, and Batteries
One of the main contributions of this present work was to examine the utility of CSP as an option in a (near-) 100% electricity system. Although levelized cost reductions were seen with the system of solar PV, wind, and long-term storage, it is important to find more realistic storage options.
CSP was included in three new scenarios with the other renewable technologies that were used in the previous models. Again, limits were set to wind capacity, however, for these models, there were also limits set on each of the energy storage systems. The CSP thermal storage was given a limit of 24 hours, with no limit on the battery storage again. The results with this technology included in the system with the stated limits are displayed in the following table.
Table 5.
Renewables with CSP Scenarios.
Table 5.
Renewables with CSP Scenarios.
| Renewables with CSP |
|---|
| Scenarios |
25 MW Wind Max |
50 MW Wind Max |
100 MW Wind Max |
| LCOE ($/MWh) |
128 |
119 |
118 |
| Land Use (km2) |
7.4 |
6.1 |
5.9 |
| Solar PV (MW) |
402 |
333 |
327 |
| Wind (MW) |
25 |
50 |
62 |
| CSP (MW) |
22 |
18 |
13 |
Battery Storage (MWh)/Hours of
Storage |
561/8hr |
542/7.75hr |
548/7.8hr |
CSP Thermal Storage (MWh)/Hours of
Storage |
1680/24hr |
1680/24hr |
1680/24hr |
The model results of these scenarios show significant cost reductions in the system LCOE of 35%-40%. This decrease was due to the large energy storage provided by the CSP thermal tanks. Thus, the required utility-battery storage was only 8 hours, still not a storage time commonly available today, but projected for batteries in the near future. These results show a similar trend, that increasing the wind energy only somewhat affects the system LCOE. As in the first set of scenarios, limiting the wind capacity to 50 MW or less leads to a solution that drives toward the maximum of that constraint. Also, the land use for each of these scenarios was significantly less than those in the previous scenarios.
3.4. Addition of Hydrogen Storage
The final additional technology considered was that of electrolysis-generated hydrogen that could be stored for long periods of time if necessary, and then converted to electricity using fuel cells [
37]. Several scenarios were run using hydrogen as one option.
Table 6 shows results for a selection of system configurations.
These scenarios yield similar system LCOEs to those without hydrogen. However, it shows that the CSP could be replaced completely with hydrogen storage to produce a very similar value for the LCOE. The combined systems with all technologies in use find that storage for utility batteries and CSP thermal storage are storage times that are in place today, although possibly slightly less common.
3.5 Small Diesel Systems Remaining
The scenarios presented thus far are considerably cheaper than the current system. In all cases, however, the inclusion of diesel has not been incorporated into these hypothetical electricity system models. Antigua is seeking to obtain 86% of energy production through renewable energy by 2030, so including some diesel generation in the system could be a very useful way to help meet this goal and to help in general with the transition to 100% renewable energy generation. Results from scenarios with all technologies included, including diesel generation, either unrestricted or limited to maximum capacities of 10, 5, and 3 MW are shown in
Table 7.
The results shown in
Table 7 have lower LCOEs than the previous sets of scenarios, although the 5 and 3 MW diesel systems are roughly the same as without any diesel capacity. These diesel systems do not actually generate much electricity, with capacity factors between 16% for the largest diesel system and only 7% for the 3 MW system. Thus, the diesel capacity acts as a flexible resource that runs only a few hundred hours each year, but that is implicitly assumed to be able to power on and off at will, a characteristic that may not reflect the reality of the larger diesel generators that are typical for Caribbean islands. However, there are technologies that allow for ramping to be done within a minute, thus allowing for these scenarios to be a reality with larger plants needed at low capacity factors [
38]. It should be noted that the scenarios with larger amounts of diesel generation would require significantly less land than any of the other scenarios shown. In all these scenarios, the renewable energy generation is higher than the NDC target of 86% by 2030. Thus, any of these systems would allow Antigua to reach their goal. However, this could be accomplished with diesel generation that is constant, as their diesel plants would operate now, albeit at a low capacity factor.
3.6. Summary of scenarios
Based on the assumed total load for 2035, a constant 7 MW of diesel generation could be used to accomplish 86% of energy generated by renewable energy. The results in
Table 8 above show various scenarios that could be utilized in the transition to 100% renewable energy generation for their electric grid. These results show that the LCOE will be competitive to the other completely renewable and small-scale diesel generators that can be ramped on and off quickly and easily. However, this model shows again that having no CSP or hydrogen storage will drive up the LCOE quite significantly. Thus, at least one of these technologies could be extremely beneficial to the system to help bring the LCOE down even if the technologies do not play the most important role in the system.
3.7. Sensitivity Tests
A sensitivity analysis on the capital cost of solar PV and CSP and on the marginal cost of the diesel generation per MWh were done. Scenarios were run with assumed solar PV capital costs of
$1200/kW and
$550/kW rather than the baseline of
$880/kW. CSP capital costs were increased by a factor of 1.2 (
$4080/kW for generator and
$60/kWh for storage) and decreased by a factor of 0.8 (
$2,720/kW for generator and
$40/kWh for storage) as sensitivity checks. Finally, the baseline marginal cost of diesel generation,
$0.60/liter [
39], was increased to
$1/liter as the check for sensitivity of scenarios to higher fossil fuel costs.
For a system that had no restrictions with solar PV, wind, CSP, and utility storage and an increased cost of fuel oil, results in a system LCOE of
$129/MWh but with no fossil fuel capacity, as shown in
Table 9. That is, an increased fuel oil cost results in the system without fossil fuels being the lowest cost optimal solution.
For the sensitivity tests to capital costs for solar PV and CSP, constraints of 25 MW for wind energy, a maximum battery storage of 10 hours, and a maximum CSP storage time of 24 hours were implemented. Results are shown in
Table 9 and
Table 10.
The cost for solar PV impacts the system LCOE most, with less sensitivity in resulting CSP capacity and to CSP cost. Given the strong tendency in the past for solar PV costs to decrease and for the cost of oil on global markets to fluctuate, both the main results and the sensitivity tests indicate that a system based mainly on solar PV and with a gradual phase-out of fossil fuel generation will be economically advantageous.
3.8. Land Use Results
Land use is a key factor in these systems as renewable energy technologies take up considerably larger areas than fossil fuel plants do. Many of the scenarios required up to 8 km2 of land for the solar PV and CSP plants. Based on the results from the scenarios, the land use of these technologies can be calculated. The land use for the solar PV and CSP are both relevant to available land in Antigua and the NDC targets that are set by the nation.
As indicators for land use, there are two large areas currently in use by the energy sector, the West Indies Oil Company facility and the site of the current generating capacity on Crabbs Peninsula, with a combined area of about 0.7 km
2 [
40]. This is larger than the amount of space the CSP plants would occupy, at around 0.4 km
2, for a 15 MW plant, the average plant size for the scenarios allowing for CSP. This is also comparable to the space required for a 33 MW plant, needing around 0.9 km
2.
The NDC target of installing solar panels on 30,000 houses [
18], with an assumed 4 kW system each, requires around 2 km
2 of roofing space for a total of 120 MW of rooftop solar PV. Since a typical house in Antigua and Barbuda has 180 m
2 of area [
40], the 30,000 homes represent approximately 5.5 km
2 of space, so more than half of all the roofing for these homes would be occupied with additional solar panels capable of being installed if loads rise beyond the needs a 4 kW solar system can provide. Although the entirety of most roofs in Antigua cannot be utilized for solar PV, as panels need to be flush to the roof, which requires more space, and need to be south facing to get optimal output. Regardless, there should be plenty of room with an extra 3.5 km
2 of roofing from the 2 km
2 minimum. Parking areas and commercial, industrial and government buildings would also represent land surface that could be used for solar PV without encroaching on new land. However, it does appear that an order of 1.5-3.5 km
2 of land area may be required for installing enough capacity to meet the target of 100% renewable energy.
3.9. Job Creation/Destruction
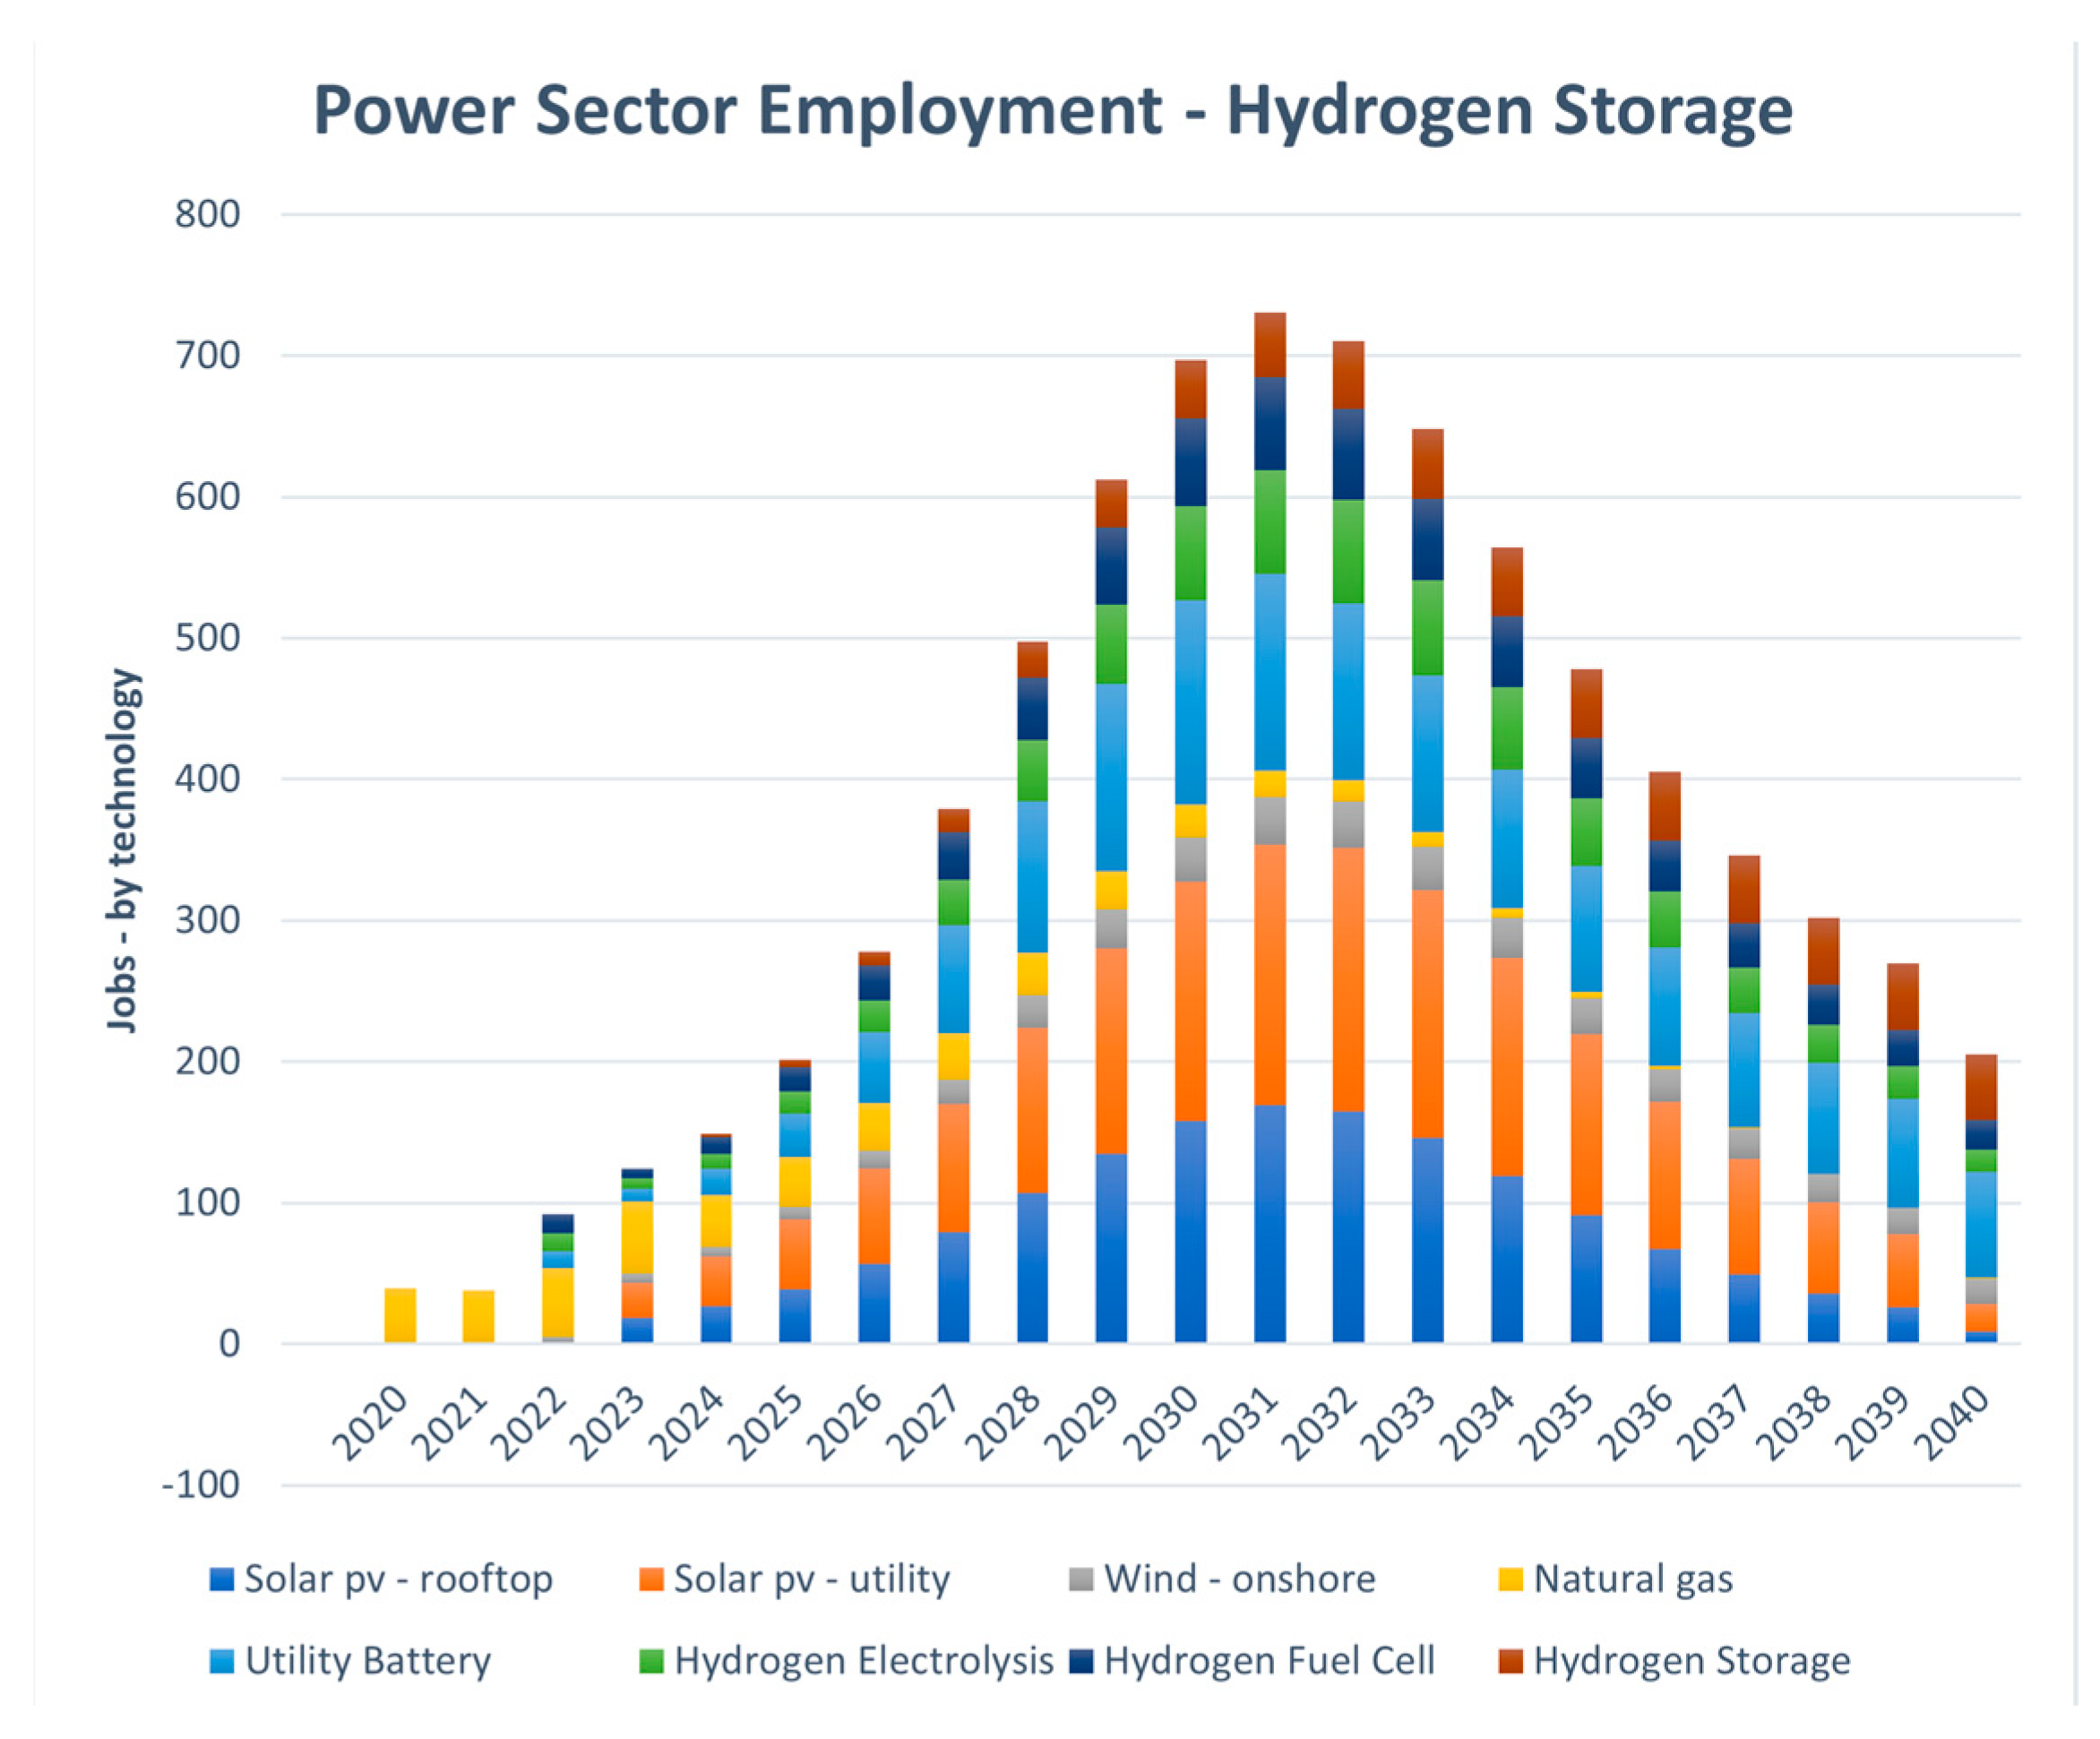
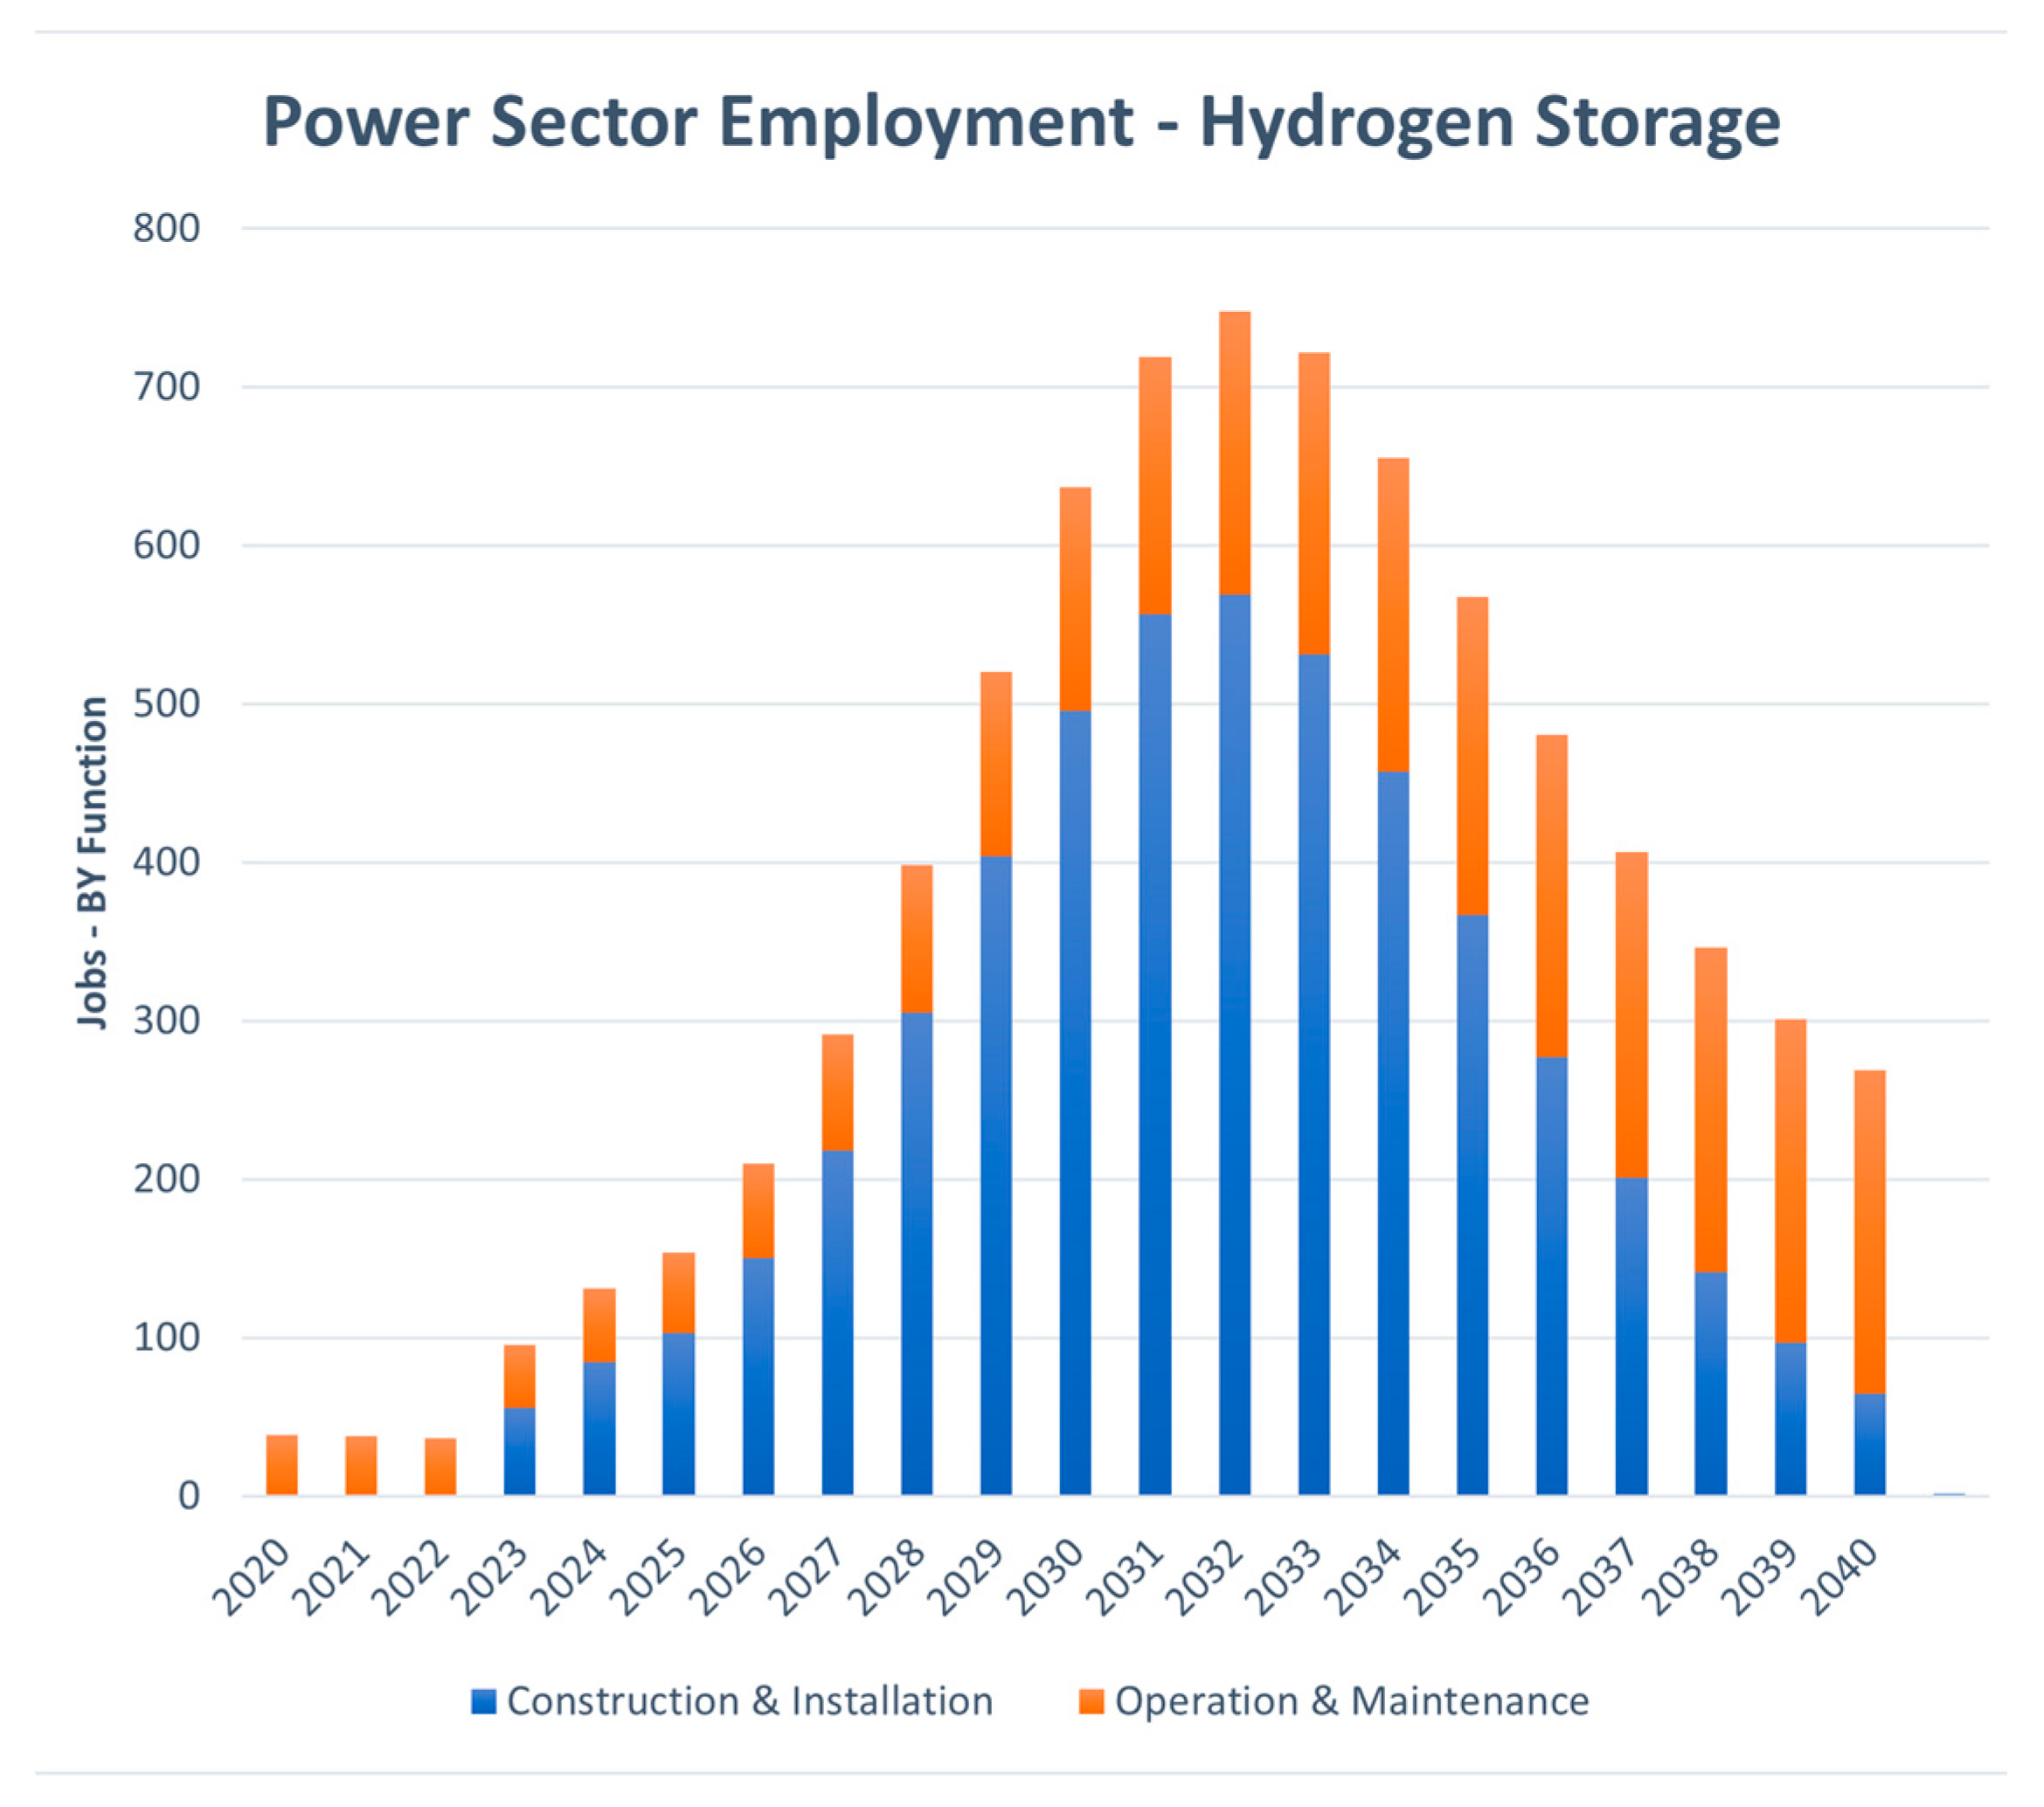
The job outlook for the proposed systems found results of large job creation for several of the scenarios.
Table 4 and
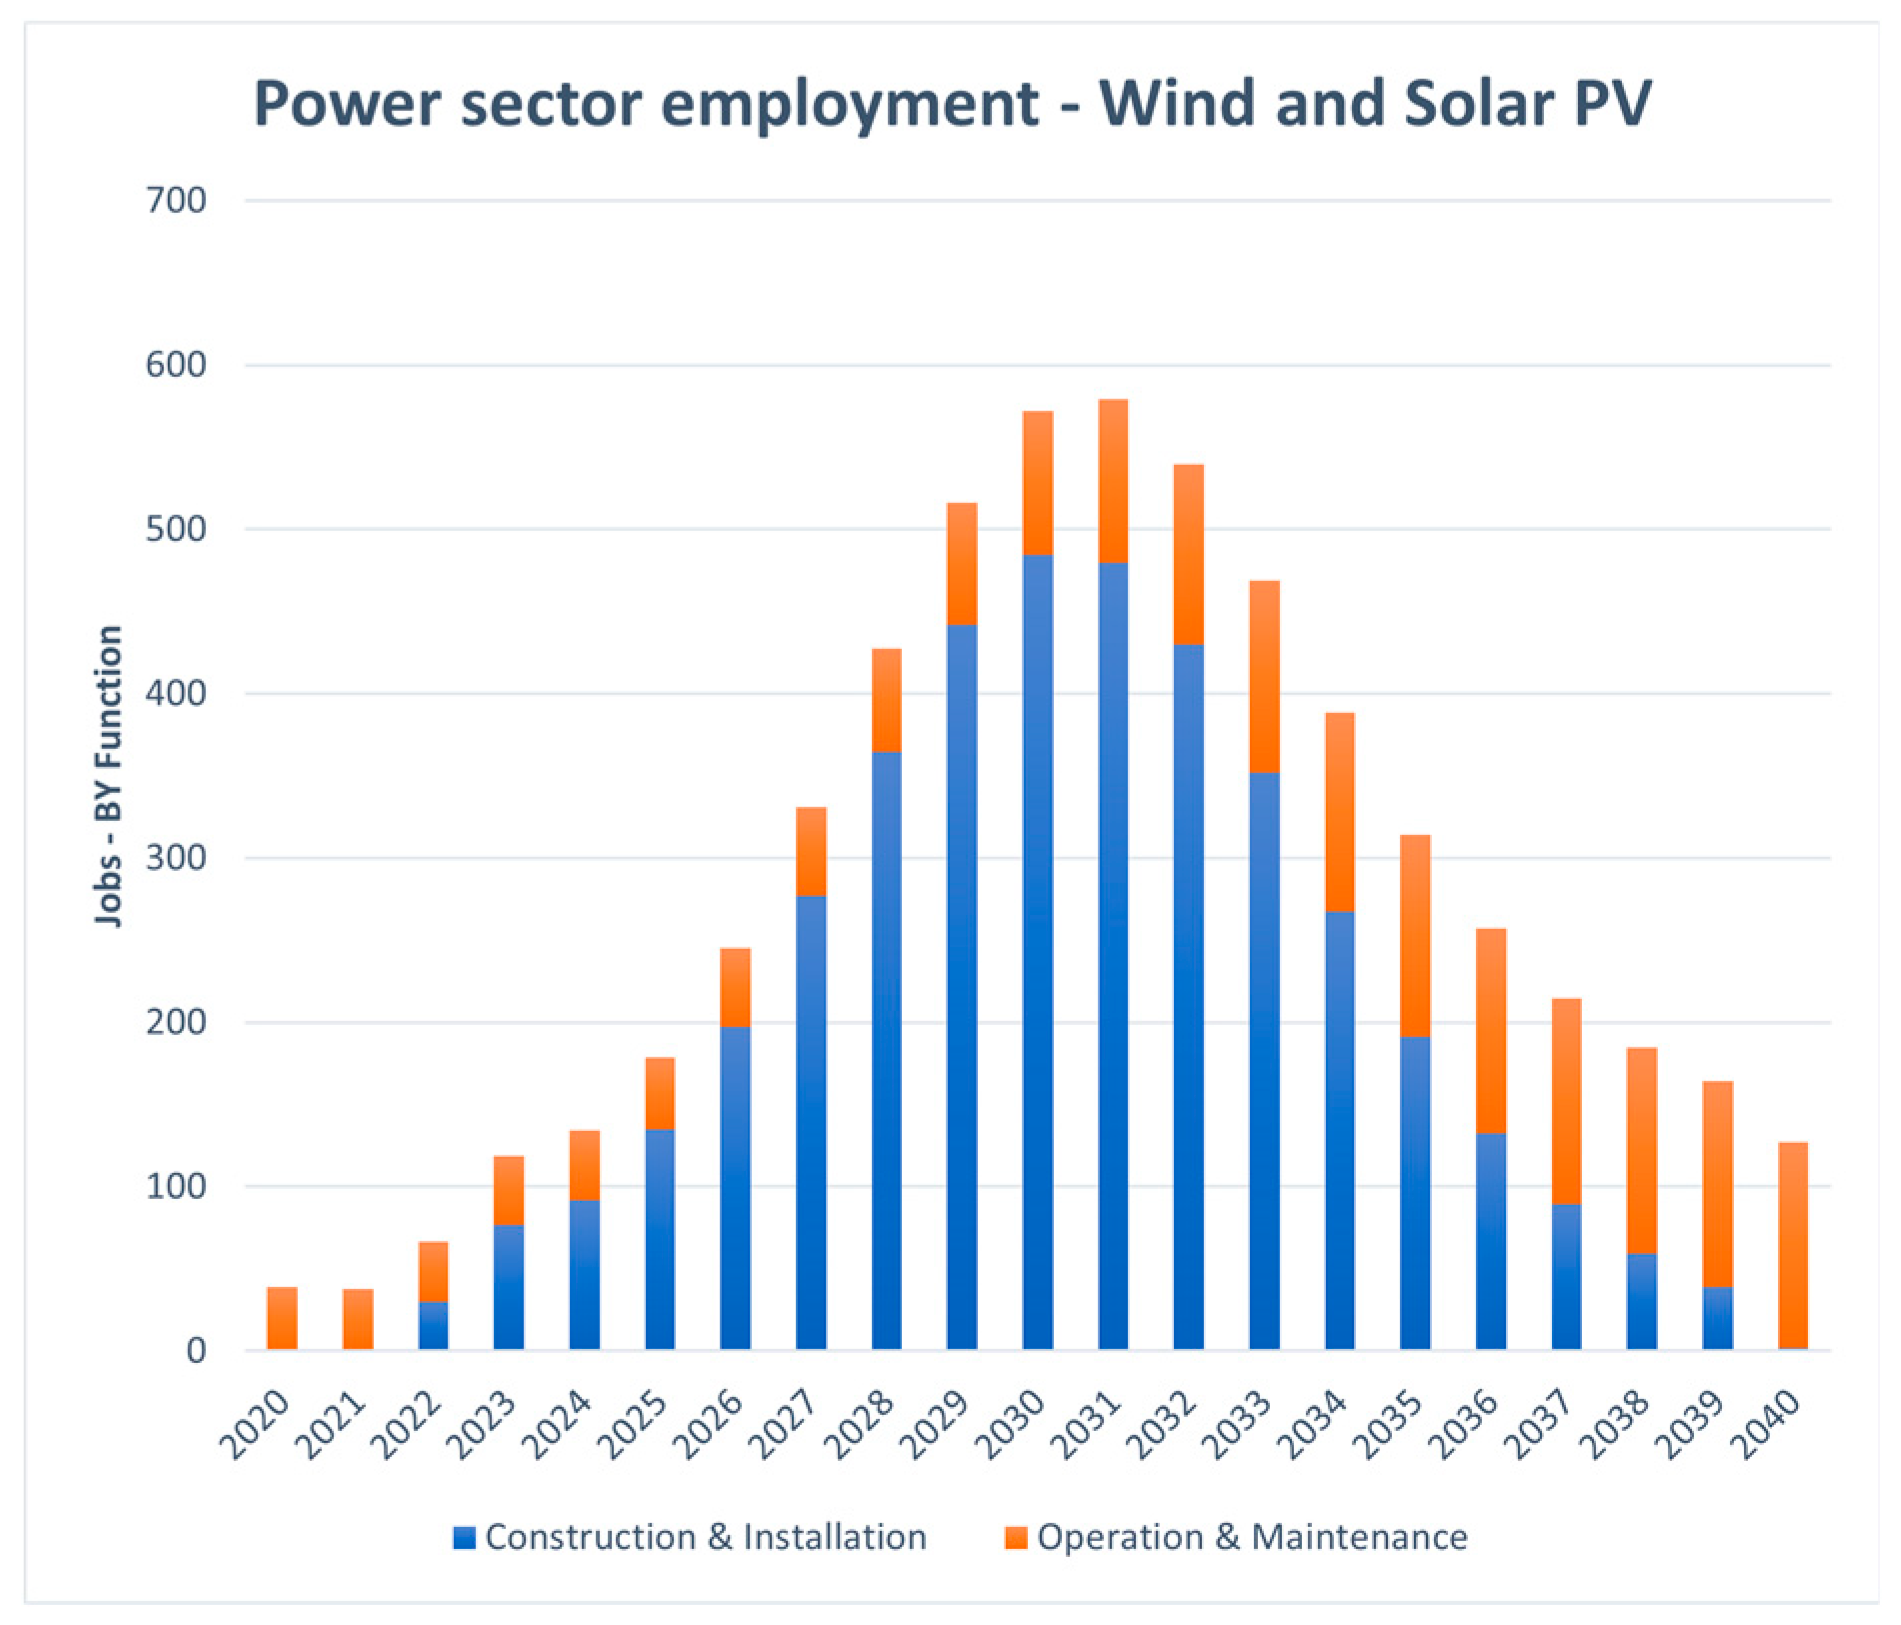
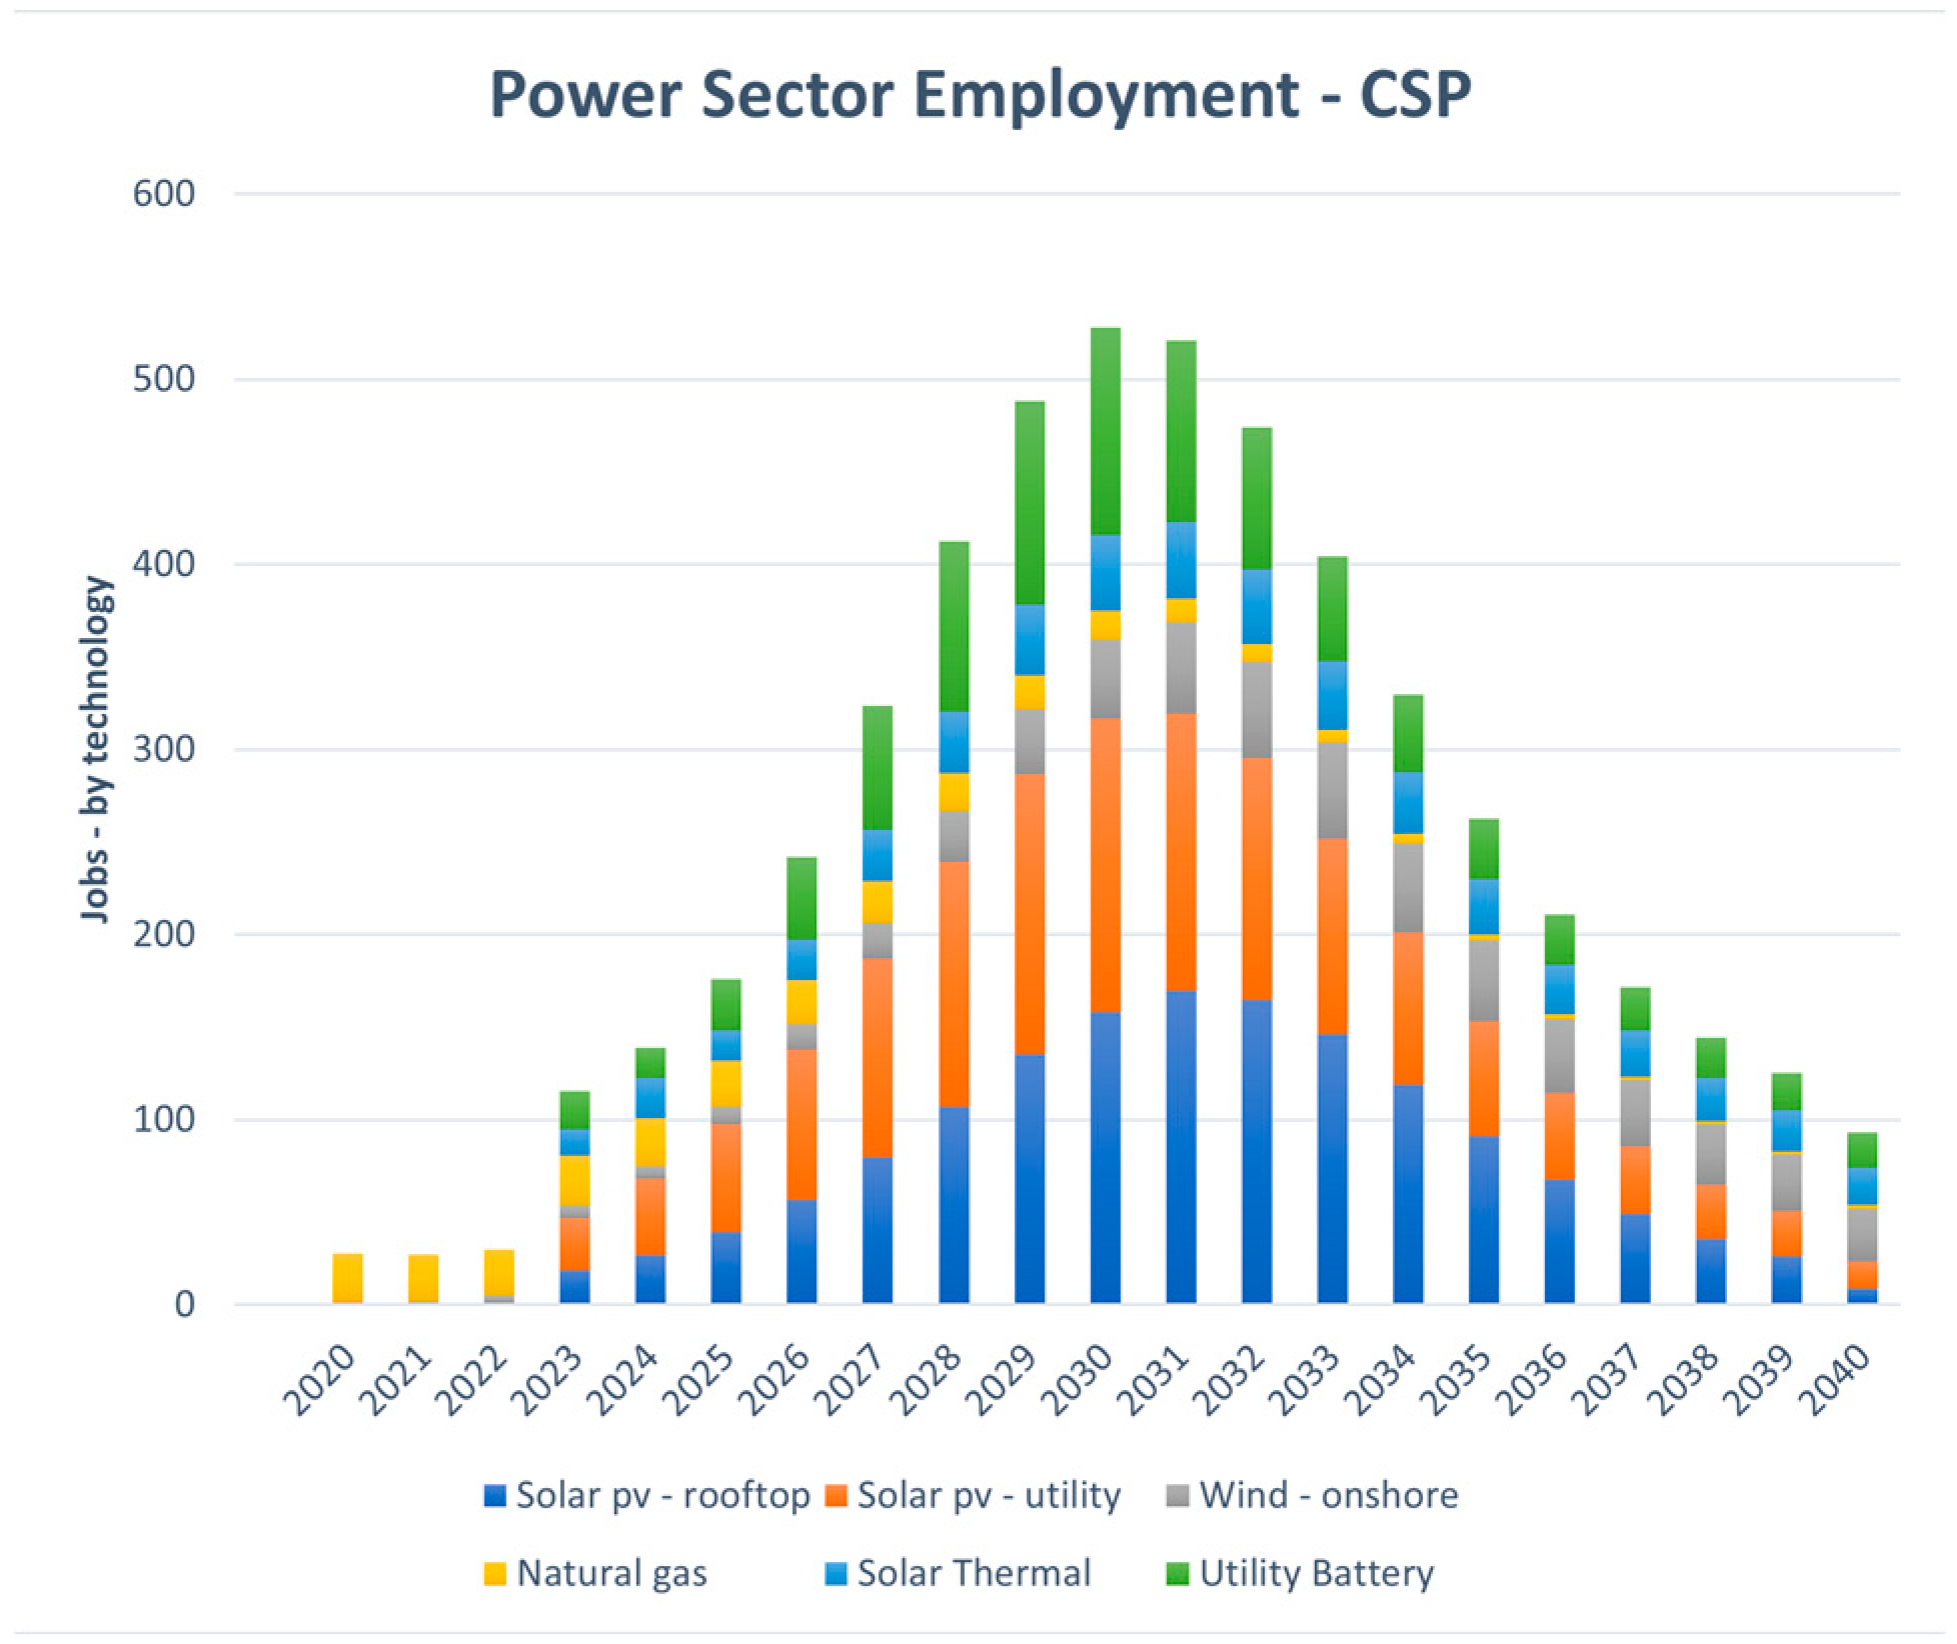
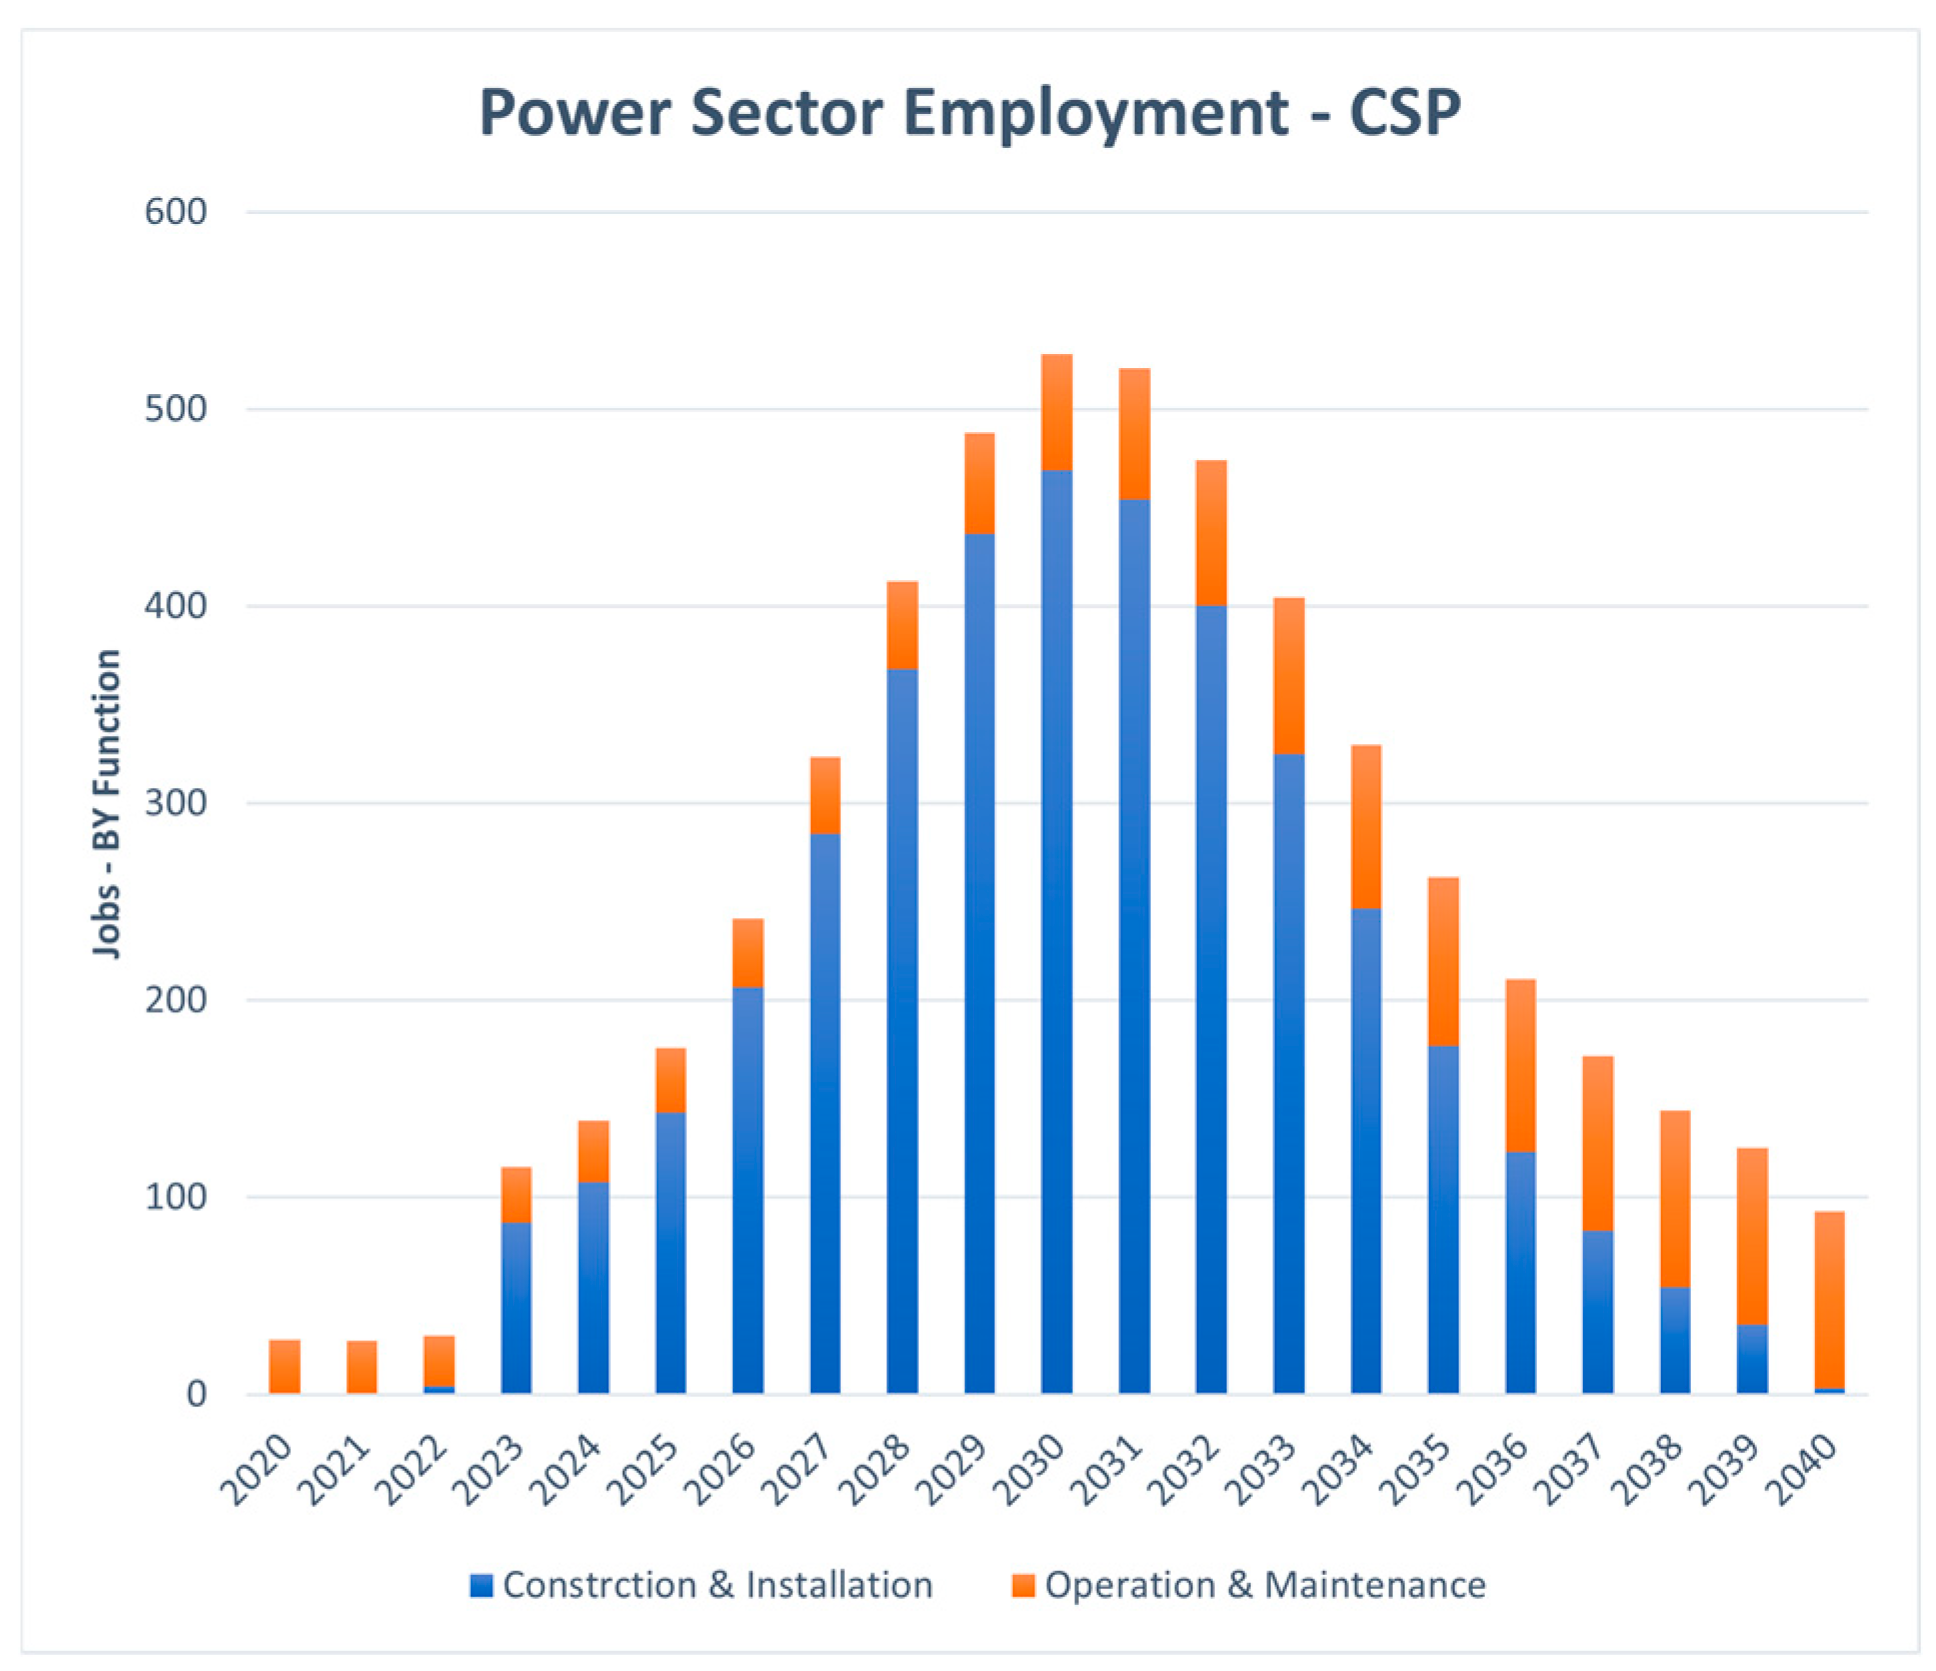
Table 5 show the job creation from 2020 to 2040. The almost 90 MW of the currently installed electricity system accounts for around 60 jobs based on the assumptions made to calculate jobs required/created for this type of technology. The figures demonstrate there is not only a short-term increase in job creation, but a long-term increase as well. Since the renewable energy systems that are a part of this analysis that take control of the system are not dispatchable sources, there is a significant increase in the number of jobs required to run the system.
There are at least 500 jobs required for each of the scenarios that were analyzed. There also reaches a maximum of just under 700 jobs needed in 2033 for these scenarios. The technologies that create the most employment are solar and wind energy. Utility solar will especially require the greatest number of workers during construction because the size of the solar PV plants are substantially larger than any of the other technologies. As time goes on, it is clear that the number of jobs will continue to decrease after the peak in 2033, but it will still provide more jobs for those who live on the island than the current energy sector requires. However, regardless of what scenario is analyzed, there will be a significant number of jobs required, especially during the construction of the technologies, from the baseline of the approximate current jobs needed for 90 MW of installed capacity that there currently is.
4. Discussion
The results of this present study can be an important step toward understanding how more renewable energy can be implemented to meet Antigua and Barbuda’s NDC target of 86% of energy produced by renewable energy for 2030 and in creating a strategy to meet that target [
18]. All scenarios in our analysis achieve the target, and even in the scenario with remaining fossil-fuel technologies, diesel generation only accounts for 12% of total electricity generation. Thus, in an optimal system with the lowest LCOE at
$83/MWh, the NDC target would already be met and seen as a large step toward achieving a system with 100% renewable electricity. However, as shown in the sensitivity tests, the optimum scenarios found with remaining fossil fuel generation are sensitive to the assumption that fuel oil will remain inexpensive; the overall long-term cost of the system with higher fuel costs is equivalent to that without any diesel generation. An advantage of the 100% renewable energy system is therefore an insensitivity to fluctuations in cost on global fossil-fuel markets.
One potential pathway forward from the current system would be to utilize small-scale diesel generation that many businesses and homes already have for emergency generation when the grid is unable to provide adequate energy across the island. These types of generators are able to power on and off easily and are more flexible than the large scale 10 MW generators. Thus, in scenarios where the diesel generators are limited to 10, 5, or 3 MW, where LCOE is lower than any other scenario, it is feasible to rely on these small-scale generators for distributed backup generation for those times of the year that the renewables and storage cannot meet.
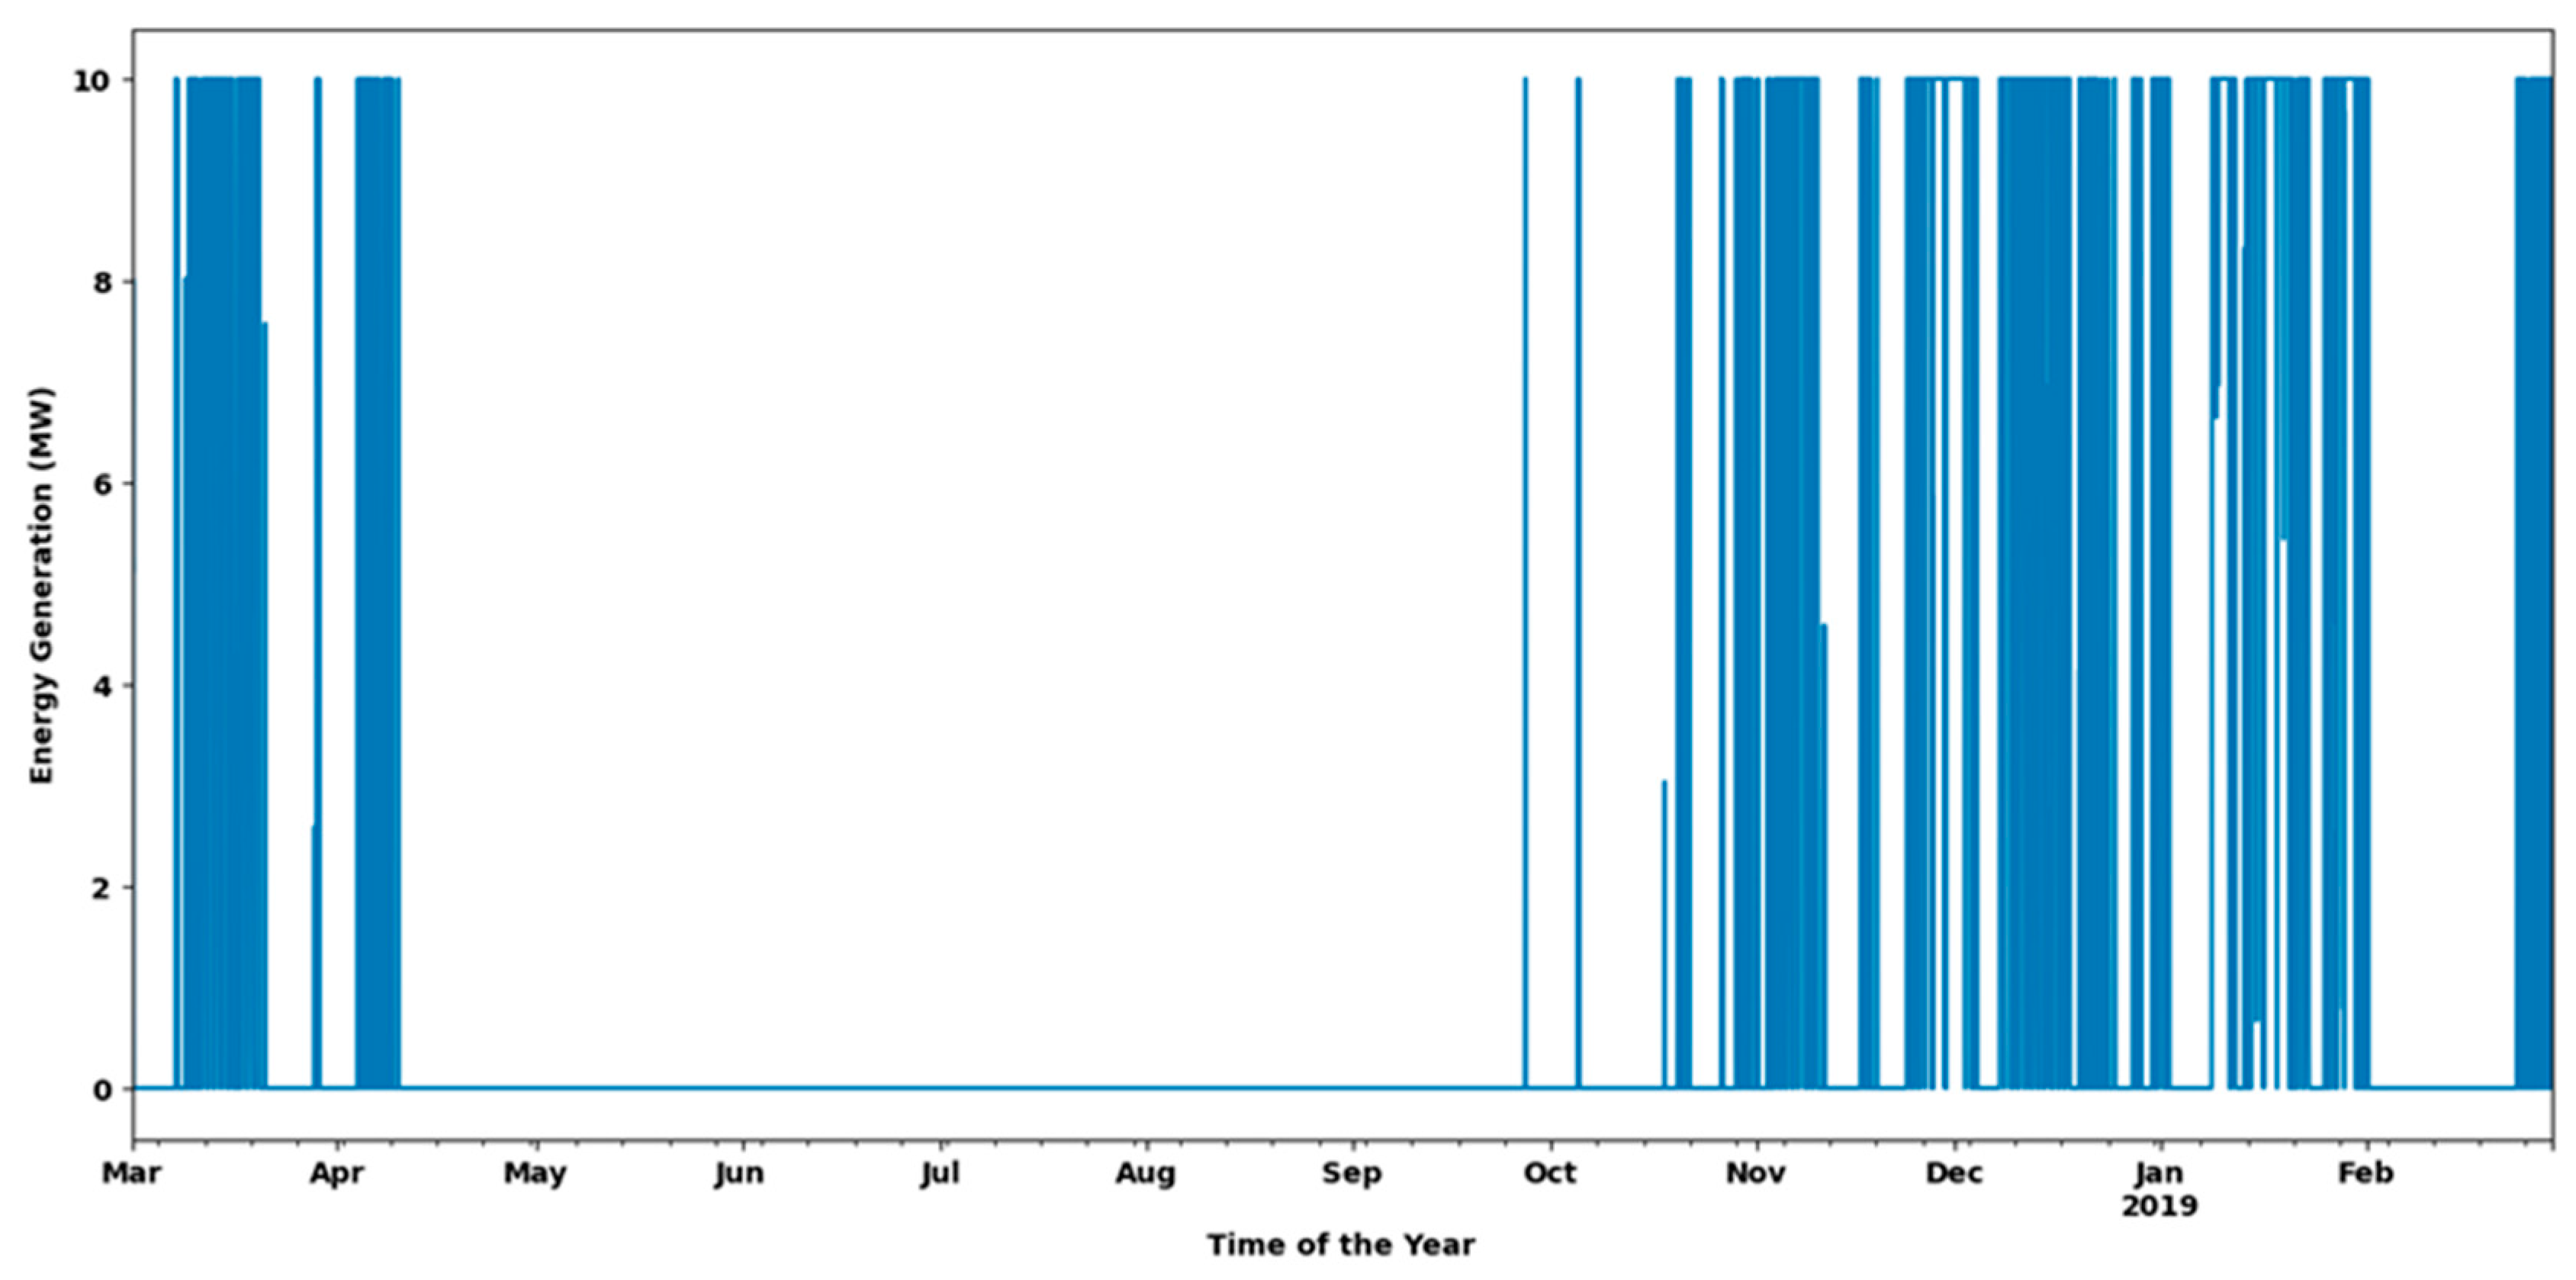
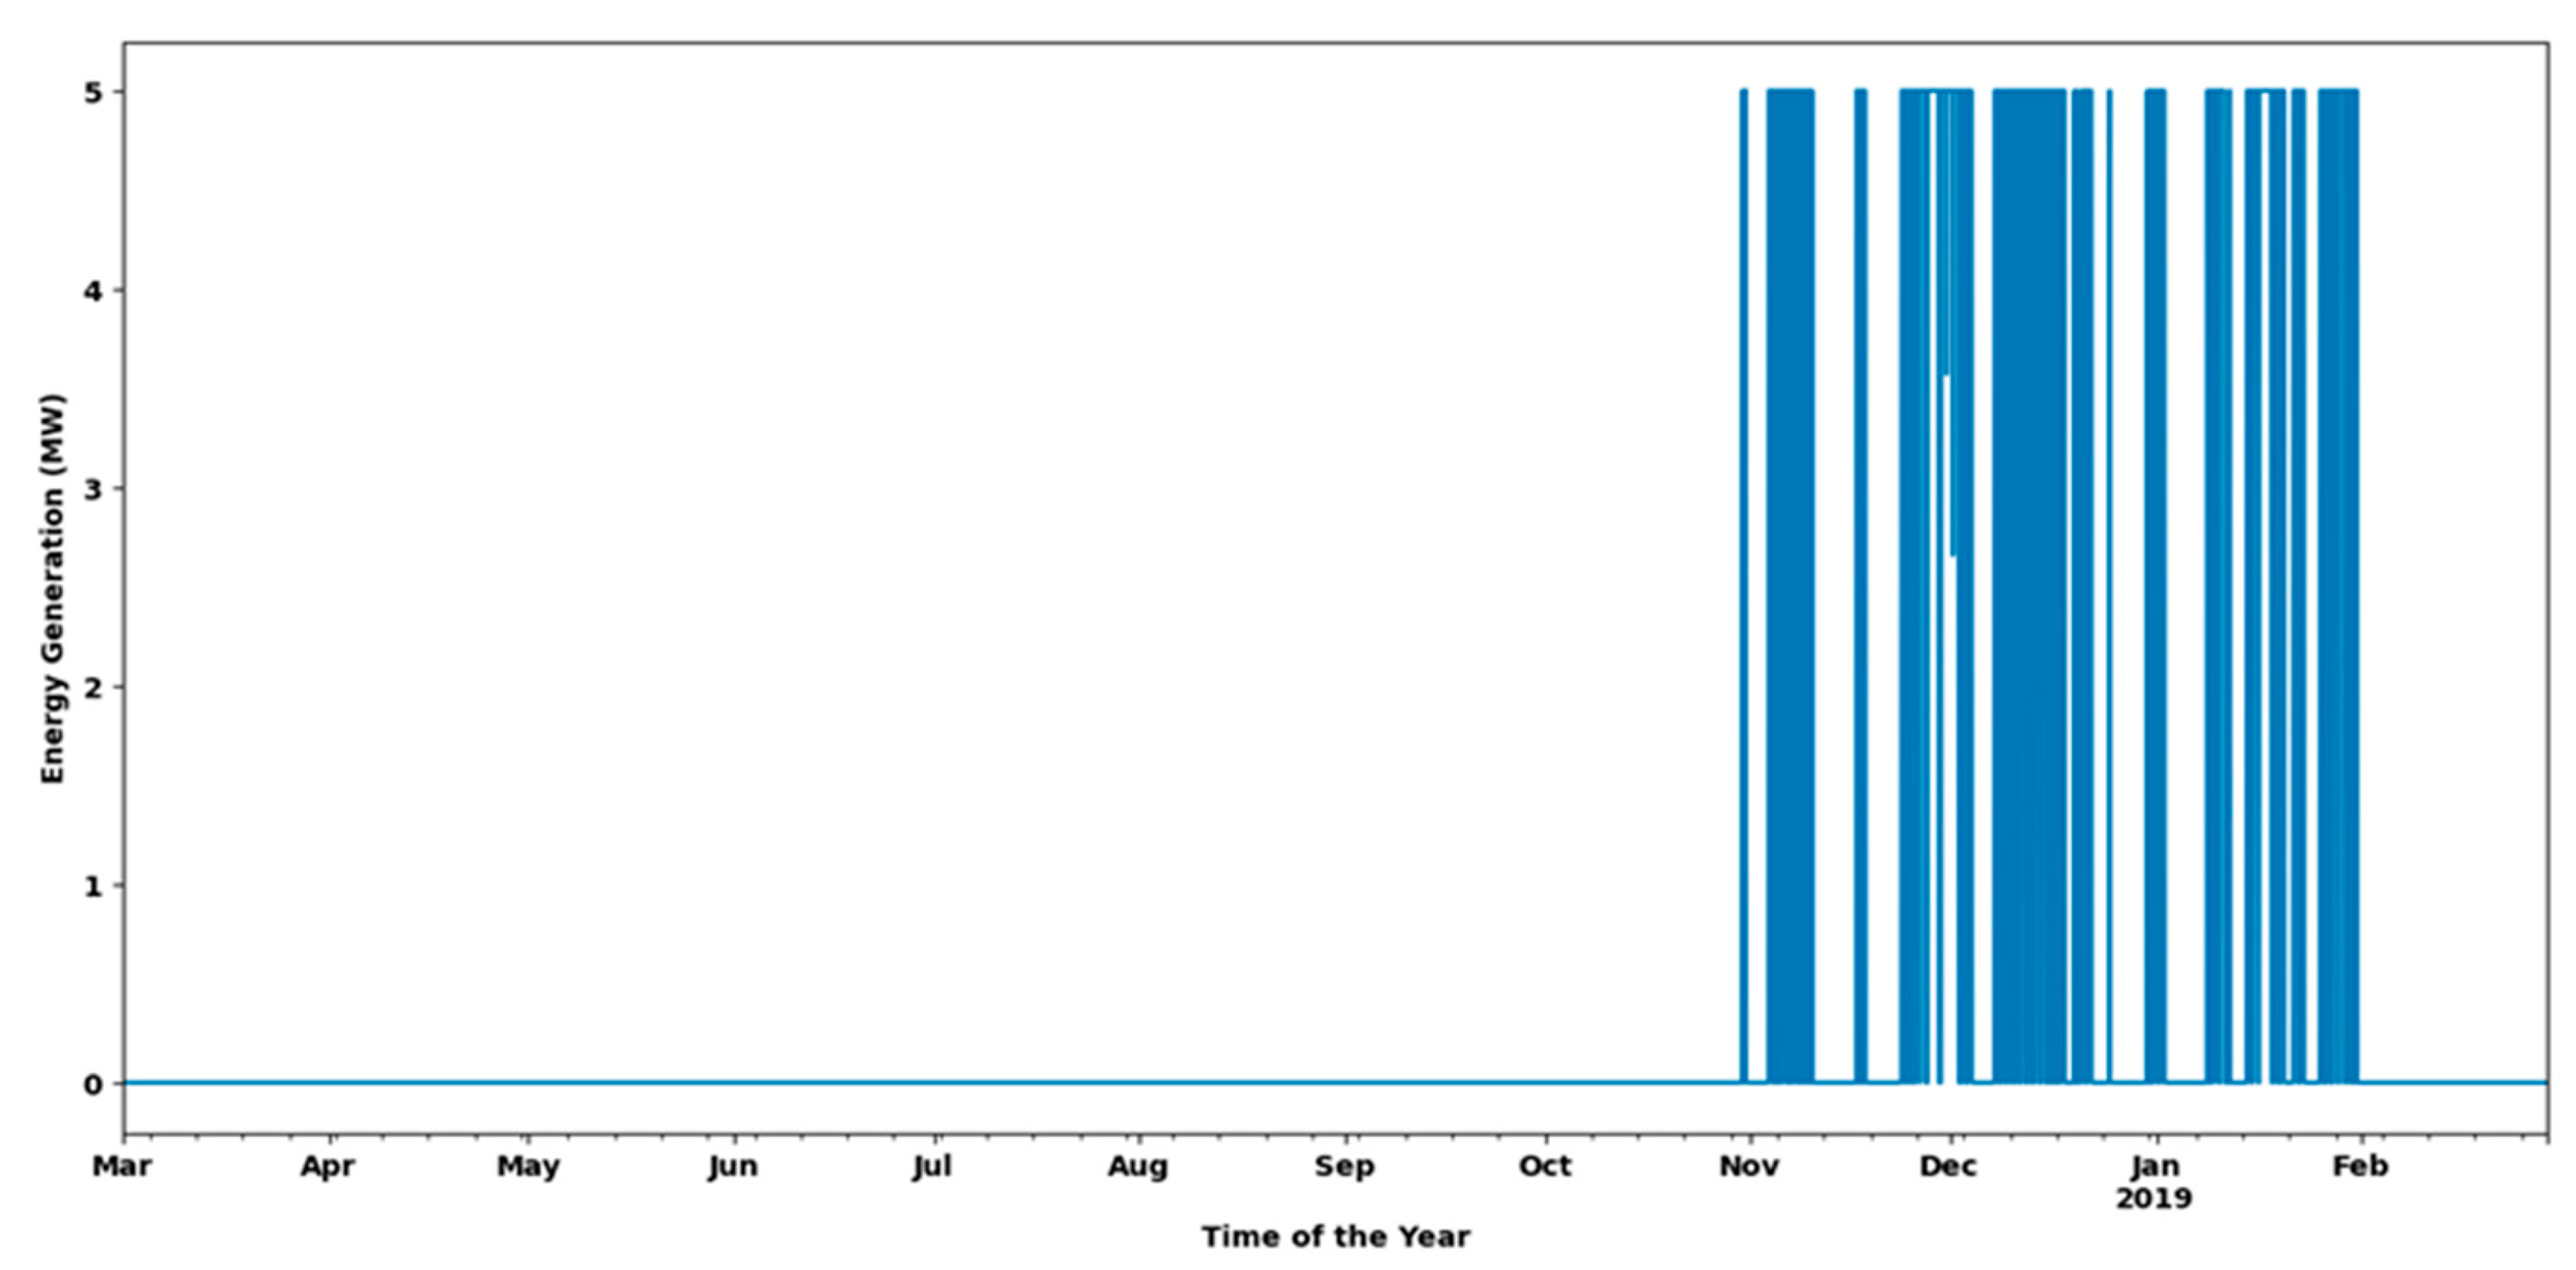
Figure 2 and
Figure 3 in the results section show how many of these hours are concentrated between the months of November to February.
Figure 4.
Hydrogen Scenario by Technology.
Figure 4.
Hydrogen Scenario by Technology.
Figure 5.
Hydrogen Scenario Jobs by Function.
Figure 5.
Hydrogen Scenario Jobs by Function.
Since many households and businesses already own diesel backup generators, a system solution could be feasible if coordination between distributed generation and the grid could be managed. Such a coordinated distributed system may also be a step towards 100% renewable energy generation, in which household solar generation, batteries and electric vehicles will provide the backbone for a combined smart grid. One important issue that will have to be considered is that of the distribution of the burden of costs for a transition; if, as suggested here, the renewable energy solution is the most cost-effective one, at least over the system lifetime, provisions will have to be made to ensure that those with lesser financial means can be part of that transition and not have to rely on the more expensive fossil-fuel options, such as personal backup generators.
In one of the main contributions of the present work, we find that the implementation of CSP helps to significantly drop the LCOE of the system and allow storage times that bridge the relatively rare longer periods of low solar PV and wind energy, compared to those scenarios with only variable renewables and utility-scale batteries. For every scenario with CSP as an option, the optimization model chose to include it and proved that the technology is well suited for the island and provides important storage with longer storage times than the utility storage even with large capital costs for the plant.
Another key outcome of the scenario selection is that increasing wind power from 25 to 50 MW decreases the LCOE of the system noticeably for every combination of technologies, but the LCOE will only decrease very slightly with systems larger than 50 MW. Finally, the implementation of hydrogen storage will create a similar reduction in LCOE as CSP. Our results provide a range of possibilities, thus allowing policymakers to gain a better understanding of how different technologies might perform in different contexts, which can inform decisions about where to invest resources and which technologies to prioritize.
Another important consideration is public and governmental trust in different technologies. In some scenarios, certain technologies may be more widely accepted and trusted, while others may face more resistance or skepticism. By considering scenarios that reflect varying levels of public trust, policymakers can identify potential barriers to the adoption of certain technologies and develop strategies to address them. This could involve investing in public education campaigns or conducting outreach to build trust and understanding around specific technologies.
The energy system transformation clearly implies a transition in the nature of various economic sectors. To ensure a smooth and just transition to renewable energy, it is important to understand in greater detail the impact on jobs and livelihoods of those working in traditional fossil fuel-based industries. Implementing these technologies over the next 15 years will require fewer jobs at one time to help with any potential issue of employee shortages. This study shows that each scenario will require at least as many jobs as the current electricity sector has now. Data gathering as more projects are implemented will be important to help policymakers develop effective strategies to support workers and mitigate any negative impacts of the transition to renewable energy.
In conclusion, these results show that there is no single defined pathway towards a 100% renewable energy system. These results are likely reflected in other nations in the Caribbean who share similar resources and current energy sectors. However, in most other Eastern Caribbean countries there are geothermal or hydropower resources that can be effectively used as dispatchable resources to enable greater penetration of the cheapest renewable energy sources, wind and solar PV. The present work shows that even in the more challenging case of Antigua and Barbuda, 100% renewable electricity systems are viable and significantly less costly than current power systems.
Author Contributions
“Conceptualization, R.J.B.; methodology, P.H., A.C., R.J.B.; validation, A.C., R.J.B.; investigation, P.H.; data curation, R.J.B; writing—original draft preparation, P.H., R.J.B.; writing—review and editing, P.H., A.C., R.J.B.; visualization, P.H., R.J.B..; supervision, A.C., R.J.B. All authors have read and agreed to the published version of the manuscript.”.
Funding
This research received no external funding. PH acknowledges support from the University of Dayton Honors Program for his Honors Thesis work.
Data Availability Statement
Not applicable.
Acknowledgments
We acknowledge support from Jonas Hörsch at Climate Analytics in Berlin, Germany, for useful conversations concerning implementation of PyPSA.
Conflicts of Interest
The authors declare no conflict of interest. RJB has worked in the past with Climate Analytics and Antigua and Barbuda Department of Environment colleagues on energy models used for developing Nationally Determined Contribution (NDC) targets, however the present work is independent of those efforts and does not imply approval of the Department of Environment in Antigua and Barbuda.
Appendix A
The levelized cost of electricity (LCOE) is an important characteristic of an energy system to determine if it will be an economically viable system for a given load. The LCOE is a value found by adding up the lifetime cost of an electricity plant including capital and marginal costs, divided by the total units of electricity the plant will generate in its lifetime. In the models used in this paper the LCOE for the system is given in terms of $/MWh of electricity generated by system as a whole, not for individual technologies. All of the capital costs associated with a given system in this analysis can be added together and then divided by the total yearly load to find a LCOE for the given system. Thus, the lower the LCOE that is calculated, the more economically viable the system will be.
Appendix B
A capital recovery factor is the ratio of a constant annuity to the present value of receiving that annuity for a given length of time [
41]. This capital recovery factor can be defined with the following equation:
The variable i is the discount rate and the variable n is the lifetime of the plant in years. In this scenario, i was assumed at a value of 7%, or 0.07, and n was assumed at a conservative value of 25 years (15 years was used for utility batteries). Using Equation 1 and multiplying the values in
Table 1 and
Table 2 in the methodology section results in the values shown in
Table A1 and
Table A2 below.
Table A1.
CRF Multiplied Generator and Link Capital and Marginal Costs.
Table A1.
CRF Multiplied Generator and Link Capital and Marginal Costs.
| Generator |
Capital Cost ($/kW) |
Marginal Cost ($/MWh) |
| Diesel |
154.46 |
1.70 |
| Wind |
115.84 |
N/A |
| Solar PV |
75.51 |
N/A |
| Concentrating Solar Power Generation |
291.76 |
N/A |
| Hydrogen Electrolyser |
85.81 |
N/A |
| Hydrogen Fuel Cell |
42.91 |
N/A |
Table A2.
CRF Multiplied Store Capital Costs.
Table A2.
CRF Multiplied Store Capital Costs.
| Stores |
Capital Cost ($/kWh) |
| Utility Battery [22] |
143 |
| CSP Thermal Storage [31] |
50 |
| Hydrogen Storage [27] |
33.33 |
Appendix C
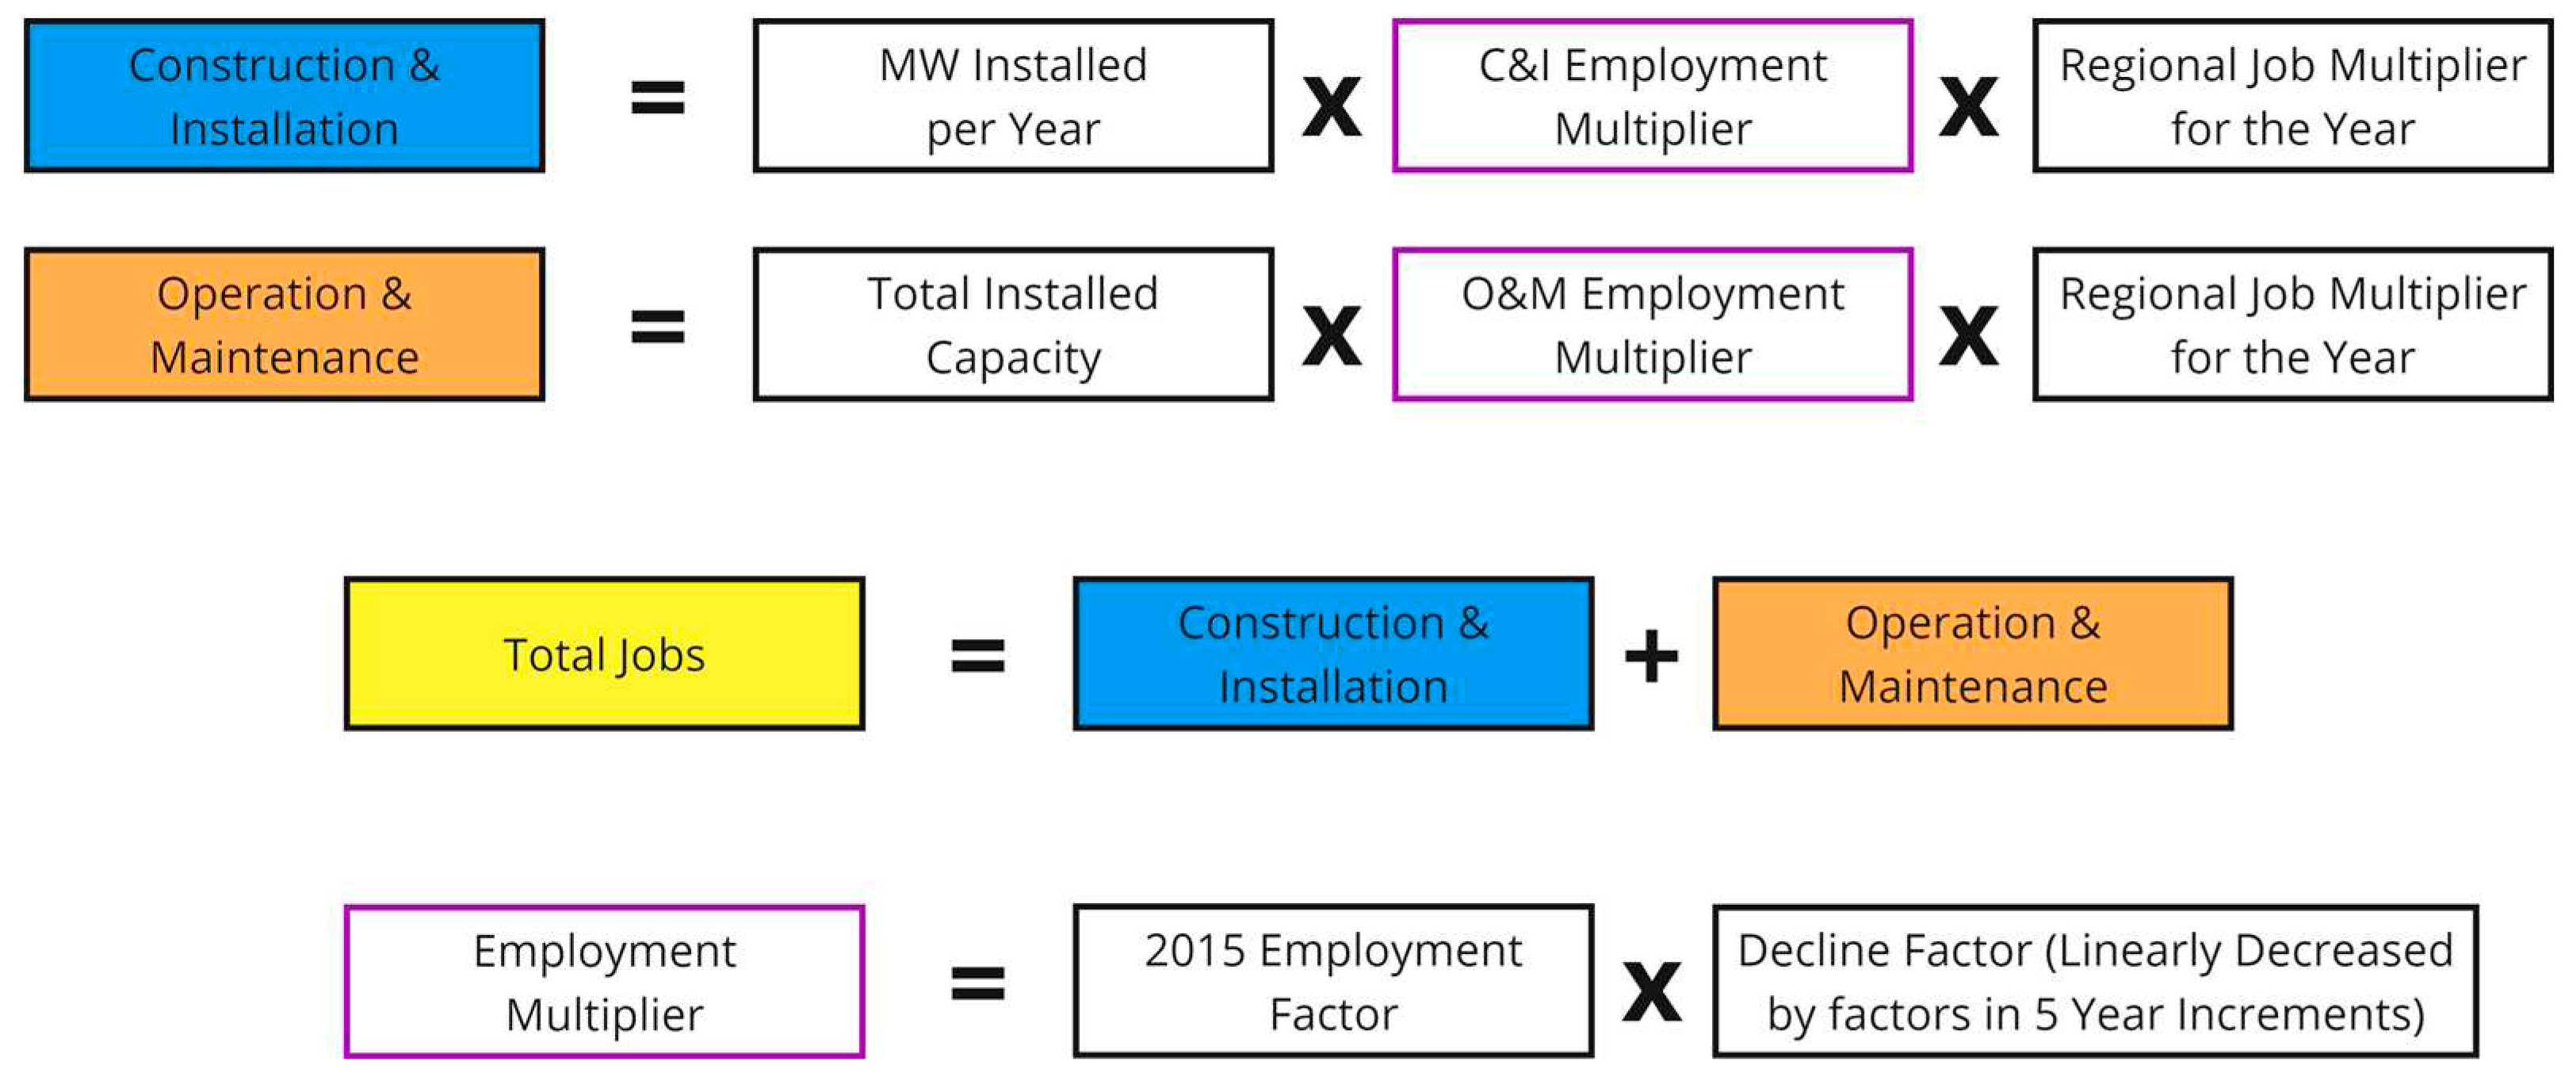
Values for total capacity of each technology and capacity added each year are used in conjunction with employment factors to find jobs/MW and job years/MW for each technology in terms of construction and installation (C&I) and operation and maintenance (O&M), as well as the total job impact of the jobs in the electricity sector [
42]. This was done on a yearly basis using a logistic curve to implement the system over a given period of time as would be more realistic than implementation all at once. Then, to find the required diesel system, an approach that found the kWh/kWpower for renewable energy generator technology then multiplying the found MW capacity calculated from the logistic curve of these technologies was required. These total generation values were summed together and subtracted from the yearly load and then divided by the number of hours in a year, 8,760 hours. Finally, this was adjusted by multiplying the value by 1.9 because the current system is much larger than just the load divided by the number of hours due to maintenance, large peak loads, etc.
Figure C1.
Job Impact Considerations.
Figure C1.
Job Impact Considerations.
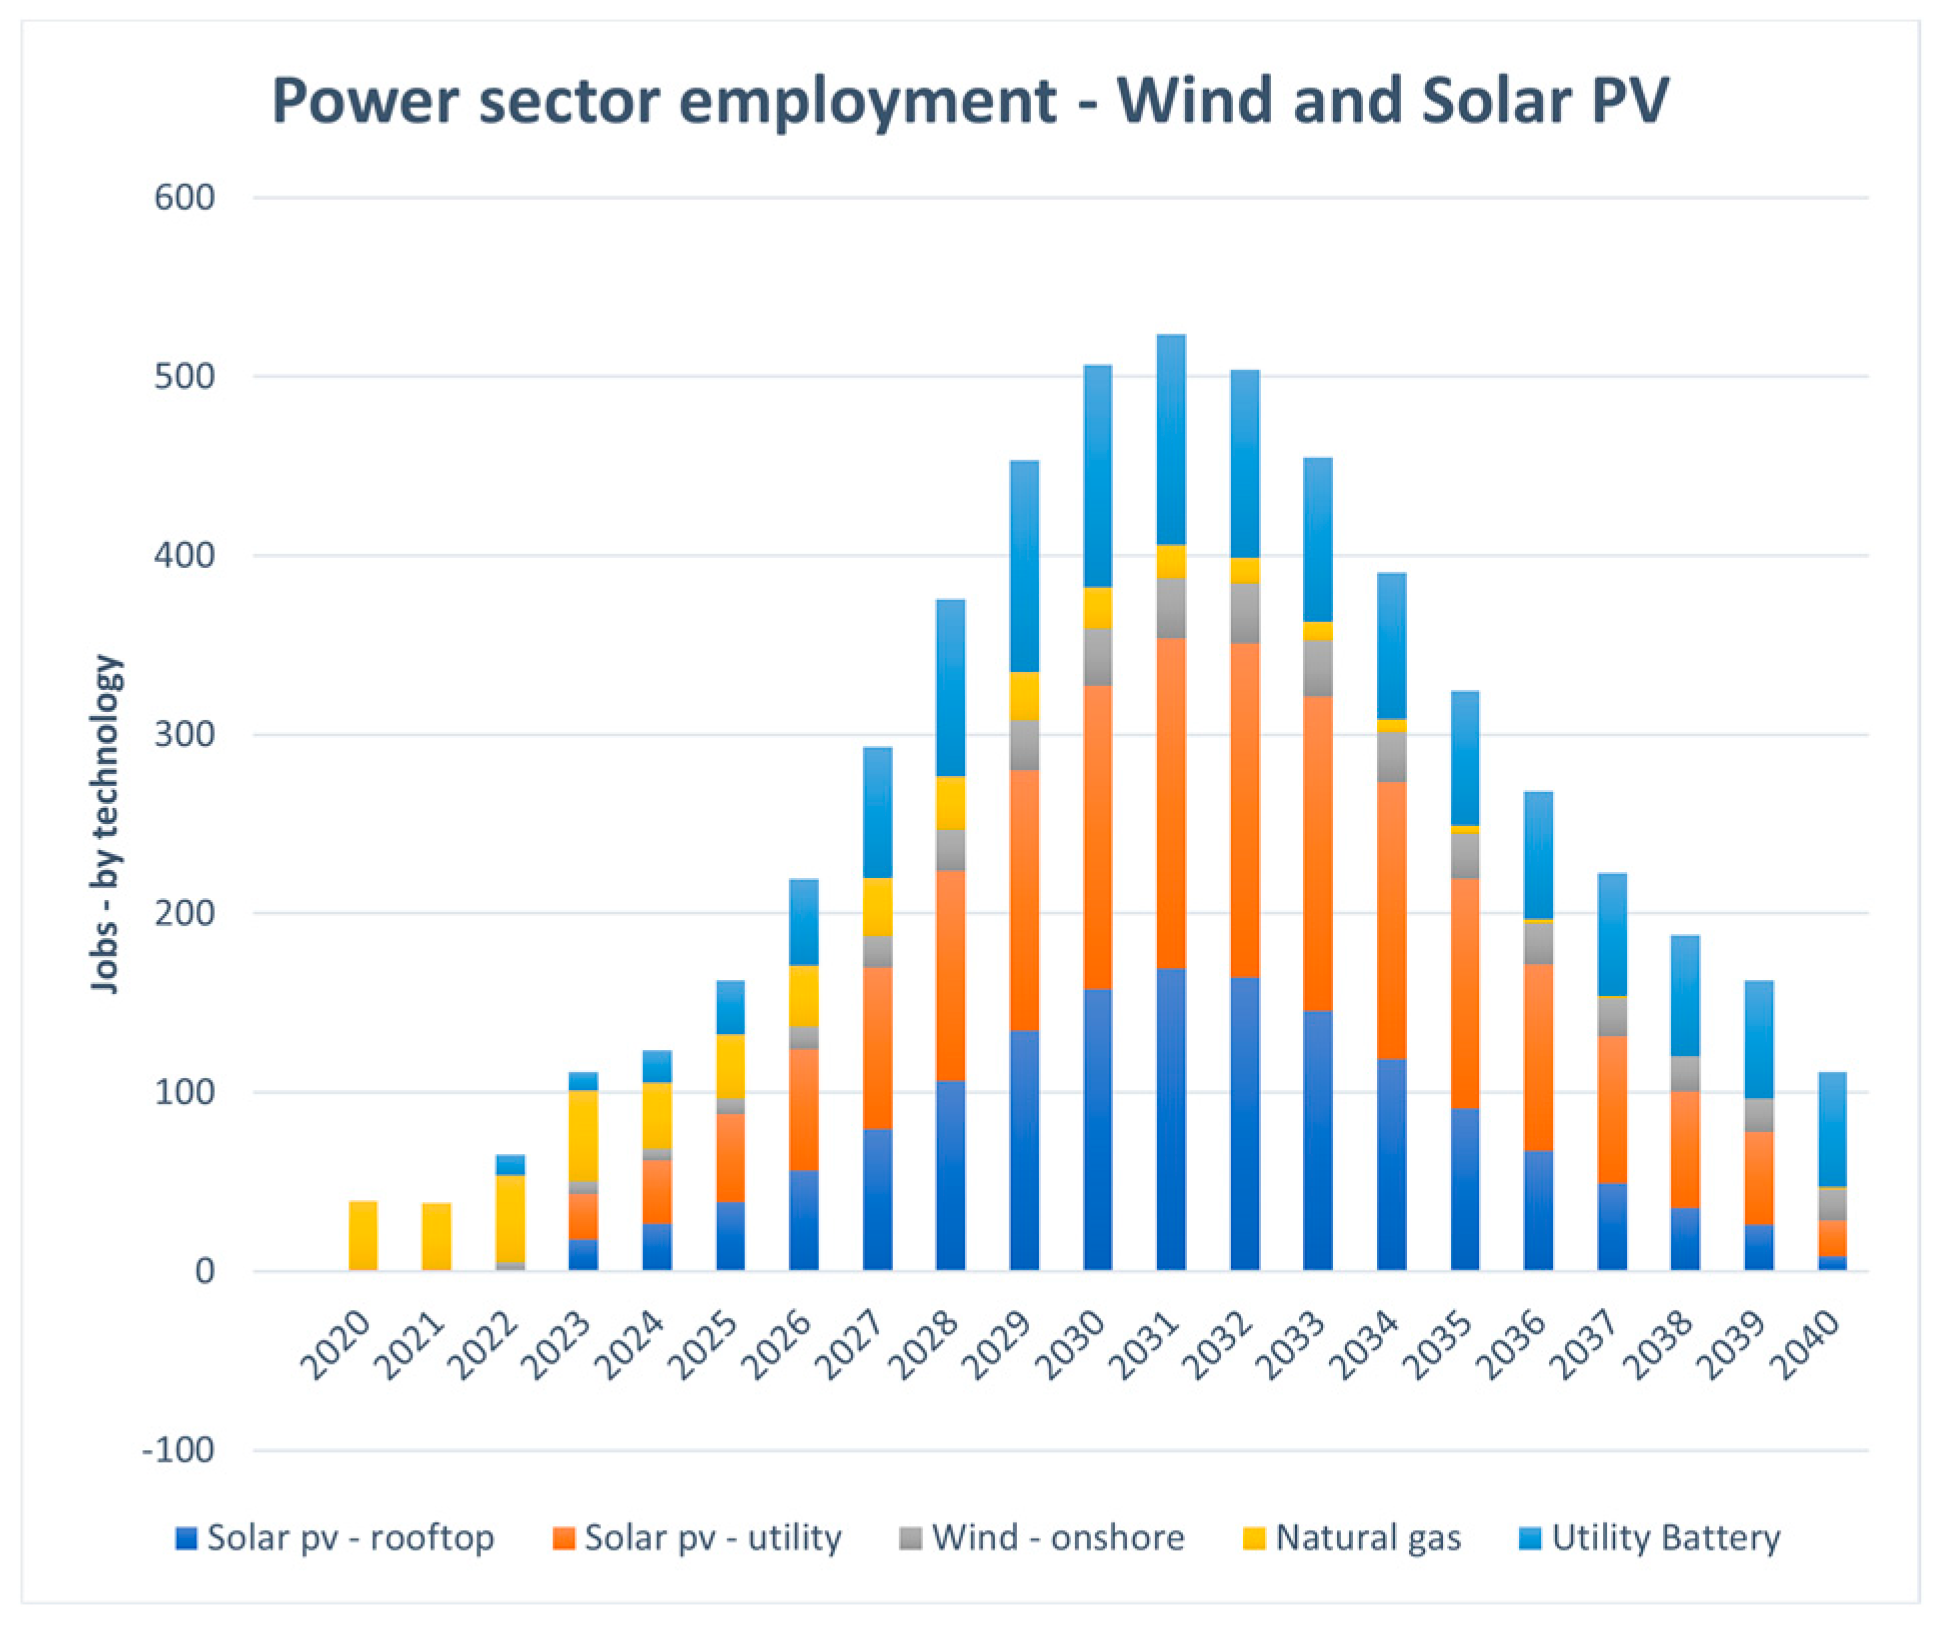
Job creation analyses were conducted for several scenarios including those without hydrogen storage and without hydrogen or CSP. All those scenarios show that solar PV will dominate job creation but necessarily job sustenance. The utility battery storage appears to have a significant portion of job sustenance, but overall, the technologies share similar portions of job needs of the entire electricity sector. Wind energy will be another large contributor to job creation for those scenarios. Also, all the scenarios follow a similar trend in showing a large increase in jobs until 2033, where it will peak and then slowly but slightly decrease and plateau.
Figure C2.
Wind and Solar PV Scenario Jobs by Technology.
Figure C2.
Wind and Solar PV Scenario Jobs by Technology.
Figure C3.
Wind and Solar PV Scenario Jobs by Function.
Figure C3.
Wind and Solar PV Scenario Jobs by Function.
Figure C4.
CSP Scenario Jobs by Technology.
Figure C4.
CSP Scenario Jobs by Technology.
Figure C5.
CSP Scenario Jobs by Function.
Figure C5.
CSP Scenario Jobs by Function.
References
- “Antilles/Greater Antilles and Lesser Antilles/Antilles Map | Mappr,” Jan. 23, 2021. Available online: Available online: https://www.mappr.co/thematic-maps/antilles/ (accessed on 28 April 2023).
- “Antigua and Barbuda - Country Profile - Nations Online Project.” Available online:. Available online: https://www.nationsonline.org/oneworld/antigua_barbuda.htm (accessed on 28 April 2023).
- “World Bank Climate Change Knowledge Portal.” Available online:. Available online: https://climateknowledgeportal.worldbank.org/ (accessed on 28 April 2023).
- “Average monthly hours of sunshine in Saint Philips (Antigua), Antigua & Barbuda.” Available online:. Available online: https://weather-and-climate.com/average-monthly-hours-Sunshine,saint-philips-antigua-ag,Antigua-Barbuda (accessed on 28 April 2023).
- “Antigua and Barbuda,” The World Factbook. Central Intelligence Agency, Apr. 26, 2023. Accessed: Apr. 28, 2023. [Online]. Available online: https://www.cia.gov/the-world-factbook/countries/antigua-and-barbuda/.
- “Antigua and Barbuda | Department of Economic and Social Affairs.” Available online:. Available online: https://sdgs.un.org/basic-page/antigua-and-barbuda-34110 (accessed on 30 April 2023).
- “2020 Energy Report Card | Antigua & Barbuda,” CCREEE. Accessed: Apr. 30, 2023. [Online]. Available online: https://www.ccreee.org/wp-content/uploads/2022/01/CCREEE-ERC-ANTIGUA-AND-BARBUDA-2020.pdf.
- “Island Energy Snapshots,” Energy.gov. Available online: https://www.energy.gov/eere/island-energy-snapshots (accessed on 30 April 2023).
- “National Energy Policy - Climate Change Laws of the World.” Available online:. Available online: https://www.climate-laws.org/document/national-energy-policy_aed3 (accessed on 30 April 2023).
- “Antigua and Barbuda Population and Housing Census 2011-2012 | GHDx.” Available online:. Available online: https://ghdx.healthdata.org/record/antigua-and-barbuda-population-and-housing-census-2011-2012 (accessed on 30 April 2023).
- “Electric Mobility Transition Assessment for Antigua and Barbuda.” Nov. 2018. Accessed: , 2023. [Online]. 25 May. Available online: https://www.environment.gov.ag/assets/uploads/attachments/5c6dd-logios-antigua-barbuda-ev-transition-deliverable-1.
- “EV Database,” EV Database. Available online: https://ev-database.org/cheatsheet/energy-consumption-electric-car (accessed on 26 May 2023).
- “Renewables.ninja.” Available online:. Available online: https://www.renewables.ninja/ (accessed on 30 April 2023).
- “Energy Snapshot | Antigua and Barbuda,” Energy Transition Initiative, 15. Accessed: Apr. 30, 2023. [Online]. 20 May. Available online: https://www.nrel.gov/docs/fy15osti/64115.pdf.
- T. Brown, J. T. Brown, J. Hörsch, and D. Schlachtberger, “PyPSA: Python for Power System Analysis,” J. Open Res. Softw., vol. 6, no. 1, p. 4, Jan. 2018. [CrossRef]
- “Production d’électricité par filière et coûts de production au pas horaire.” Available online:. Available online: https://opendata-martinique.edf.fr/explore/dataset/courbe-de-charge-de-la-production-delectricite-par-filiere/export/?refine.date_heure=2018&q.timerange.date_heure=date_heure:%5B2018-01-01T05:00:00Z+TO+2019-01-02T04:59:59Z%5D (accessed on 30 April 2023).
- “Antigua & Barbuda: Renewable Energy Roadmap.” Abu Dhabi, 2021. . Accessed: May 20, 2023. [Online]. Available online: https://www.irena.org/-/media/Files/IRENA/Agency/Publication/2021/March/IRENA_Antigua_Barbuda_RE_Roadmap_2021.pdf?rev=81fd5a4d071d4f8a857c9be2fde679d8.
- “Antigua and Barbuda First NDC (Updated submission) | UNFCCC.” Available online:. Available online: https://unfccc.int/documents/497048 (accessed on 28 April 2023).
- “Concentrated Solar Power Spain,” ContourGlobal. Available online: https://www.contourglobal.com/asset/concentrated-solar-power-spain (accessed on 30 April 2023).
- “Annual Sunshine in Spain - Current Results.” Available online:. Available online: https://www.currentresults.com/Weather/Spain/annual-days-of-sunshine.php (accessed on 30 April 2023).
- J. Prochnik, A. J. Prochnik, A. Shultz, H. Price, B. Kelly, and F. Morse, “Concentrating Solar Power and Long Duration Thermal Energy Storage Technologies,” Sep. 08, 2020. Accessed: Apr. 30, 2023. [Online]. Available online: https://static1.squarespace.com/static/5e3b69edfd4af10b189254b0/t/5f5810158a2845795441677f/1599606836884/Final+Sept+8+CSP+LDES.pdf.
- W. Cole, A. W. W. Cole, A. W. Frazier, and C. Augustine, “Cost Projections for Utility-Scale Battery Storage: 2021 Update,” Renew. Energy, 2021.
- C. Turchi, “Concentrating Solar Power (CSP) Overview,” NREL, Accessed: Apr. 28, 2023. [Online]. Available online: https://www.bia.gov/sites/default/files/dup/assets/as-ia/ieed/ieed/pdf/idc1-021596.pdf.
- M. Wilson, “Lazard’s Levelized Cost of Storage Analysis—Version 4.0,” LAZARD, Nov. 2019, Accessed: Apr. 28, 2023. [Online]. Available online: https://www.lazard.com/media/43hbgpqr/lazards-levelized-cost-of-storage-version-50-vf.pdf.
- K. Niedermeier, J. Flesch, L. Marocco, and Th. Wetzel, “Assessment of thermal energy storage options in a sodium-based CSP plant,” Appl. Therm. Eng., vol. 107, pp. 386–397, Aug. 2016. [CrossRef]
- Asian Development Bank, “Handbook on Battery Energy Storage System,” Asian Development Bank, Manila, Philippines, Dec. 2018. [CrossRef]
- “The Future of Hydrogen.” Jun. 2019. [Online]. Available online: https://iea.blob.core.windows.net/assets/9e3a3493-b9a6-4b7d-b499-7ca48e357561/The_Future_of_Hydrogen.pdf.
- “Capital Costs and Performance Characteristics for Utility Scale Power Generating Technologies”.
- “The Cost of Wind Energy.” Available online:. Available online: https://www.windenergy.org.nz/the-cost-of-wind-energy (accessed on 30 April 2023).
- “Capital costs of utility-scale solar PV in selected emerging economies – Charts – Data & Statistics,” IEA. Available online: https://www.iea.org/data-and-statistics/charts/capital-costs-of-utility-scale-solar-pv-in-selected-emerging-economies (accessed on 30 April 2023).
- “Renewable Energy Technologies: Cost Analysis Series | Concentrating Solar Power.” IRENA, Jun. 2012. Accessed: Apr. 30, 2023. [Online]. https://library.cap-az.com/documents/meetings/10-17-2013/3_Combined_Solar_CSP.pdf.
- “Agricultural land (% of land area) - Antigua and Barbuda,” World Bank Open Data. Available online: https://data.worldbank.org/indicator/AG.LND.AGRI.ZS?locations=AG (accessed on 26 May 2023).
- M. Bolinger and G. Bolinger, “Land Requirements for Utility-Scale PV: An Empirical Update on Power and Energy Density,” IEEE J. Photovolt. 2022. [CrossRef]
- “Just Transition - Climate Justice Alliance.” Available online:. Available online: https://climatejusticealliance.org/just-transition/ (accessed on 2 May 2023).
- Zimmer, C. Plinke, R. Brecha, and F. Fuller, “Towards a Just Transition of the Workplace: Baseline Analysis for the Electricity and Road Transport Sectors in Antigua and Barbuda,” Clim. Anal., Jun. 2021, Accessed: Apr. 30, 2023. [Online]. 2021. Available online: https://climateanalytics.org/publications/2021/towards-a-just-transition-of-the-workplace-baseline-analysis-for-the-electricity-and-road-transport-sectors-in-antigua-and-barbuda/.
- A. Hunter, M. M. Penev, E. P. Reznicek, J. Eichman, N. Rustagi, and S. F. Baldwin, “Techno-economic analysis of long-duration energy storage and flexible power generation technologies to support high-variable renewable energy grids,” Joule, vol. 5, no. 8, pp. 2077–2101, Aug. 2021. [CrossRef]
- M. Younas, S. Shafique, A. Hafeez, F. Javed, and F. Rehman, “An Overview of Hydrogen Production: Current Status, Potential, and Challenges,” Fuel, vol. 316, p. 123317, 22. [CrossRef]
- “Combustion Engine vs Gas Turbine - Ramp rate - Wärtsilä Energy,” Wartsila.com. Available online: https://www.wartsila.com/energy/learn-more/technical-comparisons/combustion-engine-vs-gas-turbine-ramp-rate (accessed on 30 April 2023).
- “LUCELEC 2022 Annual Report.” Accessed: May 02, 2023. [Online]. Available online: https://www.lucelec.com/sites/default/files/annual-reports/LUCELEC%202022%20Annual%20Report%20-%20Interactive.pdf.
- “Google Earth.” Available online:. Available online: https://earth.google.com/web/@17.12841423,-61.8466744,9.21549011a,1000.40976107d,30y,0h,0t,0r/data=Mi kKJwolCiExRy1ZVWZBS1dPRm8wRFF3cF9IVWFBSndhVEtvTlYwcUkgAQ (accessed on 30 April 2023).
- “Average, U.S. construction cost for onshore wind generation decreased by 27% since 2013.” Available online:. Available online: https://www.eia.gov/todayinenergy/detail.php?id=49176 (accessed on 30 April 2023).
- C. S. Turchi, J. Stekli, and P. C. Bueno, “11 - Concentrating solar power,” in Fundamentals and Applications of Supercritical Carbon Dioxide (sCO₂) Based Power Cycles, K. Brun, P. Friedman, and R. Dennis, Eds., Woodhead Publishing, 2017, pp. 269–292. [CrossRef]
- “2018 CARICOM REGIONAL ENERGY EFFICIENCY BUILDING CODE | ICC DIGITAL CODES.” Available online:. Available online: https://codes.iccsafe.org/content/CREEBC2018/effective-use-of-the-caricom-regional-energy-efficiency-building-code (accessed on 30 April 2023).
- M. T. Islam, N. Huda, A. B. Abdullah, and R. Saidur, “A comprehensive review of state-of-the-art concentrating solar power (CSP) technologies: Current status and research trends,” Renew. Sustain. Energy Rev., vol. 91, pp. 987–1018, Aug. 2018. [CrossRef]
- “Antigua and Barbuda,” CCREEE. Available online: https://www.ccreee.org/about-us/our-partners/antigua-and-barbuda/ (accessed on 28 April 2023).
- “Antigua and Barbuda | History, Geography, & Facts | Britannica.” Available online:. Available online: https://www.britannica.com/place/Antigua-and-Barbuda (accessed on 28 April 2023).
- “Antigua and Barbuda Map (Road) - Worldometer.” Available online:. Available online: https://www.worldometers.info/maps/antigua-and-barbuda-road-map/ (accessed on 28 April 2023).
- “Antigua and Barbuda Updated Nationally Determined Contribution.” UNFCCC, Sep. 2021. Accessed: Apr. 28, 2023. [Online]. Available online: https://unfccc.int/sites/default/files/NDC/2022-06/ATG%20-%20UNFCCC%20NDC%20-%202021-09-02%20-%20Final.pdf.
- “Basic economics of power generation, transmission and distribution | EME 801: Energy Markets, Policy, and Regulation.” Available online:. Available online: https://www.e-education.psu.edu/eme801/node/530 (accessed on 30 April 2023).
- J. Rutovitz, E. Dominish, and J. Downes, “Calculating Global Energy Sector Jobs | 2015 Methodology Update.” Institute for Sustainable Futures, Aug. 2015. Accessed: Apr. 30, 2023. [Online]. Available online: https://opus.lib.uts.edu.au/bitstream/10453/43718/1/Rutovitzetal2015Calculatingglobalenergysectorjobsmethodology.pdf.
- “Capital costs of wind in selected emerging economies – Charts – Data & Statistics,” IEA. Available online: https://www.iea.org/data-and-statistics/charts/capital-costs-of-wind-in-selected-emerging-economies (accessed on 30 April 2023).
- “Capital Recovery FactorBack ButtonSearch IconFilter Icon.” Available online:. Available online: https://www.homerenergy.com/products/pro/docs/3.11/capital_recovery_factor.html (accessed on 30 April 2023).
- “Concentrating Solar-Thermal Power,” Energy.gov. Available online: https://www.energy.gov/eere/solar/concentrating-solar-thermal-power (accessed on 30 April 2023).
- “Environmental Protection and Management Act 10/2019 - Climate Change Laws of the World.” Available online:. Available online: https://www.climate-laws.org/document/environmental-protection-and-management-act-10-2019_d4bc (accessed on 30 April 2023).
- “Google Maps,” Google Maps. Available online: https://www.google.com/maps/place/St+John's,+Antigua+and+Barbuda/@17.1255328,-61.8551946,15z/data=!3m1!4b1!4m14!1m7!3m6!1s0x8c124f03ed8e886d:0xf57526a1880739d4!2sRedonda+Island!8m2!3d16.938416!4d-62.3455148!16zL20vMDNfYm4y!3m5!1s0x8c12924beb8e1ba5:0x7c46122f63db374f!8m2!3d17.1274104!4d-61.846772!16zL20vMDc0MTE (accessed on 28 April 2023).
- “How much electricity does an electric car use? | EVBox.” Available online:. Available online: https://evbox.com/en/ev-home-charger-electricity-usage (accessed on 25 May 2023).
- M. Ram, J. C. Osorio-Aravena, A. Aghahosseini, D. Bogdanov, and C. Breyer, “Job creation during a climate compliant global energy transition across the power, heat, transport, and desalination sectors by 2050,” Energy, vol. 238, p. 121690, Jan. 2022. [CrossRef]
- S. Ong, C. Campbell, P. Denholm, R. Margolis, and G. Heath, “Land-Use Requirements for Solar Power Plants in the United States,” NREL/TP-6A20-56290, 1086349, Jun. 2013. [CrossRef]
- C. G. Heaps, “LEAP: The Low Emissions Analysis Platform.” Stockholm Environment Institute, Somerville, MA, USA, 2022. Accessed: Apr. 30, 2023. [Online]. Available online: https://leap.sei.org/.
- “Medium Term Development Strategy 2016-2020 - Climate Change Laws of the World.” Available online:. Available online: https://www.climate-laws.org/document/medium-term-development-strategy-2016-2020_da56 (accessed on 30 April 2023).
- “NEP_AntiguaBarbuda.pdf.” Available online:. Available online: https://www.ccreee.org/wp-content/uploads/2020/06/NEP_AntiguaBarbuda.pdf (accessed on 28 April 2023).
- “Population of Caribbean (2023) - Worldometer.” Available online:. Available online: https://www.worldometers.info/world-population/caribbean-population/ (accessed on 30 April 2023).
- “POWER | Data Access Viewer.” Available online:. Available online: https://power.larc.nasa.gov/data-access-viewer/ (accessed on 30 April 2023).
- “Renewable Energy Act - Climate Change Laws of the World.” Available online:. Available online: https://www.climate-laws.org/document/renewable-energy-act_9131 (accessed on 30 April 2023).
- D. Slanger, “Run on Less with Hydrogen Fuel Cells,” RMI, Oct. 02, 2019. Available online: https://rmi.org/run-on-less-with-hydrogen-fuel-cells/ (accessed on 30 April 2023).
- “Solar PV facility screening study for public and educational facilities on Antigua and Barbuda.” Jan. 30, 2018. Accessed: , 2023. [Online]. 26 May. Available online: https://www.environment.gov.ag/assets/uploads/attachments/1ad1e-antigua-pv-buillding-report-30jan2018.pdf.
- “Stillwater Triple Hybrid Plant.” Available online:. Available online: https://www.enelgreenpower.com/our-projects/operating/stillwater-hybrid-plant (accessed on 30 April 2023).
- “The cost of Concentrated Solar Power fell by 47% between 2010 and 2019 | REVE News of the wind sector in Spain and in the world,” Jul. 29, 2020. Available online: https://www.evwind.es/2020/07/29/the-cost-of-concentrated-solar-power-fell-by-47-between-2010-and-2019/76120 (accessed on 30 April 2023).
- “U.S. Relations With Antigua and Barbuda,” United States Department of State. Available online: https://www.state.gov/u-s-relations-with-antigua-and-barbuda/ (accessed on 28 April 2023).
- “U.S. retail electricity prices 2021,” Statista. Available online: https://www.statista.com/statistics/183700/us-average-retail-electricity-price-since-1990/ (accessed on 30 April 2023).
Notes
| 1 |
Based on IRENA [ 17] but with ~35% EVs by 2035, a somewhat more conservative estimate on total fleet penetration than used in Ref. [ 17]. |
|
Disclaimer/Publisher’s Note: The statements, opinions and data contained in all publications are solely those of the individual author(s) and contributor(s) and not of MDPI and/or the editor(s). MDPI and/or the editor(s) disclaim responsibility for any injury to people or property resulting from any ideas, methods, instructions or products referred to in the content. |
© 2023 by the authors. Licensee MDPI, Basel, Switzerland. This article is an open access article distributed under the terms and conditions of the Creative Commons Attribution (CC BY) license (http://creativecommons.org/licenses/by/4.0/).
