Submitted:
22 June 2023
Posted:
26 June 2023
You are already at the latest version
Abstract
Keywords:
1. Introduction
2. Materials and Methods
Statistical analysis
Spatial interpolation with ordinary Kriging:
3. Results
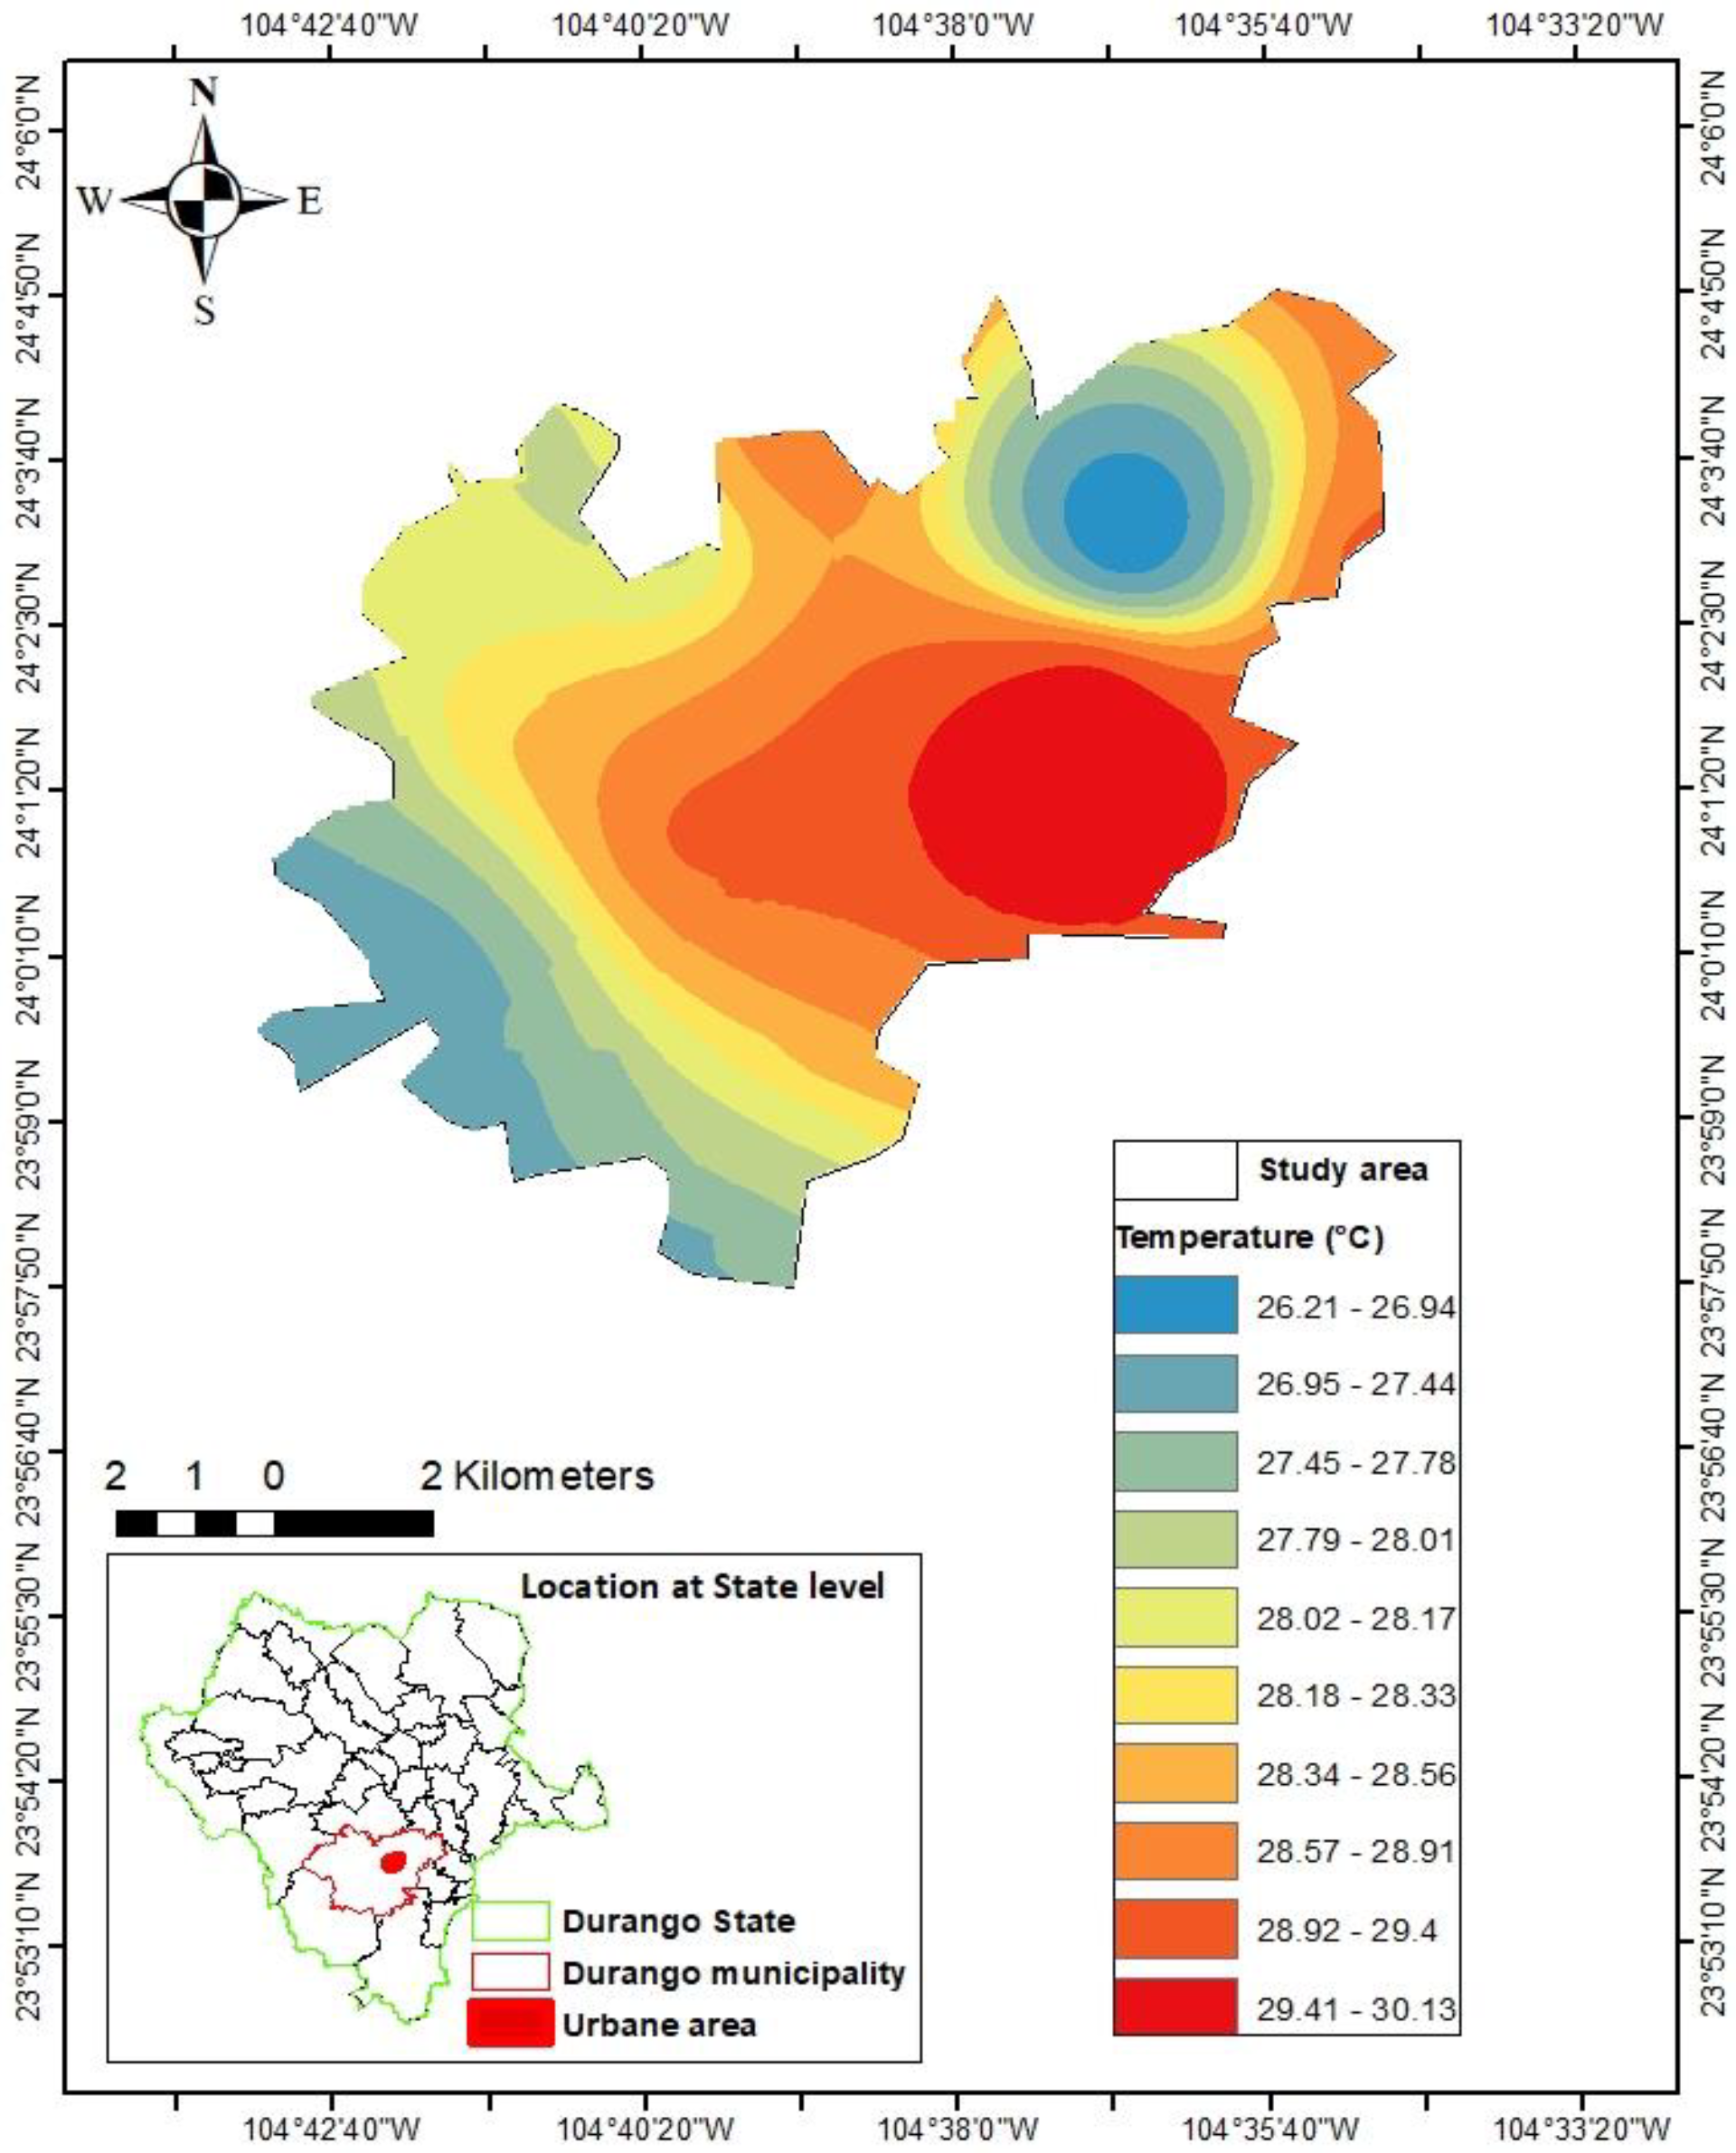
3.1. Temperature interpolation model
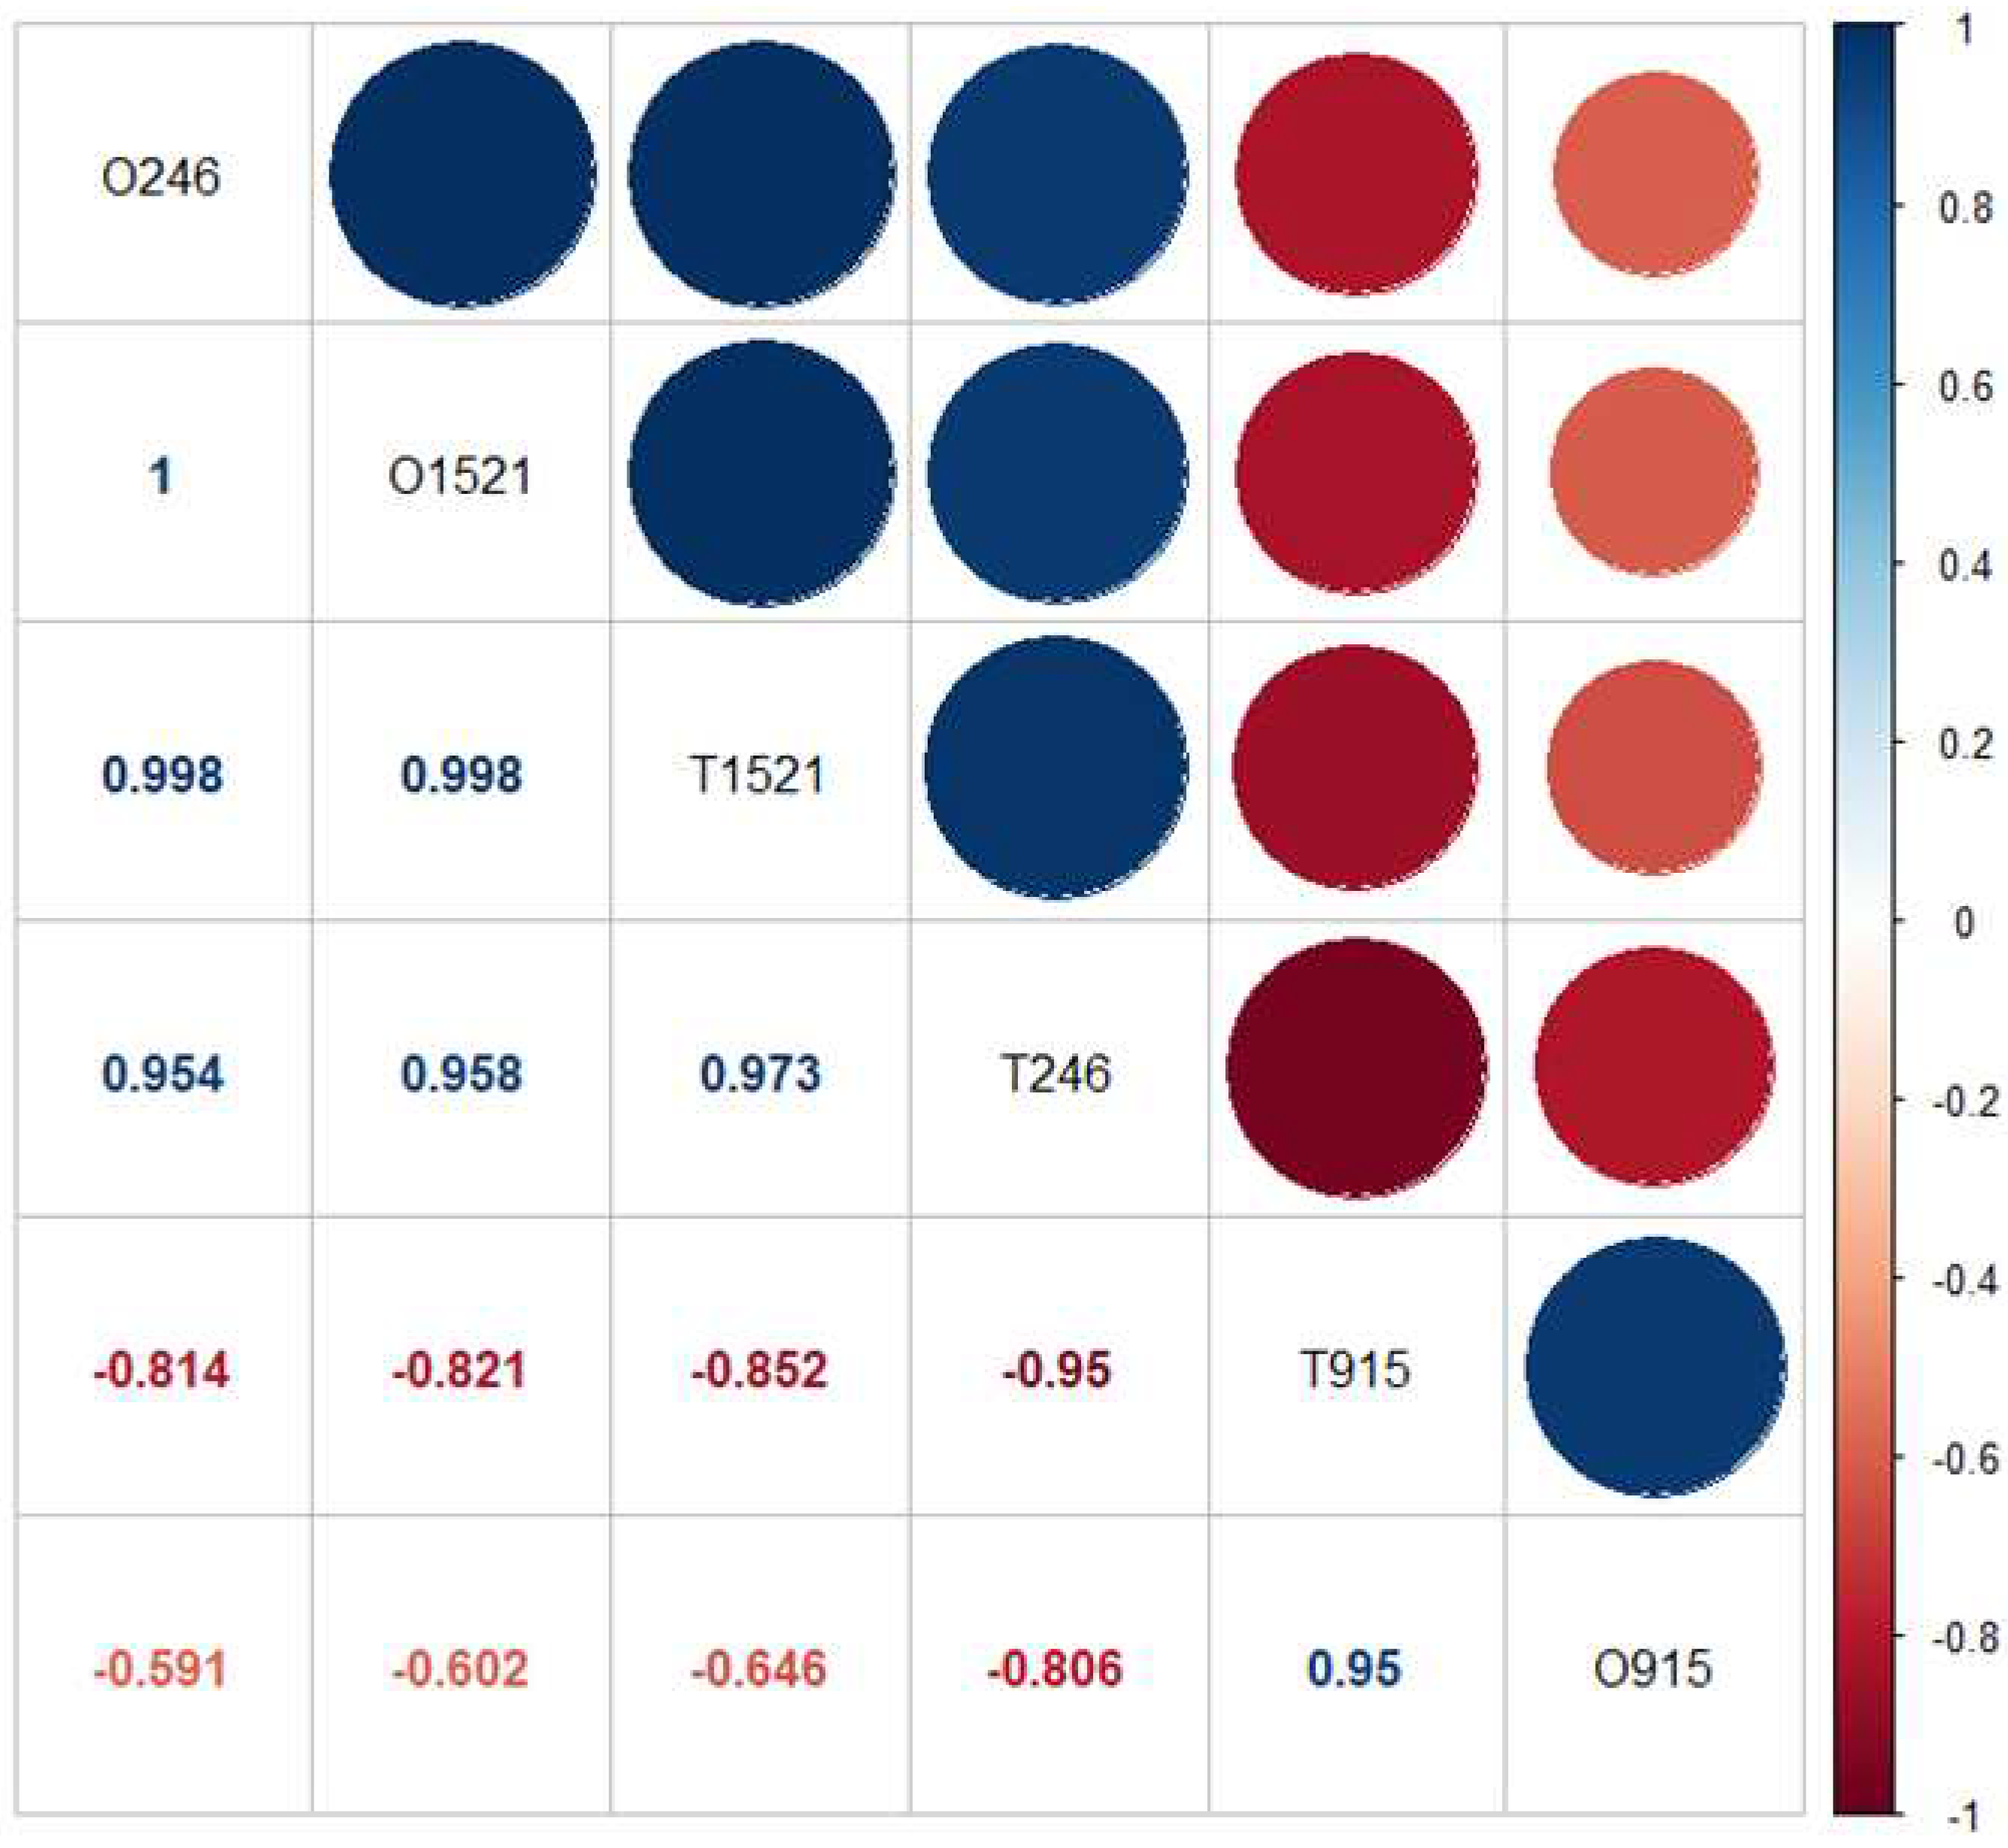
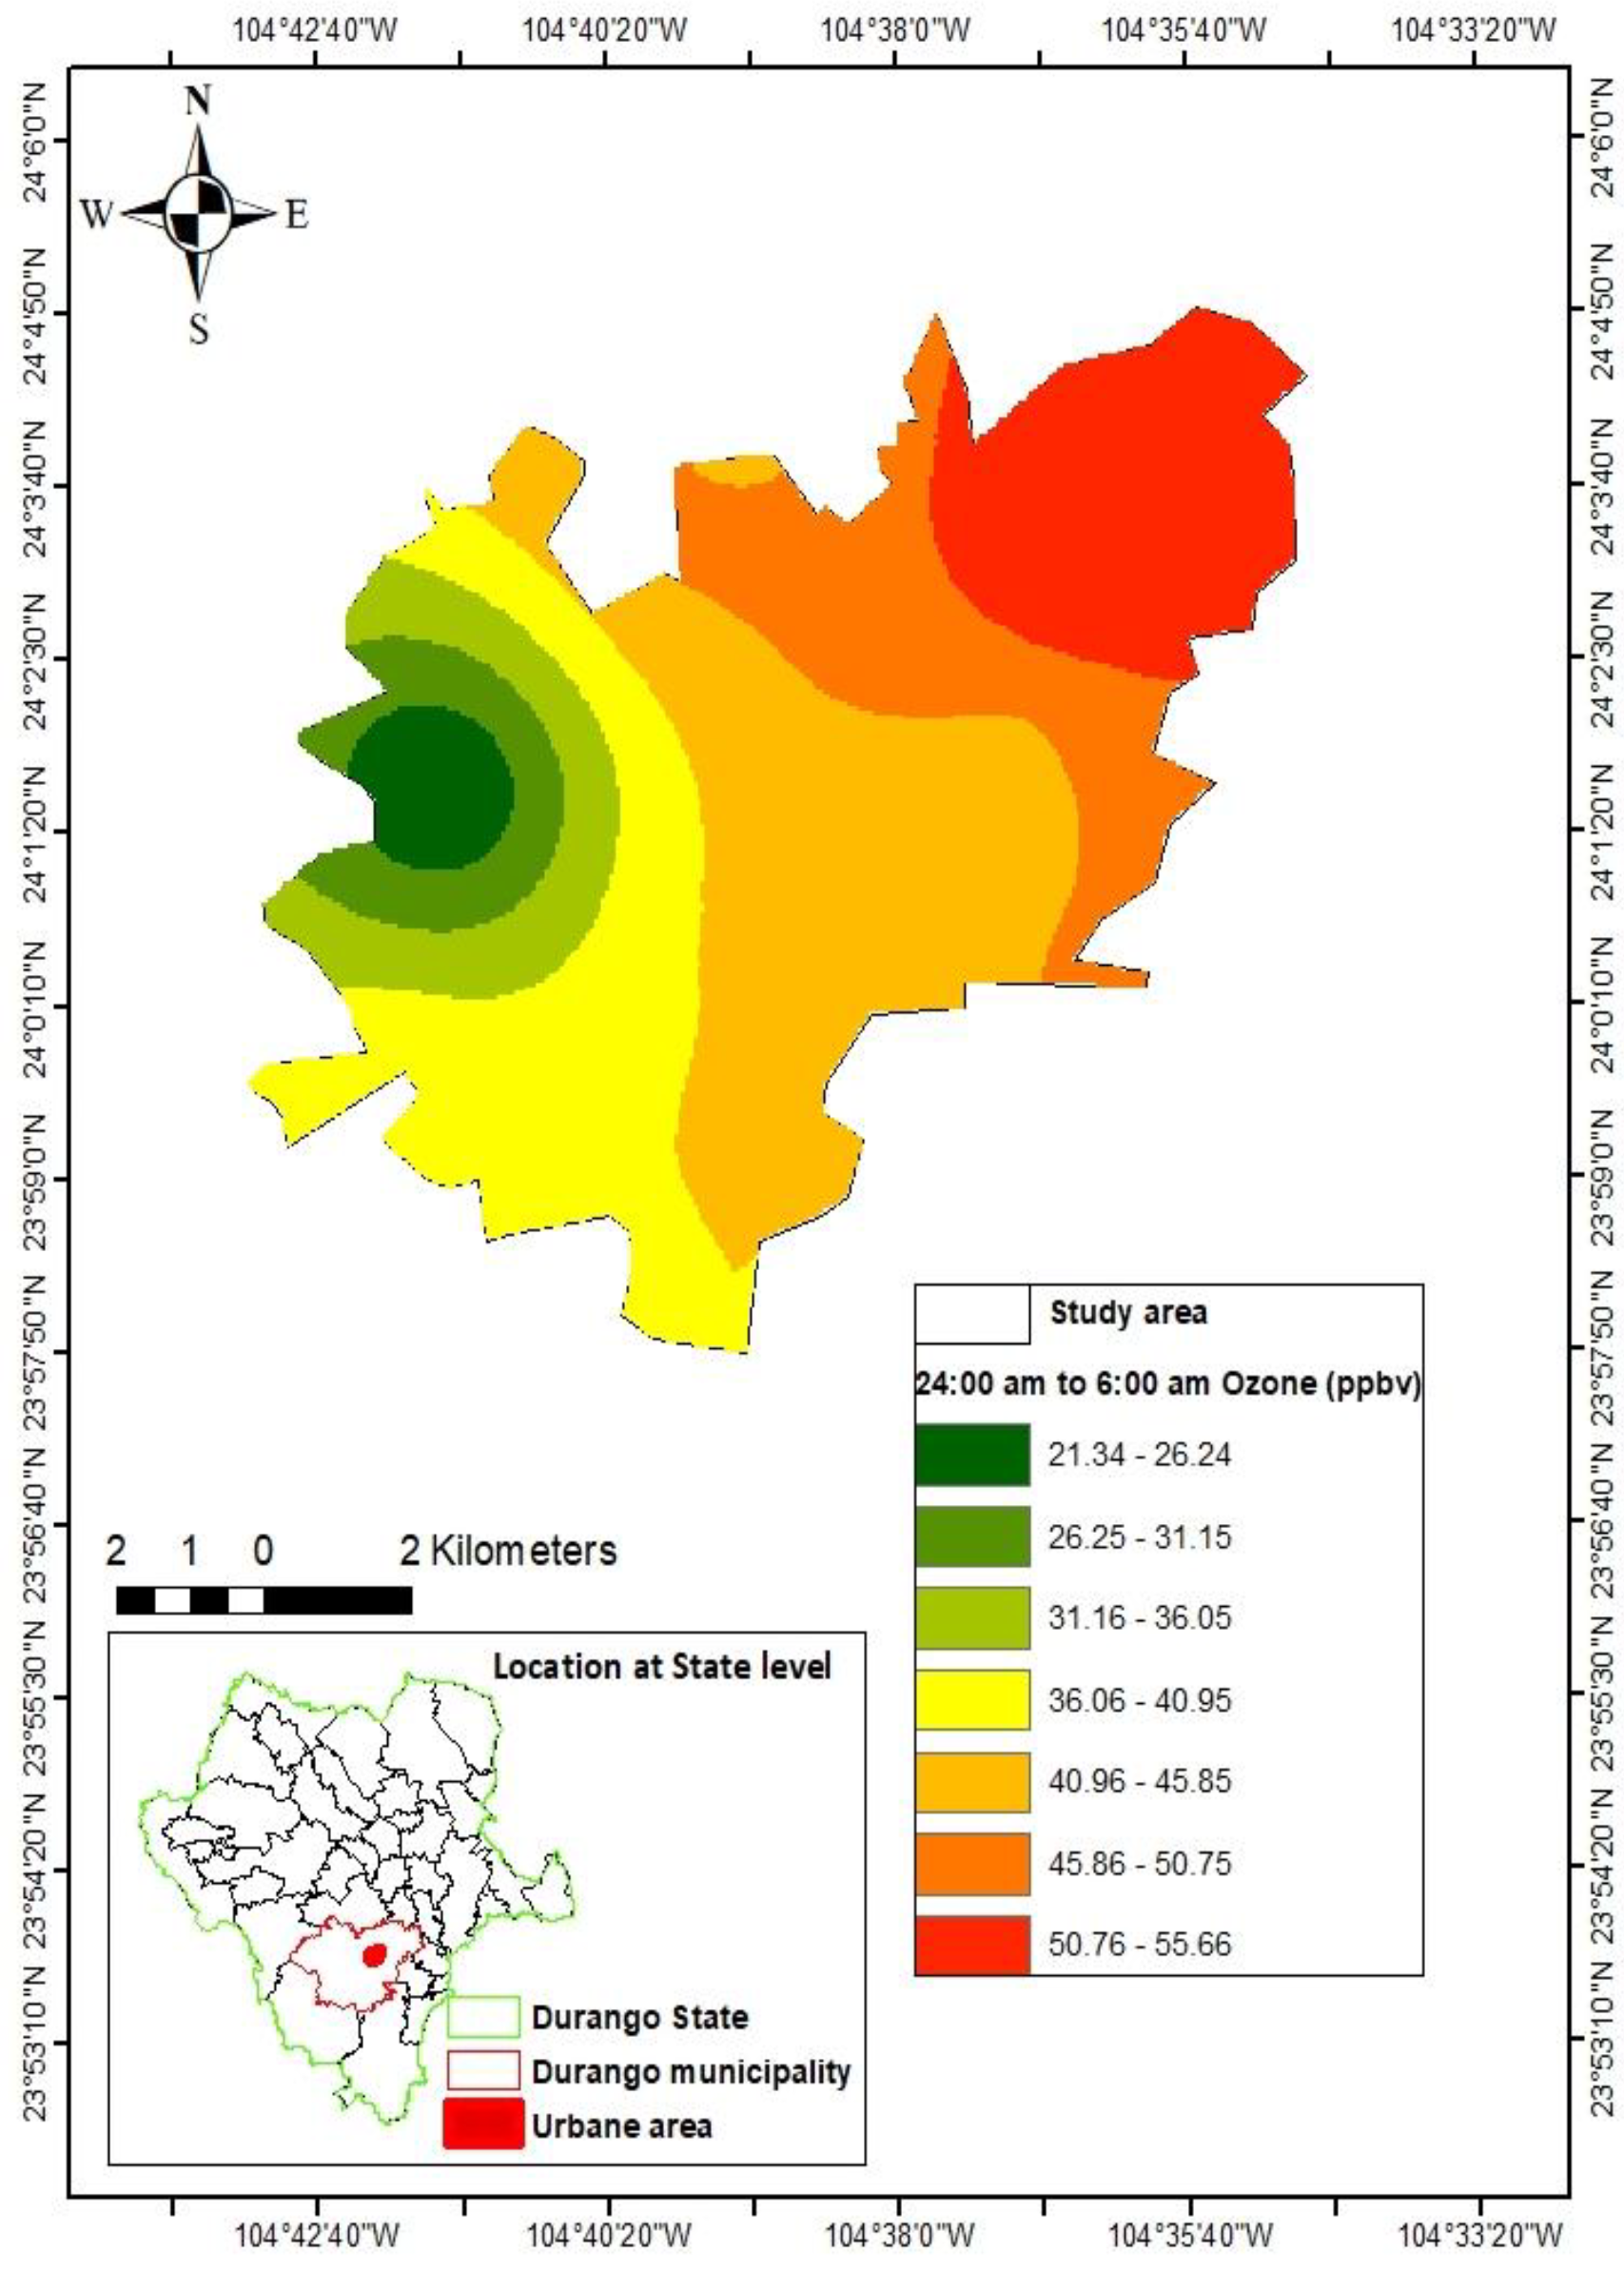
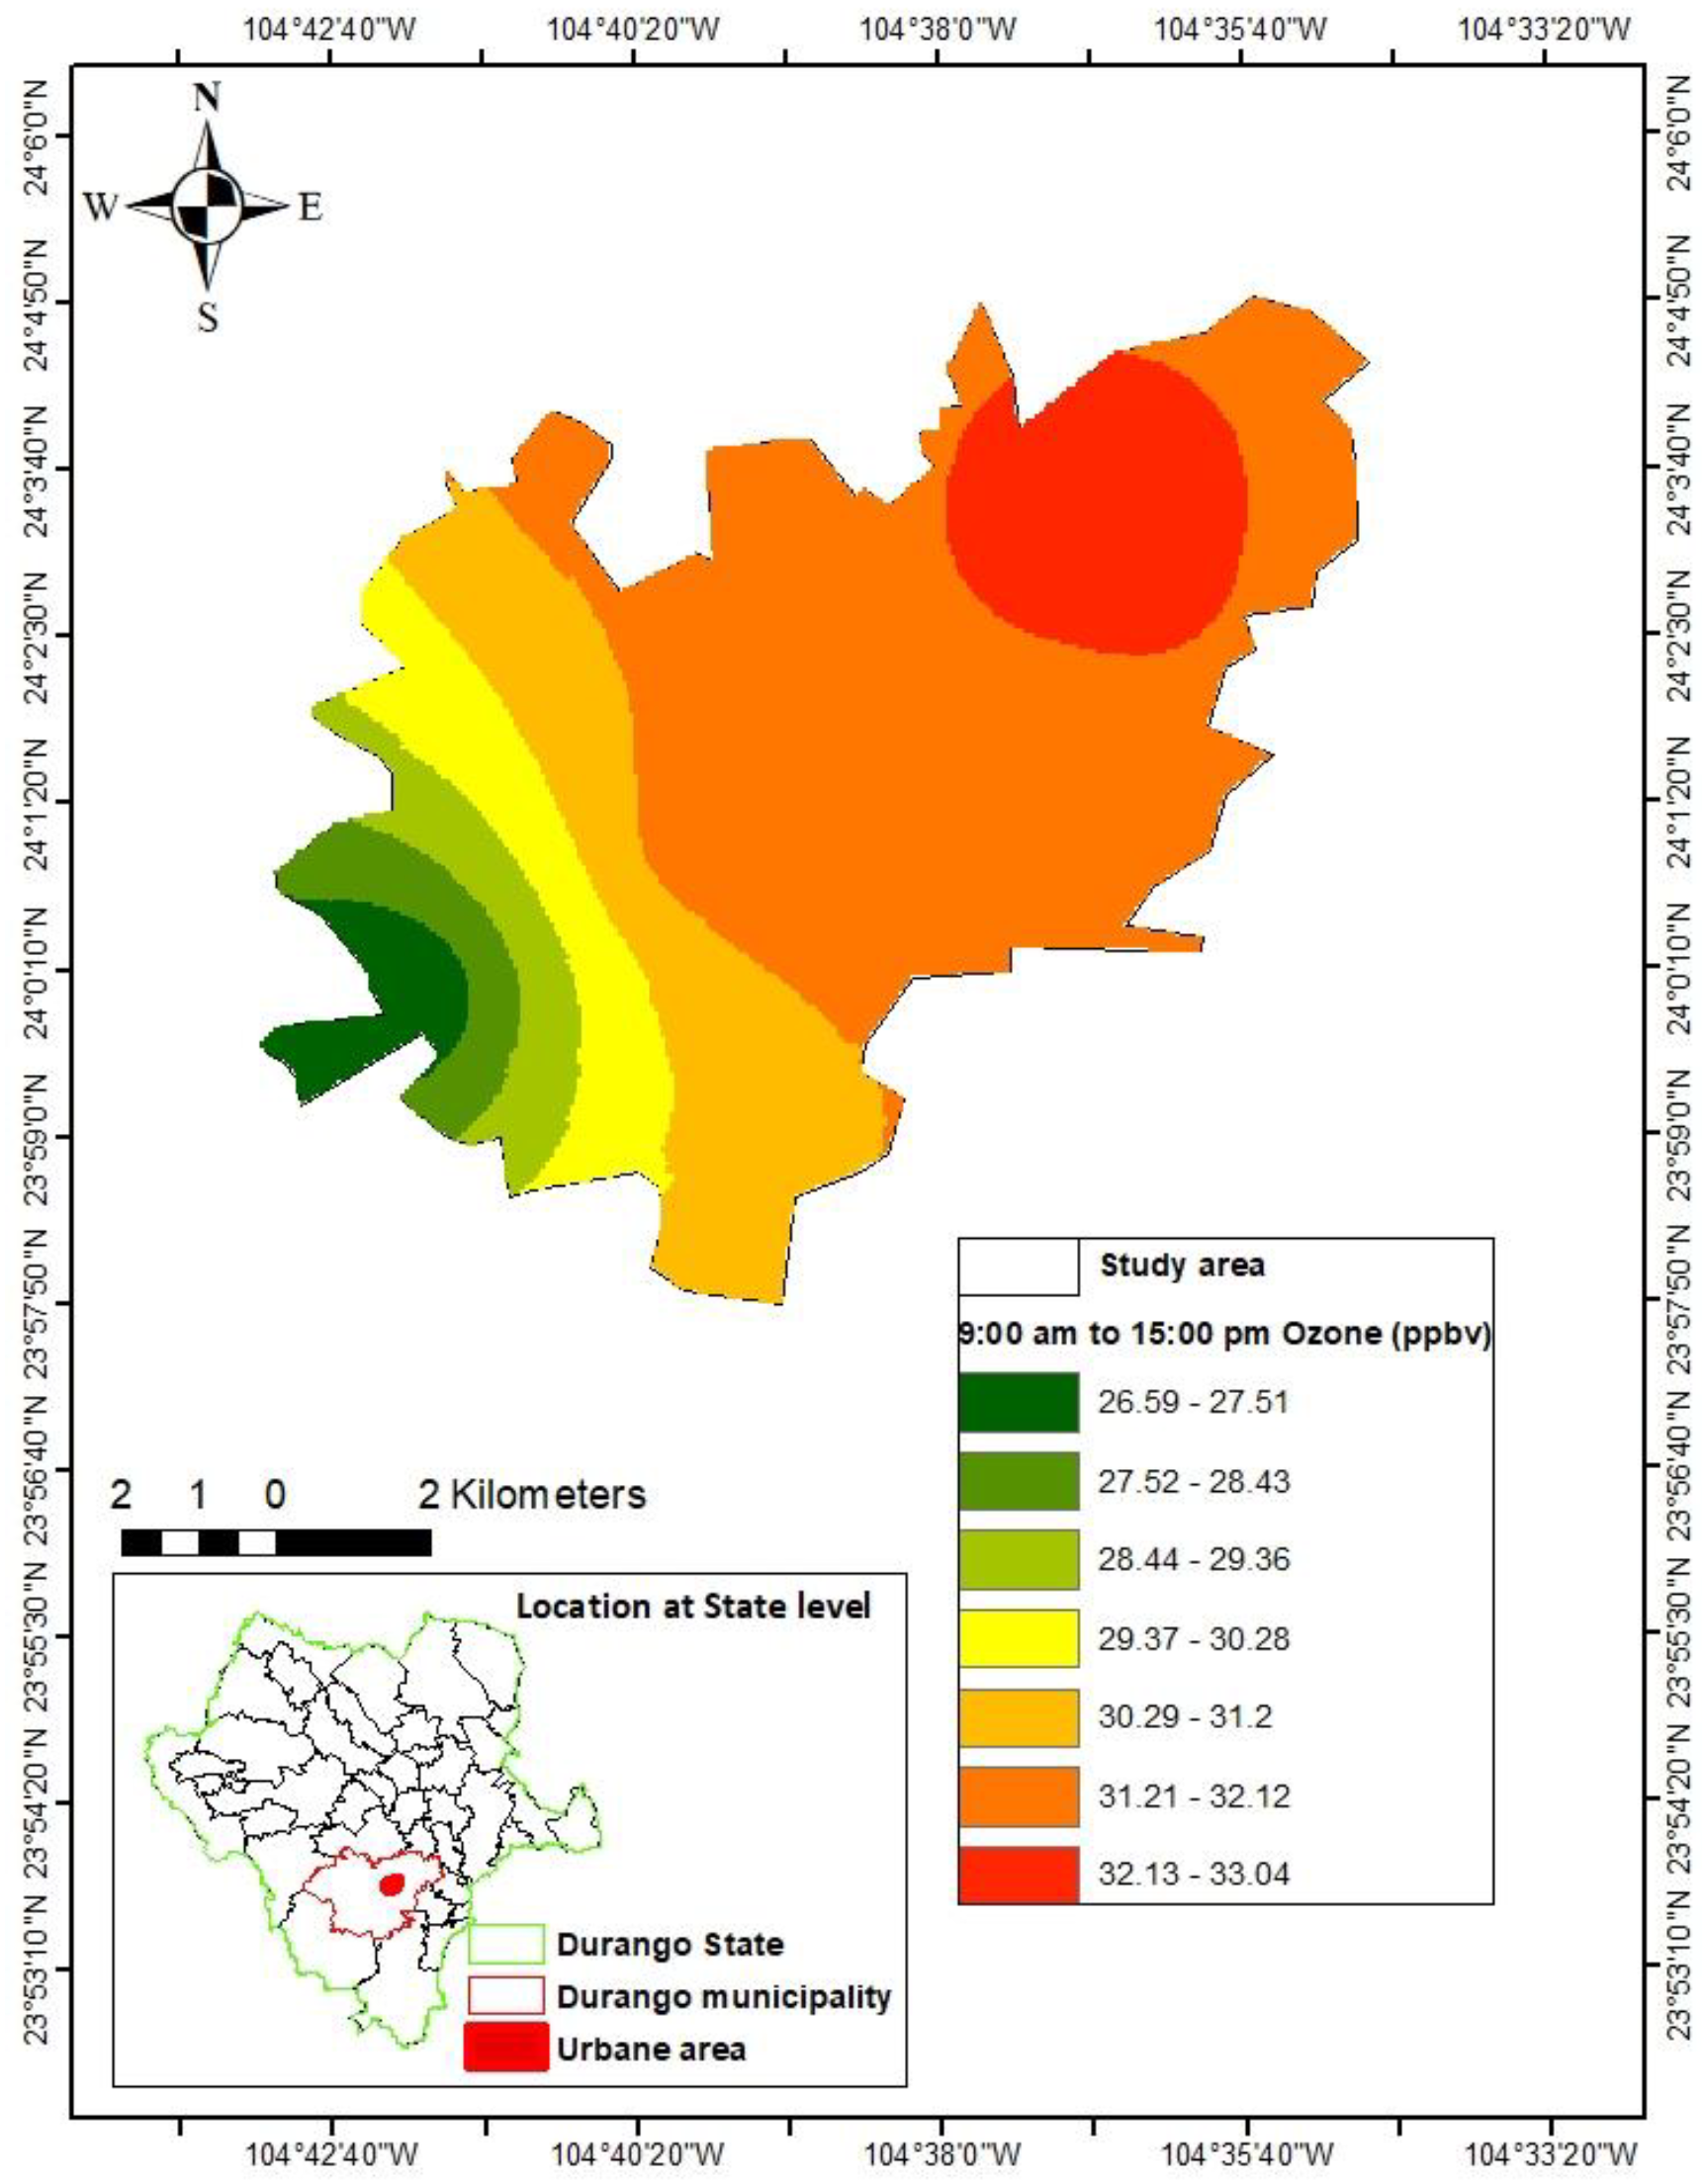
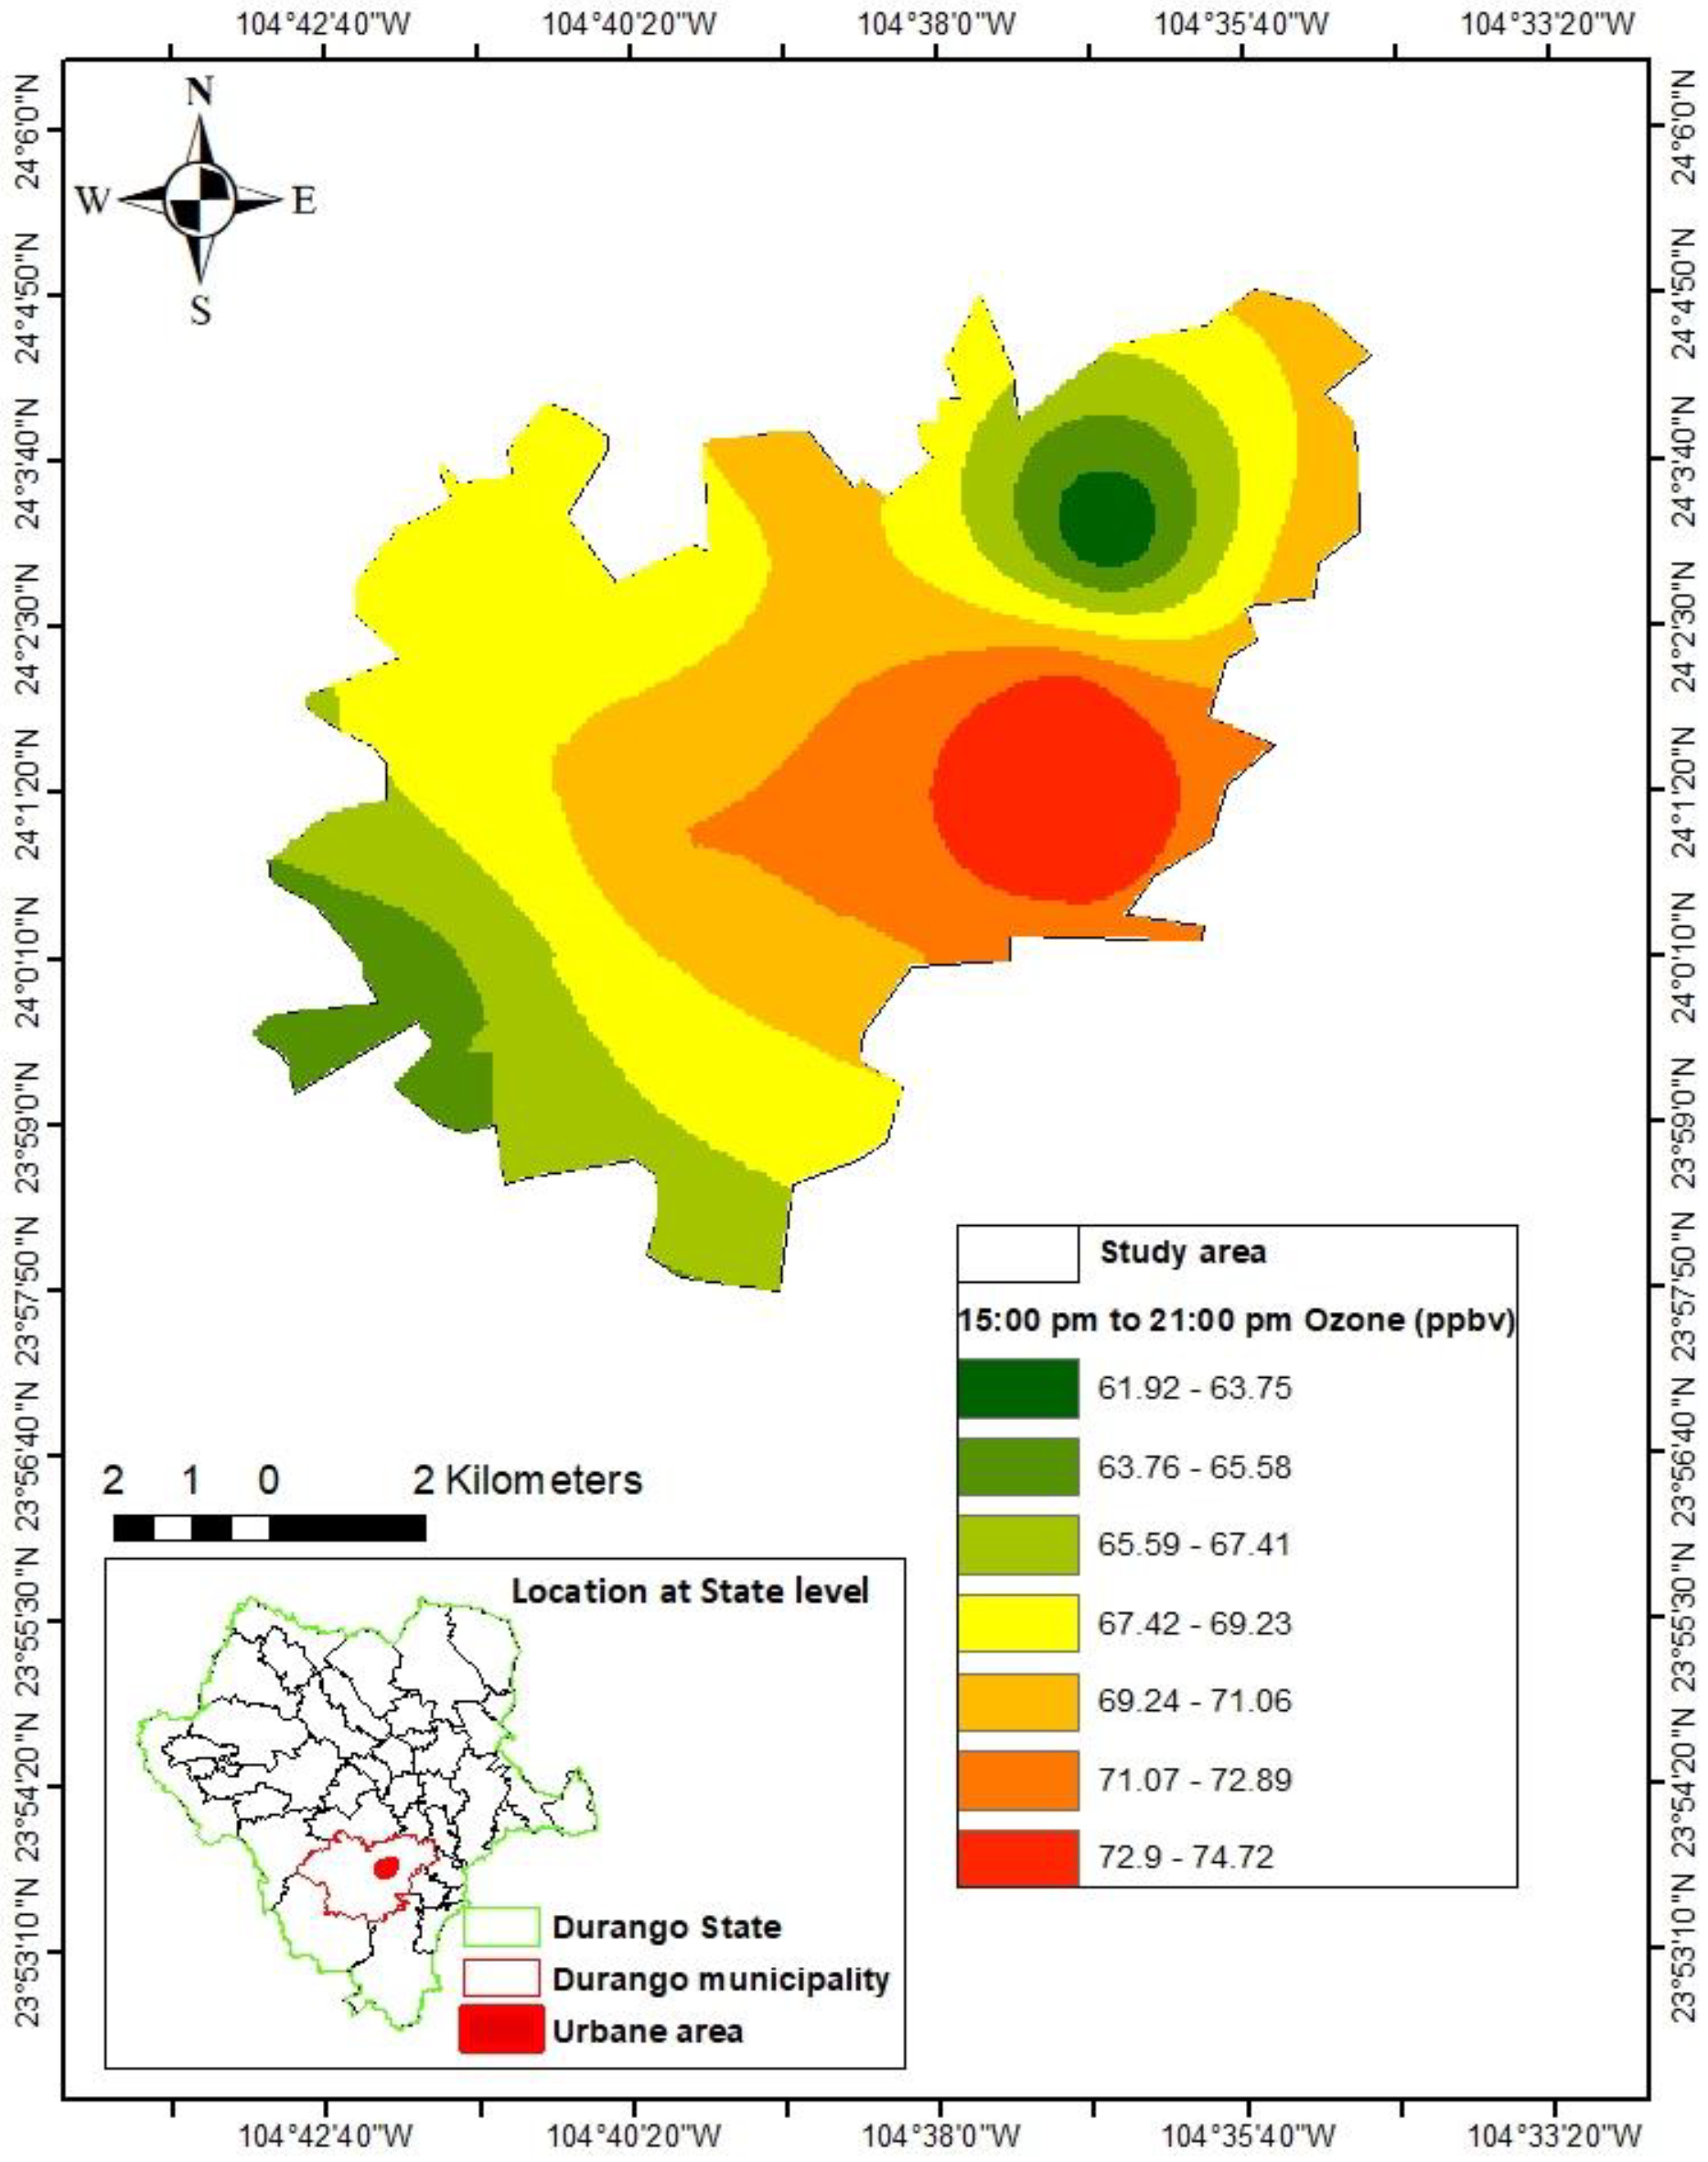
3.2. Prediction of ozone concentrations
| Hours (hrs) |
Model | r | Standard residual error | P-Value | R2 | RMSE | |
| 24:00 a 06:00 (O246; T246) | y = -83.658 + 6.787x | 0.95 | 4.83 | 0.001 | 0.91 | 2.78 | |
| 09:00 a 15:00(O915; T915) | y = -69.223 + 5.043x | 0.95 | 10.60 | 0.202 | 0.90 | 6.11 | |
| 15:00 a 21:00(O1521; T1521) | y = -19.329 + 3.066x | 0.99 | 0.08 | 0.001 | 0.99 | 0.56 |
4. Discussion
5. Conclusions
Author Contributions
Funding
Data Availability Statement
Acknowledgments
Conflicts of Interest
References
- Organization, W.H. Ambient Air Quality Databaase WHO 2023. Available online: https://www.who.int/publications/m/item/who-ambient-air-quality-database-(update-2023) (accessed on 05/19).
- Brunekreef, B.; Holgate, S.T.J.T.l. Air pollution and health. The lancet 2002, 360, 1233–1242. [Google Scholar] [CrossRef] [PubMed]
- Atkinson, R.J.A.e. Atmospheric chemistry of VOCs and NOx. Atmospheric environment 2000, 34, 2063–2101. [Google Scholar] [CrossRef]
- Butler, T.; Lupascu, A.; Nalam, A. Attribution of ground-level ozone to anthropogenic and natural sources of nitrogen oxides and reactive carbon in a global chemical transport model. Atmospheric Chemistry and Physics 2020, 20, 10707–10731. [Google Scholar] [CrossRef]
- Galloway, J.N.; Townsend, A.R.; Erisman, J.W.; Bekunda, M.; Cai, Z.; Freney, J.R.; Martinelli, L.A.; Seitzinger, S.P.; Sutton, M.A. Transformation of the nitrogen cycle: recent trends, questions, and potential solutions. Science 2008, 320, 889–892. [Google Scholar] [CrossRef]
- Monks, P.S.; Archibald, A.; Colette, A.; Cooper, O.; Coyle, M.; Derwent, R.; Fowler, D.; Granier, C.; Law, K.S.; Mills, G. Tropospheric ozone and its precursors from the urban to the global scale from air quality to short-lived climate forcer. Atmospheric Chemistry and Physics 2015, 15, 8889–8973. [Google Scholar] [CrossRef]
- Di, Q.; Rowland, S.; Koutrakis, P.; Schwartz, J.J.J.o.t.A.; Association, W.M. A hybrid model for spatially and temporally resolved ozone exposures in the continental United States. Journal of the Air & Waste Management Association 2017, 67, 39–52. [Google Scholar] [CrossRef]
- EPA, E.P.A. Greenhouse Gas Inventory Data Explorer. 2023. Available online: https://cfpub.epa.gov/ghgdata/inventoryexplorer/#allsectors/allsectors/allgas/gas/current (accessed on 05/19/2023).
- Lu, X.; Ye, X.; Zhou, M.; Zhao, Y.; Weng, H.; Kong, H.; Li, K.; Gao, M.; Zheng, B.; Lin, J. The underappreciated role of agricultural soil nitrogen oxide emissions in ozone pollution regulation in North China. Nature communications 2021, 12, 5021. [Google Scholar] [CrossRef]
- Zhan, Y.; Luo, Y.; Deng, X.; Grieneisen, M.L.; Zhang, M.; Di, B. Spatiotemporal prediction of daily ambient ozone levels across China using random forest for human exposure assessment. Environmental Pollution 2018, 233, 464–473. [Google Scholar] [CrossRef]
- Han, H.; Liu, J.; Shu, L.; Wang, T.; Yuan, H. Local and synoptic meteorological influences on daily variability in summertime surface ozone in eastern China. Atmospheric Chemistry and Physics 2020, 20, 203–222. [Google Scholar] [CrossRef]
- Roelofs, G.J.; Lelieveld, J.; van Dorland, R.J.J.o.G.R.A. A three-dimensional chemistry/general circulation model simulation of anthropogenically derived ozone in the troposphere and its radiative climate forcing. Journal of Geophysical Research: Atmospheres 1997, 102, 23389–23401. [Google Scholar] [CrossRef]
- Echávez, K.; Pastran, Y.; Polo, Á.J.R.A.A. Aire y suelo. estimación del co2 emitido y capturado en la sede sabanas y el campus deportivo de la universidad popular del cesar. 2015, 6.
- Zhang, Y.; Cooper, O.R.; Gaudel, A.; Thompson, A.M.; Nédélec, P.; Ogino, S.-Y.; West, J.J. Tropospheric ozone change from 1980 to 2010 dominated by equatorward redistribution of emissions. Nature Geoscience 2016, 9, 875–879. [Google Scholar] [CrossRef] [PubMed]
- Butler, T.; Lupascu, A.; Nalam, A. Attribution of ground-level ozone to anthropogenic and natural sources of nitrogen oxides and reactive carbon in a global chemical transport model. Atmospheric Chemistry and Physics 2020, 20, 10707–10731. [Google Scholar] [CrossRef]
- Gong, C. and H. Liao, A typical weather pattern for ozone pollution events in North China. Atmospheric Chemistry and Physics 2019, 19, 13725–13740. [Google Scholar] [CrossRef]
- Jumin, E.; Zaini, N.; Ahmed, A.N.; Abdullah, S.; Ismail, M.; Sherif, M.; Sefelnasr, A.; El-Shafie, A. Machine learning versus linear regression modelling approach for accurate ozone concentrations prediction. Engineering Applications of Computational Fluid Mechanics 2020, 14, 713–725. [Google Scholar] [CrossRef]
- Otero, N.; Sillmann, J.; Mar, K.A.; Rust, H.W.; Solberg, S.; Andersson, C.; Engardt, M.; Bergström, R.; Bessagnet, B.; Colette, A. A multi-model comparison of meteorological drivers of surface ozone over Europe. Atmospheric Chemistry and Physics 2018, 18, 12269–12288. [Google Scholar] [CrossRef]
- Zhan, Y.; Luo, Y.; Deng, X.; Grieneisen, M.L.; Zhang, M.; Di, B. Spatiotemporal prediction of daily ambient ozone levels across China using random forest for human exposure assessment. Environmental Pollution 2018, 233, 464–473. [Google Scholar] [CrossRef]
- Beristain-Montiel, E.; Gavilán-García, A.; Maldonado-Cabrera, S.C. Were biogenic volatile organic compounds mainly responsible for ozone pollution during the COVID-19 lockdown In Mexico City? Journal of the Mexican Chemical Society 2023, 67, 12–23. [Google Scholar] [CrossRef]
- Emery, X. Geoestadística. Ed. Universidad de Chile, Santiago, 2013.
- Joseph, J.; Sharif, H.O.; Sunil, T.; Alamgir, H. Application of validation data for assessing spatial interpolation methods for 8-h ozone or other sparsely monitored constituents. Environmental Pollution 2013, 178, 411–418. [Google Scholar] [CrossRef]
- Loera-Sánchez, J.M.; Ramírez-Aldaba, H.; Meléndez Soto, A.; García-Montiel, E.; González-Laredo, R. Aplicaciones geoestadísticas para la evaluación de la contaminación por ozono en la ciudad de Durango, México. Nova Scientia. 2021, 13. [Google Scholar] [CrossRef]
- R Core Team. R: A language and environment for statistical computing. R Foundation for Statistical Computing, Vienna, Austria 2020. https://www.R-project.org/ (9 de Abril de 2021).
- Olaya, V. Sistemas de Información Geográfica libres y geodatos libres como elementos de desarrollo. Cuadernos Internacionales de Tecnología para el Desarrollo Humano, 2009, núm. 8, 2009.
- Cano Baudino, Y.N.; et al. , Evaluación de los niveles de ozono en la Ciudad de Maracaibo, Estado Zulia, Venezuela. Revista internacional de contaminación Ambiental 2016, 32, 25–34. [Google Scholar]
- Malley, C.S.; Henze, D.K.; Kuylenstierna, J.C.; Vallack, H.W.; Davila, Y.; Anenberg, S.C.; Turner, M.C.; Ashmore, M.R. Updated global estimates of respiratory mortality in adults≥ 30 years of age attributable to long-term ozone exposure. Environmental health perspectives 2017, 125, 087021. [Google Scholar] [CrossRef] [PubMed]
- Bravo, J.L.; Nava, M.M.; Muhlia, A. Relaciones entre la magnitud del valor máximo de ozono, la radiación solar y la temperatura ambiente en la Zona Metropolitana de la Ciudad de México. Revista internacional de contaminación Ambiental 2000, 16, 45–54. [Google Scholar]
- Gunthe, S.; Beig, G.; Sahu, L. Study of relationship between daily maxima in ozone and temperature in an urban site in India. Current Science 2016, 1994–1999. Available online: https://www.jstor.org/stable/24908189. [CrossRef]
- Gorai, A.; Biswal, S.; Mitra, G. Effects of meteorology on ground level ozone (GLO) concentrations and identifying the hot spots having significantly higher GLO concentration in a semi-urban area. Environment, Development and Sustainability 2018, 20, 1461–1481. [Google Scholar] [CrossRef]
- Jasaitis, D.; Vasiliauskienė, V.; Chadyšienė, R.; Pečiulienė, M. Surface ozone concentration and its relationship with UV radiation, meteorological parameters and radon on the eastern coast of the Baltic Sea. Atmosphere. 2016, 7, 27. [Google Scholar] [CrossRef]
- Avino, P.; Manigrasso, M. Ten-year measurements of gaseous pollutants in urban air by an open-path analyzer. Atmospheric environment 2008, 42, 4138–4148. [Google Scholar] [CrossRef]
- Zoran, M.; Dida, M.R.; Savastru, R.; Savastru, D.; Dida, A.; Ionescu, O. Ground level ozone (O3) associated with radon (222Rn) and particulate matter (PM) concentrations in Bucharest metropolitan area and adverse health effects. Journal of Radio analytical and Nuclear Chemistry 2014, 300, 729–746. [Google Scholar] [CrossRef]
- Pusede, S.; Gentner, D.; Wooldridge, P.; Browne, E.; Rollins, A.; Min, K.-E.; Russell, A.; Thomas, J.; Zhang, L.; Brune, W. On the temperature dependence of organic reactivity, nitrogen oxides, ozone production, and the impact of emission controls in San Joaquin Valley, California. Atmospheric Chemistry and Physics 2014, 14, 3373–3395. [Google Scholar] [CrossRef]
- Pavón-Domínguez, P.; Jiménez-Hornero, F.; De Rave, E.G. Proposal for estimating ground level ozone concentrations at urban areas based on multivariate statistical methods. Atmospheric Environment 2014, 90, 59–70. [Google Scholar] [CrossRef]
- Navarro, C.M.; García, C.O. (S.f.). Impacto de la meteorología en la concentración de ozono troposférico. Universidad Complutense de Madrid. Available online: https://cmougan.github.io/CV/files/tfg.
- Bloomer, B.J.; Stehr, J.W.; Piety, C.A.; Salawitch, R.J.; Dickerson, R.R. Observed relationships of ozone air pollution with temperature and emissions. Geophysical Research Letters 2009, 36. [Google Scholar] [CrossRef]
- Jing, P.; Lu, Z.; Xing, J.; Streets, D.G.; Tan, Q.; O’Brien, T.; Kamberos, J. Response of the summertime ground-level ozone trend in the Chicago area to emission controls and temperature changes, 2005–2013. Atmospheric Environment 2014, 99, 630–640. [Google Scholar] [CrossRef]
- Porter, W.C.; Heald, C.L. The mechanisms and meteorological drivers of the summertime ozone–temperature relationship. Atmospheric Chemistry and Physics 2019, 19, 13367–13381. [Google Scholar] [CrossRef]
Disclaimer/Publisher’s Note: The statements, opinions and data contained in all publications are solely those of the individual author(s) and contributor(s) and not of MDPI and/or the editor(s). MDPI and/or the editor(s) disclaim responsibility for any injury to people or property resulting from any ideas, methods, instructions or products referred to in the content. |
© 2023 by the authors. Licensee MDPI, Basel, Switzerland. This article is an open access article distributed under the terms and conditions of the Creative Commons Attribution (CC BY) license (http://creativecommons.org/licenses/by/4.0/).


