1. Introduction
A standard treatment for locally advanced rectal cancer (LARC) is trimodality therapy consisting of neoadjuvant radiation +/- chemotherapy, surgery and adjuvant chemotherapy. Despite trimodality therapy, around a third of patients still develop recurrent disease [
1]. Currently, there are no biomarkers in routine clinical practice for patients with LARC to personalise treatment. Predictive markers are of particular relevance in the neoadjuvant chemoradiation phase, as early assessment may mean patients who experience a complete response may be spared unnecessary surgery or additional chemotherapy. Conversely, early non-response may indicate the need to escalate therapy. This is particularly relevant given the recent move towards total neoadjuvant therapy (TNT) and the watch and wait approach for complete responders [
2,
3]. In current practice, response and prognosis are assessed histologically at time of surgery by pathological stage (ypT and ypN) and tumour regression grade (TRG) as it has been demonstrated that pathological complete response is associated with superior survival [
4].
Liquid biopsy in the form of circulating tumour cells (CTCs) or circulating nucleic acids (ctDNA and ctRNA) offers the promise of earlier detection of resistance to treatment whilst being relatively non-invasive. Serial liquid biopsies may also allow clinicians to monitor tumour biology and adapt treatments accordingly. There are various methodologies used in isolating CTCs [
5]. One of the most widely used approach for CTC isolation and enumeration involves immunomagnetic based separation, utilising EpCAM-antibody-coupled magnetic beads to isolate epithelial cells from peripheral venous blood. CTCs are routinely identified as pan-cytokeratin (CK 8, 18, 19) and DAPI (4,6 diamidino-2-phenylindole) positive, and CD45 negative (leukocyte common antigen). CTCs derived using the approach also results in co-isolation of associated leucocytes.
Circulating miRNAs are increasingly becoming a focus of research, as they are highly stable non-coding RNAs thought to regulate up to 30% of the human genome and are potentially key regulators in rectal cancer [
6]. The rectal cancer microRNAome was defined by Gaedcke
et al after extensive microarray based miRNA profiling of LARC pre-treatment biopsy samples [
7].
The aims of this study were to prospectively assess CTC change and to determine CTC/lymphocyte miRNA expression during the course of neoadjuvant chemoradiation for LARC. Finally, we correlated CTC/lymphocyte miRNA expression levels and change with tumour treatment response. To the best of our knowledge, our study is the first to describe miRNA profiles associated with CTCs isolated immunomagnetically during neoadjuvant chemoradiation in LARC.
2. Materials and Methods
2.1. Patient Selection and Sample Time Points
Patients were prospectively recruited from three centres in the South Western Sydney Local Health District, Australia. The inclusion criteria were: age>18; tissue confirmation of LARC (rectal adenocarcinoma stage T3/T4 or node positive disease and no evidence of metastatic disease on computed tomography imaging of chest/abdomen/pelvis); planned treatment with neoadjuvant chemoradiation. Neoadjuvant chemoradiation consisted of infusional 5-fluorouracil (5-FU) therapy or oral capecitabine concurrent with radiotherapy for 5-6 weeks. This was followed by surgery approximately 6-12 weeks after completion of chemoradiation. Patients were followed up in clinic every 3 months. Recurrence was defined as the appearance of local or distant disease. Ethical approval was obtained from the Sydney South-West Area Health Service Ethics Review Committee (reference number HREC/13/LPPL/158, date of approval 2nd September 2013) and all patients gave written informed consent for use of their clinical data and tissue samples. CTCs were collected at baseline (pre-treatment), during treatment (at week 3) and post-treatment (within 1 week pre-surgery). Two blood samples were collected using K2EDTA BCTs, one for enumeration and the second for miRNA analyses.
2.2. TRG Scoring
Tumour Regression Grade (TRG) and pTNM staging (American Joint Committee on Cancer AJCC 7th edition/ modification of Ryan
et el) were scored by two specialist pathologists on the surgical specimens [
8,
9]. All discrepancies between pathologists were resolved through consensus. The system used for TRG scoring was the AJCC 4-point scale adapted from Ryan
et al. with 0 being complete tumour response with no viable tumour cells, 1 being small groups of cancer cells, 2 being residual cancer outgrown by fibrosis, and 3 being poor response with extensive residual tumour.
2.3. CTC Sample Processing
A 9ml blood sample was drawn in a K2EDTA tube and processed within 24 hours using the IsofluxTM (Fluxion) system, as per the manufacturer's instructions. For enumeration, immunostaining was performed with anti-CD45 for negative selection of lymphocytes, pan-cytokertin (CK) for positive selection of epithelial cells and Hoechst for DAPI/nuclear staining. For miRNA analyses, the isolated cell pellet was placed in a cryovial, snap frozen on dry ice and stored in liquid nitrogen until RNA extraction.
2.4. miRNA Candidate Selection
Three approaches were combined to select candidate miRNAs for OpenArray profiling: (i) review of the literature involving miRNAs previously associated with LARC treatment, with a focus on studies that described change in expression during treatment and association with response; (ii) review of miRNAs previously shown to be associated with colorectal cancer carcinogenesis and radiosensitivity, and (iii) additional miRNAs identified in a pilot study of rectal cancer patient CTC samples, SW480 cell line and healthy patient samples using an OpenArray® panel with 758 potential target miRNAs. The candidates from this run were compared against those derived from the literature.
2.5. RNA Extraction and miRNA OpenArray Profiling
RNA extraction was performed using the Norgen
TM total RNA purification kit as per manufacturer's instructions. Reverse transcription and preamplification were performed, using the Taqman® OpenArray MicroRNA Panels protocol. The diluted preamplified product was subject to polymerase chain reaction (PCR) using QuantStudio
TM. Customised OpenArray® miRNA plates containing the selected miRNA targets were used for the study samples. Data was outputted from the QuantStudio
TM platform as C
RT values. The QuantStudio
TM platform uses C
RT, the equivalent of C
t [
10].
2.6. Data Analyses
All statistical analyses were performed using the following R packages available from CRAN: BMA (Bayesian Model Averaging) [
11]; or Bioconductor version 3.15 (BiocManager 1.30.19) : HTqPCR version 1.50.0 [
12] , in R version R 4.0.0 [
13]. For differential expression analysis between time-points, only patients with complete information for all three time-points were analysed. This resulted in 117 individual files with the miRNA
CRT value for each patient, corresponding to 39 patients. The files were read into R using the HTqPCR function readCtData. Raw data was normalised, and three normalisation methods inside the package were tested: quantile normalisation, deltaCt normalisation and geometric mean normalisation. Comparing the different normalisation methods, and after the removal of 3 patient samples, the quantile normalisation method performed best at reducing the variation between the data points and was used for the downstream analysis of differential expression. This is illustrated in Supplementary figure S1.
Undetermined values were set to 40 and
CRT values above 38 and below 14 were defined as unreliable. Clustering analysis of normalized miRNA data identified two major sample groups that correlated with sample collection dates (
Supplementary Figure S2) according to the QuantStudio
TM RT-PCR run batches. Differential expression analysis was performed using the general linear model that takes into account sample collection time-points to correct for possible batch effects.
Comparisons were made between responders and non-responders for each time-point. The BMA R package was used to identify differentially expressed miRNAs that show a strong correlation to the responder/non-responder status. BiomaRt package [
14] in R was used to access the Gene Ontology annotations associated with miRNA targets. The targets were obtained. using the multimiR package [
15] in R.
Cytoscape was used to produce the interaction network between some of the two miRNA targets found to be significant. AKR1C3 was considered as the gene of interest to start the network. The first neighbours of this gene were retrieved resulting in only one other gene.
3. Results
Fifty-two patients were prospectively recruited into this study from 2014-2017. The median patient age was 62 years, with more than two-thirds being male. The majority of patient were diagnosed with stage T3 and node positive locally advanced rectal cancer. More than two thirds the patients were of a good performance status. Complete pathological response was seen in 18%. The median follow up was 2.7 years, at which time 21% had recurred.
Table 1 summarises the patient characteristics.
3.1. CTC Enumeration
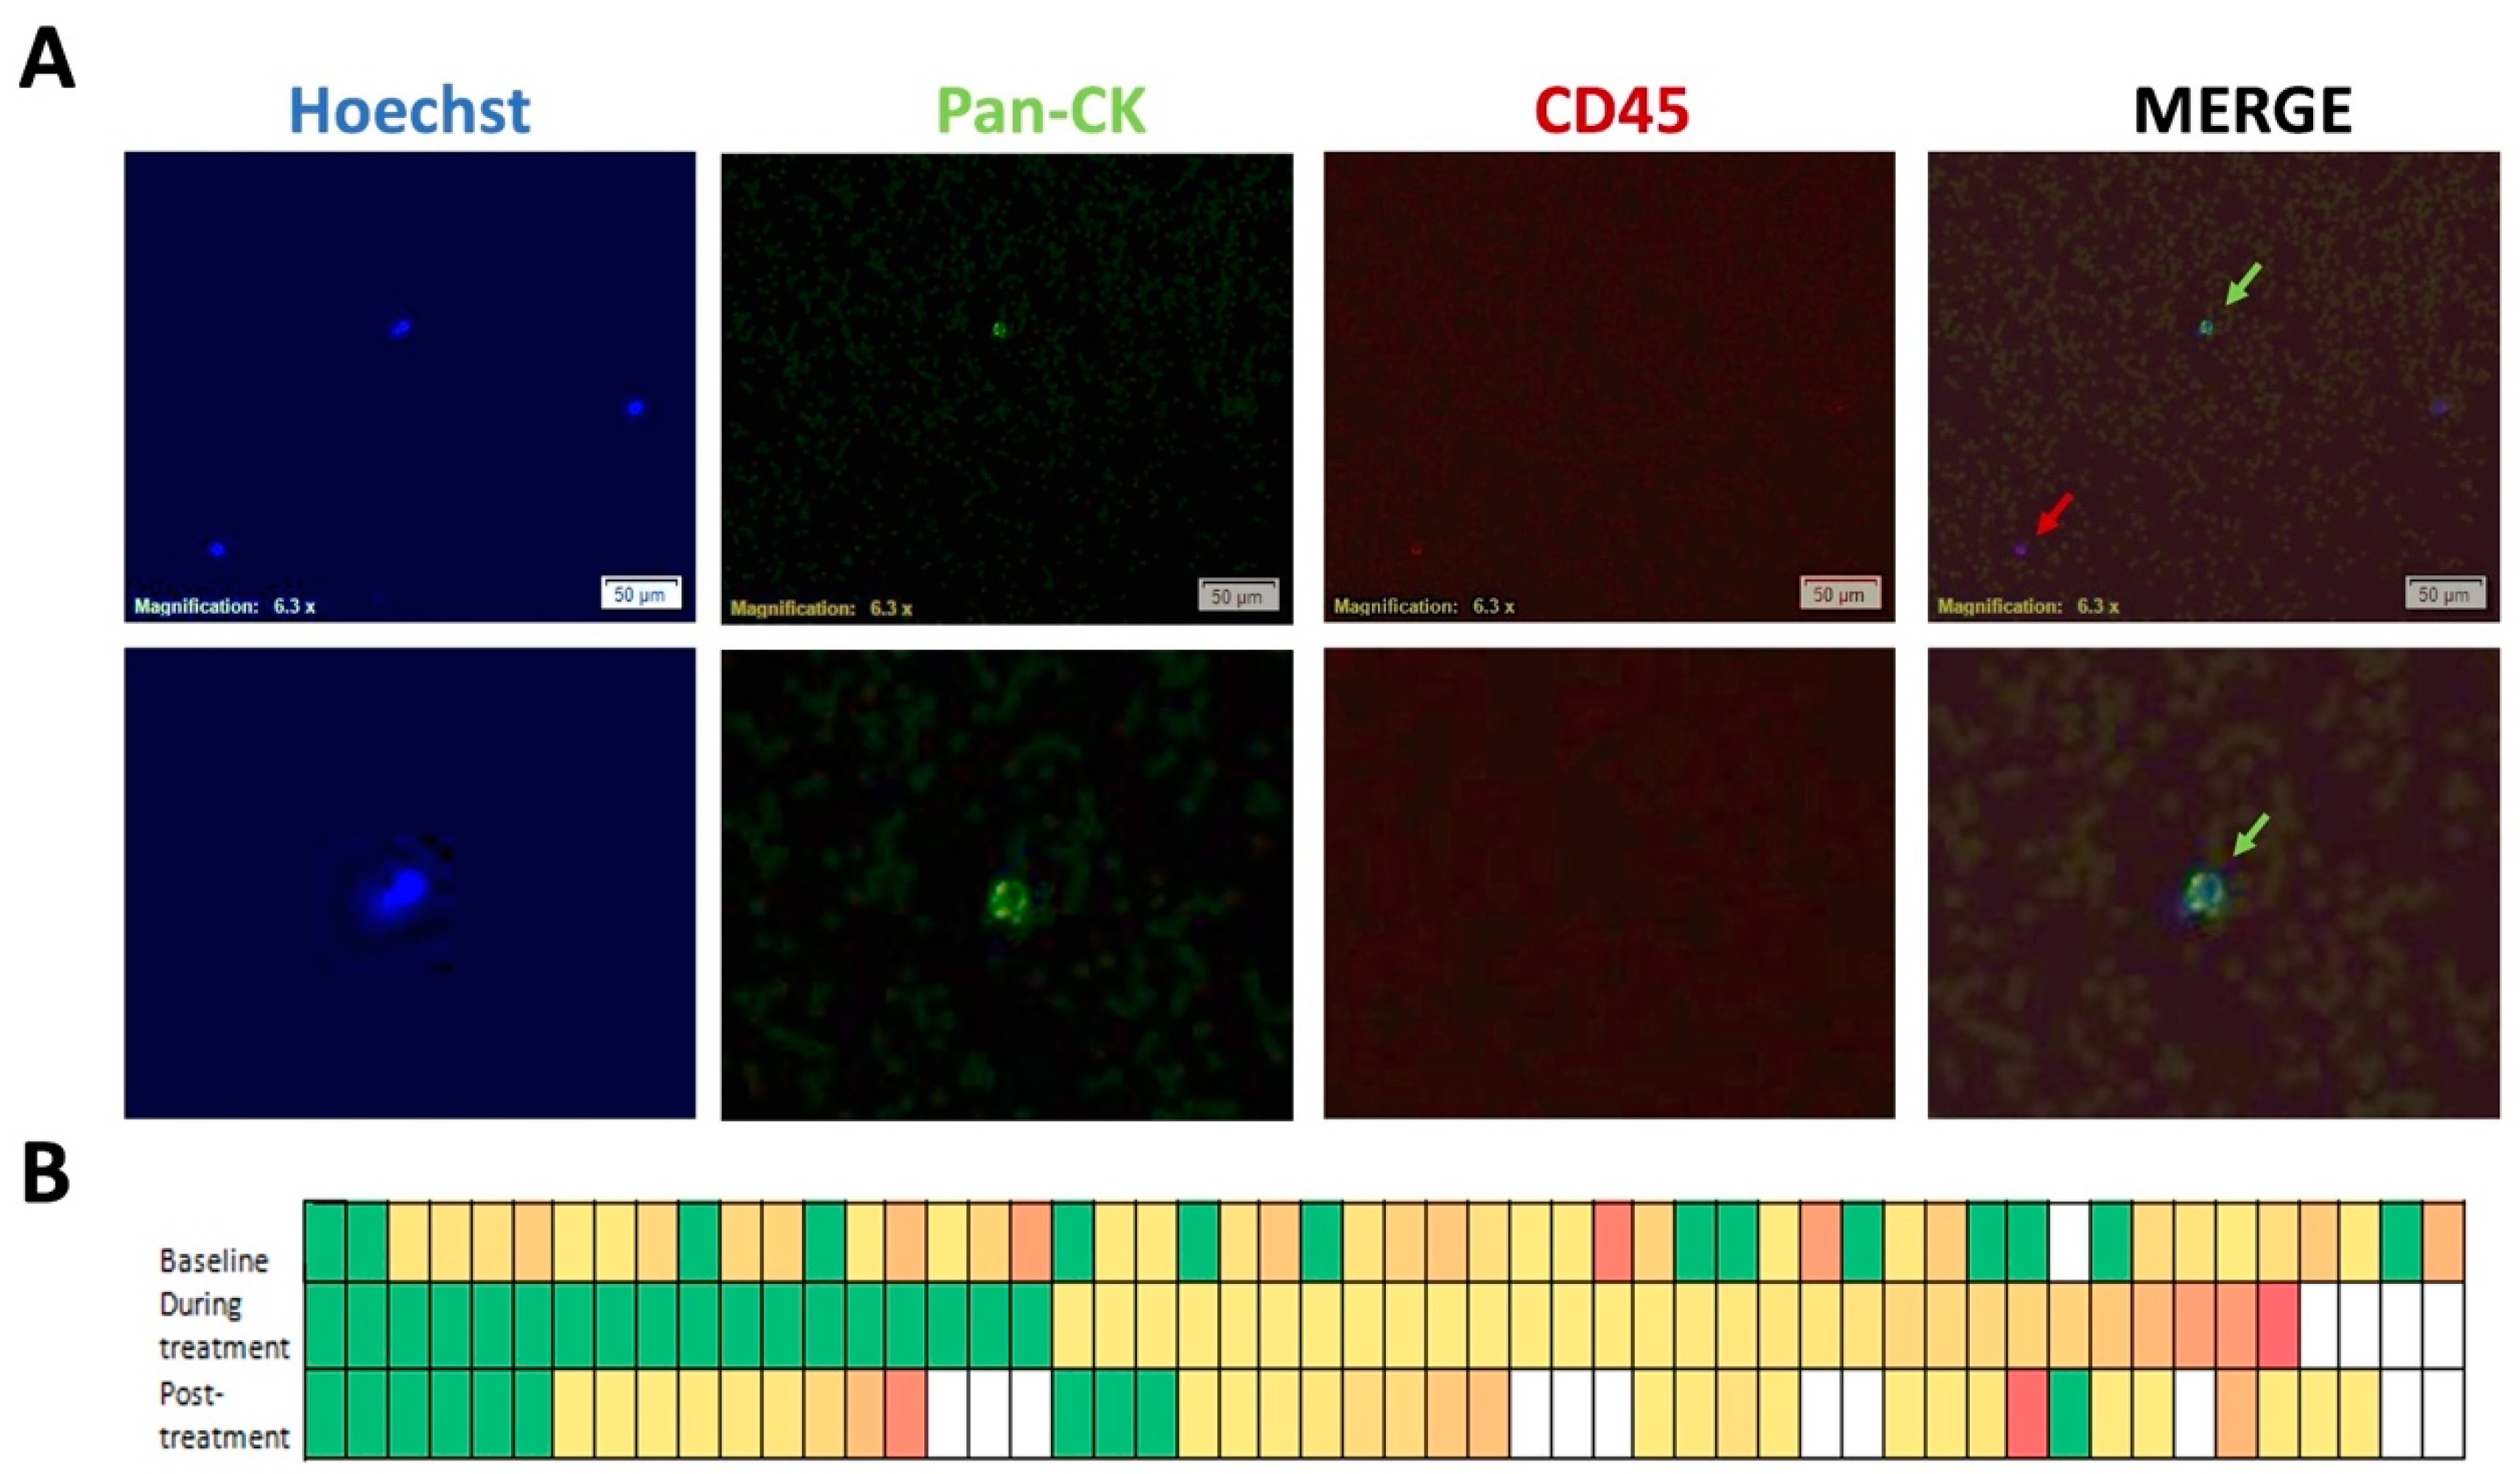
A typical image of CTCs captured and the number of CTCs captured and identified using the Isoflux
TM instrument and CTC enumeration kit for the 52 patients is shown in
Figure 1. The mean CTC count at baseline was 7 CTCs/9ml blood, ranging from 0 to 45 CTCs/9ml, with CTCs found to be present in 73% of patients at baseline pre-treatment. The mean CTC count during week 3 of treatment was 5 CTCs/9ml with a range from 0 to 54/9ml blood and the mean count post treatment or pre-surgery was 6 CTCs/9ml with a range from 0 to 52/9ml. The CTC number for each individual patient are listed in
Supplementary Table S3.
3.2. miRNA Candidate Selection and miRNA Expression Profiling
A three-tiered selection approach was applied to identify 106 candidate miRNAs of interest. The miRNAs, along with the approach used to select the miRNAs and accompanying references, as well as a data summary, are listed in supplementary
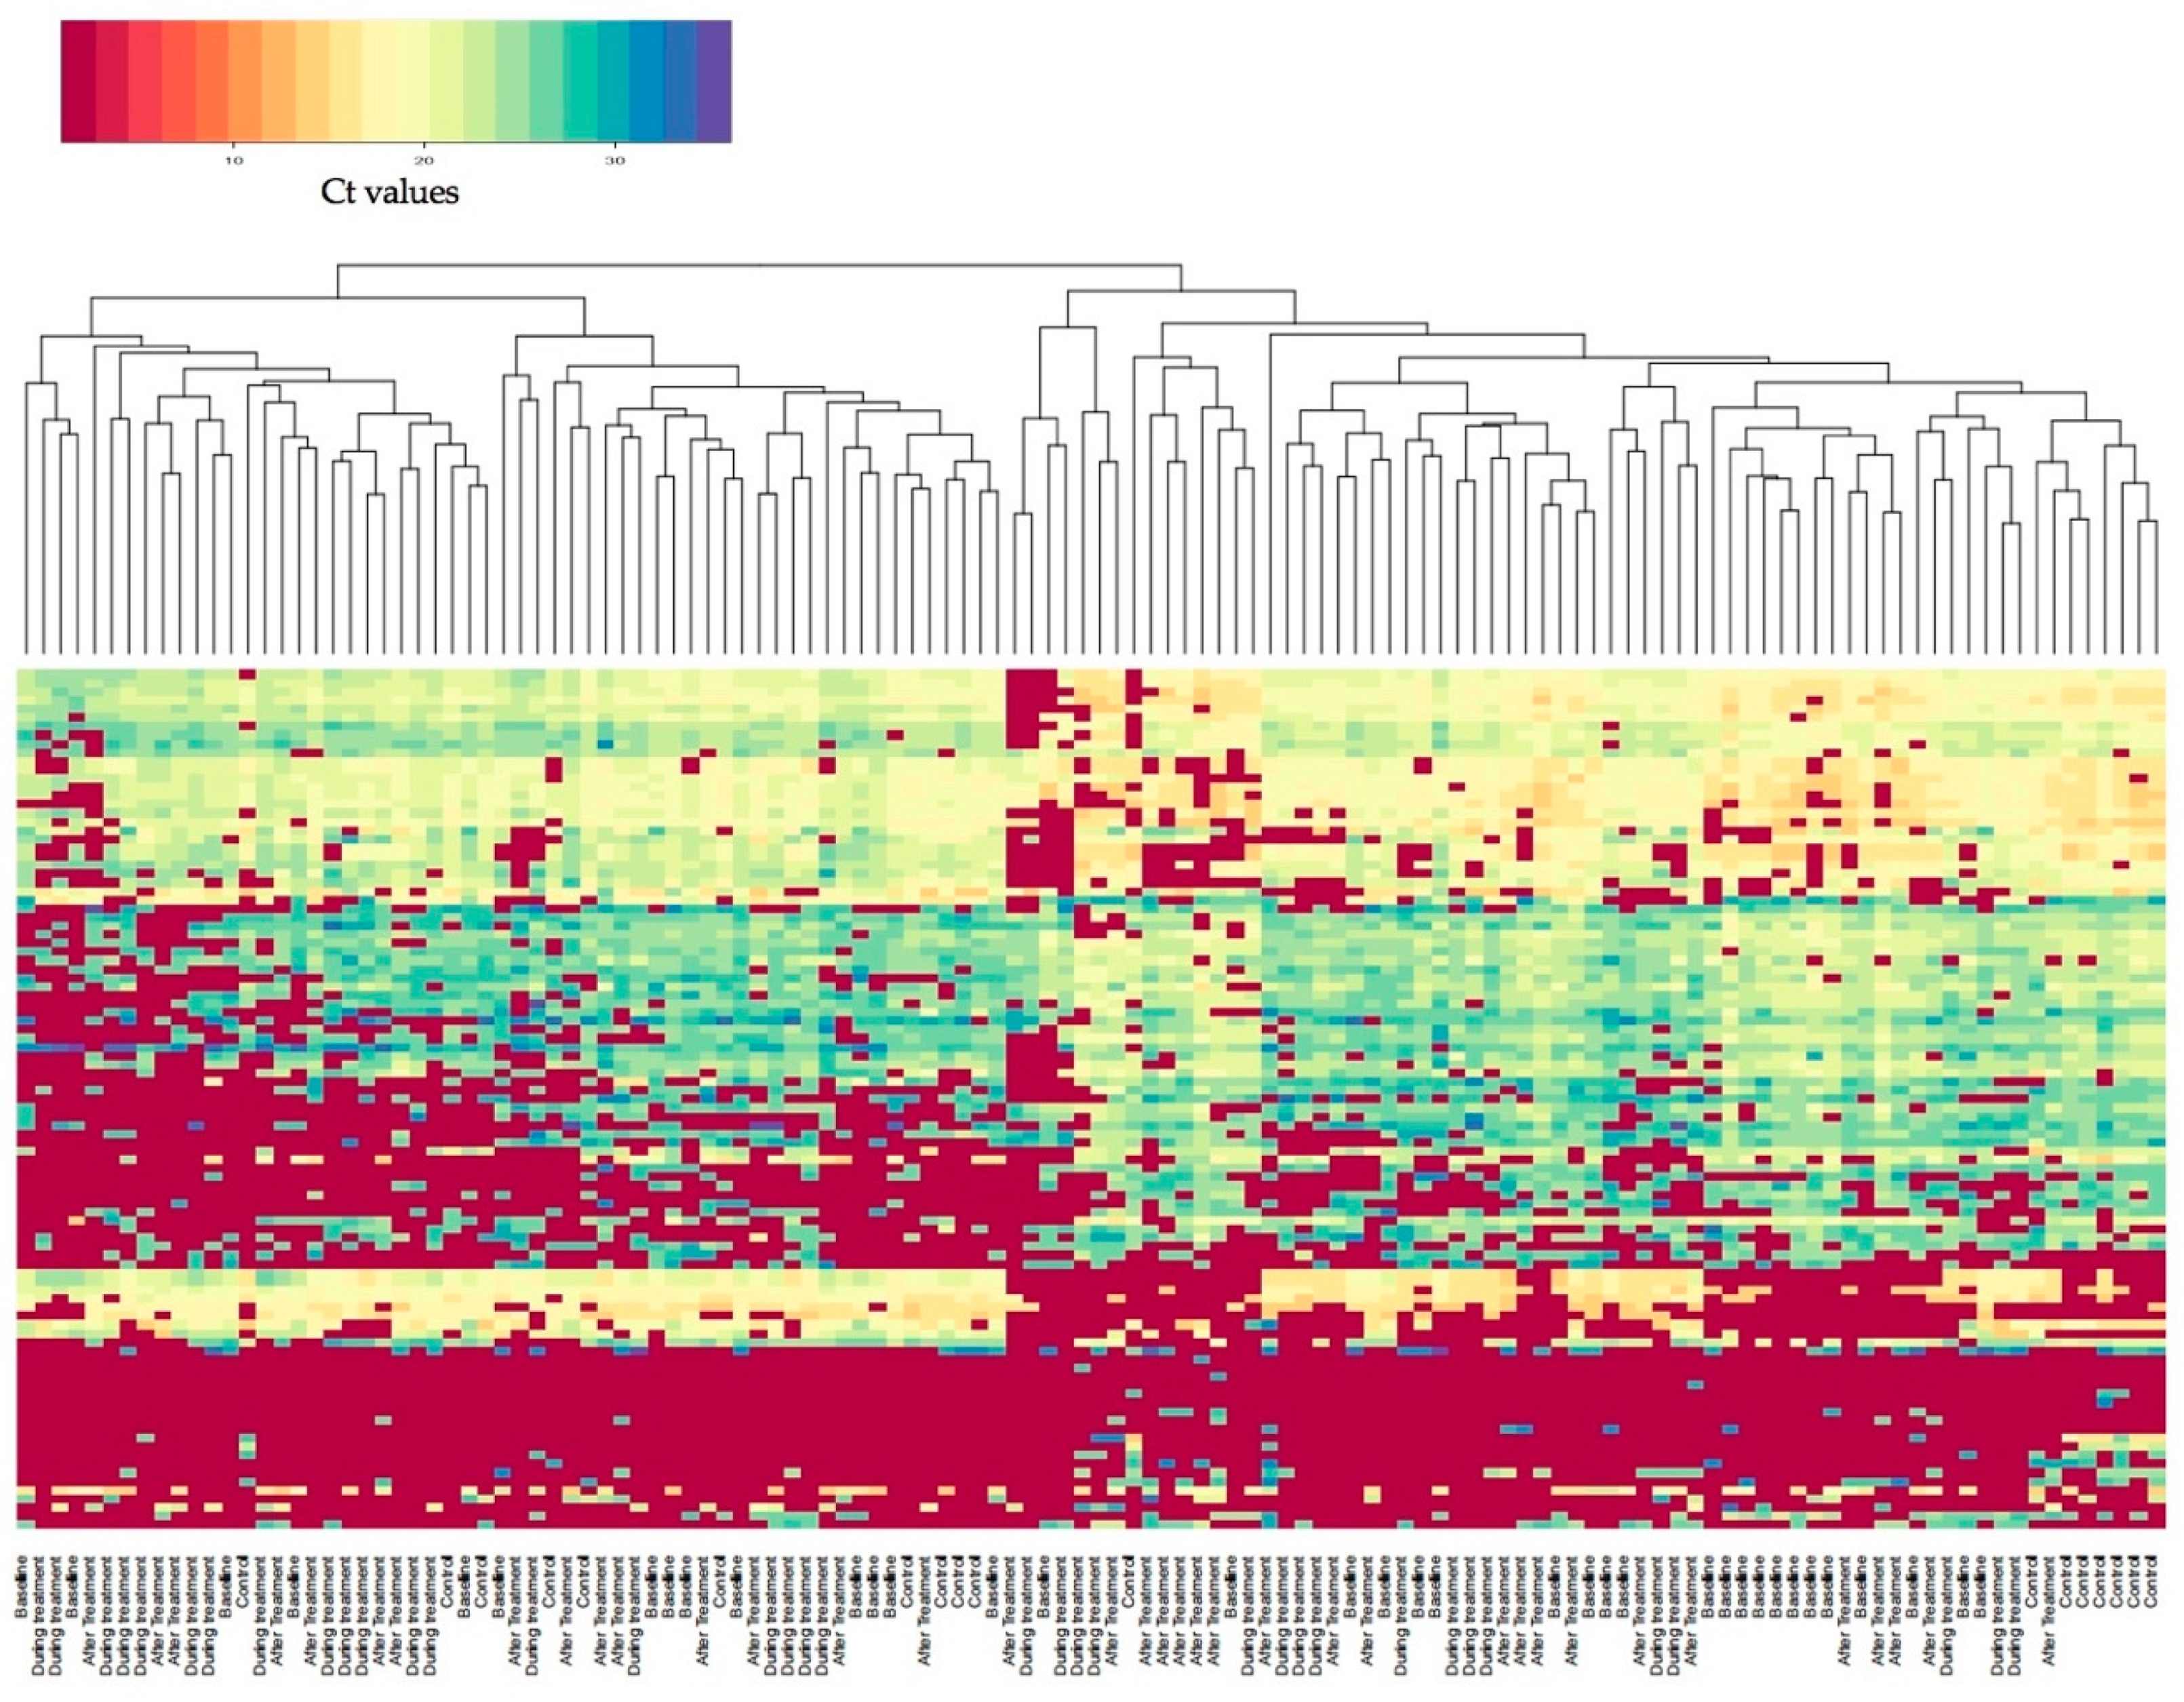
Table S4. The distribution of miRNA Ct values in all samples is summarized in the heatmap in
Figure 2. There is a clear separation into three main groups of expression with the bottom part of the figure being the miRNAs that are most highly expressed, inclusive of miRNAs with Ct values in the range from 15 to 25.
3.3. Change in CTC and Lymphocyte miRNA Expression During nCRT
The panel of selected miRNAs used in this study were assessed for differential expression during neoadjuvant treatment as described in the methods. The miRNAs that significantly changed over the course of treatment are listed in
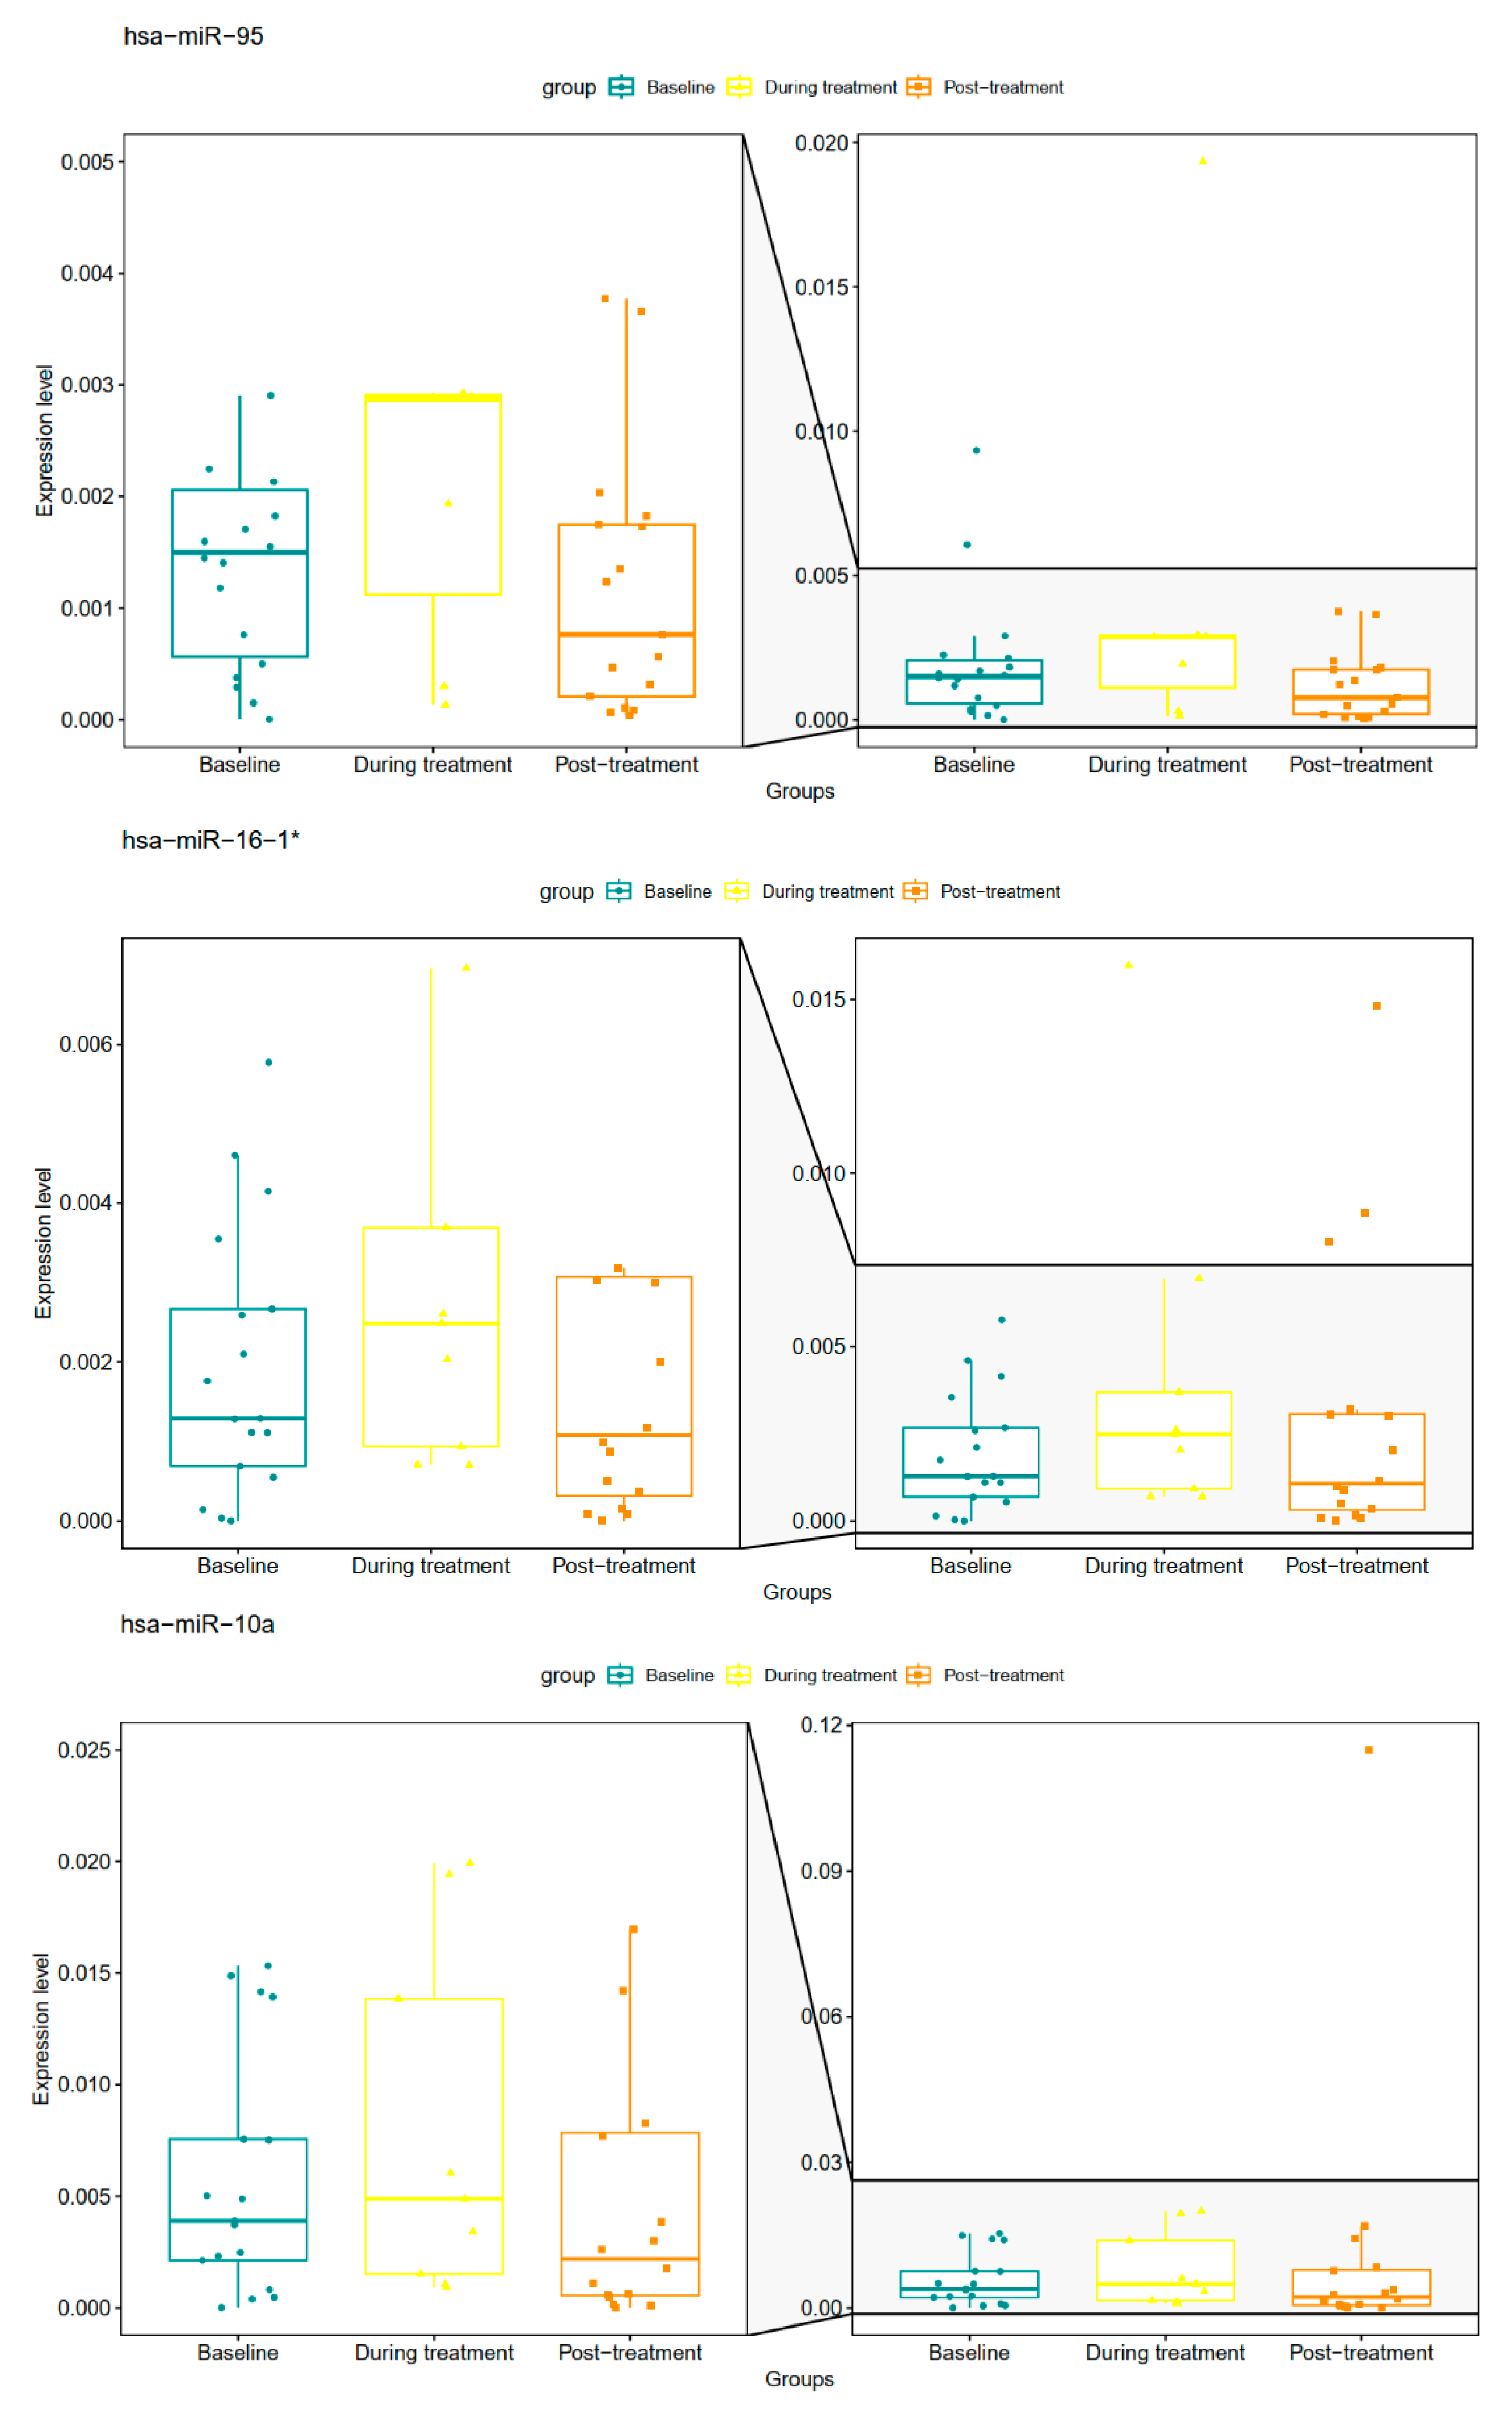
Table 2 and shown in
Figure 3.
The differential expression analysis between the time-points (baseline vs during treatment, during treatment vs post-treatment and baseline vs post-treatment) revealed six miRNAs to be differentially expressed between during treatment and post-treatment time-points. In addition, 12 miRNAs were differentially expressed between baseline and during treatment. Of these, three miRNAs (hsa-miR-95, hsa-miR10a, hsa-miR16-1*) overlapped between the two group comparisons and are shown italicised and in bold in
Table 2. No differentially expressed miRNAs were found between the baseline and post-treatment conditions. Thus, overall between all treatment groups, 15 miRNA’s were found to be uniquely differentially expressed. The boxplots for hsa-miR-95, hsa-miR10a, hsa-miR16-1*miRNAs are represented in
Figure 3. For these three differentially expressed overlapping miRNAs there was an apparent increase and then fall in the expression levels back to near baseline levels across the time-points.
3.4. Correlation of miRNA Expression with Tumour Response
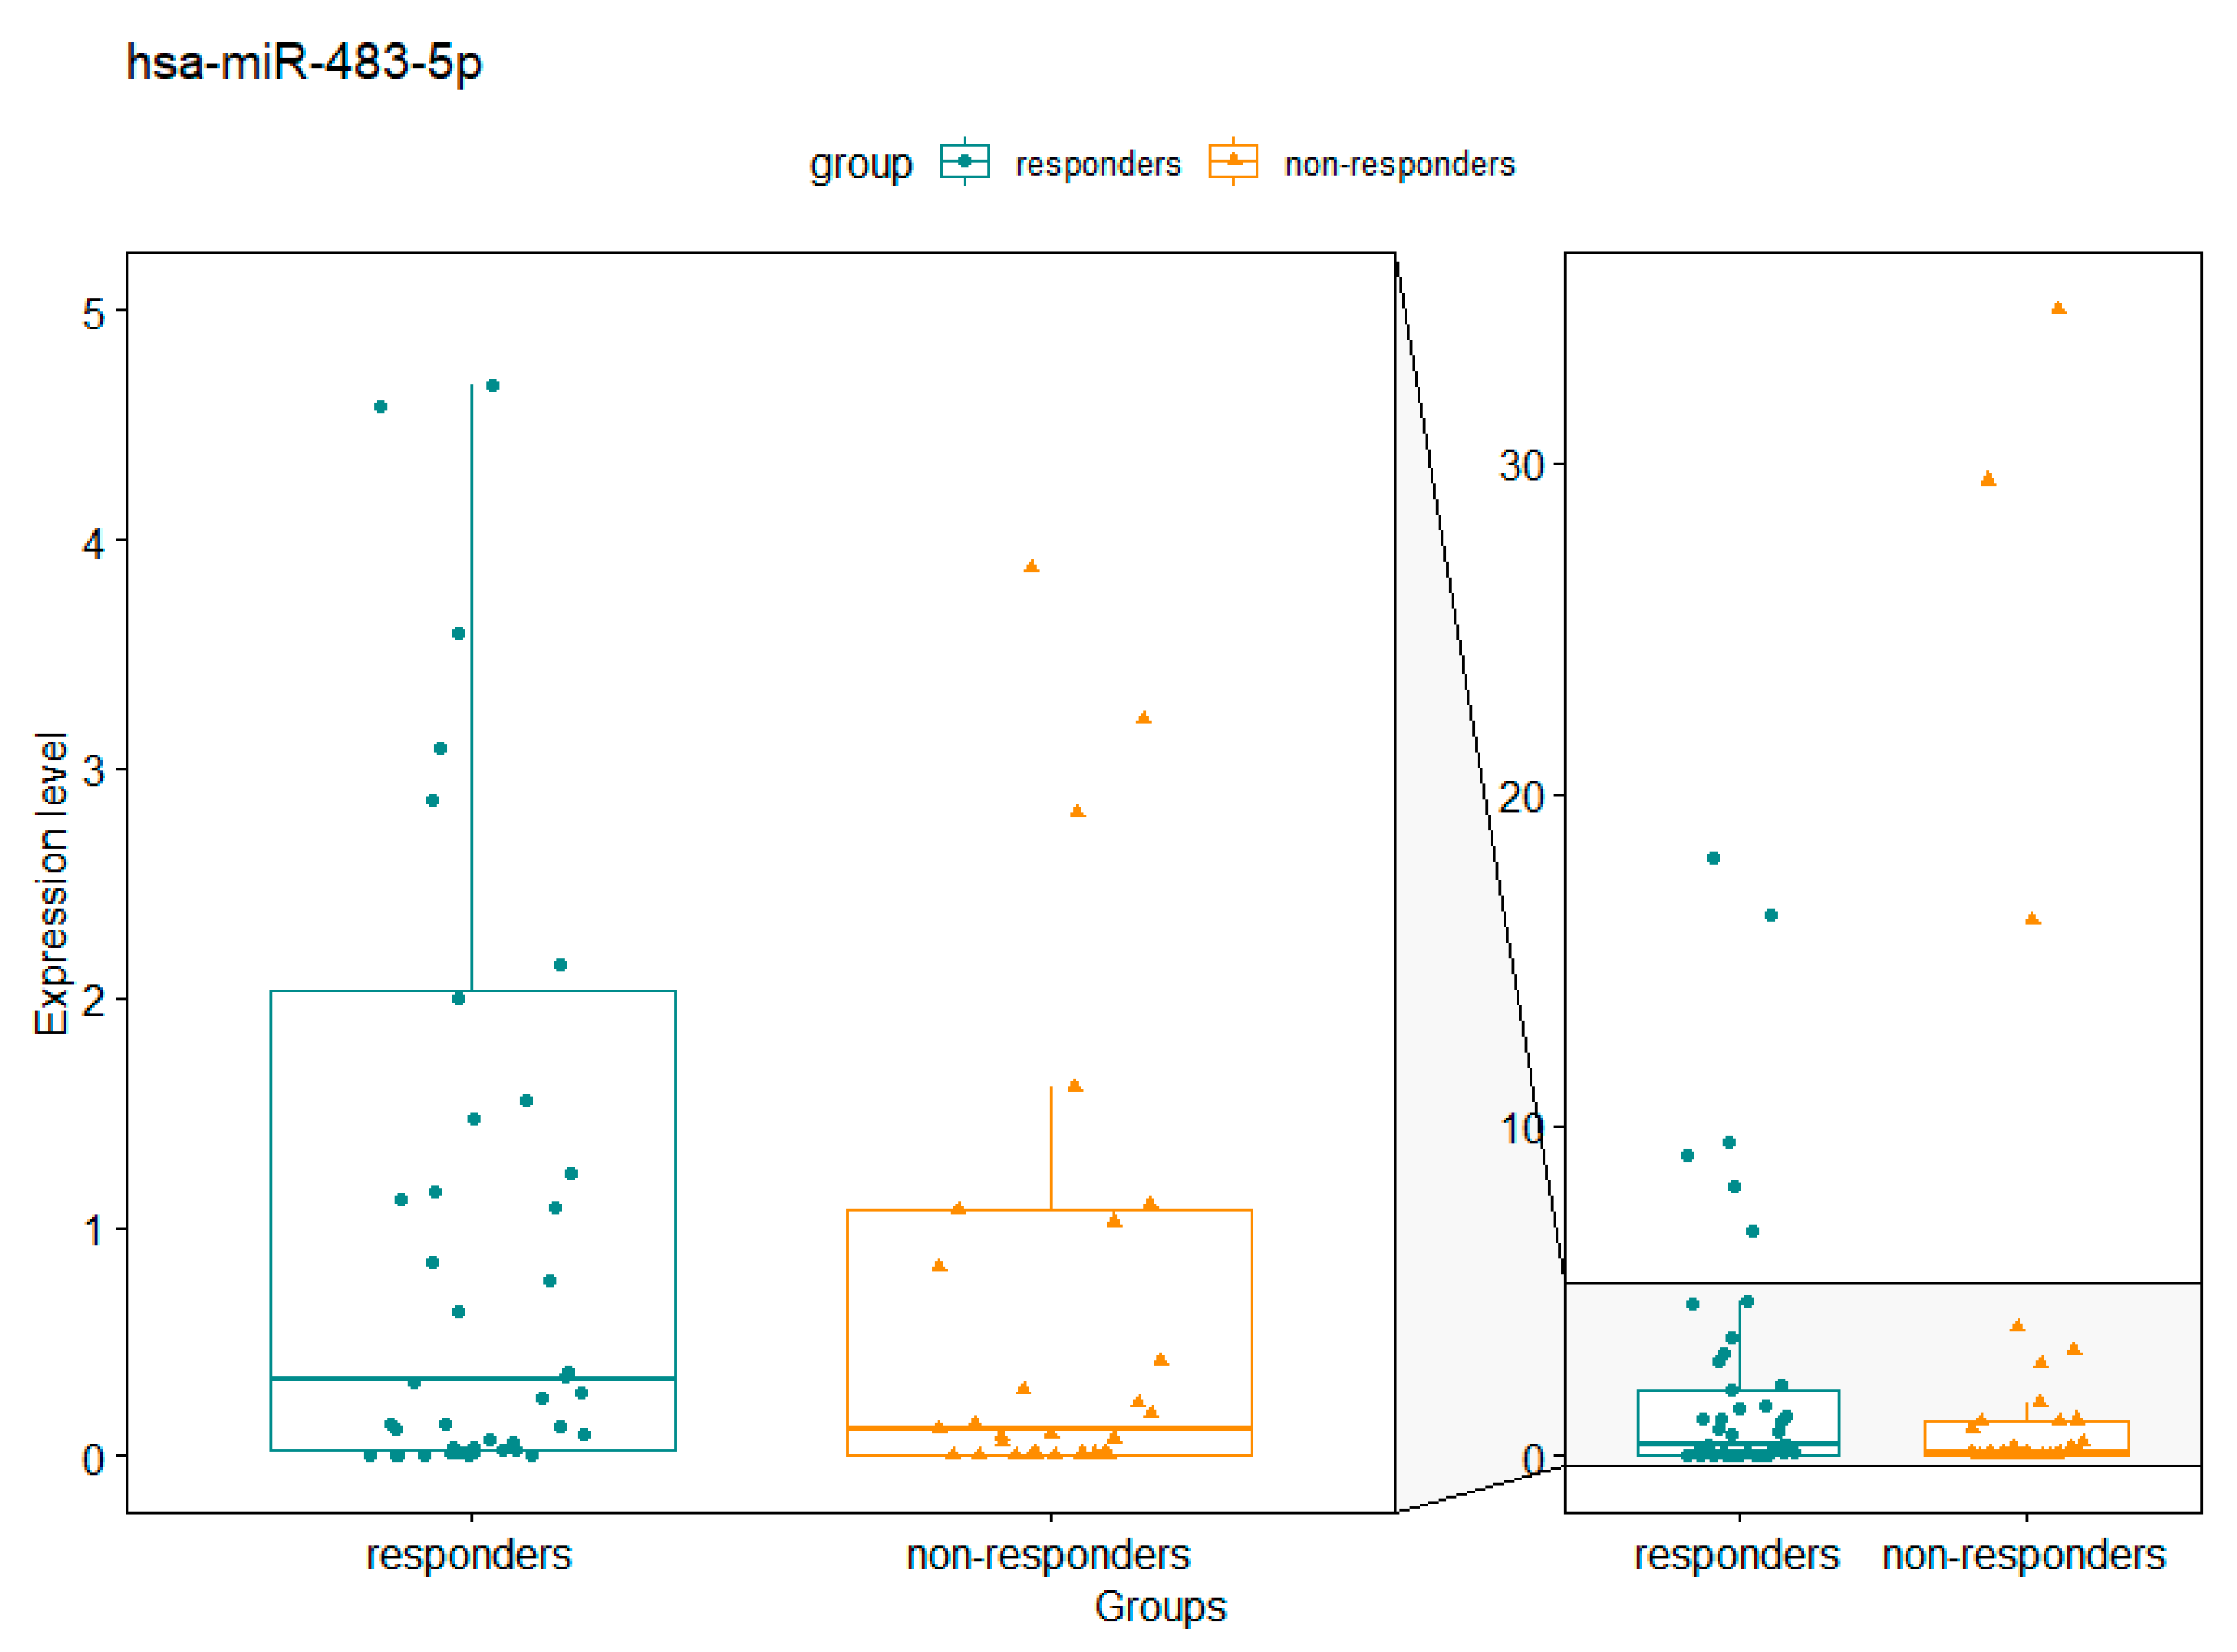
We next performed a differential expression analysis comparing good responders (TRG 0 and 1) and poor responders (TRG 2 and 3) for each of the time-points. Only one miRNA hsa-miR-483-5p was found to be differentially expressed in the post-treatment time-point between good and poor responders, with a fold change of 9.48 (p=0.048). This is illustrated in
Figure 4.
3.5. Correlation of miRNA Changes with Tumour Response
To determine if any of the differentially expressed miRNAs are good predictors of treatment response, the dataset was divided into good and poor responders and generalized linear models were generated and ranked by Bayesian modelling average analysis using the BMA package in R [
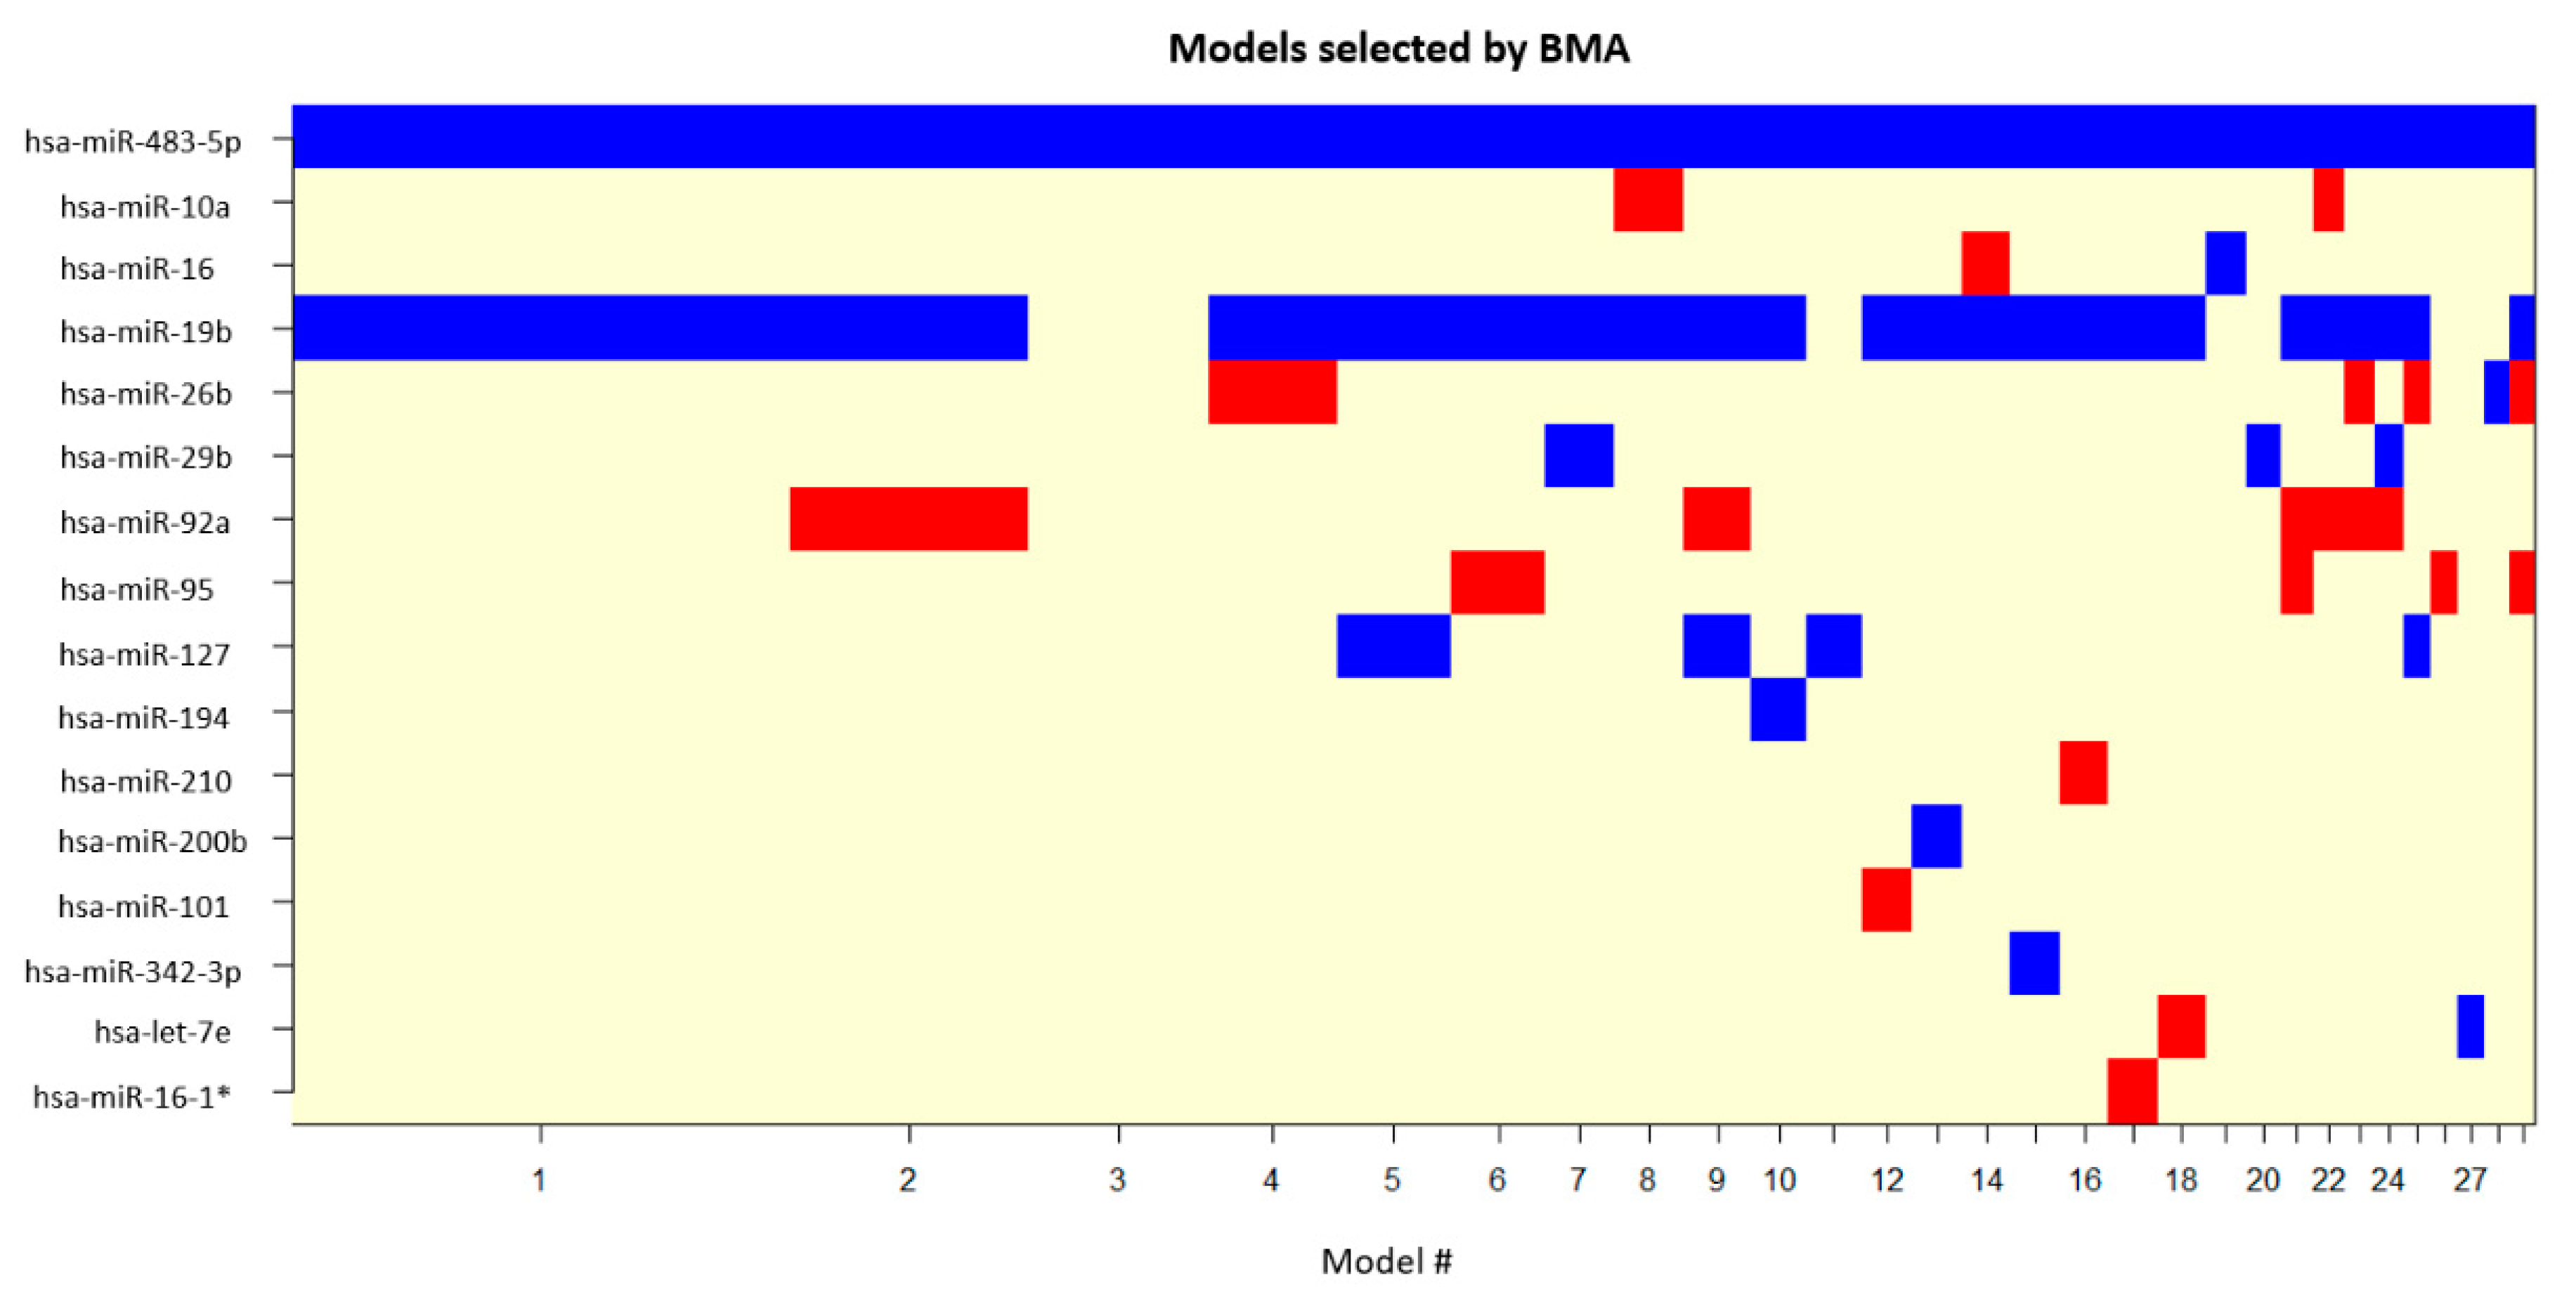
11]. This analysis included the fifteen miRNAs that were found as differentially expressed between the three conditions (pre-treatment, during treatment and post-treatment) and the single miRNA that was differentially expressed between good responders and poor responders. The independent variables of all the models that passed the BMA cut-off are represented in
Figure 5, with
Table 3 showing the parameter estimates for the best five models according to the BIC computed and the posterior probabilities associated with each variable.
This analysis showed that there are two miRNAs that belong to the set of differentially expressed miRNAs and show a good correlation to treatment response: hsa-miR-19b-3p and hsa-miR-483-5p, the latter also being the only miRNA found as differentially expressed between good responders and poor responders and showing up as an independent variable in all Bayesian models. This demonstrates a strong correlation of these miRNA with treatment response. Even though miR-19b does not show a significant differential expression between responders and non-responders like miR-483-5p, it is identified as being a good predictor of treatment response.
Table 3 summarizes the posterior probabilities for these miRNAs, with hsa-miR-19b-3p and hsa-miR-483-5p shown in bold.
3.6. Network analysis and gene ontology annotation
To further investigate the putative impact of dysregulated levels of these miRNAs and the possible functions of their targets and impact in the treatment response, the targets for hsa-miR-19b-3p and hsa-miR-483-5p were retrieved. The gene ontology annotations for these targets were also accessed using
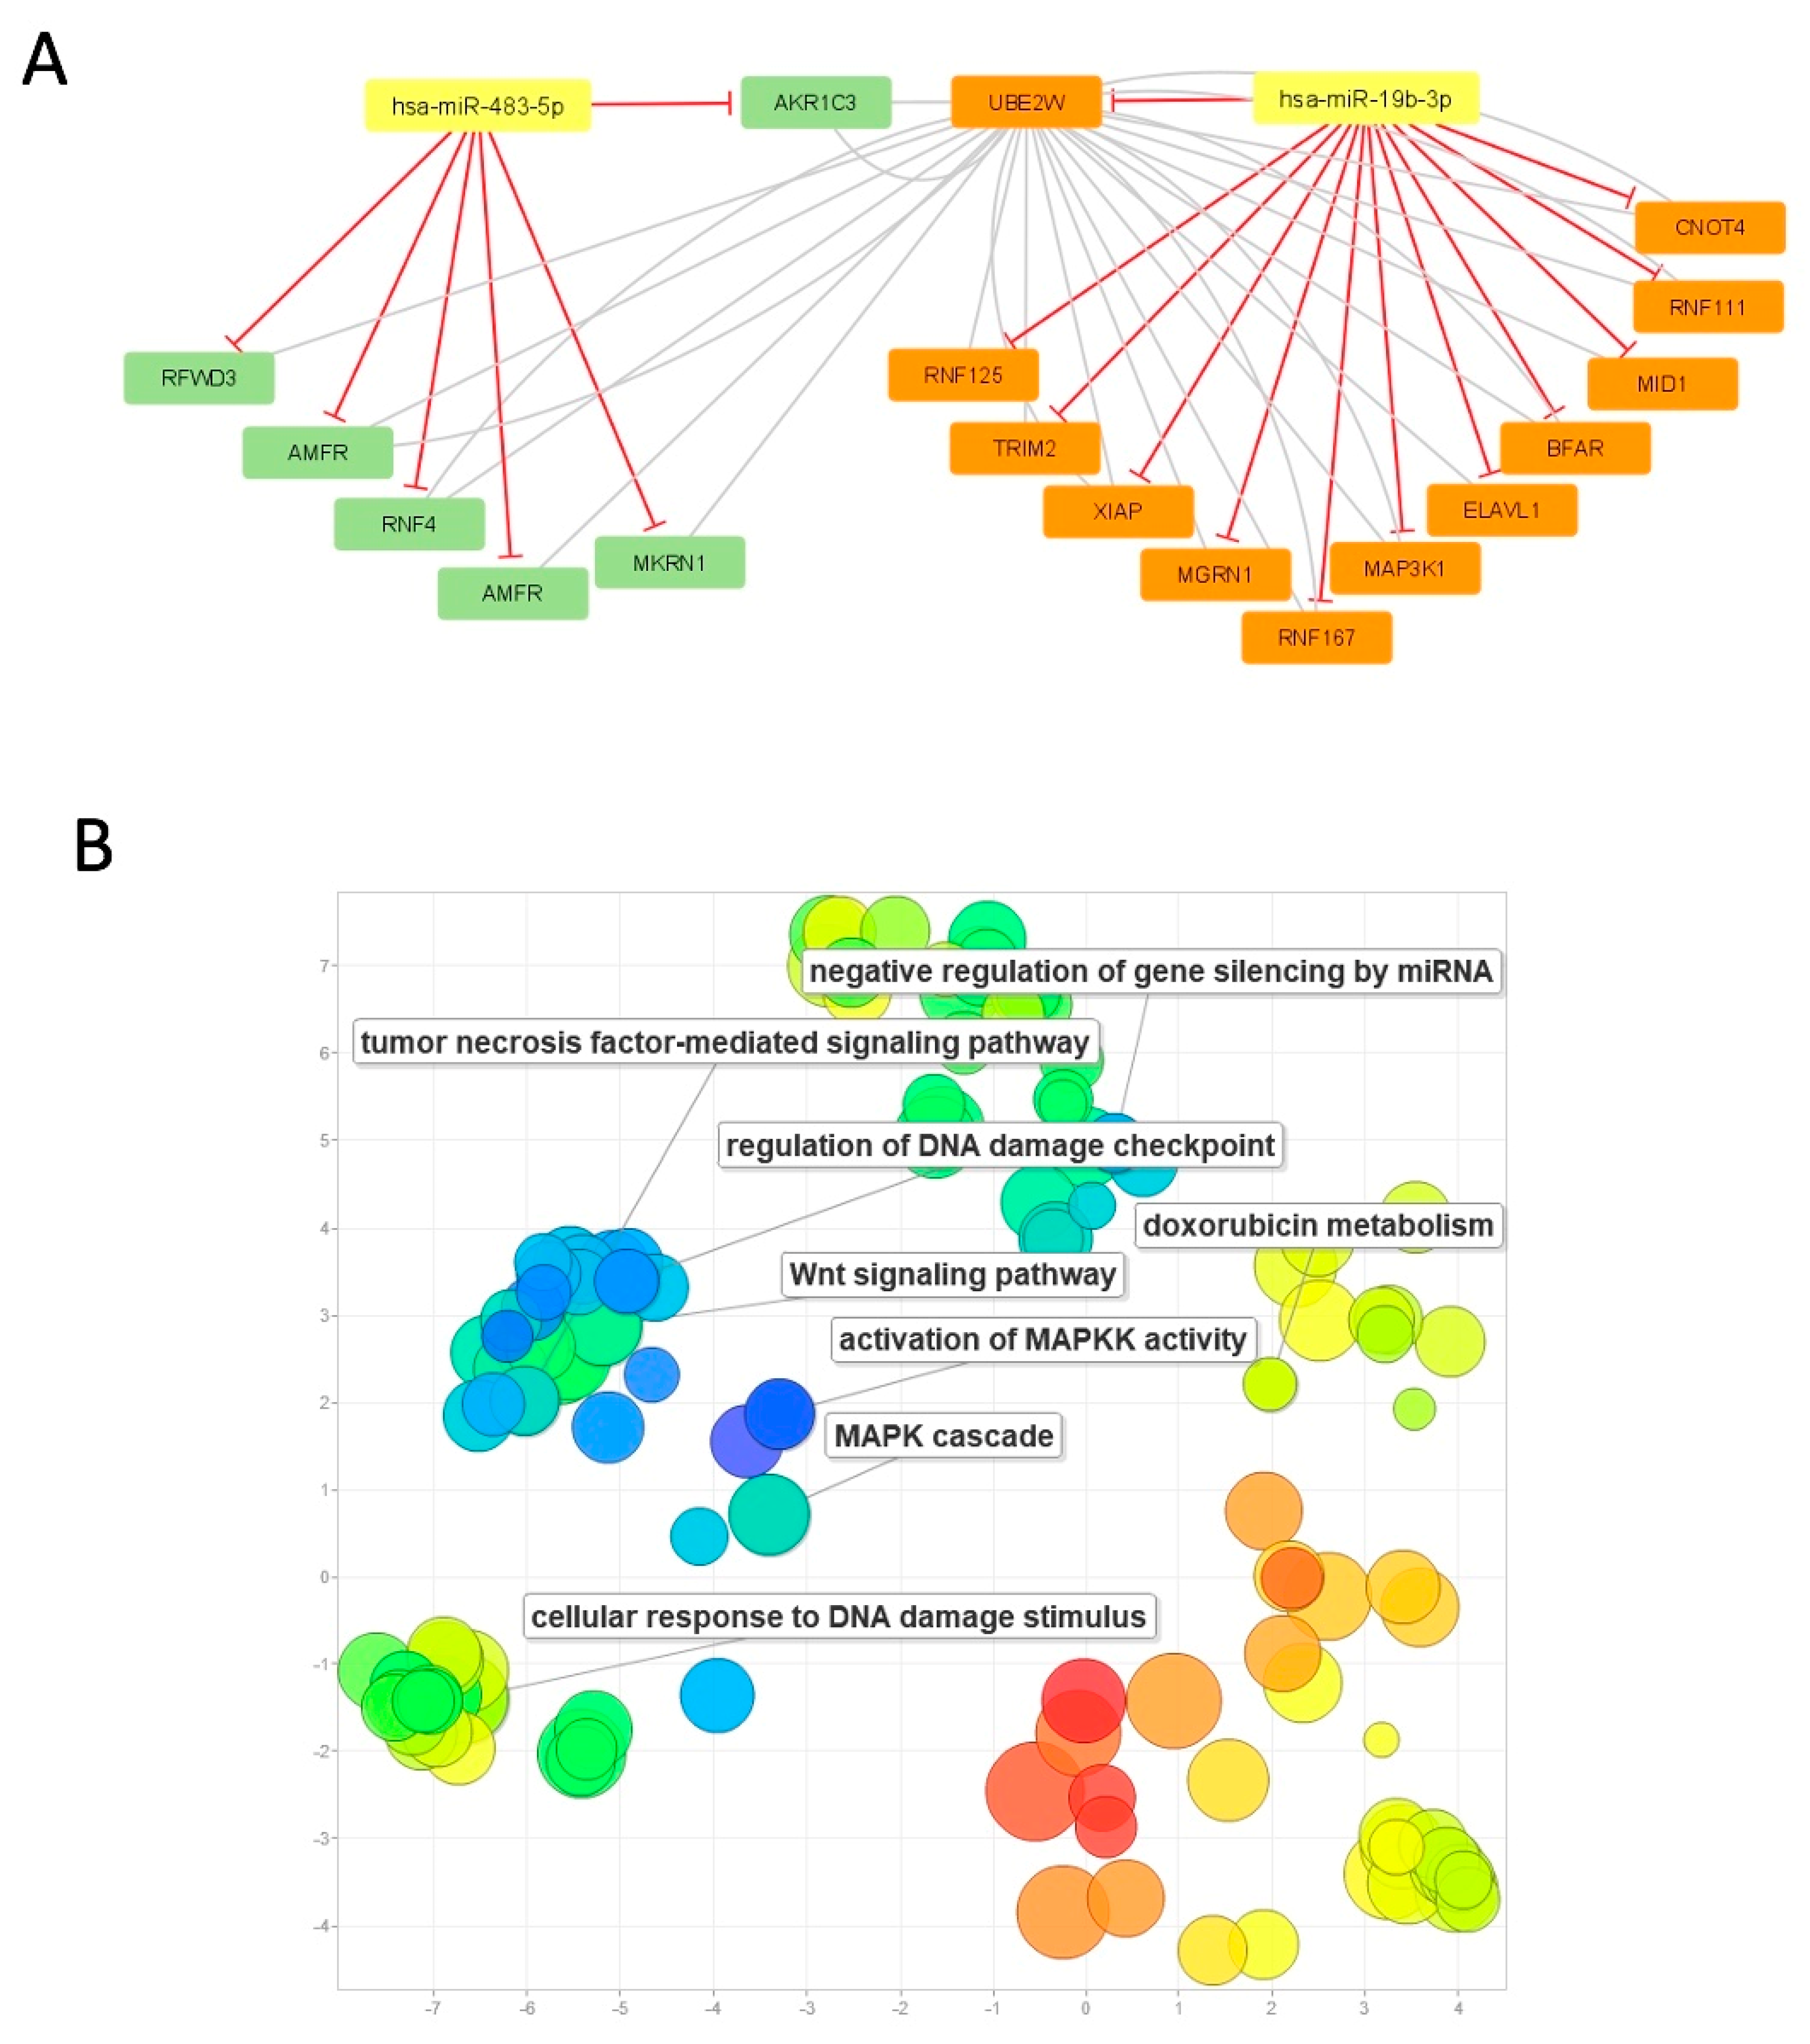
biomaRt also in R. The gene ontology annotations were interrogated for connections with chemoresistance or chemotherapy response. One gene, AKR1C3, a target of miR-483-5p was found to be annotated as being involved in the metabolism of two drugs commonly used for the treatment of cancer: doxorubicin and daunorubicin. This gene has been previously identified as being overexpressed in several cancers and associated with tumour resistance to chemotherapeutic drugs [
16]. The interaction network in
Figure 6a shows the connection between some of the hsa-miR-19b-3p and hsa-miR-483-5p target genes having AKR1C3 as a central node.
Figure 6B shows the main gene ontology annotations associated with these genes.
4. Discussion
This study addresses novel questions which, to our knowledge, have not thus far been reported in the literature. Primarily, this includes the tracking of CTCs at multiple time-points during neoadjuvant treatment for LARC and interrogating CTC samples isolated immunomagnetically for changes in miRNA expression and importantly, correlating these with tumour responses.
Presence of CTCs was found in 73% of the patient cohort, which consists of non-metastatic patients. This is a high level for early stage cancer and is consistent with the Isoflux
TM having a greater sensitivity and detection than CellSearch
TM [
17]. Publications based on CellSearch
TM have reported fewer CTCs in the early setting, with the predominance of studies performed in the metastatic setting. Studies utilising other isolation platform such as fluid-assisted separation technique (FAST) have reported up to 84% having CTCs, the majority consisting of a non-metastatic CRC cohort of which a subgroup consisted of rectal cancers [
18]. Another study using a
size-based microfluidic device reported CTCs in 100% of rectal cancer patients [
19]
.
CTCs have been found to be higher in rectal cancers treated with neoadjuvant chemoradiation compared to patients who have not received this therapy and there have been variable findings of CTC change with chemoradiation [
19,
20,
21,
22,
23,
24]. Rectal cancers treated with neoadjuvant chemoradiotherapy comprised a small subgroup of one study which enumerated CTCs based on EpCAM positivity [
20]. No changes in CTC numbers were found with chemoradiotherapy. On the contrary, another study using a size-based isolation technique, found
that CTCs fell from a median of 42 CTCs/5ml pre chemoradiation to 7 CTCs/5ml post treatment [
19]. Another study using CellSearch
TM, found 19% of patients had ≥1 CTC at baseline per 22.5ml blood [
23]. This reduced to 8% post-chemoradiation, was 9% within a week of surgery and 5% at 6 months post surgery.
We found an overall decrease in CTC number over the treatment course, though there is clear heterogeneity between patients. Overall, CTC counts appear to decrease between baseline and during treatment, as well as between baseline and post treatment with mean CTC numbers post treatment being slightly higher than during treatment, but lower than that at baseline. This is largely consistent with the literature which has reported a fall in CTCs during treatment. Differences in isolation techniques likely account for differences in positivity rate. Importantly, we also looked at 3 time-points, and tracked CTC change over the treatment course. Most studies have focussed on one or two time-points. The increase in CTCs we observed with tumour treatment is similar to another study that also looked at 3 time-points, albeit all post-treatment. The authors also observed an increase in CTCs within a week of surgery which fell after 6 months. It can be hypothesized that tumour disturbance with treatment or surgery may result in CTC dissemination which results in a transient rise [
25].
To our knowledge, there is no literature looking at the miRNA expression profiles of these CTCs and associated lymphocytes. We found that miRNA expression significantly changes during chemoradiation, with 12 differentially expressed miRNAs between baseline and during treatment. Three of these were also differentially expressed from during treatment to post-treatment. Importantly, of these miRNAs, there was a strong correlation between hsa-miR-19b with tumour response suggesting that low levels of this miRNA correlate with a good response to chemoradiation.
This finding of miR-19b and correlation with tumour response is supported by other studies in the literature which is mainly in solid tissue [
26,
27]. miR-19b expression levels in LARC biopsies obtained at time of colonoscopy have been identified as an independent predictor of pathological response to preoperative chemoradiation. miR-19b expression increases in chemotherapy resistant cells and downregulation of miR-19b enhances the antitumor effects of chemotherapy [
27]. miR-19b was also found to be overexpressed in colorectal tissue, and indicated a poor prognosis. Another study found that high expression of miR-19b in colorectal cancer was associated with lymph node metastasis and distant metastasis [
28]. FBXW7 has been identified as a putative target of miR-19b and miR-19b inhibition has been shown to potentially enhance the efficacy of radiotherapy [
29]. Another potential target of miR-19b is ITGB8 with findings suggesting that the miR19b-3p/ITGB8 axis plays an important role in the growth and metastasis of colorectal [
30]. Taken together, low levels of miR-19b expression in CTCs are associated with good response to chemoradiation and favourable outcomes. miR-19b thus represents a potential predictive biomarker as well as a potential strategy to sensitise tumour cells to treatment.
Another promising miRNA candidate is miRNA hsa-miR-483-5p, which was differentially expressed between good responders and poor responders and also showed up as an independent variable in all of our Bayesian models. This is consistent with the literature of this miRNA in solid tissue, where upregulated miR-483-5p was found in TRG1 patients (good responder) compared to TRG>1 (poor responder) patients as classified by the Mandard TRG classification [
31]. Similar findings are shown in another study, where this miRNA candidate correlated with chemoradiation response [
32]. It is thought that miR-483 expression may also be linked to
IGF2 and carcinogenesis, possibly making it a potential diagnostic biomarker [
33]
.
The gene ontology annotations for these two miRNAs are shown above and they may play a role in the Wnt and MAPK pathways. miR-483-5p is believed to regulate AKR1C3. The upregulation of hsa-miR-483-5p in responders when compared to non-responders could indicate that the targeting of AKR1C3 is contributing to a better response to the drug, which makes this miRNA a potential clinically useful predictor of response to treatment.
In summary, the additional information from liquid biopsies measured during treatment of LARC is invaluable, as response prediction during chemoradiation may serve to either intensify or de-escalate treatment. This is particularly relevant due to the move toward total neoadjuvant therapy and the watch and wait approach, potential alternatives to shift the traditional paradigm of chemoradiation and surgery [
2,
3].
5. Conclusions
Our data showed that CTCs were present in the vast majority of non-metastatic LARC patients, and fell during chemoradiation, although there was heterogeneity between patients. To our knowledge, this is the first study to report miRNA expression profiles from isolated CTCs in LARC rather than from solid tissue, and we found that expression changes during treatment, with 3 miRNAs being differentially expressed across the 3 time-points, a further 12 miRNAs were differentially expressed in pairwise time-point comparisons. miR-19b-3p and miR-483-5p correlated with good response, the latter also found to be differentially expressed between good responders and poor responders. These findings are largely supportive of the literature and the putative targets of these miRNAs. Thus, they represent potential predictive biomarkers as well as a potential strategy to sensitise tumour cells to treatment.
Supplementary Materials
Supplementary figure S1: Quantile normalisation method on raw and filtered data. Supplementary figure S2: Heatmap of normalized microRNA data. Supplementary table S3: Circulating tumour cell count of the 52 patients at baseline, week 3 and post treatment. These time points have 1, 4, 11 samples missing respectively. Supplementary table S4: Identification of 106 miRNA candidates (*R = Literature review associated with LARC treatment, C = Literature review associated with colorectal cancer, I = data on radiation sensitivity, and P = identified in preliminary study).
Author Contributions
Conceptualization, Stephanie Lim, Wei Chua, Weng Ng, Paul de Souza and Kevin Spring; Data curation, Stephanie Lim, Emilia Ip, Tania Marques, Nham Tran, Margarida Gama-Carvalho, Christopher Henderson, Yafeng Ma and Kevin Spring; Formal analysis, Stephanie Lim, Wei Chua, Weng Ng, Emilia Ip, Tania Marques, Nham Tran, Margarida Gama-Carvalho, Ray Asghari, Christopher Henderson, Yafeng Ma, Paul de Souza and Kevin Spring; Funding acquisition, Wei Chua, Weng Ng, Nham Tran, Ray Asghari, Christopher Henderson and Paul de Souza; Investigation, Stephanie Lim, Wei Chua, Weng Ng, Emilia Ip, Ray Asghari and Paul de Souza; Methodology, Stephanie Lim, Wei Chua, Weng Ng, Tania Marques, Nham Tran, Paul de Souza and Kevin Spring; Project administration, Stephanie Lim, Emilia Ip, Tania Marques, Margarida Gama-Carvalho, Christopher Henderson and Yafeng Ma; Resources, Wei Chua, Weng Ng, Ray Asghari, Christopher Henderson, Paul de Souza and Kevin Spring; Software, Tania Marques, Nham Tran, Margarida Gama-Carvalho, Christopher Henderson and Yafeng Ma; Supervision, Wei Chua, Weng Ng, Nham Tran, Ray Asghari, Paul de Souza and Kevin Spring; Validation, Stephanie Lim, Emilia Ip, Tania Marques, Nham Tran, Margarida Gama-Carvalho, Christopher Henderson and Yafeng Ma; Visualization, Stephanie Lim, Wei Chua, Weng Ng, Emilia Ip, Tania Marques, Nham Tran, Margarida Gama-Carvalho, Ray Asghari, Christopher Henderson, Yafeng Ma, Paul de Souza and Kevin Spring; Writing – original draft, Stephanie Lim, Wei Chua, Weng Ng, Emilia Ip, Tania Marques, Nham Tran, Margarida Gama-Carvalho, Ray Asghari, Christopher Henderson, Yafeng Ma, Paul de Souza and Kevin Spring; Writing – review & editing, Stephanie Lim, Wei Chua, Weng Ng, Emilia Ip, Tania Marques, Nham Tran, Margarida Gama-Carvalho, Ray Asghari, Christopher Henderson, Yafeng Ma, Paul de Souza and Kevin Spring. All authors have read and agreed to the published version of the manuscript.
Funding
This research received no external funding.
Conflicts of Interest
The authors declare no conflict of interest.
References
- Sauer, R., T. Liersch, S. Merkel, R. Fietkau, W. Hohenberger, C. Hess, H. Becker, H.R. Raab, M.T. Villanueva, H. Witzigmann, et al., Preoperative versus postoperative chemoradiotherapy for locally advanced rectal cancer: results of the German CAO/ARO/AIO-94 randomized phase III trial after a median follow-up of 11 years. J Clin Oncol, 2012. 30(16): p. 1926-33. [CrossRef]
- Conroy, T., J.F. Bosset, P.L. Etienne, E. Rio, E. Francois, N. Mesgouez-Nebout, V. Vendrely, X. Artignan, O. Bouche, D. Gargot, et al., Neoadjuvant chemotherapy with FOLFIRINOX and preoperative chemoradiotherapy for patients with locally advanced rectal cancer (UNICANCER-PRODIGE 23): a multicentre, randomised, open-label, phase 3 trial. Lancet Oncol, 2021. 22(5): p. 702-715. [CrossRef]
- Garcia-Aguilar, J., S. Patil, M.J. Gollub, J.K. Kim, J.B. Yuval, H.M. Thompson, F.S. Verheij, D.M. Omer, M. Lee, R.F. Dunne, et al., Organ Preservation in Patients With Rectal Adenocarcinoma Treated With Total Neoadjuvant Therapy. J Clin Oncol, 2022. 40(23): p. 2546-2556. [CrossRef]
- Fokas, E., T. Liersch, R. Fietkau, W. Hohenberger, T. Beissbarth, C. Hess, H. Becker, M. Ghadimi, K. Mrak, S. Merkel, et al., Tumor Regression Grading After Preoperative Chemoradiotherapy for Locally Advanced Rectal Carcinoma Revisited: Updated Results of the CAO/ARO/AIO-94 Trial. J Clin Oncol, 2014. 32(15): p. 1554-62. [CrossRef]
- Parkinson, D.R., N. Dracopoli, B.G. Petty, C. Compton, M. Cristofanilli, A. Deisseroth, D.F. Hayes, G. Kapke, P. Kumar, J. Lee, et al., Considerations in the development of circulating tumor cell technology for clinical use. J Transl Med, 2012. 10: p. 138. [CrossRef]
- Azizian, A., J. Gruber, B.M. Ghadimi, and J. Gaedcke, MicroRNA in rectal cancer. World J Gastrointest Oncol, 2016. 8(5): p. 416-26. [CrossRef]
- Gaedcke, J., M. Grade, J. Camps, R. Sokilde, B. Kaczkowski, A.J. Schetter, M.J. Difilippantonio, C.C. Harris, B.M. Ghadimi, S. Moller, et al., The rectal cancer microRNAome--microRNA expression in rectal cancer and matched normal mucosa. Clin Cancer Res, 2012. 18(18): p. 4919-30. [CrossRef]
- Edge, S.B. and C.C. Compton, The American Joint Committee on Cancer: the 7th edition of the AJCC cancer staging manual and the future of TNM. Ann Surg Oncol, 2010. 17(6): p. 1471-4. [CrossRef]
- Ryan, R., D. Gibbons, J.M. Hyland, D. Treanor, A. White, H.E. Mulcahy, D.P. O'Donoghue, M. Moriarty, D. Fennelly, and K. Sheahan, Pathological response following long-course neoadjuvant chemoradiotherapy for locally advanced rectal cancer. Histopathology, 2005. 47(2): p. 141-6. [CrossRef]
-
Crt, a relative threshold method for qPCR data analysis on the QuantStudio™ 12K Flex system with OpenArray® technology. 2014, Applied Biosystems, Thermo Fisher Scientific Inc.
- Raftery, A., J. Hoeting, C. Volinsky, I. Painter, and K. Yeung, BMA: Bayesian Model Averaging. R package version 3.18.12. 2020.
- Dvinge, H. and P. Bertone, HTqPCR: high-throughput analysis and visualization of quantitative real-time PCR data in R. Bioinformatics, 2009. 25(24): p. 3325-6. [CrossRef]
-
R: A language and environment for statistical computing. R Foundation for Statistical Computing. 2022.
- Durinck, S., Y. Moreau, A. Kasprzyk, S. Davis, B. De Moor, A. Brazma, and W. Huber, BioMart and Bioconductor: a powerful link between biological databases and microarray data analysis. Bioinformatics, 2005. 21(16): p. 3439-40. [CrossRef]
- Ru, Y., K.J. Kechris, B. Tabakoff, P. Hoffman, R.A. Radcliffe, R. Bowler, S. Mahaffey, S. Rossi, G.A. Calin, L. Bemis, et al., The multiMiR R package and database: integration of microRNA-target interactions along with their disease and drug associations. Nucleic Acids Res, 2014. 42(17): p. e133. [CrossRef]
- Novotna, E., N. Bukum, J. Hofman, M. Flaxova, E. Kouklikova, D. Louvarova, and V. Wsol, Aldo-keto reductase 1C3 (AKR1C3): a missing piece of the puzzle in the dinaciclib interaction profile. Arch Toxicol, 2018. 92(9): p. 2845-2857. [CrossRef]
-
High Sensitivity Immunomagnetic CTC Isolation as Compared to Alternative Isolation Methods. 2013, Fluxion Biosciences.
- Baek, D.H., G.H. Kim, G.A. Song, I.S. Han, E.Y. Park, H.S. Kim, H.J. Jo, S.H. Ko, D.Y. Park, and Y.K. Cho, Clinical Potential of Circulating Tumor Cells in Colorectal Cancer: A Prospective Study. Clin Transl Gastroenterol, 2019. 10(7): p. e00055. [CrossRef]
- Sun, W., G. Li, J. Wan, J. Zhu, W. Shen, and Z. Zhang, Circulating tumor cells: A promising marker of predicting tumor response in rectal cancer patients receiving neoadjuvant chemo-radiation therapy. Oncotarget, 2016. 7(43): p. 69507-69517. [CrossRef]
- Galizia, G., M. Gemei, M. Orditura, C. Romano, A. Zamboli, P. Castellano, A. Mabilia, A. Auricchio, F. De Vita, L. Del Vecchio, et al., Postoperative detection of circulating tumor cells predicts tumor recurrence in colorectal cancer patients. J Gastrointest Surg, 2013. 17(10): p. 1809-18. [CrossRef]
- Hinz, S., C. Roder, J. Tepel, A. Hendricks, C. Schafmayer, T. Becker, and H. Kalthoff, Cytokeratin 20 positive circulating tumor cells are a marker for response after neoadjuvant chemoradiation but not for prognosis in patients with rectal cancer. BMC Cancer, 2015. 15(1): p. 953. [CrossRef]
- Kienle, P., M. Koch, F. Autschbach, A. Benner, M. Treiber, M. Wannenmacher, M. von Knebel Doeberitz, M. Buchler, C. Herfarth, and J. Weitz, Decreased detection rate of disseminated tumor cells of rectal cancer patients after preoperative chemoradiation: a first step towards a molecular surrogate marker for neoadjuvant treatment in colorectal cancer. Ann Surg, 2003. 238(3): p. 324-30; discussion 330-1. [CrossRef]
- Magni, E., E. Botteri, P.S. Ravenda, M.C. Cassatella, E. Bertani, A. Chiappa, F. Luca, L. Zorzino, P.P. Bianchi, L. Adamoli, et al., Detection of circulating tumor cells in patients with locally advanced rectal cancer undergoing neoadjuvant therapy followed by curative surgery. Int J Colorectal Dis, 2014. 29(9): p. 1053-9. [CrossRef]
- Bork, U., N.N. Rahbari, S. Scholch, C. Reissfelder, C. Kahlert, M.W. Buchler, J. Weitz, and M. Koch, Circulating tumour cells and outcome in non-metastatic colorectal cancer: a prospective study. Br J Cancer, 2015. 112(8): p. 1306-13. [CrossRef]
- Lim, S.H., K.J. Spring, P. de Souza, S. MacKenzie, and L. Bokey, Circulating tumour cells and circulating nucleic acids as a measure of tumour dissemination in non-metastatic colorectal cancer surgery. Eur J Surg Oncol, 2014. [CrossRef]
- Rubio, J., I. Cristobal, A. Santos, C. Carames, M. Luque, M. Sanz-Alvarez, S. Zazo, J. Madoz-Gurpide, F. Rojo, and J. Garcia-Foncillas, Low MicroRNA-19b Expression Shows a Promising Clinical Impact in Locally Advanced Rectal Cancer. Cancers (Basel), 2021. 13(6). [CrossRef]
- Santos, A., I. Cristobal, J. Rubio, C. Carames, M. Luque, M. Sanz-Alvarez, S. Zazo, J. Madoz-Gurpide, F. Rojo, and J. Garcia-Foncillas, MicroRNA-19b Plays a Key Role in 5-Fluorouracil Resistance and Predicts Tumor Progression in Locally Advanced Rectal Cancer Patients. Int J Mol Sci, 2022. 23(20). [CrossRef]
- Zhang, J., Z. Wang, X. Han, L. Jiang, R. Ge, X. Wang, and J. Li, Up-regulation of microRNA-19b is associated with metastasis and predicts poor prognosis in patients with colorectal cancer. Int J Clin Exp Pathol, 2018. 11(8): p. 3952-3960.
- Sun, T., Y.F. Yin, H.G. Jin, H.R. Liu, and W.C. Tian, Exosomal microRNA-19b targets FBXW7 to promote colorectal cancer stem cell stemness and induce resistance to radiotherapy. Kaohsiung J Med Sci, 2022. 38(2): p. 108-119. [CrossRef]
- Huang, L., J.L. Cai, P.Z. Huang, L. Kang, M.J. Huang, L. Wang, and J.P. Wang, miR19b-3p promotes the growth and metastasis of colorectal cancer via directly targeting ITGB8. Am J Cancer Res, 2017. 7(10): p. 1996-2008.
- Della Vittoria Scarpati, G., F. Falcetta, C. Carlomagno, P. Ubezio, S. Marchini, A. De Stefano, V.K. Singh, M. D'Incalci, S. De Placido, and S. Pepe, A specific miRNA signature correlates with complete pathological response to neoadjuvant chemoradiotherapy in locally advanced rectal cancer. Int J Radiat Oncol Biol Phys, 2012. 83(4): p. 1113-9. [CrossRef]
- Zhu, Y., Q. Peng, Y. Lin, L. Zou, P. Shen, F. Chen, M. Min, L. Shen, J. Chen, and B. Shen, Identification of biomarker microRNAs for predicting the response of colorectal cancer to neoadjuvant chemoradiotherapy based on microRNA regulatory network. Oncotarget, 2017. 8(2): p. 2233-2248. [CrossRef]
- Cui, H., Y. Liu, J. Jiang, Y. Liu, Z. Yang, S. Wu, W. Cao, I.H. Cui, and C. Yu, IGF2-derived miR-483 mediated oncofunction by suppressing DLC-1 and associated with colorectal cancer. Oncotarget, 2016. 7(30): p. 48456-48466. [CrossRef]
|
Disclaimer/Publisher’s Note: The statements, opinions and data contained in all publications are solely those of the individual author(s) and contributor(s) and not of MDPI and/or the editor(s). MDPI and/or the editor(s) disclaim responsibility for any injury to people or property resulting from any ideas, methods, instructions or products referred to in the content. |
© 2023 by the authors. Licensee MDPI, Basel, Switzerland. This article is an open access article distributed under the terms and conditions of the Creative Commons Attribution (CC BY) license (http://creativecommons.org/licenses/by/4.0/).
