Submitted:
26 June 2023
Posted:
26 June 2023
You are already at the latest version
Abstract
Keywords:
1. Introduction
2. Materials and Methods
2.1. Materials
2.2. Methods
2.3. Characterization
2.3.1. Characterization of the original PP foams
2.3.2. Foam morphology
2.3.3. Differential scanning calorimetry (DSC)
2.3.4. Poisson’s ratio
2.3.5. Mechanical properties
3. Results and discussions
3.1. Physical properties of the PP recycled foams
| Foam code | Density (kg/m3) | Porosity (%) | OCP (%) |
|---|---|---|---|
| PP-O | 28.0±1.1 | 97.1±3.0 | 3.1 |
| PP-T130-15-P1.0 | 114.3±1.4 | 87.6±5.2 | 4.1 |
| PP-T130-15-P2.0 | 116.4±1.5 | 86.8±2.7 | 4.3 |
| PP-T130-15-P3.0 | 130.1±1.5 | 85.8±2.6 | 4.5 |
| PP-T130-15-P4.0 | 131.3±1.6 | 85.5±2.7 | 5.2 |
| PP-T120-15-P3.0 | 90.1±1.8 | 89.5±4.2 | 4.0 |
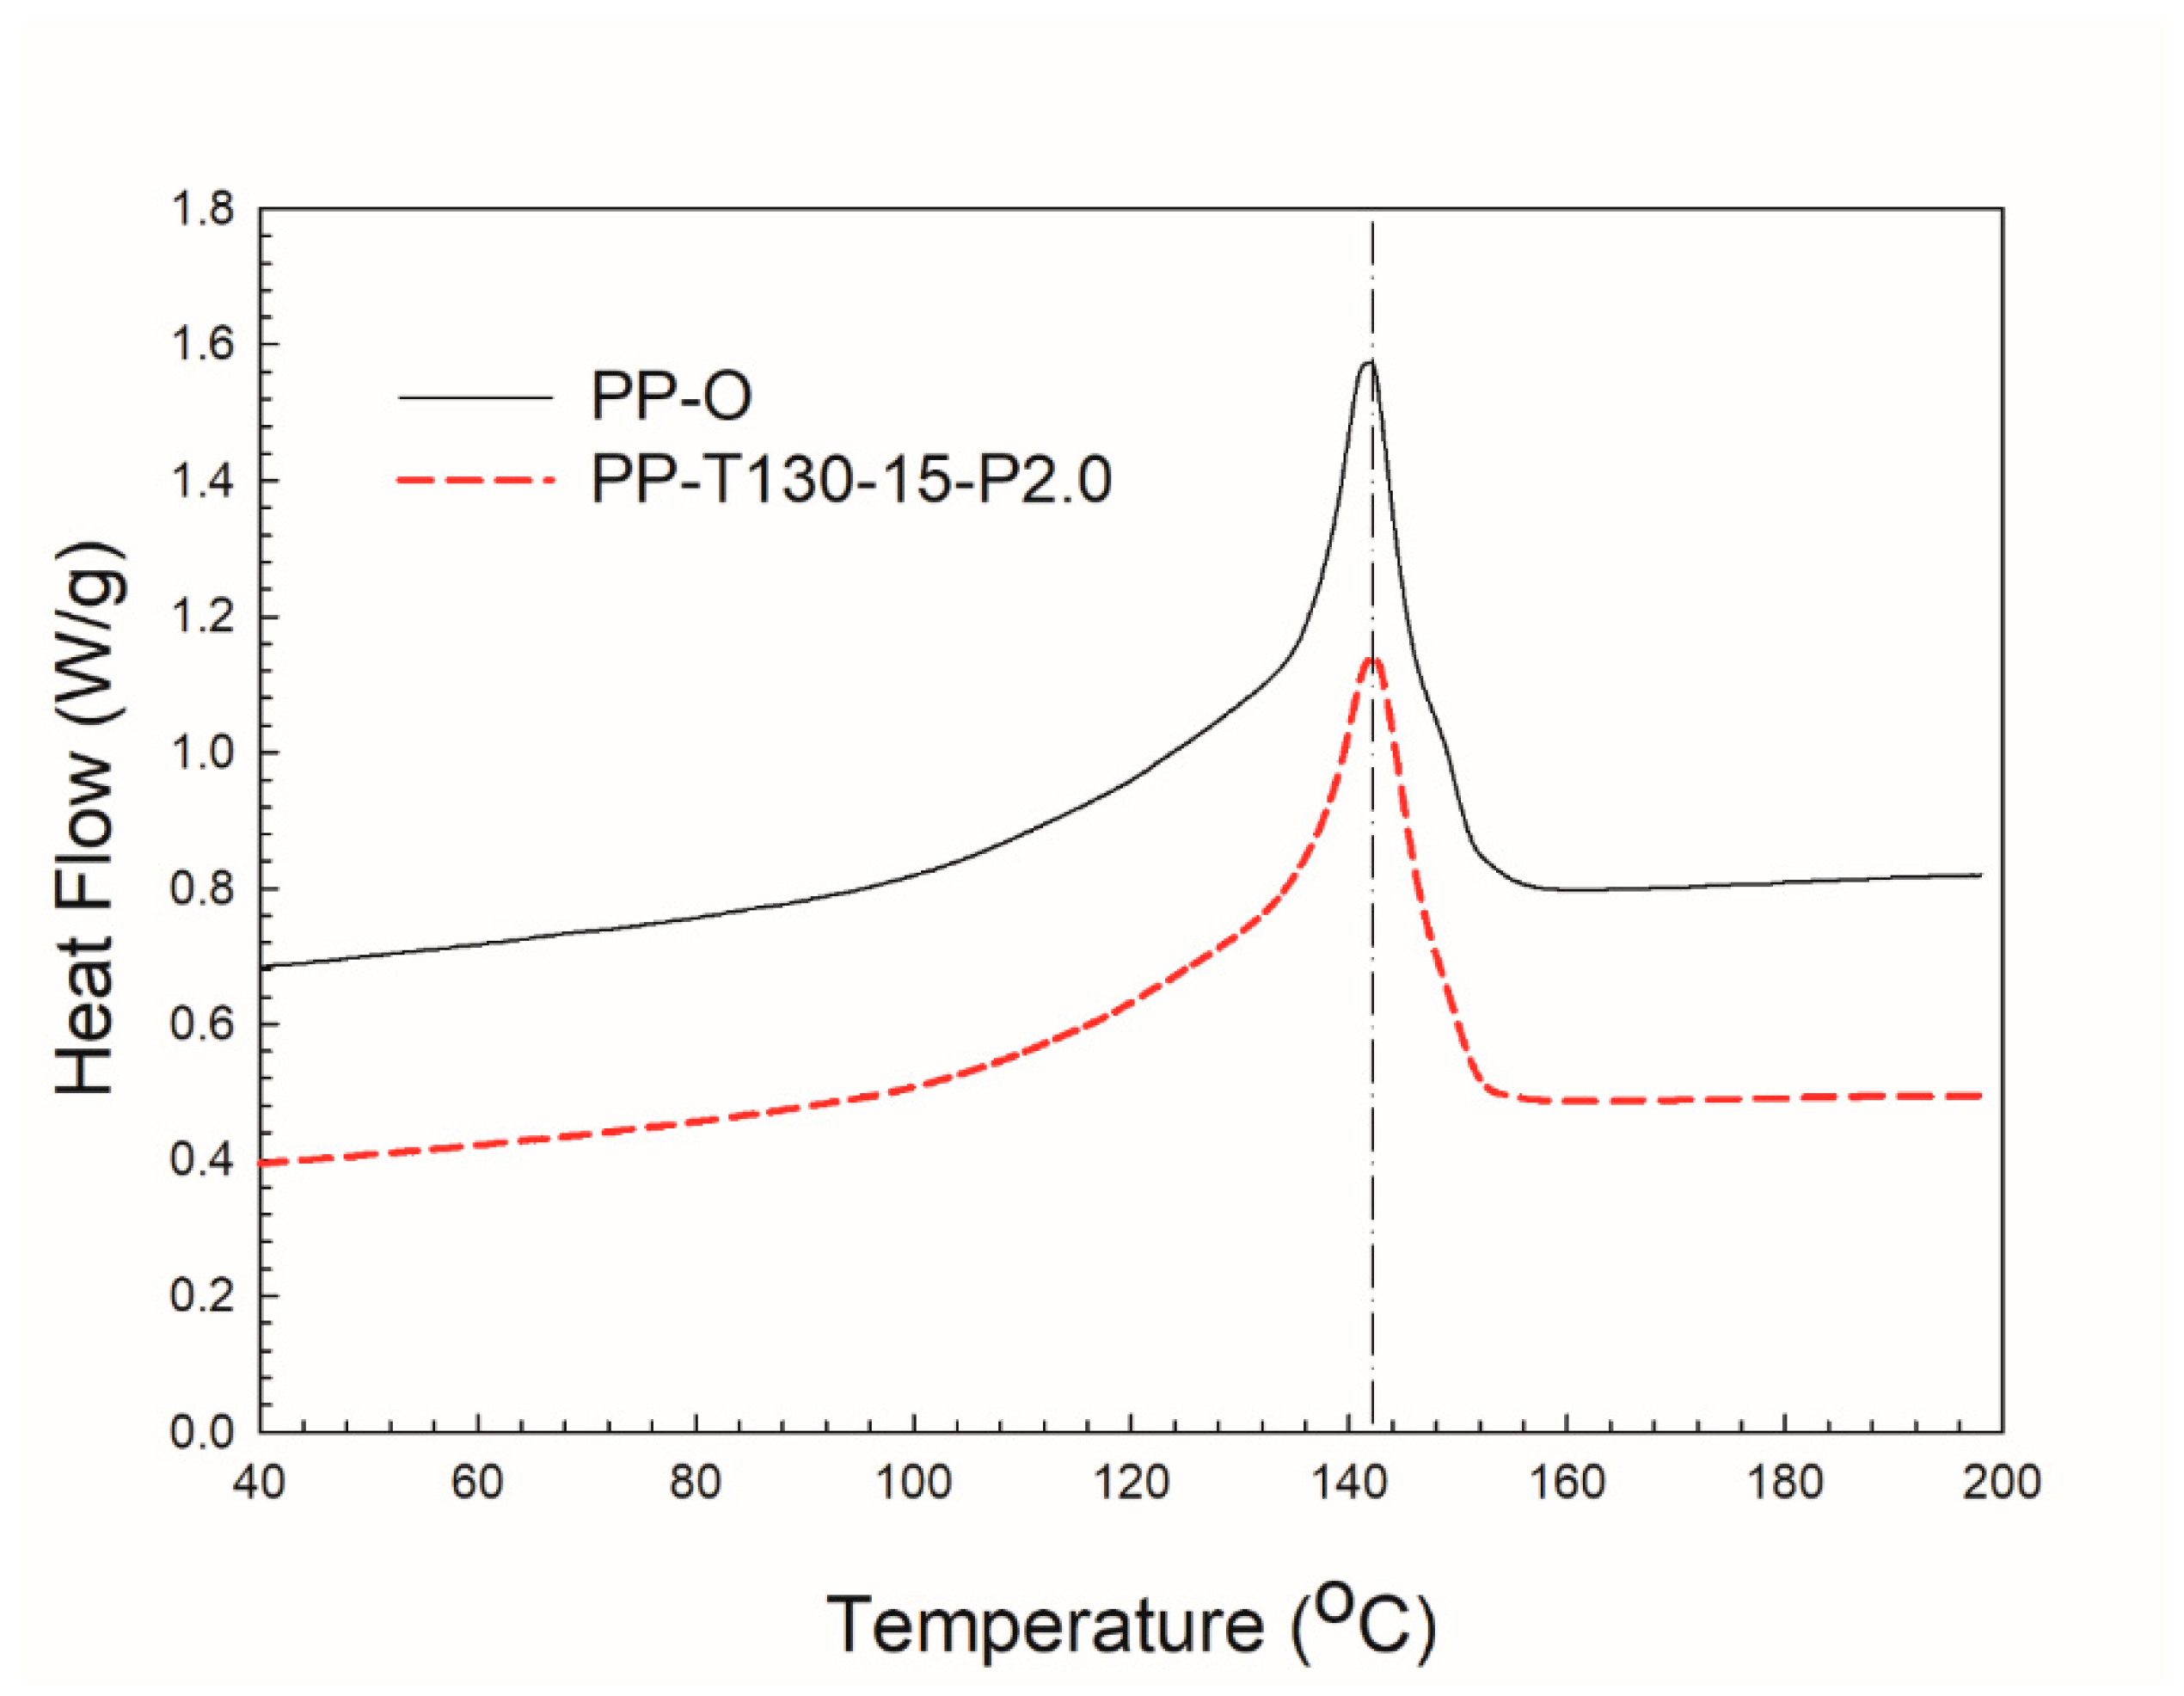
| Sample | Tm (oC) | △Hm (J/g) | Xc (%) |
|---|---|---|---|
| Initial PP foam (PP-O) | 141.7 | 83.2 | 39.8 |
| Auxetic foam (PP-T130-15-P2.0) | 142.1 | 74.0 | 35.8 |
3.2. Auxetic foams
3.2.1. Morphology
3.2.2. Poisson’s ratio
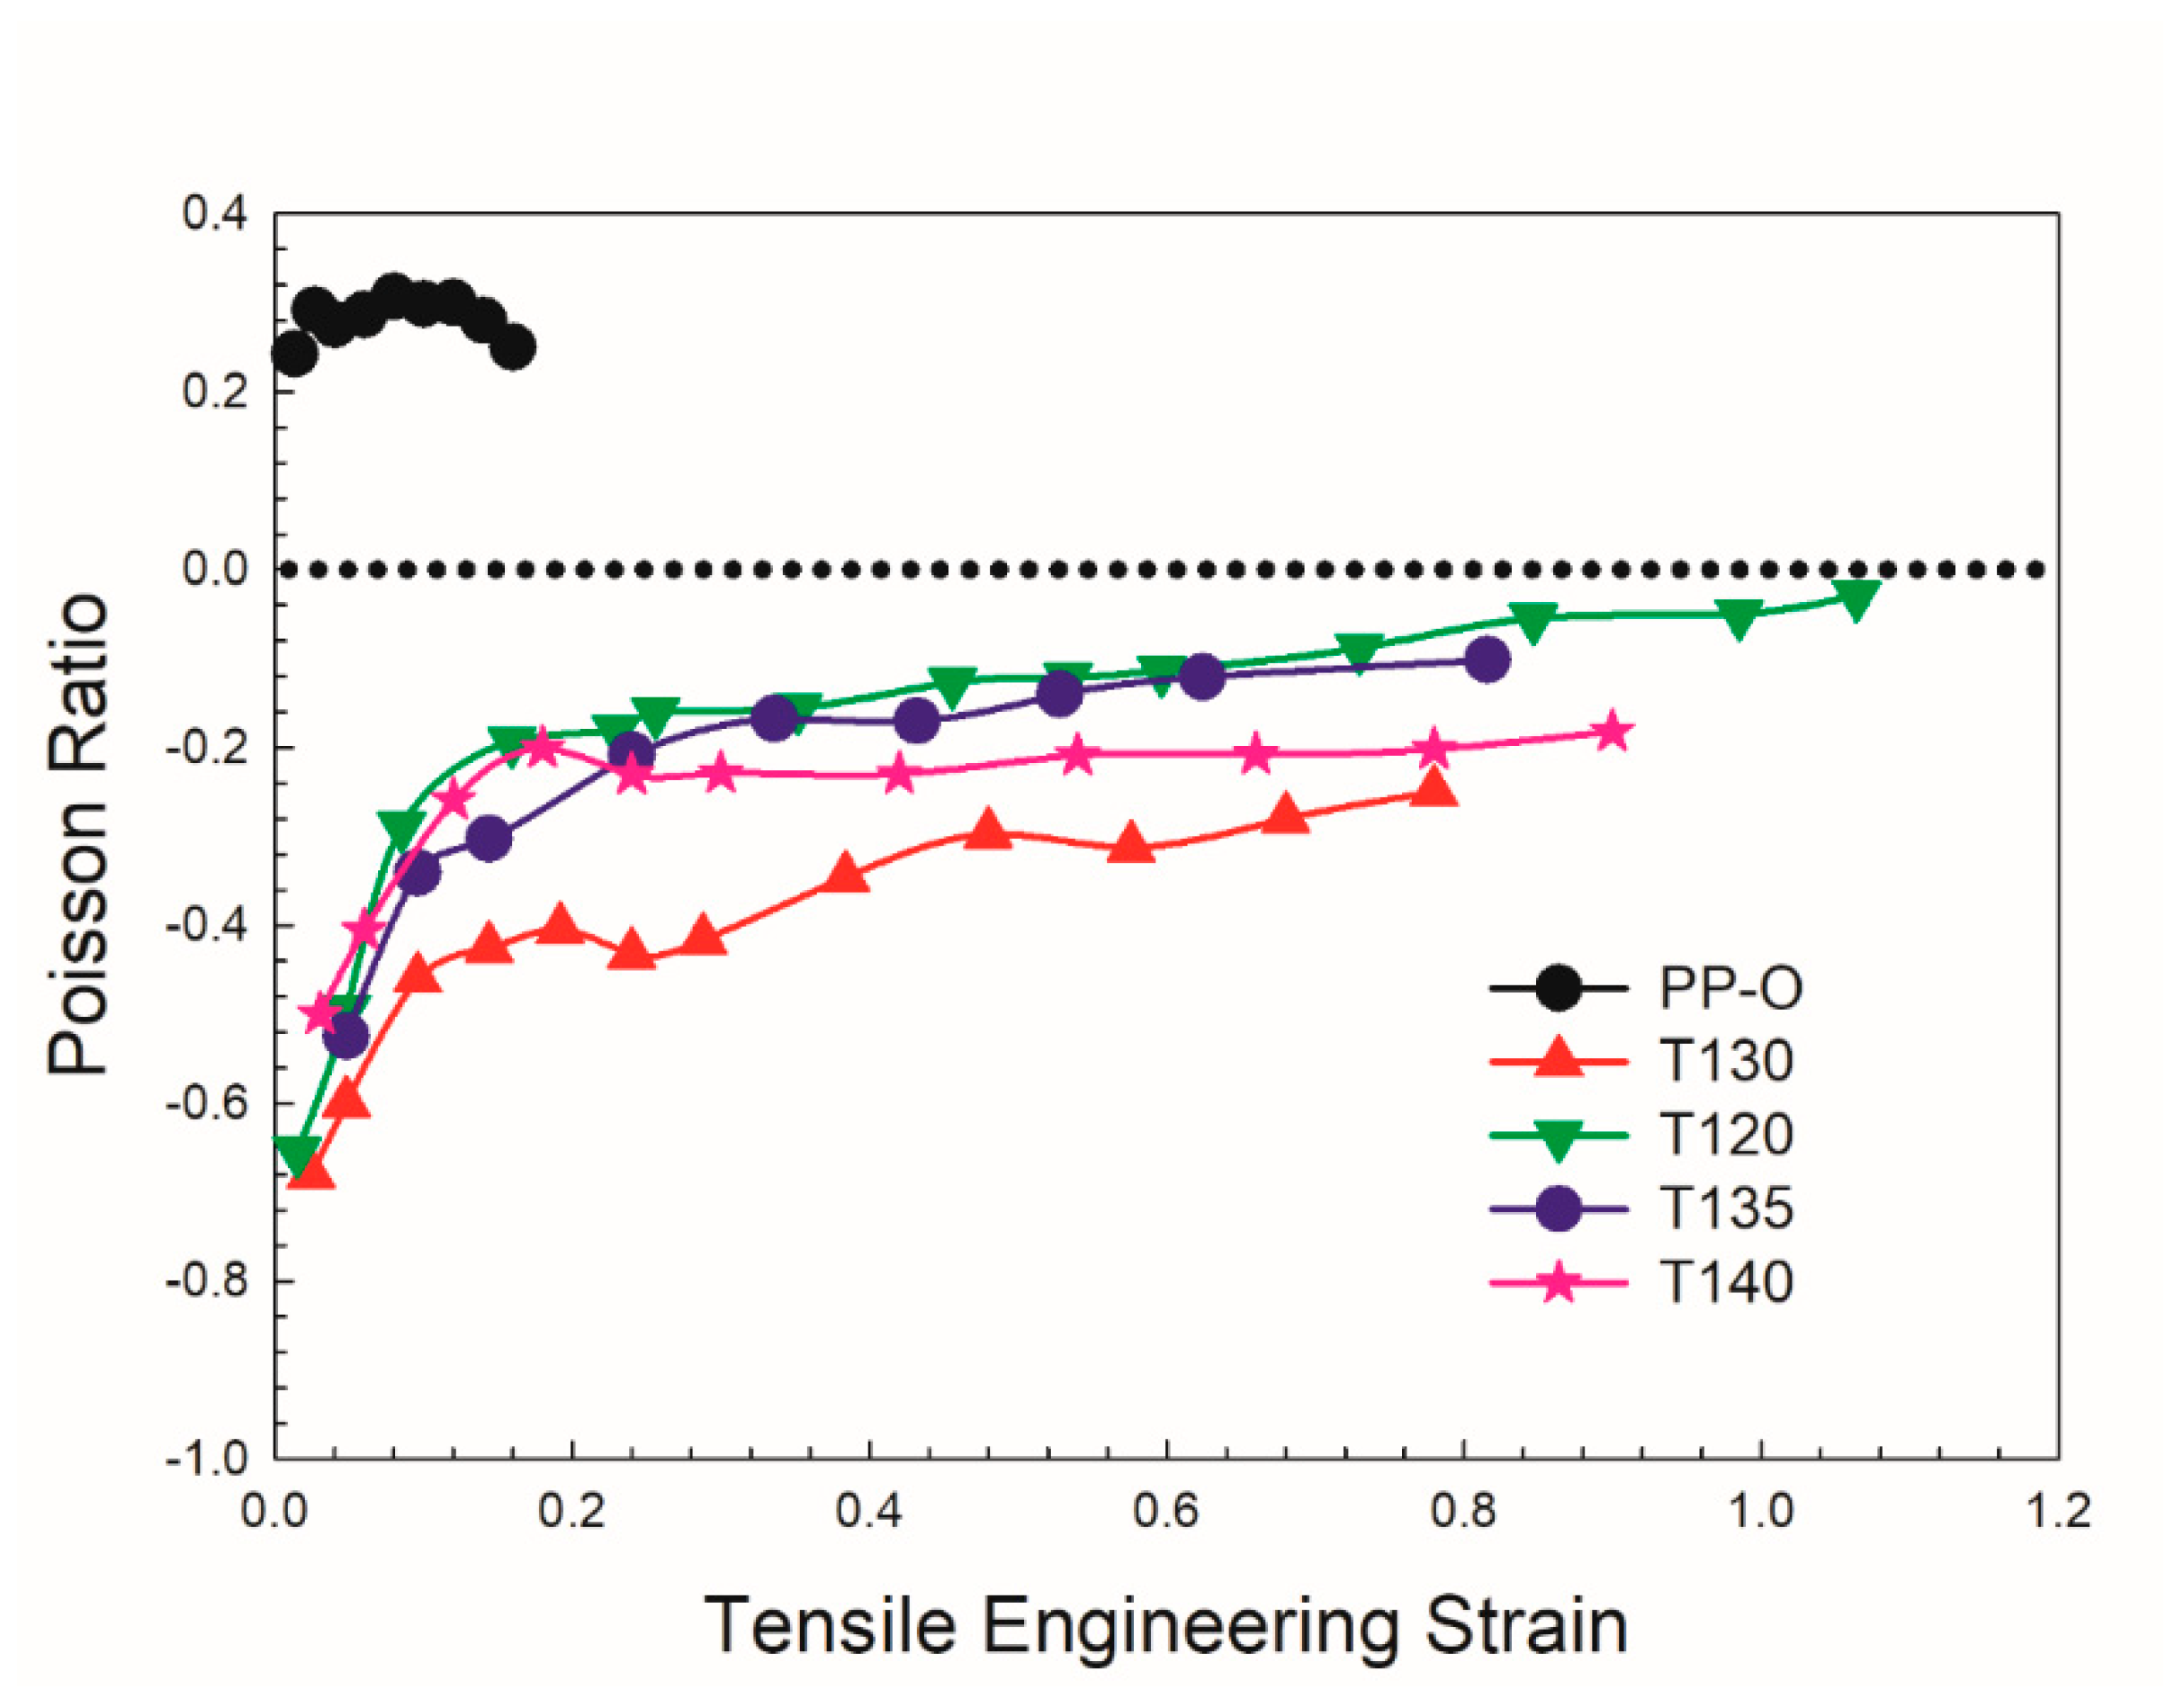
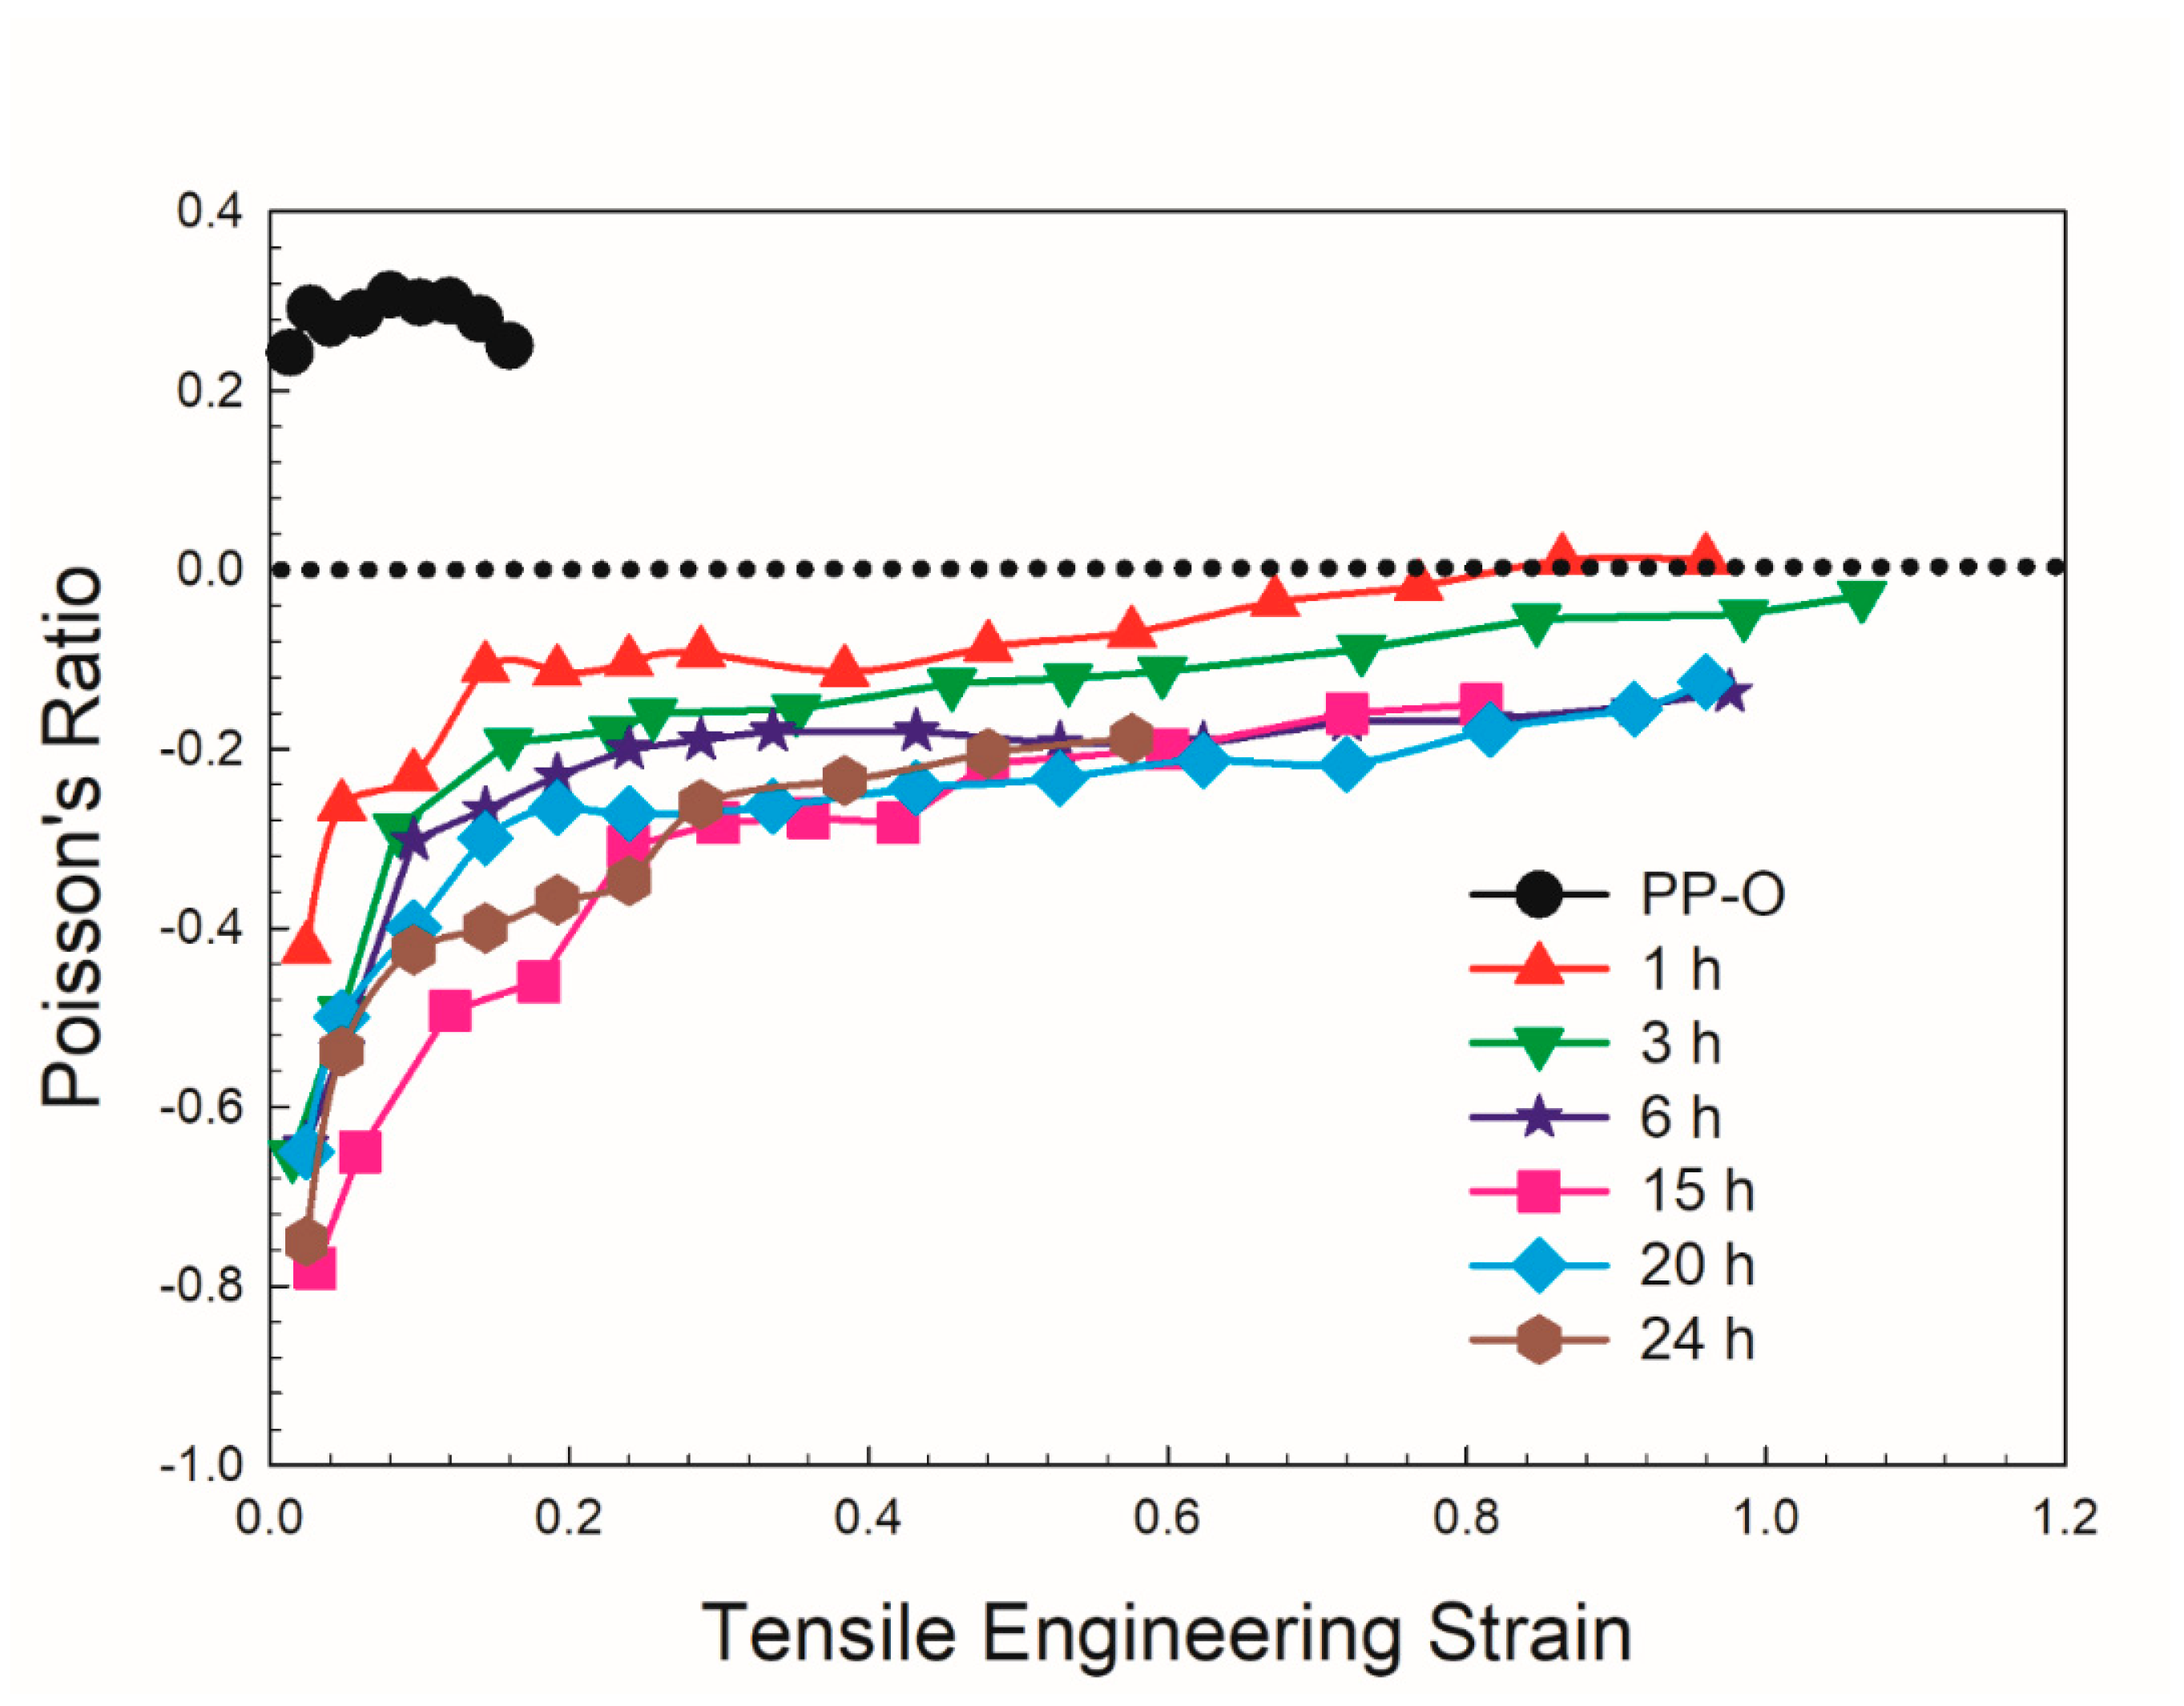
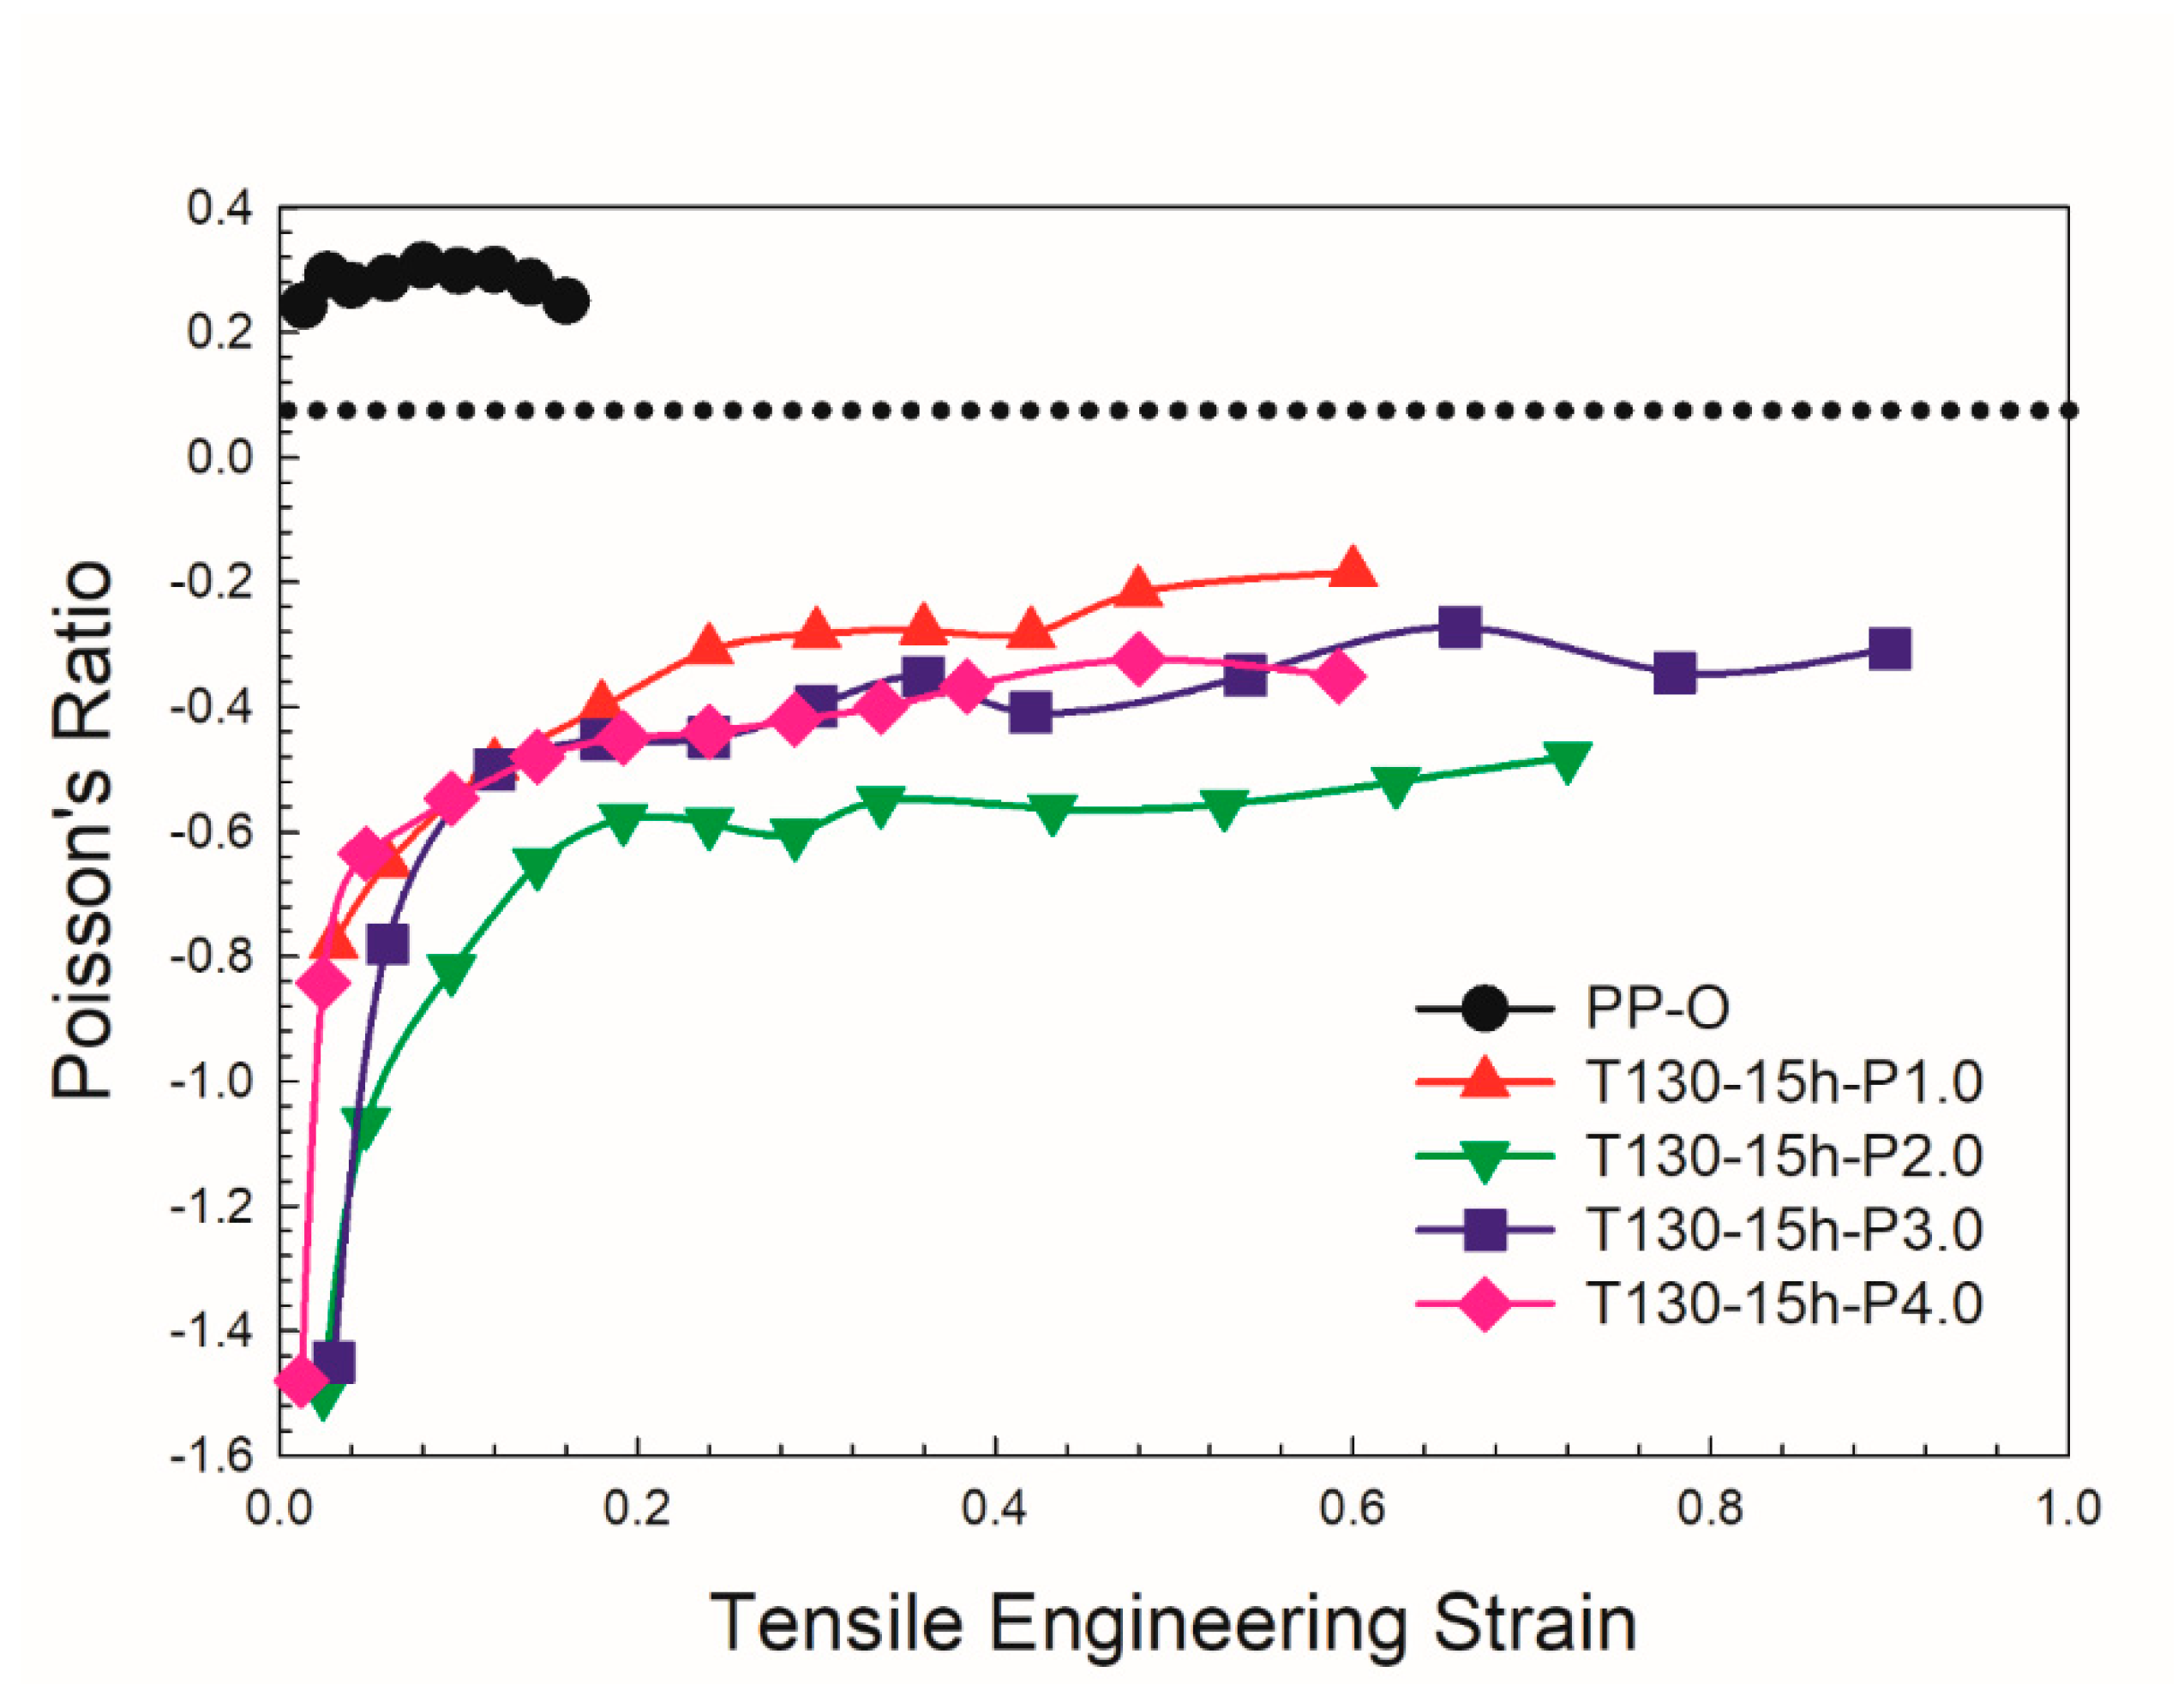

| Sample | Final density (kg/m3) | Compression ratio (⍴f/⍴o) | Minimum PR (tension) | Minimum PR (compression) |
|---|---|---|---|---|
| PP-O | 28.0 | 1 | 0.28 (mean) | 0.008 (mean) |
| PP-T130-15-P1.0 | 114 | 4.07 | –0.78 | –0.28 |
| PP-T130-15-P2.0 | 116 | 4.14 | –1.50 | –0.32 |
| PP-T130-15-P3.0 | 130 | 4.64 | –1.45 | –0.08 |
| PP-T130-15-P4.0 | 131 | 4.68 | –1.48 | –0.02 |
3.2.4. Mechanical properties
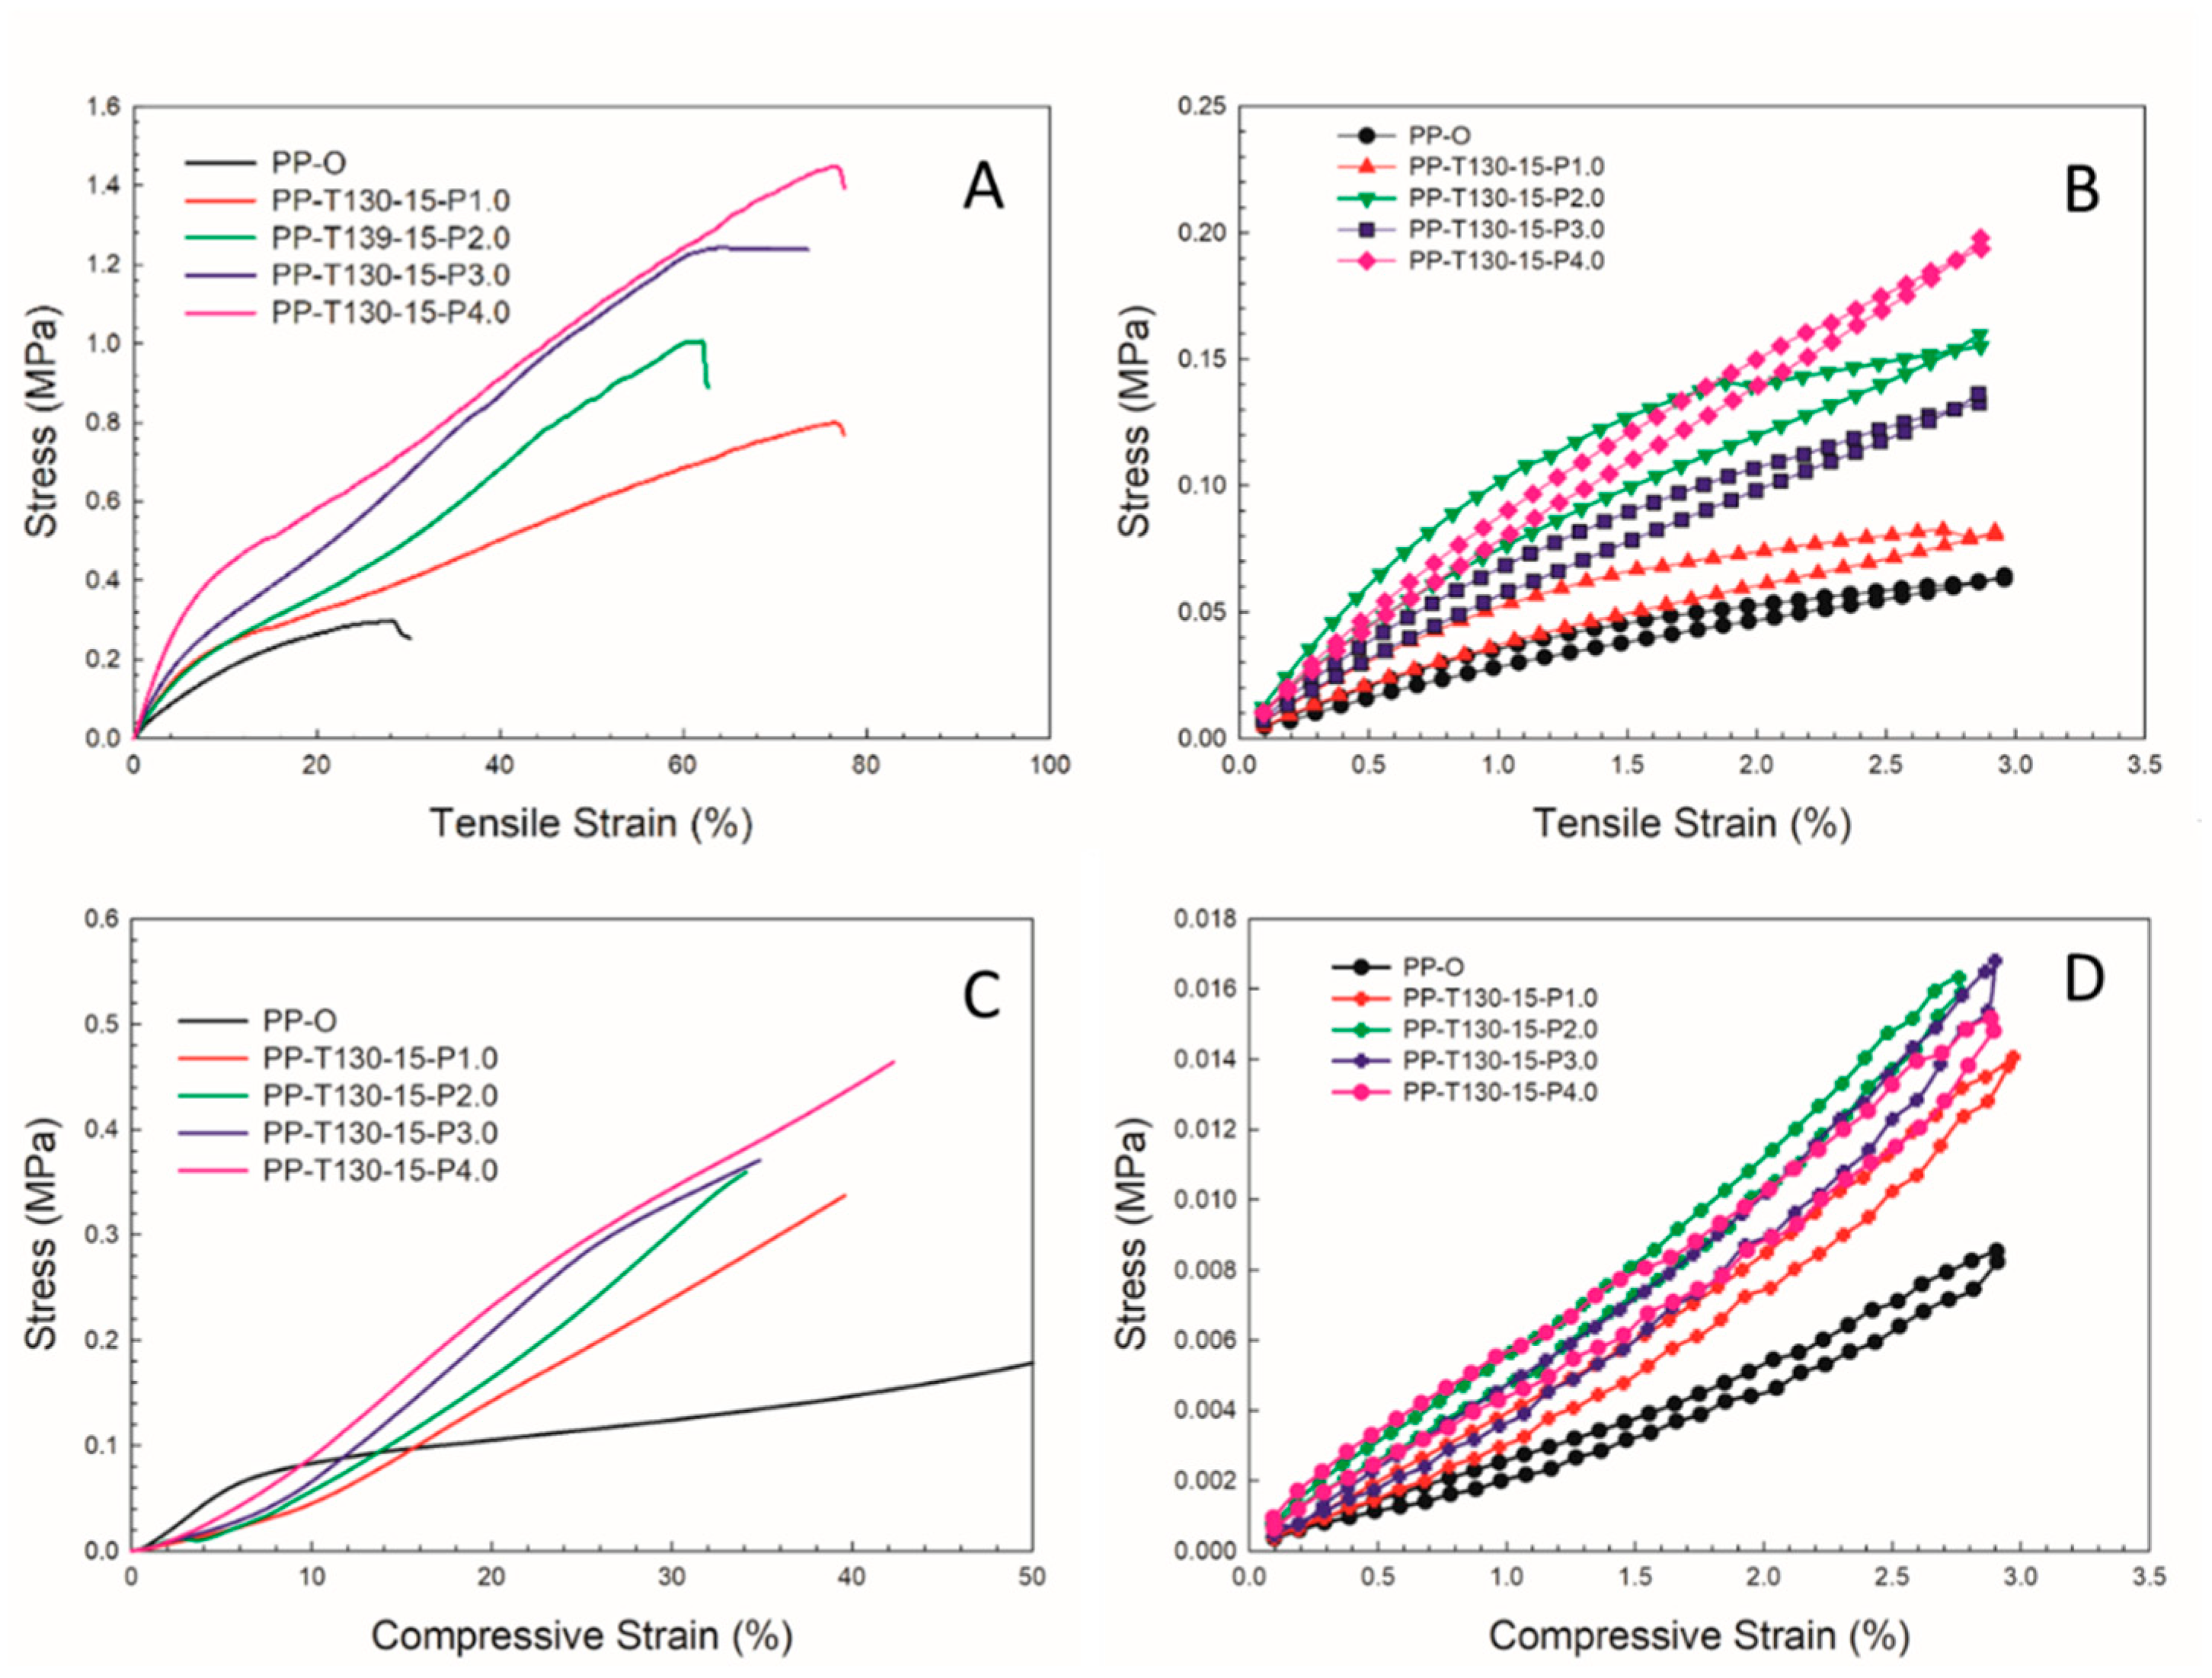
| Samples | Density (kg/m3) |
Tension | Compression | ||||
|---|---|---|---|---|---|---|---|
| Modulus (kPa) | Strength (MPa) |
Strain at break (%) |
Energy at break (MPa) |
Modulus (kPa) | Stress at 30% strain (kPa) | ||
| PP-O | 28.0 | 21.9±2.8 | 0.30±0.07 | 28.1±3.2 | 6.10±0.61 | 10.8±2.5 | 125±43 |
| PP-T130-15-P1.0 | 114 | 35.2±2.9 | 0.80±0.08 | 62.0±6.1 | 34.5±1.2 | 2.52±4.5 | 247±39 |
| PP-T130-15-P2.0 | 116 | 40.3±7.3 | 1.00±0.09 | 76.7±5.8 | 37.5±2,6 | 2.72±4.9 | 308±41 |
| PP-T130-15-P3.0 | 130 | 44.4±8.3 | 1.24±0.07 | 70.2±7.2 | 57.0±4.3 | 4.63±5.3 | 331±38 |
| PP-T130-15-P4.0 | 131 | 51.1±6.9 | 1.43±0.08 | 72.9±6.9 | 68.1±5.4 | 8.06±6.7 | 349±39 |
| Sample | Tension | Compression | ||||
|---|---|---|---|---|---|---|
| Strain energy (Ep) (kPa) | Energy loss (Ed) (mJ/cm3) |
Damping capacity (Ψ) (%) | Strain energy (Ep) (kPa) | Energy loss (Ed) (mJ/cm3) |
Damping capacity (Ψ) (%) | |
| PP-O | 120 | 14.4 | 12.0 | 11.5 | 1.56 | 13.6 |
| PP-T130-15-P1.0 | 170 | 21.5 | 12.6 | 15.3 | 3.60 | 18.7 |
| PP-T130-15-P2.0 | 166 | 31.7 | 19.2 | 19.8 | 1.97 | 10.0 |
| PP-T130-15-P3.0 | 316 | 39.5 | 12.5 | 18.8 | 2.00 | 10.7 |
| PP-T130-15-P4.0 | 309 | 50.3 | 16.2 | 19.0 | 3.34 | 17.5 |
4. Conclusions
Acknowledgments
References
- Yang, C.; Zhang, Q.; Zhang, W.; et al. High thermal insulation and compressive strength polypropylene microcellular foams with honeycomb structure. Polym. Degrad. Stabil. 2021, 183, 109406. [Google Scholar] [CrossRef]
- Lee, Y.S.; Park, N.H.; Yoon, H.S. Dynamic Mechanical Characteristics of Expanded Polypropylene Foams. J. Cell. Plast. 2010, 46, 43–55. [Google Scholar]
- Polypropylene Foam Market Size, Share & Trends Analysis, By Type (Expanded polypropylene (EPP) foams, Extruded polypropylene (XPP) foams, Type (Density Basis)), By End Use (Automotive, Packaging, Consumer products), By Region and Forecast Period 2023–2030. https://straitsresearch.com/report/polypropylene-foam-market (access on 10 may,2023).
- Meran, C.; Ozturk, O.; Yuksel, M. Examination of the possibility of recycling and utilizing recycled polyethylene and polypropylene. Mater. Des. 2008, 29, 701–705. [Google Scholar] [CrossRef]
- Corvaglla, P.; Passaro, A.; Manni, O.; Barone, L. Recycling of PP-based Sandwich Panels with Continuous Fiber Composite Skins. J. Thermoplast. Compos. Mater. 2006, 19, 731–745. [Google Scholar] [CrossRef]
- Hamdi, O.; Rodrigue, D. Auxetic Polymer Foams: Production, Modeling and Applications. Curr. Appl. Polym. Sci. 2021, 4, 159–174. [Google Scholar] [CrossRef]
- Chen, X.Y.; Hamdi, O.; Rodrigue, D. Conversion of low-density polyethylene foams into auxetic metamaterials. Polym Adv Technol. 2023, 34, 228–237. [Google Scholar] [CrossRef]
- Chen, X.Y.; Underhill, R.S.; Rodrigue, D. A Simple Method to Convert Cellular Polymers into Auxetic Metamaterials. Appl. Sci. 2023, 13, 1148. [Google Scholar] [CrossRef]
- Chen, X.Y.; Rodrigue, D. Conversion of polystyrene foams into auxetic metamaterials. Polym Eng Sci. 2023, 1–11. [Google Scholar] [CrossRef]
- Bianchi, M.; Scarpa, F.; Banse, M.; Smith, C.W. Novel generation of auxetic open cell foams for curved and arbitrary shapes. Acta. Mater., 2011, 59, 686–691. [Google Scholar] [CrossRef]
- Bianchi, M.; Scarpa, F.; Smith, C.W. Stiffness and energy dissipation in polyurethane auxetic foams. J. Mater. Sci. 2008, 43, 5851. [Google Scholar] [CrossRef]
- Bianchi, M.; Scarpa, F.; Smith, C.W. Shape memory behaviour in auxetic foams: Mechanical properties. Acta Mater 2010, 58, 858–865. [Google Scholar] [CrossRef]
- Bianchi, M.; Frontoni, F.; Scarpa, F.; C. W. Smith, Density change during the manufacturing process of PU–PE open cell auxetic foams. Phys. Status Solidi B, 2011, 248, 30–38. [Google Scholar] [CrossRef]
- Zhang, Q.; Lu, W.; Scarpa, F.; et al. Large stiffness thermoformed open cell foams with auxeticity. Appl. Mater. Today, 2020, 20, 100775. [Google Scholar] [CrossRef]
- Zhang, Q.; Lu, W.; Scarpa, F.; et al. Topological characteristics and mechanical properties of uniaxially thermoformed auxetic foam. Mater. Des. 2021, 211, 110139. [Google Scholar] [CrossRef]
- Zhang, Q.; Yu, X.; Scarpa, F.; et al. Anisotropy in conventional and uniaxially thermoformed auxetic polymer foams. Composites Part B 2022, 237, 109849. [Google Scholar] [CrossRef]
- Duncan, O.; Allen,T. ; Birch, A.; et al. Effect of steam conversion on the cellular structure, Young’s modulus and negative Poisson’s ratio of closed-cell foam. Smart Mater. Struct. 2020, 30, 015031. [Google Scholar] [CrossRef]
- Duncan, O.; Leslie1, G.; Moyle, S.; et al. Developments on auxetic closed cell foam pressure vessel fabrications. Smart Mater. Struct. 2022, 31, 074002. [Google Scholar] [CrossRef]
- Fan, D.; Li, M.; Qiu, J.; et al. Novel Method for Preparing Auxetic Foam from Closed-Cell Polymer Foam Based on the Steam Penetration and Condensation Process. ACS. Appl. Mater. Interfaces 2018, 10, 22669–22677. [Google Scholar] [CrossRef]
- Martz, E.O.; Lee, T.; Lakes, R.S.; et al. Re-entrant transformation of methods in closed cell foams. Cellular Polymers 1996, 15, 229–249. [Google Scholar]
- Lakes, R. Foam structures with a negative Poisson’s ratio. Science 1987, 235, 1038–1040. [Google Scholar] [CrossRef]
- Li, N.; Liu, Z.; Shi, X.; et al. Preparing Polypropylene Auxetic Foam by a One-Pot CO2 Foaming Process. Adv. Eng. Mater. 2022, 24, 2100859. [Google Scholar] [CrossRef]
- Chirima, G.; Ravirala, N.; Rawal, A.; et al. The effect of processing parameters on the fabrication of auxetic extruded polypropylene films. Phys. Stat. Sol. (b) 2008, 245, 2383–2390. [Google Scholar] [CrossRef]
- Alderson, K.; Nazaré, S.; Alderson, A. Large-scale extrusion of auxetic polypropylene fiber. Phys. Status. Solid. (b) 2016, 253, 1279–1287. [Google Scholar]
- Gee, D.R. and Melia, T.P. Thermal Properties of melt and solution crystallized isotactic polypropylene. Makromol. Chem. 1970, 132, 195. [Google Scholar] [CrossRef]
- Critchley, R. Corni, I.;Wharton, J.A.; et al. A review of the manufacture, mechanical properties and potential applications of auxetic foams. Phys. Status. Solid. 2013, 250, 1963. [Google Scholar] [CrossRef]
- Frioui, N.; Bezazi, A.; Remillat, C.; et al. Viscoelastic and compression fatigue properties of closed cell PVDF foam. Mech. Mater 2010, 42, 189. [Google Scholar] [CrossRef]
- Belaadi, A.; Bezazi, A.; Bourchak, M.; Scarpa, F. Tensile static and fatigue behaviour of sisal fibres. Mater. Des. 2012, 46, 76–83. [Google Scholar] [CrossRef]
- Panin, S.V.; Bogdanov, A.A.; Eremin, A.V.; et al. Estimating Low- and High-Cyclic Fatigue of Polyimide-CF-PTFE Composite through Variation of Mechanical Hysteresis Loops. Materials 2022, 15, 4656. [Google Scholar] [CrossRef]
- Andena, L.; Caimmi, F.; Leonardi, L.; Nacucchi, M. and De Pascalis, F. Compression of polystyrene and polypropylene foams for energy absorption applications: A combined mechanical and microstructural study. J. Cell. Plast. 2019, 55, 49–72. [Google Scholar] [CrossRef]
- Rinde, J.A. Poisson’s Ratio for Rigid Plastic Foams. J. Appl. Polym. Sci. 1970, 14, 1913–1926. [Google Scholar] [CrossRef]
- Caddock, B.D.; Evans, K.E. Microporous materials with negative Poisson’s ratios. I. Microstructure and mechanical properties. J. Phys. D. Appl. Phys. 1989, 22, 1877–1882. [Google Scholar] [CrossRef]
- Choi, J.B. and Lakes, R.S. Nonlinear properties of polymer cellular materials with a negative Poisson’s ratio. J. Materials Science 1992, 27, 4678–4684. [Google Scholar] [CrossRef]
- Lisiecki, J.; Błażejewicz, T.; Kłysz, S.; et al. Tests of polyurethane foams with negative Poisson’s ratio. Phys. Stat. Sol. B. 2013, 250, 250,1988–1995. [Google Scholar] [CrossRef]
- Li, D.W.; Zhou, L.W.; Wang, X.; He, L.J.; Yang, X. Effect of crystallinity of polyethylene with different densities on breakdown strength and conductance property. Materials. 2019, 12, 1746. [Google Scholar] [CrossRef] [PubMed]
- Bezazi, A.; Scarpa, F. Tensile fatigue of conventional and negative Poisson’s ratio open cell PU foams. Int J Fatigue. 2009, 31, 488–494. [Google Scholar] [CrossRef]
- Bianchi, M.; Scarpa, F.; Smith, C.W. Shape memory behaviour in auxetic foams: mechanical properties. Acta Mater. 2010, 58, 858–865. [Google Scholar] [CrossRef]
- Zhang, Y.L.; Rodrigue, D.; Ait-Kadi, A. High density polyethylene Foams. II. Elastic modulus. J Appl Polym Sci. 2003, 90, 2130–2138. [Google Scholar] [CrossRef]
Disclaimer/Publisher’s Note: The statements, opinions and data contained in all publications are solely those of the individual author(s) and contributor(s) and not of MDPI and/or the editor(s). MDPI and/or the editor(s) disclaim responsibility for any injury to people or property resulting from any ideas, methods, instructions or products referred to in the content. |
© 2023 by the authors. Licensee MDPI, Basel, Switzerland. This article is an open access article distributed under the terms and conditions of the Creative Commons Attribution (CC BY) license (http://creativecommons.org/licenses/by/4.0/).


