
Submitted:
27 June 2023
Posted:
27 June 2023
You are already at the latest version
Abstract
Diet modification may be a potential contributor in the prevention of age-related cognitive decline. The association between dairy product consumption and cognitive function remains unknown in older people. We investigated whether cheese intake is associated with lower cognitive function (LCF) in community-dwelling older adults. This cross-sectional study included 1503 adults aged over 65 years. Analyzed data were obtained from face-to-face interviews and functional ability measurement. Cognitive function was assessed using mini-mental state examination (MMSE), and a score ≤ 23 was defined as LCF. The prevalence of LCF was 4.6% and this group had smaller calf circumference, slower usual walking speed, and more frequent history of anemia than subjects with MMSE scores ≥ 24. After adjusting for confounding factors, logistic regression analysis revealed cheese intake (odds ratio (OR) = 0.404, 95% confidence interval (CI) = 0.198-0.824), age (OR = 1.170, 95% CI = 1.089-1.256), usual walking speed (OR = 0.171, 95% CI = 0.062-0.472) and calf circumference (OR = 0.823, 95% CI = 0.747-0.908) as significant factors associated with LCF. Although the present study was an analysis of cross-sectional data of Japanese community-dwelling older adults, the results suggest that cheese intake is inversely associated with LCF.
Keywords:
dairy product consumption
; mini-mental state examination score
; lower cognitive function
1. Introduction
Dementia prevention and treatment are the major strategies for achieving healthy longevity. The older population with dementia as well as the percentage of people requiring nursing care due to dementia continue to increase, and dementia prevention has become an urgent issue [1,2].
Efficient prevention of dementia requires preservation of a level of cognitive function as high as possible and prevention of cognitive decline as early as possible. A variety of information obtained from longitudinal and cross-sectional research provides insight on the factors that affect cognitive function. A synopsis of the results of previous studies has indicated that physical activity, consumption of a Mediterranean diet, dairy intake at midlife, and moderate consumption of wine are effective in delaying or preventing dementia and cognitive decline [3,4,5,6]. On the other hand, a history of diabetes, vitamin K or vitamin D deficiency, elevated D-type amino acids, and frailty are known factors that promote dementia and cognitive decline [7,8,9,10,11].
In particular, there is an increase in interest on the relationship between food intake and cognitive function. Previous studies have shown that a dietary pattern of high intake of soybean products, vegetables, seaweed, milk and dairy products, together with low intake of grain products is associated with reduced risk of developing dementia [12], and high intake of milk and dairy products reduces the risk of developing dementia, especially Alzheimer’s dementia [13]. de Goeij et al [14] reported that cheese intake was associated with information processing speed but not with memory, and pointed out a possibility that the influence may differ depending on the cognitive function subscale. Suzuki et al [15] conducted a randomized controlled study, in which older women with mild cognitive impairment consumed matured cheese for 3 months, and they reported a significant increase in brain-derived neurotrophic factor level but no significant change in Mini-Mental State Examination (MMSE) score [16]. Ni et al [17] analyzed 2-year follow-up data on the association between dairy product intake and changes in cognitive function, and found no association of low-fat milk, yogurt, cheese or fermented dairy intake with changes in cognitive performance. The results of the association between dairy product intake and cognitive function obtained from observational and/or intervention studies differ among studies. Moreover, Lee et al [18] concluded that existing evidence is not sufficient to arrive at a concrete conclusion that milk and dairy product intake contributes to reduce the risk of cognitive decline. Further studies are needed to determine the role of dairy intake on outcomes of cognitive function in older adults.
The purpose of this study was to elucidate the relationship between cheese intake and cognitive function evaluated by MMSE score in community-dwelling older people, using cross-sectional data.
2. Materials and Methods
2.1. Subjects
This study analyzed the cross-sectional data of two cohorts. Cohort 1 consisted of 759 people in a previous 2017 cohort (see below for details), who participated in the follow-up survey in 2019. The data of this cohort at the 2019 survey was used as the cross-sectional data for this study. Cohort 2 consisted of 757 people who participated in a new cohort survey in 2019. The total number of subjects was 1,516. The recruitment processes for the two cohorts are described below.
Cohort 1: This cross-sectional study utilized data from a cohort study of subjects participating in comprehensive health examination, “The Otassha Study 2017 Cohort”, conducted at the Tokyo Metropolitan Institute of Gerontology [19]. Older women aged 65 years or older living in Itabashi, Tokyo, Japan were recruited using the Basic Resident Register (n = 6788) in 2017. After excluding 422 women who participated in another cohort study, we sent out invitation letters to 6366 candidates. A total of 1365 women participated in the health examination in 2017. Of these subjects, 759 women (55.6%) completed the follow-up examination in 2019.
Cohort 2: This study recruited volunteer participants from 18 neighborhoods near the Tokyo Metropolitan Institute of Gerontology, Itabashi, Tokyo, Japan. In 2019, the names and addresses of all individuals aged 75-85 years registered in the Basic Resident Registry for this area were extracted (n = 4233). After eliminating 88 participants who had been enrolled in other cohorts, invitations were sent to 4145 candidates. In total, 757 individuals (275 men and 482 women) participated in this study. Out of 1516 subjects in two cohorts, 1504 subjects with no missing values for cheese intake and MMSE were analyzed.
The study protocol was approved by the Clinical Research Ethics Committee of Tokyo Metropolitan Institute of Gerontology (TMIG) (ID R2-25 and R2-18). Procedures were fully explained to all participants, and written informed consent was obtained.
2.2. Outcome Measures
Interview. Face-to-face interviews were conducted to assess a history of falls, urinary incontinence, frequencies of food intake (cheese, milk, fish, meat, egg, soy products, potatoes, fruit, seaweed, green and yellow vegetables, fats and oils), and chronic conditions such as a history of heart disease, hyperlipidemia, dyslipidemia, diabetes, osteoporosis, osteoarthritis (OA), anemia and others. Dietary variety score was calculated from the intake frequencies of 9 food categories (fish, meat, egg, soy products, potatoes, fruit, seaweed, green and yellow vegetables, and fats and oils: In the original paper, 10 items were calculated, including milk, but in this study, milk is a food of the same family as cheese, so it was calculated with 9 items excluding milk). A score of 1 was given for eating a food category every day; a score of 0 for eating once every 2 days, eating once or twice a week or not eating at all; and the total score (score 0 to 9) was calculated [20].
Anthropometric and physical function measures. Measurements of height and weight were converted to body mass index (BMI). Muscle mass, body fat mass, and percent body fat were determined using bioelectrical impedance analysis (BIA) (InBody 720, Biospace, Seoul, Korea). Blood pressure was measured using automatic blood pressure monitors (TM-2657, A&D, Japan) prior to the physical function measurements. Calf circumference of the non-dominant leg was measured with the subject in a seated position with the knee and ankle at right angles, and the feet resting on the floor. Measurements were made at the level of the widest circumference and subcutaneous tissue was not compressed. Grip strength of the dominant hand was measured using a hand-held Smedley-type dynamometer, and the greater strength of two trials were used for analysis. Usual walking speed was measured on a flat walking path of 11 m with markers placed at the 3 m and 8 m mark. A stopwatch was used to measure the time taken to walk 5 m between the markers, and the faster time of two trials was recorded. Assistive walking devices were allowed in the measurement of walking speed when the participant expressed concerns about walking without a device, or when the investigators suspected a risk of falling.
Blood indicators. Non-fasting blood samples were collected in a seated position at baseline. Analyses were carried out centrally in one laboratory (Special Reference Laboratories, Tokyo, Japan). Lipid levels (total cholesterol, high-density lipoprotein (HDL) cholesterol, and triglycerides) were determined. Serum albumin was measured by bromocresol green method, glycated hemoglobin (HbA1c) by latex agglutination assay, and serum creatinine by an enzymatic assay.
Cognitive function. Global cognitive status was assessed using the MMSE. Lower cognitive function was operationally defined as MMSE scores ≤ 23 [21].
2.3. Data analysis
Descriptive statistics are expressed as mean and standard deviation or number (%). Participants were divided into a cheese intake group and a non-cheese intake group. The subjects were also classified into a group with MMSE score of 24 or above (MMSE ≥ 24 group) and a group with MMSE score of 23 or below (MMSE ≤ 23 group). Two groups were compared using Student’s t-test for continuous variables, and by chi-square test for categorical variables.Multiple logistic regression analyses were used to analyze the factors associated with lower cognitive function. Model I included only the status of cheese intake. Model II was Model 1 adjusted for age, physical function, and physique factors. Model III was Model II adjusted for medical history, blood pressure, number of teeth, blood variables, urinary incontinence, milk intake, and dietary variety score. Significant and nonsignificant variables were entered into the multiple logistic regression models to obtain odds ratio (OR) and 95% confidence interval (CI).
P values less than 0.05 were considered statistically significant. All analyses were performed using the SPSS software, Windows version 25.0 (SPSS Inc., Tokyo, Japan).
3. Results
Table 1 shows the status of cheese intake of the subjects. Of a total of 1517 subjects, 1230 (81.0%) were cheese intake group and 287 (19.0%) were non-cheese intake group. By type of cheese consumed, processed cheese occupied the highest percentage of 65.7%, and white mold cheese occupied 15.3%.

Table 1.
Cheese intake of study participants.
| Variables | Category | N | % |
|---|---|---|---|
| Cheese intake | Daily | 418 | 27.6 |
| Once every two days | 358 | 23.7 | |
| 1-2 times a week | 449 | 29.7 | |
| Not intake | 287 | 19.0 | |
| Type of cheese * | Processed cheese | 1082 | 65.7 |
| Fresh type cheese | 215 | 13.0 | |
| White mold cheese | 252 | 15.3 | |
| Blue mold cheese | 41 | 2.5 | |
| Other | 57 | 3.5 |
* Multiple answers. N: number.
Table 2 shows a comparison of the measured parameters between the cheese intake group and the non-cheese intake group. Compared to the cheese intake group, the non-cheese group had slower usual walking speed, fewer current number of teeth, lower total cholesterol and HDL-cholesterol levels, higher prevalence of urinary incontinence, lower percentage of milk consumers, and lower MMSE total score.
Table 2.
Comparison of selected variables between cheese intake and non-intake groups.
| Variable | Cheese intake | N | M | SD | t-value† | p-value | |
|---|---|---|---|---|---|---|---|
| Age, yrs | Yes | 1225 | 76.29 | ± | 4.82 | 1.445 | 0.074 |
| No | 287 | 76.75 | ± | 4.78 | |||
| BMI, kg/m2 | Yes | 1213 | 22.70 | ± | 3.35 | 0.695 | 0.244 |
| No | 279 | 22.85 | ± | 3.32 | |||
| SBP, mmHg | Yes | 1225 | 134.38 | ± | 17.46 | 0.741 | 0.229 |
| No | 287 | 135.24 | ± | 18.29 | |||
| DBP, mmHg | Yes | 1225 | 75.64 | ± | 11.23 | 0.439 | 0.330 |
| No | 287 | 75.97 | ± | 12.19 | |||
| % body fat, % | Yes | 1212 | 29.48 | ± | 8.95 | 0.027 | 0.489 |
| No | 277 | 29.49 | ± | 8.71 | |||
| Calf circumference, cm | Yes | 1225 | 34.37 | ± | 3.28 | 1.097 | 0.136 |
| No | 286 | 34.14 | ± | 3.08 | |||
| Grip strength, kg | Yes | 1221 | 22.28 | ± | 6.14 | 0.788 | 0.216 |
| No | 286 | 21.93 | ± | 6.75 | |||
| Usual walking speed, m/s | Yes | 1223 | 1.30 | ± | 0.25 | 3.517 | <0.001 |
| No | 281 | 1.24 | ± | 0.26 | |||
| MMSE score | Yes | 1218 | 28.11 | ± | 2.16 | 4.412 | <0.001 |
| No | 285 | 27.24 | ± | 3.17 | |||
| Number of teeth, N | Yes | 1224 | 20.00 | ± | 8.56 | 2.242 | 0.013 |
| No | 287 | 18.66 | ± | 9.27 | |||
| Creatinine, mg/dL | Yes | 1223 | 0.77 | ± | 0.34 | 0.788 | 0.215 |
| No | 287 | 0.78 | ± | 0.24 | |||
| Total cholesterol, mg/dL | Yes | 1223 | 214.52 | ± | 34.92 | 2.120 | 0.017 |
| No | 287 | 209.67 | ± | 34.57 | |||
| HDL-cholesterol, mg/dL | Yes | 1223 | 68.47 | ± | 17.70 | 2.339 | 0.010 |
| No | 287 | 65.77 | ± | 17.15 | |||
| Triglycerides, mg/dL | Yes | 1223 | 145.40 | ± | 84.91 | 0.155 | 0.438 |
| No | 287 | 146.26 | ± | 86.60 | |||
| Albumin, g/dL | Yes | 1223 | 4.29 | ± | 0.27 | 0.395 | 0.346 |
| No | 287 | 4.28 | ± | 0.29 | |||
| HbA1c, % | Yes | 1222 | 5.99 | ± | 0.58 | 1.239 | 0.108 |
| No | 287 | 5.94 | ± | 0.60 | |||
| Number of chronic diseases, N | Yes | 1221 | 1.90 | ± | 1.31 | 0.017 | 0.493 |
| No | 286 | 1.90 | ± | 1.35 | |||
| Dietary variety score | Yes | 1218 | 4.65 | ± | 2.05 | 6.538 | <0.001 |
| No | 285 | 3.77 | ± | 2.04 | |||
| Anemia: yes, % | Yes | 1223 | 3.7 | 2.725 | 0.099 | ||
| No | 287 | 1.7 | |||||
| Urinary incontinence: yes, % | Yes | 1225 | 37.1 | 4.042 | 0.044 | ||
| No | 287 | 43.6 | |||||
| Milk intake: yes, % | Yes | 1225 | 79.3 | 57.773 | <0.001 | ||
| No | 287 | 57.8 | |||||
Data are presented as mean (M) and standard deviation (SD) for continuous variables and percentage for categorical variables. BMI: body mass index, SBP: systolic blood pressure, DBP: diastolic blood pressure, MMSE: mini mental state examination, HDL: high-density lipoprotein, HbA1c: hemoglobin A1c, N: number. † Student’s t-test for categorical variables and chi-square for categorical variables.
Figure 1 shows the distribution of the changes in MMSE scores among subjects. Sixty-nine subjects had MMSE scores of 23 or below.
Figure 1.
Frequency of MMSE scores.
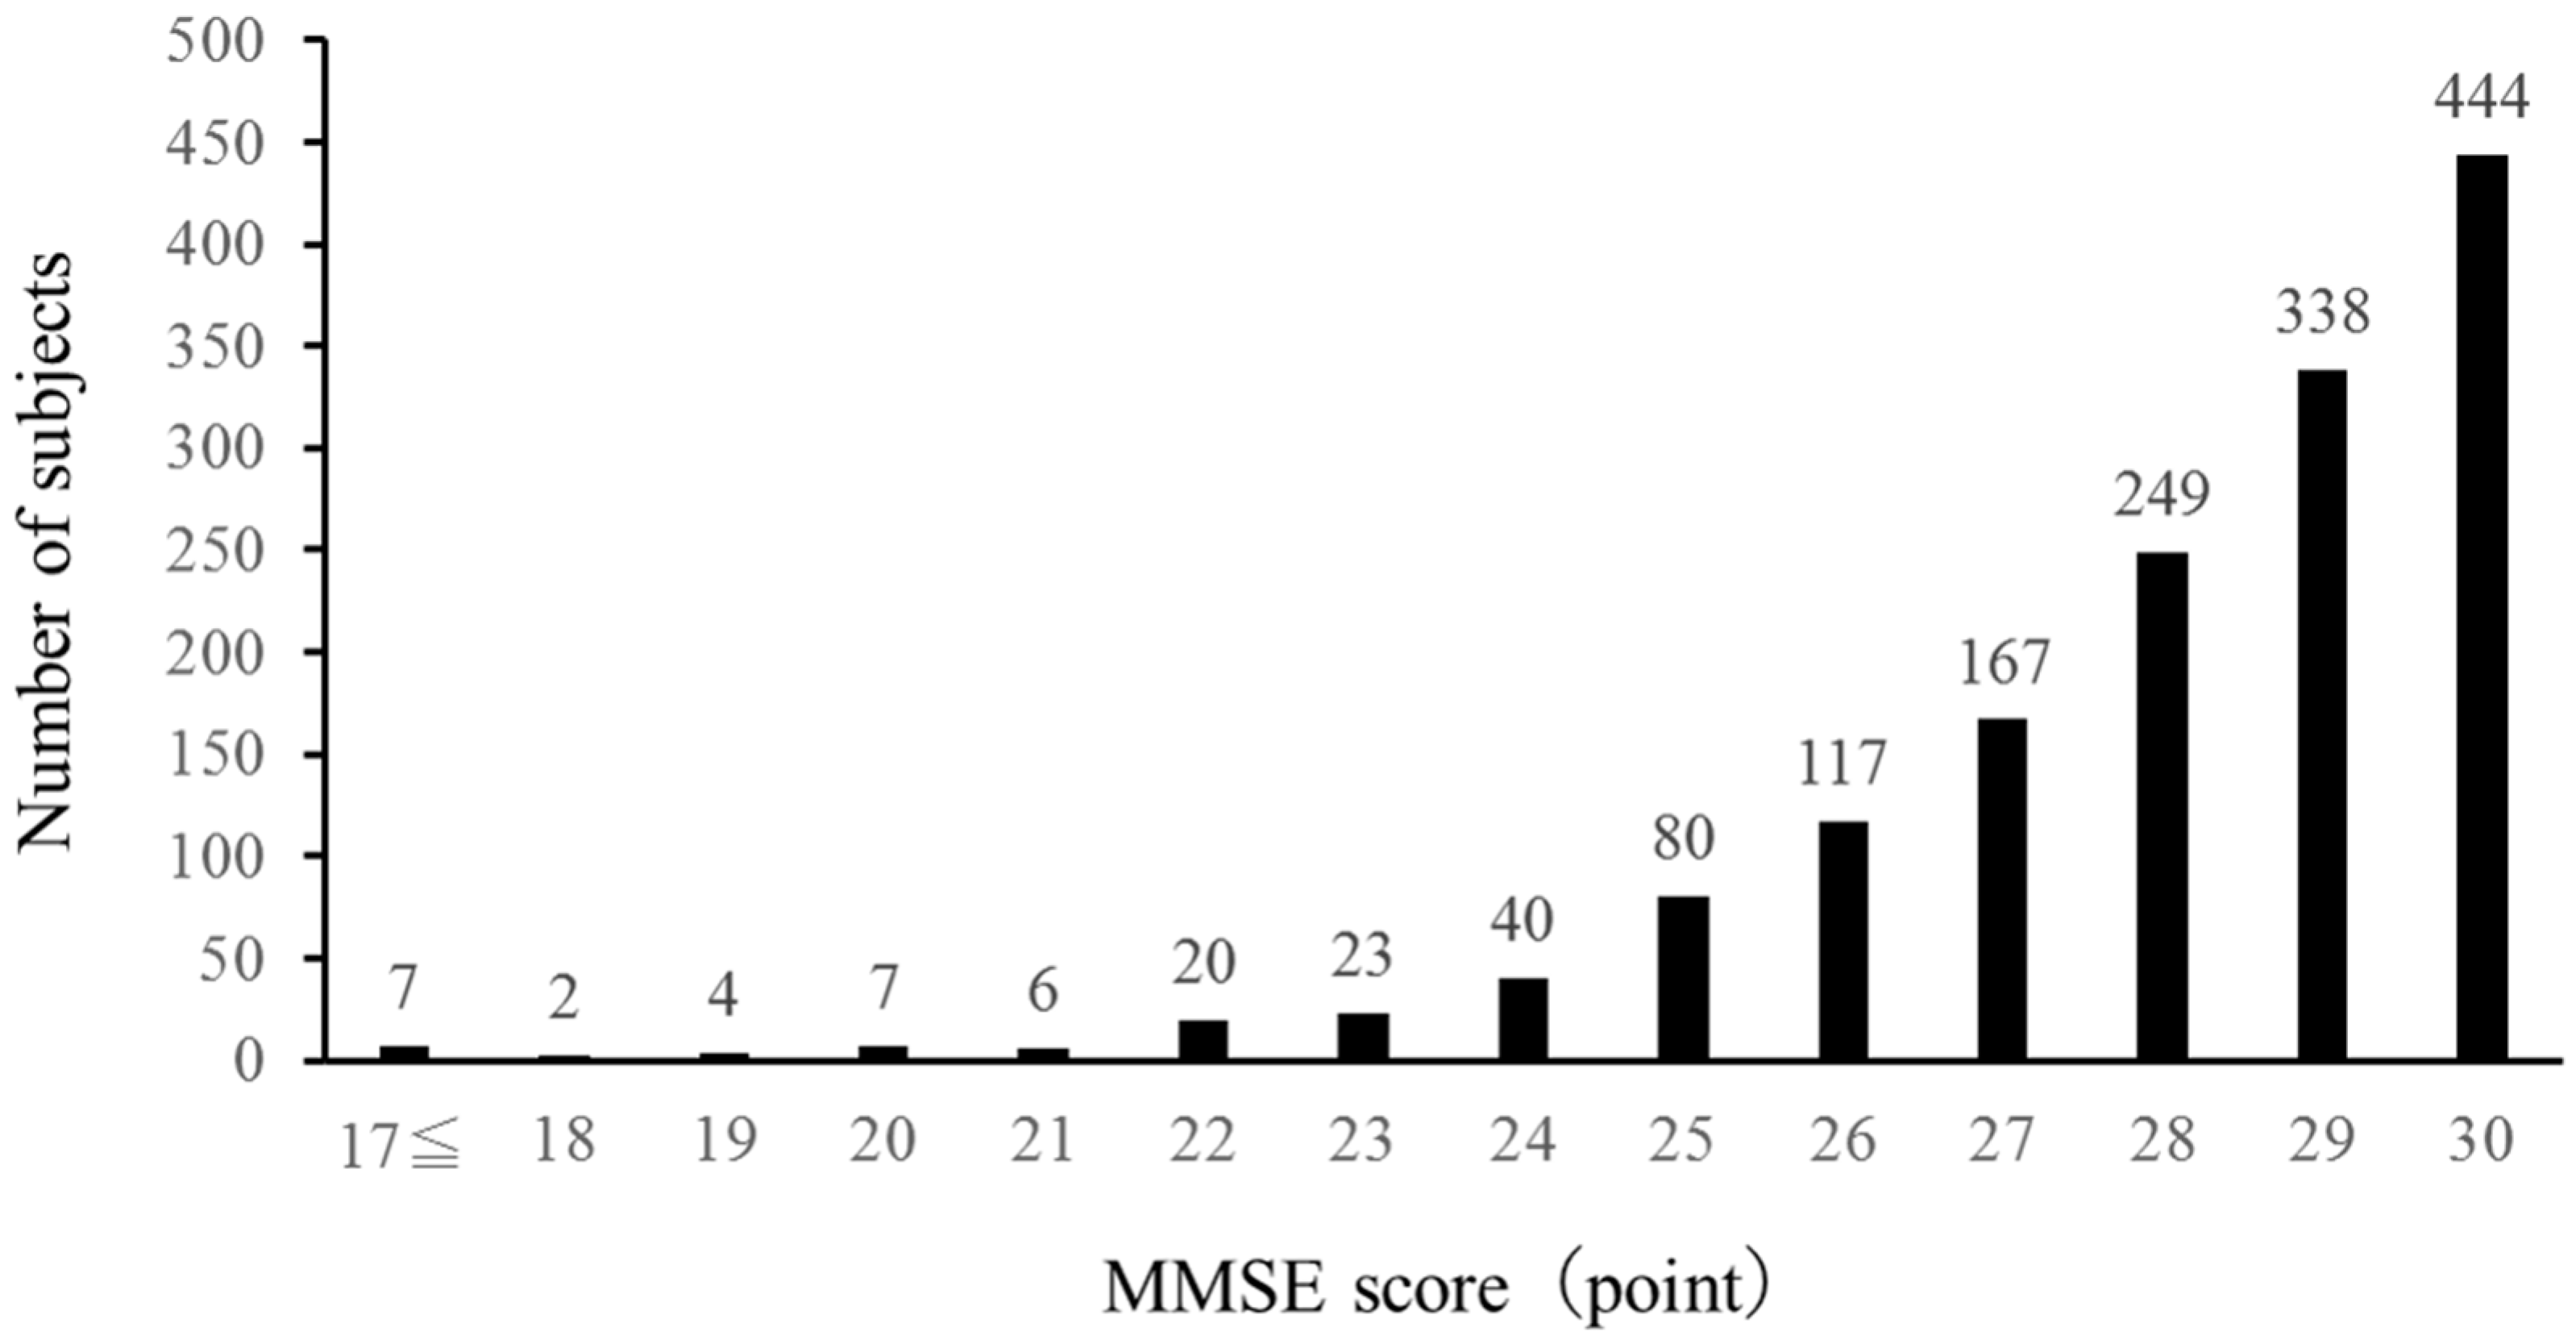
Table 3 shows a comparison of the measured parameters between the MMSE ≥ 24 group and the MMSE ≤ 23 group. Compared to the MMSE ≥ 24 group, the MMSE ≤ 23 group had older age, smaller calf circumference, slower usual walking speed, lower MMSE total score, fewer current number of teeth, higher creatinine level, lower total cholesterol and HDL-cholesterol levels, lower albumin level, higher prevalence of anemia, and lower percentage of milk consumers.
Table 3.
Comparison of selected variables between MMSE score≦23 and ≧24 groups.
| Variable | Group | N | M | SD | t-value† | p-value | |
|---|---|---|---|---|---|---|---|
| Age, yrs | MMSE≦23 | 69 | 80.13 | ± | 4.04 | 6.750 | <0.001 |
| MMSE≧24 | 1435 | 76.18 | ± | 4.77 | |||
| BMI, kg/m2 | MMSE≦23 | 67 | 22.37 | ± | 3.64 | 0.903 | 0.183 |
| MMSE≧24 | 1417 | 22.75 | ± | 3.32 | |||
| SBP, mmHg | MMSE≦23 | 69 | 134.99 | ± | 19.24 | 0.208 | 0.418 |
| MMSE≧24 | 1435 | 134.54 | ± | 17.50 | |||
| DBP, mmHg | MMSE≦23 | 69 | 75.75 | ± | 13.99 | 0.019 | 0.491 |
| MMSE≧24 | 1435 | 75.72 | ± | 11.27 | |||
| Percent body fat, % | MMSE≦23 | 67 | 30.56 | ± | 11.02 | 1.064 | 0.144 |
| MMSE≧24 | 1414 | 29.38 | ± | 8.75 | |||
| Calf circumference, cm | MMSE≦23 | 69 | 32.49 | ± | 3.56 | 4.424 | <0.001 |
| MMSE≧24 | 1434 | 34.42 | ± | 3.21 | |||
| Grip strength, kg | MMSE≦23 | 68 | 20.62 | ± | 8.29 | 1.661 | 0.051 |
| MMSE≧24 | 1431 | 22.31 | ± | 6.15 | |||
| Usual walking speed, m/s | MMSE≦23 | 68 | 1.10 | ± | 0.27 | 6.365 | <0.001 |
| MMSE≧24 | 1428 | 1.30 | ± | 0.25 | |||
| MMSE score | MMSE≦23 | 69 | 20.67 | ± | 3.62 | 17.436 | <0.001 |
| MMSE≧24 | 1435 | 28.30 | ± | 1.67 | |||
| Number of teeth, N | MMSE≦23 | 69 | 16.00 | ± | 9.58 | 3.342 | 0.001 |
| MMSE≧24 | 1434 | 19.93 | ± | 8.62 | |||
| Creatinine, mg/dL | MMSE≦23 | 69 | 0.97 | ± | 0.87 | 2.010 | 0.024 |
| MMSE≧24 | 1433 | 0.76 | ± | 0.27 | |||
| Total-cholesterol, mg/dL | MMSE≦23 | 69 | 205.00 | ± | 36.04 | 2.116 | 0.017 |
| MMSE≧24 | 1433 | 214.07 | ± | 34.71 | |||
| HDL-cholesterol, mg/dL | MMSE≦23 | 69 | 62.87 | ± | 16.88 | 2.453 | 0.007 |
| MMSE≧24 | 1433 | 68.17 | ± | 17.57 | |||
| Triglyceride, mg/dL | MMSE≦23 | 69 | 146.94 | ± | 99.56 | 0.122 | 0.451 |
| MMSE≧24 | 1433 | 145.66 | ± | 84.69 | |||
| Albumin, g/dL | MMSE≦23 | 69 | 4.19 | ± | 0.31 | 3.171 | 0.001 |
| MMSE≧24 | 1433 | 4.29 | ± | 0.27 | |||
| HbA1c, % | MMSE≦23 | 69 | 6.05 | ± | 0.73 | 1.083 | 0.140 |
| MMSE≧24 | 1432 | 5.97 | ± | 0.58 | |||
| Number of chronic diseases, N | MMSE≦23 | 69 | 1.74 | ± | 1.50 | 0.939 | 0.176 |
| MMSE≧24 | 1430 | 1.91 | ± | 1.31 | |||
| Dietary variety score | MMSE≦23 | 68 | 3.88 | ± | 2.15 | 2.474 | 0.013 |
| MMSE≧24 | 1428 | 4.52 | ± | 2.06 | |||
| Anemia: yes, % | MMSE≦23 | 69 | 8.7 | 6.473 | 0.011 | ||
| MMSE≧24 | 1433 | 3.1 | |||||
| Urinary incontinence: yes, % | MMSE≦23 | 69 | 29.0 | 2.727 | 0.099 | ||
| MMSE≧24 | 1435 | 37.1 | |||||
| Milk intake: yes, % | MMSE≦23 | 69 | 65.2 | 3.922 | 0.048 | ||
| MMSE≧24 | 1435 | 75.7 | |||||
Data are presented as mean (M) and standard deviation (SD) for continuous variables and percentage for categorical variables. BMI: body mass index, SBP: systolic blood pressure, DBP: diastolic blood pressure, MMSE: mini mental state examination, HDL: high-density lipoprotein, HbA1c: hemoglobin A1c, N: number. † Student’s t-test for categorical variables and chi-square for categorical variables.
As shown in Table 4, multiple logistic regression (model III) identified four variables i.e, cheese intake (OR = 0.404, 95% CI = 0.198-0.824), age (OR = 1.170, 95% CI = 1.089-1.256), usual walking speed (OR = 0.171, 95% CI = 0.062-0.472) and calf circumference (OR = 0.823, 95% CI = 0.747-0.908) as significant independent variables for lower cognitive function. In all three models, cheese intake was identified as a factor significantly associated inversely with lower cognitive function.
Table 4.
Odds ratios (OR) with 95% confidence intervals (CI) for variables associated with lower cognitive function.
Table 4.
Odds ratios (OR) with 95% confidence intervals (CI) for variables associated with lower cognitive function.
| Independent variable | Model I | Model II | Model III | ||||||
|---|---|---|---|---|---|---|---|---|---|
| OR | 95% CI | p-value | OR | 95% CI | p-value | OR | 95% CI | p-value | |
| Cheese intake, yes | 0.322 | 0.168-0.617 | 0.001 | 0.392 | 0.197-0.777 | 0.007 | 0.404 | 0.198-0.824 | 0.013 |
| Frequency of cheese intake, daily | 0.971 | 0.506-1.864 | 0.929 | 0.796 | 0.401-1.577 | 0.512 | 0.793 | 0.390-1.610 | 0.521 |
| Type of cheese, camembert | 0.692 | 0.267-1.791 | 0.448 | 0.881 | 0.333-2.329 | 0.798 | 0.906 | 0.339-2.421 | 0.843 |
| Age, 1 unit | 1.170 | 1.089-1.256 | <0.001 | 1.150 | 1.066-1.239 | 0.000 | |||
| Usual walking speed, 1 unit | 0.171 | 0.062-0.472 | <0.001 | 0.218 | 0.075-0.638 | 0.005 | |||
| Grip strength, 1 unit | 1.023 | 0.982-1.066 | 0.281 | 1.010 | 0.965-1.057 | 0.672 | |||
| Calf circumference, 1 unit | 0.823 | 0.747-0.908 | <0.001 | 0.843 | 0.761-0.934 | 0.001 | |||
| Anemia, yes | 1.674 | 0.534-5.253 | 0.377 | ||||||
| DBP, 1 unit ** | 1.015 | 0.992-1.038 | 0.214 | ||||||
| Number of teeth, 1unit | 0.988 | 0.960-1.016 | 0.388 | ||||||
| Creatinine, 1 unit | 1.506 | 0.828-2.739 | 0.180 | ||||||
| Albumin, 1 unit | 0.569 | 0.203-1.595 | 0.284 | ||||||
| Total cholesterol, 1 unit | 1.000 | 0.992-1.008 | 0.999 | ||||||
| Urinary incontinence, yes | 1.726 | 0.954-3.125 | 0.071 | ||||||
| Milk, intake | 1.038 | 0.580-1.855 | 0.901 | ||||||
| Dietary variety score, 1 unit | 0.912 | 0.800-1.039 | 0.166 |
Dependent variable: cognitive frailty (1 = MMSE score <= 23, 0 = MMSE score >= 24). ** DBP: diastolic blood pressure.
4. Discussion
In the present study, we conducted an analysis of cross-sectional data on the relationship between cheese intake and cognitive function in community-dwelling older people, and the results suggest that cheese intake is associated inversely with the risk of lower cognitive function defined as a MMSE score of 23 or below, even after adjusting for multiple confounding factors. The significance of the results of this research will be discussed from various points of view.
Many studies on the relationship between food intake and the development of cognitive decline and dementia have been reported from multifaceted research fields. Among 1081 people aged 60 and above without dementia at baseline followed for 17 years (1988-2005) in the Hisayama study, 303 people subsequently developed dementia (including 166 patients with Alzheimer’s dementia and 98 patients with vascular dementia). When the relationship of milk and dairy product intake and dementia was analyzed in this cohort, milk and dairy product intake significantly reduced the risk of development of Alzheimer’s dementia (p = 0.03) but not vascular dementia (p = 0.14), even after adjusting for many potential confounders including age, sex, years of education, stroke, hypertension, diabetes, total cholesterol level, BMI, smoking, and exercise [13]. Another study using a 3-day weighed food record found that in women, increased intake of grain products increased the risk of cognitive decline by 40%, whereas increased intake of dairy products reduced the risk of cognitive decline by 20% [12]. However, according to a meta-analysis, the existing evidence which is derived mostly from observational studies is not sufficient to arrive at a definitive conclusion regarding the effect of milk or dairy product intake on the risk of cognitive decline or cognitive disorders in older adults [18]. The present study also detected no association between the frequency of milk consumption and MMSE scores of 23 or less, which is consistent with the conclusion of Lee et al [18]. On the other hand, cheese intake was found to be a factor associated inversely with lower cognitive function. A previous study using logistic regression analyses showed that a 30 g increase in Dutch cheese intake was associated with a 33% lower probability of poor information processing speed (PR = 0.67, 95% CI: 0.47–0.97), whereas dairy intake was not associated with attention and working memory or episodic memory [14]. Another study reported that cheese intake was associated inversely with cognitive impairment in a simple logistic regression analysis (OR = 0.59; 95% CI: 0.42, 0.84; p = 0.003) and a multiple logistic regression analysis (OR = 0.68; 95% CI: 0.47, 0.99; p = 0.04) after adjusting for socio-demographic and for other dietary factors, leading to a conclusion that increased frequency of cheese intake was associated with decreased cognitive impairment (p = 0.0034) [22].
To explore the relationship between cheese intake and cognitive function in detail, we conducted multiple regression analysis using three models. The result as shown in Table 4 indicated that cheese intake was significantly associated inversely with lower cognitive function, even after adjusting for a variety of confounders including a history of anemia and milk intake.
Although the present study shows an inverse association of cheese intake with lower cognitive function, it is not possible to elucidate the cause of this association from the results obtained from cross-sectional data. However, previous study has reported an association between higher dietary diversity and better cognitive function [23]. In the present study, the cheese intake group had significantly higher dietary variety score than the non-cheese intake group. The inverse association between cheese intake and lower cognitive function may be more likely due to the subjects with cheese intake had dietary habit of consuming a wide variety of foods, rather than the specific nutrients contained in cheese.
In this study, factors other than cheese intake that were associated with lower cognitive function were age, usual walking speed, and calf circumference. Many previous studies have reported that age is associated with cognitive decline and dementia, and this finding was validated in this study. The association of usual walking speed with cognitive decline and lower cognitive function has been demonstrated and verified in longitudinal and cross-sectional studies [24,25], and the results of the present study were consistent with previous finding. Calf circumference is another important factor. Many previous studies have pointed out a strong association between calf circumference and frailty or sarcopenia, and calf circumference has been adopted as a screening test for sarcopenia [26,27]. However, the relationship between calf circumference and cognitive function has not been reported. The present study also suggests the possibility that larger calf circumference is associated with lower risk of lower cognitive function. Regarding the effect of calf circumference on cognitive function, the mechanism cannot be elucidated from the results of the present study.
This study has several limitations. First, the present finding of an inverse relationship between cheese intake and lower cognitive function was obtained from an analysis of cross-sectional data. Whether cheese intake contributes to reduce the risk of cognitive decline cannot be elucidated from the present result, and has to be further investigated by conducting a longitudinal study in the future. Second, information of the status of cheese intake was based on self-reporting during the interview in the survey, and was not quantified by an objective method. Third, although many cut-off values have been proposed for defining lower cognitive function, the cutoff value used in the present study was determined operationally as MMSE score of 23 or below, according to that proposed by O’Bryant et al [21].
5. Conclusions
Although the present study was an analysis of cross-sectional data of Japanese community-dwelling older adults, the results suggest that cheese intake is inversely associated with lower cognitive function even after adjusting for multiple confounding factors. In the future, a large-scale longitudinal analysis is needed to elucidate the causal relationship.
Author Contributions
Conceptualization, H.K., and T.S.; methodology, H.K., and T.S.; formal analysis, H.K.; investigation, H.K., Y.O., N.K., H.S., and T.S.; data curation, H.K., Y.O., N.K., H.S., and T.S.; writing—original draft preparation, H.K.; writing—review and editing, H.K., and T.S.; supervision, T.S.; project administration, T.S.; funding acquisition, H.K., Y.O., N.K., H.S., K.N., C.O., M.S., and T.S. All authors have read and agreed to the published version of the manuscript.
Funding
This study was funded by Grants-in-Aid for Scientific Research (grant numbers: 17H02187 and 26282201), Japan Agency for Medical Research and Development (grant number: 20282345), Joint Research Grant (grant numbers: 28-819 and 29-3917), and 2017 and 2019 Research funding for Longevity Sciences (grant number: 29–42) from the National Center for Geriatrics and Gerontology, and Meiji Co., Ltd.
Institutional Review Board Statement
This study was conducted according to the guidelines of the Declaration of Helsinki, and approved by the Ethics Committee of the Tokyo Metropolitan Institute of Gerontology (approval R2-25 and R2-18).
Informed Consent Statement
Written informed consent was obtained from all subjects involved in this study.
Data Availability Statement
The datasets analyzed in this study are not publicly available due to ethical and legal restrictions imposed by the Ethics Committee at Tokyo Metropolitan Institute of Gerontology, but are available from the corresponding author on reasonable request.
Conflicts of Interest
This study was conducted as a part of “Epidemiology study of relationship between dairy products intake and cognitive function” commissioned from Meiji Co., Ltd. T.S. holds position of Commissioned Research Chair, and H.K. is a member of the Commissioned Research group. K.N., C.O. and M.S. are employees of Meiji Co., Ltd. Other authors declare no conflict of interest. The funding sponsors had no role in the execution, analysis and interpretation of data, and writing of the manuscript.
References
- Grande, G.; Qiu, C.; Fratiglioni, L. Prevention of dementia in an ageing world: Evidence and biological rationale. Ageing Res Rev 2020, 64, 101045. [Google Scholar] [CrossRef]
- Livingston, G.; Huntley, J.; Sommerlad, A.; Ames, D.; Ballard, C.; Banerjee, S.; Brayne, C.; Burns, A.; Cohen-Mansfield, J.; Cooper, C.; et al. Dementia prevention, intervention, and care: 2020 report of the Lancet Commission. Lancet 2020, 396, 413–446. [Google Scholar] [CrossRef]
- Luchsinger, J.A.; Tang, M.X.; Siddiqui, M.; Shea, S.; Mayeux, R. Alcohol intake and risk of dementia. J Am Geriatr Soc 2004, 52, 540–546. [Google Scholar] [CrossRef]
- Singh, B.; Parsaik, A.K.; Mielke, M.M.; Erwin, P.J.; Knopman, D.S.; Petersen, R.C.; Roberts, R.O. Association of mediterranean diet with mild cognitive impairment and Alzheimer’s disease: a systematic review and meta-analysis. J Alzheimers Dis 2014, 39, 271–282. [Google Scholar] [CrossRef]
- Sofi, F.; Valecchi, D.; Bacci, D.; Abbate, R.; Gensini, G.F.; Casini, A.; Macchi, C. Physical activity and risk of cognitive decline: a meta-analysis of prospective studies. J Intern Med 2011, 269, 107–117. [Google Scholar] [CrossRef]
- Talaei, M.; Feng, L.; Yuan, J.M.; Pan, A.; Koh, W.P. Dairy, soy, and calcium consumption and risk of cognitive impairment: the Singapore Chinese Health Study. Eur J Nutr 2020, 59, 1541–1552. [Google Scholar] [CrossRef]
- Azuma, K.; Osuka, Y.; Kojima, N.; Sasai, H.; Kim, H.; Inoue, S. Association of Vitamin K Insufficiency With Cognitive Dysfunction in Community-Dwelling Older Adults. Front Nutr 2021, 8, 811831. [Google Scholar] [CrossRef]
- Kimura, R.; Tsujimura, H.; Tsuchiya, M.; Soga, S.; Ota, N.; Tanaka, A.; Kim, H. Development of a cognitive function marker based on D-amino acid proportions using new chiral tandem LC-MS/MS systems. Sci Rep 2020, 10, 804. [Google Scholar] [CrossRef]
- Pal, K.; Mukadam, N.; Petersen, I.; Cooper, C. Mild cognitive impairment and progression to dementia in people with diabetes, prediabetes and metabolic syndrome: a systematic review and meta-analysis. Soc Psychiatry Psychiatr Epidemiol 2018, 53, 1149–1160. [Google Scholar] [CrossRef]
- Samper-Ternent, R.; Al Snih, S.; Raji, M.A.; Markides, K.S.; Ottenbacher, K.J. Relationship between frailty and cognitive decline in older Mexican Americans. J Am Geriatr Soc 2008, 56, 1845–1852. [Google Scholar] [CrossRef]
- Slinin, Y.; Paudel, M.; Taylor, B.C.; Ishani, A.; Rossom, R.; Yaffe, K.; Blackwell, T.; Lui, L.Y.; Hochberg, M.; Ensrud, K.E. Association between serum 25(OH) vitamin D and the risk of cognitive decline in older women. J Gerontol A Biol Sci Med Sci 2012, 67, 1092–1098. [Google Scholar] [CrossRef]
- Otsuka, R.; Kato, Y.; Nishita, Y.; Tange, C.; Nakamoto, M.; Tomida, M.; Imai, T.; Ando, F.; Shimokata, H. Cereal Intake Increases and Dairy Products Decrease Risk of Cognitive Decline among Elderly Female Japanese. J Prev Alzheimers Dis 2014, 1, 160–167. [Google Scholar] [CrossRef]
- Ozawa, M.; Ohara, T.; Ninomiya, T.; Hata, J.; Yoshida, D.; Mukai, N.; Nagata, M.; Uchida, K.; Shirota, T.; Kitazono, T.; et al. Milk and dairy consumption and risk of dementia in an elderly Japanese population: the Hisayama Study. J Am Geriatr Soc 2014, 62, 1224–1230. [Google Scholar] [CrossRef]
- de Goeij, L.C.; van de Rest, O.; Feskens, E.J.M.; de Groot, L.; Brouwer-Brolsma, E.M. Associations between the Intake of Different Types of Dairy and Cognitive Performance in Dutch Older Adults: The B-PROOF Study. Nutrients 2020, 12. [Google Scholar] [CrossRef]
- Suzuki, T.; Kojima, N.; Osuka, Y.; Tokui, Y.; Takasugi, S.; Kawashima, A.; Yamaji, T.; Hosoi, E.; Won, C.W.; Kim, H. The Effects of Mold-Fermented Cheese on Brain-Derived Neurotrophic Factor in Community-Dwelling Older Japanese Women With Mild Cognitive Impairment: A Randomized, Controlled, Crossover Trial. J Am Med Dir Assoc 2019, 20, 1509–1514. [Google Scholar] [CrossRef]
- Folstein, M.F.; Folstein, S.E.; McHugh, P.R. "Mini-mental state". A practical method for grading the cognitive state of patients for the clinician. J Psychiatr Res 1975, 12, 189–198. [Google Scholar] [CrossRef]
- Ni, J.; Nishi, S.K.; Babio, N.; Martínez-González, M.A.; Corella, D.; Castañer, O.; Martínez, J.A.; Alonso-Gómez, Á.M.; Gómez-Gracia, E.; Vioque, J.; et al. Dairy Product Consumption and Changes in Cognitive Performance: Two-Year Analysis of the PREDIMED-Plus Cohort. Mol Nutr Food Res 2022, 66, e2101058. [Google Scholar] [CrossRef]
- Lee, J.; Fu, Z.; Chung, M.; Jang, D.J.; Lee, H.J. Role of milk and dairy intake in cognitive function in older adults: a systematic review and meta-analysis. Nutr J 2018, 17, 82. [Google Scholar] [CrossRef]
- Osuka, Y.; Kojima, N.; Sakurai, R.; Watanabe, Y.; Kim, H. Reliability and construct validity of a novel motor-cognitive dual-task test: A Stepping Trail Making Test. Geriatr Gerontol Int 2020, 20, 291–296. [Google Scholar] [CrossRef]
- Hayakawa, M.; Motokawa, K.; Mikami, Y.; Yamamoto, K.; Shirobe, M.; Edahiro, A.; Iwasaki, M.; Ohara, Y.; Watanabe, Y.; Kawai, H.; et al. Low Dietary Variety and Diabetes Mellitus Are Associated with Frailty among Community-Dwelling Older Japanese Adults: A Cross-Sectional Study. Nutrients 2021, 13. [Google Scholar] [CrossRef]
- O’Bryant, S.E.; Humphreys, J.D.; Smith, G.E.; Ivnik, R.J.; Graff-Radford, N.R.; Petersen, R.C.; Lucas, J.A. Detecting dementia with the mini-mental state examination in highly educated individuals. Arch Neurol 2008, 65, 963–967. [Google Scholar] [CrossRef]
- Rahman, A.; Sawyer Baker, P.; Allman, R.M.; Zamrini, E. Dietary factors and cognitive impairment in community-dwelling elderly. J Nutr Health Aging 2007, 11, 49–54. [Google Scholar]
- Milte, C.M.; Ball, K.; Crawford, D.; McNaughton, S.A. Diet quality and cognitive function in mid-aged and older men and women. BMC Geriatr 2019, 19, 361. [Google Scholar] [CrossRef]
- Suzuki, H.; Kawai, H.; Hirano, H.; Yoshida, H.; Ihara, K.; Kim, H.; Chaves, P.H.; Minami, U.; Yasunaga, M.; Obuchi, S.; et al. One-Year Change in the Japanese Version of the Montreal Cognitive Assessment Performance and Related Predictors in Community-Dwelling Older Adults. J Am Geriatr Soc 2015, 63, 1874–1879. [Google Scholar] [CrossRef]
- Taniguchi, Y.; Watanabe, Y.; Osuka, Y.; Kitamura, A.; Seino, S.; Kim, H.; Kawai, H.; Sakurai, R.; Inagaki, H.; Awata, S.; et al. Characteristics for gait parameters of community-dwelling elderly Japanese with lower cognitive function. PLoS One 2019, 14, e0212646. [Google Scholar] [CrossRef]
- Chen, L.K.; Woo, J.; Assantachai, P.; Auyeung, T.W.; Chou, M.Y.; Iijima, K.; Jang, H.C.; Kang, L.; Kim, M.; Kim, S.; et al. Asian Working Group for Sarcopenia: 2019 Consensus Update on Sarcopenia Diagnosis and Treatment. J Am Med Dir Assoc 2020, 21, 300–307. [Google Scholar] [CrossRef]
- Kim, M.; Jeong, M.J.; Yoo, J.; Song, D.Y.; Won, C.W. Calf Circumference as a Screening Tool for Cognitive Frailty in Community-Dwelling Older Adults: The Korean Frailty and Aging Cohort Study (KFACS). J Clin Med 2018, 7. [Google Scholar] [CrossRef]
Disclaimer/Publisher’s Note: The statements, opinions and data contained in all publications are solely those of the individual author(s) and contributor(s) and not of MDPI and/or the editor(s). MDPI and/or the editor(s) disclaim responsibility for any injury to people or property resulting from any ideas, methods, instructions or products referred to in the content. |
© 2023 by the authors. Licensee MDPI, Basel, Switzerland. This article is an open access article distributed under the terms and conditions of the Creative Commons Attribution (CC BY) license (http://creativecommons.org/licenses/by/4.0/).
Copyright: This open access article is published under a Creative Commons CC BY 4.0 license, which permit the free download, distribution, and reuse, provided that the author and preprint are cited in any reuse.


