
Submitted:
27 June 2023
Posted:
27 June 2023
You are already at the latest version
Abstract
Real-time fluorescent quantitative PCR (RT-qPCR) is the most classic and widely used technology for evaluating the expression level of target gene. In order to select the proper internal reference genes for RT-qPCR analysis in Amorphophallus konjac (Araceae), eight candidate internal reference genes, including 25S ribosomal RNA gene (25S rRNA), 18S ribosomal RNA gene (18S rRNA), actin gene (ACT), glyceraldehyde-3-phosphate dehydrogenase gene (GAPDH), Ubiquitin gene (UBQ), β-tubulin gene (β-TUB), eukaryotic elongation factor 1-αgene(eEF-1α), and eukaryotic translation initiation factor 4α-1 gene (eIF-4α) were selected and tested the corresponding expression level in different tissues at different growing stages. The results showed that 25S rRNA, 18S rRNA, and ACT at the reproductive periods, eEF-1α and eIF-4α at the nutritional periods, and eEF-1α, UBQ, and ACT at different leaf developmental periods had a stable level of gene expression, respectively. These results might be useful for the study of gene function in A. konjac.
Keywords:
Amorphophallus
; reference genes
; RT-qPCR
; gene expression
1. Introduction
Amorphophallus (Araceae) is primarily found in tropical or subtropical areas of South Asia and West Africa [1,2,3]. So far, more than 170 species have been found in this genus; some of them are used as medicine or food. Konjac glucomannan (KGM), the most representative water-soluble dietary fiber, has a good effect on human health by reducing plasma lipids, blood pressure, glycemia, and even weight [4]. Identifying critical genes in the synthesis of Konjac KGM also provides valuable candidate genes for the molecular breeding of this crop [5]. Because Amorphophallus konjac is rich in KGM, it is widely cultivated in the central and western regions in China. Its cultivation area has already reached 26000 hm2 [6]. The researches on konjac mainly focus on bioactive components extraction [7], molecular cloning [8], taxonomic and evolution [7,9], whole chloroplast genome sequencing [10], genetic molecular makers development [3] and comparative transcriptomics [2]. With the development of molecular biology research in konjac, gene expression patterns had become the important part of gene functional study.
Real-time fluorescent quantitative PCR (RT-qPCR) has a series of advantages, comprising higher sensitivity, specificity, and broad quantification range, a common method for quantifying gene expression [11].For quantifying quantitative amounts of gene expression, relative and absolute quantification techniques are frequently used. Relative quantification was calculated based on the PCR data of target genes of stable reference genes [12]. Many factors such as sample initial RNA quality, the efficiency of cDNA synthesis, the specificity of primers, and the test environment could affect the results of gene expression analysis [13]. Particularly, multiple factors, such as diverse abiotic stress conditions or various tissue development phases, may have an impact on the expression levels of the reference genes. Therefore, choosing appropriate reference genes is essential for gene quantitative analysis. In recent years, many reference genes for RT-qPCR analysis have been selected in crops, such as Miscanthus lutarioriparia [14], switchgrass [15], wheat [16], tea [17], and cotton [18]. In the meantime, in two cultivated Amorphophallus species, the appropriate reference genes have been found in various tissues under stress from waterlogging or high temperatures [19]. However, there are yet no reports on reference genes in konjac at various growth stages. In this work, the candidate reference gene selected from the transcriptome database of A. konjac was analyzed for the stability of gene expression in different tissues and developmental phases in order to provide a reference for gene expression studies of Amorphophallus species.
2. Materials and Methods
2.1. Plant Sample Collection
The tested individuals of A. konjac were planted with the same growth condition in Wuhan University, Hubei Province, China. The plant materials included 1) eight tissues at the reproductive periods, 2) four tissues at the nutritional periods, and leaves in three development periods (Table 1). All samples were collected from three individuals, respectively. All samples were washed with sterilized water, dried with hygroscopic filter paper, then immediately frozen in liquid nitrogen and stored at −80 °C.
2.2. RNA Extraction and cDNA Synthesis
Total RNAs were extracted using OminiPlant RNA Kit with DNase I (CW Biotech Co, Ltd, Beijing, China). The purity and quality of RNA were determined by 1.2% agarose gel electrophoresis. The cDNAs (20 μl) were synthesized using the Fast Quant RT Kit with gDNase (Tiangen Biotech Co, Ltd, Beijing, China) and stored at −20 °C.
2.3. Screening of Candidate Reference Genes, Primer Design and RT-qPCR Assay
The partial sequences of eight candidate reference genes were screened from available transcriptome data of konjac in our laboratory and BLAST with the corresponding homologous gene from the database in NCBI GeneBank. The conserved region among the homologous genes was used for primer design by Premier 5.0 software (Table 2). Besides, the selected candidate genes were cloned from konjac and sequenced to verify the accuracy of transcriptome data.
The RT-qPCR assay was performed using the StepOne Real-Time PCR System (Applied Biosystem, Foster City, USA). Each reaction (final volume of 20 μl) contained 4.8 μl RNase-free ddH2O, 2 μl 50×ROX Reference Dye, 10 μl 2×SuperReal PreMix Plus, 2 μl diluted cDNA template, 0.6 μl of each primer. Two-step amplification included: pre-denaturation at 95 °C for 10 min, followed by 40 cycles of denaturation at 95 °C for 10 s, and annealing extension at 60 °C for 1 min. The melting curve analysis of each sample amplification product was used to verify the specificity of the PCR reaction. The standard curves were used to test the amplification efficiency (E) and correlation coefficient (R2) of the series diluted cDNA templates (100, 101, 102, 103, 104 dilutions). Three technical replicates were set for each sample.
2.4. Data Analysis of Gene Expression Stability
The baseline threshold (StepOne Software v2.3) was set up manually to ensure the consistence of all samples with the same tested gene placed in different reaction plates. The average, three technical replicates of Ct values with the parameter STD of <0.2 were calculated. The three programs geNorm, NormFinder, and BestKeeper were used for the ranking comparison. The Ct values of three technical replicates were converted to relative expression quantities according to the formula of: 2−ΔCt (ΔCt = the corresponding Ct value - minimum Ct value). To compare the comprehensive expression stability of the tested genes, those converted relative expression quantities were analyzed and ranked by geNorm, Normfinder, and BestKeeper programs, respectively.
3. Results
3.1. Primer Specificity and Amplification Efficiency of PCR Reaction
The sequencing results showed that the sequence of eight candidate reference genes obtained by cloning were consistent with those of the transcripts, suggesting the primers designed by the transcriptome data were reliable. The melting curves of the PCR amplification products was analyzed to verify the rationality of each pair of primers for the eight candidate reference genes (Figure 1). Melting curves showed a single peak for each primer set indicating no non-specific amplification and the primer dimer. Amplification efficiency (E) among the test primers ranged from 90.19 to 103.73% with the correlation coefficient (R2) between 0.995 to 0.999 (Table 2 and Figure 2).
3.2. Ct value Distribution and Expression Profile of the Eight Reference Genes
In this study, the precision of RT-qPCR for reference gene selection was assessed. The cDNA extracted from mixed tissues served as the template for RT-qPCR to create a standard curve and measure the efficiency E of each internal gene amplification. The amplification efficiency of each tested gene was between 90% and 110%, and all of the curves displayed a unimodal fusion peak, suggesting that the expression of these genes was stable in each sample and practical for further research. With the use of the cycle threshold values, the expression levels of the eight potential reference genes were verified. The relationship between the Ct value and the gene's level of expression was inverse. The mean Ct values were examined to evaluate the level of expression between genes and within samples in accordance with the melting curves of the tested samples. According to earlier research, appropriate reference genes should be highly expressed and display steady expression levels across multiple samples. The selected genes displayed Ct values ranged from 13.87 to 32.08. Among the tested genes, 25S rRNA, and 18S rRNA showed both the highest expression level and the lowest transcript abundance. The trend of expression level for the rest genes (ACT, GAPDH, UBQ, βTUB, eEF-1α, eIF-4α) were similar in different konjac tissues (Figure 3).
3.3. Stability Analysis of Reference Genes by geNorm
GeNorm was used to detect the two or more most suitable reference genes. The M value of candidate reference genes was obtained. The M value is inversely proportional to gene stability. Generally, M=1.5 was the critical value. If M<1.5, it was considered having better expression stability and suitable to be a reference gene. The results of geNorm analysis were showed in Table 3. Both 25S rRNA and 18S rRNA were with the lowest M value of 0.513, suggesting they might be the most stable genes in expression profile at the reproductive phase. The stability of the rest genes was eEF-1α>UBQ>eIF-4α>ACT>GAPDH>β-TUB (Figure 4A).
The pairwise variations (Vn/n+1) were also calculated with geNorm between two sequential ranked genes to determine the minimum number of reference genes. If Vn/n+1 < 0.15, the appropriate number of the best reference genes should be n; if the Vn/n+1 > 0.15 or Vn/ n+1 = 0.15, the number should be n + 1. At the reproductive phases, it can be seen in Fig 4A that the V value of V3/V4 was 0.149 < 0.15. At the reproductive phases, the three most stable internal reference genes were selected, including 25S rRNA, 18S rRNA and ACT to make the experimental data more reliable. According to the above method, eEF-1α and eIF-4α with the lowest M value of 0.310 were the most stable reference genes at the nutritional phases, while 25S rRNA with a M value of 1.097 was the least stable reference gene under the same phase (Figure 4B). It as well as can be seen in Fig 4B that the V value of V2/V3 was 0.135 < 0.15. At the vegetative phases, the two most stable internal reference genes were selected, including eEF-1α and eIF-4α to make the experimental data more reliable. In additional, the stability of the eight internal reference genes were in descending order from high to low: eEF-1α= UBQ (M= 0.291)> ACT > β-TUB >GAPDH >18S rRNA> eIF-4α >25S rRNA (M=0.935) (Figure 4C). Furthermore, it can be seen in Fig 4C that the V value of V2/V3 was 0.135 < 0.15. In three developmental stages of leaf, the two most stable internal reference genes were selected, including eEF-1α and eIF-4α to make the experimental data more reliable.
3.4. Stability Analysis of Reference Genes by Normfinder
The Normfinder software was mainly applied based on of specific experimental conditions to evaluate the stability of each candidate reference gene. It was based on the mathematical model for separate analysis of sample subgroups and estimates the intra-group and intra-group expression changes according to the stability value (SV). The lower the stability value obtained via NormFinder, the more stable the candidate reference genes.
The results of Normfinder analysis showed in Table 3. The SV of 25S rRNA, 18S rRNA, ACT, GAPDH, UBQ, β-TUB, eEF-1α, and eIF-4α from eight different tissues at the reproductive phase was 0.354, 0.336, 0.448, 0.630, 0.375, 0.745, 0.075, and 0.532 respectively (Fig 5A). From this result, the eEF-1α (SV=0.075) had the highest stability, followed by 18S rRNA (SV= 0.336) and 25S rRNA (SV=0.354). Thus, eEF-1α, the most stable reference gene, was advised to use in the reproductive phases. Similar to the above method, 25S rRNA (SV=0.987) was ranked as the least stable gene, while the eEF-1α (SV=0.274) was as a stable gene, followed by UBQ (SV=0.344) and 18S rRNA (SV=0.375) (Fig 5B). So, the eEF-1α was the most suitable one at the nutritional phases. The Fig 5C showed that 25S rRNA (SV=0.834) was the least stable gene, while β-TUB (SV=0.161) was the most stable, followed by ACT (SV=0.260) and eEF-1α (SV=0.305). The NormFinder results indicated that β-TUB was the most suitable reference gene at three developmental stages of leaf.
3.5. Stability Analysis of Reference Genes by BestKeeper
Unlike the previous two programs, this program does not need to convert Ct values into relative expressions and can be analyzed using Ct values directly. The stability of reference genes was mainly determined by standard variation coefficient SD and variation correlation coefficient CV, and the correlation between genes and other genes was determined by correlation coefficient R. The smaller SD and CV indicated that the gene was more stable, and the smaller R indicated that the expression of gene was less correlated with other genes, so it can be used alone without the need to cooperate with other genes.
The results of the BestKeeper analysis were shown in Table 3. The results showed that the SD values of ACT, GAPDH, and β-TUB > 1 with low stability were unsuitable as reference genes at the reproductive phase. The correlation coefficient R value of 25S rRNA and 18S rRNA was relatively larger with a small SD value and CV, indicated that these two genes were suitable for synergistic use as reference genes. Comprehensive analysis showed that 25S rRNA and 18S rRNA were suitable for use as reference genes at the reproductive phases. At the nutritional phases, eEF-1α has a large correlation coefficient R and a minimum SD value and CV, indicating that gene expression stability between samples was strong and recommending that eEF-1α was suitable for reference gene. In the end, eIF-4α has a minimum correlation coefficient R (-0.11) and a minimum SD value (0.44) and CV (1.57), suggesting that the expression of eIF-4α was stable between samples and suitable for reference alone at the three developmental stages of leaf.
4. Discussion
Due to housekeeping genes participate not only in primary cell metabolism but also in other cellular functions, even the same housekeeping gene might show a different stability in gene expression among different species [14]. In different samples, different tissues from the same sample, or even different locations from the same tissue, the expression of housekeeping genes varied greatly [20,21,22,23]. On the one hand, gene expression shows temporal specificity, that means the expression of gene rigorously follows a particular time sequence, leading to changes in gene expression during different growth stages. On the other hand, it also has spatial specificity, which was established by the differential cell distribution in various organs. Gene expression can be regulated to sustain cell division and differentiation, individual growth and development, and a better ability for organisms to adapt to changes in their surroundings. So, the housekeeping genes are not constant for gene expression study and must be chosen depending on the sample and for verification purposes, because its expression is influenced by the promoter sequence or the interaction between the promoter and RNA polymerase (Zhang et al. 2007). In other words, the stability of reference gene expression is an elementary prerequisite for normalizing the expression profiles of target genes. Although stable reference genes are established in many crops, there have been no studies on reference genes in Amorphophallus [19].
There are numerous bio-pathways and genes involved in the konjac life span waiting for our exploration. Therefore, screening the best internal reference genes is important to molecular genetic research in konjac. It was the first time to investigate the most reliable reference genes for RT-qPCR analysis in konjac at the nutritional, reproduction, and different leaf developmental phases. The comprehensive results demonstrated that the suitable reference genes might vary depending on the species or other unique experimental circumstances. In conclusion, the suitable internal reference genes were 25S rRNA, 18S rRNA, and ACT at the reproductive phase, eEF-1α and eIF-4α at the nutritional stages and eEF-1α, UBQ, and ACT at different leaf development stages, respectively.
Author Contributions
Conceptualization, ZLH.; Methodology and soft-ware, YLL and CCZ; Validation, NH; Formal analysis, YLL, CCZ, YD, NH and EL; Writing original draft preparation, YLL, CCZ and YD; Supervision, YD and ZLH. All authors have read and agreed to the published version of the manuscript.
Funding
This work was supported by grants for Basic Scientific Research Business Special Funds of Wuhan University (2042016kf1106).
Institutional Review Board Statement
Not applicable.
Informed Consent Statement
Not applicable.
Data Availability Statement
No new data were created.
Acknowledgments
We thank the Wuhan University of College of Life Science for providing the experimental conditions to carry out this work.
Conflicts of Interest
The authors declare no conflict of interest.
References
- Chua, M.; Baldwin, T.C.; Hocking, T.J.; Chan, K. Traditional Uses and Potential Health Benefits of Amorphophallus Konjac K. Koch Ex N.E.Br. Journal of Ethnopharmacology 2010, 128, 268–278. [Google Scholar] [CrossRef]
- Diao, Y.; Yang, C.; Yan, M.; Zheng, X.; Jin, S.; Wang, Y.; Hu, Z. De Novo Transcriptome and Small RNA Analyses of Two Amorphophallus Species. PLoS ONE 2014, 9, e95428. [Google Scholar] [CrossRef]
- Zheng, X.; Pan, C.; Diao, Y.; You, Y.; Yang, C.; Hu, Z. Development of Microsatellite Markers by Transcriptome Sequencing in Two Species of Amorphophallus (Araceae). BMC Genomics 2013, 14, 490. [Google Scholar] [CrossRef] [PubMed]
- Sood, N.; Baker, W.L.; Coleman, C.I. Effect of Glucomannan on Plasma Lipid and Glucose Concentrations, Body Weight, and Blood Pressure: Systematic Review and Meta-Analysis. The American Journal of Clinical Nutrition 2008, 88, 1167–1175. [Google Scholar] [CrossRef] [PubMed]
- Gao, Y.; Zhang, Y.; Feng, C.; Chu, H.; Feng, C.; Wang, H.; Wu, L.; Yin, S.; Liu, C.; Chen, H.; et al. A Chromosome-Level Genome Assembly of Amorphophallus Konjac Provides Insights into Konjac Glucomannan Biosynthesis. Computational and Structural Biotechnology Journal 2022, 20, 1002–1011. [Google Scholar] [CrossRef] [PubMed]
- Nie, C.Y.; Gao, Q.Y. Deep Processing and Application of Konjac. Food Science and Technology 2022, 47, 153–158. [Google Scholar] [CrossRef]
- Das, D.; Mondal, S.; Roy, S.K.; Maiti, D.; Bhunia, B.; Maiti, T.K.; Islam, S.S. Isolation and Characterization of a Heteropolysaccharide from the Corm of Amorphophallus Campanulatus. Carbohydrate Research 2009, 344, 2581–2585. [Google Scholar] [CrossRef]
- Fei, J.; Liao, Z.; Chai, Y.; Pang, Y.; Yao, J.; Sun, X.; Tang, K. Molecular Cloning and Characterization of a Novel Mannose-Binding Lectin Gene from Amorphophallus Konjac. 7.
- Grob, G.B.J.; Gravendeel, B.; Eurlings, M.C.M. Potential Phylogenetic Utility of the Nuclear FLORICAULA/LEAFY Second Intron: Comparison with Three Chloroplast DNA Regions in Amorphophallus (Araceae). Molecular Phylogenetics and Evolution 2004, 30, 13–23. [Google Scholar] [CrossRef]
- Liu, E.; Yang, C.; Liu, J.; Jin, S.; Harijati, N.; Hu, Z.; Diao, Y.; Zhao, L. Comparative Analysis of Complete Chloroplast Genome Sequences of Four Major Amorphophallus Species. Sci Rep 2019, 9, 809. [Google Scholar] [CrossRef]
- Ginzinger, D.G. Gene Quantification Using Real-Time Quantitative PCR: An Emerging Technology Hits the Mainstream. Experimental Hematology 2002, 10. [Google Scholar] [CrossRef]
- Pfaffl, M.W. A New Mathematical Model for Relative Quantification in Real-Time RT-PCR. Nucleic Acids Research 2001, 29, 45e–445. [Google Scholar] [CrossRef] [PubMed]
- Huo, X.P.; Zhang, L.P.; Zhao, X.R.; Liu, Q.S.; Wang, H.F. Effect of RNA quality on internal reference gene selection and qRT PCR result evaluation. Biotechnology News 2018, 29, 415–418. [Google Scholar]
- Cheng, T.; Zhu, F.; Sheng, J.; Zhao, L.; Zhou, F.; Hu, Z.; Diao, Y.; Jin, S. Selection of Suitable Reference Genes for Quantitive Real-Time PCR Normalization in Miscanthus Lutarioriparia. Mol Biol Rep 2019, 46, 4545–4553. [Google Scholar] [CrossRef]
- Huang, L.; Yan, H.; Jiang, X.; Zhang, X.; Zhang, Y.; Huang, X.; Zhang, Y.; Miao, J.; Xu, B.; Frazier, T.; et al. Evaluation of Candidate Reference Genes for Normalization of Quantitative RT-PCR in Switchgrass Under Various Abiotic Stress Conditions. Bioenerg. Res. 2014, 7, 1201–1211. [Google Scholar] [CrossRef]
- Paolacci, A.R.; Tanzarella, O.A.; Porceddu, E.; Ciaffi, M. Identification and Validation of Reference Genes for Quantitative RT-PCR Normalization in Wheat. BMC Molecular Biol 2009, 10, 11. [Google Scholar] [CrossRef]
- Wu, Z.-J.; Tian, C.; Jiang, Q.; Li, X.-H.; Zhuang, J. Selection of Suitable Reference Genes for QRT-PCR Normalization during Leaf Development and Hormonal Stimuli in Tea Plant (Camellia Sinensis). Sci Rep 2016, 6, 19748. [Google Scholar] [CrossRef]
- Wang, M.; Wang, Q.; Zhang, B. Evaluation and Selection of Reliable Reference Genes for Gene Expression under Abiotic Stress in Cotton (Gossypium Hirsutum L.). Gene 2013, 530, 44–50. [Google Scholar] [CrossRef]
- Wang, K.; Niu, Y.; Wang, Q.; Liu, H.; Jin, Y.; Zhang, S. Cloning and Evaluation of Reference Genes for Quantitative Real-Time PCR Analysis in Amorphophallus. 2017.
- Dheda, K.; Huggett, J.F.; Bustin, S.A.; Johnson, M.A.; Rook, G.; Zumla, A. Validation of Housekeeping Genes for Normalizing RNA Expression in Real-Time PCR. BioTechniques 2004, 37, 112–119. [Google Scholar] [CrossRef]
- Hisbergues, M.; Christiansen, G.; Rouhiainen, L.; Sivonen, K.; Börner, T. PCR-Based Identification of Microcystin-Producing Genotypes of Different Cyanobacterial Genera. Archives of Microbiology 2003, 180, 402–410. [Google Scholar] [CrossRef]
- Lee, P.D.; Sladek, R.; Greenwood, C.M.T.; Hudson, T.J. Control Genes and Variability: Absence of Ubiquitous Reference Transcripts in Diverse Mammalian Expression Studies. Genome Res. 2002, 12, 292–297. [Google Scholar] [CrossRef]
- Zmienko, A.; Samelak-Czajka, A.; Goralski, M.; Sobieszczuk-Nowicka, E.; Kozlowski, P.; Figlerowicz, M. Selection of Reference Genes for QPCR- and DdPCR-Based Analyses of Gene Expression in Senescing Barley Leaves. PLoS ONE 2015, 10, e0118226. [Google Scholar] [CrossRef] [PubMed]
Figure 1.
Melting curve of the 8 reference genes showing a single peak.
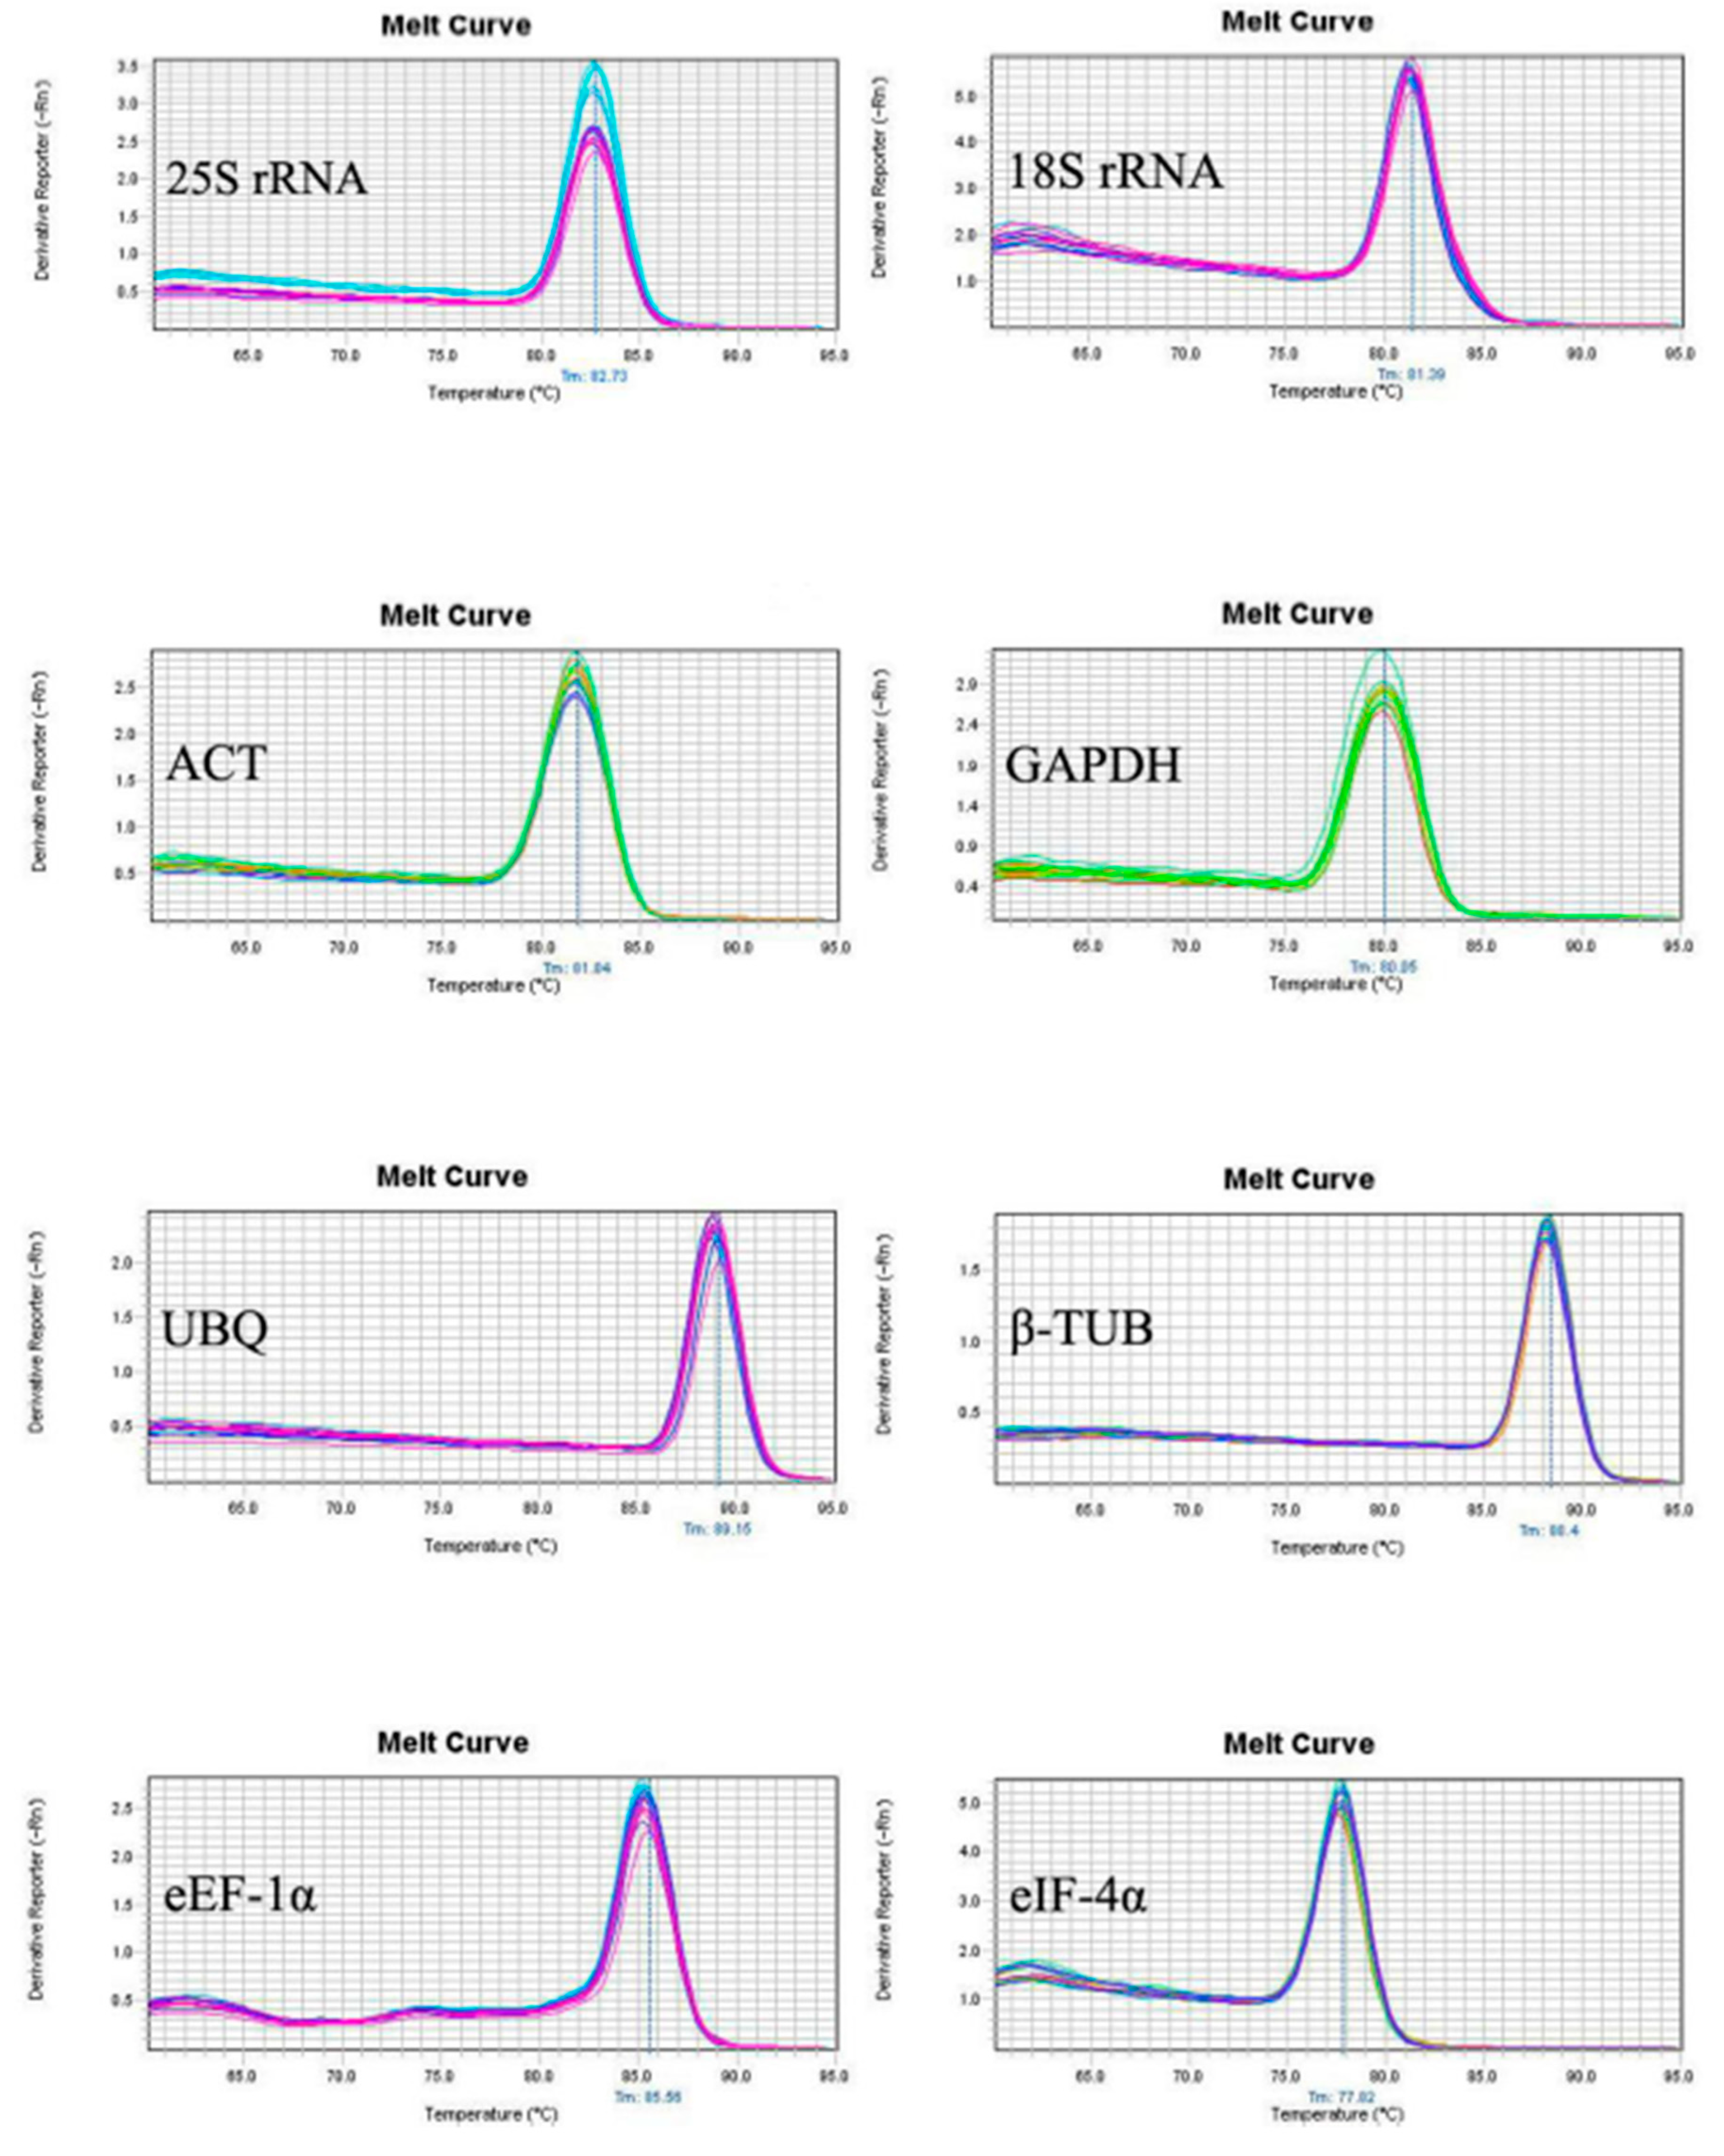
Figure 2.
Standard curves of the 8 candidate housekeeping genes.
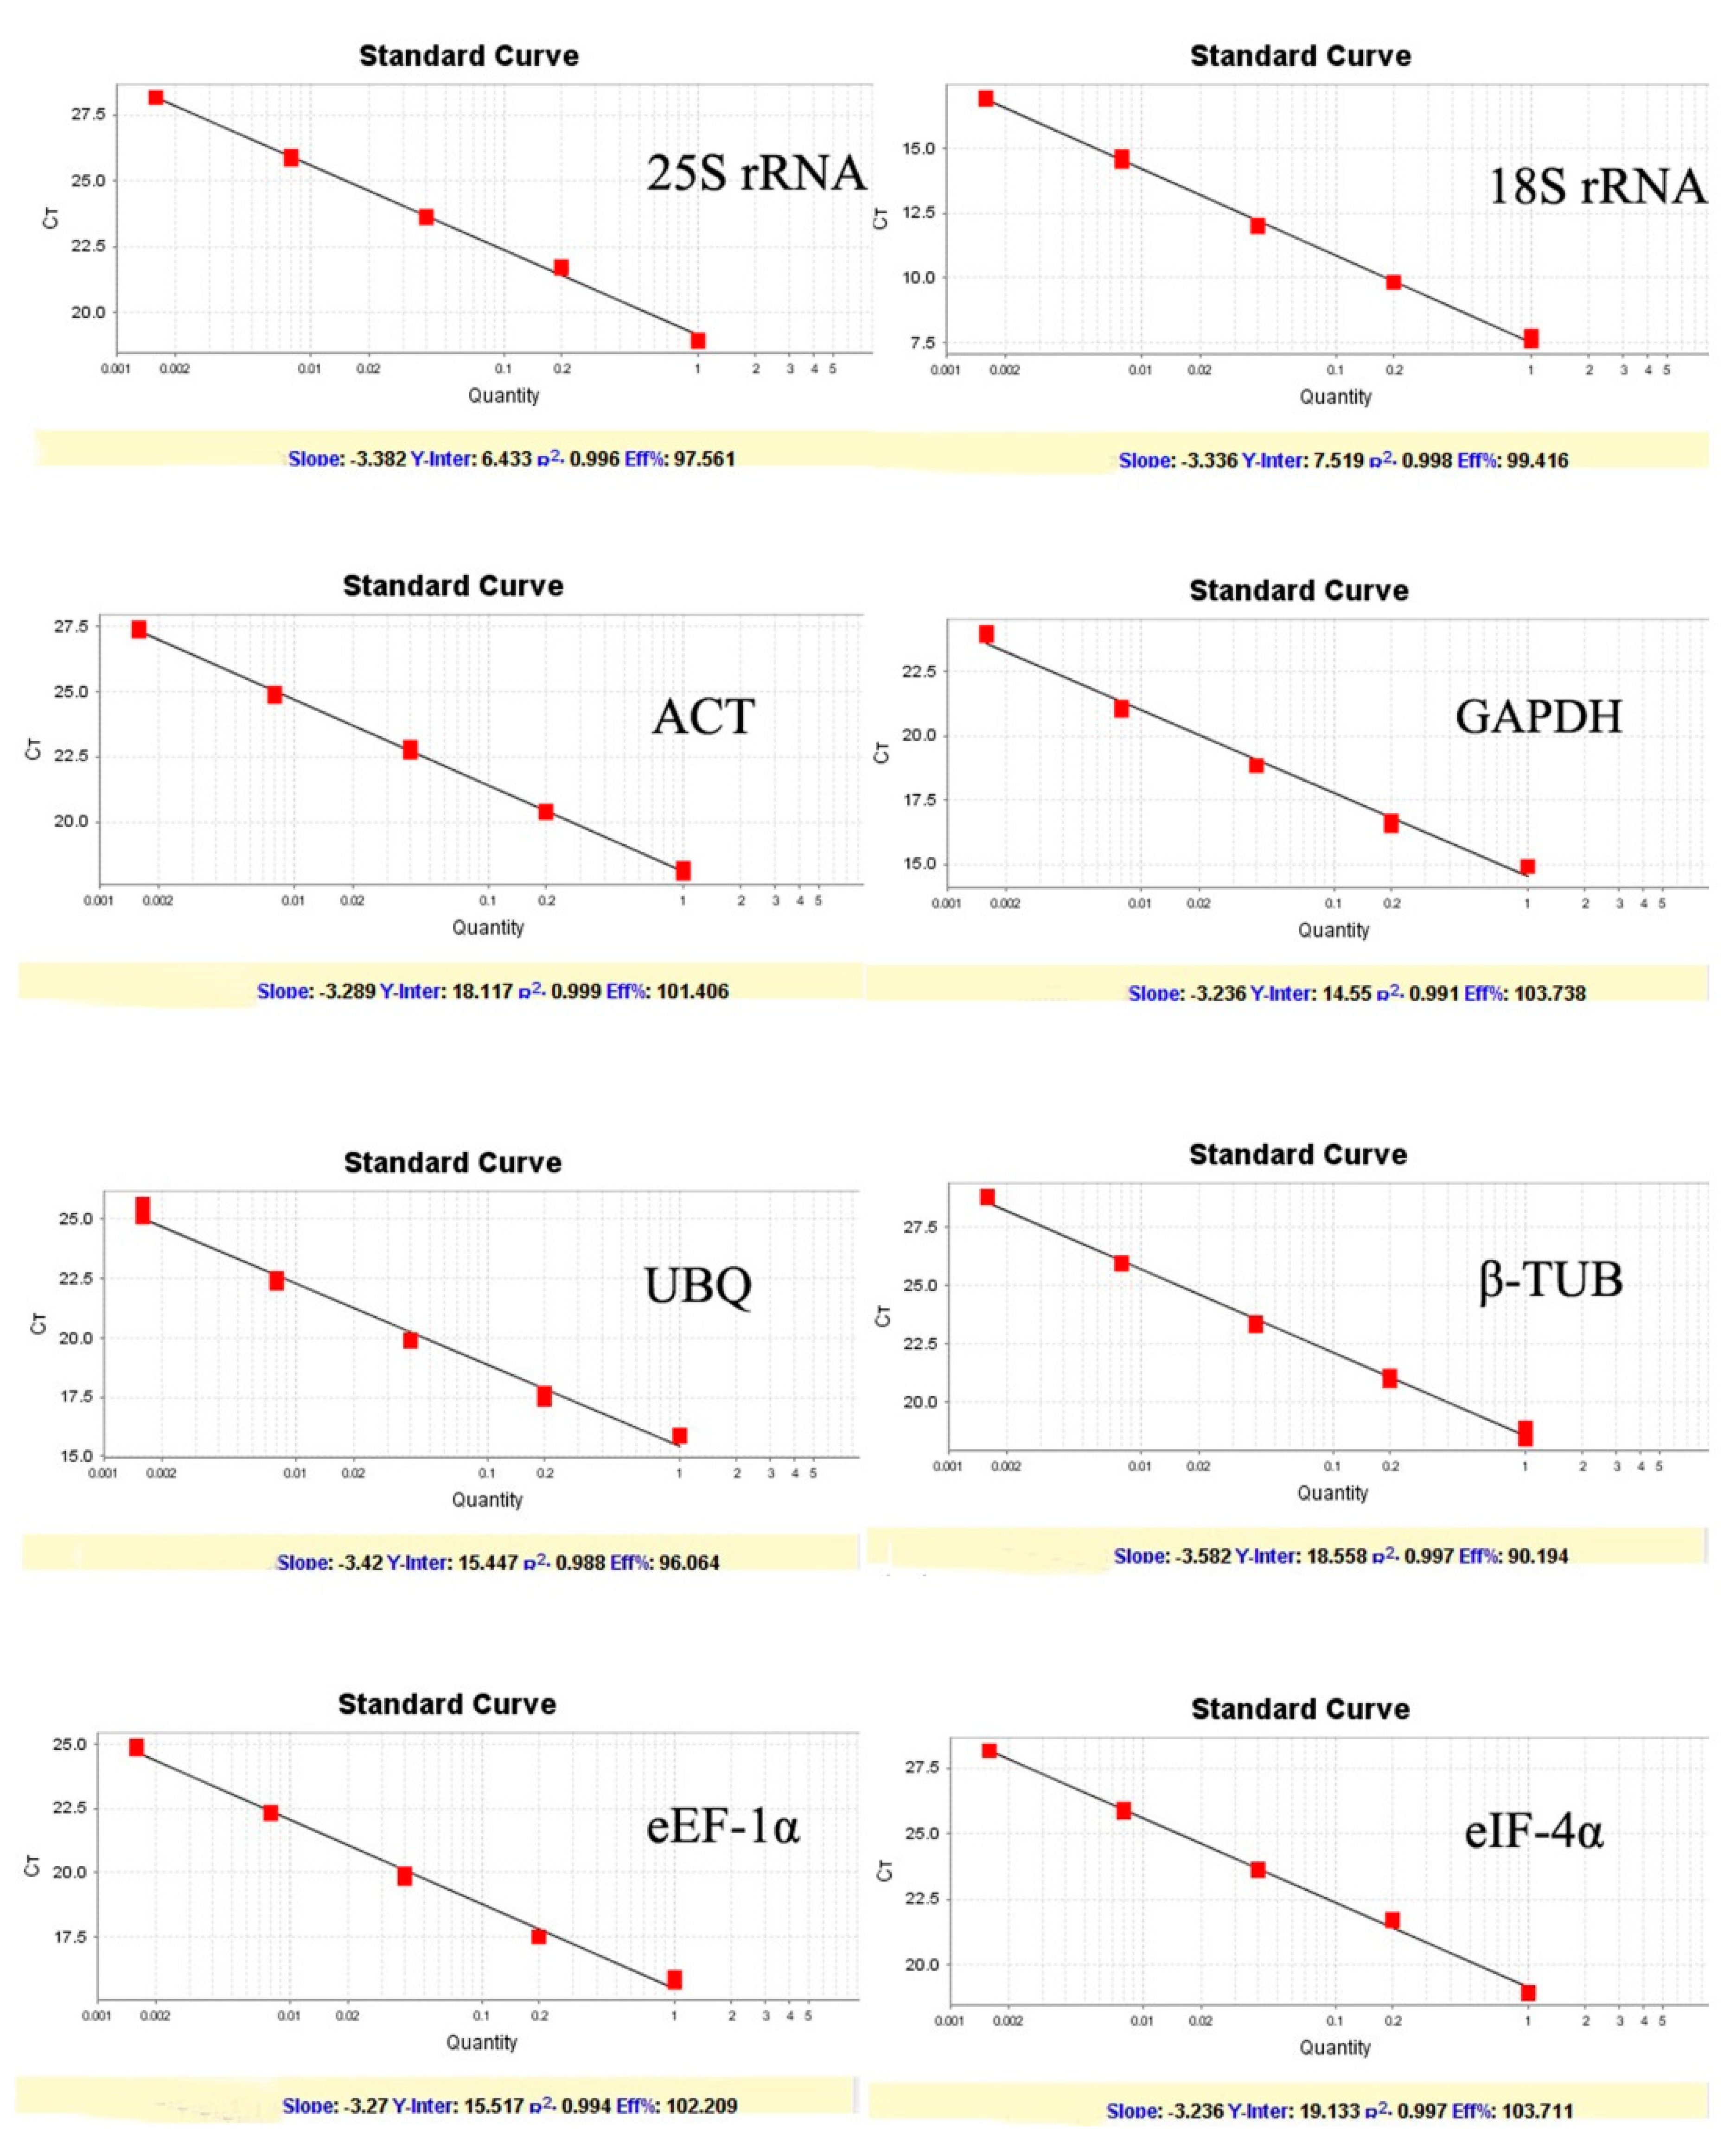
Figure 3.
Cycle threshold (Ct) values of the calculated reference genes of all samples used in the experiments. Raw Ct values of fourteen samples were showed by a box plot. Box-plot graph of Ct value shows the mean of values as line across the box. Short-term represented the maximum and minimum values. Lower and upper boxes indicated the 25th percentile to the 75th percentile.
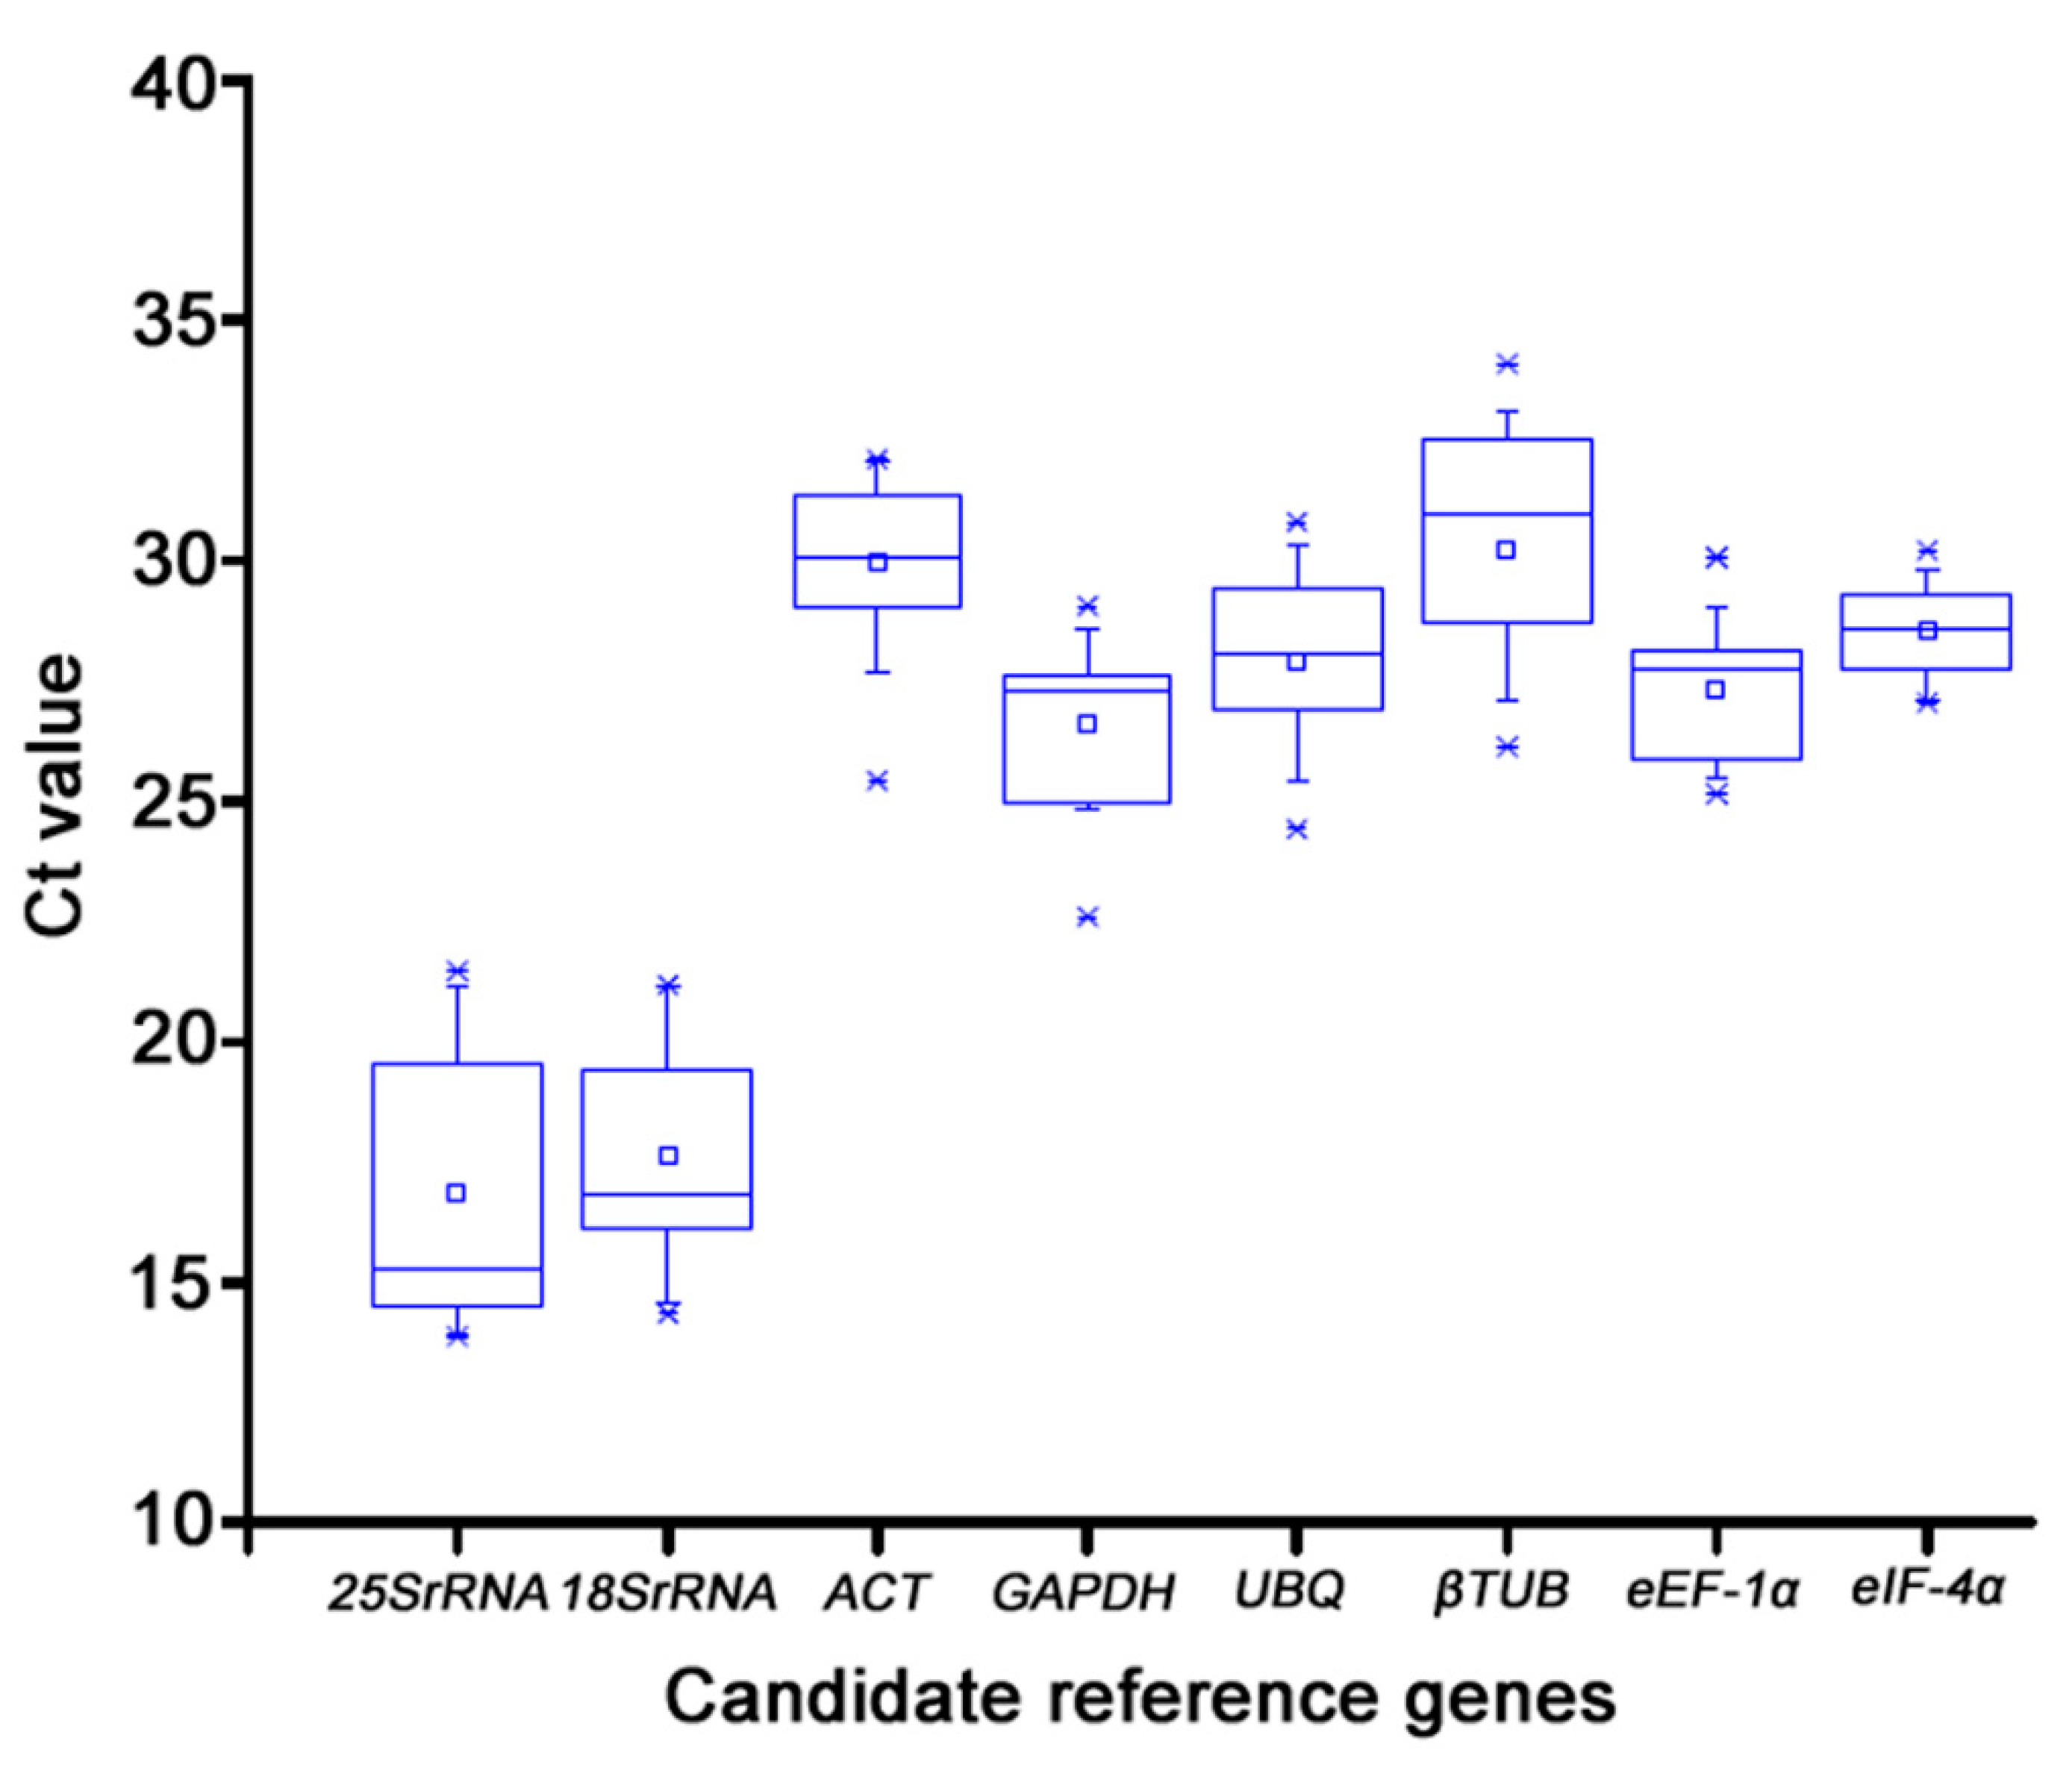
Figure 4.
Gene exression stability values (M) (Right) and Pairwise variation (V) (Left) of candidate reference genes calculated by geNorm. A. Ranking of the gene expression stability performed of all samples in reproductive phase. The least stable genes are on the left and the most stable genes on the right. Pairwise variation (Vn/Vn+1) was analyzed between the normalization factors NFn and NFn+1 in reproductive phase. B. Ranking of the gene expression stability performed of all samples in vegetative phase. The least stable genes are on the left and the most stable genes on the right. Pairwise variation (Vn/Vn+1) was analyzed between the normalization factors NFn and NFn+1 in vegetative phase. C. Ranking of the gene expression stability performed of all samples in different developmental stages of leaves. The least stable genes are on the left and the most stable genes on the right. Pairwise variation (Vn/Vn+1) was analyzed between the normalization factors NFn and NFn+1 in different developmental stages of leaves.
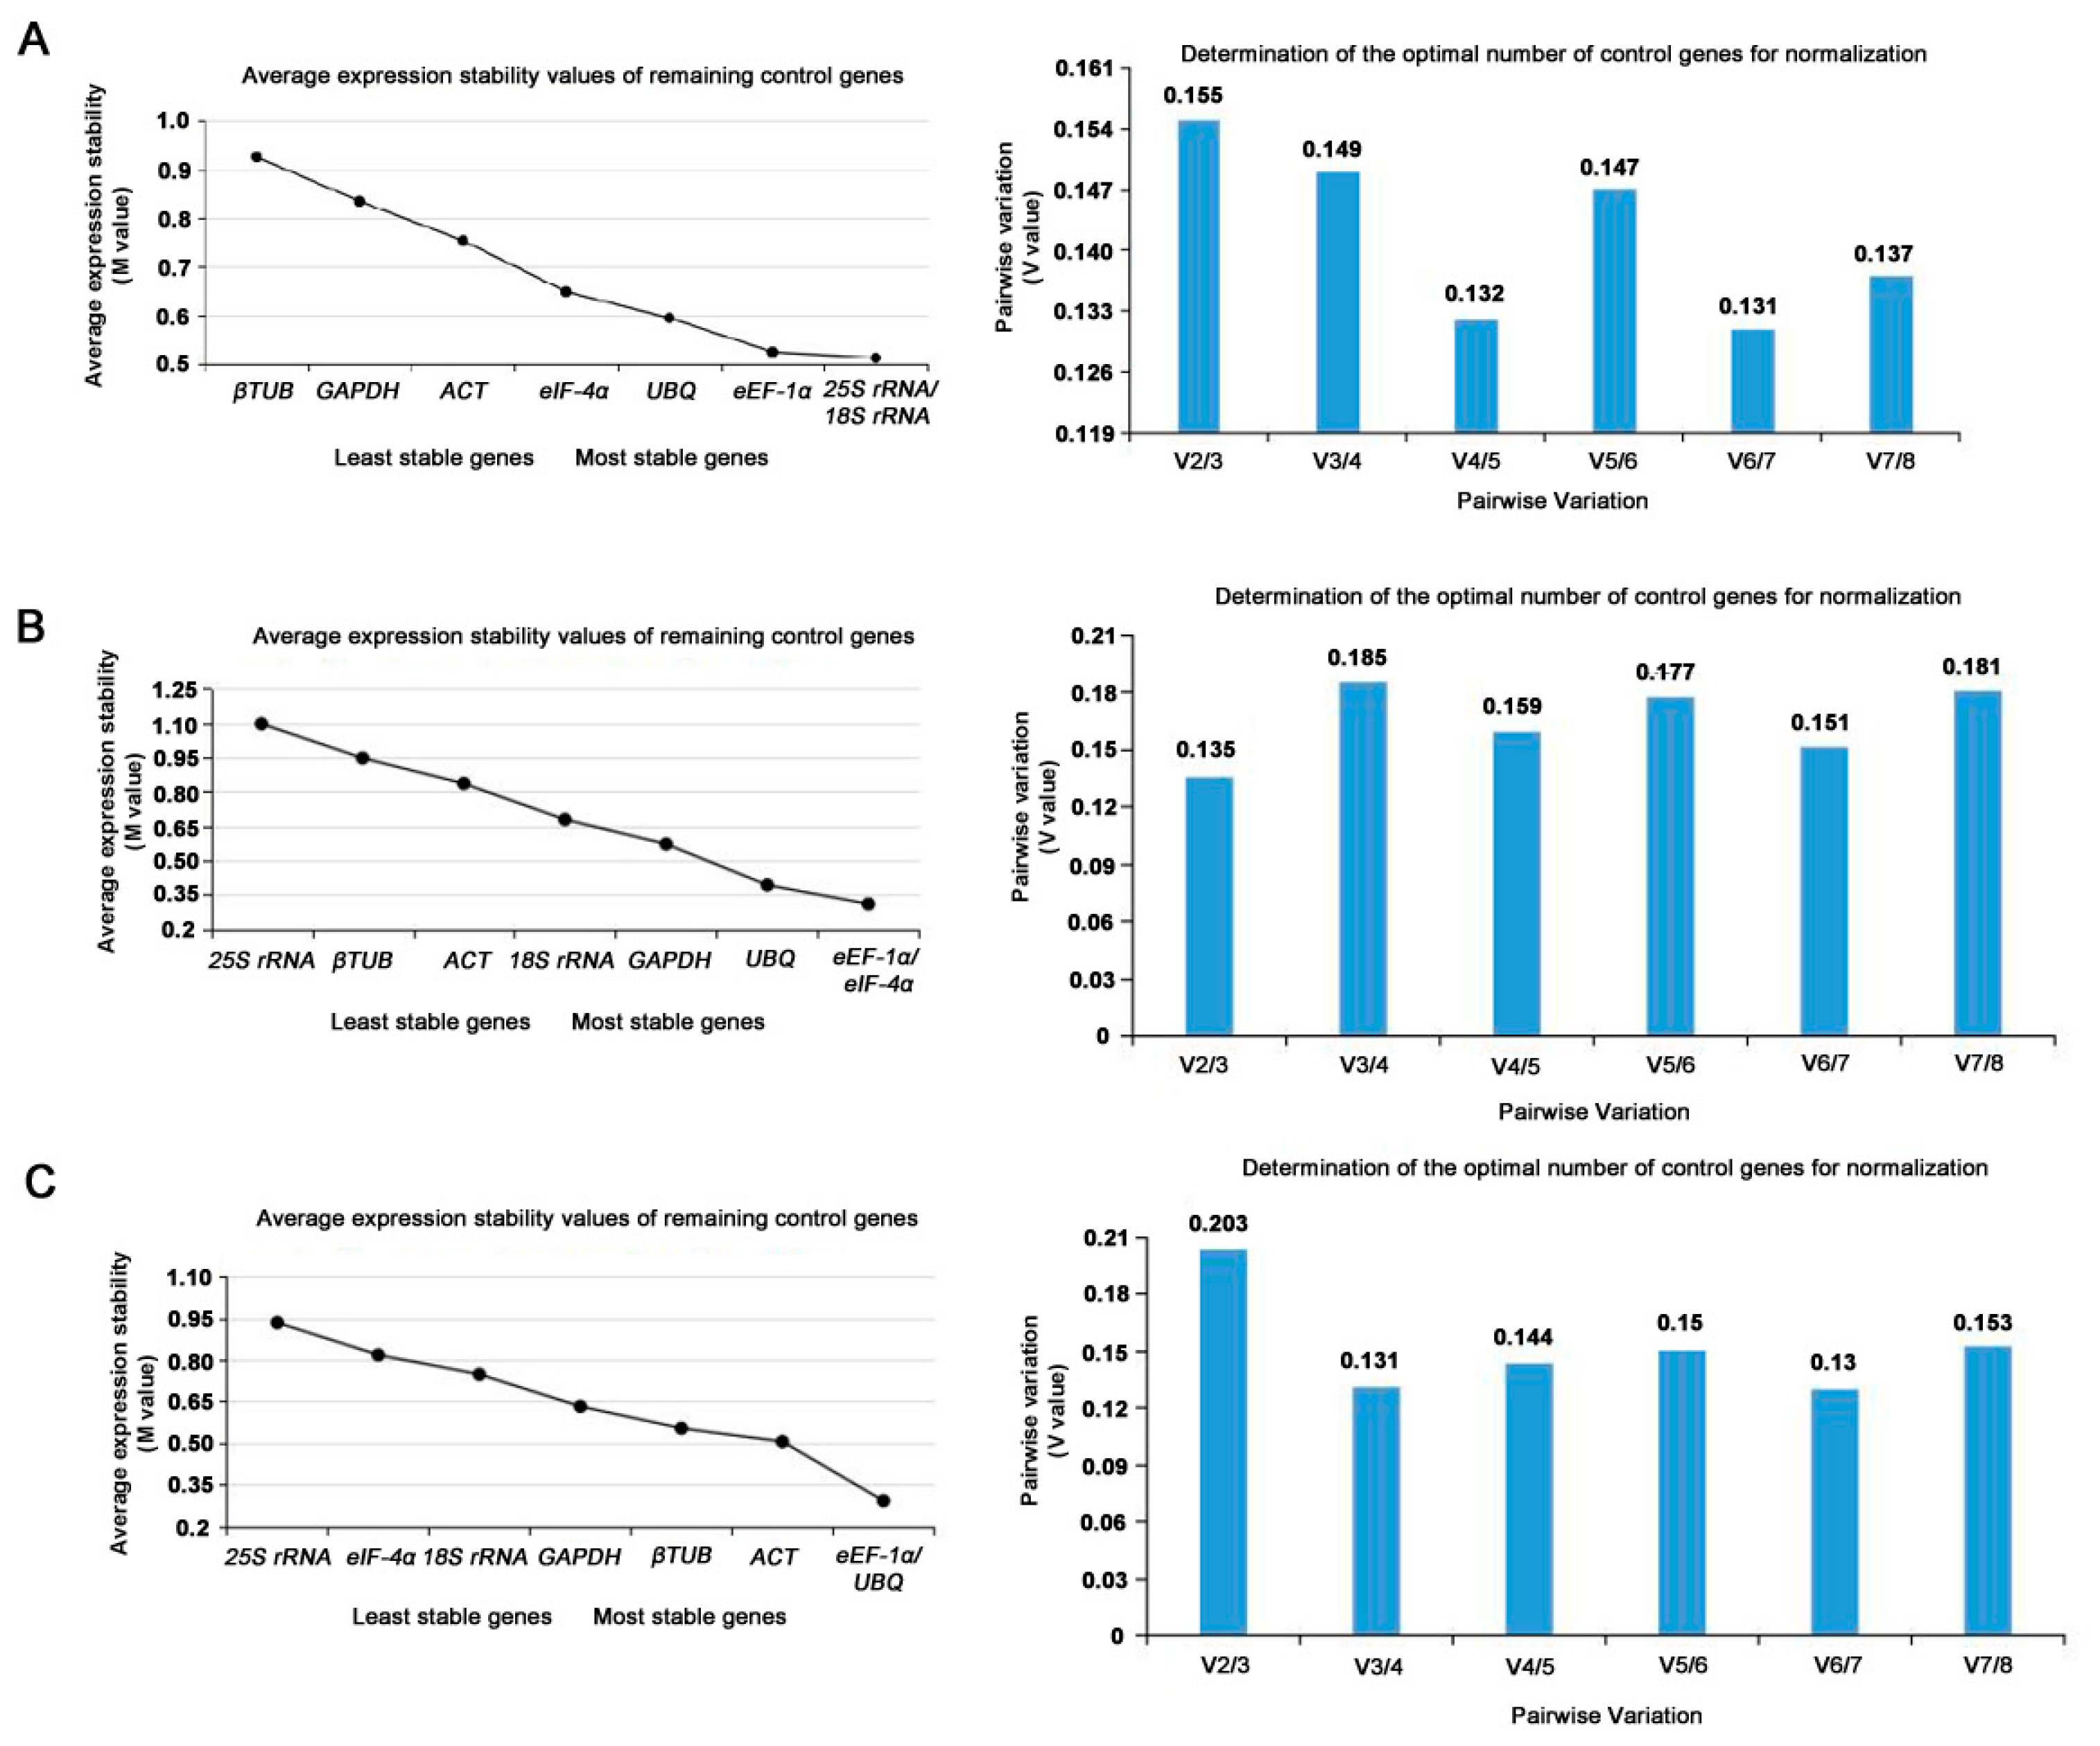

Table 1.
Plant materials used in this study.
| Growing stage | Spathe | Append age | Stamen | Pistil | Inflorescence axis | Inflorescence stalk | Tuber | Root | Leaf | Petiole |
|---|---|---|---|---|---|---|---|---|---|---|
| Reproductive period | √ | √ | √ | √ | √ | √ | ||||
| Nutritional growing period | √ | √ | √ | √ | ||||||
| Germinating period Leaf opening period Leaf mature period |
|
|
|
|
|
|
|
|
√ √ √ √ |
|
Table 2.
Summary of candidate reference genes and their parameters derived from RT-qPCR analysis.
| Gene name | Sequence primer 5'-3' | Size (bp) | PCR efficiency (%) | R2 |
|---|---|---|---|---|
| 25S rRNA | F: CGCCCTCGACCTATTCTCAAA R: CTTACCAAAAATGGCCCACTT |
103 | 97.56 | 0.995 |
| 18S rRNA | F: AGACGAACAACTGCGAAAGC R: GGCGGAGTCCTAAGAGCAAC |
149 | 99.41 | 0.998 |
| ACT | F: TGAACGTGAAATTGTAAGGGAC R: CAGATGAGCTAGTCTTGGCAGT |
95 | 101.40 | 0.999 |
| GAPDH | F: AGAGGAGCGAGGCAGTTAGTG R: CCCATGTTTGTTGTTGGTGTA |
95 | 103.73 | 0.991 |
| UBQ | F: CCAGCAGCGCCTCATCTTTG R: CTTGGGCTTGGTGTAGGTCTTC |
151 | 96.06 | 0.998 |
| β-TUB | F: CGGATGATGCTGACCTTCTCG R: ATGCACTCGTCGGCGTTCTC |
116 | 90.19 | 0.997 |
| eEF-1α | F: CTGAAGAATGGCGATGCTGG R: ACCGTCTGCCTCATGTCCCT |
119 | 102.20 | 0.994 |
| eIF-4α | F: AGCATTTCATCCGCTTCGTC R: TTGTGGGTACTCCTGGTCGT |
100 | 103.71 | 0.997 |
Table 3.
Gene expression stability ranked by geNorm, Normfinder and BestKeeper.
| Different developmental stage of Konjac | Gene name | geNorm Stability (M) |
Normfinder Stability (SV) |
BestKeeper | Stability | |
|---|---|---|---|---|---|---|
| SD | CV% | r | ||||
| Reproductive phase | 25S rRNA | 0.513 | 0.354 | 0.56 | 3.83 | 0.89 |
| 18S rRNA | 0.513 | 0.336 | 0.70 | 4.38 | 0.91 | |
| ACT | 0.754 | 0.448 | 1.64 | 5.58 | 0.95 | |
| GAPDH | 0.835 | 0.630 | 1.64 | 6.27 | 0.93 | |
| UBQ | 0.595 | 0.375 | 0.90 | 3.4 | 0.91 | |
| β-TUB | 0.926 | 0.745 | 1.17 | 4.11 | 0.81 | |
| eEF-1α | 0.525 | 0.075 | 0.81 | 3.06 | 0.86 | |
| eIF-4α | 0.649 | 0.532 | 0.69 | 2.38 | 0.83 | |
| Nutritional phase | 25S rRNA | 1.097 | 0.987 | 1.27 | 6.51 | 0.99 |
| 18S rRNA | 0.679 | 0.375 | 1.08 | 5.37 | 0.98 | |
| ACT | 0.836 | 0.552 | 0.61 | 2.01 | 0.50 | |
| GAPDH | 0.572 | 0.430 | 0.90 | 3.38 | 0.82 | |
| UBQ | 0.393 | 0.344 | 0.42 | 1.41 | 0.50 | |
| β-TUB | 0.947 | 0.802 | 0.75 | 2.34 | 0.28 | |
| eEF-1α | 0.310 | 0.274 | 0.24 | 0.86 | 0.88 | |
| eIF-4α | 0.310 | 0.521 | 0.31 | 1.11 | -0.55 | |
| Three developmental stages of leaves | 25S rRNA | 0.935 | 0.834 | 1.11 | 5.62 | 0.82 |
| 18S rRNA | 0.748 | 0.517 | 0.46 | 2.35 | 0.85 | |
| ACT | 0.505 | 0.260 | 1.05 | 3.38 | 0.98 | |
| GAPDH | 0.632 | 0.440 | 0.83 | 2.97 | 1.00 | |
| UBQ | 0.291 | 0.434 | 0.55 | 1.82 | 0.60 | |
| β-TUB | 0.553 | 0.161 | 1.17 | 3.58 | 0.96 | |
| eEF-1α | 0.291 | 0.305 | 0.74 | 2.56 | 0.85 | |
| eIF-4α | 0.818 | 0.711 | 0.44 | 1.57 | -0.11 | |
Disclaimer/Publisher’s Note: The statements, opinions and data contained in all publications are solely those of the individual author(s) and contributor(s) and not of MDPI and/or the editor(s). MDPI and/or the editor(s) disclaim responsibility for any injury to people or property resulting from any ideas, methods, instructions or products referred to in the content. |
© 2023 by the authors. Licensee MDPI, Basel, Switzerland. This article is an open access article distributed under the terms and conditions of the Creative Commons Attribution (CC BY) license (http://creativecommons.org/licenses/by/4.0/).
Copyright: This open access article is published under a Creative Commons CC BY 4.0 license, which permit the free download, distribution, and reuse, provided that the author and preprint are cited in any reuse.


