Submitted:
27 June 2023
Posted:
29 June 2023
You are already at the latest version
Abstract
Keywords:
1. Introduction
2. Related work
2.1. Remote sensing image-text cross-modal retrieval
2.2. Text and image encoders based on Transformer
2.3. vision-language pre-training (VLP) model
2.4. Contrastive learning
3. Method
3.1. Unimodal encoder
3.1.1. Image encoder
3.1.2. Text encoder
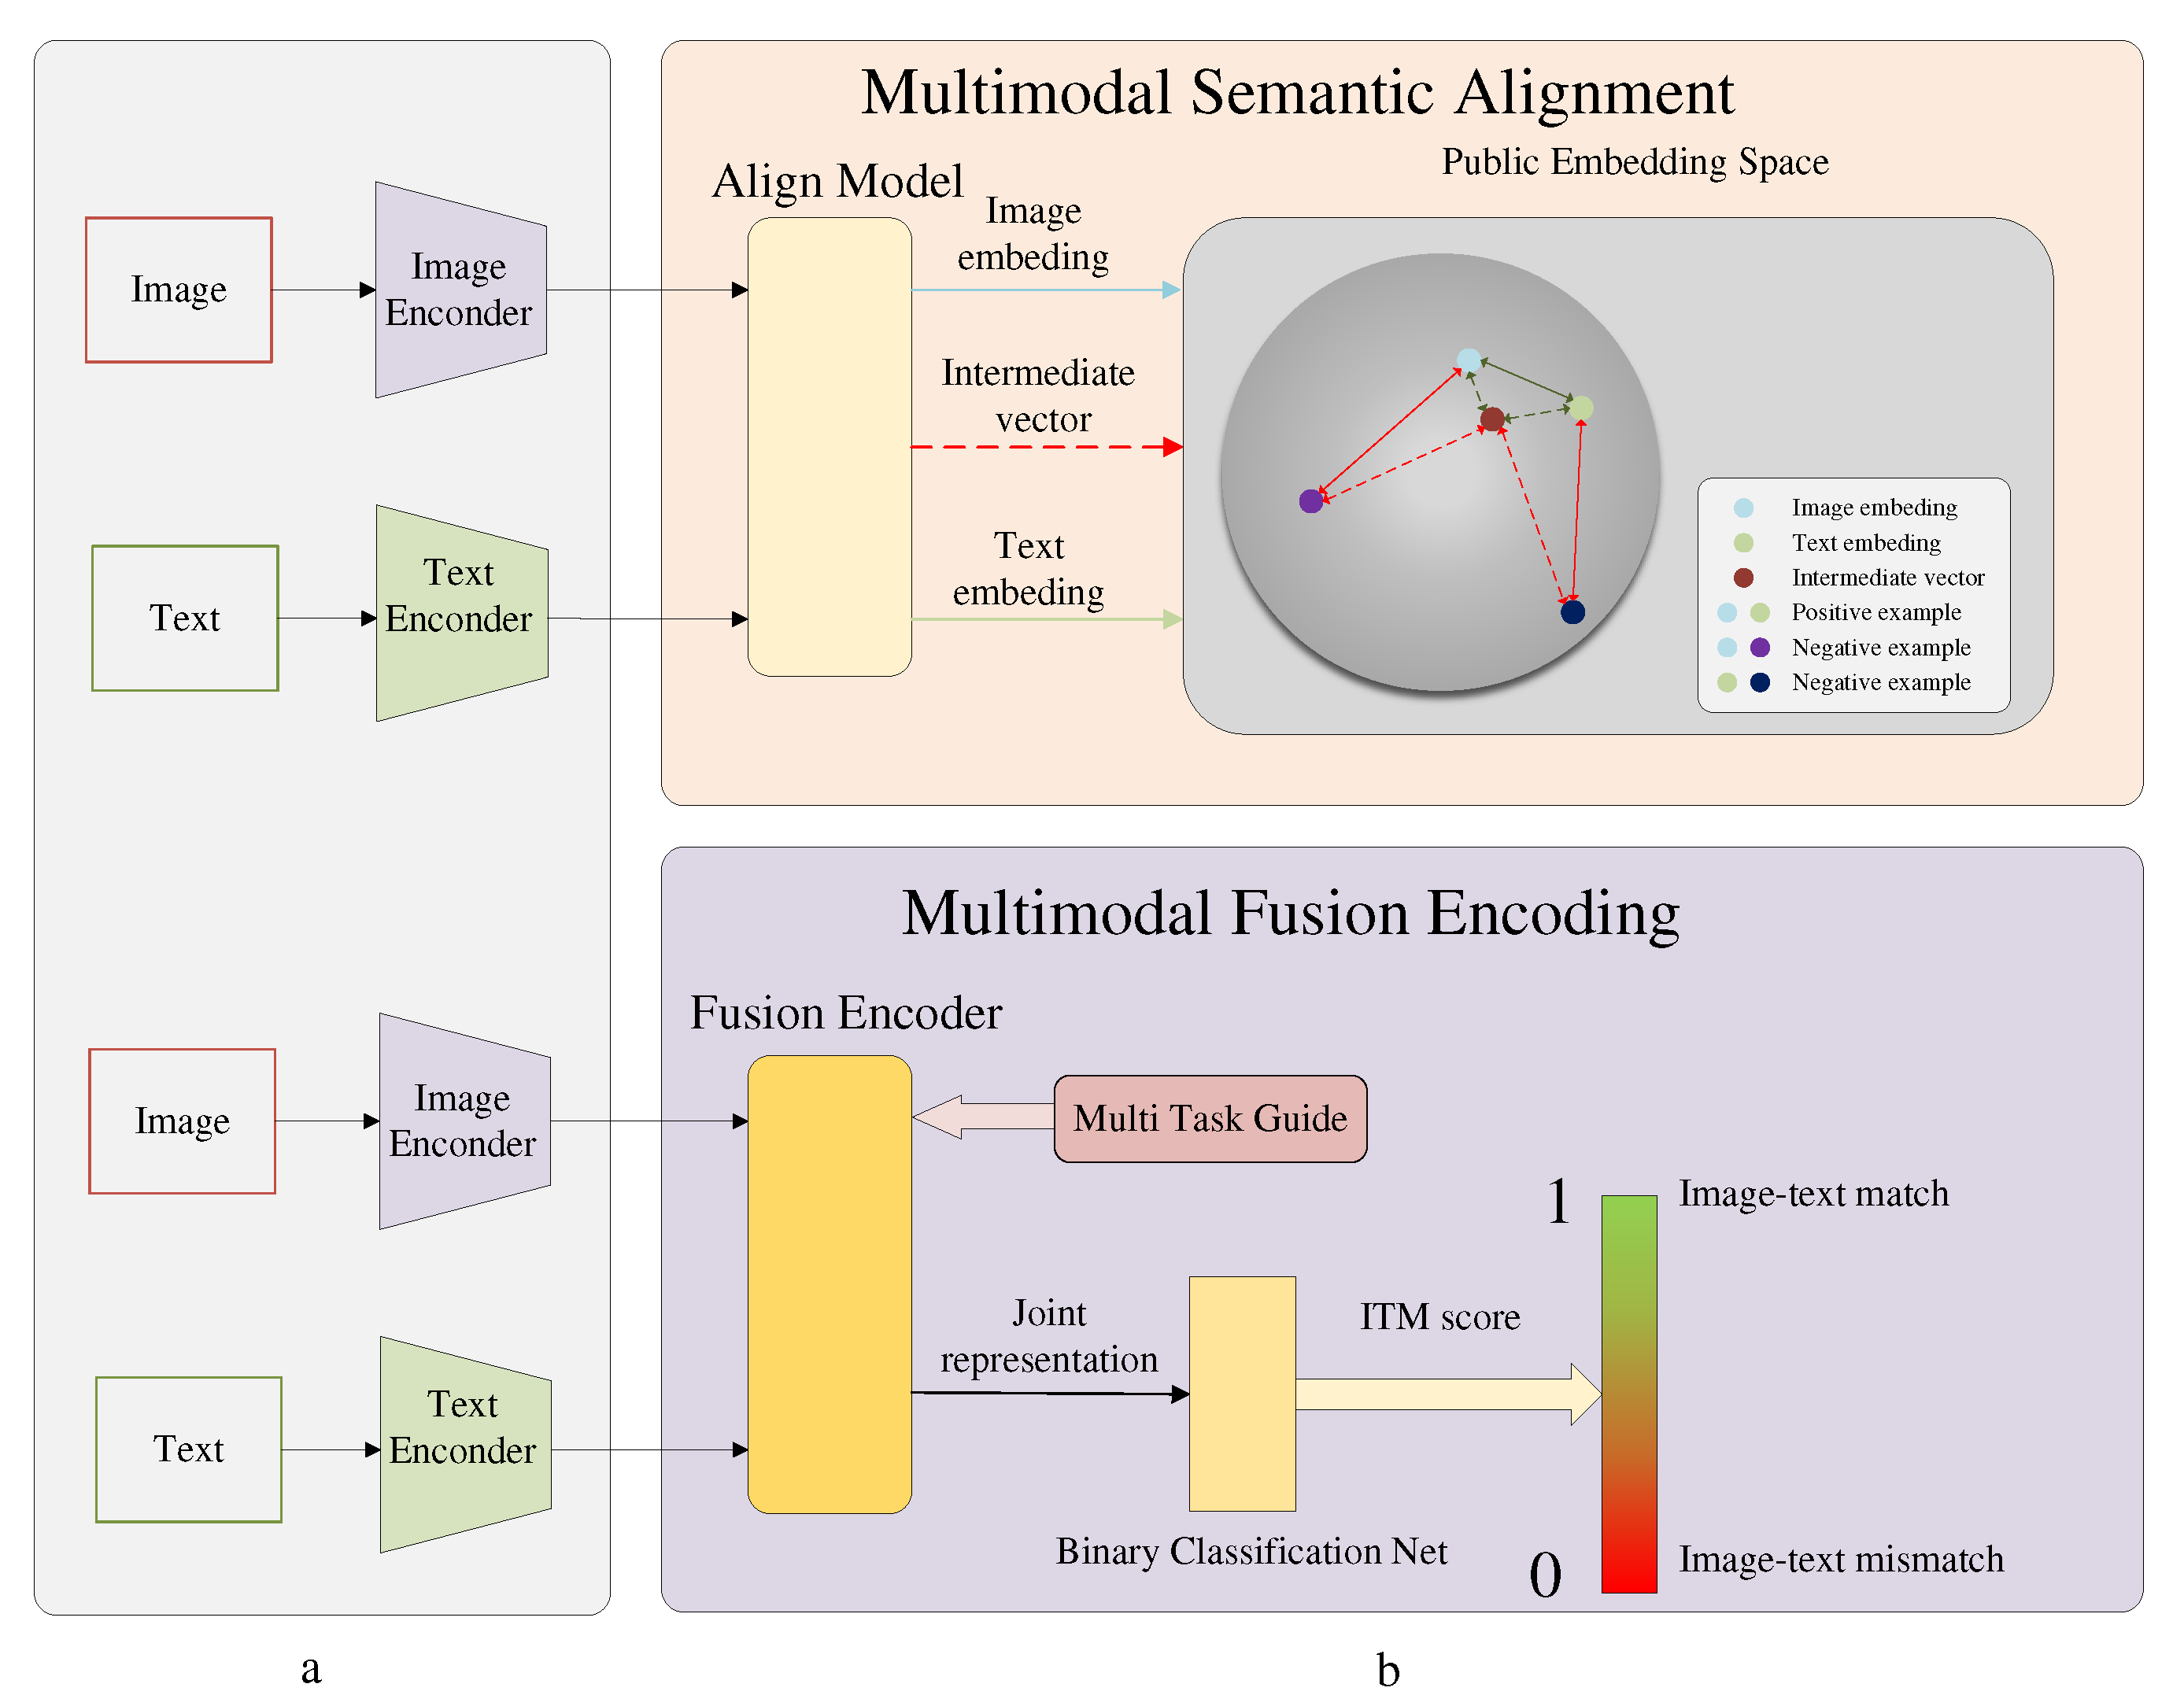
3.2. Multimodal fusion encoder
3.3. Multimodal fusion encoder training task
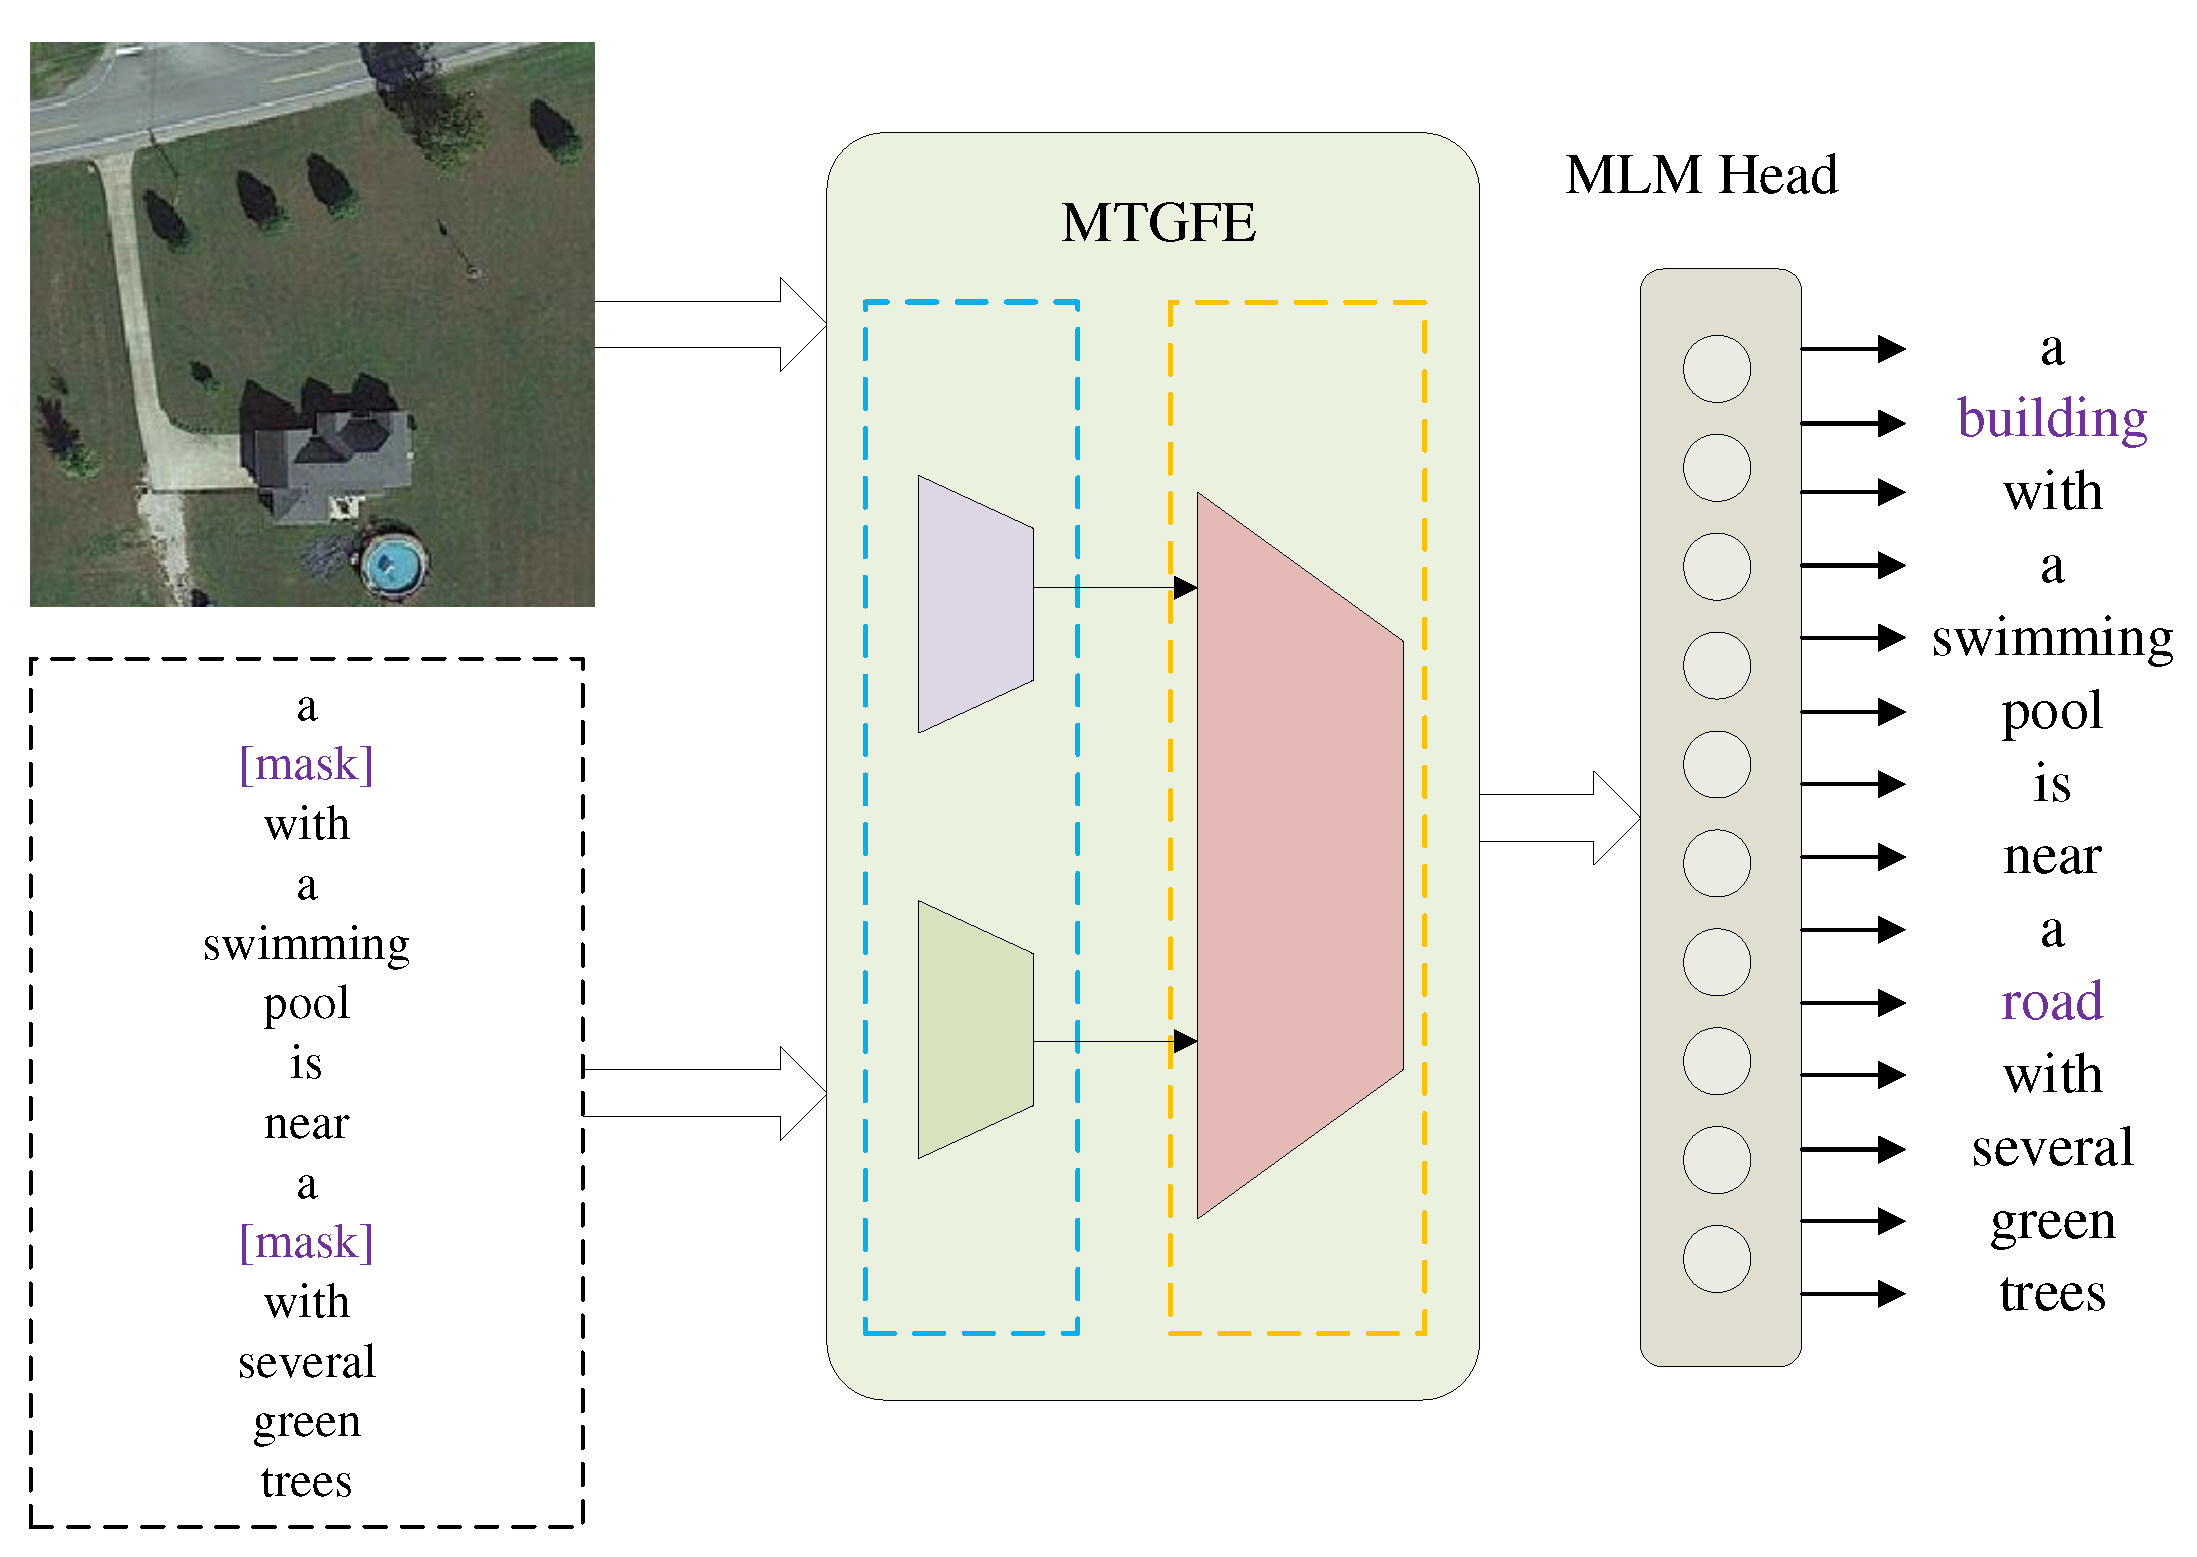
3.3.1. MLM
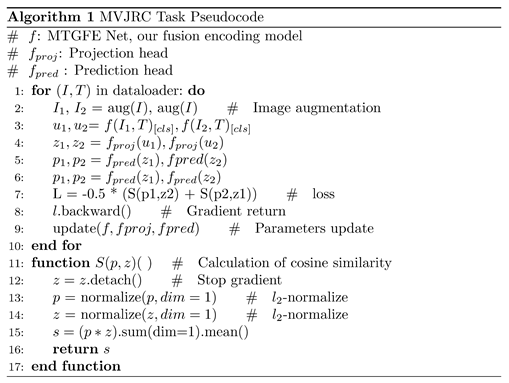
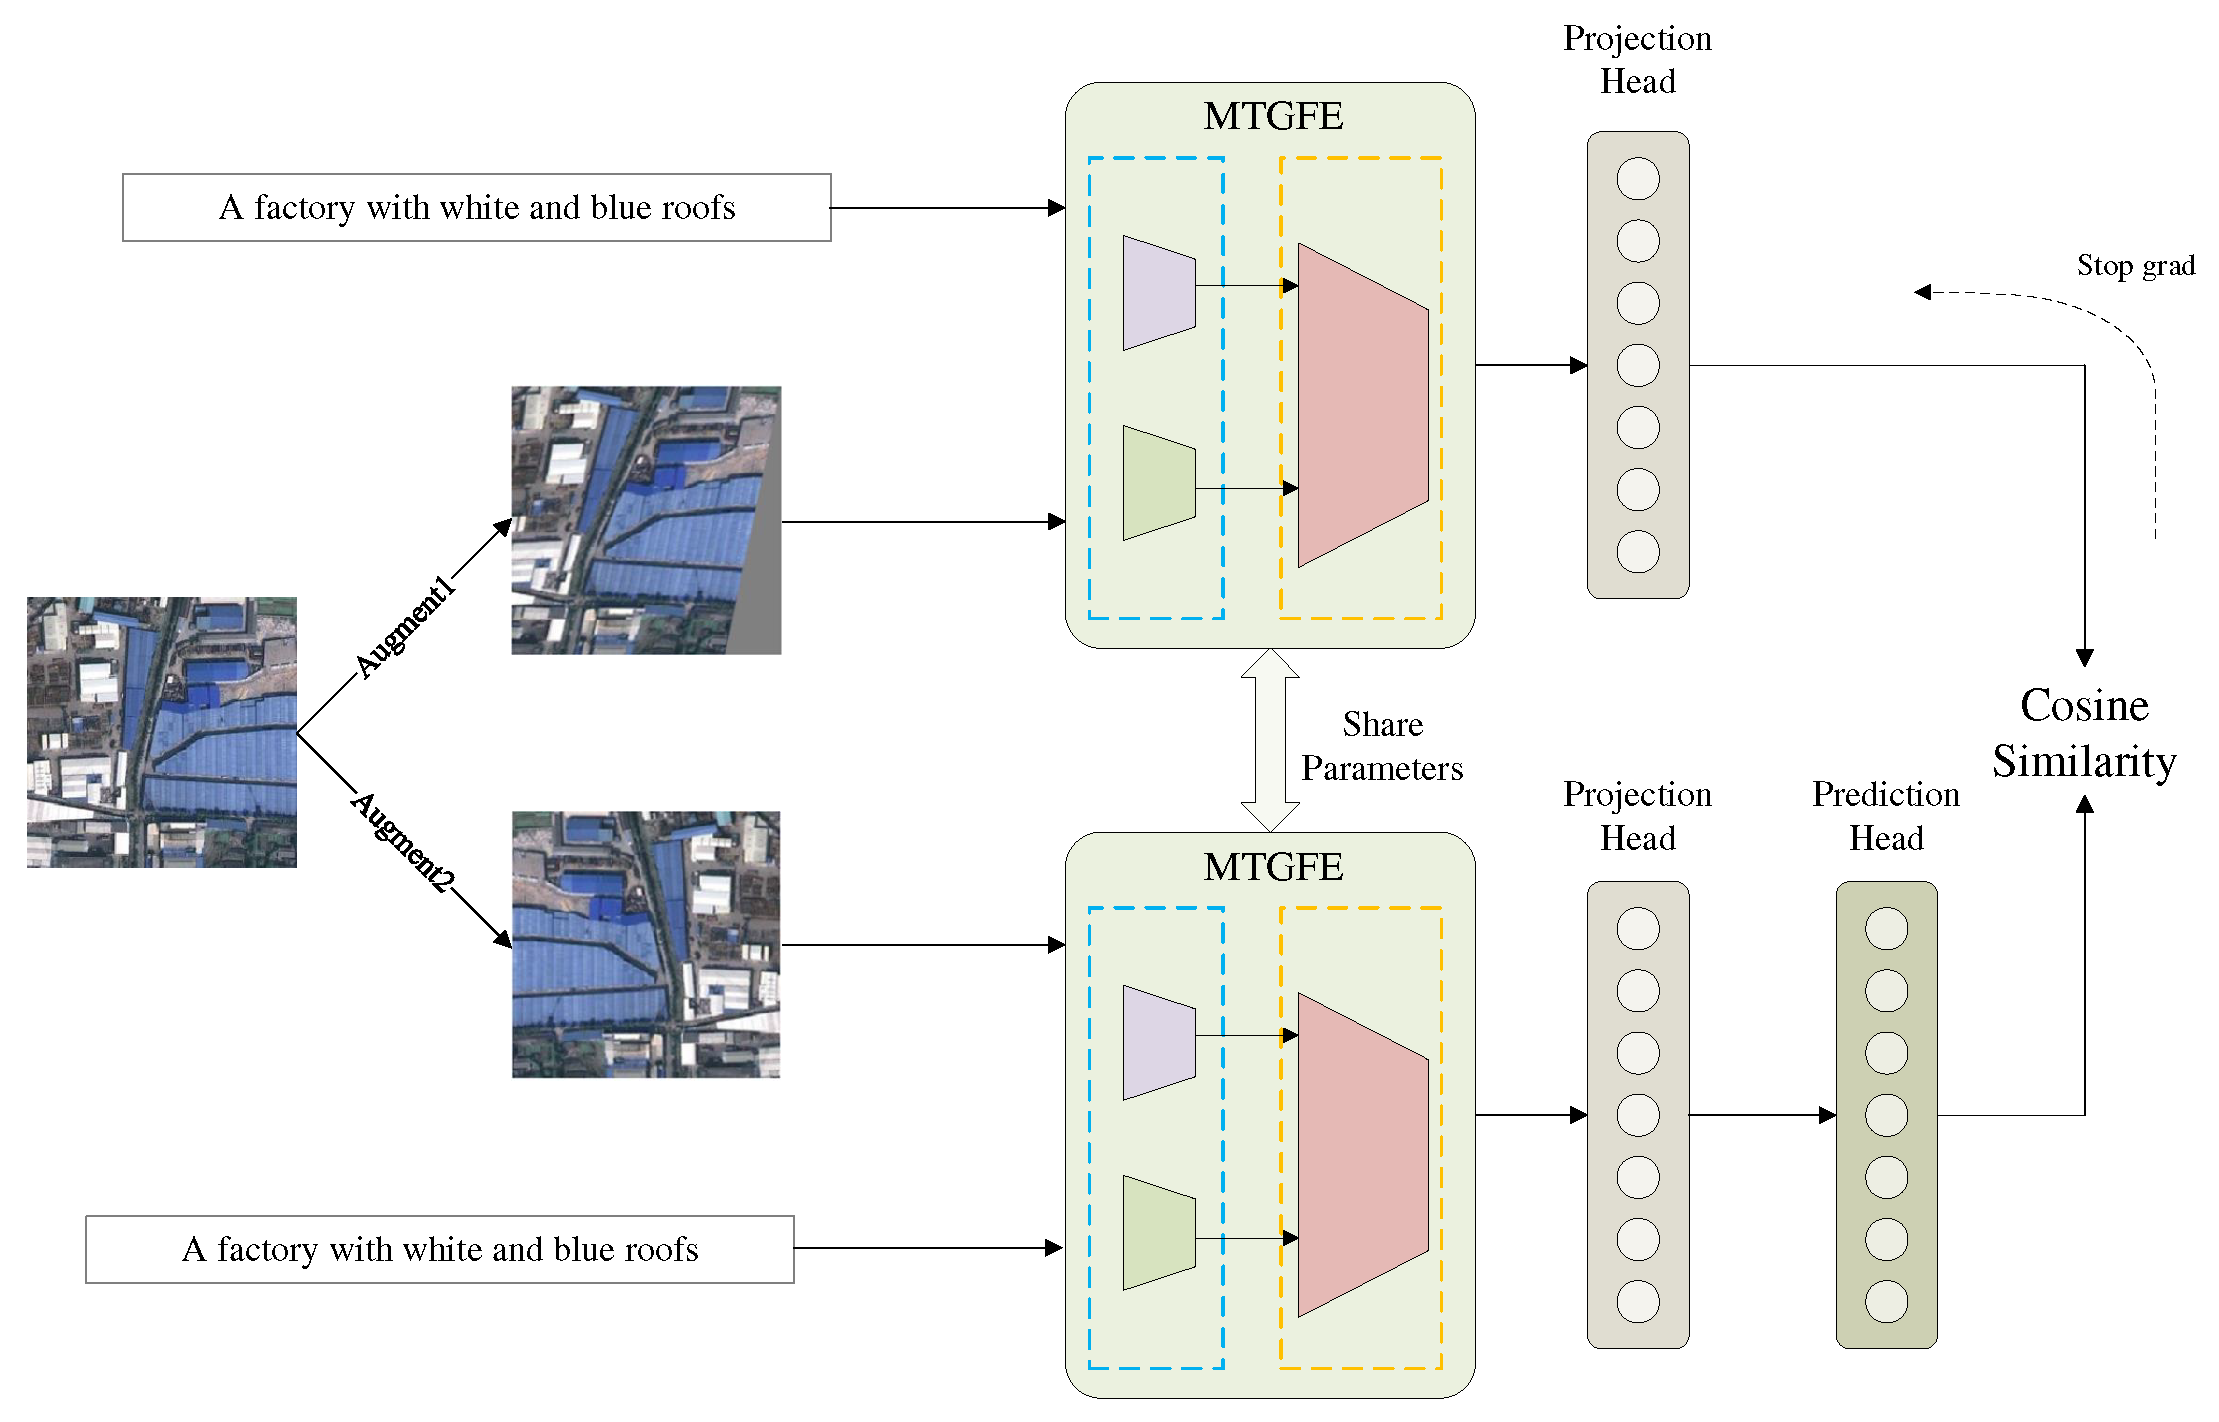
3.3.2. MVJRC
3.3.3. ITM
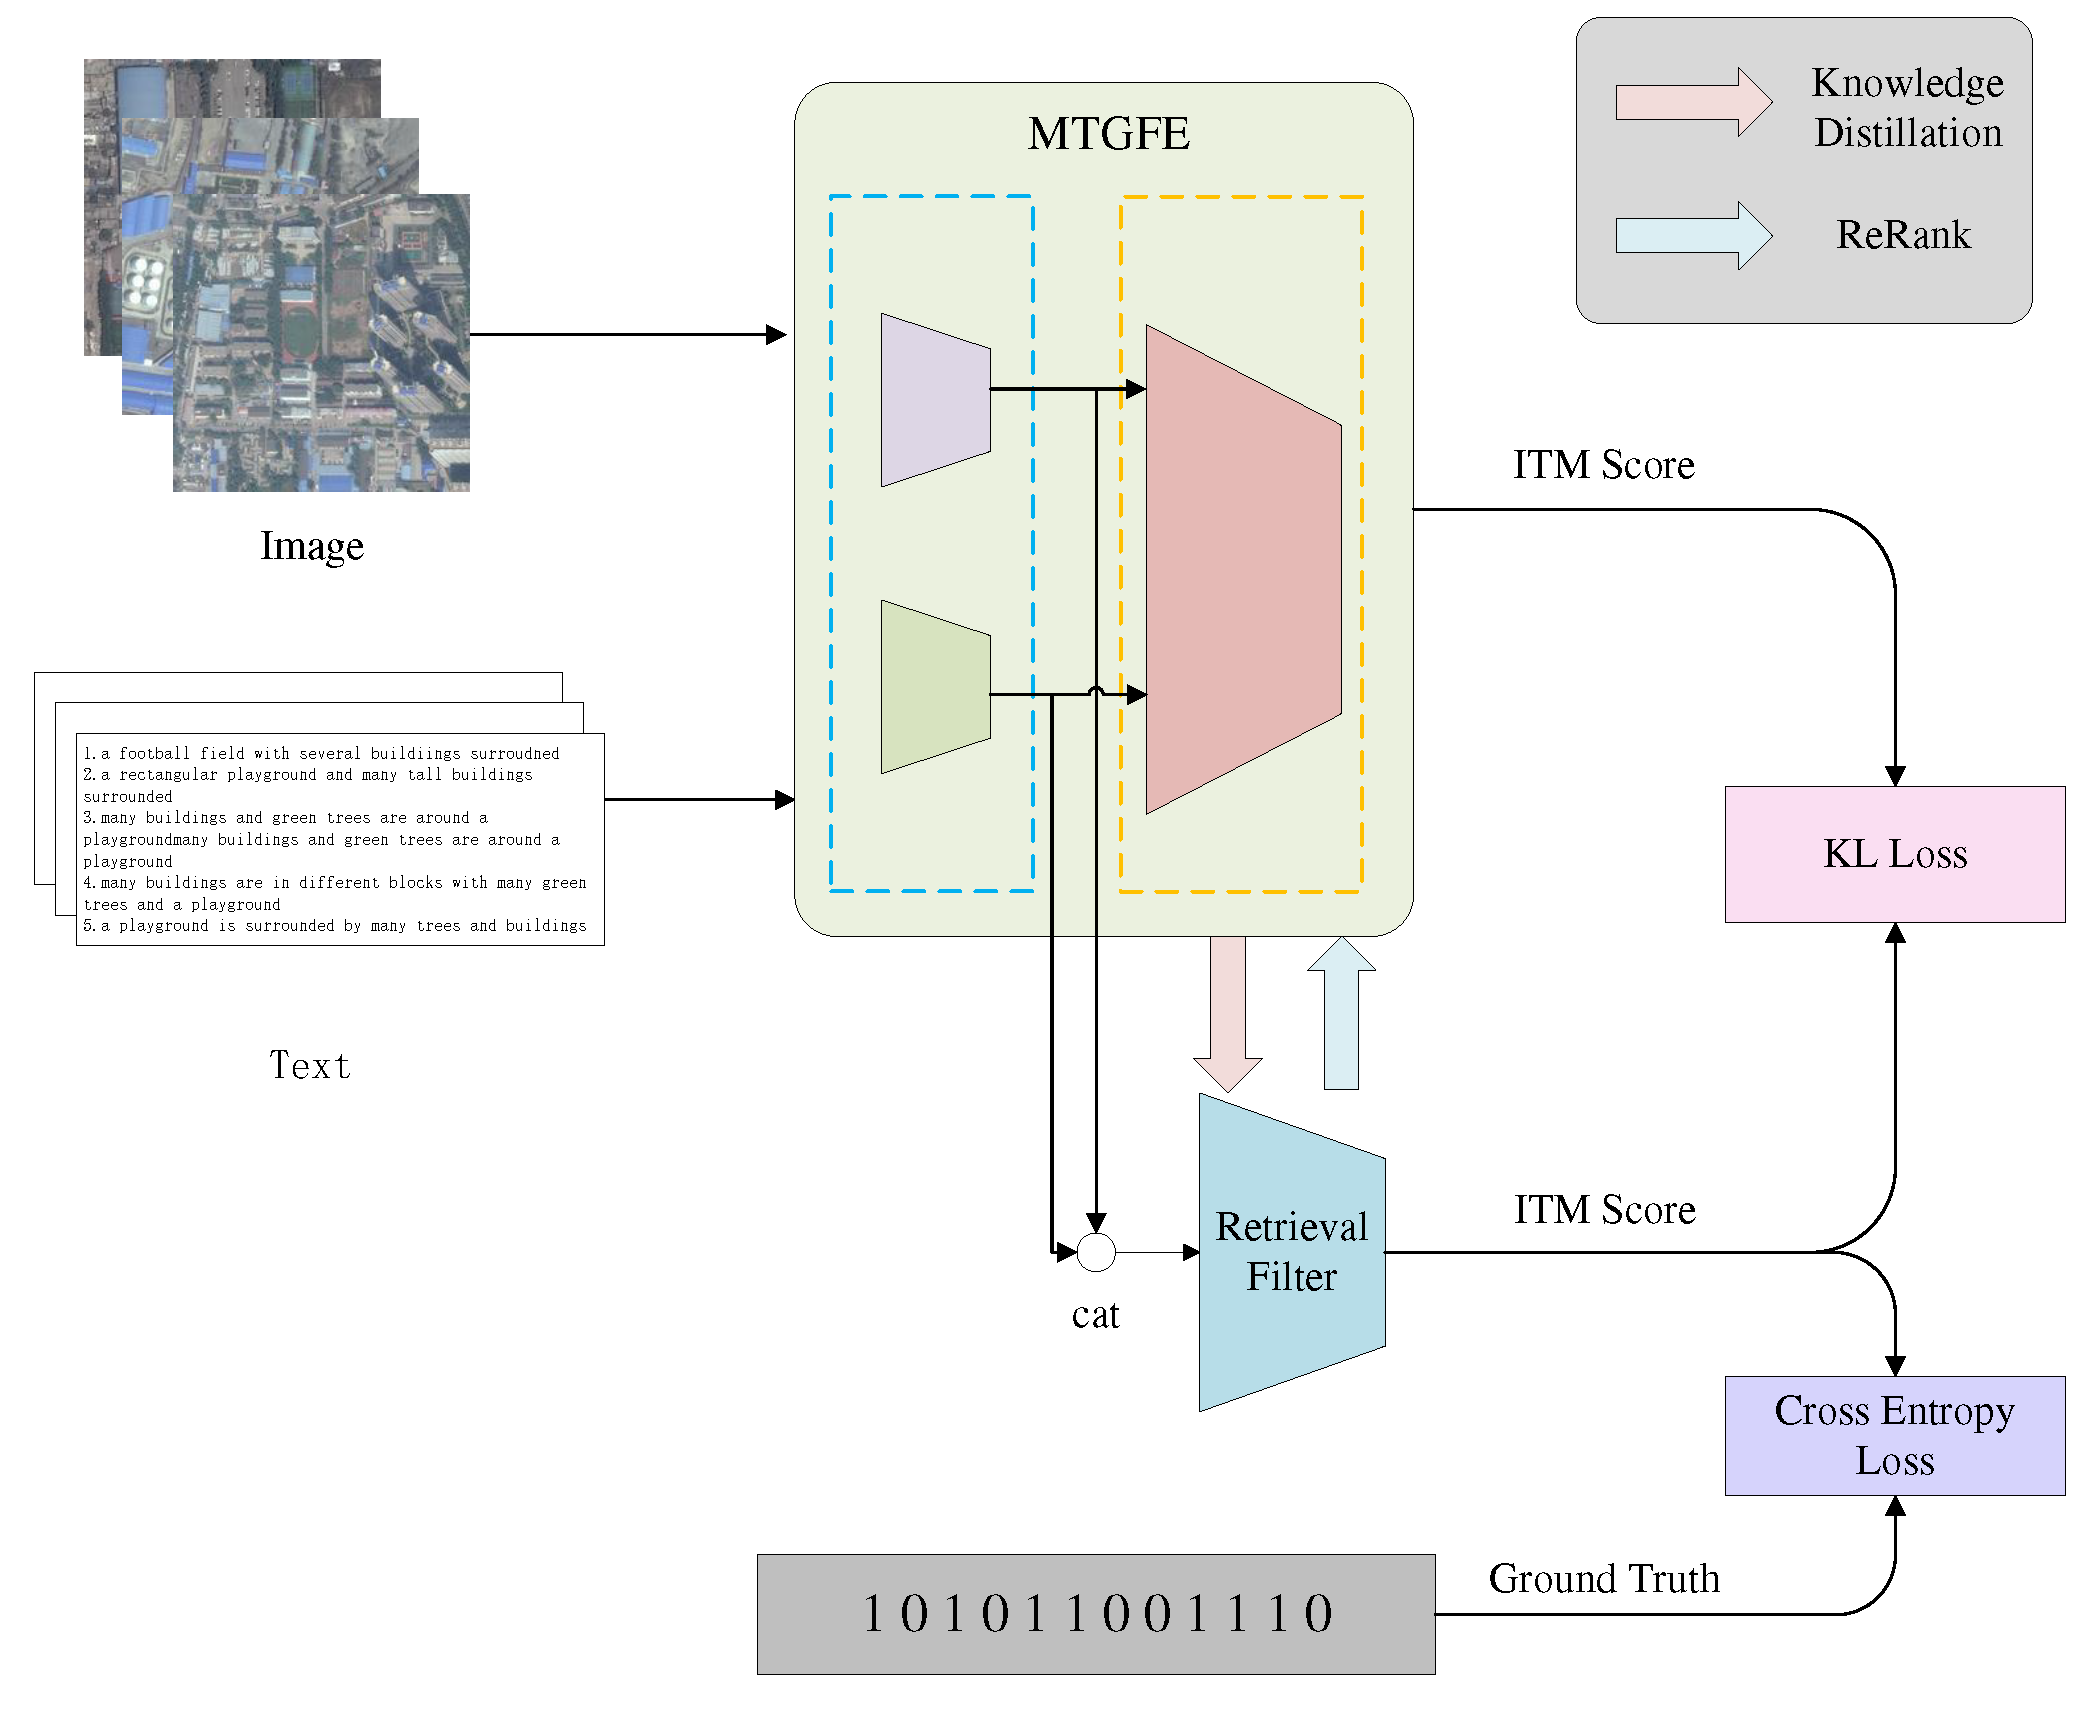
3.4. Retrieval filtering(RF)
4. Experimental results and analysis
4.1. Datasets and evaluation indicators
4.2. Implementation details
4.3. Experimental results and analysis
4.4. Ablation tests
4.4.1. Visualization of fine-grained correlations in word-patch
4.4.2. Impact of task combinations on retrieval accuracy
4.5. Retrieval filtering experiments
5. Conclusions
Author Contributions
Funding
Conflicts of Interest
Abbreviations
| MTGFE | Multi-task guided fusion encoder |
| ITM | image-text matching |
| MLM | masked language modeling |
| MVJRC | multi-view joint representations contrast |
| VLP | vision-language pre-training |
| RF | Retrieval filtering |
| FC | Fully connected |
| MLP | Multilayer perceptron |
| FFN | Feed-forward network |
| BN | Batch normalization |
| ReLU | rectified linear unit |
References
- Zeng, Y.; Zhang, X.; Li, H.; Wang, J.; Zhang, J.; Zhou, W. X$$-VLM: All-In-One Pre-trained Model For Vision-Language Tasks, 2022, [arxiv:cs/2211.12402].
- Lu, X.; Wang, B.; Zheng, X.; Li, X. Exploring Models and Data for Remote Sensing Image Caption Generation. IEEE Transactions on Geoscience and Remote Sensing 2018, 56, 2183–2195. [Google Scholar] [CrossRef]
- Simonyan, K.; Zisserman, A. Very Deep Convolutional Networks for Large-Scale Image Recognition, 2015, [arxiv:cs/1409.1556].
- He, K.; Zhang, X.; Ren, S.; Sun, J. Deep Residual Learning for Image Recognition, 2015, [arxiv:cs/1512.03385].
- Dosovitskiy, A.; Beyer, L.; Kolesnikov, A.; Weissenborn, D.; Zhai, X.; Unterthiner, T.; Dehghani, M.; Minderer, M.; Heigold, G.; Gelly, S.; Uszkoreit, J.; Houlsby, N. An Image Is Worth 16x16 Words: Transformers for Image Recognition at Scale. arXiv:2010.11929 [cs] 2021, [arxiv:cs/2010.11929].
- Greff, K.; Srivastava, R.K.; Koutnik, J.; Steunebrink, B.R.; Schmidhuber, J. LSTM: A Search Space Odyssey. IEEE Transactions on Neural Networks & Learning Systems 2017, 28, 2222–2232. [Google Scholar] [CrossRef]
- Cho, K.; van Merrienboer, B.; Gulcehre, C.; Bahdanau, D.; Bougares, F.; Schwenk, H.; Bengio, Y. Learning Phrase Representations Using RNN Encoder-Decoder for Statistical Machine Translation, 2014, [arxiv:cs, stat/1406.1078].
- Devlin, J.; Chang, M.W.; Lee, K.; Toutanova, K. BERT: Pre-training of Deep Bidirectional Transformers for Language Understanding. arXiv:1810.04805 [cs] 2019, [arxiv:cs/1810.04805].
- Baltrusaitis, T.; Ahuja, C.; Morency, L.P. Multimodal Machine Learning: A Survey and Taxonomy. IEEE Transactions on Pattern Analysis and Machine Intelligence 2019, 41, 423–443. [Google Scholar] [CrossRef]
- Yuan, Z.; Zhang, W.; Fu, K.; Li, X.; Deng, C.; Wang, H.; Sun, X. Exploring a Fine-Grained Multiscale Method for Cross-Modal Remote Sensing Image Retrieval. IEEE Transactions on Geoscience and Remote Sensing 2022, 60, 1–19. [Google Scholar] [CrossRef]
- Faghri, F.; Fleet, D.J.; Kiros, J.R.; Fidler, S. VSE++: Improving Visual-Semantic Embeddings with Hard Negatives, 2018, [arxiv:cs/1707.05612].
- Lee, K.H.; Chen, X.; Hua, G.; Hu, H.; He, X. Stacked Cross Attention for Image-Text Matching, 2018, [arxiv:cs/1803.08024].
- Wang, T.; Xu, X.; Yang, Y.; Hanjalic, A.; Shen, H.T.; Song, J. Matching Images and Text with Multi-modal Tensor Fusion and Re-ranking. Proceedings of the 27th ACM International Conference on Multimedia; ACM: Nice France, 2019; pp. 12–20. [CrossRef]
- Rahhal, M.M.A.; Bazi, Y.; Abdullah, T.; Mekhalfi, M.L.; Zuair, M. Deep Unsupervised Embedding for Remote Sensing Image Retrieval Using Textual Cues. Applied Sciences 2020, 10, 8931. [Google Scholar] [CrossRef]
- Abdullah, T.; Bazi, Y.; Al Rahhal, M.M.; Mekhalfi, M.L.; Rangarajan, L.; Zuair, M. TextRS: Deep Bidirectional Triplet Network for Matching Text to Remote Sensing Images. Remote Sensing 2020, 12, 405. [Google Scholar] [CrossRef]
- Cheng, Q.; Zhou, Y.; Fu, P.; Xu, Y.; Zhang, L. A Deep Semantic Alignment Network for the Cross-Modal Image-Text Retrieval in Remote Sensing. IEEE Journal of Selected Topics in Applied Earth Observations and Remote Sensing 2021, 14, 4284–4297. [Google Scholar] [CrossRef]
- Lv, Y.; Xiong, W.; Zhang, X.; Cui, Y. Fusion-Based Correlation Learning Model for Cross-Modal Remote Sensing Image Retrieval. IEEE Geoscience and Remote Sensing Letters 2022, 19, 1–5. [Google Scholar] [CrossRef]
- Yuan, Z.; Zhang, W.; Tian, C.; Rong, X.; Zhang, Z.; Wang, H.; Fu, K.; Sun, X. Remote Sensing Cross-Modal Text-Image Retrieval Based on Global and Local Information. IEEE Transactions on Geoscience and Remote Sensing 2022, 60, 1–16. [Google Scholar] [CrossRef]
- Cheng, Q.; Zhou, Y.; Huang, H.; Wang, Z. Multi-Attention Fusion and Fine-Grained Alignment for Bidirectional Image-Sentence Retrieval in Remote Sensing. IEEE/CAA Journal of Automatica Sinica 2022, 9, 1532–1535. [Google Scholar] [CrossRef]
- Yuan, Z.; Zhang, W.; Rong, X.; Li, X.; Chen, J.; Wang, H.; Fu, K.; Sun, X. A Lightweight Multi-Scale Crossmodal Text-Image Retrieval Method in Remote Sensing. IEEE Transactions on Geoscience and Remote Sensing 2022, 60, 1–19. [Google Scholar] [CrossRef]
- Schroff, F.; Kalenichenko, D.; Philbin, J. FaceNet: A Unified Embedding for Face Recognition and Clustering. 2015 IEEE Conference on Computer Vision and Pattern Recognition (CVPR); IEEE: Boston, MA, USA, 2015; pp. 815–823. [Google Scholar] [CrossRef]
- van den Oord, A.; Li, Y.; Vinyals, O. Representation Learning with Contrastive Predictive Coding, 2019, [arxiv:cs, stat/1807.03748]. [CrossRef]
- Li, H.; Xiong, W.; Cui, Y.; Xiong, Z. A Fusion-Based Contrastive Learning Model for Cross-Modal Remote Sensing Retrieval. International Journal of Remote Sensing 2022, 43, 3359–3386. [Google Scholar] [CrossRef]
- Huang, Y.; Wang, W.; Wang, L. Instance-Aware Image and Sentence Matching with Selective Multimodal LSTM. 2017 IEEE Conference on Computer Vision and Pattern Recognition (CVPR); IEEE: Honolulu, HI, 2017; pp. 7254–7262. [Google Scholar] [CrossRef]
- Zheng, F.; Li, W.; Wang, X.; Wang, L.; Zhang, X.; Zhang, H. A Cross-Attention Mechanism Based on Regional-Level Semantic Features of Images for Cross-Modal Text-Image Retrieval in Remote Sensing. Applied Sciences 2022, 12, 12221. [Google Scholar] [CrossRef]
- Kim, W.; Son, B.; Kim, I. ViLT: Vision-and-Language Transformer Without Convolution or Region Supervision, 2021, [arxiv:cs, stat/2102.03334].
- Li, J.; Selvaraju, R.R.; Gotmare, A.D.; Joty, S.; Xiong, C.; Hoi, S. Align before Fuse: Vision and Language Representation Learning with Momentum Distillation, 2021, [arxiv:cs/2107.07651].
- Li, L.H.; Yatskar, M.; Yin, D.; Hsieh, C.J.; Chang, K.W. VisualBERT: A Simple and Performant Baseline for Vision and Language, 2019, [arxiv:cs/1908.03557]. [CrossRef]
- Huang, Z.; Zeng, Z.; Liu, B.; Fu, D.; Fu, J. Pixel-BERT: Aligning Image Pixels with Text by Deep Multi-Modal Transformers, 2020, [arxiv:cs/2004.00849]. [CrossRef]
- Hinton, G.; Vinyals, O.; Dean, J. Distilling the Knowledge in a Neural Network, 2015, [arxiv:cs,stat/1503.02531]. [CrossRef]
- Shi, Z.; Zou, Z. Can a Machine Generate Humanlike Language Descriptions for a Remote Sensing Image? IEEE Transactions on Geoscience and Remote Sensing 2017, 55, 3623–3634. [Google Scholar] [CrossRef]
- Qu, B.; Li, X.; Tao, D.; Lu, X. Deep Semantic Understanding of High Resolution Remote Sensing Image. 2016 International Conference on Computer, Information and Telecommunication Systems (CITS); IEEE: Kunming, China, 2016; pp. 1–5. [Google Scholar] [CrossRef]
- Mikriukov, G.; Ravanbakhsh, M.; Demir, B. Deep Unsupervised Contrastive Hashing for Large-Scale Cross-Modal Text-Image Retrieval in Remote Sensing, 2022, [arxiv:cs/2201.08125].
- Mikriukov, G.; Ravanbakhsh, M.; Demir, B. An Unsupervised Cross-Modal Hashing Method Robust to Noisy Training Image-Text Correspondences in Remote Sensing. arXiv:2202.13117 [cs] 2022, [arxiv:cs/2202.13117].
- Hadsell, R.; Chopra, S.; LeCun, Y. Dimensionality Reduction by Learning an Invariant Mapping. 2006 IEEE Computer Society Conference on Computer Vision and Pattern Recognition - Volume 2 (CVPR’06); IEEE: New York, NY, USA, 2006; Vol. 2, pp. 1735–1742. IEEE: New York, NY, USA, 2006. [Google Scholar] [CrossRef]
- Vaswani, A.; Shazeer, N.; Parmar, N.; Uszkoreit, J.; Jones, L.; Gomez, A.N.; Kaiser, L.; Polosukhin, I. Attention Is All You Need. arXiv:1706.03762 [cs] 2017, [arxiv:cs/1706.03762].
- Wu, Y.; Schuster, M.; Chen, Z.; Le, Q.V.; Norouzi, M.; Macherey, W.; Krikun, M.; Cao, Y.; Gao, Q.; Macherey, K.; Klingner, J.; Shah, A.; Johnson, M.; Liu, X.; Kaiser, Ł.; Gouws, S.; Kato, Y.; Kudo, T.; Kazawa, H.; Stevens, K.; Kurian, G.; Patil, N.; Wang, W.; Young, C.; Smith, J.; Riesa, J.; Rudnick, A.; Vinyals, O.; Corrado, G.; Hughes, M.; Dean, J. Google’s Neural Machine Translation System: Bridging the Gap between Human and Machine Translation. p. 23.
- Yu, J.; Wang, Z.; Vasudevan, V.; Yeung, L.; Seyedhosseini, M.; Wu, Y. CoCa: Contrastive Captioners Are Image-Text Foundation Models, 2022, [arxiv:cs/2205.01917].
- Lu, J.; Batra, D.; Parikh, D.; Lee, S. ViLBERT: Pretraining Task-Agnostic Visiolinguistic Representations for Vision-and-Language Tasks, 2019, [arxiv:cs/1908.02265].
- Tan, H.; Bansal, M. LXMERT: Learning Cross-Modality Encoder Representations from Transformers, 2019, [arxiv:cs/1908.07490]. [CrossRef]
- Tian, Y.; Krishnan, D.; Isola, P. Contrastive Multiview Coding. arXiv:1906.05849 [cs] 2020, [arxiv:cs/1906.05849].
- He, K.; Fan, H.; Wu, Y.; Xie, S.; Girshick, R. Momentum Contrast for Unsupervised Visual Representation Learning. arXiv:1911.05722 [cs] 2020, [arxiv:cs/1911.05722].
- Chen, T.; Kornblith, S.; Norouzi, M.; Hinton, G. A Simple Framework for Contrastive Learning of Visual Representations. arXiv:2002.05709 [cs, stat] 2020, [arxiv:cs, stat/2002.05709].
- Chen, X.; He, K. Exploring Simple Siamese Representation Learning. arXiv:2011.10566 [cs] 2020, [arxiv:cs/2011.10566].
- Radford, A.; Kim, J.W.; Hallacy, C.; Ramesh, A.; Goh, G.; Agarwal, S.; Sastry, G.; Askell, A.; Mishkin, P.; Clark, J.; Krueger, G.; Sutskever, I. Learning Transferable Visual Models From Natural Language Supervision 2021. [CrossRef]
- Jia, C.; Yang, Y.; Xia, Y.; Chen, Y.T.; Parekh, Z.; Pham, H.; Le, Q.V.; Sung, Y.; Li, Z.; Duerig, T. Scaling Up Visual and Vision-Language Representation Learning With Noisy Text Supervision. arXiv:2102.05918 [cs] 2021, [arxiv:cs/2102.05918].
- Touvron, H.; Cord, M.; Douze, M.; Massa, F.; Sablayrolles, A.; Jégou, H. Training Data-Efficient Image Transformers & Distillation through Attention, 2021, [arxiv:cs/2012.12877].
- Ba, J.L.; Kiros, J.R.; Hinton, G.E. Layer Normalization, 2016, [arxiv:cs, stat/1607.06450].
- Hendrycks, D.; Gimpel, K. Gaussian Error Linear Units (GELUs), 2020, [arxiv:cs/1606.08415].
- Ioffe, S.; Szegedy, C. Batch Normalization: Accelerating Deep Network Training by Reducing Internal Covariate Shift. arXiv:1502.03167 [cs] 2015, [arxiv:cs/1502.03167].
- Glorot, X.; Bordes, A.; Bengio, Y. Deep Sparse Rectifier Neural Networks. Journal of Machine Learning Research 2011, 15, 315–323. [Google Scholar]
- Cubuk, E.D.; Zoph, B.; Shlens, J.; Le, Q.V. Randaugment: Practical Automated Data Augmentation with a Reduced Search Space. 2020 IEEE/CVF Conference on Computer Vision and Pattern Recognition Workshops (CVPRW); IEEE: Seattle, WA, USA, 2020; pp. 3008–3017. IEEE: Seattle, WA, USA. [CrossRef]
- Loshchilov, I.; Hutter, F. Decoupled Weight Decay Regularization, 2019, [arxiv:cs, math/1711.05101].



| Dataset | Images | Captions | Captions per image | No. of classes | Image size |
|---|---|---|---|---|---|
| UCM-captions | 2,100 | 10,500 | 5 | 21 | 256×256 |
| Sydney-captions | 613 | 6,035 | 5 | 7 | 500×500 |
| RSICD | 10,921 | 54,605 | 5 | 31 | 224×224 |
| RSITMD | 4,743 | 23,715 | 5 | 32 | 256×256 |
| 3]*Approach | UCM-captions dataset | Sydney-captions dataset | ||||||||||||
|---|---|---|---|---|---|---|---|---|---|---|---|---|---|---|
| Text Retrieval | Image Retrieval | 1]*mR | Text Retrieval | Image Retrieval | 1]*mR | |||||||||
| R@1 | R@5 | R@10 | R@1 | R@5 | R@10 | R@1 | R@5 | R@10 | R@1 | R@5 | R@10 | |||
| VSE++ | 12.38 | 44.76 | 65.71 | 10.1 | 31.8 | 56.85 | 36.93 | 24.14 | 53.45 | 67.24 | 6.21 | 33.56 | 51.03 | 39.27 |
| SCAN | 14.29 | 45.71 | 67.62 | 12.76 | 50.38 | 77.24 | 44.67 | 18.97 | 51.72 | 74.14 | 17.59 | 56.9 | 76.21 | 49.26 |
| MTFN | 10.47 | 47.62 | 64.29 | 14.19 | 52.38 | 78.95 | 44.65 | 20.69 | 51.72 | 68.97 | 13.79 | 55.51 | 77.59 | 48.05 |
| SAM | 11.9 | 47.1 | 76.2 | 10.5 | 47.6 | 93.8 | 47.85 | 9.6 | 34.6 | 53.8 | 7.7 | 28.8 | 59.6 | 32.35 |
| AMFMN | 16.67 | 45.71 | 68.57 | 12.86 | 53.24 | 79.43 | 46.08 | 29.31 | 58.62 | 67.24 | 13.45 | 60 | 81.72 | 51.72 |
| LW-MCR | 13.14 | 50.38 | 79.52 | 18.1 | 47.14 | 63.81 | 45.35 | 20.69 | 60.34 | 77.59 | 15.52 | 58.28 | 80.34 | 52.13 |
| MAFA-Net | 14.5 | 56.1 | 95.7 | 10.3 | 48.2 | 80.1 | 50.82 | 22.3 | 60.5 | 76.4 | 13.1 | 61.4 | 81.9 | 52.6 |
| FBCLM | 28.57 | 63.81 | 82.86 | 27.33 | 72.67 | 94.38 | 61.6 | 25.81 | 56.45 | 75.81 | 27.1 | 70.32 | 89.68 | 57.53 |
| MTGFE | 47.14 | 78.1 | 90.95 | 40.19 | 74.95 | 94.67 | 71 | 44.83 | 68.97 | 86.21 | 38.28 | 69.31 | 83.1 | 61.52 |
| 3]*Approach | RSICD dataset | RSITMD dataset | ||||||||||||
| Text Retrieval | Image Retrieval | 1]*mR | Text Retrieval | Image Retrieval | 1]*mR | |||||||||
| R@1 | R@5 | R@10 | R@1 | R@5 | R@10 | R@1 | R@5 | R@10 | R@1 | R@5 | R@10 | |||
| VSE++ | 3.38 | 9.51 | 17.46 | 2.82 | 11.32 | 18.1 | 10.43 | 10.38 | 27.65 | 39.6 | 7.79 | 24.87 | 38.67 | 24.83 |
| SCAN | 5.85 | 12.89 | 19.84 | 3.71 | 16.4 | 26.73 | 14.24 | 11.06 | 25.88 | 39.38 | 9.82 | 29.38 | 42.12 | 26.27 |
| MTFN | 5.02 | 12.52 | 19.74 | 4.9 | 17.17 | 29.49 | 14.81 | 10.4 | 27.65 | 36.28 | 9.96 | 31.37 | 45.84 | 26.92 |
| SAM | 12.8 | 31.6 | 47.3 | 11.5 | 35.7 | 53.4 | 32.05 | - | - | - | - | - | - | - |
| AMFMN | 5.39 | 15.08 | 23.4 | 4.9 | 18.28 | 31.44 | 16.42 | 10.63 | 24.78 | 41.81 | 11.51 | 34.69 | 54.87 | 29.72 |
| LW-MCR | 4.39 | 13.35 | 20.29 | 4.3 | 18.85 | 32.34 | 15.59 | 9.73 | 26.77 | 37.61 | 9.25 | 34.07 | 54.03 | 28.58 |
| MAFA-Net | 12.3 | 35.7 | 54.41 | 12.9 | 32.4 | 47.6 | 32.55 | - | - | - | - | - | - | - |
| FBCLM | 13.27 | 27.17 | 37.6 | 13.54 | 38.74 | 56.94 | 31.21 | 12.84 | 30.53 | 45.89 | 10.44 | 37.01 | 57.94 | 32.44 |
| GaLR | 6.59 | 19.9 | 31 | 4.69 | 19.5 | 32.1 | 18.96 | 14.82 | 31.64 | 42.48 | 11.15 | 36.68 | 51.68 | 31.41 |
| MTGFE | 15.28 | 37.05 | 51.6 | 8.67 | 27.56 | 43.92 | 30.68 | 17.92 | 40.93 | 53.32 | 16.59 | 48.5 | 67.43 | 40.78 |
| 1]*Task | Text Retrieval | Image Retrieval | 1]*mR | ||||
|---|---|---|---|---|---|---|---|
| R@1 | R@5 | R@10 | R@1 | R@5 | R@10 | ||
| ITM | 15.71 | 35.62 | 50.44 | 13.41 | 44.78 | 65.66 | 37.6 |
| ITM+MLM | 16.37 | 38.05 | 52.88 | 16.46 | 47.92 | 67.43 | 39.85 |
| ITM+MVJRC | 12.39 | 33.19 | 49.56 | 10.66 | 40.35 | 61.64 | 34.63 |
| ITM+MLM+MVJRC | 17.92 | 31.19 | 53.32 | 16.59 | 48.5 | 67.43 | 40.78 |
| 1]*Method | Text Retrieval | Image Retrieval | 1]*mR | ||||||
|---|---|---|---|---|---|---|---|---|---|
| R@1 | R@5 | R@10 | time(ms) | R@1 | R@5 | R@10 | time(ms) | ||
| MTGFE | 15.28 | 37.05 | 51.6 | 472.1 | 8.67 | 27.56 | 43.92 | 94.41 | 30.68 |
| MTGFE+Filter | 13.82 | 36.32 | 50.41 | 24.7 | 8.27 | 27.17 | 42.8 | 14.27 | 29.8 |
Disclaimer/Publisher’s Note: The statements, opinions and data contained in all publications are solely those of the individual author(s) and contributor(s) and not of MDPI and/or the editor(s). MDPI and/or the editor(s) disclaim responsibility for any injury to people or property resulting from any ideas, methods, instructions or products referred to in the content. |
© 2023 by the authors. Licensee MDPI, Basel, Switzerland. This article is an open access article distributed under the terms and conditions of the Creative Commons Attribution (CC BY) license (http://creativecommons.org/licenses/by/4.0/).


