Preprint
Article

Trends and Diversity of Cardiovascular Disease (CVD) Mortality and Risk Factors in Five Asian Countries

This version is not peer-reviewed.

Submitted:

29 June 2023

Posted:

29 June 2023

You are already at the latest version

Abstract
We explored the trends and the diversity of the mortality and risk factors of age-standardized cardiovascular diseases (CVD) and cerebrovascular disease (CBD) from 2000 to 2020 in five advanced Asian countries, including China, Japan, Singapore, South Korea, and Taiwan. Data were obtained from the Global Burden of Disease (GBD) report. Overall, the CVD mortality rates decreased gradually in all five Asian countries. Singapore had the highest rates before 2011, but Taiwan replaced Singapore as the nation of the highest mortality rates after 2012. Additionally, South Korea had the highest CBD mortality rates before 2016, while Taiwan experienced a peak in 2011 and remained high thereafter. The absolute difference (AD) and relative difference (RD) for CVD mortality rates showed clear declining trends in all five countries, with South Korea and China displaying the highest reductions, respectively. It is noteworthy that overweight and obesity exhibited an increasing trend in all these five Asian countries, with China demonstrating the highest AD and RD. Except for Taiwan, where a negative association of r=-0.732 was observed, CVD mortality was positively associated with CBD, hypertension, and DM mortality in all other four countries, therefore, further investigation into these relationships are needed.
Keywords: 
Subject: 
Public Health and Healthcare  -   Other

1. Introduction

Cardiovascular disease (CVD) is a leading cause of mortality and morbidity worldwide, and its burden is particularly high in Asia. According to the World Health Organization (WHO), CVD accounts for approximately 40% of all deaths in the Asian region, and this impact is expected to rise due to the aging population, rapid urbanization, and changing lifestyle and dietary habits [1234]. There are several factors that contribute to the high burden of CVD in Asian countries. A systematic study by Zhao (2021) found that the number of CVD deaths in Asia had risen significantly from 5.6 million to 10.8 million. The proportion of CVD-related deaths in total deaths also increased from 23 to 35%. This rise in crude CVD mortality rates was evident in both men and women. Although the crude CVD mortality rates showed an increasing burden of CVD in Asian populations, the decrease in age-standardized CVD mortality rates suggested that the trend in the crude mortality rate was mainly due to demographic changes [5].
These changes have been associated with an increased risk of CVD, including unhealthy diets high in salt, sugar, and unhealthy fats, as well as decreased physical activity levels [6]. Furthermore, the socioeconomic and demographic changes in Asian countries, such as rapid economic development and urbanization, have also led to changes in lifestyle and dietary habits. Data on diet-attributable CVD burdens were extracted from the Global Burden of Disease (GBD) Study 2019. Globally, the number of diet-attributable CVD deaths and disability-adjusted life years (DALYs) in 2019 were 6.9 million and 153.2 million, marking 43.8% and 34.3% increases since 1990, respectively [4] (Dong et al., 2022). A multinational South Asia cohort study indicated that the modifiable risk factors revealed that they contributed to around 64% of the population-attributable fraction (PAF) for CVD and 69% of the PAF for death. The largest PAFs for CVD were associated with hypertension (13.1%), high non-HDL cholesterol (11.1%), diabetes (8.9%), low education (7.7%), abdominal obesity (6.9%), and household air pollution (6.1%) [7] (Joseph et al., 2022). In addition, A multinational prospective cohort study conducted across 21 countries spanning five continents, as reported by Yusuf et al. [8], found that metabolic factors were the predominant risk factors for cardiovascular disease, accounting for 41.2% of the population-attributable fraction (PAF), with hypertension being the largest contributor at 22.3% of the PAF. The study also revealed that higher body mass index (BMI) categories (25-27.4 and ≥ 27.5 kg/m2) were associated with increased risk of obesity-CVD mortality, with the multivariable-adjusted cause-specific hazard ratios (95% confidence interval) for men at 1.27 (1.10, 1.46) and 1.59 (1.30, 1.95) and for women at 1.10 (0.95, 1.28) and 1.44 (1.21, 1.72), respectively. Additionally, the PAF of a BMI ≥ 25 kg/m2 for obesity-CVD was 5.0% in men and 4.5% in women, according to Matsunaga et al. [9]. Nevertheless, previous studies have shown a high variation in modifiable risk factors that contribute to CVD mortality. This could be attributed to limitations in study design, insufficient exposure to risk factors, synergistic effects, and differences in socioeconomic status. Evidence from the secular trends and diversity of CVD and its risk factors in different countries can be used to support the hypothesis on the association between CVD mortality and risk factors. Hence, there is an urgent need to better understand the complex interactions between various risk factors and CVD mortality in the context of the changing Asian demographic and socioeconomic landscape. Compared to other developing countries in Asia, Japan, Singapore, South Korea, China, and Taiwan have high levels of economic development, similarity in demographic information, and lifestyle. Targeted prevention and management strategies are necessary to address these trends and diversity and reduce the burden of CVD and CBD mortality rates in Taiwan. Thus, this study aimed to analyze the trends and diversity of age-standardized CVD and CBD mortality rates and their risk factors in above mentioned five Asian countries.

2. Materials and Methods

Data information: The data sources for this study were obtained from open-access websites of international institutions. While most data were based on realistic data from five studied countries, some data were simulated using previous data. To ensure comparable data quality across different countries, the study recommended using internationally published data. However, in cases where published data not available for Taiwan, data from government sources were used instead. The annual number of deaths from cardiovascular disease per 100,000 people was obtained from the Global Burden of Disease (2019) and published in Our World in Data (https://ourworldindata.org/about). These data displayed age-standardized CVD rates in the five selected Asian countries from 2000 to 2020. The CBD mortality data were sourced from the WHO mortality database, which provided a compilation of mortality data from national authorities transmitted annually through their civil registration and vital statistics system. The mortality data visualization platform used in this study was at least 65% complete, but no information from Taiwan was found. Thus, the mortality rates for CBD, hypertension (HP), and Diabetes Mellitus and (DM) in Taiwan were obtained from the National Statistic Department of Taiwan’s Ministry of Health and Welfare. Data of lifestyle in five Asian countries included alcohol use, consumption of smoking and overweight/obesity was retrieved from various sources. Owing to no available data from the consumption of alcohol, the proportion of alcohol dependence in these five countries was retrieved from the published data in the Our World in Data, which is defined by the International Classification of Diseases (ICD) as the presence of three or more indicators of dependence for at least a month within the previous year. The smoking prevalence data used in this study were obtained from three sources: the Foundation for a Smoke-Free World (FSFW), Statista.com, and the Macrotrends - The Premier Research Platform for Long Term Investors. The data sources of overweight/obesity were retrieved from the WHO global health observatory (https://data.worldobesity.org/) for all countries studied except Taiwan, whose data were from three waves of the NAHSIT (Nutrition and Health Survey in Taiwan). BMI, a simple index of weight-for-height commonly used to classify overweight and obesity in adults was adopted in this study. The prevalence (%) of overweight and obesity was determined using a BMI cutoff of ≥ 25 and ≥ 30, based on age-standardized estimates. Please note that the BMI cutoffs used for defining overweight and obesity may vary by country or region, and the data was retrieved from the specified sources.
Measurement: This study focused on measuring the trends and diversity on CVD mortality and its risk factors. The "Secular trends" referred to long-term changes or patterns in data over time. In this study, the secular trends of CVD and CBD mortality rates and the risk factors in different countries were analyzed and displayed visually from 2000 to 2020. In the study, both the absolute difference (AD) and relative difference (RD) were calculated to measure the diversity of cardiovascular disease (CVD) and its risk factors in three time periods. The AD was used to calculate the numerical difference between two values, while the RD was used to calculate the proportion of the absolute difference between two values in the last (2015-2020) and the first (2003-2008) period, divided by the first period of those values. Both AD and RD were useful in different contexts. AD (1/100,000) provided a simple and straightforward measure of difference, while RD (%) represented the magnitude of the values being compared and provided a standardized measure of difference that could be compared across different contexts. The use of both AD and RD in this study allowed for a more comprehensive analysis of the changes in CVD and its risk factors over time and helped to provide a clearer understanding of the trends and patterns observed. For a more detailed analysis of the changes in CVD and its risk factors over time to identify any patterns or trends that might have emerged during different time periods, this study arbitrarily divided 2003 to 2020 into three periods by six-year intervals: early (2003-2008), moderate (2009-2014), and late (2015-2020) for different diseases. Therefore, the study was able to analyze changes in the data for CVD and its risk factors in specific time periods. The division of these three time periods was based on the availability of data and the need to capture changes over time.

3. Results

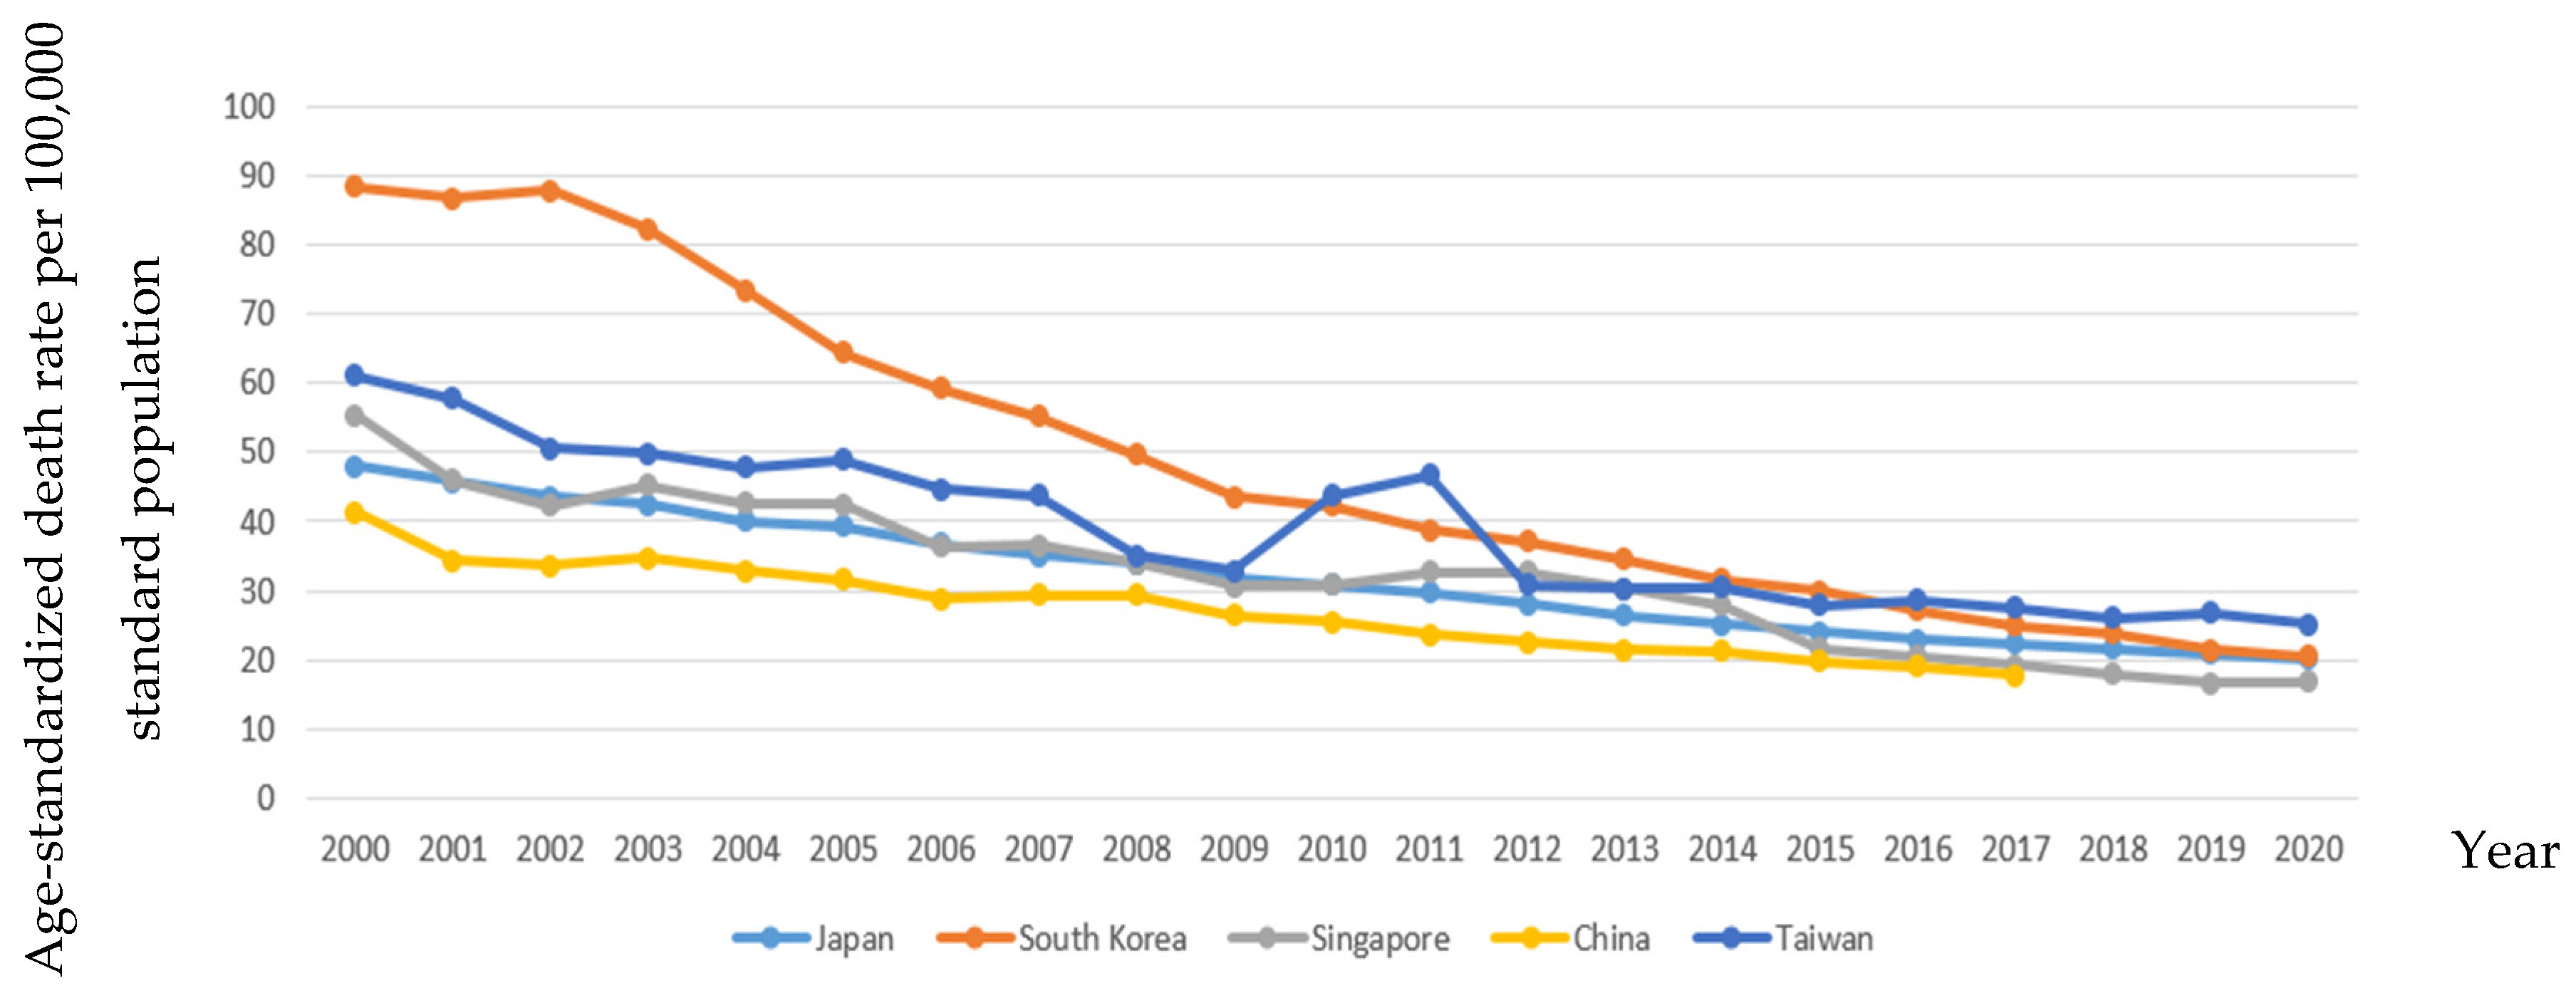
The trends in age-standardized CVD mortality for five studied Asian countries from 2000 to 2020 are depicted in Figure 1. Singapore had the highest age-standardized CVD mortality rates before 2011, but Taiwan replaced Singapore with the highest mortality rates after 2012, while Japan had the lowest rates during the whole period. Over time, there was a gradual decline in age-standardized CVD mortality rates in all five countries.
Figure 2 shows the trends in age-standardized CBD mortality rates for studied countries from 2000 to 2020. South Korea had the highest age-standardized CBD mortality rates before 2016. However, Taiwan experienced a peak in 2011 and remained high thereafter. Nevertheless, there was a gradual decline in age-standardized CBD mortality rates in all five countries over time.
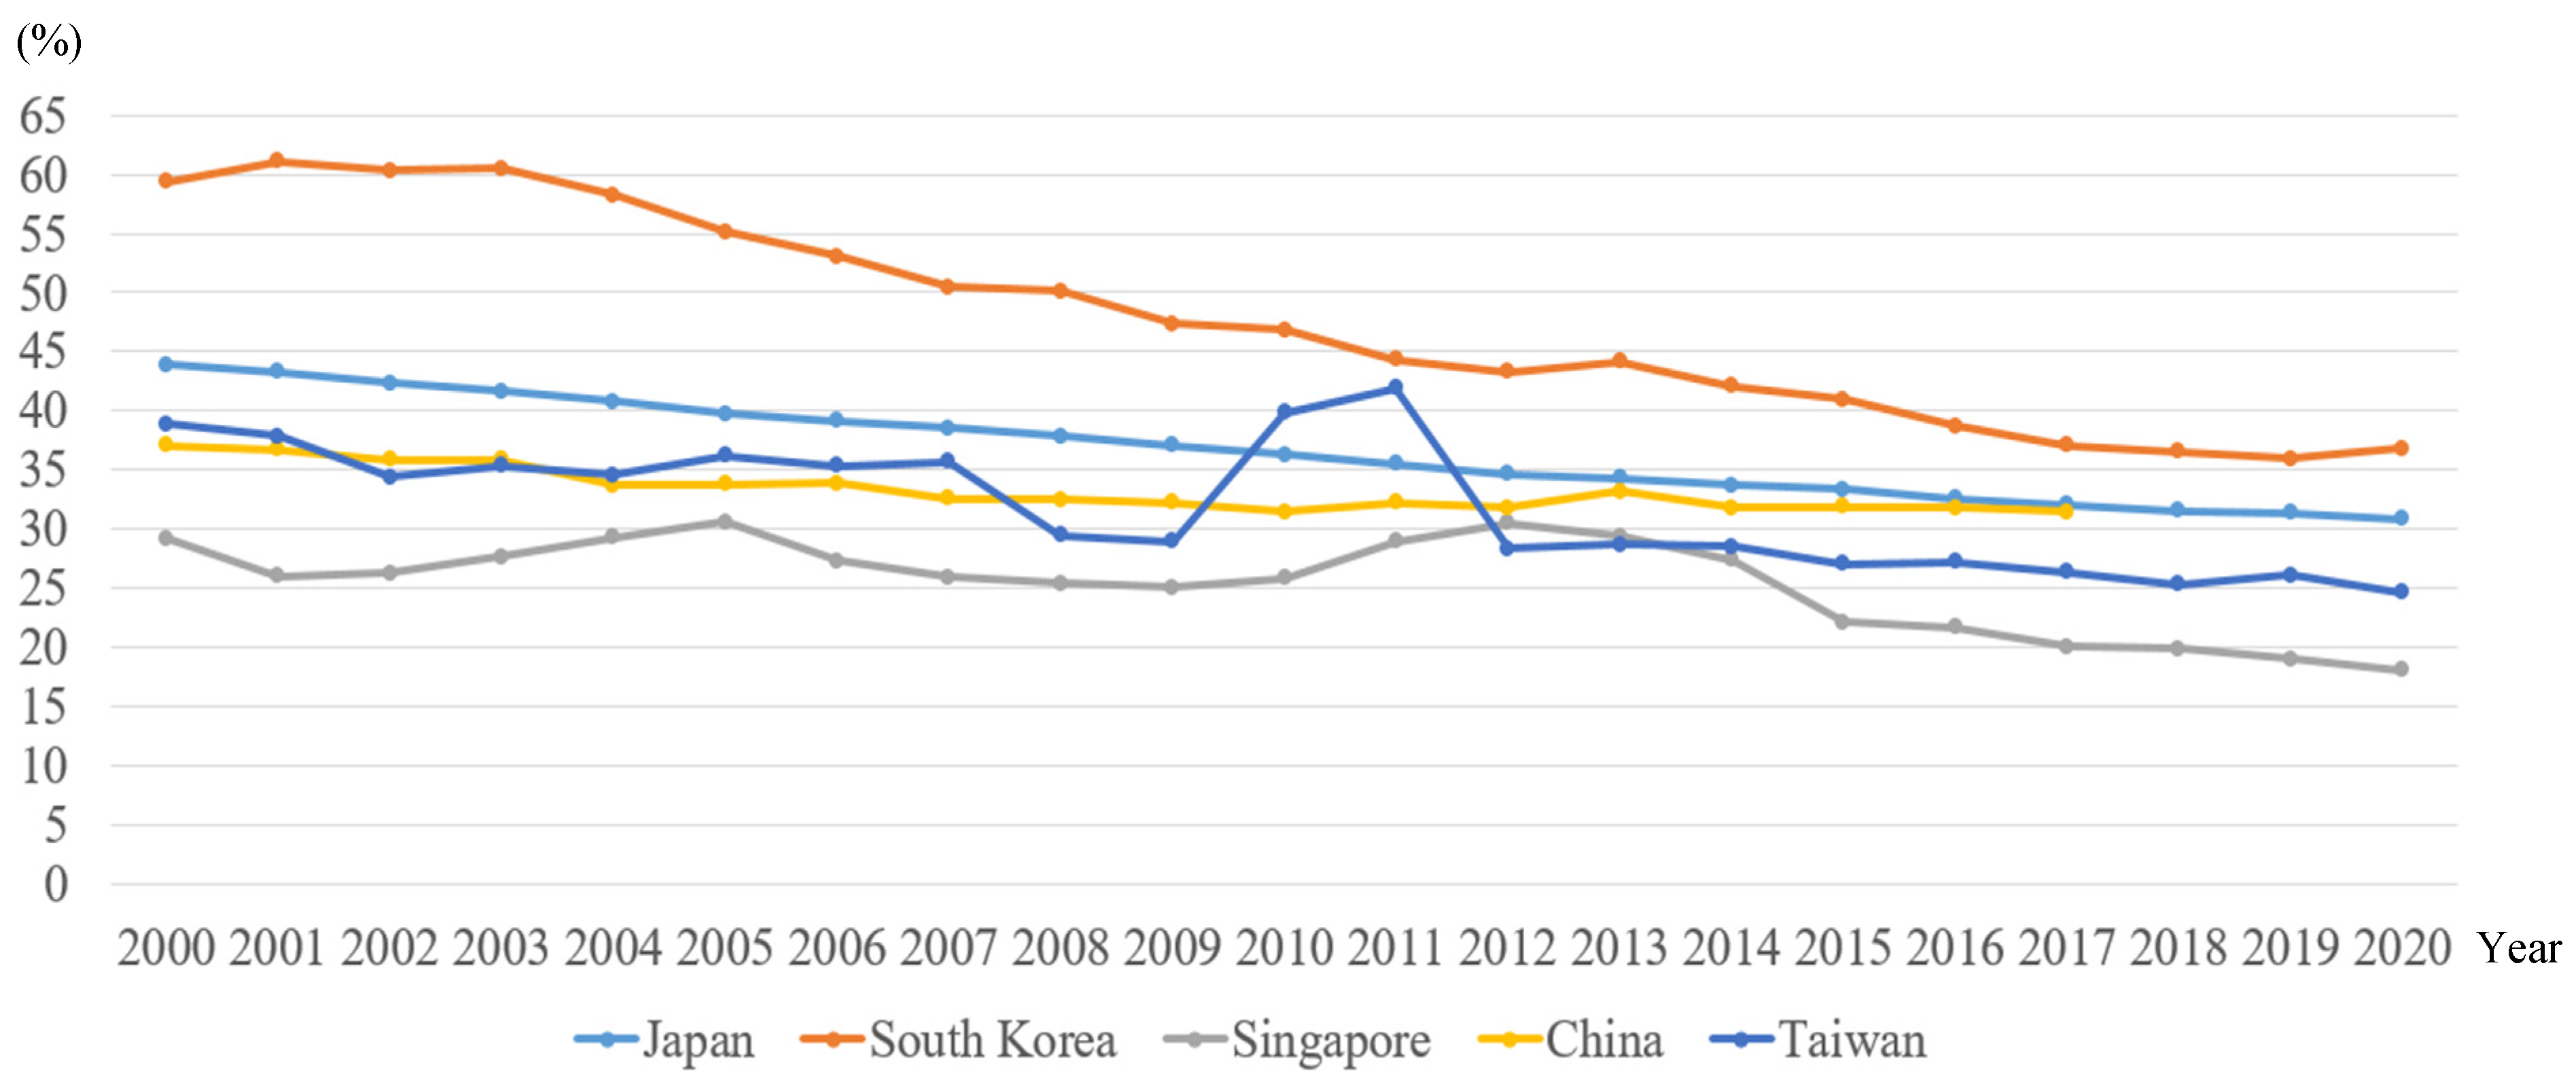
Figure 3 illustrates the trends in the percentage of CBD mortality contributing to CVD mortality for the five Asian countries from 2000 to 2020. It showed that South Korea had the highest proportion of CBD contributing to CVD mortality followed by Japan. Consistently, Singapore had the lowest CBD/CVD mortality portion while Taiwan experienced a peak in 2011. Despite the variance, all five Asian countries demonstrated a gradually decreasing trend in the percentage of CBD contributing to CVD mortality over time.
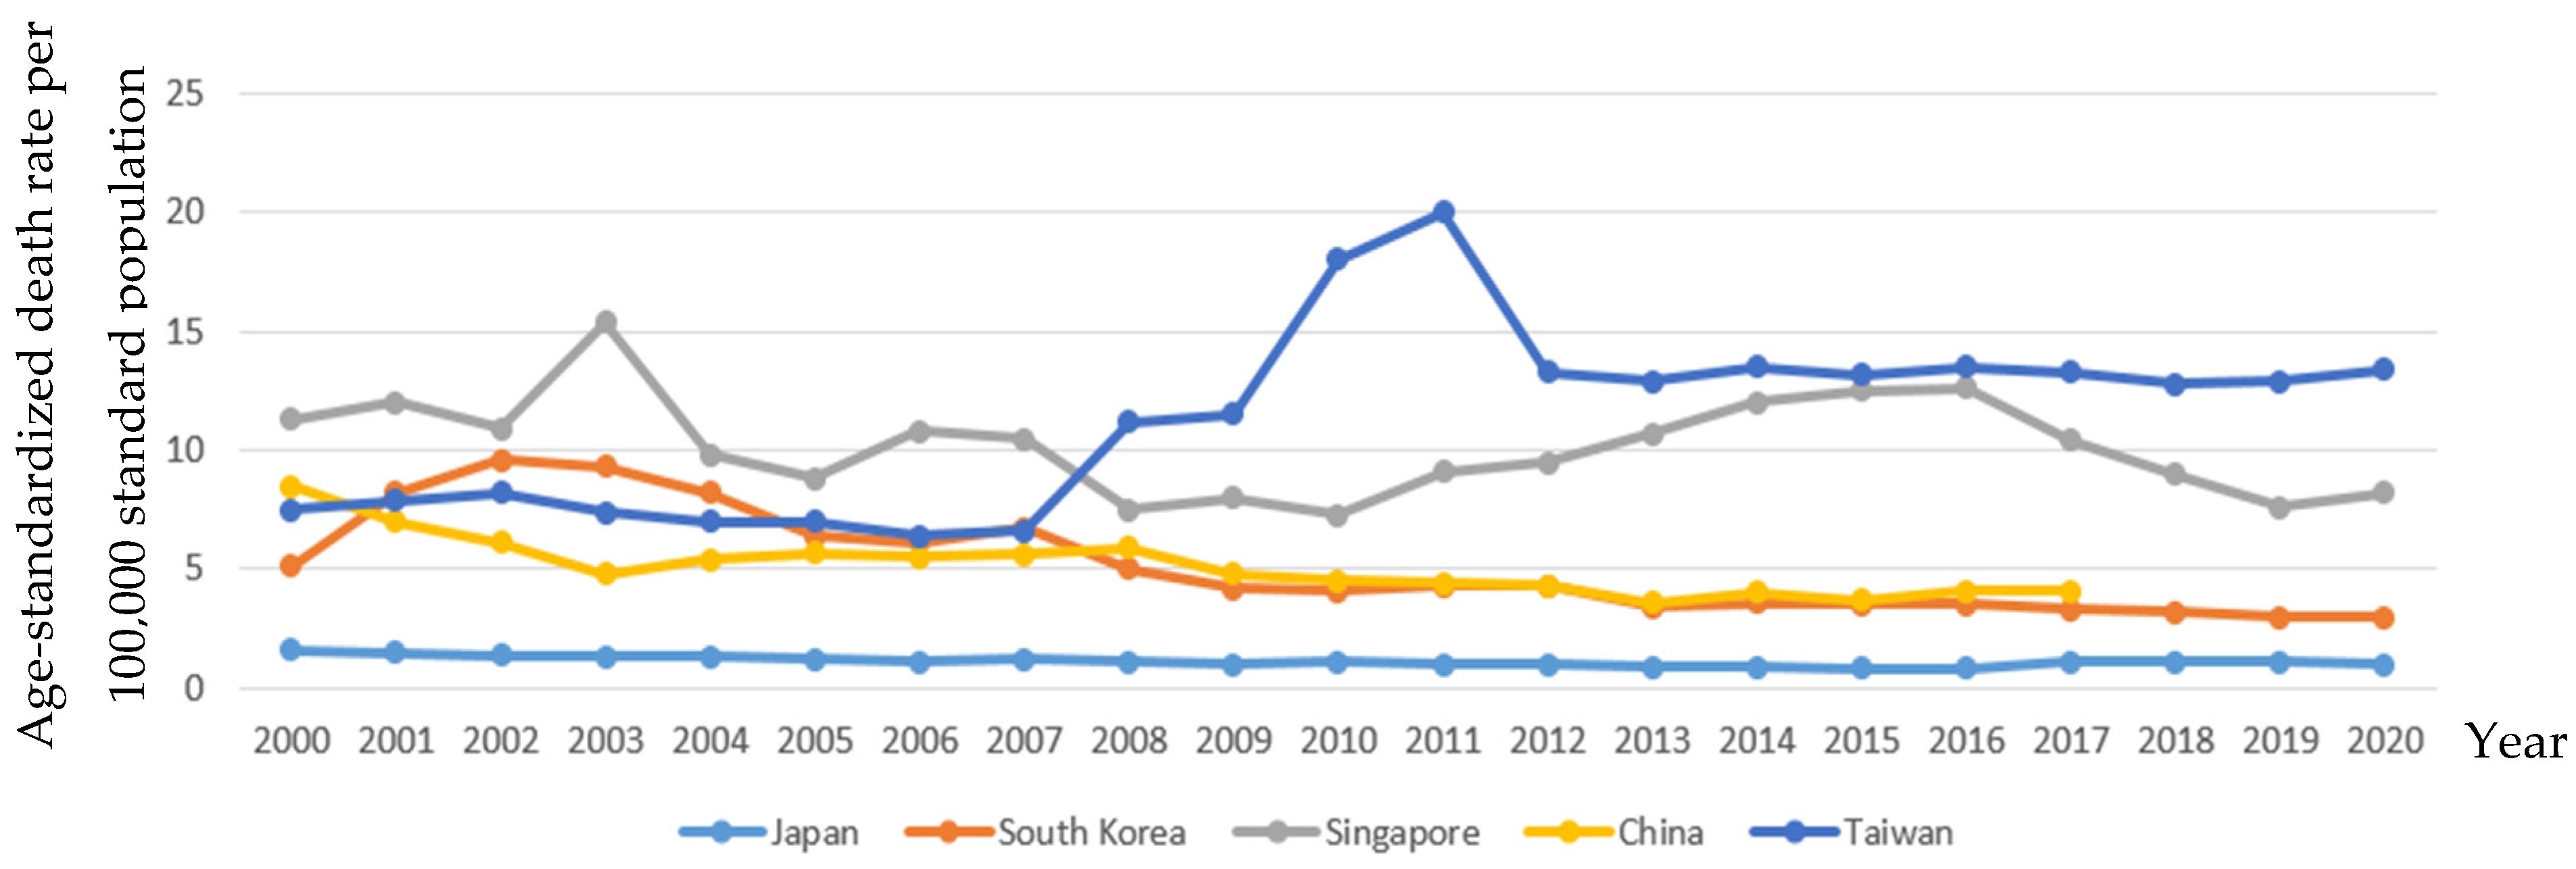
The trends in age-standardized hypertension mortality rates for five Asian countries from 2000 to 2020 are presented in Figure 4. Before 2007, Singapore had the highest age-standardized hypertension mortality rates with significant fluctuations over time. In contrast, Taiwan showed an increasing trend after 2008 and had the highest mortality rates among the five countries while Japan had the lowest.
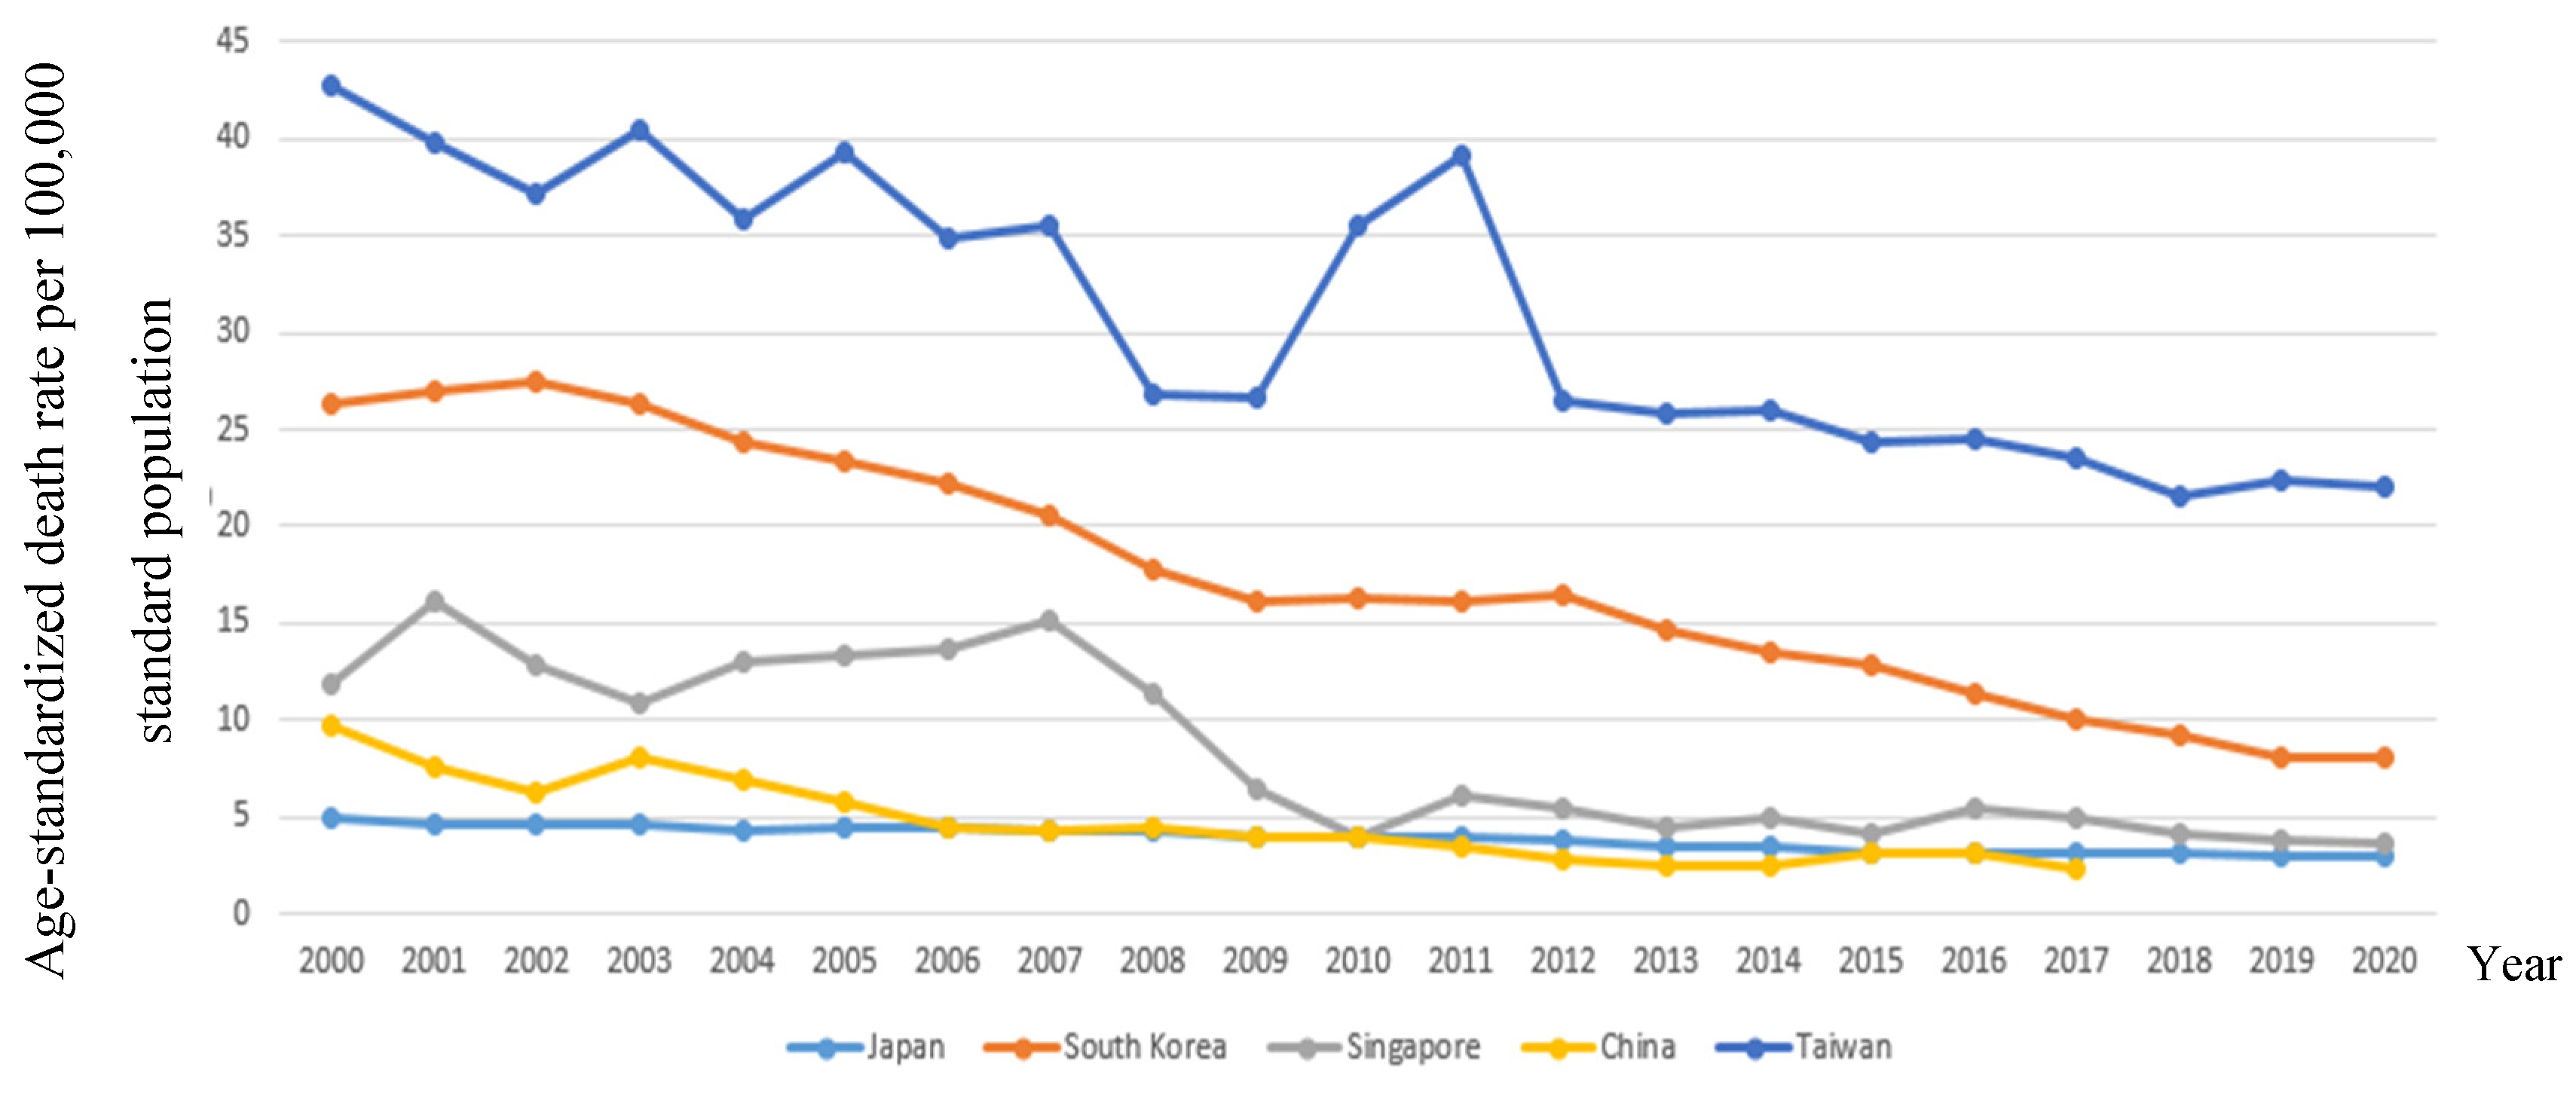
The trends in age-standardized DM mortality rates for five Asian countries from 2000 to 2020 are presented in Figure 5. Taiwan had the highest age-standardized DM mortality rates with a significant decline over time except for 2011. South Korea also experienced a gradual decrease in DM mortality rates; Japan and China had the lowest age-standardized DM mortality rates among the five Asian countries.
This study presented the trends in alcohol dependence in the five Asian countries from 2000 to 2020, as shown in Figure 6. The data indicated that South Korea had the highest prevalence of alcohol dependence among the five Asian countries, with a decline of 2.5% in 2019. China was second to South Korea in alcohol dependence with a gradual increasing trend. However, the other three countries did not show any significant difference in the trends of alcohol dependence over the period analyzed.
Table 1 shows the AD and RD in mortality rates for CVDs, CBD, hypertension, and diabetes in the five Asian countries over three time periods. The age-standardized AD and RD for CVD mortality showed an obvious decreasing trend in all five Asian countries, with South Korea and China displaying the highest reduction rates for the early (2003-2008) and late (2015-2020) stages, respectively. The AD and RD for CBD followed a similar trend to that of CVDs. For hypertension mortality, the highest decreasing trend was observed in Singapore with a reduction of 7.90 and 4.30 for AD and 105.3% and 52.44% for RD in the early and late stages, respectively. In contrast, increasing trends in both AD (3.80 and 2.00) and RD (33.93% and 14.81%) for hypertension were found in Taiwan for the early and the moderate stages. Meanwhile, China displayed the highest decreasing trends in AD and RD for diabetes mellitus in the early stage (-3.5 and -77.78%).
Table 2 indicates the absolute differences (AD) and relative differences (RD) in prevalence rates of alcohol dependence, smoking, and overweight in five Asian countries across three time periods. The AD and RD for alcohol dependence are considerably lower in the five Asian countries when compared to Western countries. Notably, South Korea had higher AD (0.12%) in the early period than other countries, while China had the highest AD (0.08%) in the late period. For smoking prevalence, Singapore was stable in all three time periods. Meanwhile consistent declining trends were observed in Japan, South Korea, and Taiwan, and a small peak was found in China in the moderate stage. In the contrast, overweight rate was increasing in all five Asian countries, with China having the highest AD and RD in the early and the moderate periods. However, Taiwan experienced the highest increase as AD of 8.15% and RD of 17.30%.
Table 3 presents the correlation between CVD mortality and mortality related to CBD, hypertension, and DM, as well as the prevalence of overweight, smoking, and alcohol dependence in the five Asian countries. CVD mortality exhibited a strong positive correlation with CBD and DM mortality in all five countries. Additionally, CVD mortality showed a positive correlation with hypertension mortality in all countries except Taiwan (r=-0.732). Notably, there was a negative correlation between the prevalence of overweight and CBD mortality in all five Asian countries. Smoking exhibited positive associations with CVD mortality in four out of the five Asian countries, with a negative association found in Singapore (r=-0.795). Moreover, alcohol dependence prevalence was negatively correlated with CVD mortality in Japan (r=-0.700) and Taiwan (r=-0.978). Overall, the findings suggested that the associations between CVD mortality and related risk factors across different Asian countries are complex and varying.

4. Discussion

4.1. Trends and diversity of SMR for CVD and other diseases

In 2019, CVD accounted for approximately 35% of total deaths in Asia, causing 10.8 million fatalities and making it the leading cause of death in the region [5]. However, the age-standardized CVD mortality in five Asian countries shows a decreasing trend over time, especially during the period from 2003 to 2008, with the largest decline observed in South Korea (37.47% decline) and the lowest in China (7.29% decline). From 2015 to 2020, South Korea had the highest decrease (30.36% decline), while Taiwan had the lowest (1.01% decline). The age-standardized CBD morality also showed a similar downward trend over time. Whereas the growing crude CVD mortality rates indicated the increasing burden of CVD in Asian populations. In addition, the fall in age-standardized CVD mortality implied that the trend in the crude mortality rate was driven mainly by the growing aging population and medical service changes [3]. However, there was no similar trend in hypertension. Singapore had the largest decrease in hypertension (105.33% decline) from 2003 to 2008, followed by South Korea (86.0% decline), while Taiwan and China showed an increase (33.93% and 18.64%, respectively). From 2015 to 2020, Japan showed an increase of 20.00%. Diabetes had a decreasing trend over time, but the magnitude of the decrease varied across countries, with the largest decrease in China and the lowest in Taiwan. Although both hypertension (HP) and diabetes mellitus (DM) are risk factors for CVD and CBD, the results showed that the SMRs (standardized mortality ratios) of HP and DM did not contribute much to the mortality rates of CVD and CBD. This might be due to the changing trends in mortality rates over the years with competing causes of death. It could be also due to the fact that this study measured indicators as SMRs, not incidence rates, and susceptible to the influence of the medical level of each country and other risk factors, such as lifestyle and economic conditions. Of note, China has higher age-standardized CVD and CBD moralities than other countries, possibly due to its aging population trend. In China, the incidence and mortality rates of CVD and CBD are generally higher in older people, which is one of the main factors affecting China's CVD and CBD mortality rates. In addition, Chinese dietary habits, lifestyle, and environmental factors all have significant impacts on the incidence and mortality rates of CVD and CBD. For example, Chinese people have a higher intake of salt, a higher rate of obesity, and a lack of exercise, which are factors that contribute to the incidence and mortality rates of CVD and CBD. The risk of CVD shows geographical variation in China, with higher rates observed in the northeast (12.6% [12.4-12.8]) and north China (11.4% [11.3-11.6]), while lower rates were found in the south part of the country (8.0% [7.8-8.2]). Possibly, the primary risk factors contributing to CVD vary across different regions of China [10]. In addition, China's healthcare system and resource distribution may also contribute to higher CVD and CBD mortality rates. Particularly, in remote and impoverished areas, medical services and conditions are relatively poor, leading to insufficient early diagnosis and poor treatment of CVD and CBD, increasing the risk of death. Given the geographical variation in CVD risk factors and prevalence in China, it is important to implement targeted interventions in specific regions to mitigate the risk and reduce the burden of CVD in this vast country. As China is currently in a stage of economic development, it is even more important to take preventive measures against CVD-related diseases. As for Taiwan, the SMR of hypertension and DM is higher than that of the other four Asian countries, which is a warning. Since hypertension and DM are common chronic diseases in Taiwan, their prevalence and incidence are relatively high. The lifetime prevalence rates of hypertension and DM in Taiwan are between 25-30% and 10-15%, respectively. With factors such as population aging and unhealthy lifestyles, the incidence of these diseases is increasing. According to data from the National Health Agency of the Ministry of Health and Welfare, the annual incidence of hypertension in people over 50 years old is approximately 3%, while the incidence of diabetes is about 1-2%. Therefore, the prevalence and incidence of hypertension and diabetes are important public health issues in Taiwan. Preventing and treating these diseases requires the active participation of individuals and communities to change unhealthy lifestyles, such as reducing salt intake, controlling weight, and increasing exercise, as well as actively treating and managing these diseases.

4.2. Proportion for CBD mortality contributing to CVD mortality

This study showed that the proportion of CBD in all CVD varies among countries. Most CVD deaths (87%) were due to ischemic heart disease (IHD, 47%) or stroke (40%). South Korea has a proportion of approximately 35.97% to 61.13%, which has been decreasing annually. Singapore has the lowest proportion, ranging from only 19.85% to 30.61% over time. The other three countries have relatively high proportions, while Taiwan decreased from the highest 41.92% to 25.33%. In 2011, there was a peak of around 47%, indicating significant differences among countries in the proportion of CBD in all CVD over the years. The reasons for this may be related to the following factors: 1. Population structure: Countries with a higher proportion of elderly people have a higher incidence and mortality rate of CVD and CBD. 2. Medical level: Differences in the allocation of medical resources and medical level may affect the prevention, diagnosis, and treatment of CVD and CBD. Countries with more developed medical resources and technology can detect and treat CVD and CBD earlier, resulting in a relatively lower proportion of CBD in all CVD. 3. Disease management and prevention: Different countries have different disease management and prevention strategies, especially for high-risk groups, such as regular screening and management, to reduce the incidence and mortality rate of CVD and CBD.
In addition, there are significant differences in the proportion of CBD to all CVD between Asian and Western countries. In Asian countries, the proportion of CBD to all CVD is usually higher than that of Western countries. For example, in the United States, the proportion of CBD to all CVD deaths is only about 33%. CVD and CBD generally refer to heart, cerebral ischemia, or hemorrhagic diseases caused by various factors such as diabetes, dyslipidemia, hypertension, overweight, or obesity in the United States from 2012 to 2019 [11]. It is worth noting that different studies may use different definitions and methods to calculate the proportion of CBD to all CVD, and these proportions are for reference only. There may be several reasons for the difference between Asian and Western countries. First, different population structures: the population structure in Asian countries is generally younger than in Western countries and the proportion of CBD among young people is lower, resulting in a lower proportion of CBD among all CVDs. Second, differences in lifestyle: people in Asian countries generally have a healthier diet, consume less high-fat, high-salt, and high-sugar foods, and engage in less unhealthy behaviors such as smoking and drinking alcohol, resulting in a lower incidence of CBD. Third, differences in healthcare systems: the distribution of healthcare resources in Asian countries may be insufficient and lead to higher mortality rates of CVDs and CBDs, especially in remote and impoverished areas where medical conditions are poorer. Such limited healthcare resources result in the failure of early diagnosis and treatment of CBD and the increased risk of death. Overall, the proportion of CBD among all CVDs is influenced by various factors, including population structure, lifestyle, healthcare system, etc. Countries should formulate corresponding prevention and treatment measures based on their own situations to reduce the impact of CBD on public health. For example, compared to Western populations, Asian populations tend to have higher sodium intake, lower calcium intake, and lower animal protein intake. Additionally, men in Asian countries tend to consume more alcohol. These dietary differences may contribute to the higher prevalence of hypertension and the increased risk of stroke among Asian countries. As a result, the national chronic disease prevention and control plan reports revealed that Chinese individuals had a good dietary behavior rate of 82%, whereas Koreans and Japanese had rates of 48% and 64%, respectively [12]. Hence, corresponding prevention and treatment measures based on each country’s situation are vital to reduce the impact of CBD on public health.

4.3. Risk factors of CVD and CBD

The risk factors for CVD in Asian countries are comparable to those in other regions, although some factors are more widespread in this area. The major risk factors contributing to the CVD epidemic in Asia are the result of an intricate interplay between socioeconomic and living conditions, demographics, lifestyles, the prevalence of CVD risk factors, and the capacity to achieve prevention and treatment goals. In China, the risk factors for CVD and CBD in young people include obesity, current smoking, atrial fibrillation, hypertension, systolic blood pressure, and total cholesterol, while triglycerides serve as protective factors for CVD and CBD in young and middle-aged individuals [13]. A cross-sectional study showed significant variations in the prevalence of hypertension (24.5% in China, 17.6% in Korea, and 15.2% in Japan) and DM (8.9% in China, 5.7% in Korea, and 4.8% in Japan). Although these countries have made significant progress in modifying risk factors for non-communicable diseases (NCDs) over the past few decades, the prevalence and control of major modifiable risk factors remain concerning (Ma et al., 2017). The age-standardized mortality of hypertension and DM in these countries are not only correlated with their prevalence but also influenced by the sufficient emergency and medical systems in place. As for the risk factors of CVD in other lifestyle factors, including smoking, alcohol consumption, and overweight/obesity, this study could only obtain data on the proportion of alcohol dependence but not historical alcohol consumption habits in the five Asian countries. According to Our World in Data, in 2016, the proportions of alcohol drinkers and heavy drinkers were 55.9% and 40.7% in China, 63.9% and 47.7% in South Korea, 57% and 40.0% in Japan, and 70% and 42.9% in Singapore, respectively. The average monthly alcohol consumption per person was approximately 7.05 liters in China, 9.7 liters in South Korea, 7.96 liters in Japan, and 2.03 liters in Singapore, respectively, indicating that the proportion of alcohol drinkers and alcohol consumption in South Korea is higher than in other three countries. However, information quality needs to be taken into consideration when analyzing the risk factors for CVD in these countries. It should be also noted that this study did not include data on historical alcohol consumption habits, and the proportions and quantities of alcohol consumption may have changed in recent years. In addition, except for Singapore (r=-0.795), the smoking rates in these four countries were positively correlated with CVD mortality, despite efforts to implement national smoking cessation programs. Data from Our World in Data showed that in 1990, among these five countries, the highest smoking rate was observed in South Korea at 29.15%, followed by 28.65% in China, 26.71% in Japan, 25.49% in Taiwan, and 10.29% in Singapore. However, by 2016, Japan had the highest smoking rate at 22.73%, followed by 20.87% in China, 18.63% in South Korea, 12.63% in Taiwan, and the lowest at 7.47% in Singapore. A pooled meta-analysis based on individual participants from 20 prospective cohort studies in Asian indicated that smoking prevalence for men steadily increased in China and India, whereas it plateaued in Japan, South Korea, Singapore, and Taiwan. It also found that lung cancer mortality associated with tobacco smoking continued to increase among Asian men in recent birth cohorts [14]. Based on the report from Global Obesity Observatory indicated that the prevalence rates of overweight and obesity in the four Asian countries were in South Korea at 36.3% and 6.01 [15], followed by 33.07% and 6.51% in China, 22.6% and 4.5% in Japan, and 28.8% and 10.5% in Singapore. In Taiwan, three waves of the NAHSIT data were investigated from 1993–1996, 2005–2008 to 2013–2014, and the prevalence rates of overweight (24≦BMI≦27) (21.5%, 25.5%, to 21.3%), obesity (27 < BMI < 30) (11.8%, 17.9%, to 22.1%) and morbid obesity (BMI > 30) (0.4%, 0.6%, to1.4%) increased sharply in Taiwan. Morbid obesity was found to be correlated with low socioeconomic status and poor dietary patterns. Moreover, the prevalence of obesogenic dietary patterns increased over time in Taiwan [16]. Therefore, further research is needed to better understand the relationship between lifestyle and CVD risk in these countries. Establishing an inter-countries study cohort for CVD and lifestyle is recommended for accurate and up-to-date information [17].
However, our study had some limitations. We noted that correlation did not imply causation and further research is needed to better understand these relationships. Additionally, the specific direction and strength of these correlations may change over time and should be interpreted with caution. Although we tried to standardize our data in different Asian countries as uniformly as possible, some risk factors attributable to CVD in Taiwan had to be retrieved from the governmental survey. However, data representation and accuracy from various sources in international institutions were not promised among the five Asian countries. In addition, different understandings of the definition of lifestyle including dietary behavior, and alcohol drinking that are based on cultural background may also introduce bias into the results. Nevertheless, the trends in the morality from various diseases and their lifestyles may be comparable at different consecutive times in the five countries.
Despite the limitations, owing to the five Asian countries in this study are high levels of economic development, our findings can help governments and healthcare professionals better understand the burden of CVD and CBD mortality and develop effective prevention and management strategies to reduce this incidence of risk factors.

5. Conclusions

Overall, the analysis of CVD and risk factors data from Asian five countries revealed a positive trend of decreasing mortality rates over time. China had the highest age-standardized CVD and CBD mortality rates compared to the other four countries, followed by South Korea and Singapore, while Japan had the lowest rates. However, the inconsistent trends of change for CVD and risk factors suggest that there are other contributing factors to CVD mortality that have not been fully addressed. Therefore, it is important for policymakers and healthcare professionals to continue to prioritize CVD prevention and management through evidence-based interventions and policies. Further research is also needed to better understand the complex interactions between various risk factors and CVD mortality, particularly in the context of the changing Asian demographic and socioeconomic landscape.

Supplementary Materials

Not applicable.

Author Contributions

The following statements should be used “Conceptualization, H.W. Kuo, and W.Y. Lin; methodology, P.Y. Lin and H.W. Kuo; software, W.Y. Lin; validation, H.W. Kuo, W.M. Liang and W.Y. Lin; formal analysis, W.Y. Lin; investigation, P.Y. Lin and H.W. Kuo; resources, W.Y. Lin and W.M. Liang; data curation, W.M. Liang; writing—original draft preparation, H.W. Kuo; writing—review and editing, H.W. Kuo; visualization, W.Y. Lin; supervision, P.Y. Lin and H.W. Kuo; project administration, W.Y. Lin. All authors have read and agreed to the published version of the manuscript.

Funding

This research received no external funding.

Institutional Review Board Statement

Not applicable.

Informed Consent Statement

Not applicable.

Data Availability Statement

Not applicable.

Acknowledgments

Not applicable.

Conflicts of Interest

The authors declare no conflict of interest.

References

  1. Herrington, W.; Lacey, B.; Sherliker, P.; Armitage, J.; Lewington, S. Epidemiology of Atherosclerosis and the Potential to Reduce the Global Burden of Atherothrombotic Disease. Circ. Res. 2016, 118, 535–546. [Google Scholar] [CrossRef] [PubMed]
  2. Zhao, D.; Liu, J.; Wang, M.; Zhang, X.; Zhou, M. Epidemiology of cardiovascular disease in China: current features and implications. Nat. Rev. Cardiol. 2019, 16, 203–212. [Google Scholar] [CrossRef] [PubMed]
  3. Zhao, D. Epidemiological Features of Cardiovascular Disease in Asia. JACC: Asia 2021, 1, 1–13. [Google Scholar] [CrossRef] [PubMed]
  4. Dong, C.; Bu, X.; Liu, J.; Wei, L.; Ma, A.; Wang, T. Cardiovascular disease burden attributable to dietary risk factors from 1990 to 2019: A systematic analysis of the Global Burden of Disease study. Nutr. Metab. Cardiovasc. Dis. 2022, 32, 897–907. [Google Scholar] [CrossRef] [PubMed]
  5. Global Burden of Disease (GBD) Collaborative Network. Global Burden of Disease Study 2019 (GBD 2019) Results. Seattle, WA: Institute for Health Metrics and Evaluation (IHME); 2020. Available at: http://ghdx.healthdata.org/gbdresults-tool. Accessed May 1, 2021. [Google Scholar]
  6. Teo, K.K.; Rafiq, T. Cardiovascular Risk Factors and Prevention: A Perspective From Developing Countries. Can. J. Cardiol. 2021, 37, 733–743. [Google Scholar] [CrossRef] [PubMed]
  7. Joseph, P.; Kutty, V.R.; Mohan, V.; Kumar, R.; Mony, P.; Vijayakumar, K.; Islam, S.; Iqbal, R.; Kazmi, K.; Rahman, O.; et al. Cardiovascular disease, mortality, and their associations with modifiable risk factors in a multi-national South Asia cohort: a PURE substudy. Eur. Hear. J. 2022, 43, 2831–2840. [Google Scholar] [CrossRef] [PubMed]
  8. Yusuf, S.; Joseph, P.; Rangarajan, S.; Islam, S.; Mente, A.; Hystad, P.; Brauer, M.; Kutty, V.R.; Gupta, R.; Wielgosz, A.; et al. Modifiable risk factors, cardiovascular disease, and mortality in 155 722 individuals from 21 high-income, middle-income, and low-income countries (PURE): a prospective cohort study. Lancet 2020, 395, 795–808. [Google Scholar] [CrossRef] [PubMed]
  9. Matsunaga, M.; Yatsuya, H.; Iso, H.; Li, Y.; Yamagishi, K.; Tanabe, N.; Wada, Y.; Ota, A.; Tamakoshi, K.; Tamakoshi, A.; et al. Impact of Body Mass Index on Obesity-Related Cancer and Cardiovascular Disease Mortality; The Japan Collaborative Cohort Study. J. Atheroscler. Thromb. 2022, 29, 1547–1562. [Google Scholar] [CrossRef] [PubMed]
  10. Li, X.; Wu, C.; Lu, J.; Chen, B.; Li, Y.; Yang, Y.; Hu, S.; Li, J. Cardiovascular risk factors in China: a nationwide population-based cohort study. Lancet Public Health 2020, 5, e672–e681. [Google Scholar] [CrossRef]
  11. Adepoju, L.; Danos, D.; Green, C.; Cook, M.W.; Schauer, P.R.; Albaugh, V.L. Effect of high-risk factors on postoperative major adverse cardiovascular and cerebrovascular events trends following bariatric surgery in the United States from 2012 to 2019. Surg. Obes. Relat. Dis. 2022, 19, 59–67. [Google Scholar] [CrossRef]
  12. Ma, D.; Sakai, H.; Wakabayashi, C.; Kwon, J.-S.; Lee, Y.; Liu, S.; Wan, Q.; Sasao, K.; Ito, K.; Nishihara, K.; et al. The prevalence and risk factor control associated with noncommunicable diseases in China, Japan, and Korea. J. Epidemiology 2017, 27, 568–573. [Google Scholar] [CrossRef]
  13. Wu, Y.; Xiong, Y.; Wang, P.B.; Liu, R.; Jia, X.B.; Kong, Y.B.; Li, F.B.; Chen, C.B.; Zhang, X.B.; Zheng, Y. Risk factors of cardiovascular and cerebrovascular diseases in young and middle-aged adults: A meta-analysis. Medicine 2022, 101, e32082. [Google Scholar] [CrossRef]
  14. Yang, J.J.; Yu, D.; Wen, W.; Shu, X.O.; Saito, E.; Rahman, S.; Gupta, P.C.; He, J.; Tsugane, S.; Xiang, Y.B.; et al. Tobacco Smoking and Mortality in Asia: A Pooled Meta-analysis. JAMA Netw Open 2019, 2, e191474. [Google Scholar] [CrossRef] [PubMed]
  15. Nam, G.E.; Kim, Y.-H.; Han, K.; Jung, J.-H.; Rhee, E.-J. ; Won-Young Won-Young Lee; On Behalf of the Taskforce Team of the Obesity Fact Sheet of the Korean Society for the Study of Obesity; Obesity Fact Sheet of the Korean Society for the Study of Obesity Obesity Fact Sheet in Korea, 2020: Prevalence of Obesity by Obesity Class from 2009 to 2018. J. Obes. Metab. Syndr. 2021, 30, 141–148. [Google Scholar] [CrossRef] [PubMed]
  16. Chang, H.C.; Yang, H.C.; Chang, H.Y.; Yeh, C.J.; Chen, H.H.; Huang, K.C.; Pan, W.H. Morbid obesity in Taiwan: Prevalence, trends, associated social demographics, and lifestyle factors. PLoS ONE 2017, 12, e0169577. [Google Scholar] [CrossRef] [PubMed]
  17. Wang L, Kong L, Wu F, Bai Y, Burton R. Preventing chronic diseases in China. Lancet 2005, 366, 1821–1824. [Google Scholar] [CrossRef] [PubMed]
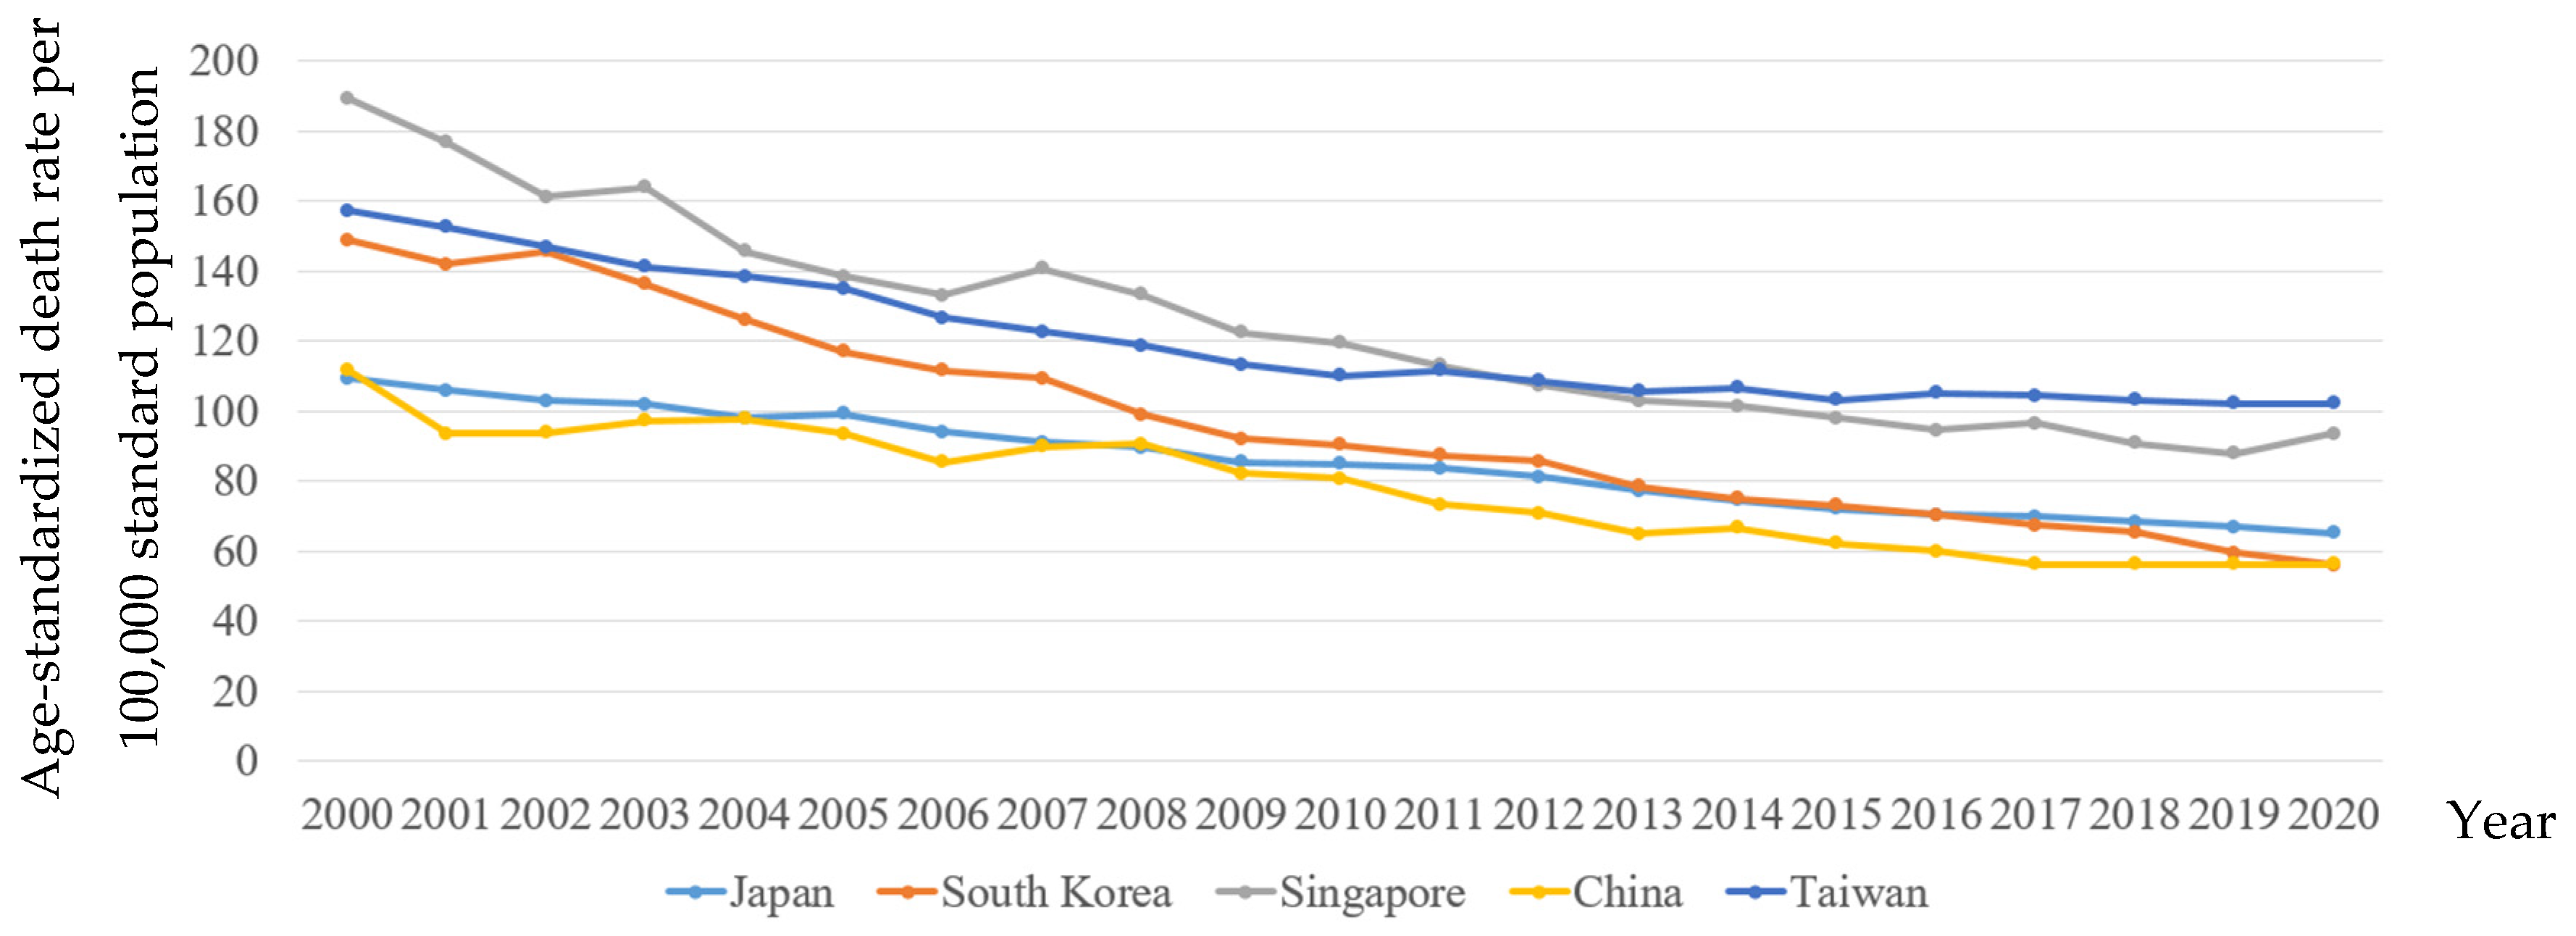
Figure 1. Secular trends of age-standardized CVD mortality in five Asian countries from 2000 to 2020
Preprints 78004 g001
Figure 2. Secular trends of standardized CBD mortality in five Asian countries from 2000 to 2020
Preprints 78004 g002
Figure 3. Trends of percentages for CBD mortality contributing to CVD mortality in five Asian countries from 2000 to 2020
Preprints 78004 g003
Figure 4. Secular trends of age-standardized hypertension mortality in five Asian countries from 2000 to 2020
Preprints 78004 g004
Figure 5. Secular trends of age-standardized Diabetes Mellitus (DM) mortality in five Asian countries from 2000 to 2020
Preprints 78004 g005
Figure 6. Secular trends of alcohol dependence in five Asian countries from 2000 to 2020
Preprints 78004 g006
Table 1. The absolute difference (AD) and relative differences (RD) in CVDs, CBD, hypertension, and diabetes mortality in five Asian countries during three periods.
CVD CBD Hypertension Diabetes Mellitus
AD RD % AD RD % AD RD % AD RD %
Japan        
2003-2008 -12.40 -13.84 -8.60 -25.37 -0.20 -18.18 -0.30 -6.98
2009-2014 -10.90 -14.63 -6.60 -26.29 -0.10 -11.11 -0.60 -17.65
2015-2020 -6.80 -10.45 -3.90 -19.40 0.20 20.00 -0.20 -6.67
South Korea
2003-2008 -37.10 -37.47 -32.70 -65.93 -4.30 -86.00 -8.50 -47.75
2009-2014 -16.90 -22.53 -11.90 -37.66 -0.60 -16.67 -2.60 -19.26
2015-2020 -17.00 -30.36 -9.30 -0.005 -0.50 -16.67 -4.90 -61.25
Singapore
2003-2008 -30.50 -22.88 -11.40 -33.63 -7.90 -105.33 0.40 3.54
2009-2014 -20.80 -20.49 -2.90 -0.10 4.00 33.33 -1.50 -30.61
2015-2020 -4.50 -4.81 -4.80 -28.40 -4.30 -52.44 -0.60 -16.67
China
2003-2008 -6.60 -7.29 -5.40 -18.37 1.10 18.64 -3.50 -77.78
2009-2014 -15.60 -23.42 -5.30 -25.00 -0.80 -20.00 -1.40 -56.00
2015-2020 -5.80 -10.32 -2.10 -11.86 0.40 9.76 -0.90 -39.13
Taiwan
2003-2008 -22.59 -19.04 -14.90 -42.57 3.80 33.93 -13.60 -0.51
2009-2014 -6.90 -6.48 -2.40 -7.89 2.00 14.81 -0.60 -2.31
2015-2020 -1.03 -1.01 -2.70 -10.71 0.20 1.49 -2.30 -10.45
Table 2. The absolute and relative differences in prevalence rates of alcohol dependence, smoking and overweight in five Asian countries during three periods.
alcohol dependence Smoking Overweight
AD RD % AD RD % AD RD %
Japan     Japan Japan
2003-2008 0.00 0.00 2005-2010 -3.60 -13.95 2000-2005 2.20 9.02
2009-2014 0.03 4.76 2010-2015 -3.10 -13.66 2006-2010 0.00 0.00
2015-2019 0.02 3.08 2015-2020 -2.60 -12.94 2011-2016 1.90 6.99
South Korea     South Korea South Korea
2003-2008 0.12 3.56 2005-2010 -3.70 -13.70 2000-2005 2.50 9.19
2009-2014 -0.04 -1.22 2010-2015 -3.20 -13.45 2006-2010 1.80 6.10
2015-2019 -0.75 -29.64 2015-2020 -3.00 -14.42 2011-2016 2.10 6.54
Singapore     Singapore Singapore
2003-2008 0.00 0.00 2005-2010 0.00 0.00 2000-2005 1.70 5.63
2009-2014 -0.01 -1.52 2010-2015 0.00 0.00 2006-2010 1.30 4.09
2015-2019 0.05 7.04 2015-2020 0.00 0.00 2011-2016 1.5 4.46
China     China China
2003-2008 -0.02 -1.74 2005-2010 -0.90 -3.60 2000-2005 3.30 13.69
2009-2014 0.02 1.68 2010-2015 -0.70 -2.88 2006-2010 3.00 10.79
2015-2019 0.08 6.25 2015-2020 -0.80 -3.40 2011-2016 3.80 11.76
Taiwan     Taiwan Taiwan
2003-2008 0.05 9.09 2005-2010 -2.90 -14.65 2000-2005 NA NA
2009-2014 0.04 6.56 2010-2015 -2.70 -15.79 2006-2010 1.05 2.73
2015-2019 0.01 1.59 2015-2020 -4.00 -30.53 2011-2016 8.15 17.30
Table 3. CVD mortality correlated with CBD mortality, hypertension mortality, diabetes mortality, prevalence of overweight, smoking, and alcohol dependence in the five Asian Countries .
Japan South Korea Singapore China Taiwan
CBD 0.997** 0.997** 0.952** 0.988** 0.926**
Hypertension 0.812** 0.887** 0.329 0.854** -0.732**
Diabetes 0.985** 0.987** 0.848** 0.916** 0.852**
Overweight -0.958** -0.990** -0.983** -0.972** -0.670**
Smoking 0.997** 0.992** -0.795** 0.967** 0.936**
Alcohol dependence -0.700** 0.183 0.135 -0.398 -0.978**
Disclaimer/Publisher’s Note: The statements, opinions and data contained in all publications are solely those of the individual author(s) and contributor(s) and not of MDPI and/or the editor(s). MDPI and/or the editor(s) disclaim responsibility for any injury to people or property resulting from any ideas, methods, instructions or products referred to in the content.
Copyright: This open access article is published under a Creative Commons CC BY 4.0 license, which permit the free download, distribution, and reuse, provided that the author and preprint are cited in any reuse.
Alerts
Prerpints.org logo

Preprints.org is a free preprint server supported by MDPI in Basel, Switzerland.

Subscribe

© 2025 MDPI (Basel, Switzerland) unless otherwise stated