1. Introduction
Yunnan Province, situated on the southwest border of China, is a representative plateau mountainous region. Its distinct geographical and geological environment, along with its topography, are the primary causes behind frequent occurrences of geological disasters. The plateau mountainous terrain is prone to geological hazards such as collapses, landslides, and debris flows, posing significant threats to national economic development, the safety of lives and properties, as well as causing substantial damage to infrastructure and the ecological environment within the affected areas [
1]. Among geological disasters in China, slope-related incidents rank as the second most prevalent after earthquakes [
2]. Within the realm of geological disaster management, susceptibility zoning plays a vital role and constitutes an essential component of prevention and mitigation efforts. A scientifically sound and reliable geological disaster susceptibility zoning map plays a strategic guiding role in various work processes by effectively predicting disaster-prone areas and reducing the losses caused by such events.
To date, both domestic and international scholars have made significant progress in evaluating geological disaster susceptibility. The primary evaluation models can be categorized into three types: qualitative models, mathematical statistical models, and machine learning models. Qualitative models primarily include the Analytic Hierarchy Process [
3] and the fuzzy comprehensive evaluation method [
4]. These models determine the weight of evaluation factors based on experts' understanding of the disaster mechanisms and their accumulated experience. However, the evaluation results from such models may contain subjective elements. Geological disasters often result from a combination of internal and inducing factors and their spatial and temporal characteristics are not influenced by human subjective consciousness. Mathematical statistical models mainly encompass the information quantity method [
5] and the deterministic coefficient method [
6]. These models objectively reflect the contribution of each evaluation factor to the occurrence of geological disasters based on the information value carried by each factor. However, they require extensive engineering geological data, which may not be suitable for large research areas. Furthermore, these models fail to fully consider the correlation between various evaluation factors in weight determination and merely overlap information values with deterministic coefficient values. As a result, the accuracy of the evaluation results can be affected to some extent. Machine learning models mainly include artificial neural networks [
7] and support vector machines [
8]. While these models can better adapt to the complex nonlinear characteristics of slope-related geological disasters, they often suffer from issues related to weak interpretation or overfitting of prediction results [
9]. Additionally, these methods do not directly reflect the relative importance of each evaluation index, failing to effectively guide the focus of disaster prevention and control efforts.
In order to enhance the precision of model evaluation results, mitigate overfitting, and capture the relative importance of each evaluation factor, the random forest algorithm, as a prominent technique in ensemble learning, emerges as a promising solution to address the aforementioned limitations. Merghadi et al. [
10] conducted research in the Mira Basin in North Africa, focusing on the prediction accuracy of five machine learning models, including random forest, boosting gradient machines, and neural networks, for assessing susceptibility to landslide geological hazards. The results demonstrated that the random forest model exhibited superior prediction accuracy. Likewise, He et al. [
11] utilized the random forest model to investigate the rapid evaluation of earthquake-induced landslide susceptibility. Through verification, the study found that the random forest model displayed strong predictive capabilities, allowing for the analysis of three influential factors contributing to the occurrence of disasters. Furthermore, Goetz et al. [
12] compared the predictive capabilities of mathematical statistical models and machine learning models in landslide susceptibility assessments across three distinct regions in Austria. The findings indicated that the random forest model was better suited for landslide susceptibility modeling. In recent years, a coupled model that integrates multiple individual models with the random forest technique has attracted considerable attention among scholars in the field of geological disasters, as it improves prediction and generalization capabilities. Liu et al. [
13] combined the information method with the random forest model to investigate geological disaster susceptibility in Gongbujiangda County. The random forest model was employed to obtain the weights of the evaluation factors, and a weighted linear combination was used to generate the susceptibility zoning map. Similarly, Zheng et al. [
14] examined the application of the deterministic coefficient method and the random forest model in assessing landslide susceptibility in Mangshi, Yunnan. The study revealed that the CF-RF model achieved higher accuracy than the standalone RF model. The evaluation results obtained can serve as a scientific reference.
In summary, this study focuses on Huize County, Yunnan Province, as the research area and selects eight evaluation factors, including elevation, gradient, terrain relief, stratum lithology, normalized difference vegetation index, distance from the fault, distance from the road, and distance from the river. The CF-RF model is employed to assess the susceptibility to geological disasters in Huize County, analyze the accuracy of the results, and determine the significance of the evaluation factors based on the random forest model.
2. Overview of the Study Area
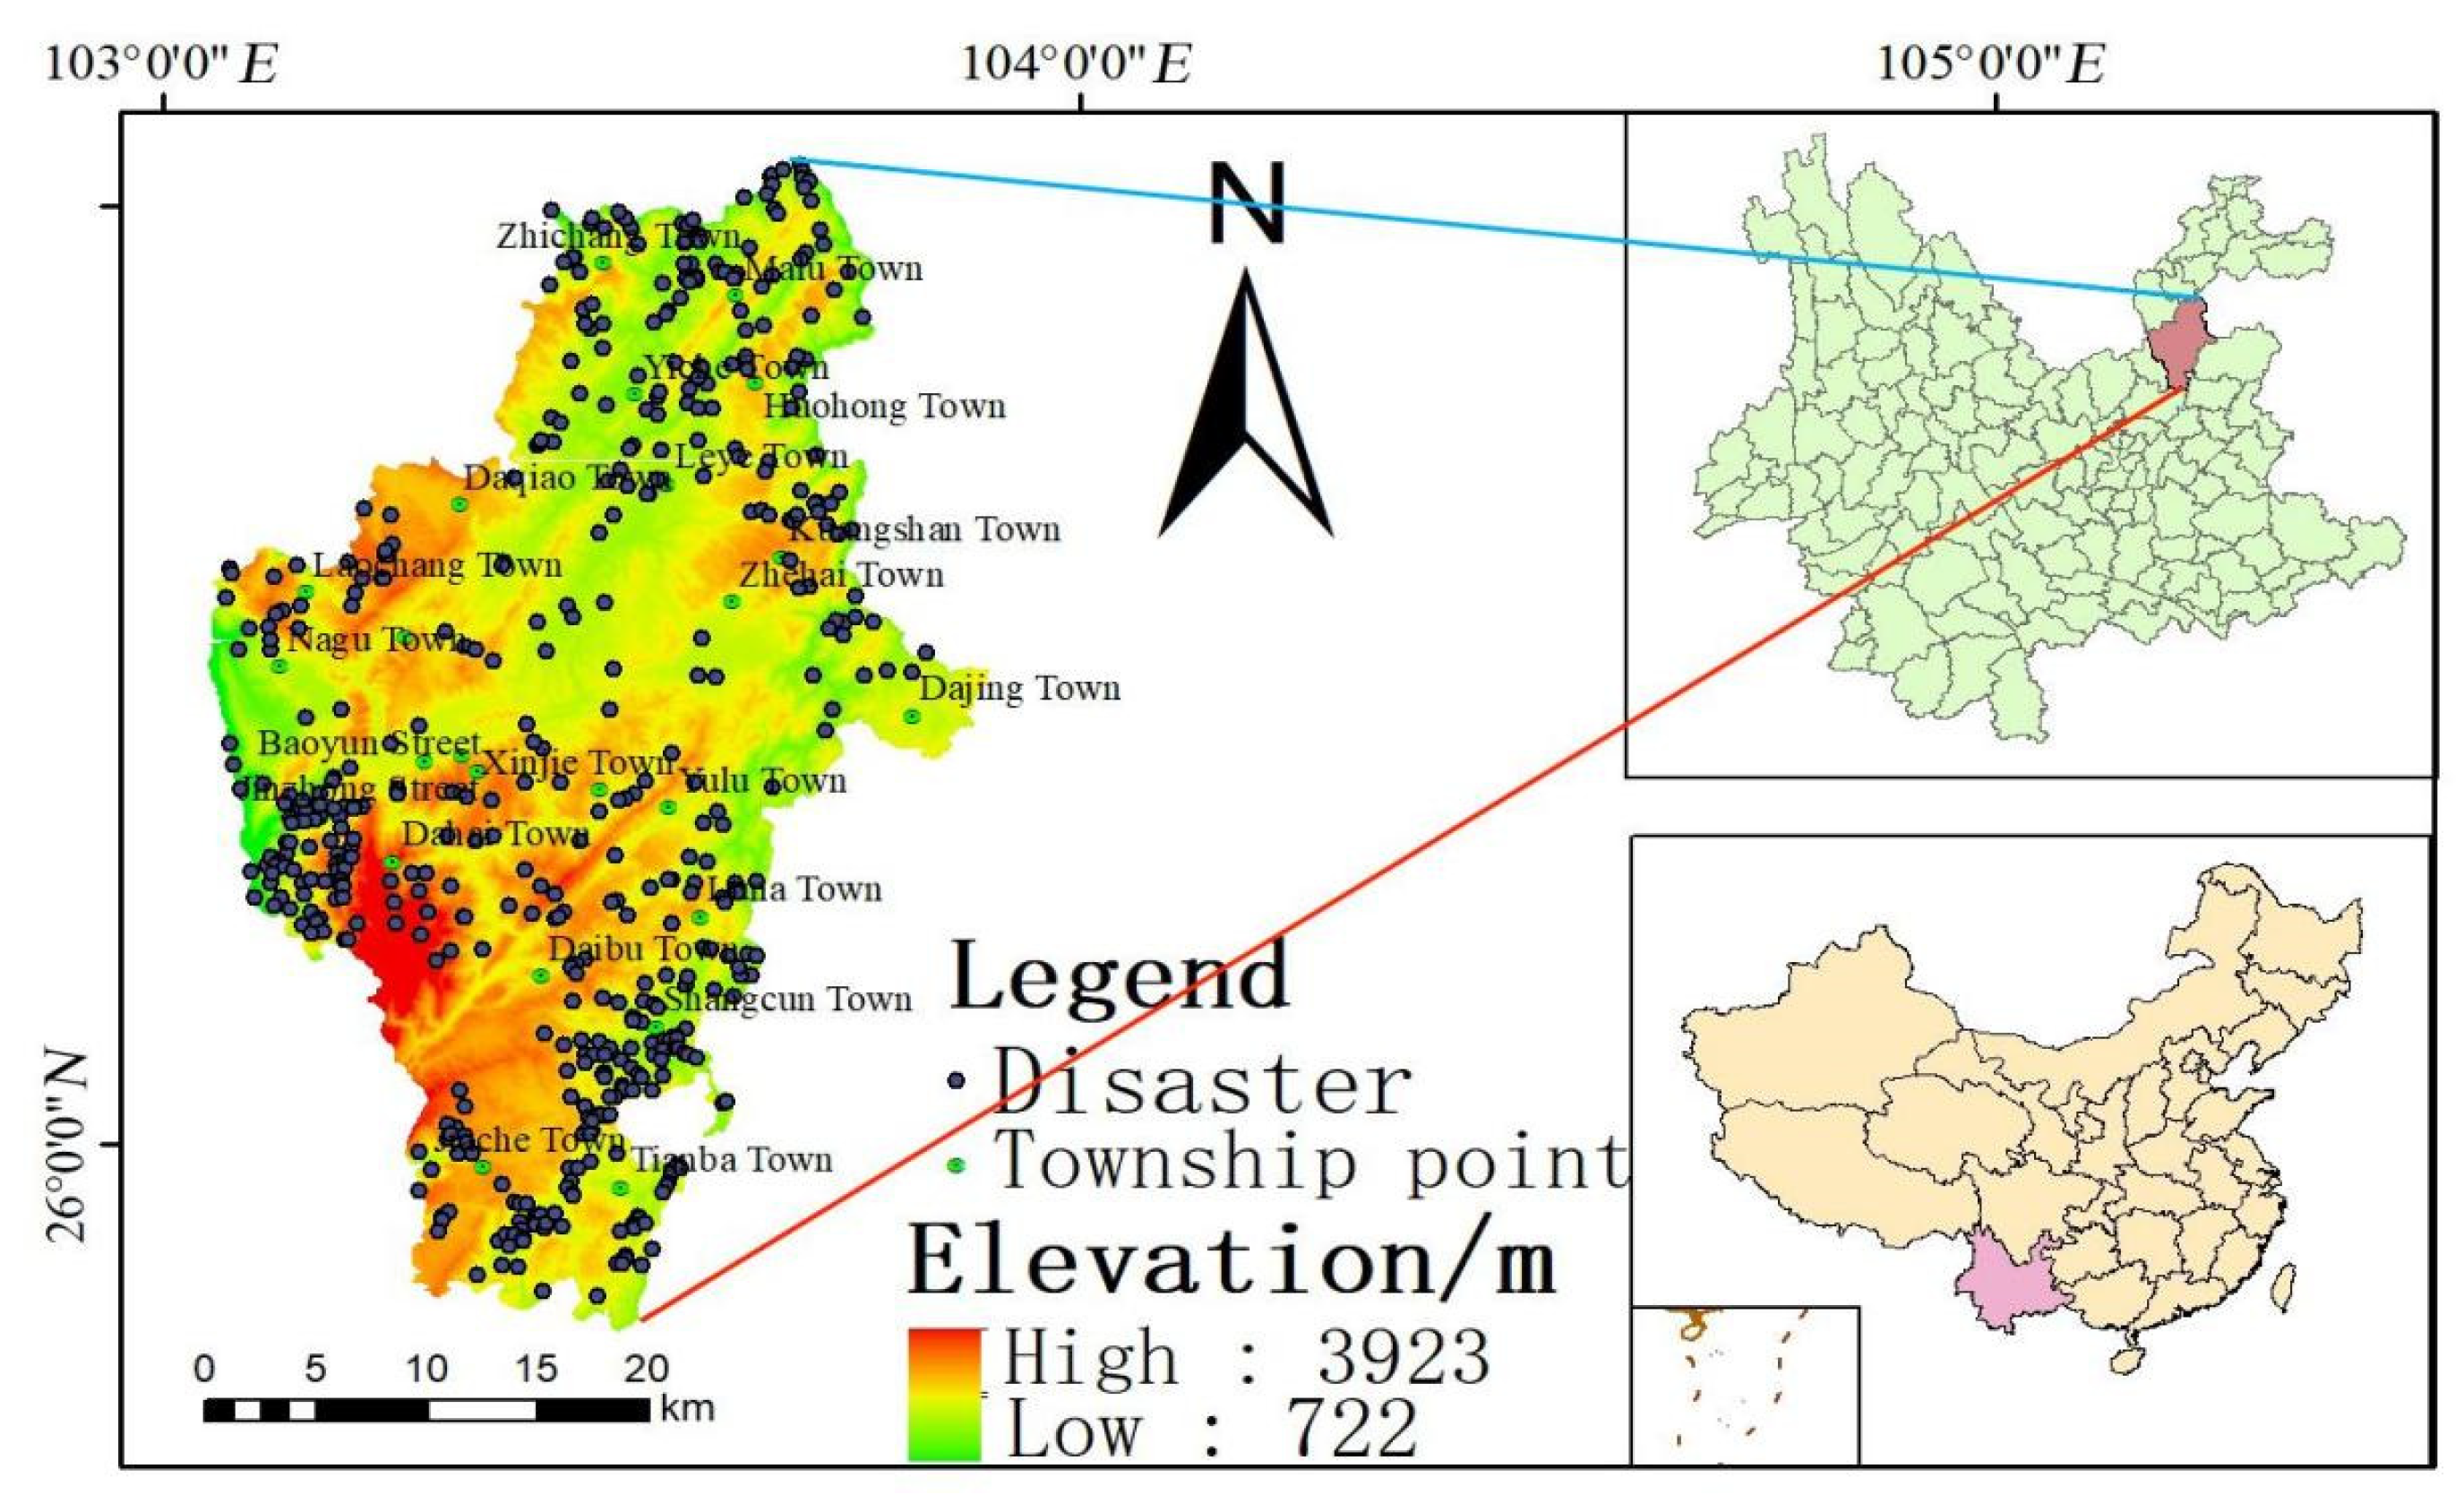
Huize County, under the administration of Qujing City, is situated in the northeastern part of Yunnan Province. It is positioned on the eastern bank of the Jinsha River, at the summit of the main peak of the Wumeng Mountains, and serves as the juncture between the eastern Yunnan Plateau and the western Guizhou Plateau. The county's boundaries span between 103 ° 03 ′ ~ 103 ° 55 ′ E and 25 ° 48 ′ ~ 27 ° 04 ′ N. The terrain is characterized by steep slopes, towering heights, and numerous deep ravines, presenting an undulating landscape. Generally, the topography features a high-northwest to low-southeast gradient, with a relative elevation difference of 3322 meters from west to east. The highest peak in the region is Dahailiangzi Guniuzhai, which stands at 4017 meters and is the highest point in Qujing City. Conversely, the lowest point lies at the junction of the Xiaojiang River and Jinsha River, with an altitude of 695 meters, marking the lowest elevation in Qujing City. The geomorphological attributes of the area classify it into three categories: mountain landforms, basin landforms, and localized glacial landforms. Huize experiences a typical temperate plateau monsoon climate, characterized by cool summers and cold winters, with indistinct seasonal boundaries. The annual maximum rainfall reaches 1500 mm in the higher-altitude regions, while the minimum annual rainfall in lower-altitude areas reaches 500 mm. On average, the annual rainfall measures approximately 817.1 mm. The region boasts a well-developed surface water system, with the Xiaojiang River, Yili River, and Niulan River as the primary watercourses. Due to the river channels' incision, slopes in the area are susceptible to destabilization under external forces, leading to disasters such as landslides and debris flows. The exposed geological strata in Huize span from the Proterozoic to the Quaternary, with the exception of the Cretaceous period. Areas characterized by hard and soft/hard rock compositions are prone to geological disasters. The region experiences pronounced tectonic activity, primarily in the form of synclines. Notably, the Xiaojiang Fault exhibits significant recent tectonic movement and is prone to frequent earthquakes. Existing disasters primarily occur in proximity to fault zones. The geographic location and distribution of disaster points in the study area are depicted in
Figure 1.
3. Introduction of the Model Method
3.1. Certainty Factor Model
The deterministic coefficient model was initially introduced by Shortliffe et al. [
15] and subsequently refined by Heckerman [
16]. This model employs a probability function that assumes future geological disasters will occur under the same conditions as past geological disasters. The calculation formula for this model is as follows:
where
represents the conditional probability of geological disasters in the evaluation factor classification level a. The assessment of geological disaster susceptibility typically involves expressing it as the ratio between the number of geological disaster points in a specific level and the corresponding proportion of the area occupied by that level a.
is expressed by the ratio of the number of geological disaster points in the whole study area to the area of the whole study area. From Equation (1), it is evident that the CF value ranges between [ –1 ~ 1]. A positive value signifies a higher susceptibility to geological disasters, with values closer to 1 indicating a greater contribution of the corresponding factor. Conversely, a negative value suggests a lower likelihood of geological disasters occurring, with values closer to –1 indicating a diminished probability under the influence of such factors. When the calculated result approaches 0, it becomes difficult to determine the impact of the factor on the susceptibility to geological disasters.
3.2. Random Forest Model
The random forest model [
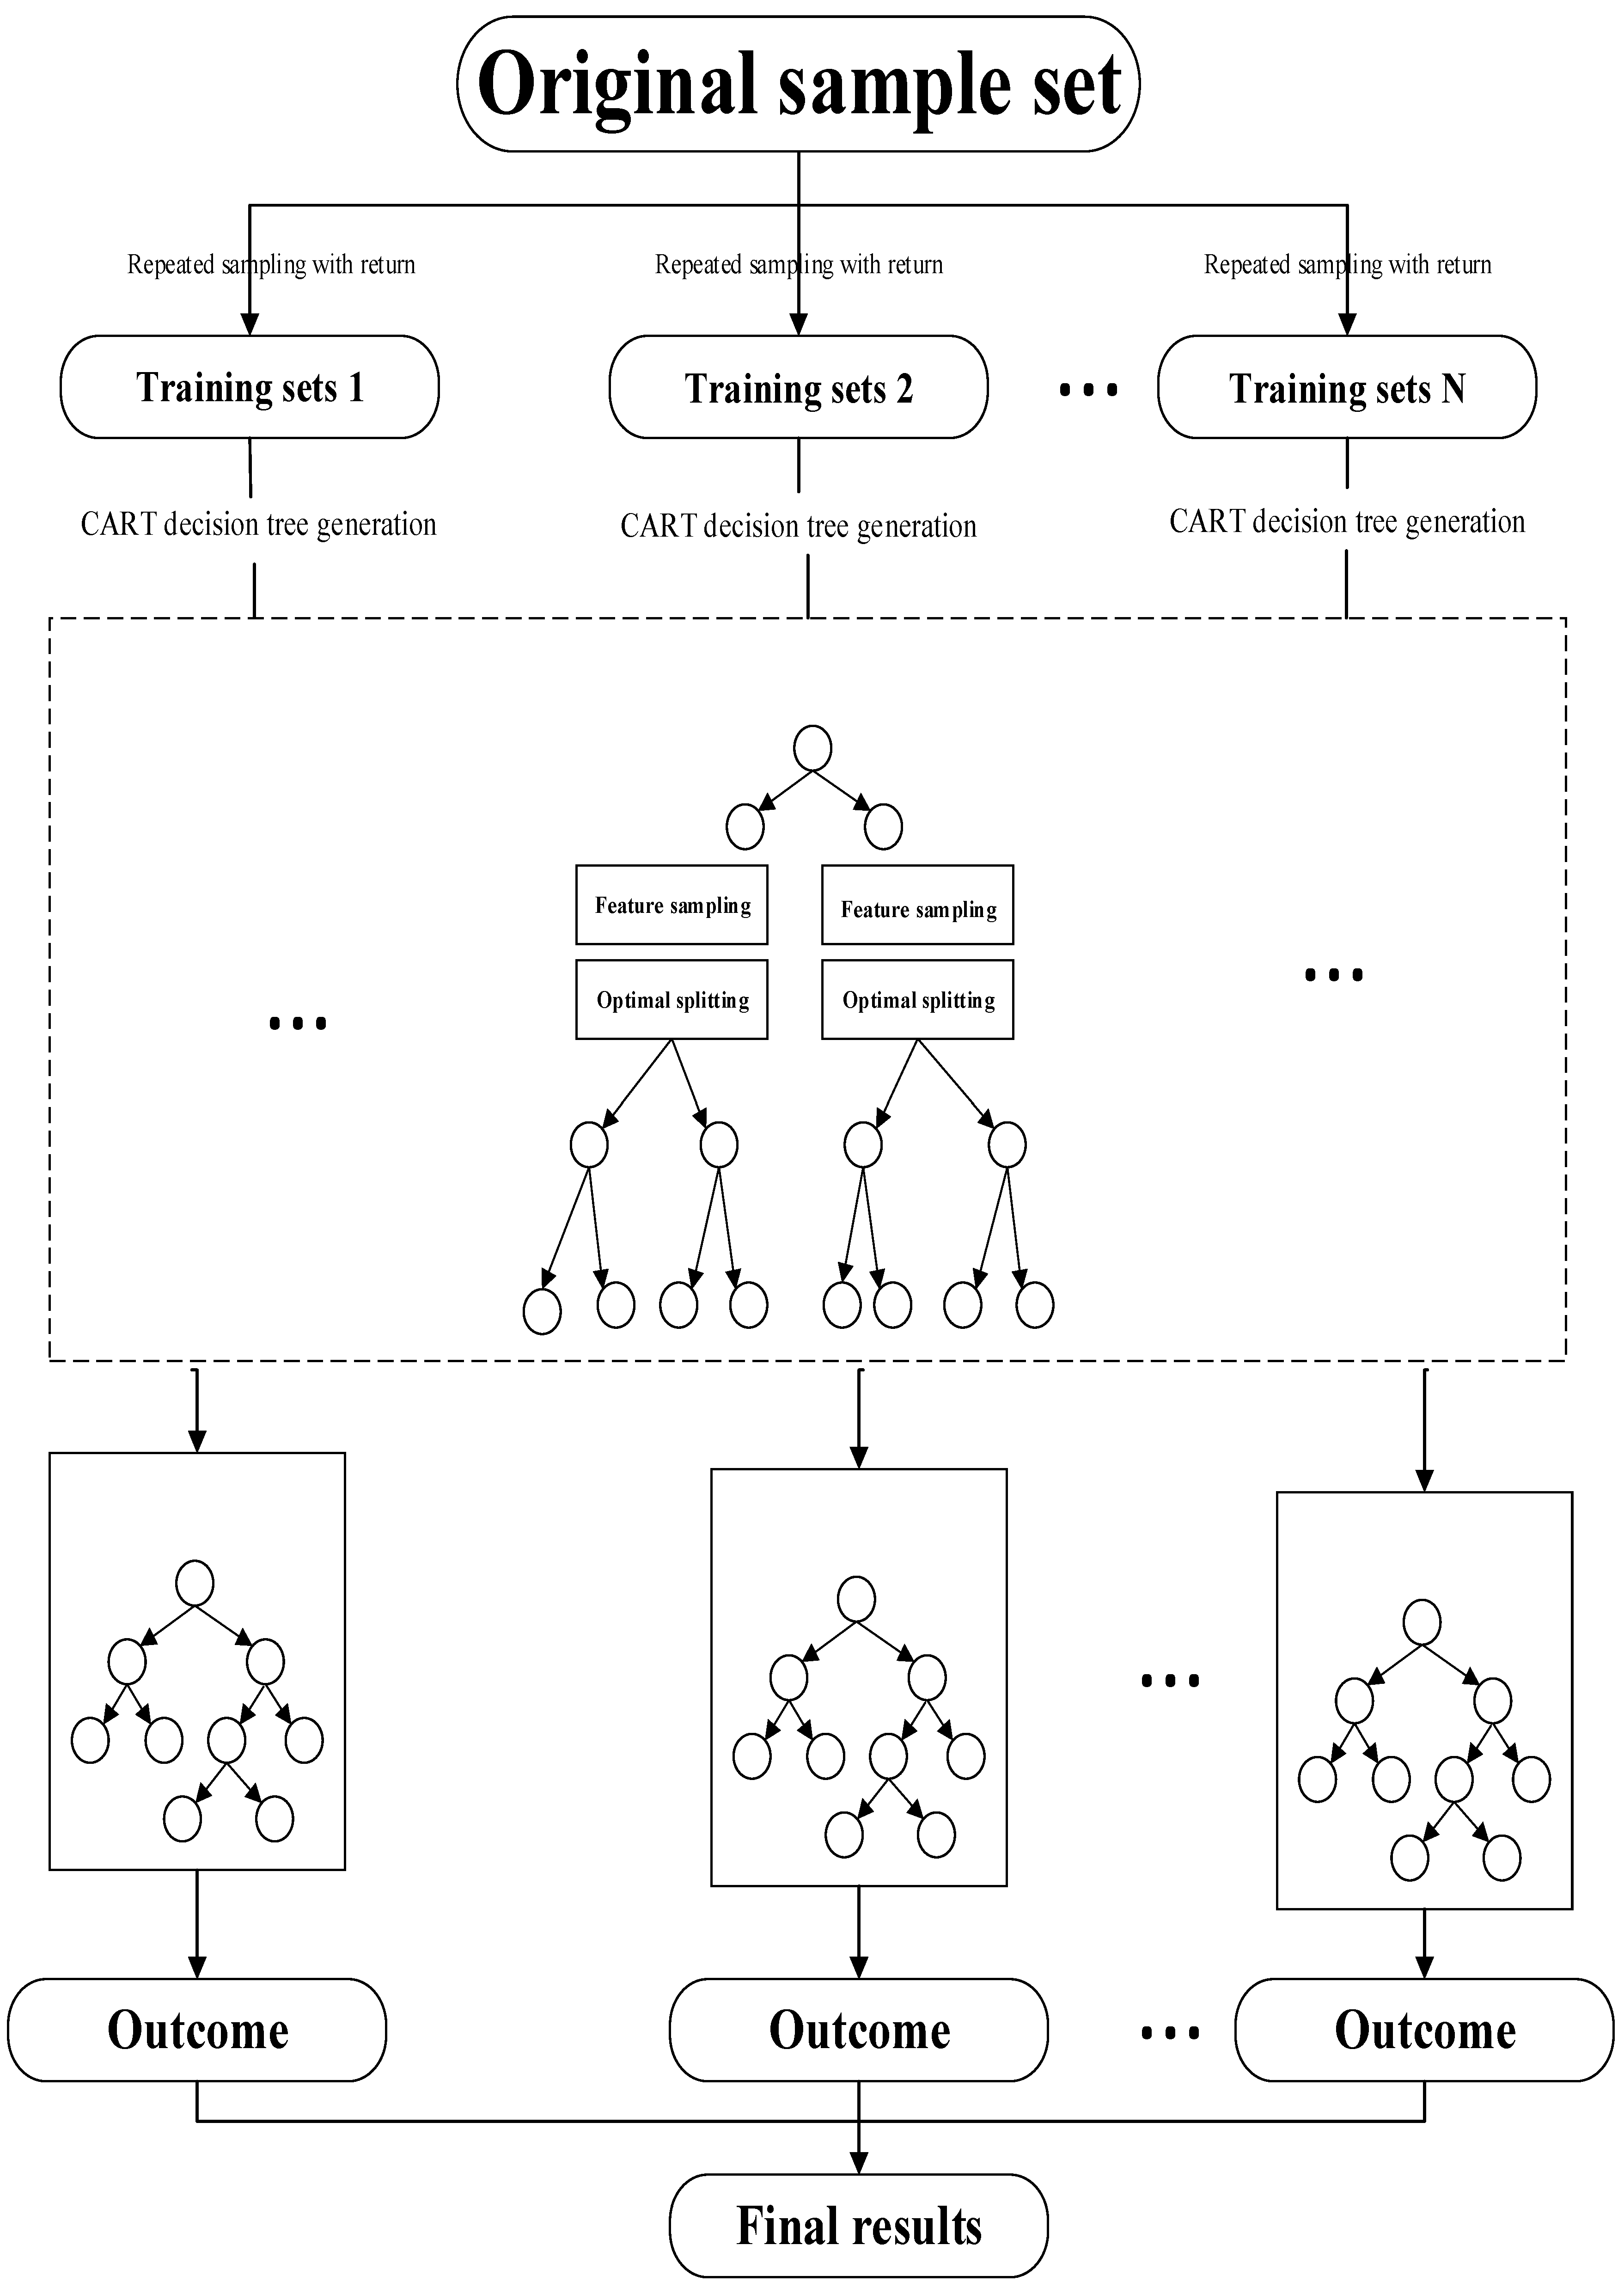
17] is an ensemble learning method that integrates multiple decision trees through random sampling. It is widely regarded as a more accurate and reliable model. The application of the random forest model in assessing geological disaster susceptibility can be summarized as follows. Firstly, the model randomly selects N times from the sample set of N evaluation factors using the Bootstrap aggregating method to create N training sets, with each training set used to build a decision tree. During the growth process of each decision tree, internal nodes split and expand without pruning. At each splitting point, the internal nodes randomly sample from the feature set and select the optimal split among the extracted features. Ultimately, each decision tree independently votes on the calculated results of all decision trees, with the category receiving the most votes determined as the final result. The random forest model involves two types of random sampling: one randomly samples the original sample set to obtain different training sets, while the other randomly samples the features at each internal node to determine the split feature set for that node. By employing these two random sampling processes, the model reduces sensitivity to data noise and outliers during the classification process, thereby improving prediction accuracy and effectively mitigating overfitting. The key steps of the random forest algorithm are depicted in
Figure 2 and can be summarized as follows:
- (1)
Randomly sample (with replacement) N times from the original sample data to create N training sets. In this sampling process, approximately 36% of the data will not be included due to the sampling with replacement. This unselected data is referred to as Out-of-Bag (OOB) and is often used to evaluate model performance and select optimal parameters.
- (2)
Each training set generates a decision tree. Assuming the original sample has M features, K features (where K ≤ M) are randomly selected as the split feature set at each internal node of all decision trees. The optimal value of K should be determined based on the OOB error.
- (3)
The decision trees are generated using the classification and regression tree (CART) algorithm, with each tree growing freely without pruning.
- (4)
Repeat the above steps j times to create j training sets and j decision trees. The unselected data corresponding to each decision tree forms the j out-of-bag data.
- (5)
Combine all the decision trees to form a random forest. The output of the random forest is determined by aggregating the votes from each decision tree. The results from each tree are summarized, and the category with the highest number of votes is considered the final result. For regression tasks, the final result is obtained by calculating the mean of the results from each tree.
The random forest algorithm employs impurity partitioning, specifically using the Gini index, to calculate the relative weight of each evaluation factor in the assessment of geological disaster susceptibility. The Gini reduction value
of the evaluation factor
i in the random forest is calculated when the nodes are divided. After adding
at all tree nodes,
of all evaluation factors of each tree in the forest is averaged, which indicates importance of the evaluation factor
i.
where
m denotes the number of parent nodes;
c denotes the number of classification child nodes;
n is the total number of evaluation factors;
represents the Gini reduction value of i-th evaluation factor at the y-th child node under the parent node
x and
represents the relative importance of i-th evaluation factor.
3.3. Weighted Linear Combination
Weighted linear combination exhibits a simple and comprehensible calculation principle, making it a popular approach in the assessment of geological disaster susceptibility. This method utilizes a linear model for a comprehensive evaluation and can be effectively integrated with GIS technology [
18]. Leveraging these aforementioned benefits, this study integrates the relative importance of each evaluation factor, determined by the random forest model, with the deterministic coefficient. This integration establishes a geological disaster susceptibility evaluation model. The formula is:
where
y is the comprehensive CF value;
n is the number of evaluation factors;
is the importance of evaluation factor i, calculated by the formula (2).
4. Evaluation of Geological Disaster Susceptibility
4.1. Selection and Classification of Evaluation Factors
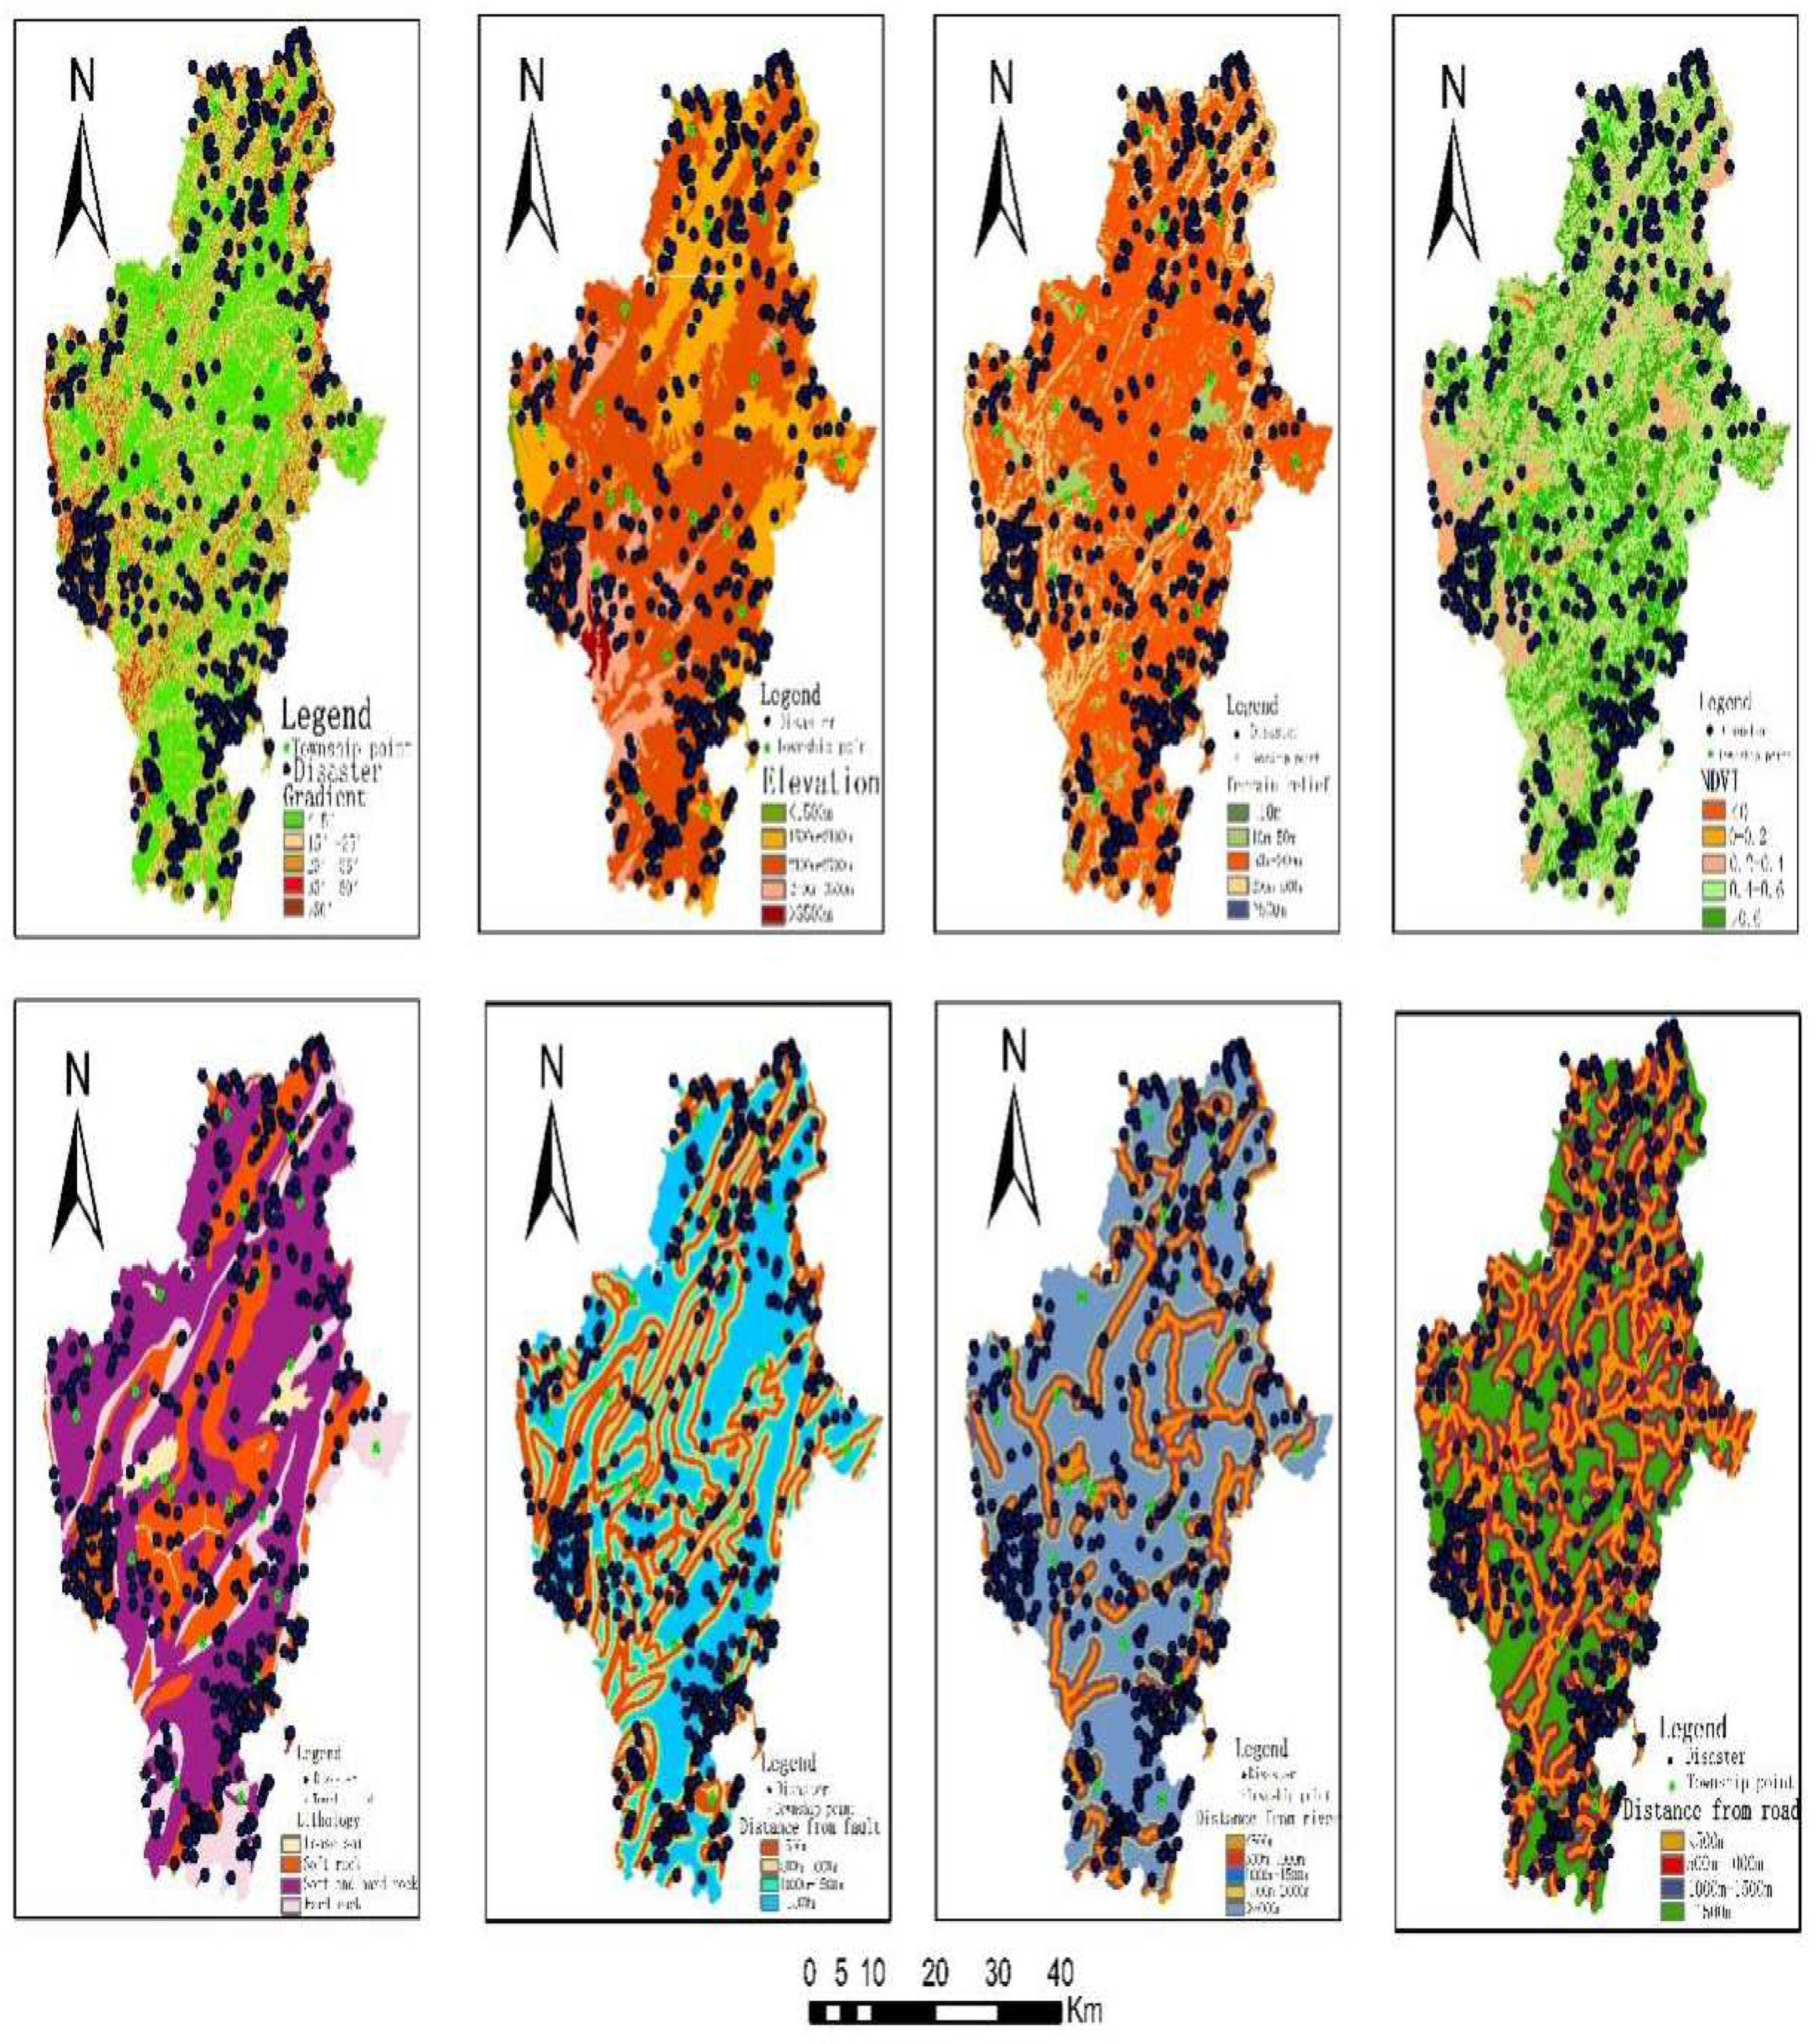
The evaluation of geological disaster susceptibility relies on two critical components: evaluation factors and evaluation models. To ensure reliable susceptibility zoning results, it is essential to utilize objective and authentic data, as well as employ scientifically and logically sound classification methods. The selection of an appropriate evaluation model should align with the specific disaster conditions present in the study area. A well-chosen evaluation model can address the limitations of individual evaluation methods, tackle the challenges associated with correlation and weighting between evaluation factors, and ultimately enhance the accuracy of the evaluation results. Considering the survey data of geological disasters within the study area, a detailed investigation of typical slope geological disaster points has been conducted. Through a comprehensive analysis of the strong linkage between the factors causing disasters and the mechanisms behind their occurrence, it is evident that topography, geological structure, stratigraphic lithology, water systems, and human engineering activities exert significant control over geological disasters in Huize County. The distribution of previous geological disasters predominantly occurs in regions characterized by pronounced topographic relief, steep terrain, active tectonic movement, intense human engineering activities, low vegetation coverage, alternating soft and hard strata, as well as rock mass joints and fissures. In this study, eight disaster-causing factors, including elevation, gradient, terrain relief, stratum lithology, normalized difference vegetation index, distance from the fault, distance from the road, and distance from the river, have been selected as evaluation indices (rainfall, earthquakes, and other inducing factors are typically not considered in the evaluation of geological disaster susceptibility). These evaluation factors are classified according to the patterns of disaster formation, and the classification results are presented in
Figure 3.
4.2. Evaluation Factor of Each Grade CF Value Calculation
The collected data for each evaluation factor is imported into the ArcGIS platform, where it is reclassified and subsequently rasterized. All vector data is converted to raster format and combined with the disaster point data. Using the ArcGIS multi-value extraction to point function, the number of disaster points corresponding to different classification levels for each evaluation factor can be determined. After the classification and counting process, the CF values for each evaluation factor are calculated using Equation (1), and the results are presented in
Table 1.
Table 1 reveals that elevation, topographic relief, and NDVI exert significant control over the initial conditions of geological disasters in Huize County. Areas with altitudes below 1500 m, topographic relief below 10 m, and NDVI below 0 indicate relatively strong human engineering activities, disruption of the natural balance of rocks and soil, limited vegetation, and severe soil erosion. These factors contribute to the occurrence of geological disasters. On the other hand, at altitudes exceeding 3500 m, the influence of heavy rainfall, low-temperature weather, and physical weathering of rock masses further amplify the risk of disaster occurrence. The CF values for road, fault, and water system indicators decrease with increasing distance, suggesting that a greater distance corresponds to a lower probability of disasters.
4.3. Multicollinearity Diagnosis of Evaluation Factors
When there is a high degree of correlation among evaluation factors in a susceptibility evaluation model, it often leads to lower-than-expected accuracy, thereby undermining the effectiveness of susceptibility zoning results in providing guidance. Prior to applying the model, it is crucial to assess the independence of each factor through a check for multicollinearity [
19]. In this study, the CF values of both disaster point and non-disaster point data were calculated, normalized, and imported into SPSS software. Subsequently, a multicollinearity diagnosis was conducted using SPSS software to assess the eight evaluation factors (
Table 2). The results were evaluated based on tolerance (T) and variance inflation factor (VIF). VIF measures the ratio of the variance in the presence of multicollinearity between explanatory variables to the variance in the absence of multicollinearity, providing insights into the degree of variance inflation caused by multicollinearity. T and VIF are reciprocals of each other. A value of T<0.1 or VIF>10 suggests a high degree of collinearity [
20]. Analysis of
Table 2 indicates that all evaluation indicators have T values exceeding 0.1 or equivalently, VIF values below 10. This suggests that collinearity between the evaluation factors is not substantial and that independence is well-maintained, allowing for the application of these factors in the model.
4.4. Parameter Optimization of Random Forest Model
(1) Feature number selection
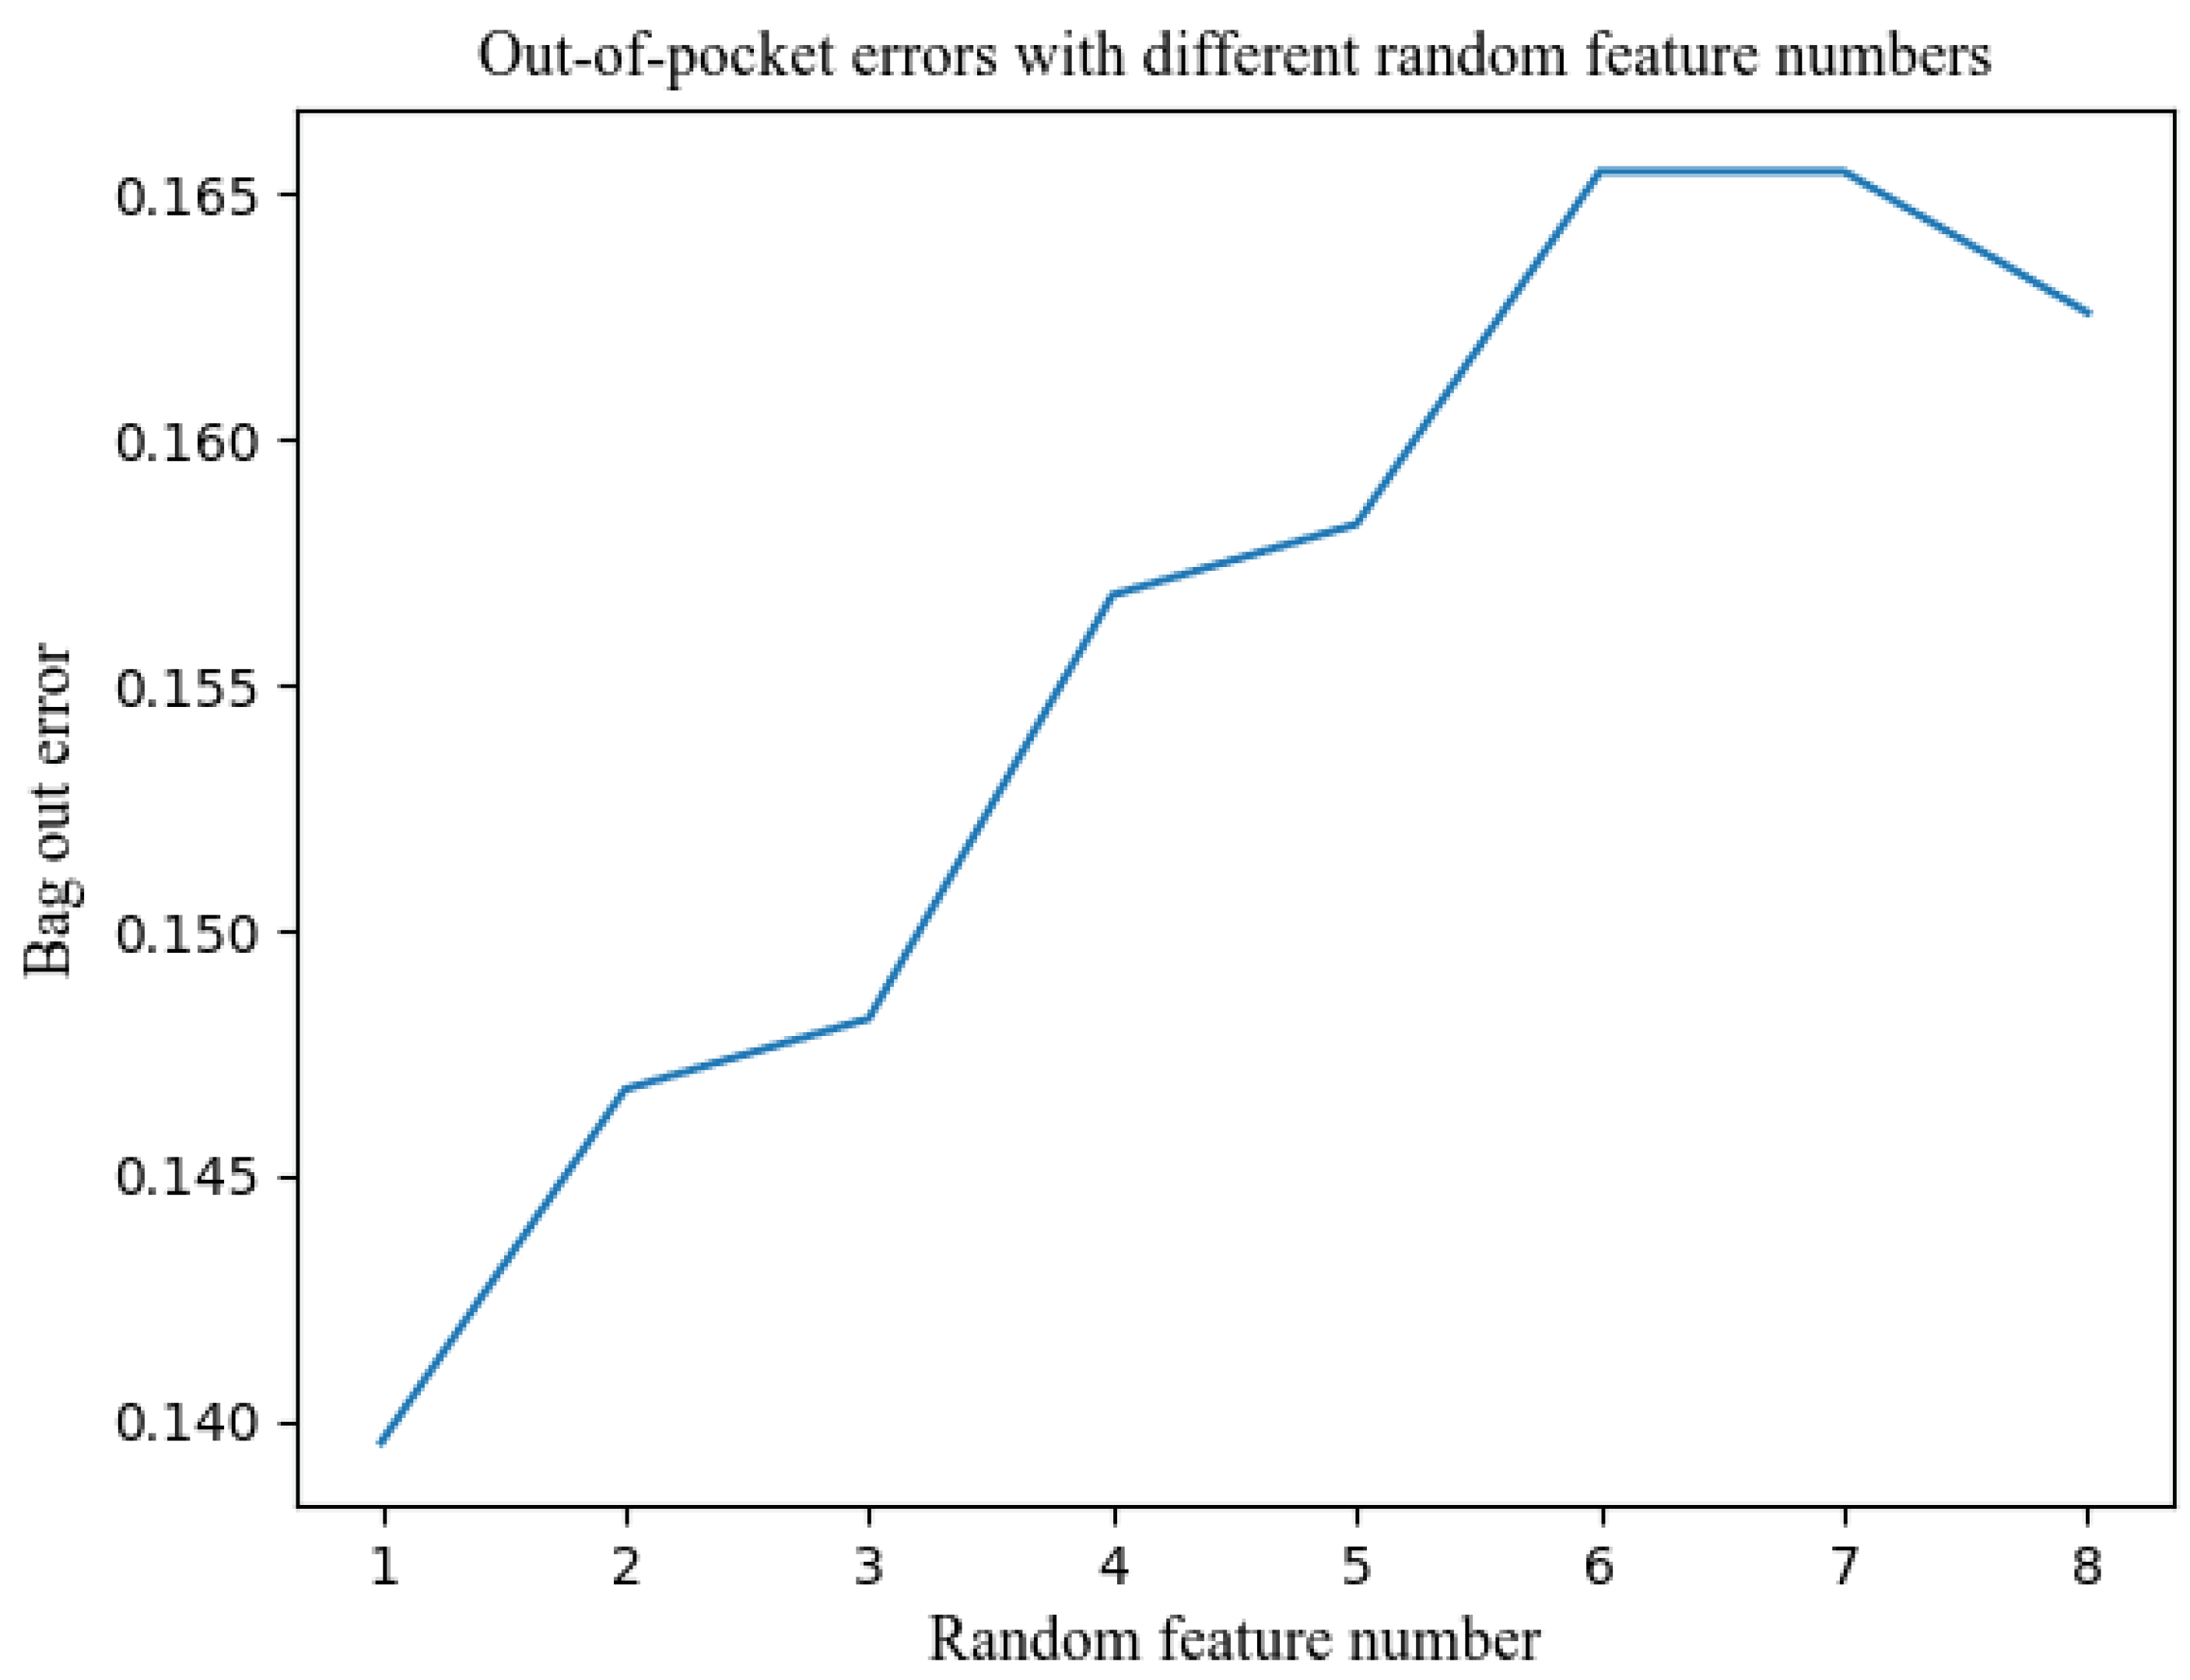
The accuracy and performance of the random forest model are closely tied to the selection of model parameters, as only the most appropriate parameters can fully exploit the model's potential. In the random forest algorithm, each decision tree is constructed using a random subset of features. The size of this subset is controlled by setting the maximum number of features. Therefore, determining the optimal feature number is a critical consideration in establishing the model. In this study, the out-of-bag error (OOB) is utilized to explore the optimal feature number. The OOB error is calculated using Bootstrap sampling, where approximately 36% of the sample data is left uncollected. These uncollected samples are then employed to evaluate the model's classification prediction performance and calculate the error rate. Through iterative analysis using the Python programming language, the OOB error is statistically analyzed under different feature numbers (
Figure 4). A smaller OOB error indicates higher prediction accuracy for the corresponding model. Generally, it is recommended to set the maximum number of features to a value greater than 1. This enables each decision tree to consider multiple features during the splitting of nodes, facilitating a better capture of feature interactions and information. Conversely, if the maximum number of features is set to 1, each decision tree will only consider one feature when splitting nodes, potentially limiting the performance of the random forest. From
Figure 4, it can be observed that the OOB error is minimized when the number of features is 2, and it increases when the number of features exceeds 2. Based on this analysis, the feature number for this model is set to 2.
(2) Selection of the Number of Decision Trees
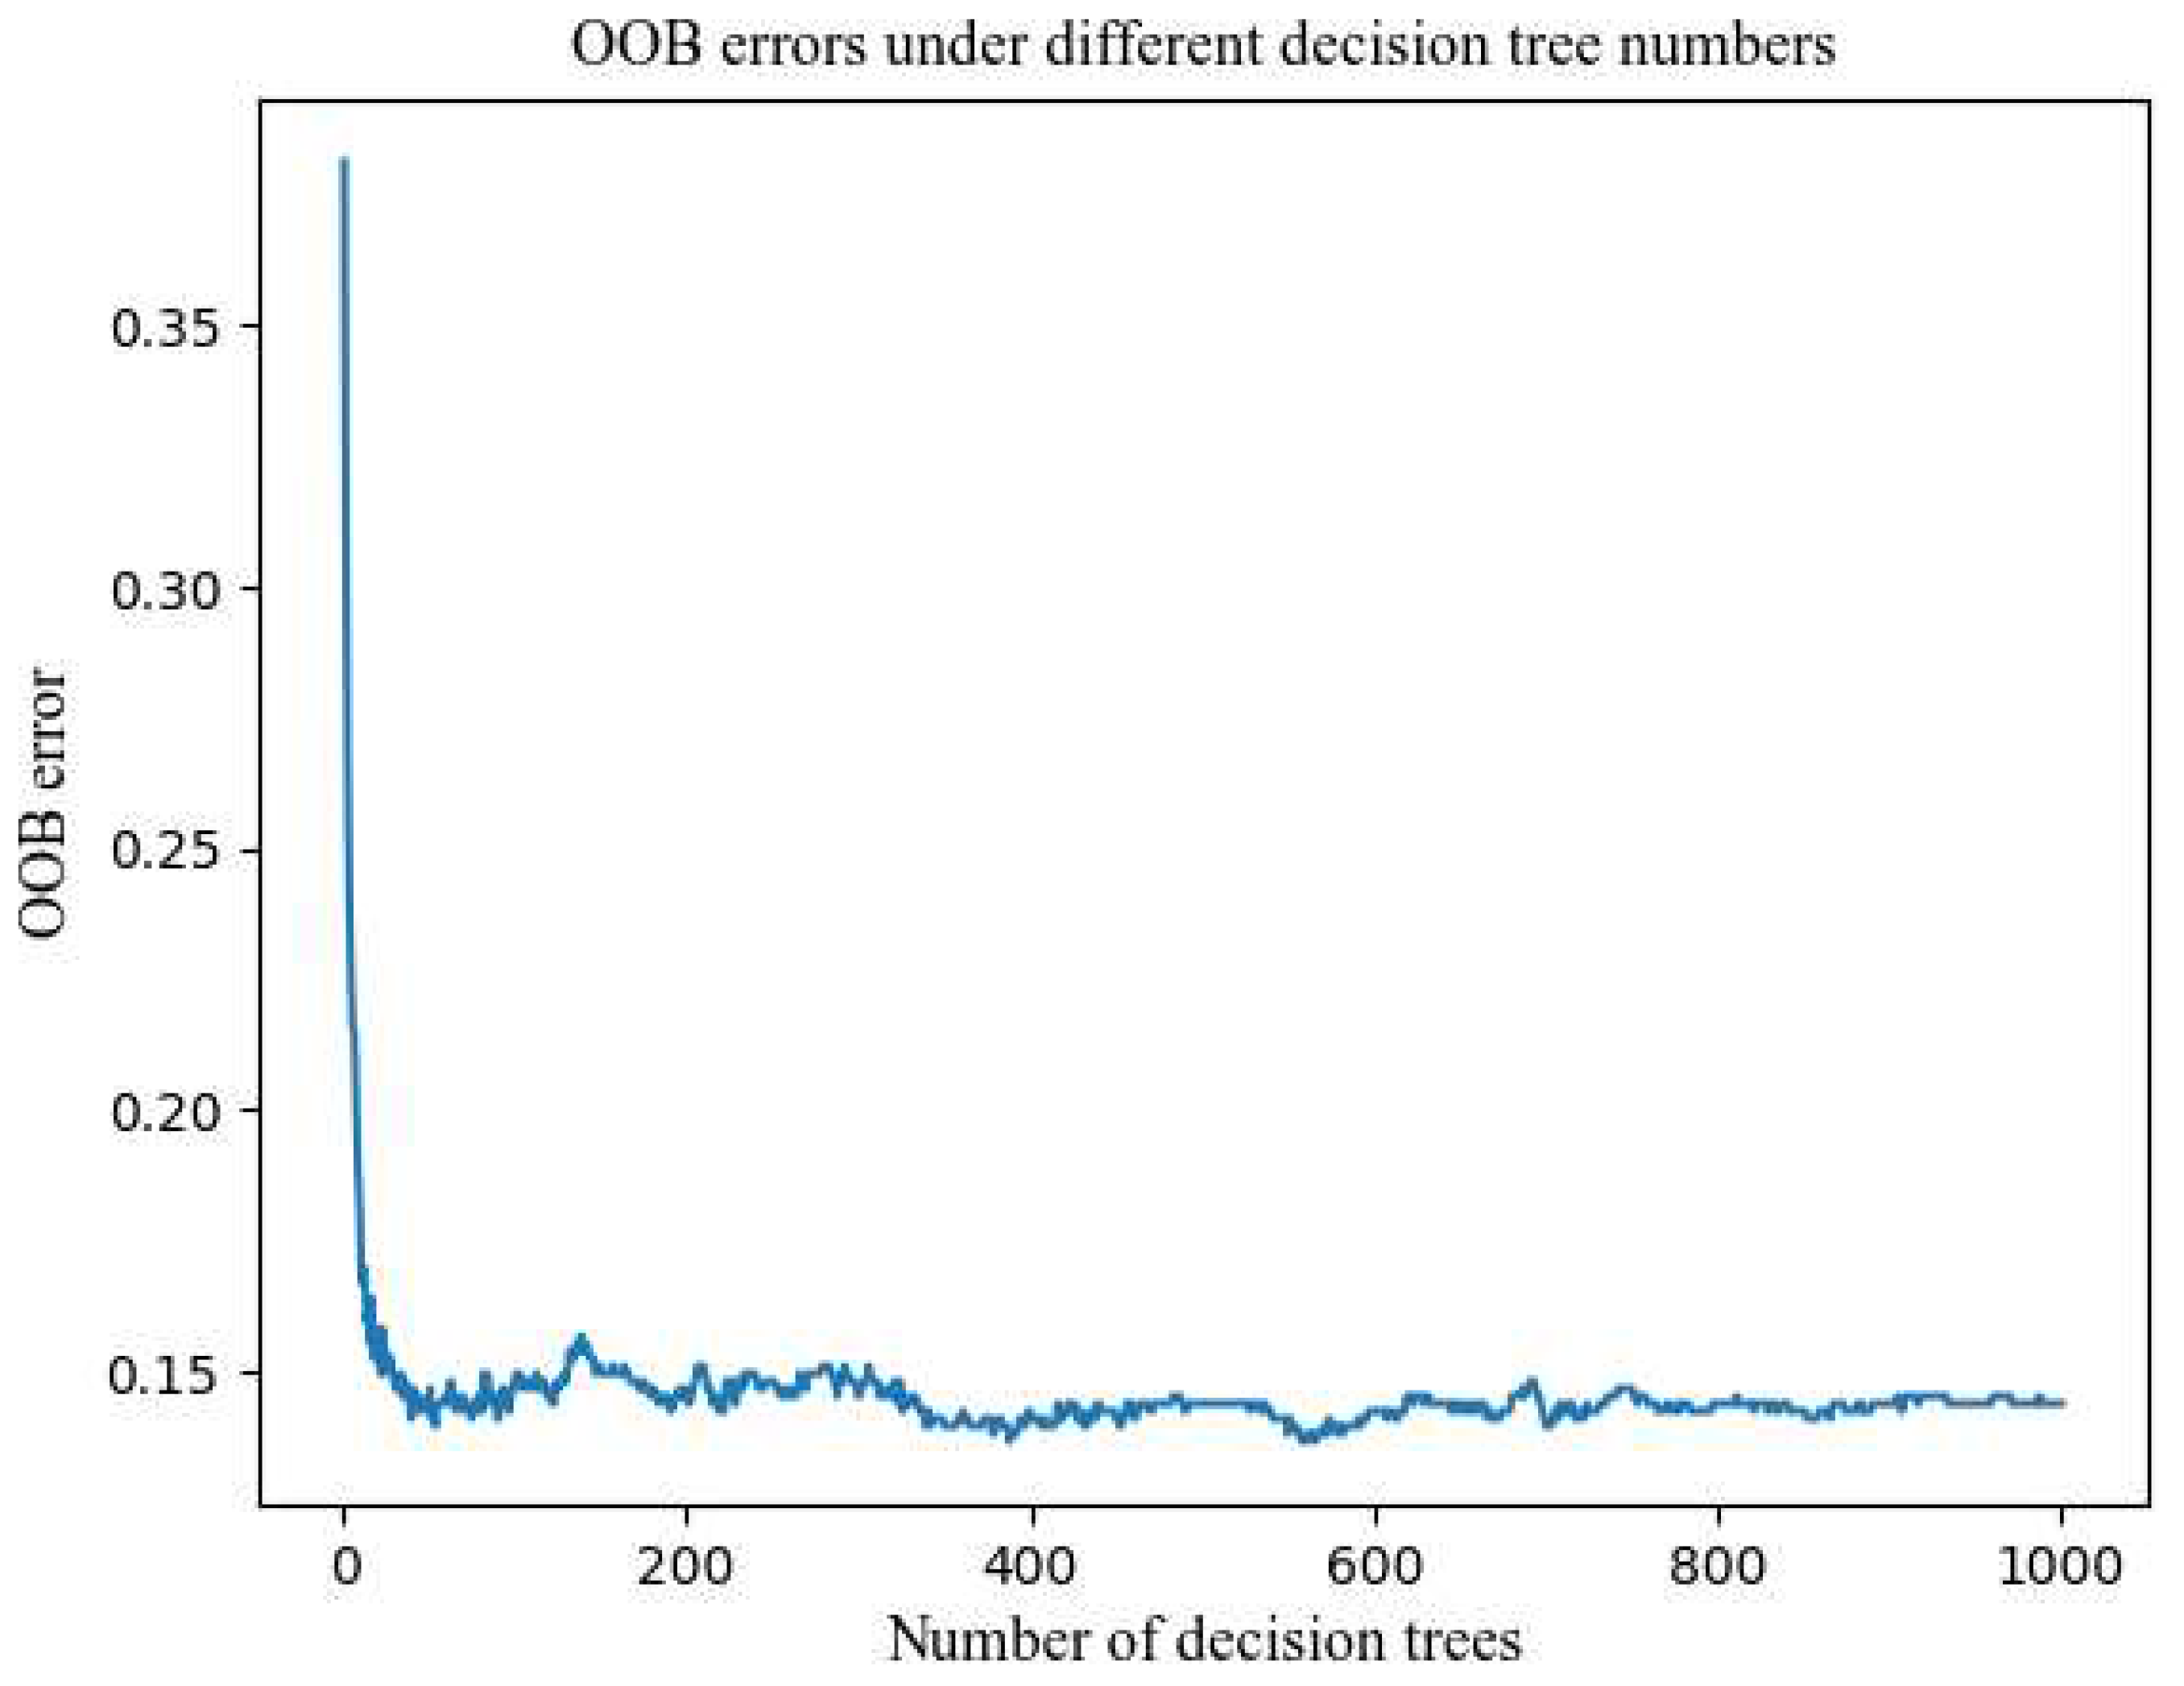
Similarly, a Python loop iteration is employed to obtain the out-of-bag errors of the model under different numbers of decision trees for statistical analysis (
Figure 5). The model accuracy is further analyzed in conjunction with the confusion matrix (
Table 3). In
Figure 5, the blue line depicts the curve of the model's error as the number of decision trees increases during the iteration process, providing insights into the model's error. The curve exhibits fluctuations until reaching a certain number of decision trees, at which point it stabilizes. The blue line shows slight fluctuations within a defined range, indicating the optimal number of decision trees for the model. From
Table 3, it can be concluded that the classification and prediction accuracy of the model is demonstrated by the test dataset. The test dataset comprises 299 sample points, of which the model correctly classifies 293 samples. Hence, the classification and prediction accuracy of the RF model is 0.980 (the ratio of correctly classified sample points to the total number of test samples), indicating a high level of accuracy.
Figure 5 and
Table 3 clearly illustrate that the model's error is 13%, and its accuracy is 98%. In summary, the number of decision trees in this model is set to 750.
4.5. Random Forest Weight
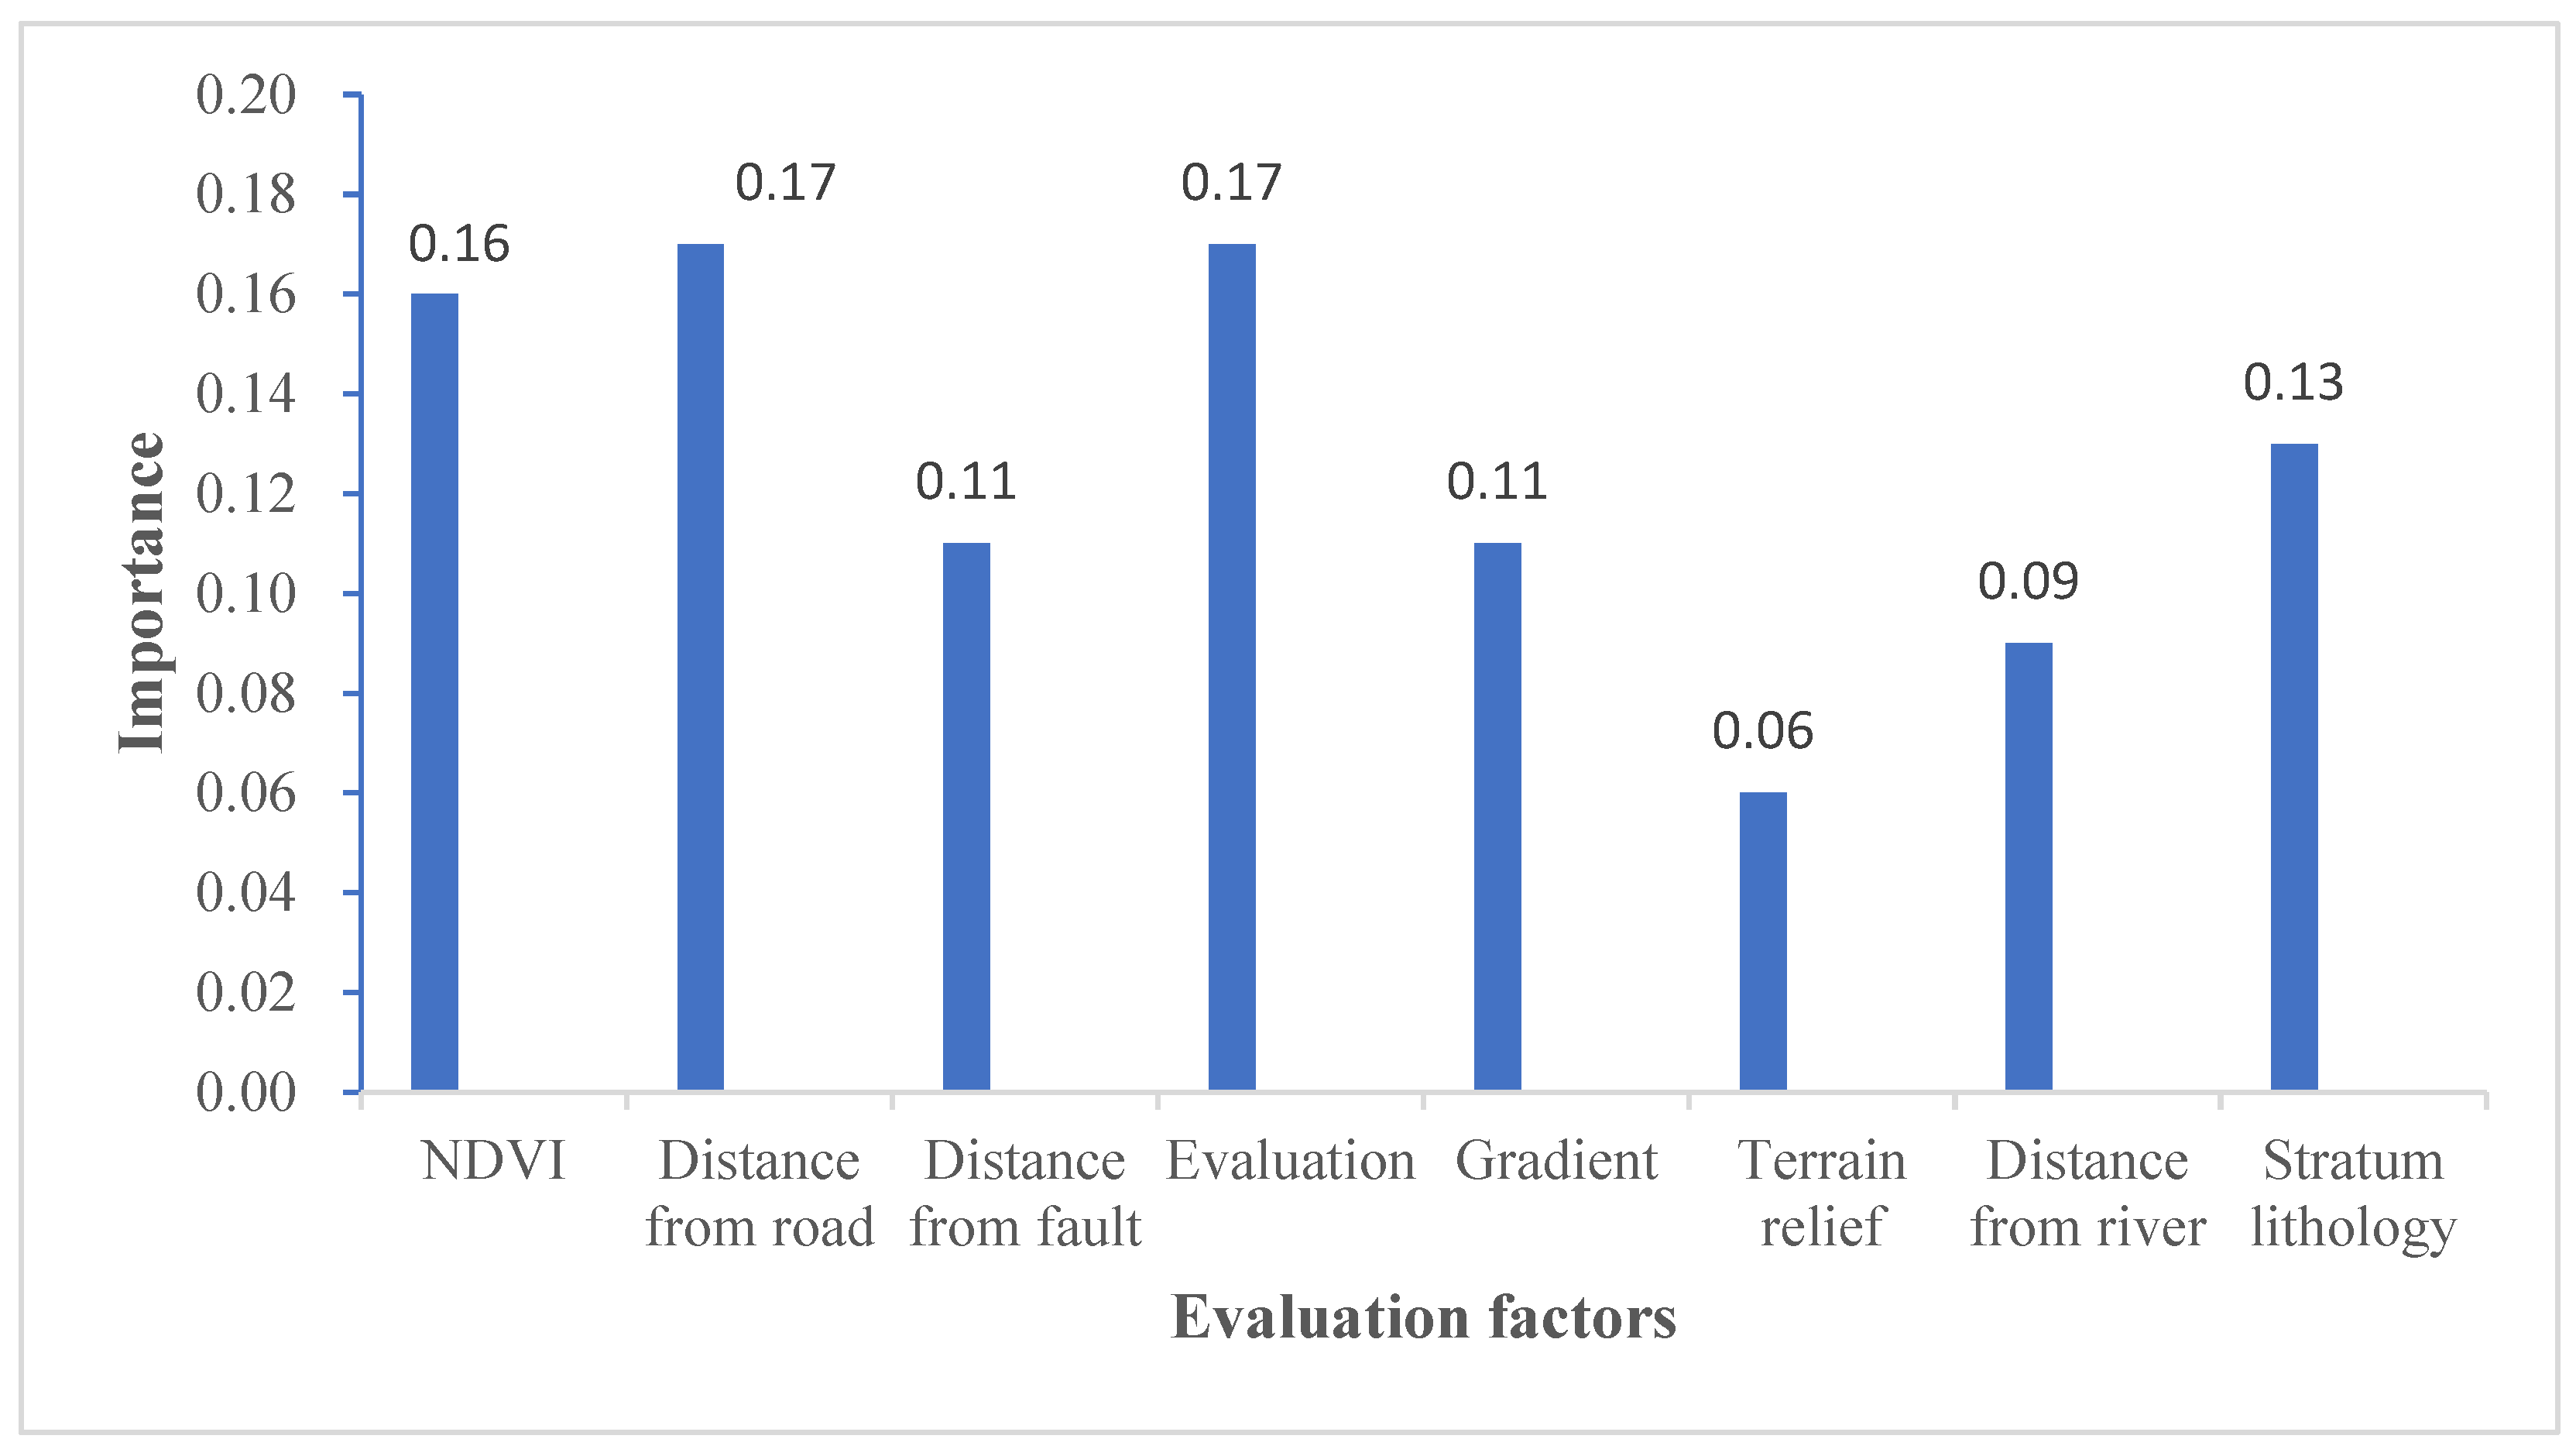
The 497 geological hazard points within the study area were labeled as the first category, denoted as 1. Similarly, the 497 non-geological disaster points selected based on the CF prior model were labeled as the second category, with the label 0. This resulted in a total of 994 sample data points with categorical attributes. The CF value of each sample point, obtained through the ArcGIS multi-value extraction to point function, was used as the training and testing data for the random forest model. Thus, each sample point contained the attribute values of each evaluation factor and a category label. The dataset was divided into 70% training data and 30% test data, comprising both disaster and non-disaster points, which were then input into the random forest model. Using PyCharm, the random forest model calculated the Gini coefficient reduction value for each evaluation factor during node splitting, and the importance of each evaluation index was determined using Equation (2) as the factor weight. The resulting weight diagram of the evaluation factors (
Figure 6) illustrates the impact of NDVI, Distance from the road, and Evaluation on geological disasters. In the context of geological disaster prevention and control, efforts should focus on addressing and mitigating the effects of these three factors.
4.6. CF value Weighting
The random forest model, with optimized parameters, is used to calculate the weight of each evaluation index. The weight of each index is then linearly combined with the corresponding CF value layer using Equation (3). This process results in the creation of a weighted superposition layer of CF values.
4.7. Geological Disaster Prone Zoning
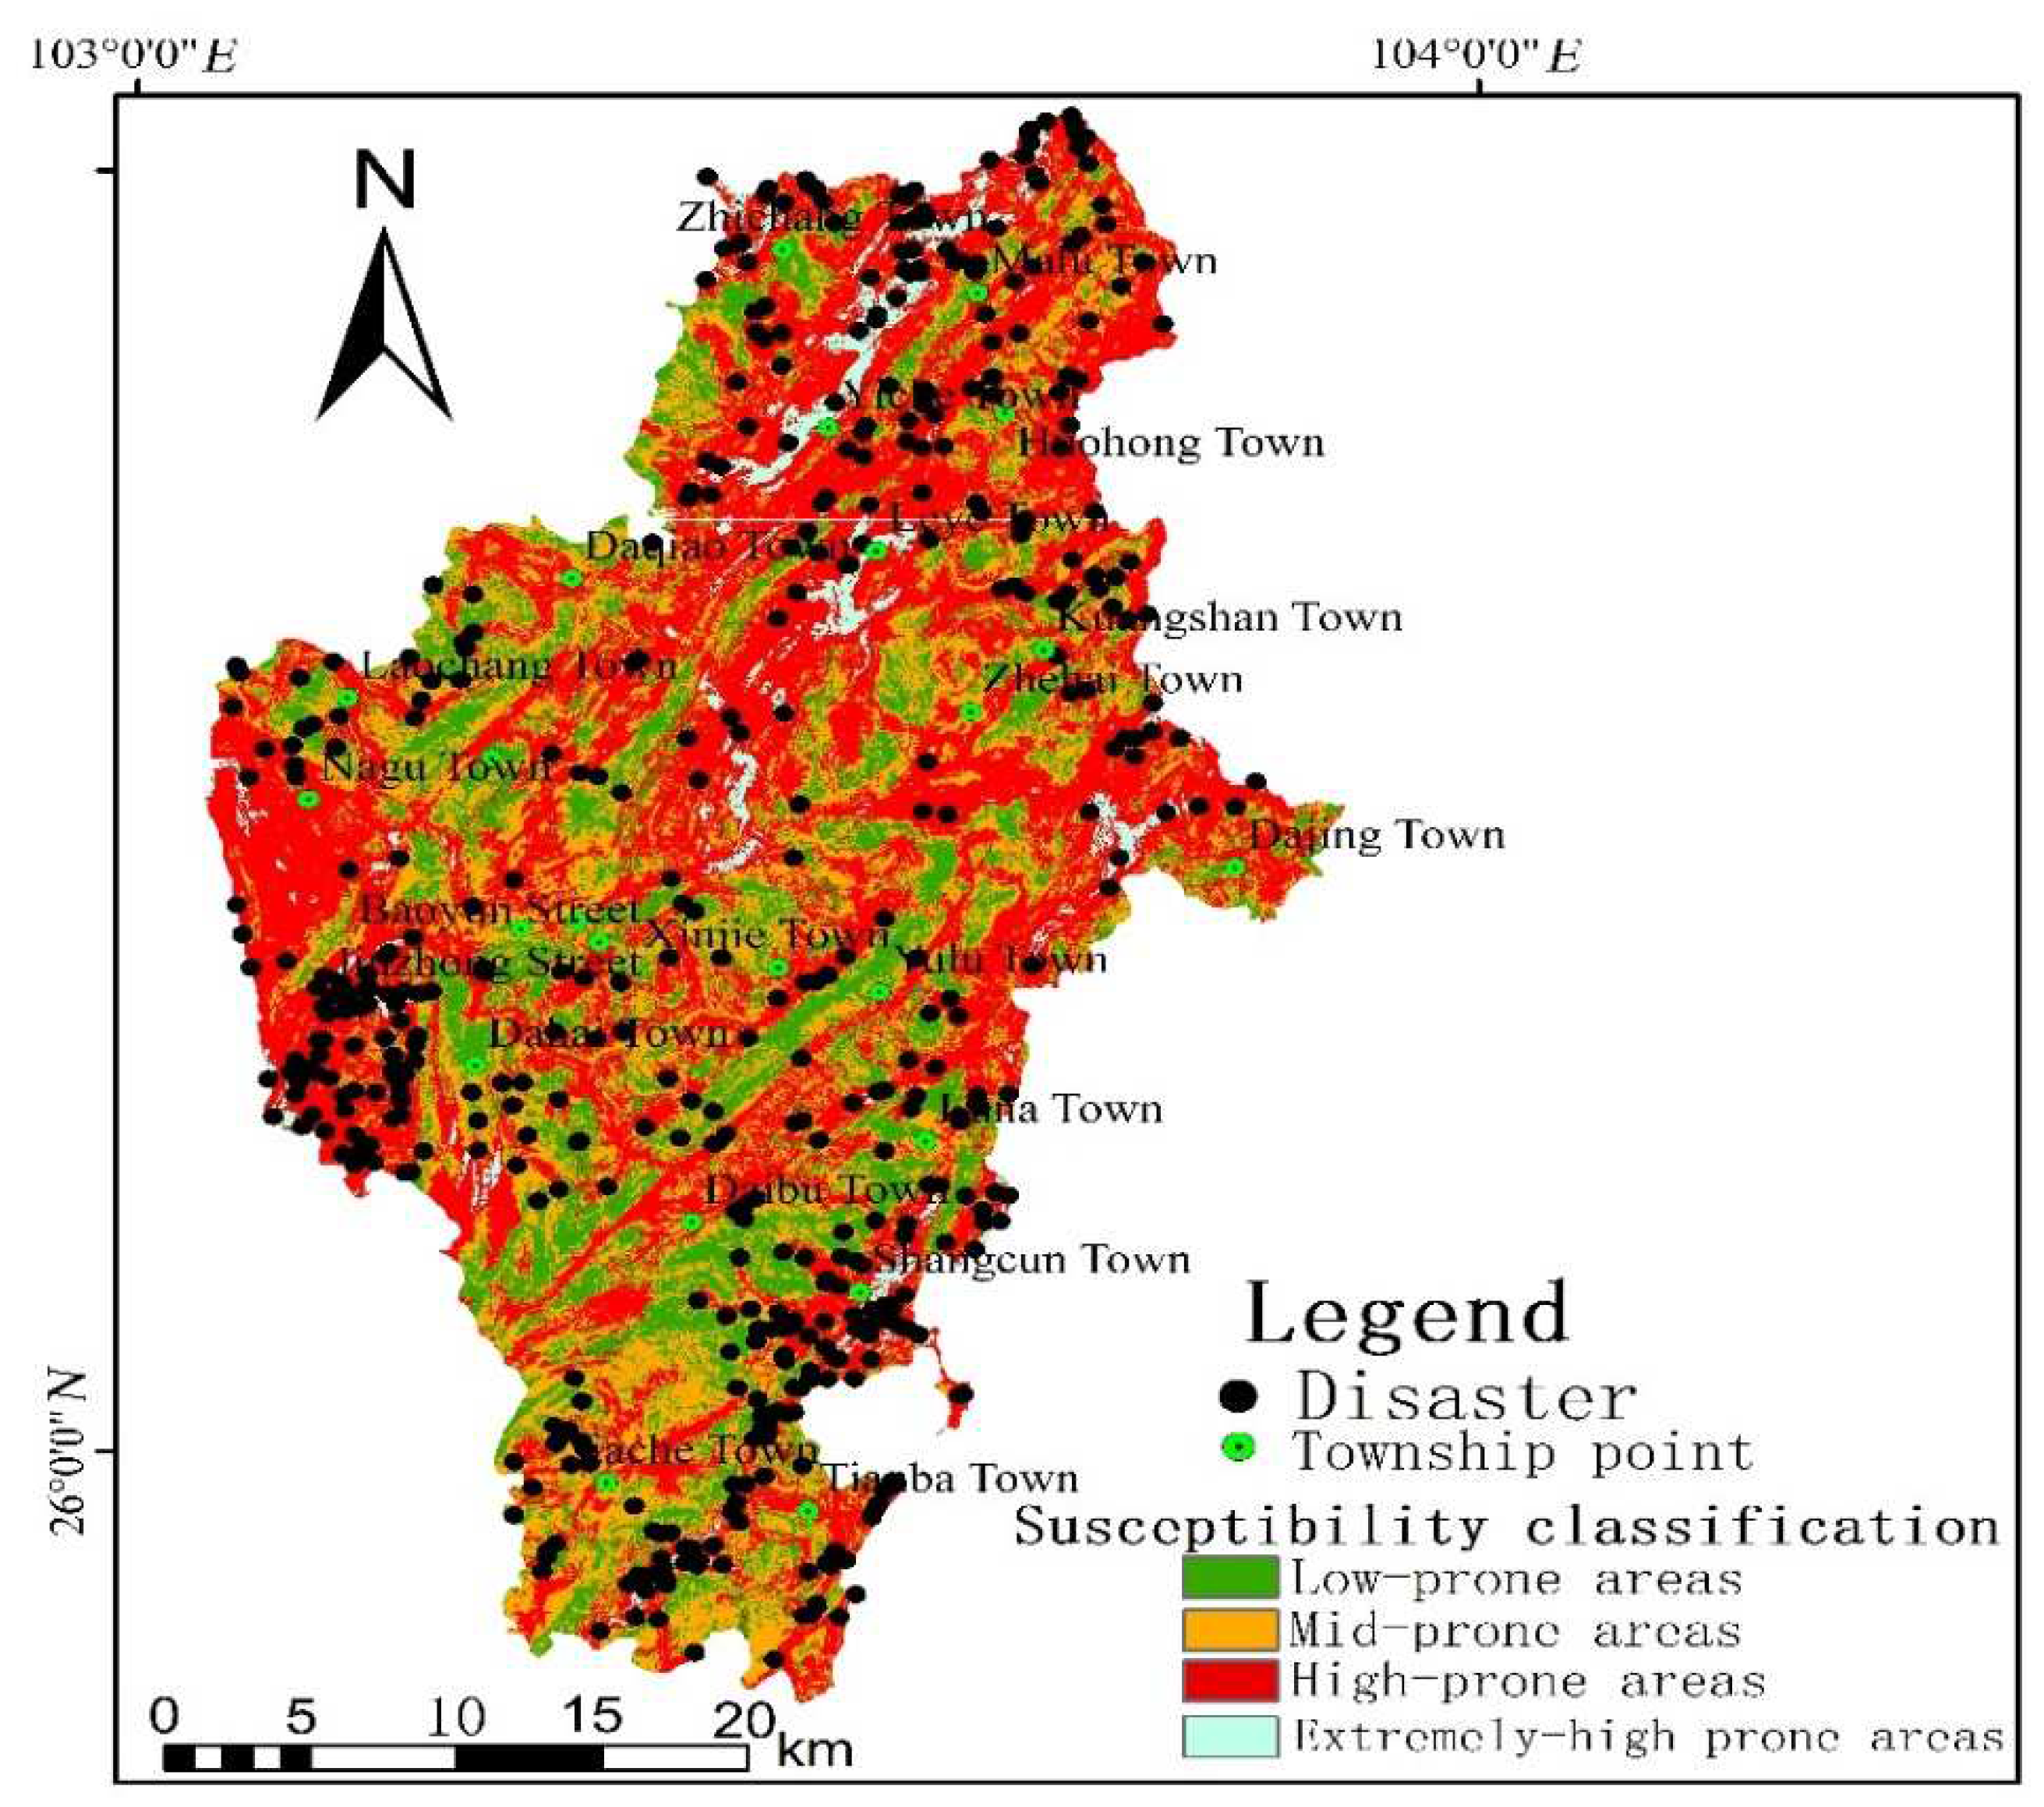
The weighted superposition grid map of CF values in the study area is divided into four levels, namely low susceptibility, medium susceptibility, high susceptibility, and extremely high susceptibility. This division is achieved using the natural breakpoint method commonly employed in the ArcGIS reclassification function. The resulting zoning map of geological disaster susceptibility in Huize County, based on the deterministic coefficient and random forest model, is presented in
Figure 7. To validate the susceptibility zoning map, the locations of the previously occurred disaster points within the study area are examined. It is observed that the susceptibility zoning results obtained in this study align closely with the distribution of disaster points, thereby offering valuable scientific references for relevant departments in their work.
5. Evaluation Results and Accuracy Verification
5.1. Analysis of Prone Partition Results
This study applies the deterministic coefficient model to calculate the CF value of each impact factor. By optimizing the parameters of the general random forest model, the weights of each evaluation factor are determined based on parameter optimization. The CF value layers of each evaluation factor are then linearly weighted using the objective weights obtained from the random forest model. This approach aims to enhance the accuracy and reliability of geological disaster susceptibility evaluation results.
(1) The statistical analysis reveals that the study area can be categorized into extremely high-prone areas, high-prone areas, medium-prone areas, and low-prone areas, comprising 4.21%, 47.90%, 29.50%, and 18.39% of the total area, respectively.
Figure 7 indicates that the northern, western, eastern, north-central, and southeastern parts of Huize County are highly susceptible to geological disasters, particularly Zhichang Township, Malu Township, Yiche Town, Nagu Town, Dahai Township, Luna Township, Yulu Township, Dajing Town, Huohong Township, Leye Town, Shangcun Township, and Jiache Township. These areas are characterized by steep terrain, active neotectonic movement, weak formation lithology, developed rock mass structure, dense road networks, strong human engineering activities, well-developed water systems, and evident river erosion. In light of these key areas, a relocation and avoidance plan is proposed to relocate vulnerable populations to lower-lying areas. Afforestation efforts should be undertaken, and existing vegetation should be effectively protected. Strengthening monitoring and early warning systems is crucial, along with enhancing the disaster prevention capabilities of local communities.
(2) The medium-prone areas are primarily distributed along the fault zone, characterized by relatively gentle slopes compared to the high-prone areas. Human engineering activities are generally prevalent in these areas. Prevention measures should include restrictions on human engineering activities and the implementation of scientifically and contextually appropriate engineering measures to control small-slope geological disasters.
(3) In the low-prone areas, favorable geographical and geological conditions indicate a lower likelihood of future geological disasters. It is important to strictly prohibit all unreasonable human engineering activities in these areas and prioritize the protection of the existing geological and ecological environment.
5.2. Validation of Prone Partition Results
The accuracy of the evaluation results can be objectively verified by statistically testing the distribution of sample points (30% disaster points and non-disaster points) in each prone area, providing a more robust verification of the susceptibility zoning results. The ROC curve is widely used to assess the accuracy of the evaluation model in geological disaster susceptibility studies. It plots the correct prediction proportion of geological disasters against the proportion of incorrectly predicted disasters [
21]. The accuracy of the model is represented by the area under the curve (AUC), which ranges from 0.5 to 1. A higher AUC value indicates greater accuracy of the evaluation model.
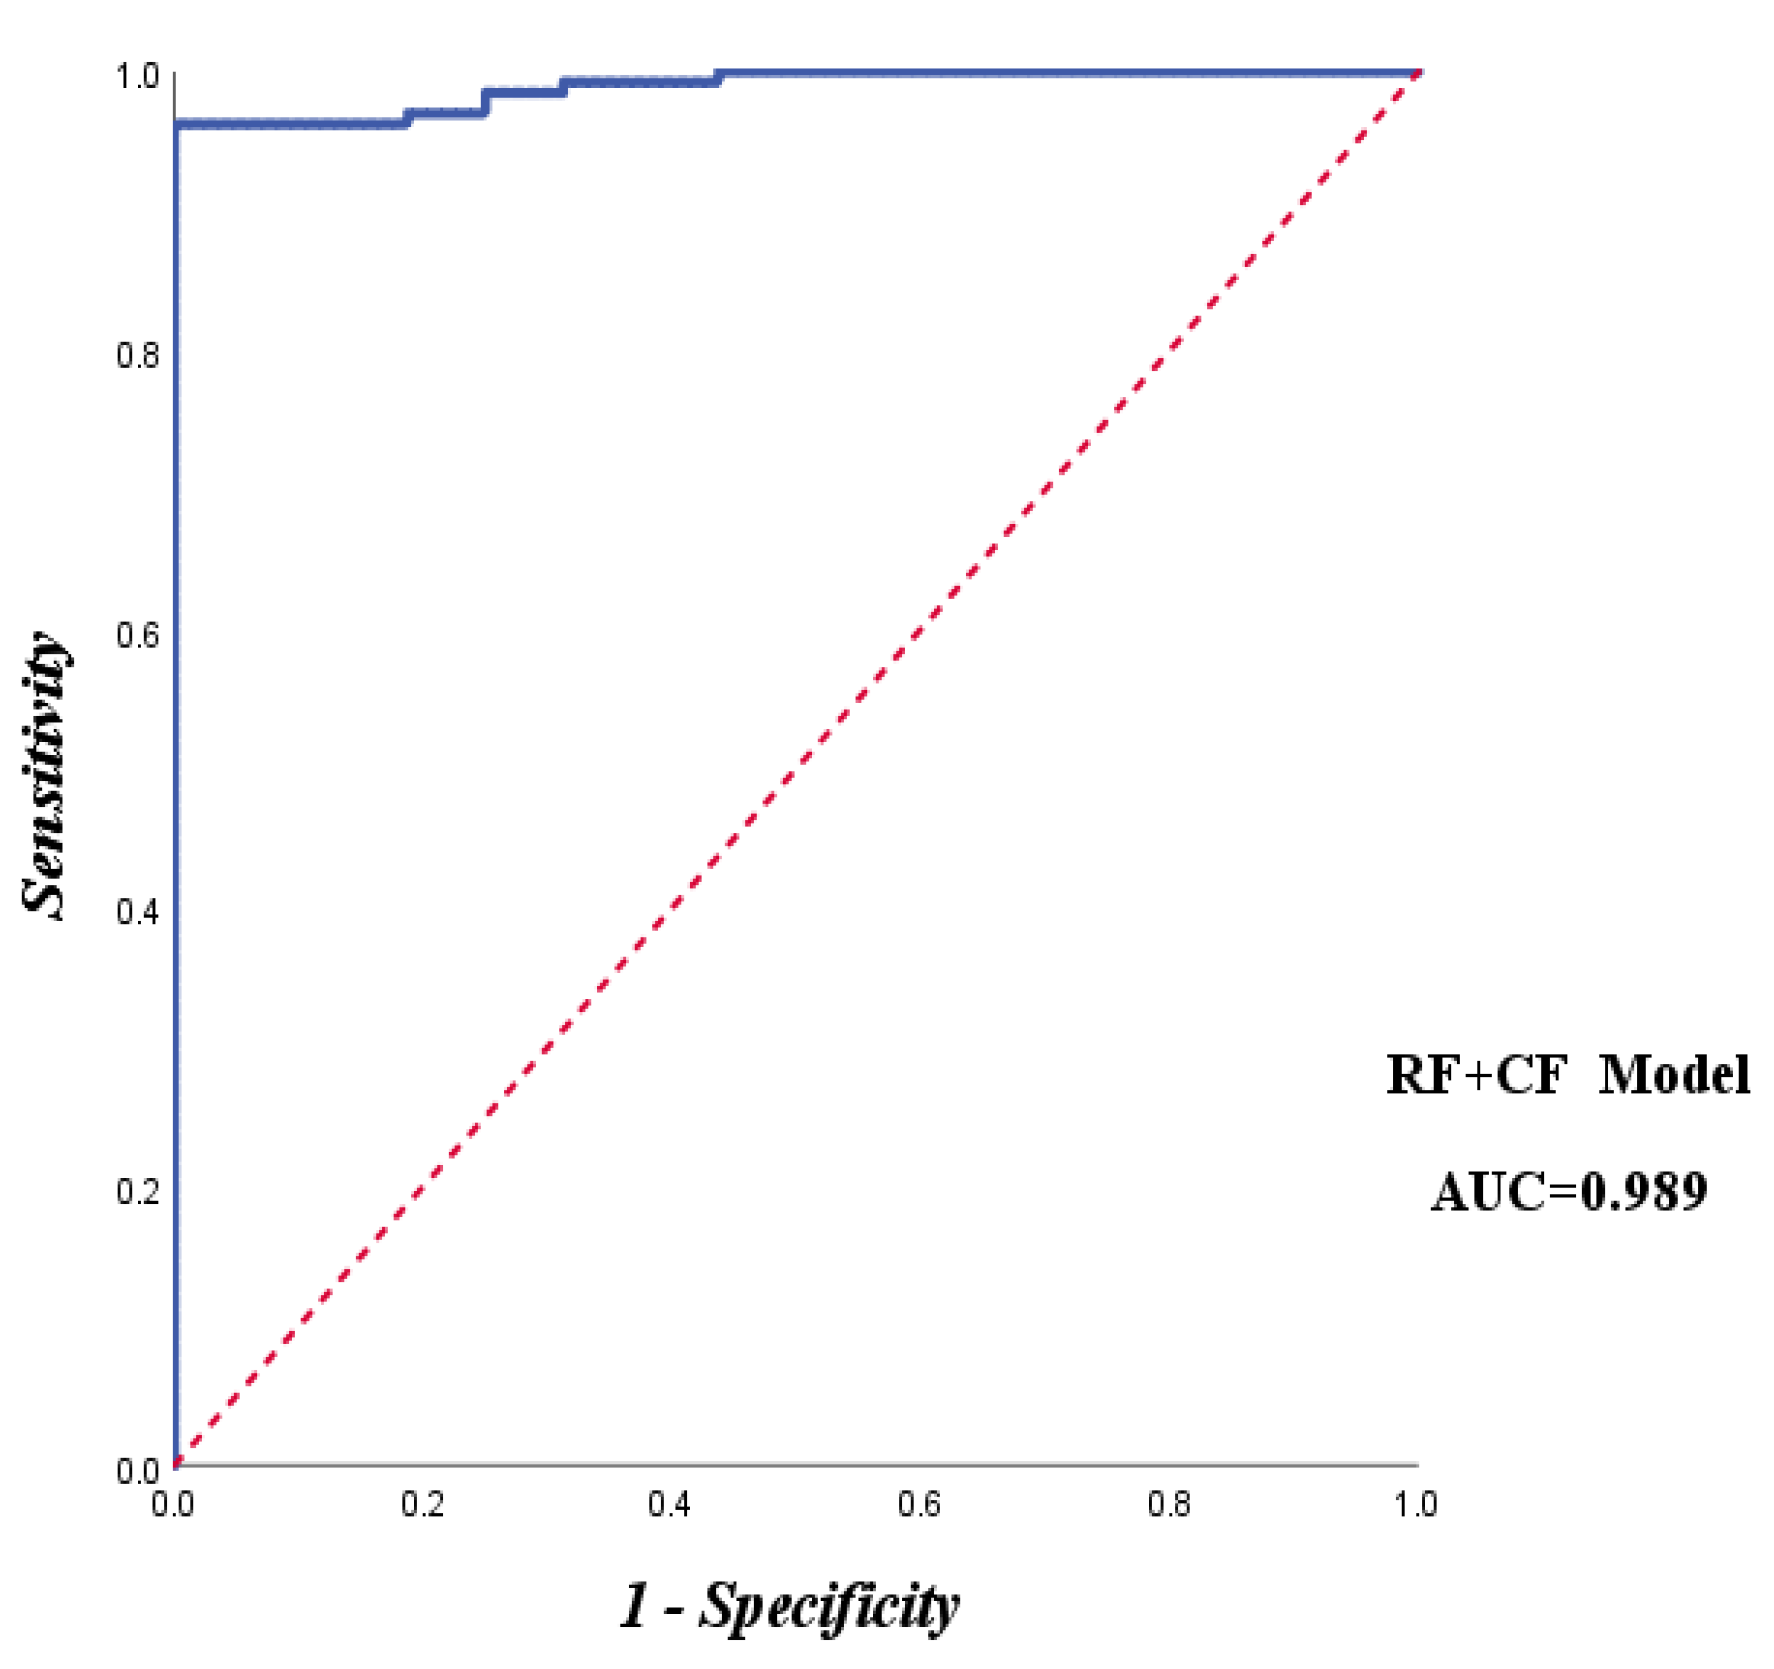
In this study, the accuracy of the evaluation results is verified through the susceptibility evaluation results test table (
Table 4) and ROC curve (
Figure 8).
Table 4 shows that the low-prone areas cover 18.39% of the total study area, and there are 28 test points in the extremely high-prone areas, accounting for 9.4% of the total test points. The S values, calculated as the ratio of the percentage of test points falling into each prone area to the total test points divided by the percentage of each prone area to the total area of the study area (S = D/M), are 1.42, 0.96, 0.76, and 2.23 for the respective prone areas. As shown in
Figure 8, the AUC value of the evaluation model in this study is 0.989, which is greater than 0.5 and closer to 1. This indicates that the model's accuracy meets the requirements and provides an objective and accurate reflection of the geological disaster-prone situation in the study area.
6. Conclusion
This paper focuses on the evaluation of geological disaster susceptibility in Huize County using the deterministic coefficient and random forest model. The accuracy of the evaluation results is verified through statistical analysis of test sample point distribution and the ROC curve. The following conclusions can be drawn:
(1) Medium, high, and extremely high-prone areas of geological disasters are widely distributed throughout Huize County, encompassing 81.61% of the study area. These areas are prone to geological disasters and require significant attention from relevant departments. During the flood season, the likelihood of geological disasters increases substantially, posing a serious threat to the safety of residents' lives and property.
(2) The random forest algorithm provides the relative importance of each evaluation factor, enabling disaster management departments to implement targeted prevention and control measures for key disaster-causing factors.
(3) Through Python language loop iteration, the optimal number of features and decision trees are determined by calculating the out-of-bag error under different feature numbers and decision trees. The selected parameters are evaluated using the confusion matrix.
(4) The selection of non-disaster point samples based on the CF prior model minimizes the misclassification of potential disaster points as non-disaster points, enhancing the credibility of the evaluation results.
7. Discussion and Prospect
7.1. Discussion
By employing the random forest algorithm, the Gini coefficient of each evaluation factor can be swiftly determined, enabling the calculation of their relative importance. This approach significantly reduces the impact of subjective factors on the weighting of evaluation factors and enhances the objectivity and scientific validity of the evaluation results. Compared to the direct random selection of non-disaster point samples, the use of CF's prior model for selecting non-disaster point samples substantially reduces the error of misclassifying potential disaster points as non-disaster points. In this study, the deterministic coefficient model is utilized to establish an initial geological disaster susceptibility zoning map, aiming to minimize the influence of subjective factors on the evaluation results through the selection of non-disaster samples and calculation of random forest model sample data. Through iterative calculation, the optimal parameters of the model are determined to ensure the best match between the evaluation model and the study area, thereby enhancing the reliability of the evaluation results. Nonetheless, several limitations exist in this study: (1) The exclusion of earthquakes as an evaluation factor may impact the accuracy of the evaluation results; (2) The steep terrain of Huize County poses challenges in obtaining geological data in certain areas; (3) The subjective influence on the evaluation results cannot be entirely eliminated due to the artificial selection and classification of evaluation factors in the CF prior model.
7.2. Prospect
Geological disasters are inherent in the Earth's dynamic nature and will persist in human society. As researchers, our quest to understand geological disasters and mitigate their impact on human society is an ongoing endeavor. Moving forward, it is essential to explore new approaches that leverage advanced technologies such as meteorological satellites, high-resolution remote sensing, artificial intelligence, and spatiotemporal big data. These technologies can enable the rapid acquisition and classification of evaluation indicators for a given study area. By objectively weighting and superimposing these indicators, we can generate geological disaster susceptibility zoning maps. This will facilitate the swift assessment of geological disaster susceptibility and provide valuable insights for various sectors of human society, ultimately promoting high-quality development and resilience.
Author Contributions
All authors contributed to the study conception and design. Material preparation, data collection and analysis were performed by [Shucheng Tan], [Shaohan Zhang], [Jinxuan Zhou], [Duanyu Ding] [Jun Li] and [Yongqi Sun]. The first draft of the manuscript was written by [Shaohan Zhang] and all authors commented on previous versions of the manuscript. All authors read and approved the final manuscript.
Funding
This work was supported by the Science and Technology Innovation Team Program (Grant number YNEDUSTIT202202), and the Education Department of Yunnan Province and Famous teacher of Yunnan Province “Xingdian talents support program”.
Institutional Review Board Statement
Not applicable.
Informed Consent Statement
Not applicable.
Data Availability Statement
The DEM and NDVI data are openly available in [the geospatial data cloud platform] at [
https://www.gscloud.cn/]. Geological hazard point data and 1:200,000 geological maps are openly available from [the Geographic Remote Sensing Ecology Network platform] at [
http://www.gisrs.cn/]. Water system and road data can be obtained from [the National Catalogue Service for Geographic Information] at [
https://www.webmap.cn/].
Acknowledgments
Thank you for the hard work of laboratory colleagues and the mentor's careful guidance, thanks for funding.
Conflicts of Interest
The authors declare no conflict of interest.
References
- Zhang, S.F.; Wang, Y.F.; Jia, B.; Zhao, S.M. Spatial-temporal changes and influencing factors of geologic disasters from 2005 to 2016 in China. J. Geo-Inform. Sci. 2017, 19, 1567–1574. [Google Scholar]
- Wang, N.Q.; Wang, Y.F.; Luo, D.H.; Yao, Y. Review of landslide prediction and forecast research in China. Geol. Rev. 2008, 44, 355–361. [Google Scholar] [CrossRef]
- Li, Y.Y.; Mei, H.B.; Ren, X.J.; Hu, X.D.; Li, M.D. Geological disaster susceptibility evaluation based on certainty factor and support vector machine. J. Geo-Inform. Sci. 2018, 20, 1699–1709. [Google Scholar]
- Laura, Z.F.; Moussa, N.N.; Christian, B.A.M.; Monespérance, M.G.M.; Landry, W.D.P.; Rodrigue, T.K.; Armand, K.D.; Sébastien, O. Landslide susceptibility zonation using the analytical hierarchy process (AHP) in the Bafoussam-Dschang region (West Cameroon). Adv. Space Res. 2023, 71, 5282–5301. [Google Scholar] [CrossRef]
- Vakhshoori, V.; Zare, M. Landslide susceptibility mapping by comparing weight of evidence, fuzzy logic, and frequency ratio methods. Geomat. Nat. Hazards Risk 2016, 7, 1731–1752. [Google Scholar] [CrossRef]
- Wang, Q.Q.; Guo, Y.H.; Li, W.P.; He, J.H.; Wu, Z.Y. Predictive modeling of landslide hazards in Wen County, northwestern China based on information value, weights-of-evidence, and certainty factor. Geomat. Nat. Hazards Risk 2019, 10, 820–835. [Google Scholar] [CrossRef]
- Juliev, M.; Mergili, M.; Mondal, I.; Nurtaev, B.; Pulatov, A.; Hübl, J. Comparative analysis of statistical methods for landslide susceptibility mapping in the Bostanlik District, Uzbekistan. Sci. Total Environ. 2019, 653, 801–814. [Google Scholar] [CrossRef]
- Guo, Z.Z.; Yin, K.L.; Fu, S.; Huang, F.M.; Gui, L.; Xia, H. Evaluation of landslide susceptibility based on GIS and WOE-BP model. Earth Sci. 2019, 44, 4299–4312. [Google Scholar]
- Huang, F.M.; Yao, C.; Liu, W.P.; Li, Y.J.; Liu, X.W. Landslide susceptibility assessment in the Nantian area of China: a comparison of frequency ratio model and support vector machine. Geomat. Nat. Hazards Risk 2018, 9, 919–938. [Google Scholar] [CrossRef]
- Yang, S.; Li, D.Y.; Yan, L.X.; Huang, Y.; Wang, M.Z. Landslide susceptibility assessment in high and steep bank slopes landslide susceptibility assessment in high and steep bank slopes along Wujiang river based on random forest model. Safety Environ. Eng. 2021, 28, 132–133. [Google Scholar] [CrossRef]
- Merghadi, A.; Abderrahmane, B.; Tien Bui, D. Landslide susceptibility assessment at Mila Basin (Algeria): a comparative assessment of prediction capability of advanced machine learning methods. ISPRS Int. J. Geo-Inform. 2018, 7, 268. [Google Scholar] [CrossRef]
- He, Q.; Wang, M.; Liu, K. Rapidly assessing earthquake-induced landslide susceptibility on a global scale using random forest. Geomorphology 2021, 391, 107889. [Google Scholar] [CrossRef]
- Goetz, J.N.; Brenning, A.; Petschko, H.; Leopold, P. Evaluating machine learning and statistical prediction techniques for landslide susceptibility modeling. Comput. Geosci. 2015, 81, 1–11. [Google Scholar] [CrossRef]
- Liu, F.Z.; Dai, T.Y.; Wang, J.C. Geological hazard susceptibility evaluation by coupled random forest and information model: a case study of Gongbujiangda county, Tibet autonomous region. J. Safety Environ. 2022. [Google Scholar] [CrossRef]
- Y. K., Z.; J.G., C.; C.B., W.; Chen, T.W. Application of certainty factor and random forests model in landslide susceptibility evaluation in Mangshi City, Yunnan Province. Bull. Geol. Sci. Technol. 2020, 39, 131–144. [Google Scholar] [CrossRef]
- Shortliffe, E.H.; Davis, R.; Axline, S.G.; Buchanan, B.G.; Green, C.C.; Cohen, S.N. Computer-based consultations in clinical therapeutics: explanation and rule acquisition capabilities of the MYCIN system. Comput. Biomed. Res. 1975, 8, 303–320. [Google Scholar] [CrossRef]
- Heckerman, D. Probabilistic interpretations for MYCIN's certainty factors. In Readings in uncertain reasoning, Shafer, G., Pearl, J., Eds.; Morgan Kaufmann Publishers Inc.: CA, United States, 1990; pp. 298–312. [Google Scholar]
- Breiman, L. Random forests. Mach. Learn. 2001, 45, 5–32. [Google Scholar] [CrossRef]
- Avtar, R.; Singh, C.K.; Singh, G.; Verma, R.L.; Mukherjee, S.; Sawada, H. Landslide susceptibility zonation study using remote sensing and GIS technology in the Ken-Betwa River Link area, India. Bull. Eng. Geol. Environ. 2011, 70, 595–606. [Google Scholar] [CrossRef]
- Hong, H.Y.; Pradhan, B.; Sameen, M.I.; Kalantar, B.; Zhu, A.; Chen, W. Improving the accuracy of landslide susceptibility model using a novel region-partitioning approach. Landslides 2018, 15, 753–772. [Google Scholar] [CrossRef]
- Gao, H.X. Some method on treating the collinearity of independent variables in multiple linear regression. Appl. Stat. Manage. 2000, 20, 49–55. [Google Scholar] [CrossRef]
- Xu, C.; Xu, X.W. Logistic regression model and its validation for hazard mapping of landslides triggered by Yushu earthquake. J. Eng. Geol. 2012, 20, 326–333. [Google Scholar]
|
Disclaimer/Publisher’s Note: The statements, opinions and data contained in all publications are solely those of the individual author(s) and contributor(s) and not of MDPI and/or the editor(s). MDPI and/or the editor(s) disclaim responsibility for any injury to people or property resulting from any ideas, methods, instructions or products referred to in the content. |
© 2023 by the authors. Licensee MDPI, Basel, Switzerland. This article is an open access article distributed under the terms and conditions of the Creative Commons Attribution (CC BY) license (http://creativecommons.org/licenses/by/4.0/).
