
Submitted:
29 June 2023
Posted:
29 June 2023
You are already at the latest version
Abstract
Background Dietary guidelines typically recommend limiting the intake of fresh red meat, yet evidence linking red meat consumption with adverse health outcomes is inconsistent.
Objective To assess the level of evidence from existing systematic reviews and meta-analyses and analyze the association between high consumption of red meat and cancer risk and adverse health outcomes.
Methods Eight databases were searched to collect systematic reviews and meta-analyses from database inception to December 2022. Two independent reviewers screened and extracted data and used the AMSTAR 2 tool to evaluate methodological quality of the included studies. Meta-analysis was conducted using STATA 17.0.
Results A total of 18 studies were included, of which 5 were rated as high quality, 4 as medium quality, 6 as low quality, and 3 as extremely low quality. Of the 9 SRs/MAs included, primary studies with overlap were identified, and 14 studies were eventually included. The meta-analysis results showed that compared with the lowest intake of red meat, the highest intake of red meat was associated with an increased risk of colorectal cancer (OR 1.21, 95% CI 1.07-1.37), gastric cancer (OR 1.37, 95% CI 1.18-1.59), non-Hodgkin's lymphoma (OR 1.10.95% CI 1.02-1.19), stroke (RR 1.11, 95% CI 1.03-1.20), type 2 diabetes (RR 1.19 95% CI 1.04-1.37), and ischemic heart disease (RR 1.09, 95% CI 1.06-1.12), as well as a negative effect on total cholesterol (WMD 0.264, 95% CI 0.144-0.383), triglycerides (WMD -0.181, 95% CI -0.349 to -0.013), low-density lipoprotein (WMD 0.198, 95% CI 0.065-0.330), and high-density lipoprotein (WMD -0.065, 95% CI -0.109 to -0.020). However, the associations with breast cancer (RR 1.05 95% CI 1.00-1.11), glycemic control (WMD 0.040, 95% CI 0.049-0.129), and changes in body weight status [overweight (β 0.89, 95% CI 0.48-1.64); obesity (β 1.06, 95% CI 0.30-3.71)] were not significant.
Conclusions This comprehensive umbrella review suggests that high consumption of red meat may increase the risk of colorectal cancer, gastric cancer, non-Hodgkin lymphoma, stroke, type 2 diabetes, and cardiovascular disease, and that reducing red meat intake is a key modifiable dietary factor for reducing risk. However, there was no significant correlation with breast cancer, kidney stones, age-related eye disease or changes in body weight.
Keywords:
red meat
; health outcomes
; cancer
; risk factors
; umbrella review
; meta-analysis.
Introduction
Red meat refers to the muscles of mammals such as beef, veal, pork, mutton, goat, horse, deer, etc. Distinguished from white meat (poultry meat), red meat has a higher fat content[1,2]. For a long time, red meat has been an important dietary source of protein and essential nutrients such as iron, zinc and vitamins[3]. The annual consumption of red meat worldwide is as high as 184 million tons, almost twice that of white meat, mainly concentrated on high per capita consumption in high-income countries. At the same time, the consumption of meat in developing countries is also growing at an annual rate of 5-6%, and red meat consumption accounts for a large proportion[4,5]. Proper intake of red meat and balancing the relationship between it and other food components is crucial for cancer prevention and long-term health[6]. In November 2019, a final recommendation was made by a 14-member panel from seven countries, including three community members, to continue consuming unprocessed red meat as well as current processed meats (made by curing, smoking, salting, or adding chemical preservatives) but with weak recommendations based on low-quality evidence. The dietary guidelines were published in Annals of Internal Medicine[7].
However, as early as 2015, an International Agency for Research on Cancer (IARC) working group classified the consumption of red meat as "possibly carcinogenic to humans" (2A class) based on limited evidence of carcinogenicity in humans and compelling mechanistic evidence of the carcinogenic effects[8]. The working group report suggested that the consumption of unprocessed red meat might increase the risk of colorectal, pancreatic, and prostate cancer, while the consumption of processed red meat, such as salted and cured meat, might also increase the risk of colorectal and stomach cancer, concluding that the intake of 50g of processed meat per day could increase the risk of colorectal cancer by 18%[8]. According to the mechanistic studies of the cooking and digestion processes of red meat conducted by Hecke et al. and Bernstein et al., there is a close relationship between excessive intake of red meat and the increased risk of cancer[9,10]. Pan et al. also pointed out that the restriction of red meat intake is beneficial for glycemic control in type 2 diabetes patients[11]. Regarding the dietary guidelines published in the Annals of Internal Medicine in 2019, subsequent expert reviews and comments suggest that the five reviews included in the guidelines only included one randomized trial, while the rest relied on observational epidemiological data, which may have flaws in terms of research methods. In the review of the randomized controlled trials included, it was found that many of the trials were funded by the meat industry, and none of the trials only focused on the health outcomes of red meat or processed meat[12,13]. These reviews produced contradictory results in terms of the recommendation of red meat consumption, and did not carry out a comprehensive assessment of the outcomes in this field, in addition, there were also discrepancies in the quality of evidence and the consideration of bias in the support of evidence in the reviews, all of which affected the credibility of the evidence.
An umbrella review, as a newly developed research method for complex topics in cancer, cardiovascular disease, and a variety of health outcomes, can compare data obtained from different interventions or conditions, thus providing researchers with a more comprehensive understanding of the subject matter. It is designed to provide a conclusive summary of the report and emphasize the level of evidence[14,15,16,17]. Given the aforementioned drawbacks from previous studies, we began to undertake a summarizing review of the evidence from evaluations/meta-analyses of existing systems, providing an overview to assess the validity of reports correlating red meat and various cancers risk and health outcomes.
This study intends to use the method of umbrella review to comprehensively summarize and evaluate the impact of red meat intake on human health outcomes such as diseases or disease risk factors, so as to assess the strength of observed evidence and provide a basis for future research as well as guidance for people's daily diet consumption.
Methods
We followed the PRIMSA (Preferred Reporting Items for Systematic Reviews and Meta-Analyses) guidelines for reporting the umbrella review[18]. (Appendix 1).
Data sources and search strategy
Two investigators (T.N. and X.S.) independently searched PubMed, Web of Science, The Cochrane Library, Embase, CNKI, Wan Fang Data, CBM, and VIP databases from database construction until December 2022. In addition, we conducted a supplementary inquiry into grey literature and relevant references. Search terms were as follows: (red mea* OR veal OR beef, OR mutton OR lamb mea* OR pork) AND (Health OR Nutrition OR nutritional status) AND (systematic reviews OR systematic review OR literature review OR meta-analysis OR meta-analyses). Details of the search strategy are in Appendix 2.
Criteria for considering studies for this review
According to principles of PICOS (Participants, Intervention Measures Type, Control Measures, Outcome Indicators and Research Type), we established inclusion and exclusion criteria[19].
Types of studies
We included systematic reviews and meta-analyses, and reporting relative risk (RR) or ratio ratio (OR) indicators and corresponding 95% confidence intervals (CI).
Types of participants
We include participants who primarily consume a high intake red meat diet, with no restrictions on their characteristics and are not influenced by age, gender, race, or background.
Types of interventions
The intervention measure for the intervention group was to consume a high quantity of fresh red meat (without specific numerical limits on high intakes). Red meat refers to the muscles of mammals such as beef, veal, pork, mutton, goat, horse, deer, etc. Distinguished from white meat (poultry meat), red meat has a higher fat content [1,2]. The intervention in the control group may include lowest category of red meat intake (include no red meat consumption), alternatives to red meat (such as chicken) and blank.
Types of outcome measures
Primary outcomes include Incidence of colon cancer, rectal cancer, gastric cancer; Secondary outcomes include preventive factors of breast cancer, incidence of non-Hodgkin's lymphoma (NHL), risk of Stroke /mortality rate, change levels of glycemic control and inflammatory biomarkers, cardiovascular disease outcomes and risk factors, risk of kidney stones, age-related eye disease and change levels of body weight and composition
Studies with any of the following characteristics are excluded: 1) Study the nutritional value of red meat; 2) Literature with mixed analysis of red meat and processed meat; 3) Analyzing the cost-effectiveness of red meat supplements; 4) Animal trials, case reports, correspondence, protocols, abstracts, commentaries and unreported data studies; 5) Duplicate reports of the same study.
Data extraction and management
All the retrieved articles were imported into the EndNote X 9.0software. After excluding duplicate publications, two authors (T.N. and X.S.) independently screened and extracted data according to the inclusion and exclusion criteria. Disagreements were resolved through a discussion or by consulting a third member (FF.E.) with vast experience in the field[19]. Using a standardized pilot-tested form, two reviewers independently screened the literature and extracted relevant information from eligible studies: 1) Basic information of the research, such as first author name, country, year of publication, age, follow-up duration, type and number of original research included, sample size, types of disease, bias risk assessment tools, types of metrics, publication bias assessment, correction factor; 2) The specific details of the intervention and control measures(such as the frequency and quantity of consumption of red meat and red meat substitute diet); 3) The quantitative analysis results of the outcome indicators; 4) The results of methodological quality evaluation of SRs/MA and related content. If there are discrepancies, they will discuss and resolve them through negotiation, or through third-party adjudication by expert research.
Quality assessment
The quality assessment will be independently performed by pairs of investigators (T.N. and X.S.), disagreements were resolved through a discussion or by consulting a third member (JW.Z.). A Measurement Tool to Assess Systematic Review-2 (AMSTAR-2) was used to evaluate the methodological[20]. AMSTAR-2 regards items 2, 4, 7, 9, 11, 13 and 15 as key items affecting the production of system evaluation and the validity of its results. There are 16 items in total, and each item was evaluated using “Yes”, “Partial Yes”, or “No”. The assessment process was conducted online (https://amstar.ca/Amstar_Checklist.php), the overall quality assessment results (“Critically low quality,” “Low quality,” “Moderate quality”, or “High quality”) were automatically generated.
Overlapping and low-quality reviews
We included studies are SRs/MAs, and different reviews may contain the same original experimental studies, if the same exposure and outcomes are assessed across two or more reviews, there is overlap between the reviews[21]. The pooled outcome from overlapping reviews may result in the same primary study being included multiple times, leading to biased estimates and results[22,23]. Additionally, in a systematic review, even though the study process is rigorous, the quality may vary, and the results of studies on the same topic may differ[24]. Therefore, when analyzing a systematic review, a critical attitude should be adopted, and the methodological quality of the existing reviews should be carefully evaluated[25].
For the overlapping associations between the same exposures and outcomes in the survey, a cross-tabulation (citation matrix) is generated to include primary studies (at the row level) and overlapping systematic reviews (at the column level)[26]. And the metric of Corrected Covering Area (CCA) is used to quantify the degree of overlap[21]. CCA is an intuitive method to quantify the degree of overlap between two or more reviews, which helps to decide how to deal with the overlap. It is represented by percentage and the calculation formula is (N-r)/(rc-r), where N is the number of primary studies included in the evidence synthesis (i.e. the number of boxes checked in the citation matrix), r is the number of rows, and c is the number of columns. Overlap is classified as very high (CCA > 15%), high (CCA 11-15%), moderate (CCA 6-10%) or slight (CCA 0-5%)[21].
All non-overlapping systematic reviews meeting the inclusion criteria are included in the analysis. The management of overlapping reviews is as follows: (1) since the quality of Cochrane reviews is generally higher and often updated, when the overlapping reviews are from both Cochrane and non-Cochrane evidence synthesis, the Cochrane review is preferred[27]; (2) if there is a high degree of overlap (CCA>10%) between two or more non-Cochrane reviews, the review with higher methodological quality rating is preferred, evaluated using the AMSTAR 2 quality assessment tool; or the most recently published; or conducted a meta-analysis; or has the most study subjects[28]; (3) if there is slight or moderate overlap (CCA ≤ 10%), all reviews are retained and pooled analysis is conducted. Appendix 3 shows the citation matrices of all reviews with some degree of overlap.
Data synthesis and statistical analysis
When similar SRs/MAs were available and there was only slight or moderate overlap between two or more reviews (CCA≤10%), we re-included all primary studies and re-analyzed them using STATA 17.0 software to aggregate their results in a meta-analysis. For any dichotomous outcomes, odds ratio (OR) is used as the effect statistic for categorical variables and corresponding 95% confidence intervals (95%CI) are calculated when the confidence interval does not cross the null line and P < 0.05, indicating differences are statistically significant. For continuous outcomes, mean differences (MDs) were calculated as an effect indicator and its 95% Confidence Interval (CI) was provided. P < 0.05 was considered statistically significant. P-values and I² are used to quantify the degree of heterogeneity, with I² values greater than 50% indicating significant heterogeneity. We used fixed-effects models with inverse variance weighting for all meta-analyses.
We use qualitative description to describe the outcome indicators of only one review report.
Assessment of heterogeneity and subgroup analysis
Heterogeneity (P>0.05, I²<50%) due to results from pooled analysis results was resolved by fixed-effects model.[29,30]. If possible, reduce heterogeneity through subgroup analysis. When heterogeneity was present, we first reviewed study components such as participants, interventions, and outcomes to determine if heterogeneity was significant. If that was the case, we investigated and reported possible causes.
Sensitivity analysis
We planned to perform a sensitivity analysis to explore the effects of adequate sequence generation and blinding, but were unable to do so due to a lack of relevant inclusion studies.
Assessment of publication biases
Results
Selection and characteristics of studies
A total of 2,191 articles were initially identified, with the exclusion of 967 duplicated articles. After reviewing the titles and abstracts, the remaining 1,224 records were preliminarily screened, and 1,178 records were excluded. Reading the full text and re-screening the remaining 46 papers. (Appendix 4). Ultimately, a total of 18 SRs/MA were included in our overview (Figure 1).
All articles were published between 2010 and 2022. The primary studies were mostly from Asia, Australia, Europe, and the Americas, with participants ranging in age from 18 to 80 years. We systematically categorized 18 SRs/MAs into 12 health outcomes categories as follows: incidence of colon cancer, incidence of rectal cancer, Incidence rate of gastric cancer, preventive factors of breast cancer, Incidence of non-Hodgkin's lymphoma (NHL), risk of stroke /mortality rate, blood glucose control and type 2 diabetes, cardiovascular disease outcomes, changes levels in cardiovascular risk factors, risk of kidney stones, age-related eye disease, change levels of body weight and composition. The details are listed in Table 1.
Quality assessment
According to the AMSTAR 2 assessment, 5 SRs/MAs were rated as high quality, 4 as moderate quality, 6 as low quality, and 3 as very low quality. For each of the 16 items of the AMSTAR 2, 12 were rated as relatively complete, with a reporting rate of ≥70% (items 1, 3, 4, 5, 6, 8, 9, 11, 13, 14, 15, 16). All studies provided comprehensive inclusion criteria (item 1), and literature selection and data extraction were also conducted in duplicate (items 5 and 6). There were 4 items with a reporting rate ≤50%, of which 7 studies (38.89%) provided predefined protocols (item 2), 8 studies (44.44%) provided full text exclusion reasons (item 7), 5 studies (27.78%) reported primary study funding sources (item 10), and 9 studies (50%) analyzed the impact of bias risks on the meta-analysis (item 12). (Figure 2). The more detailed scoring process of AMSTAR2 for each systematic review is shown in Appendix 5.
Overlapping and non-overlapping associations
By corrected covered area, 9 SRs/MAs had overlapping correlations. The outcomes of the overlapping correlations included: colorectal cancer incidence (CCA=12.5%)[33,34], rectal cancer incidence (CCA=5%) [33,34], type-2 diabetes incidence (CCA=16.7%)[42,43], stroke risk/mortality (CCA=40%)[38,39,40], total cholesterol (CCA=48.5%)[46,47], triglyceride concentration (CCA=42.4%)[46,47], low-density lipoprotein (CCA=48.5%)[46,47], and high-density lipoprotein (48.5%)[46,47]. According to the criteria for managing the overlapping correlations review, the systemic reviews and outcomes included in the review were: colorectal cancer incidence[34], rectal cancer incidence[33,34], type-2 diabetes incidence[42], and stroke risk/mortality[46]. The details are listed in Table 2. Appendix 6 shows the decisions to retain or exclude reviews in the analysis. Appendix 7 is a list of retained/excluded reviews.
Qualitative and quantitative description
Incidence of colon cancer
1 meta-analysis evaluated the relative risk of red meat consumption on colon cancer[34]. A total of 22 primary studies were included, and the combined results showed that consuming more than 50 g/day of red meat had a risk of inducing colon cancer (RR 1.21, 95%CI 1.07-1.37). However, no reports regarding heterogeneity and publication bias were reviewed.
Incidence of rectal cancer
Based on the 11 primary studies included in 2 reviews[33,34], a re-meta-analysis reveals a weak correlation between consuming 50 g or more of red meat daily and the incidence of rectal cancer. The OR for rectal cancer incidence was 0.19 (95%CI 0.03-0.34), and there was low heterogeneity. (I2= 30.9%, P = 0.152 for heterogeneity) (Figure 3). The results of the meta-analysis were robust and remained unchanged when analyzed using random-effect models, but with wider confidence intervals (OR 0.19, 95%CI 0.01-0.39).
Incidence of gastric cancer
1 meta-analysis evaluated the relative risk of highest red meat intake on gastric cancer[35]. The pooled analysis of 18 primary studies showed a combined relative risk of gastric cancer (RR) of 1.37 (95%CI 1.18-1.59). In addition, the risk of gastric cancer increased by 17% (RR 1.17, 95%CI 1.05-1.32) for every 100 g/day of red meat intake, and the dose-response analysis showed that the risk of gastric cancer increased with the increase of red meat intake.
Preventive factors of breast cancer
1 meta-analysis evaluated the relative risk of highest red meat intake on breast cancer[36]. A total of 22 primary studies were pooled for analysis, and it was found that high-level red meat consumption was not significantly associated with the risk of breast cancer (RR 1.05, 95%CI 1.00-1.11; P=0.030).
Incidence of non-Hodgkin's lymphoma (NHL)
1 meta-analysis evaluated the relative risk of red meat consumption on non-Hodgkin's lymphoma[37]. The pooled analysis of 11 primary studies revealed a significant association between red meat consumption and NHL risk (OR 1.10, 95%CI 1.02-1.19). In the subgroup analysis, especially diffuse large B-cell lymphoma (DLBCL) (OR 1.20, 95%CI 1.04-2.37) was found to be statistically significantly associated with red meat consumption.
Risk of Stroke /mortality rate
1 meta-analysis evaluated the relative risk of red meat consumption on total stroke and stroke mortality[38]. When the daily diet increased by 100-120g of red meat, the RR of total stroke was 1.11 (95%CI 1.03-1.20). In addition, the risk of ischemic stroke was positively associated with the consumption of red meat (RR 1.13, 95%CI 1.00-1.27), but there was no statistically significant correlation between hemorrhagic stroke and red meat consumption.
Change levels of glycemic control and inflammatory biomarkers
1 meta-analysis evaluated the effects of red meat consumption on glycemic control and inflammatory biomarkers, combining the results of 24 primary studies[41]. The results showed that consuming more than 35 g/day of red meat did not affect blood glucose concentrations (WMD 0.040, 95%CI 0.049-0.129), insulin concentrations (WMD -0.710, 95%CI 6.582-5.162), Homeostatic Model Assessment of Insulin Resistance (HOMA-IR) (WMD 0.11, 95%CI -0.072 to 0.293) and C-reactive protein (WMD 2.424, 95%CI -1.460 to 6.309). However, in the meta-analysis assessing the risk of red meat consumption on diabetes[42], the pooled analysis of 14 primary studies revealed that after adjusting for age, BMI, and other lifestyle and dietary habits, red meat consumption was positively associated with the risk of T2D (P<0.001). The result showed that the RR of consuming 100 g/day of unprocessed red meat was 1.19 (95%CI 1.04-1.37).
Cardiovascular disease outcomes
1 meta-analysis evaluated the effect of restricting red meat consumption on cardiovascular disease[44]. A total of 12 primary studies were included in the analysis, and the combined results showed that low red meat diet had almost no effect on all-cause mortality (HR 0.99, 95%CI 0.95-1.03), cardiovascular mortality (HR 0.98, 95%CI 0.91-1.06), and cardiovascular disease (HR 0.99, 95%CI 0.94-1.05). However, 1 meta-analysis of ischemic heart disease (IHD) showed that the higher the intake of red meat, the higher the relative risk of IHD (RR 1.09, 95%CI 1.06-1.12) for every 50 g/day[45].
Changes levels in cardiovascular risk factors
1 meta-analysis of 24 studies evaluated the effects of red meat consumption on changes in total cholesterol, low-density lipoprotein cholesterol, high-density lipoprotein, triglycerides and other cardiovascular disease risk factors[46]. A synthesis of 36 primary studies revealed that the intake of 46.4-500 g/day of red meat compared to other sources of protein may be associated with alterations in total cholesterol (WMD 0.264, 95%CI 0.144-0.383), triglycerides (WMD -0.181 95%CI -0.349 to -0.013), low-density lipoprotein (WMD 0.198, 95%CI 0.065-0.330) and high-density lipoprotein (WMD -0.065, 95%CI -0.109 to -0.020). However, no reports regarding heterogeneity were reported in the review.
Risk of kidney stones
1 meta-analysis evaluated the association between red meat intake and risk of kidney stones[48]. A synthesis of three primary studies showed a statistically non-significant pooled relative risk (RR) of 1.02 (95% CI 1.09-1.15). A dose-response analysis indicated a significant positive correlation between an additional 100 g/day of red meat intake and risk of kidney stones (RR 1.39, 95% CI 1.13-1.71).
Change levels of body weight and composition
1 meta-analysis assessed the changes in body weight and composition associated with red meat consumption[50]. A pooled analysis of 12 studies found no association between red meat consumption and overweight (β 0.89, 95% CI 0.48-1.64, P>0.05) or obesity (β 1.06, 95% CI 0.30-3.71, P>0.05). When total energy intake was not restricted, red meat consumption was associated with reduced body weight (β -0.86, 95% CI -1.55 to -0.17, P<0.05) and body fat percentage (β -0.77, 95% CI -1.43 to -0.11, P<0.05), but not lean body mass (β 1.79, 95% CI -1.74 to 5.32, P>0.05). When total energy intake was restricted, red meat consumption was associated with decreased body weight (β -5.56, 95% CI -10.59 to -0.55, P<0.05), body fat percentage (β -1.50, 95% CI -1.62 to -1.39, P<0.05) and lean body mass (β -6.6, 95% CI -6.79 to -6.42, P<0.05). However, the lack of specification of the amount of red meat consumed may limit the extrapolation of the evidence.
Publication bias
Figure 4 illustrates a funnel plot which examines the association between red meat consumption and the risk of colorectal cancer, and utilizes an Egger test analysis (P= 0.112) with no statistically significant results. Both the visual inspection and Egger test results indicate the absence of potential publication bias (Figure 4).
Discussion
Summary of main results
Our comprehensive overview comprehensively summarizes the associations between red meat intake and various health outcomes in humans, attempts to evaluate the strength and credibility of the evidence underlying these associations, and provides the best available data to healthcare decision makers. Analysis of 13 health outcomes across 18 SRs/MAs was conducted, categorizing these meta-analyses according to the outcome type and assessing the level of significance of each health outcome analysis using the collected data (e.g., overall effect p-value, heterogeneity p-value, publication bias I2 and p-value, etc). The results revealed some concerning associations between red meat intake and a range of health outcomes. Analysis of this review indicated that higher intake of red meat is associated with an increased risk of colorectal cancer, gastric cancer, and non-Hodgkin lymphoma. Specifically, daily intake of more than 50g of red meat may increase the risk of colorectal cancer, although the association is weak, but a dose-response relationship between consumption of fresh red meat and colorectal cancer was indicated in the study by Farvid et al., with an increase of 26% risk of colorectal cancer with daily intake of 100g red meat[51]. The risk of gastric cancer and kidney stones was also associated with dose response, with a 17% increase in gastric cancer risk and a significantly positive correlation with kidney stones risk with daily intake of 100g red meat. Intake of red meat was also positively associated with the risk of non-Hodgkin lymphoma, with the most significant associated subtype being diffuse large B-cell lymphoma. Additionally, consumption of a high amount of red meat was also found to increase the risk of stroke, Type 2 diabetes, ischemic heart disease, and potentially have negative impacts on vascular risk factors, age-related eye disease, and body composition changes. Nevertheless, no significant associations were found between high red meat consumption and breast cancer risk, glycemic control and inflammatory biomarkers, and changes in body weight status.
Currently, reliable evidence has been found in red meat that there are carcinogenic substances associated with cancer. Studies have revealed that red meat contains many known and potential carcinogens, three common significant carcinogens including heterocyclic amines (HCA), polycyclic hydrocarbons (PCH), and nitrosamines[52]. These are easily produced when cooked at high temperatures such as barbecuing or frying[53]. The cancer risk of red meat is also associated with the presence of heme iron, which induces cell toxicity and catalyzes the formation of N-nitroso compounds, thus promoting the occurrence of cancer[54]. Additionally, red meat intake increases the levels of inflammatory biomarkers (including C-reactive protein) and blood plasma concentrations[55,56]. Chaturvedi et al. have found that the methionine present in red meat can promote chronic inflammation, thus facilitating the development and progression of associated diseases and tumors[57].
However, despite the increasing body of mechanistic evidence linking increased consumption of red meat with increased risk of various cancers or other diseases, the current study evidence, particularly epidemiological results, is inconsistent. Some studies have demonstrated a significant positive correlation between red meat consumption and colorectal cancer risk[58,59], while some do not[60,61]. Furthermore, the regional distribution of the primary studies included in SRs/MAs may have a considerable influence on the outcomes. Our results show that most primary studies were conducted in North America, Europe and Asia, with participants ranging from 18 to 80 years old, and the differences in regional population, dietary structure and lifestyle may have led to disparate conclusions when extrapolating to other populations and ethnic groups. Moreover, the inter-study age differences make there a considerable heterogeneity in disease risk. For instance, adolescence is typically considered a period of health with low disease burden, not being predisposed to long-term diseases due to cumulative etiologic exposures[62]. In heterogeneous studies, results not adjusted for age, gender, occupation, and region could be deviating from the true situation. Thus, it is essential to undertake subgroup analyses based on various factors to eradicate bias and inaccuracies in large datasets or primary meta-analyses.
Our results show that, concerning studies on the risks of high red meat consumption for human health, low- and very-low-quality studies constituted up to half. Therefore, the importance of the study results in practice should not be over-emphasized, and the explanation of a link between risk factors and disease based solely on the results is inadequate. It is not rigorous for most clinical doctors to only consider the overall P-value to determine the importance of the results. What's more, researchers should also consider effect size, 95% confidence interval, heterogeneity, publication bias, and funnel plot data[63,64,65]. Additionally, when establishing evidence levels of multiple meta-analyses, they should strictly adhere to the PRISMA guidelines and rigorous standard procedures for reporting[66].
Most of the previously published SRs/MAs lacked information on publication bias, making it difficult to assess the effectiveness of evidence synthesis[67]. In our study, four studies were found to have no information on publication bias, including two with statistically significant results (colorectal cancer and changes in body composition). Notably, the study on breast cancer had high heterogeneity and publication bias, while those on age-related macular degeneration and changes in body weight status did not provide specific intake information, which to some extent limited the inferences of the evidence. It can be seen that it is the various limitations in a single meta-analysis that make it necessary to comprehensively explain and elaborate through umbrella reviews. Umbrella reviews, as a type of meta-analysis, aim to provide a comprehensive report that emphasizes evidence level by excluding overlapping primary studies within the same type of research and selectively choosing the studies to be included for pooled analysis[21,68]. Since it was first proposed by Ioannidis et al. in 2009, it has gradually become the mainstream analysis method[69]. It effectively analyzes the misleading results and biases caused by the deficiencies and misuses of statistical methods in single meta-analyses[69].
In addition, with the rapid transformation of the global dietary structure from plant-based diet to animal-based diet, the intake of fat and calories inevitably increased in the diet[70,71]. This study suggests that the dietary guidelines proposed by the World Cancer Research Fund and the American Institute for Cancer Research (WCRF/AICR) should be followed in the red meat diet[72,73], limiting the intake of red meat, and selecting production methods that do not require high temperature or long-time cooking, such as boiling or steaming, or increasing the proportion of other protein sources in the diet, such as fish, poultry, or plant proteins, to reduce the risk of cancer[74,75,76].
Limitations
Our research has several limitations. Primarily, despite taking a comprehensive search strategy, the current study only covered reports published in English due to restrictions on the inclusion/exclusion criteria, which may lead to potential language bias; second, the results of this study are based on the published literature currently available and we will continue to follow up and update in a timely manner when relevant research emerges; third, due to the subjective limitations of the assessment tools, this may introduce some other biases. However, this study was independently evaluated by two researchers, which to some extent reduced the deviation; fourth, due to the different exposure, outcome, and statistical effect indexes, only partial result indexes were reanalyzed, while the results of most studies were not re-summarized for analysis; fifth, this study only analyzed the carcinogenic effects of fresh red meat, and the consumption of processed red meat was not included in the exposure, which to some extent limited the scope of evidence generalization.
Conclusions
In conclusion, this comprehensive umbrella review indicates that reducing the consumption of red meat may be an important modifiable dietary factor for reducing cancer risks and health outcomes mentioned in the analysis. It provides evidence to promote public awareness of a reasonable diet for red meat as well as to promote health.
Supplementary Materials
The following supporting information can be downloaded at the website of this paper posted on Preprints.org, Figure S1: title; Table S1: title; Video S1: title.
Authors’ Contributions: (I) Conception and design: Tao Nian and Xue Shang; (II) Administrative support: Xiuxia Li; (III) Collection and assembly of data: Yilong Yan, Pengyue Hu, Tianjiao Xin, Kaiyue Chen, Zhisheng Cai; (IV) Data analysis and interpretation: Tao Nian, Xue Shang, Wenjing Zhou, and Fenfen E; (V) Manuscript writing: Tao Nian; (VI) Final approval of manuscript: All authors. .
Funding
This research is supported by the Fundamental Research Funds for the Central Universities: lzujbky-2021-ct06、lzujbky-2021-kb22.
Acknowledgments
The authors would like to thank all members of the Evidence-Based Medicine Center at Lanzhou University for their help with this study.
Conflicts of Interest
The authors declare that they have no any competing interests.
References
- Zhang, Y.; Zhang, D.Z. Red meat; poultry, and egg consumption with the risk of hypertension: a meta-analysis of prospective cohort studies. Journal of human hypertension 2018, 32, 507–517. [Google Scholar] [CrossRef]
- Bassam, S.M.; Noleto-Dias, C.; Farag, M.A.J.F.C. Dissecting grilled red and white meat flavor: Its characteristics, production mechanisms. influencing factors and chemical hazards 2022, 371, 131139. [Google Scholar]
- Bouvard, V.; Loomis, D.; Guyton, K.Z.; Grosse, Y.; Ghissassi, F.E.; Benbrahim-Tallaa, L.; Guha, N.; Mattock, H.; Straif, K. Carcinogenicity of consumption of red and processed meat. The Lancet. Oncology 2015, 16, 1599–600. [Google Scholar] [CrossRef] [PubMed]
- Bruinsma, J. World agriculture: towards 2015/2030: an FAO perspective. Earthscan 2003.
- Wolk, A. Potential health hazards of eating red meat. Journal of internal medicine 2017, 281, 106–122. [Google Scholar] [CrossRef]
- Boyle, P.; Boffetta, P.; Autier, P. Diet; nutrition; cancer: public, media and scientific confusion. Annals of oncology : official journal of the European Society for Medical Oncology 2008, 19, 1665–7. [Google Scholar] [CrossRef]
- Johnston, B.C.; Zeraatkar, D.; Han, M.A.; Vernooij, R.W.M.; Valli, C.; El Dib, R.; Marshall, C.; Stover, P.J.; Fairweather-Taitt, S.; Wójcik, G.; Bhatia, F.; de Souza, R.; Brotons, C.; Meerpohl, J.J.; Patel, C.J.; Djulbegovic, B.; Alonso-Coello, P.; Bala, M.M.; Guyatt, G.H. Unprocessed Red Meat and Processed Meat Consumption: Dietary Guideline Recommendations From the Nutritional Recommendations (NutriRECS) Consortium. Annals of internal medicine 2019, 171, 756–764. [Google Scholar] [CrossRef]
- Domingo, J.L.; Nadal, M. Carcinogenicity of consumption of red meat and processed meat: A review of scientific news since the IARC decision. Food and chemical toxicology : an international journal published for the British Industrial Biological Research Association 2017, 105, 256–261. [Google Scholar] [CrossRef] [PubMed]
- Van Hecke, T.; Vossen, E.; Hemeryck, L.Y.; Bussche, J.V.; Vanhaecke, L.; De Smet, S. Increased oxidative and nitrosative reactions during digestion could contribute to the association between well-done red meat consumption and colorectal cancer. Food Chem 2015, 187, 29–36. [Google Scholar] [CrossRef] [PubMed]
- Bernstein, A.M.; Song, M.; Zhang, X.; Pan, A.; Wang, M.; Fuchs, C.S.; Le, N.; Chan, A.T.; Willett, W.C.; Ogino, S.; Giovannucci, E.L.; Wu, K. Processed and Unprocessed Red Meat and Risk of Colorectal Cancer: Analysis by Tumor Location and Modification by Time. PloS one 2015, 10, e0135959. [Google Scholar] [CrossRef]
- Pan, B.; Wu, Y.; Yang, Q.; Ge, L.; Gao, C.; Xun, Y.; Tian, J.; Ding, G. The impact of major dietary patterns on glycemic control, cardiovascular risk factors, and weight loss in patients with type 2 diabetes: A network meta-analysis. Journal of evidence-based medicine 2019, 12, 29–39. [Google Scholar] [CrossRef]
- Vernooij, R.W.M.; Zeraatkar, D.; Han, M.A.; El Dib, R.; Zworth, M.; Milio, K.; Sit, D.; Lee, Y.; Gomaa, H.; Valli, C.; Swierz, M.J.; Chang, Y.; Hanna, S.E.; Brauer, P.M.; Sievenpiper, J.; de Souza, R.; Alonso-Coello, P.; Bala, M.M.; Guyatt, G.H.; Johnston, B.C. Patterns of Red and Processed Meat Consumption and Risk for Cardiometabolic and Cancer Outcomes: A Systematic Review and Meta-analysis of Cohort Studies. Annals of internal medicine 2019, 171, 732–741. [Google Scholar] [CrossRef] [PubMed]
- Carroll, A.E.; Doherty, T.S. Meat Consumption and Health: Food for Thought. Annals of internal medicine 2019, 171, 767–768. [Google Scholar] [CrossRef]
- Hartling, L.; Chisholm, A.; Thomson, D.; Dryden, D.M. A descriptive analysis of overviews of reviews published between 2000 and 2011. PloS one 2012, 7, e49667. [Google Scholar] [CrossRef]
- Becker, L.A.; Oxman, A.D.J.C.H.F.S.R.O.I. Overviews of reviews 2008, 607.
- Khangura, S.; Konnyu, K.; Cushman, R.; Grimshaw, J.; Moher, D.J.S.R. Evidence summaries: the evolution of a rapid review approach. 2012, 1, 1–9. [Google Scholar] [CrossRef]
- Higgins, J.J.W.C.-H.O. Cochrane handbook for systematic reviews of interventions. Version 5.1. 0 [updated 11]. The Cochrane Collaboration, (2011). 20 March.
- M J, P.; J E, M.; P M, B.; et al. The PRISMA 2020 statement: an updated guideline for reporting systematic reviews. International journal of surgery 2021, 88, 105906. [Google Scholar]
- Yan, P.; Yao, L.; Li, H.; Zhang, M.; Xun, Y.; Li, M.; Cai, H.; Lu, C.; Hu, L.; Guo, T.; Liu, R.; Yang, K. The methodological quality of robotic surgical meta-analyses needed to be improved: a cross-sectional study. Journal of clinical epidemiology 2019, 109, 20–29. [Google Scholar] [CrossRef] [PubMed]
- Shea, B.J.; Reeves, B.C.; Wells, G.; Thuku, M.; Hamel, C.; Moran, J.; Moher, D.; Tugwell, P.; Welch, V.; Kristjansson, E.; Henry, D.A. AMSTAR 2: a critical appraisal tool for systematic reviews that include randomised or non-randomised studies of healthcare interventions, or both. BMJ (Clinical research ed.) 2017, 358, j4008. [Google Scholar] [CrossRef] [PubMed]
- Pieper, D.; Antoine, S.L.; Mathes, T.; Neugebauer, E.A.; Eikermann, M. Systematic review finds overlapping reviews were not mentioned in every other overview. Journal of clinical epidemiology 2014, 67, 368–75. [Google Scholar] [CrossRef]
- Smith, V.; Devane, D.; Begley, C.M.; Clarke, M. Methodology in conducting a systematic review of systematic reviews of healthcare interventions. BMC medical research methodology 2011, 11, 15. [Google Scholar] [CrossRef] [PubMed]
- Senn, S.J. Overstating the evidence: double counting in meta-analysis and related problems. BMC medical research methodology 2009, 9, 10. [Google Scholar] [CrossRef]
- Sacks, H.S.; Berrier, J.; Reitman, D.; Ancona-Berk, V.; Chalmers, T.C.J.N.E.J.O.M. Meta-analyses of randomized controlled trials. 1987, 316, 450–455. [Google Scholar] [CrossRef]
- Shea, B.; Dubé, C.; Moher, D.J.S.R.I.H.C.M.-A.I.C. Assessing the quality of reports of systematic reviews: the QUOROM statement compared to other tools. 2001, 122–39. [Google Scholar]
- Bougioukas, K.I.; Liakos, A.; Tsapas, A.; Ntzani, E.; Haidich, A.B. Preferred reporting items for overviews of systematic reviews including harms checklist: a pilot tool to be used for balanced reporting of benefits and harms. Journal of clinical epidemiology 2018, 93, 9–24. [Google Scholar] [CrossRef] [PubMed]
- Pollock, M.; Fernandes, R.M.; Newton, A.S.; Scott, S.D.; Hartling, L. The impact of different inclusion decisions on the comprehensiveness and complexity of overviews of reviews of healthcare interventions. Systematic reviews 2019, 8, 18. [Google Scholar] [CrossRef]
- Pollock, M.; Fernandes, R.M.; Newton, A.S.; Scott, S.D.; Hartling, L. A decision tool to help researchers make decisions about including systematic reviews in overviews of reviews of healthcare interventions. Systematic reviews 2019, 8, 29. [Google Scholar] [CrossRef] [PubMed]
- Higgins, J.P.; Thompson, S.G.; Deeks, J.J.; Altman, D.G.J.B. Measuring inconsistency in meta-analyses. 2003, 327, 557–560. [Google Scholar] [CrossRef]
- Ioannidis, J.P.; Patsopoulos, N.A.; Evangelou, E.J.B. Uncertainty in heterogeneity estimates in meta-analyses. 2007, 335, 914–916. [Google Scholar] [CrossRef] [PubMed]
- Sterne, J.A.; Egger, M.J.J.O.C.E. Funnel plots for detecting bias in meta-analysis: guidelines on choice of axis. 2001, 54, 1046–1055. [Google Scholar]
- Egger, M.; Smith, G.D.; Schneider, M.; Minder, C.J.B. Bias in meta-analysis detected by a simple. graphical test, 1997, 315, 629–634. [Google Scholar]
- Alexander, D.D.; Weed, D.L.; Cushing, C.A.; Lowe, K.A. Meta-analysis of prospective studies of red meat consumption and colorectal cancer. European journal of cancer prevention : the official journal of the European Cancer Prevention Organisation (ECP) 2011, 20, 293–307. [Google Scholar] [CrossRef]
- Smolińska, K.; Paluszkiewicz, P. Risk of colorectal cancer in relation to frequency and total amount of red meat consumption. Systematic review and meta-analysis. Archives of medical science : AMS 2010, 6, 605–10. [Google Scholar] [CrossRef]
- Song, P.; Lu, M.; Yin, Q.; Wu, L.; Zhang, D.; Fu, B.; Wang, B.; Zhao, Q. Red meat consumption and stomach cancer risk: a meta-analysis. Journal of cancer research and clinical oncology 2014, 140, 979–92. [Google Scholar] [CrossRef]
- Poorolajal, J.; Heidarimoghis, F.; Karami, M.; Cheraghi, Z.; Gohari-Ensaf, F.; Shahbazi, F.; Zareie, B.; Ameri, P.; Sahraee, F. Factors for the Primary Prevention of Breast Cancer: A Meta-Analysis of Prospective Cohort Studies. Journal of research in health sciences 2021, 21, e00520. [Google Scholar] [CrossRef] [PubMed]
- Fallahzadeh, H.; Cheraghi, M.; Amoori, N.; Alaf, M. Red meat intake and risk of non-Hodgkin lymphoma: a meta-analysis. Asian Pacific journal of cancer prevention : APJCP 2014, 15, 10421–5. [Google Scholar] [CrossRef] [PubMed]
- Kaluza, J.; Wolk, A.; Larsson, S.C. Red meat consumption and risk of stroke: a meta-analysis of prospective studies. Stroke 2012, 43, 2556–60. [Google Scholar] [CrossRef]
- Yang, C.; Pan, L.; Sun, C.; Xi, Y.; Wang, L.; Li, D. Red Meat Consumption and the Risk of Stroke: A Dose-Response Meta-analysis of Prospective Cohort Studies. Journal of stroke and cerebrovascular diseases : the official journal of National Stroke Association 2016, 25, 1177–1186. [Google Scholar] [CrossRef] [PubMed]
- de Medeiros, G.; Mesquita, G.X.B.; Lima, S.; Silva, D.F.O.; de Azevedo, K.P.M.; Pimenta, I.; de Oliveira, A.; Lyra, C.O.; Martínez, D.G.; Piuvezam, G. Associations of the consumption of unprocessed red meat and processed meat with the incidence of cardiovascular disease and mortality, and the dose-response relationship: A systematic review and meta-analysis of cohort studies. Crit Rev Food Sci Nutr 2022, 1–14. [Google Scholar] [CrossRef]
- O'Connor, L.E.; Kim, J.E.; Clark, C.M.; Zhu, W.; Campbell, W.W. Effects of Total Red Meat Intake on Glycemic Control and Inflammatory Biomarkers: A Meta-Analysis of Randomized Controlled Trials. Advances in nutrition (Bethesda, Md.) 2021, 12, 115–127. [Google Scholar] [CrossRef]
- Pan, A.; Sun, Q.; Bernstein, A.M.; Schulze, M.B.; Manson, J.E.; Willett, W.C.; Hu, F.B. Red meat consumption and risk of type 2 diabetes: 3 cohorts of US adults and an updated meta-analysis. The American journal of clinical nutrition 2011, 94, 1088–96. [Google Scholar] [CrossRef]
- Zhang, R.; Fu, J.; Moore, J.B.; Stoner, L.; Li, R. Processed and Unprocessed Red Meat Consumption and Risk for Type 2 Diabetes Mellitus: An Updated Meta-Analysis of Cohort Studies. International journal of environmental research and public health 2021, 18. [Google Scholar] [CrossRef] [PubMed]
- Zeraatkar, D.; Johnston, B.C.; Bartoszko, J.; Cheung, K.; Bala, M.M.; Valli, C.; Rabassa, M.; Sit, D.; Milio, K.; Sadeghirad, B.; Agarwal, A.; Zea, A.M.; Lee, Y.; Han, M.A.; Vernooij, R.W.M.; Alonso-Coello, P.; Guyatt, G.H.; El Dib, R. Effect of Lower Versus Higher Red Meat Intake on Cardiometabolic and Cancer Outcomes: A Systematic Review of Randomized Trials. Annals of internal medicine 2019, 171, 721–731. [Google Scholar] [CrossRef]
- Papier, K.; Knuppel, A.; Syam, N.; Jebb, S.A.; Key, T.J. Meat consumption and risk of ischemic heart disease: A systematic review and meta-analysis. Crit Rev Food Sci Nutr 2023, 63, 426–437. [Google Scholar] [CrossRef]
- Guasch-Ferré, M.; Satija, A.; Blondin, S.A.; Janiszewski, M.; Emlen, E.; O'Connor, L.E.; Campbell, W.W.; Hu, F.B.; Willett, W.C.; Stampfer, M.J. Meta-Analysis of Randomized Controlled Trials of Red Meat Consumption in Comparison With Various Comparison Diets on Cardiovascular Risk Factors. Circulation 2019, 139, 1828–1845. [Google Scholar] [CrossRef] [PubMed]
- O'Connor, L.E.; Kim, J.E.; Campbell, W.W. Total red meat intake of ≥0.5 servings/d does not negatively influence cardiovascular disease risk factors: a systemically searched meta-analysis of randomized controlled trials. The American journal of clinical nutrition 2017, 105, 57–69. [Google Scholar] [CrossRef]
- Asoudeh, F.; Talebi, S.; Jayedi, A.; Marx, W.; Najafi, M.T.; Mohammadi, H. Associations of Total Protein or Animal Protein Intake and Animal Protein Sources with Risk of Kidney Stones: A Systematic Review and Dose-Response Meta-Analysis. Advances in nutrition (Bethesda, Md.) 2022, 13, 821–832. [Google Scholar] [CrossRef]
- Cirone, C.; Cirone, K.D.; Malvankar-Mehta, M.S. Linkage between a plant-based diet and age-related eye diseases: a systematic review and meta-analysis. Nutrition reviews 2023, 81, 428–440. [Google Scholar] [CrossRef]
- An, R.; Liu, J.; Liu, R. Pork Consumption in Relation to Body Weight and Composition: A Systematic Review and Meta-analysis. American journal of health behavior 2020, 44, 513–525. [Google Scholar] [CrossRef] [PubMed]
- Farvid, M.S.; Sidahmed, E.; Spence, N.D.; Angua, K.M.; Rosner, B.A.; Barnett, J.B. Consumption of red meat and processed meat and cancer incidence: a systematic review and meta-analysis of prospective studies. Eur J Epidemiol 2021, 36, 937–951. [Google Scholar] [CrossRef]
- Devall, M.; Dampier, C.H.; Eaton, S.; Ali, M.W.; Díez-Obrero, V.; Moratalla-Navarro, F.; Bryant, J.; Jennelle, L.T.; Moreno, V.; Powell, S.M.; Peters, U.; Casey, G. Novel insights into the molecular mechanisms underlying risk of colorectal cancer from smoking and red/processed meat carcinogens by modeling exposure in normal colon organoids. Oncotarget 2021, 12, 1863–1877. [Google Scholar] [CrossRef] [PubMed]
- Cross, A.J.; Sinha, R. Meat-related mutagens/carcinogens in the etiology of colorectal cancer. Environmental and molecular mutagenesis 2004, 44, 44–55. [Google Scholar] [CrossRef] [PubMed]
- Gamage, S.M.K.; Dissabandara, L.; Lam, A.K.; Gopalan, V. The role of heme iron molecules derived from red and processed meat in the pathogenesis of colorectal carcinoma. Critical reviews in oncology/hematology 2018, 126, 121–128. [Google Scholar] [CrossRef]
- Azadbakht, L.; Esmaillzadeh, A. Red meat intake is associated with metabolic syndrome and the plasma C-reactive protein concentration in women. The Journal of nutrition 2009, 139, 335–9. [Google Scholar] [CrossRef]
- Ley, S.H.; Sun, Q.; Willett, W.C.; Eliassen, A.H.; Wu, K.; Pan, A.; Grodstein, F.; Hu, F.B. Associations between red meat intake and biomarkers of inflammation and glucose metabolism in women. The American journal of clinical nutrition 2014, 99, 352–60. [Google Scholar] [CrossRef]
- Chaturvedi, P.; Kamat, P.K.; Kalani, A.; Familtseva, A.; Tyagi, S.C. High Methionine Diet Poses Cardiac Threat: A Molecular Insight. Journal of cellular physiology 2016, 231, 1554–61. [Google Scholar] [CrossRef] [PubMed]
- Helmus, D.S.; Thompson, C.L.; Zelenskiy, S.; Tucker, T.C.; Li, L. Red meat-derived heterocyclic amines increase risk of colon cancer: a population-based case-control study. Nutrition and cancer 2013, 65, 1141–50. [Google Scholar] [CrossRef]
- Le Marchand, L.; Hankin, J.H.; Pierce, L.M.; Sinha, R.; Nerurkar, P.V.; Franke, A.A.; Wilkens, L.R.; Kolonel, L.N.; Donlon, T.; Seifried, A.; Custer, L.J.; Lum-Jones, A.; Chang, W. Well-done red meat, metabolic phenotypes and colorectal cancer in Hawaii. Mutation research 2002, 506-507, 205–14. [Google Scholar] [CrossRef]
- Nöthlings, U.; Yamamoto, J.F.; Wilkens, L.R.; Murphy, S.P.; Park, S.Y.; Henderson, B.E.; Kolonel, L.N.; Le Marchand, L. Meat and heterocyclic amine intake, smoking, NAT1 and NAT2 polymorphisms, and colorectal cancer risk in the multiethnic cohort study. Cancer epidemiology, biomarkers & prevention : a publication of the American Association for Cancer Research, cosponsored by the American Society of Preventive Oncology 2009, 18, 2098–106. [Google Scholar]
- Tiemersma, E.W.; Voskuil, D.W.; Bunschoten, A.; Hogendoorn, E.A.; Witteman, B.J.; Nagengast, F.M.; Glatt, H.; Kok, F.J.; Kampman, E. Risk of colorectal adenomas in relation to meat consumption, meat preparation, and genetic susceptibility in a Dutch population. Cancer causes & control : CCC 2004, 15, 225–36. [Google Scholar]
- Gore, F.M.; Bloem, P.J.; Patton, G.C.; Ferguson, J.; Joseph, V.; Coffey, C.; Sawyer, S.M.; Mathers, C.D.J.T.L. Global burden of disease in young people aged 10–24 years: a systematic analysis. 2011, 377, 2093–2102. [Google Scholar] [CrossRef] [PubMed]
- Ioannidis, J.P.; Patsopoulos, N.A.; Evangelou, E. Uncertainty in heterogeneity estimates in meta-analyses. BMJ (Clinical research ed.) 2007, 335, 914–6. [Google Scholar] [CrossRef] [PubMed]
- Sterne, J.A.; Sutton, A.J.; Ioannidis, J.P.; Terrin, N.; Jones, D.R.; Lau, J.; Carpenter, J.; Rücker, G.; Harbord, R.M.; Schmid, C.H.; Tetzlaff, J.; Deeks, J.J.; Peters, J.; Macaskill, P.; Schwarzer, G.; Duval, S.; Altman, D.G.; Moher, D.; Higgins, J.P. Recommendations for examining and interpreting funnel plot asymmetry in meta-analyses of randomised controlled trials. BMJ (Clinical research ed.) 2011, 343, d4002. [Google Scholar] [CrossRef]
- Lau, J.; Ioannidis, J.P.; Terrin, N.; Schmid, C.H.; Olkin, I. The case of the misleading funnel plot. BMJ (Clinical research ed.) 2006, 333, 597–600. [Google Scholar] [CrossRef] [PubMed]
- Moher, D.; Liberati, A.; Tetzlaff, J.; Altman, D.G.; Group, J.A.O.I.M.P.R.S.A. Preferred reporting items for systematic reviews and meta-analyses: the PRISMA statement. 2009, 151, 264–269. [Google Scholar] [PubMed]
- Herrmann, D.; Sinnett, P.; Holmes, J.; Khan, S.; Koller, C.; Vassar, M. Statistical controversies in clinical research: publication bias evaluations are not routinely conducted in clinical oncology systematic reviews. Annals of oncology : official journal of the European Society for Medical Oncology 2017, 28, 931–937. [Google Scholar] [CrossRef]
- Aromataris, E.; Fernandez, R.; Godfrey, C.M.; Holly, C.; Khalil, H.; Tungpunkom, P. ; Summarizing systematic reviews: methodological development, conduct and reporting of an umbrella review approach. International journal of evidence-based healthcare 2015, 13, 132–40. [Google Scholar] [CrossRef] [PubMed]
- Ioannidis, J.P. Integration of evidence from multiple meta-analyses: a primer on umbrella reviews, treatment networks and multiple treatments meta-analyses. CMAJ : Canadian Medical Association journal = journal de l'Association medicale canadienne 2009, 181, 488–93. [Google Scholar] [CrossRef] [PubMed]
- Foley, J.A.; Ramankutty, N.; Brauman, K.A.; Cassidy, E.S.; Gerber, J.S.; Johnston, M.; Mueller, N.D.; O’Connell, C.; Ray, D.K.; West, P.C.J.N. Solutions for a cultivated planet. 2011, 478, 337–342. [Google Scholar] [CrossRef]
- Springmann, M.; Wiebe, K.; Mason-D, D.; Sulser, T.B.; Rayner, M.; Scarborough, P. Health and nutritional aspects of sustainable diet strategies and their association with environmental impacts: a global modelling analysis with country-level detail. The Lancet. Planetary health 2018, 2, e451–e461. [Google Scholar] [CrossRef]
- Recommendations, C.P. 2023. Available online: https://www.aicr.org/resources/media-library/10-cancer-prevention-recommendations/.
- International, W.C.R.F. 2023. Available online: https://www.wcrf.org/diet-activity-and-cancer/cancer-prevention-recommendations/.
- Kushi, L.H.; Doyle, C.; McCullough, M.; Rock, C.L.; Demark-Wahnefried, W.; Bandera, E.V.; Gapstur, S.; Patel, A.V.; Andrews, K.; Gansler, T.J.C.A.C.J.F.C. American Cancer Society Guidelines on nutrition and physical activity for cancer prevention: reducing the risk of cancer with healthy food choices and physical activity. 2012, 62, 30–67. [Google Scholar] [CrossRef] [PubMed]
- Zhu, B.; Sun, Y.; Qi, L.; Zhong, R.; Miao, X. Dietary legume consumption reduces risk of colorectal cancer: evidence from a meta-analysis of cohort studies. Scientific reports 2015, 5, 8797. [Google Scholar] [CrossRef] [PubMed]
- Li, J.; Mao, Q.Q. Legume intake and risk of prostate cancer: a meta-analysis of prospective cohort studies. Oncotarget 2017, 8, 44776–44784. [Google Scholar] [CrossRef] [PubMed]
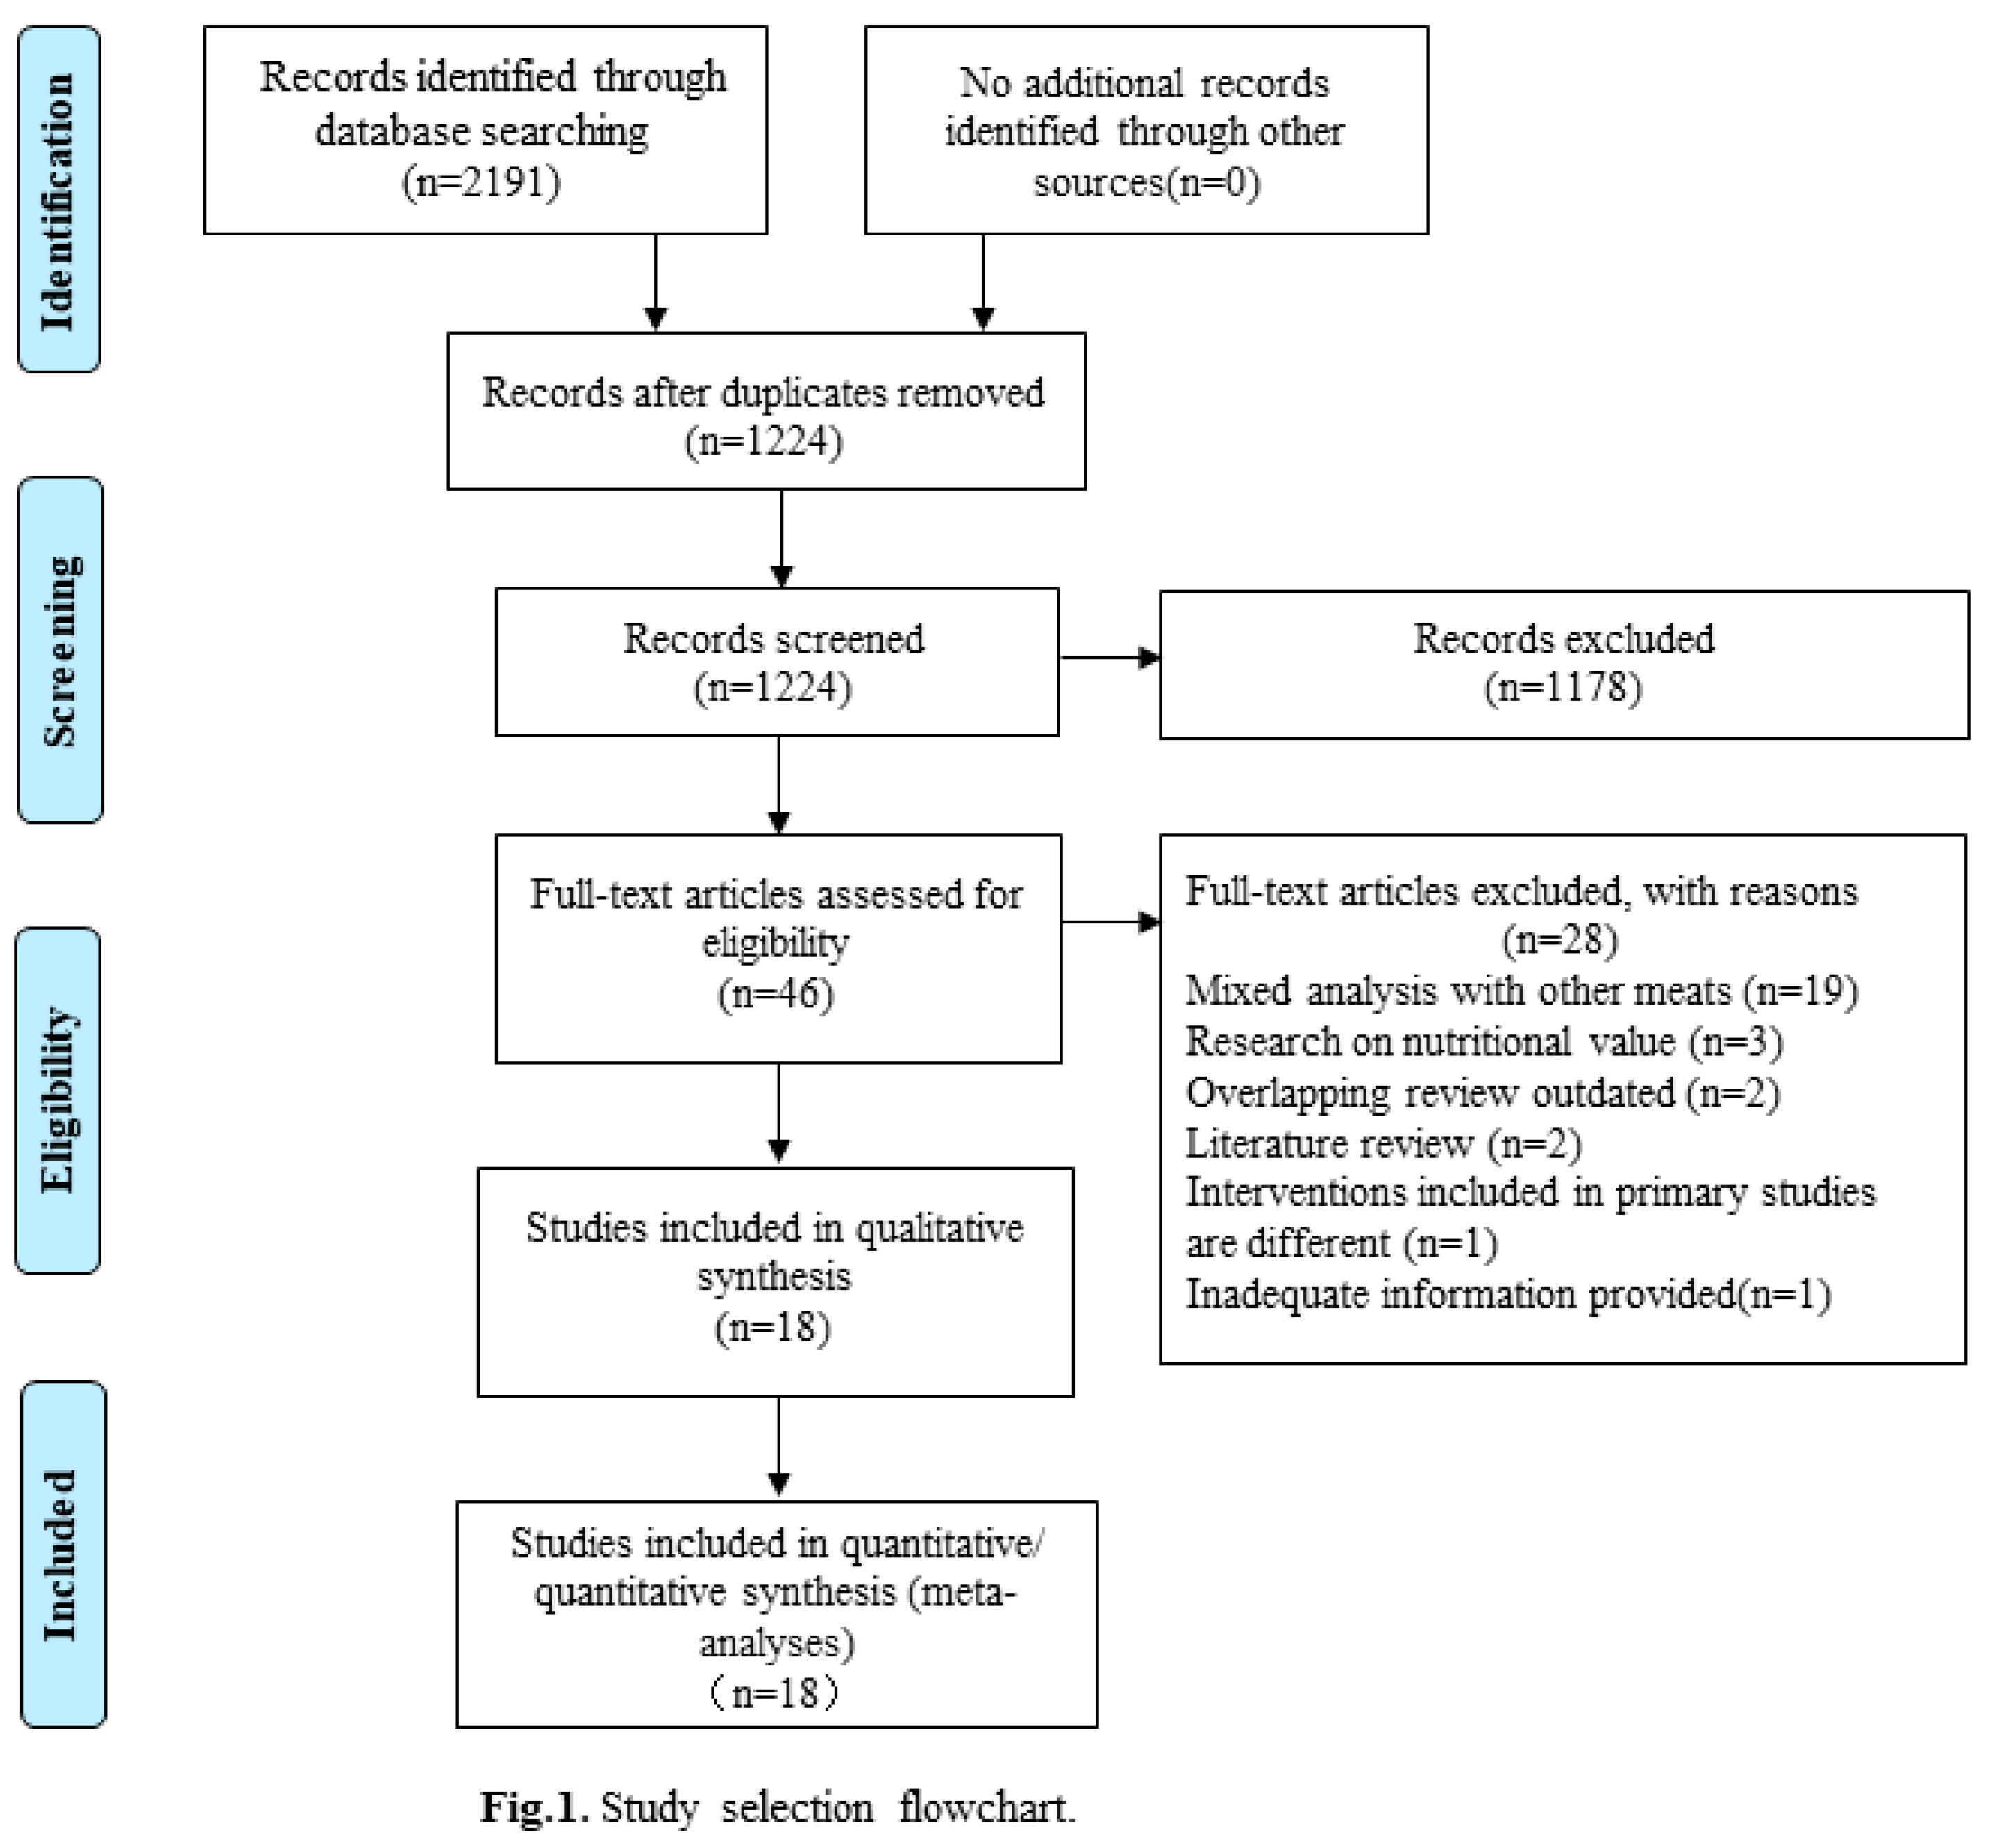
Figure 2.
Coincidence rate of AMSTAR2 items included in SRs/MAs.
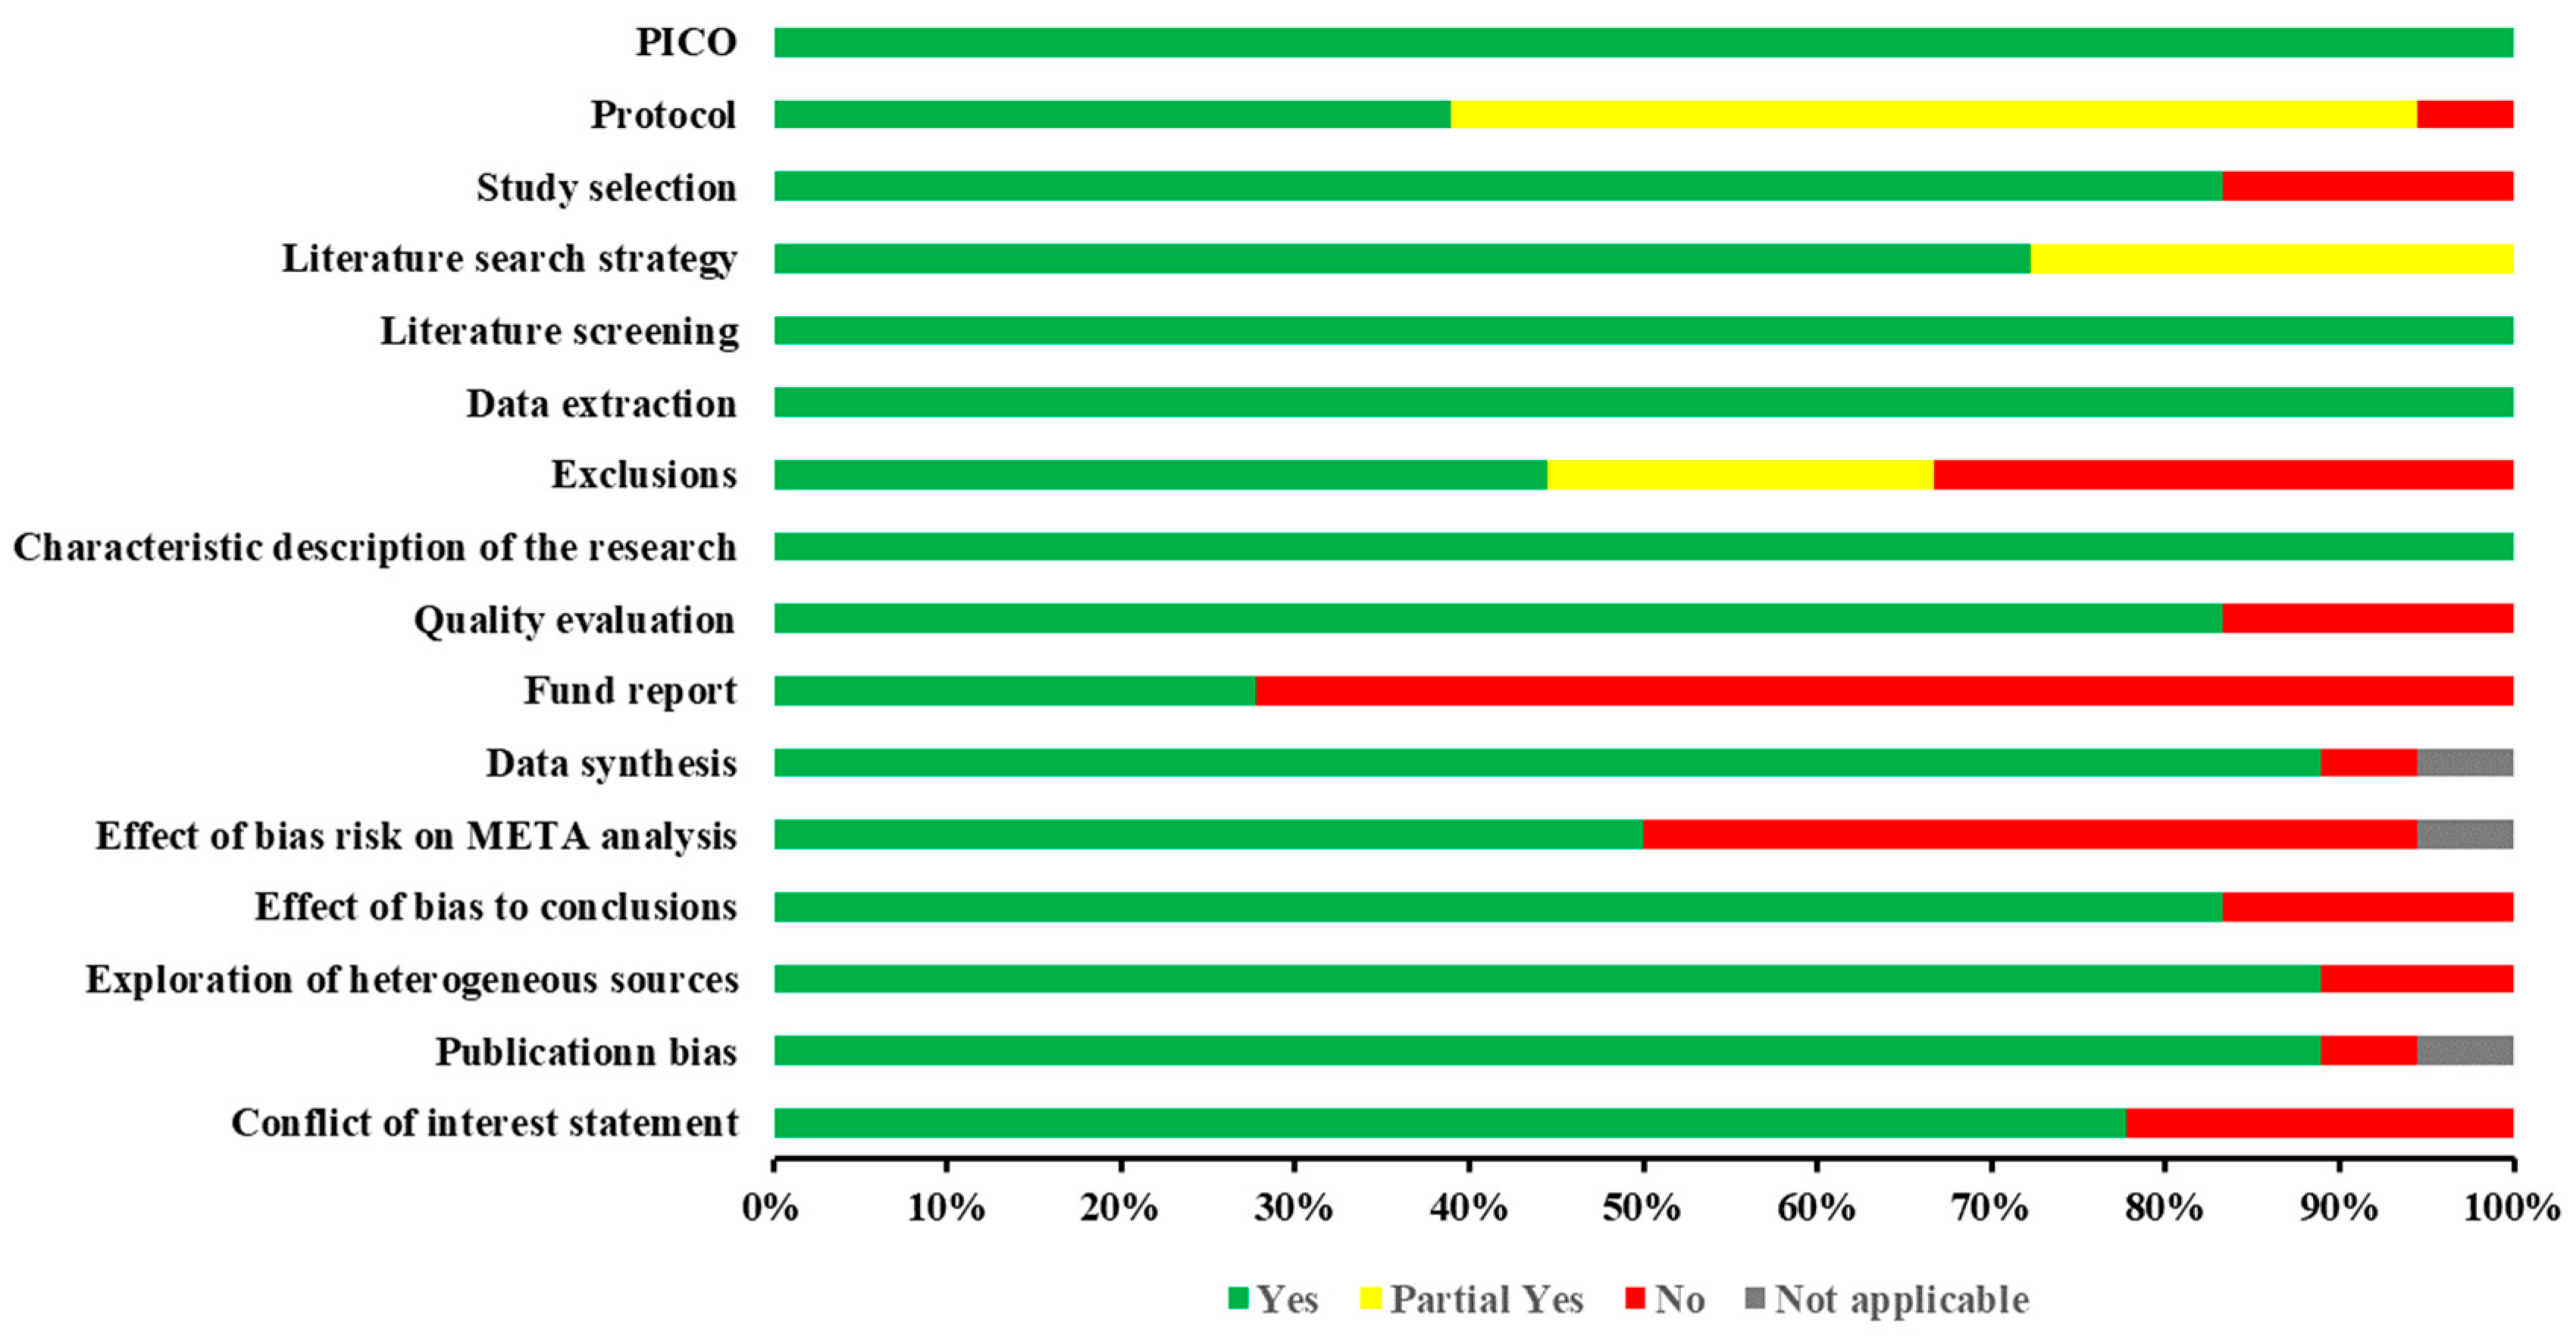
Figure 3.
Forest plot of red meat intake and risk of rectal cancer.
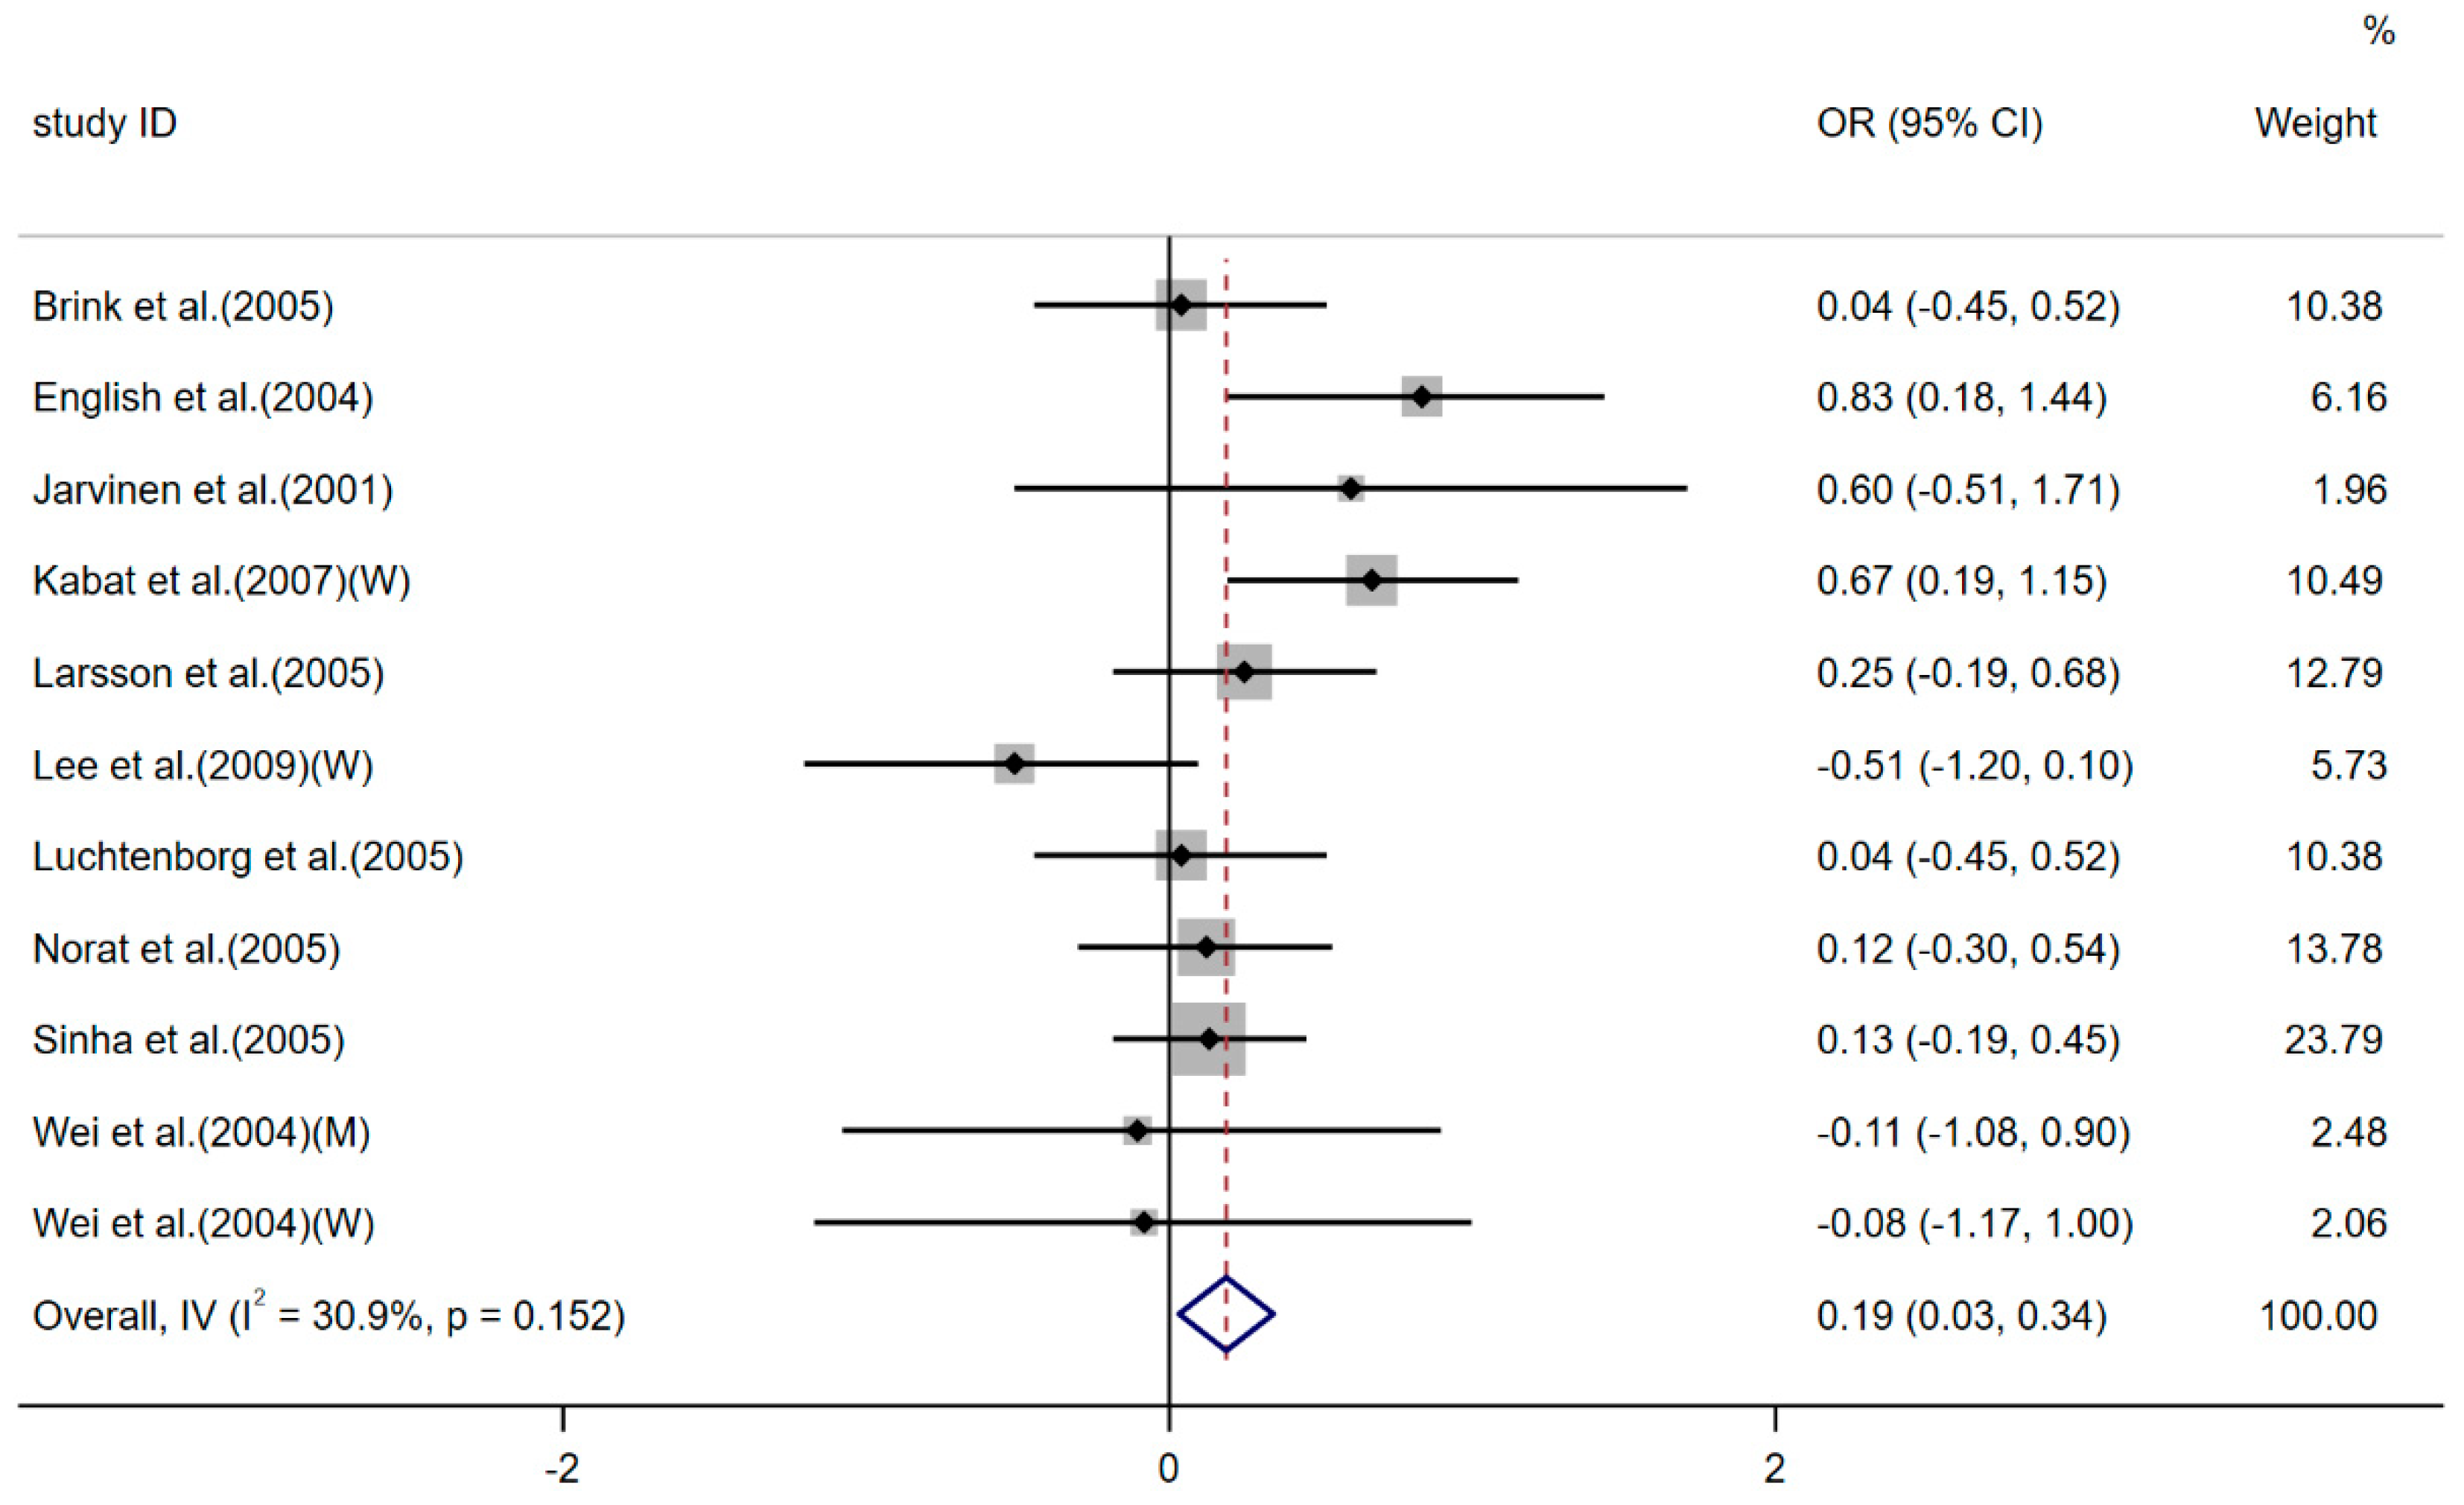
Figure 4.
Funnel plot of meat consumption and risk of rectal cancer.
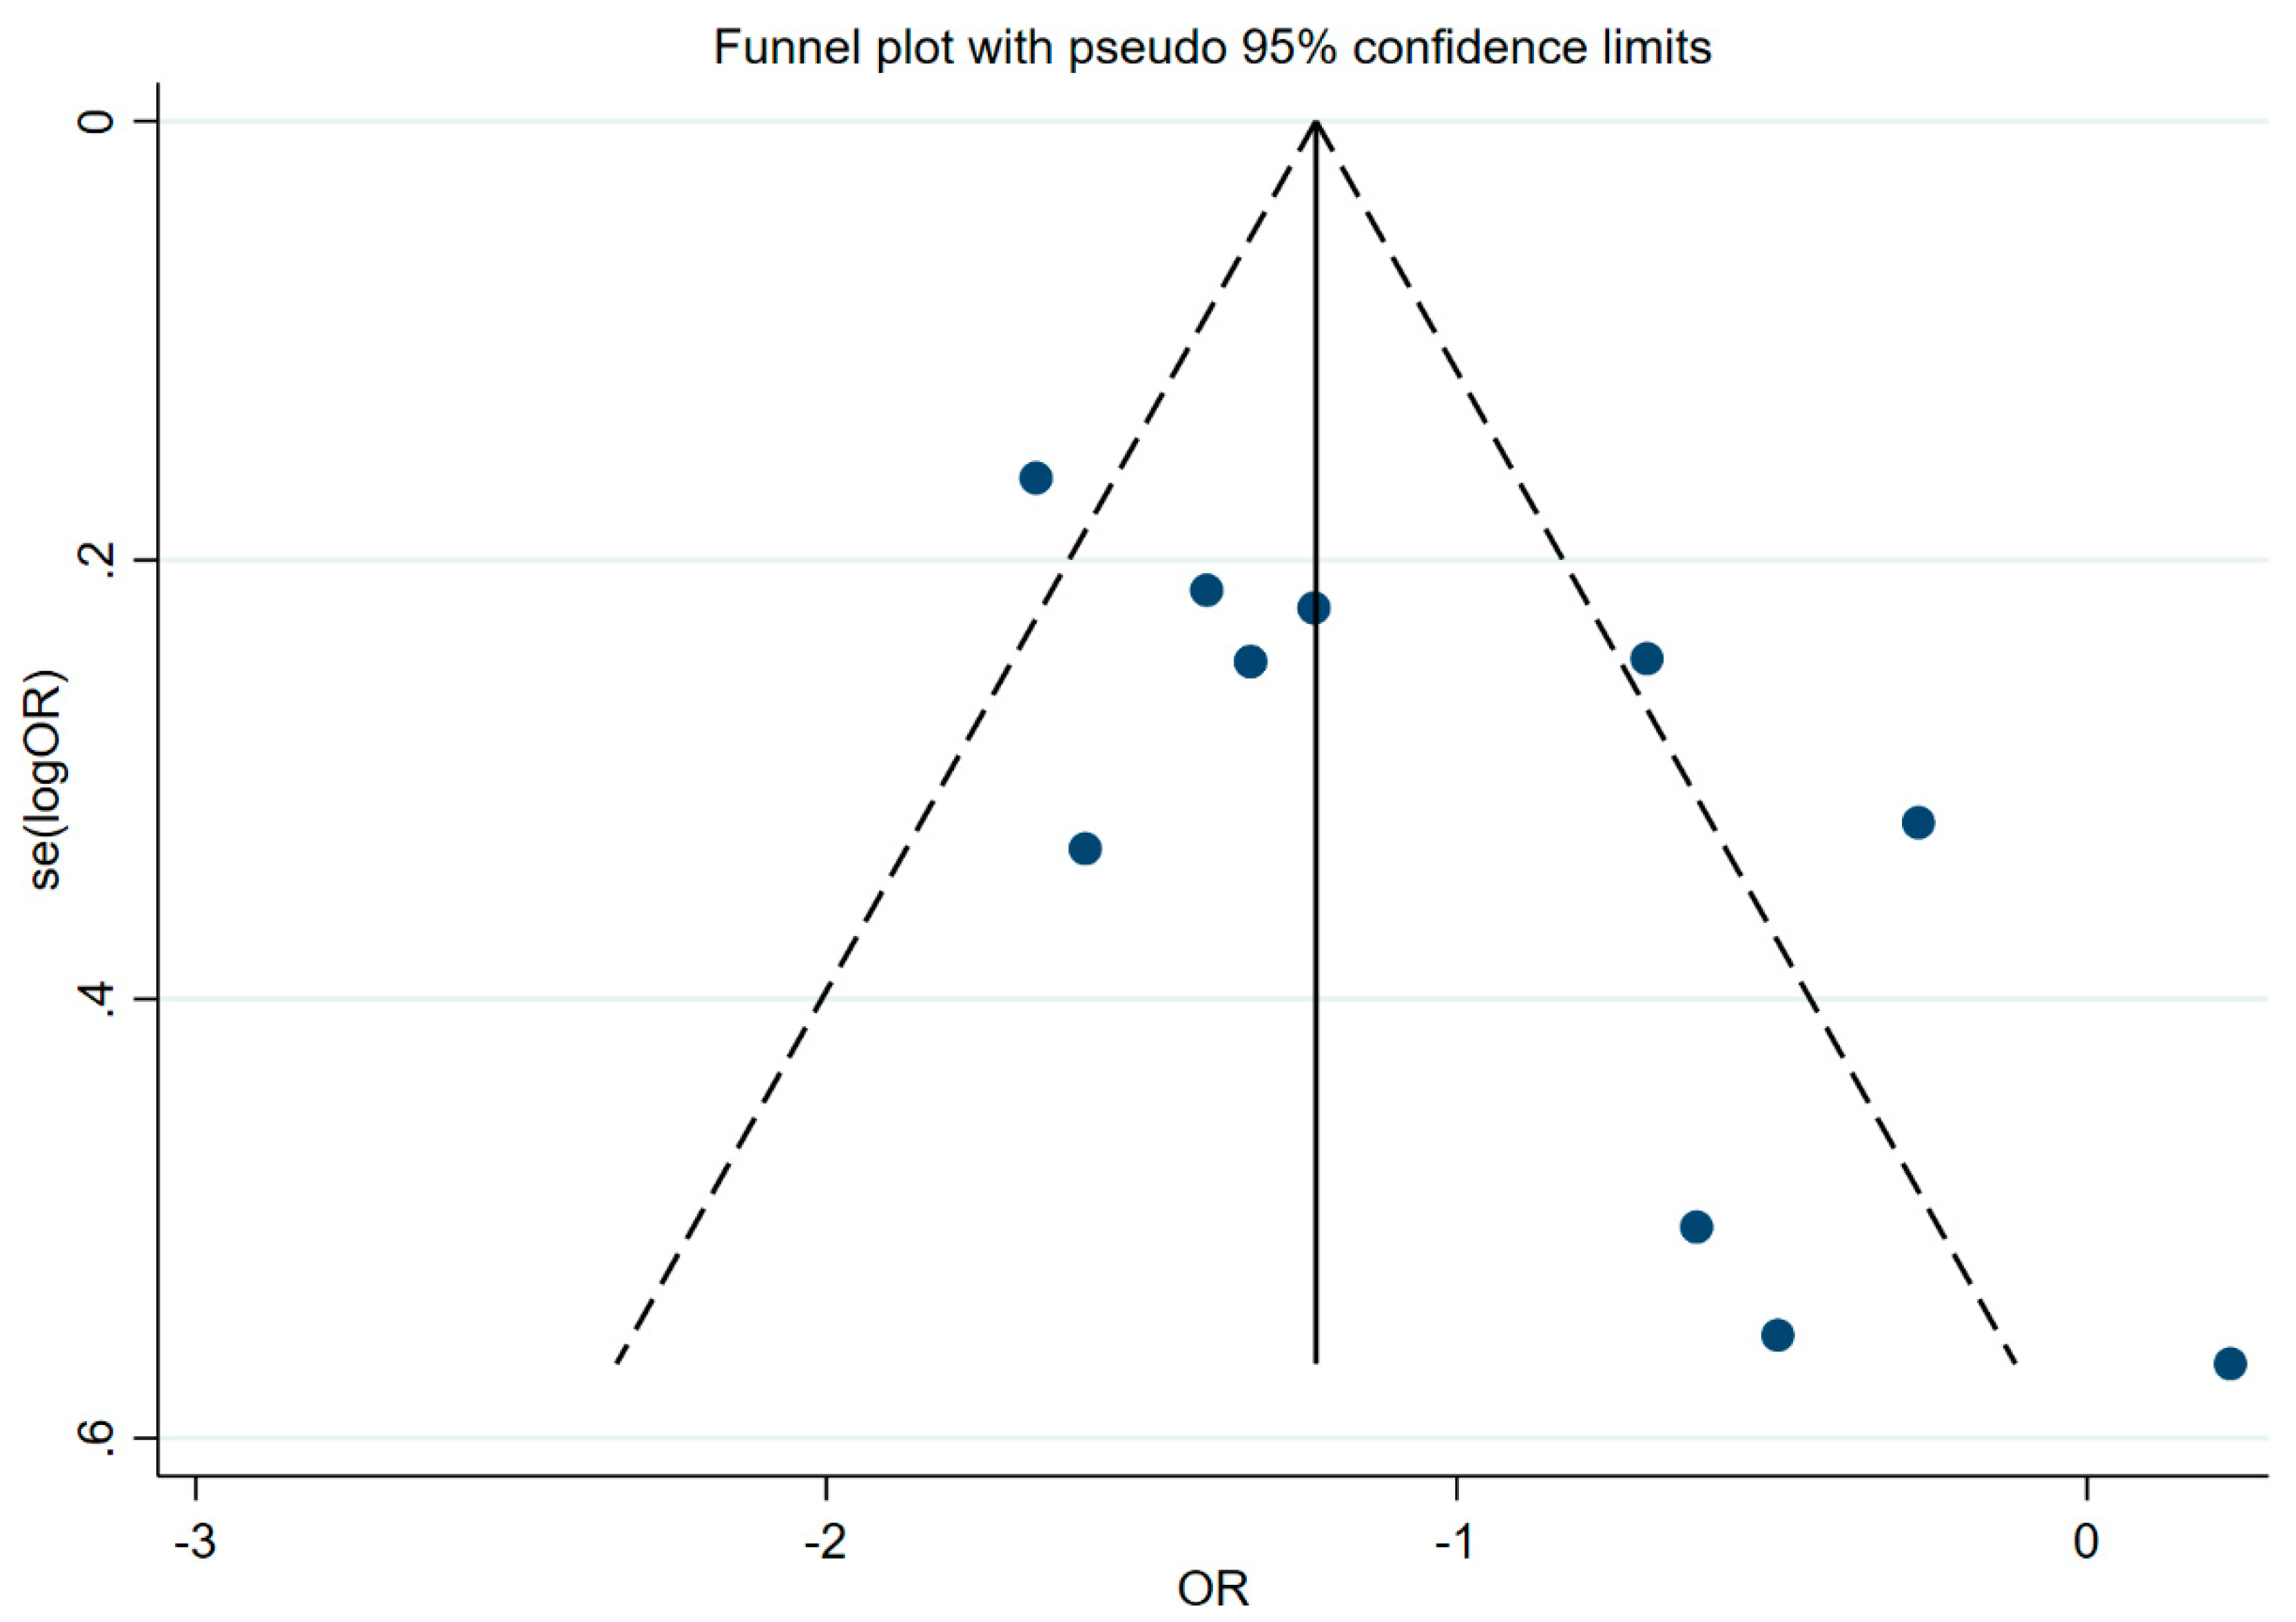

Table 1.
Basic characteristics of the systematic reviews and meta-analyses included in the review.
| Study ID | Study design | Number of participants | Study population | Intervention/Exposure | Control | Bias risk assessment tool | Outcomes | Type of metrics | Correction factor | Publication bias test | AMSTAR2 | ||
|---|---|---|---|---|---|---|---|---|---|---|---|---|---|
| country/region | age | follow-up | |||||||||||
| Alexander 2011[33] | PCS, NCCS | 25(-) | North America, Europe, Asia | - | - | The highest intake of red meat | Lowest category of red meat intake (include no red meat consumption) | - | Incidence of colorectal cancer | SRRE | total energy, body mass index (BMI), physical activity, alcohol, history of disease, education, income (socioeconomic status) | funnel plot | Critically Low |
| Smolińska 2010[34] | CCS, PCS | 22(-) | Britain, Spain, Switzerland, The Netherlands, Sweden, France, Italy, Australia, Canada | 30-80 age | - | Intake of red meat≥50g/day; Intake of red meat >1 times /day | Eat no more than 50g of red meat a day;Intake of red meat≤1 times/day | - | Incidence of colorectal cancer | RR | - | - | Critically Low |
| Song 2014[35] | CCS, PCS | 18(1,228,327) | Europe, North America, South America, Asia | - | 6.5-18 years | The highest intake of red meat | Lowest category of red meat intake (may include no red meat consumption) | NOS | Incidence of gastric cancer | SRRE | body mass index (BMI), total energy, smoking, vegetable intake | funnel plot, Egger’ stest, Begg’s test | Moderate |
| Jalal 2021[36] | PCS, NCC | 22(2,345,839) | Netherlands,UK,China,France,Italy,USA,Sweden, | 21-90 age | - | The highest intake of red meat | Lowest category of red meat intake (include no red meat consumption) | NOS | breast cancer | RR | Adjusted | Begg’s test, Egger’s test | Low |
| Fallahzadeh 2014[37] | CCS, PCS | 11(27,505) | Europe, USA, Canada | - | - | High intake of red meat (at least 1 serving per week) | Low intake of red meat (less than 1 serving per week) | - | Incidence of non-Hodgkin's lymphoma | OR | age, sex, body mass index (BMI) | funnel plot | Low |
| Kaluza 2012[38] | PCS | 5(329,495) | Europe, USA, Japan | - | - | Increase your red meat intake by one serving a day; One serving equals 100 to 120 g of fresh red meat | - | - | Stroke incidence | RR | sex and age, type and type of red meat consumption, stroke subtype | Egger’ stest | Moderate |
| Yang 2016[39] | PCS | 7(2,079,236) | America, Sweden, China, Japan | 30-83 age | 8-26 years | The highest intake of red meat | Lowest category of red meat intake (include no red meat consumption) | NOS | Stroke risk, stroke mortality | RR | age, smoking, fish, fruits, vegetables, body mass index and history of disease | Egger’ stest, Begg’s test | Critically Low |
| Gidyenne 2022[40] | PCS | 8(612,248) | USA, Japan, Spanish, China, Columbia, Sweden | 29-79 age | 7.6-30 years | The highest intake of red meat | Lowest category of red meat intake (include no red meat consumption) | NOS | the risk of total stroke incidence, (the risk of ischemic stroke incidence, the risk of Hemorrhagic stroke Mortality) | RR | age (in months), calendar time, body mass index (BMI), physical activity, smoking status, alcohol intake | - | Low |
| O'Connor 2020[41] | RCT | 24(1368) | USA, Australia, Iran, Denmark, China, Spain, Canada, Norway, Netherlands | ≥19 age | - | Red meat | Alternatives to red meat | NHLBI | GlycemicControl; Inflammatory Biomarkers | WMD | - | funnel plot, Egger’ stest, Begg's test | HIgh |
| Pan 2011[42] | PCS | 9 (4,033,322) | USA | 20 years old or more | 14 -28 years | Fresh red meat 100g/ day; | blank | - | Incidence of type 2 diabetes | HR | - | funnel plot, Egger’ stest, Begg’s test | Moderate |
| Rui Zhang 2021[43] | PCS | 14(724352) | Europe USA Asia,China,Dutch,Singapore,Spain,Finland,France,Japan,Sweden | 18-90 age | 5-28 years | The highest intake of red meat | Lowest category of red meat intake (include no red meat consumption) | NOS | Incidence of type 2 diabetes | RR | gender, location, follow-up, sample size, case | Egger’s test, Funnel plots | Low |
| Zeraatkar 2019[44] | RCT | 12(48,835) | Australia, France, Brazil, the United States, Israel | 22.4-70.9 age | - | High intake of red meat (at least 1 serving per week) | Low intake of red meat (less than 1 serving per week) | ROB | All-cause mortality, cardiovascular mortality | HR | - | - | High |
| Keren 2021[45] | PCS | 12(34,949) | USA,UK,Japan,China,Denmark | - | - | The highest intake of red meat | Lowest category of red meat intake (include no red meat consumption) | NOS | ischemic heart disease | RR | age, sex, smoking, relative weight, other dietc, location, study center (random effect), wealth index | Funnel plots, Egger’s test | High |
| Guasch-Ferré 2019[46] | RCT | 36(1,803) | Europe, United States | 18 years old or more | - | Red meat | A combination of alternatives to red meat | NHLBI | Total blood cholesterol levels, LDL cholesterol levels, HDL cholesterol levels, triglyceride levels, etc | WMD | - | funnel plot, Egger’ stest, Begg's test | High |
| O'Connor 2017[47] | RCT | 24(-) | USA | 19 years old or more | - | Total red meat≥0.5 servings (35 grams or 1.25 ounces) per day | Eat less than 0.5 servings (35 grams or 1.25 ounces) of red meat per day | ROB | Total blood cholesterol levels,LDL cholesterol levels, HDL cholesterol levels, triglyceride levels, etc | WMD | age, sex, body mass index (BMI), duration of intervention, total energy | - | Moderate |
| Farzaneh Asoudeh 2022[48] | POS | 5(251,742) | UK, USA | 20-75 age | 6-26 years | The highest intake of red meat | Lowest category of red meat intake (include no red meat consumption) | NOS | risk of kidney stones | RR | body mass index (BMI), alcohol consumption, smoking | Begg’s test, Egger’s test | High |
| Cristina 2022[49] | CCS | 8(62438) | Australia and New Zealand;United Kingdom;Iceland;Netherlands;United States | 10-70 age | - | Red meat | Low intake of red meat (less than 1 serving per week) | NOS | age-related eye disease | OR | - | funnel plot | Low |
| An 2020[50] | RCT, PCS | 12(41478) | USA, Australia, Netherlands, Denmark, Canada, China, Belgium, Germany Poland | 18-70 age | - | Pork meat | Other foods (such as chicken) | NIHSS, ROB | Body weight, Lean mass, Body fat percentage, Fat mass, Overweight, Obesity | β, OR | - | Egger’ stest, Begg's test | Low |
NHLBI represents the National Heart, Lung, and Blood Institute’s Quality Assessment of Controlled Interventions Studies; NOS represents the Newcastle Ottawa scale; ROB represents the Cochrane Collaboration Risk Assessment tool; NIHSS represents the National Institutes of Health’s Quality Assessment Tool; - not reported; RCT Randomized Controlled Trial; CCS case control study; PCS prospective cohort study; NCCS nested case-control study; SRREs summary relative risk estimates; RR relative risk; OR odd ratio; HR hazard ratio ; WMD weighted mean difference.
Table 2.
Summary of meta-analysis results for red meat intake and human health outcomes.
| Study ID | Human health outcomes | Type of metrics | Summary effect size (95%Cl) | Model | P value | I2(P value) | Egger's P value | Statistically significant |
|---|---|---|---|---|---|---|---|---|
| Smolińska 2010[34] | Incidence of colon cancer | RR | 1.21 (1.07, 1.37) | Random | - | - | - | Yes |
| Song 2014[35] | Incidence of gastric cancer | SRREs | 1.37(1.18, 1.59) | Random | P < 0.05 | 67.6% (0.001) | 0.52 | Yes |
| Jalal 2021[36] | Effect of red meat intake on breast cancer | RR | 1.05(1.00, 1.11) | Random | P = 0.03 | 52% | 0.022 | No |
| Fallahzadeh 2014[37] | the risk of non-Hodgkin’s lymphoma | OR | 1.10(1.02, 1.19) | Random | P = 0.01 | 59.4% (0.001) | Publication bias based on funnel plot was not significant | Yes |
| the subtype of diffuse large B-cell lymphoma | OR | 1.20(1.04, 2.37) | Random | P = 0.05 | 74.9% (0.001) | - | Yes | |
| Kaluza 2012[38] | Relative risks of total incident stroke and stroke mortality | RR | 1.11(1.03, 1.20) | Random | - | 0%(0.65) | 0.76 | Yes |
| O'Connor 2020[41] | blood glucose concentration | WMD | 0.040(-0.049, 0.129) | Random | P > 0.05 | 68% | P > 0.05 | No |
| blood insulin concentration | WMD | -0.710(-6.582, 5.162) | Random | P > 0.05 | 28% | P > 0.05 | No | |
| HOMA-IR | WMD | 0.11(-0.072, 0.293) | Random | P > 0.05 | 64% | P > 0.05 | No | |
| C-reactive protein | WMD | 2.424(-1.460, 6.309) | Random | P > 0.05 | 27% | P > 0.05 | No | |
| Pan 2011[42] | Incidence of type 2 diabetes | RR | 1.19(1.04, 1.37) | Random | P < 0.001 | 93.3% (0.001) | 0.35 | Yes |
| Zeraatkar[44] | all-cause mortality | HR | 0.99(0.95, 1.03) | Random | P > 0.05 | - | - | No |
| cardiovascular mortality rate | HR | 0.98(0.91, 1.06) | Random | P > 0.05 | - | - | No | |
| cardiovascular disease | HR | 0.99(0.94, 1.05) | Random | P > 0.06 | - | - | No | |
| Keren 2021[45] | ischemic heart disease | RR | 1.09(1.06, 1.12) | Random | NA | 41.3% (0.04) | 0.7 | Yes |
| Guasch-Ferré 2019[46] | total cholesterol | WMD | 0.264(0.144, 0.383) | Random | P < 0.001 | - | P > 0.05 | Yes |
| triglyceride concentrations | WMD | -0.181(-0.349, -0.013) | Random | P = 0.035 | - | P > 0.05 | Yes | |
| LDL cholesterol | WMD | 0.198(0.065, 0.330) | Random | P = 0.003 | - | P > 0.05 | Yes | |
| HDL cholesterol | WMD | -0.065(-0.109, -0.020) | Random | P = 0.004 | - | P > 0.05 | Yes | |
| Farzaneh Asoudeh 2022[48] | risk of kidney stones | RR | 1.02(1.91, 1.15) | Random | NA | 81.1% (0.00) | 0.01 | No |
| Cristina 2022[49] | age-related eye disease | OR | 1.41(1.07, 1.86) | Random | NA | 83.8% (0.000) | Publication bias based on funnel plot was not significant | Yes |
| An 2020[50] | Overweight | OR | 0.89(0.48, 1.64) | Random | P > 0.05 | 64% | - | No |
| Obesity | OR | 1.06(0.30, 3.71) | Random | P > 0.05 | 81% | - | No | |
| In experimental studies that did not limit total daily energy intake | ||||||||
| Body weight | β | -0.86(-1.55, -0.17) | Random | P < 0.05 | 0% | - | Yes | |
| Body fat percentage | β | -0.77(-1.43, -0.11) | Random | P < 0.05 | 90.40% | - | Yes | |
| Lean mass | β | 1.79(-1.74, 5.32) | Random | P > 0.05 | 98.40% | - | No | |
| In experimental studies that restricted energy intake | ||||||||
| Body weight | β | -5.56(-10.59, -0.55) | Random | P < 0.05 | 98.70% | - | Yes | |
| Lean mass | β | -1.50(-1.62, -1.39) | Random | P < 0.05 | 0% | - | Yes | |
| Fat mass | β | -6.6(-6.79, -6.42) | Random | P < 0.05 | 0% | - | Yes | |
SRREs summary relative risk estimates; RR relative risk; OR odd ratio; HR hazard ratio; WMD weighted mean difference; - not reported.
Disclaimer/Publisher’s Note: The statements, opinions and data contained in all publications are solely those of the individual author(s) and contributor(s) and not of MDPI and/or the editor(s). MDPI and/or the editor(s) disclaim responsibility for any injury to people or property resulting from any ideas, methods, instructions or products referred to in the content. |
© 2023 by the authors. Licensee MDPI, Basel, Switzerland. This article is an open access article distributed under the terms and conditions of the Creative Commons Attribution (CC BY) license (https://creativecommons.org/licenses/by/4.0/).
Copyright: This open access article is published under a Creative Commons CC BY 4.0 license, which permit the free download, distribution, and reuse, provided that the author and preprint are cited in any reuse.


