Introduction
In today’s development, robotics is playing an increasingly important role in research. Our modern robotic systems are constantly evolving and exploring new areas of application. As a result, these systems are becoming larger and more sophisticated. However, as new areas of application emerge, individual robotic systems are increasingly reaching their limits. Attempts have been made to overcome this situation by developing even more complex or larger robotic systems, but this approach requires immense costs and complexity in implementation. Therefore, new concepts are increasingly being explored in these peripheral areas. One of these concepts is the field of swarm robotics.
Swarm robotics refers to the use of multiple small, simple robots working together to perform complex tasks. This technology leverages the benefits of collective intelligence and self-organization to address problems that would be too difficult or impossible for a single robot to solve. Unlike conventional robotic systems, which often rely on centralized control and strong interaction with humans, swarm robots can work independently and quickly respond to changes in their environment [
1].
In order for humans to interact with these systems, the field of human-swarm interaction has emerged. Human-swarm interaction refers to the way in which humans can interact with a group of robots. Research is being conducted on Human-Swarm Interfaces (HSI) to facilitate this interaction. As mentioned earlier, the goal of swarm robotics is to accomplish complex tasks through collective intelligence and self-organization. Therefore, the question arises as to why and, more importantly, how an interaction from human to robot could take place, even though the aim is to move away from centralized control by humans as much as possible.
Such interventions in the autonomy of the swarm are necessary when drastic changes in its behavior are desired, which initially contradict its internal organizational algorithms [
2]. It is important to note that humans can only tolerate a limited cognitive load, within which they can give meaningful commands to robots or the swarm [
2]. Therefore, it is often more sensible not to give commands to individual individuals, but to transmit a task directly to the swarm. The swarm can then self-organize and coordinate its individuals to solve the task. However, human intervention in the autonomy of the swarm is desired or even necessary in certain situations. Immature algorithms or challenging environments can put individual robots in a deadlock
1. The human must then intervene and free the respective robot from the situation with new instructions [
3].
Now the question remains as to what such an interface could look like. With the advent of augmented reality and other new technologies, new possibilities for human-swarm interaction are emerging. In this context, the question arises about the performance of these interfaces based on these new technologies for human-swarm interaction. In this work, a comparison was made between a VR-HSI and a conventional desktop-HSI to determine which option is better suited. For this purpose, an existing simulation was extended with a network interface to enable basic data exchange between the HSI and the simulation. Both the VR-HSI and the desktop-HSI were developed from scratch as part of this work and form the technical framework for future work.
The aim is to evaluate the impact of using a VR environment on the interaction with a swarm of robots. In this context, the use of a traditional graphical interface is compared with a virtual reality app, and it is evaluated by participants from a sample size in terms of efficiency, accuracy, and usability.
1. Related Work
Over the years, several models have emerged on how robot swarms can self-organize to achieve the desired level of autonomy. In the survey by Mills, Kevin L. [
4], models from biology and physics are particularly highlighted. Social interactions among individual entities such as birds, insects, and fish, which exhibit significantly more complex behavior as a swarm than individually, are also examined.
In this work, UAVs (Unmanned Aerial Vehicles) utilize potential fields for navigation. Each UAV has its own potential field in its environment, and it navigates towards the direction with the lowest potential. In the work by Wong, Tsuchiya, and Kikuno [
5], this technique is adapted and applied to swarms. Instead of external forces being exerted on the participants by the environment, the participants themselves (sensors) generate forces. Each sensor in this model exerts a certain force on the other participants (Virtual Force).
Another model, which is also partially implemented in this work, deals with the social interaction of individuals, specifically the organization of ant colonies. When a worker ant discovers food, it releases pheromones that mark the path from the nest to the food for other worker ants [
6]. It can be observed that not all worker ants respond to the pheromone. Some ants deliberately ignore this signal and follow their own paths. This behavior increases the colony’s chance of finding food, as one of these ants may also stumble upon food and mark it with a pheromone trail [
7]. The UAVs in this work also imitate this concept. The UAVs decide for themselves whether they want to remain on their current path or initiate exploratory behavior.
When delving deeper into swarm robotics, it quickly becomes apparent that there is an exceptionally high level of military interest in this research field. Military organizations, in particular, allocate significant research funding to this topic. This interest is justified, among other reasons, by the low production costs and good scalability of such systems. The paper by Zhu Xiaoning [
8] provides a more in-depth discussion of the use of UAV swarms in a military context.
Augmented Reality (AR) offers users an even deeper immersion in interacting with the swarm. AR can be used in areas such as control and visualization. Both application areas draw from concepts and techniques that are continuously being researched. This work, for example, utilizes human pointing models [
9], which associate human psychomotor behavior with marking a point in the virtual world, similar to a cursor on traditional computers. Another way of inputting commands is through human gestures. Gestures can be captured by the computer and converted into specific commands. A work from China [
10] focuses on the development of gesture control in the AR sector. A HoloLens continuously tracks the user’s hand and reproduces it as a digital clone in the virtual environment. With this virtual hand, the user can precisely select drones using a lasso tool.
Aamodh Suresh and Mac Schwager go even further and describe in their work a technical implementation of a Brain-Swarm Interface (BSI) [
11]. In this case, the user interacting with the swarm wears an EEG headset to measure their brain waves. The headset also has sensors to detect the user’s gaze direction. With these data, Suresh and Schwager are able to control the robot swarm rudimentarily and simultaneously based on the user’s brain activity. Techniques from the fields of neuroscience, signal processing, machine learning, and control theory were applied for the implementation.
2. Methodology
To answer the previous questions, a user experiment will be conducted using both HSIs as the basis. Before the actual user experiment can take place, both the VR-HSI and the Desktop-HSI need to be developed. The simulation of the swarm is already realized through an existing simulation software, but the simulation needs to be equipped with a necessary network interface to enable interaction with the HSIs. The requirements for the technology are that both HSIs can visualize the internal information of the swarm in their own way. The VR-HSI can also incorporate external information into the visualization that is unknown to the swarm. Both HSIs can process simple inputs to manipulate the swarm and communicate them to the simulation.
To measure the performance of both interfaces, participants from a sample need to complete a predefined mission using each interface. Afterwards, participants need to answer a questionnaire specific to each HSI. Metrics from two categories will be applied in the evaluation. The Performance category includes metrics such as effectiveness, accuracy, and response time, which have a measurable impact on the usability and performance of the respective HSI. The User Experience category includes metrics such as user-friendliness, immersion, and workload, which represent a subjective assessment by the participants and have an indirect influence on performance [
12].
The collected data will be analyzed in Chapter 10 using well-known statistical significance tests to compare the differences in the respective metrics. The metrics of both HSIs will be compared individually as well as examined for mutual influence. The result should provide an assessment of the performance of each HSI.
Implementation
3. The Simulator
The technical framework consists of a simulator specialized in simulating UAVs. This simulator was developed in Python based on the work [
13] and provides a two-dimensional simulation environment. In this environment, any number of UAVs can be deployed to locate disasters in the simulation area. Various initial conditions and settings can be defined through the
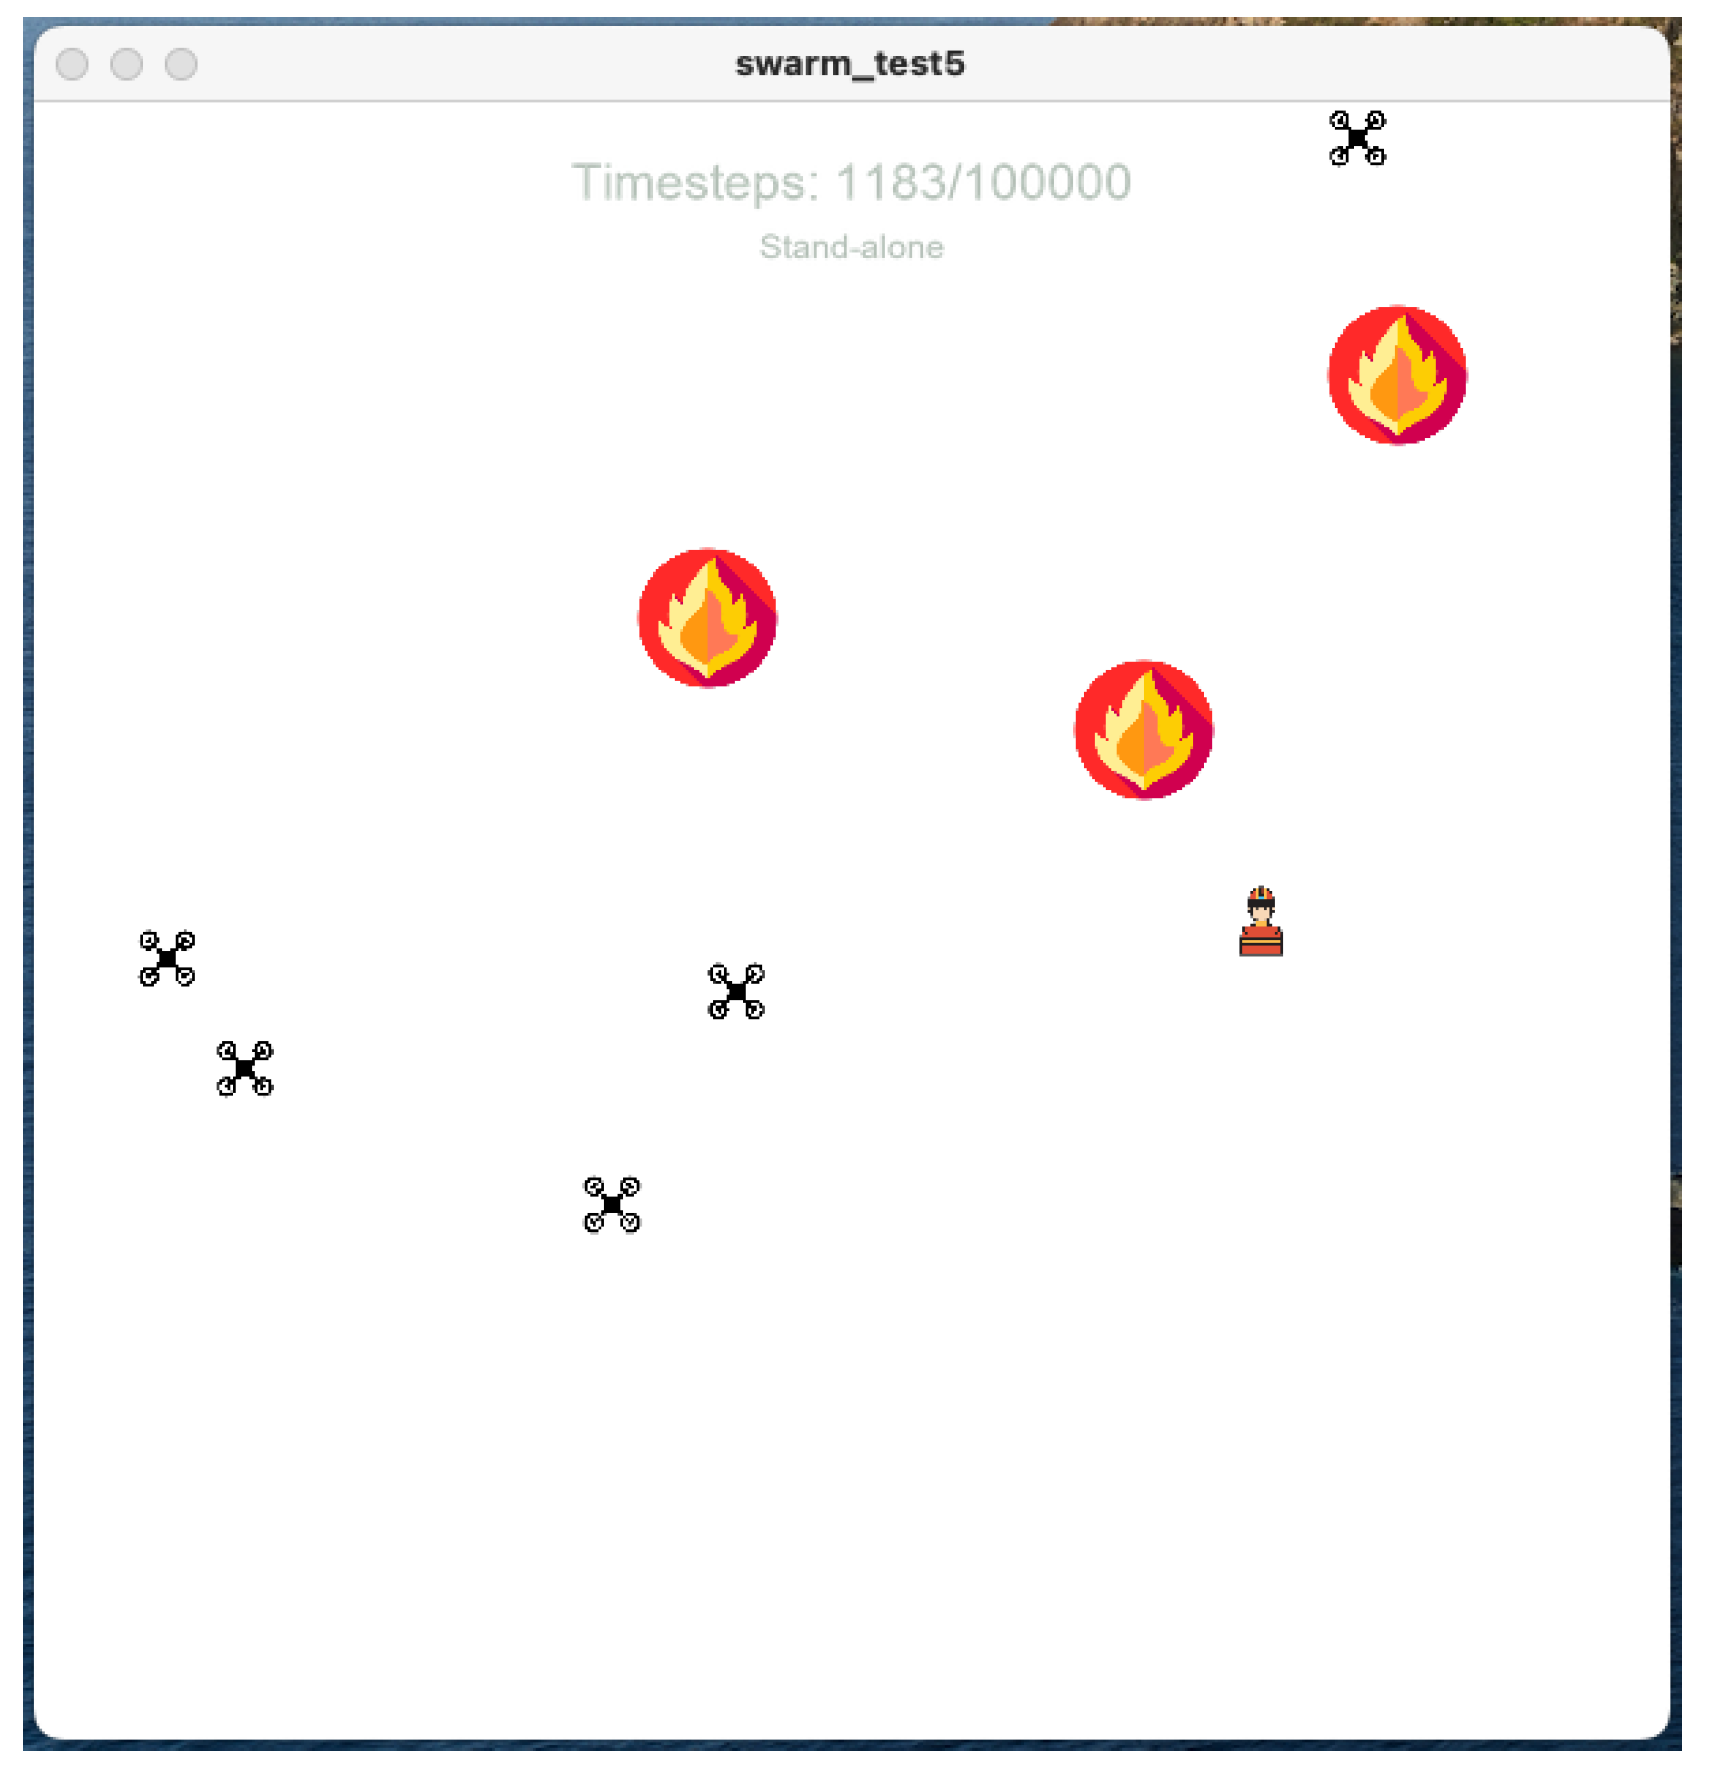
init.py file. During the simulation, the simulator executes multiple ticks per second, which perform several tasks. These tasks include updating the positions of UAVs, belief and confidence maps, as well as the positions of disasters and operators. The simulator allows for simulating different scenarios and testing the performance of UAVs in various situations. The simulation environment takes into account various factors such as obstacles, transmission disruptions, and moving disasters.
Figure 1.
Screenshot of the simulator described in [
13].
Figure 1.
Screenshot of the simulator described in [
13].
3.1. Belief Map
The belief map is a heatmap that stores information about detected disasters and response teams. When the information is current, it is marked with a value of 1 on the map. However, this information loses its trustworthiness with each tick, so the value is decreased every second by a constant decay value until it reaches 0 [
13]. Each UAV and human operator has its own belief map.
3.2. Confidence Map
The confidence map is a heatmap used to monitor UAV activities in the simulation environment. It marks areas in the heatmap with a value of 1 where the information about that area is maximally high. It allows tracking the progress of exploration efforts and identifying areas that have not been explored yet. Furthermore, the confidence map can be used to infer the positions of individual UAVs. Areas with high values indicate that UAVs are currently or have recently been present there. It is important to note that, similar to the belief map, the values in the confidence map decrease over time with the decay value, minimizing the information content [
13]. Each UAV and human operator has its own confidence map.
4. The Swarm Algorithm
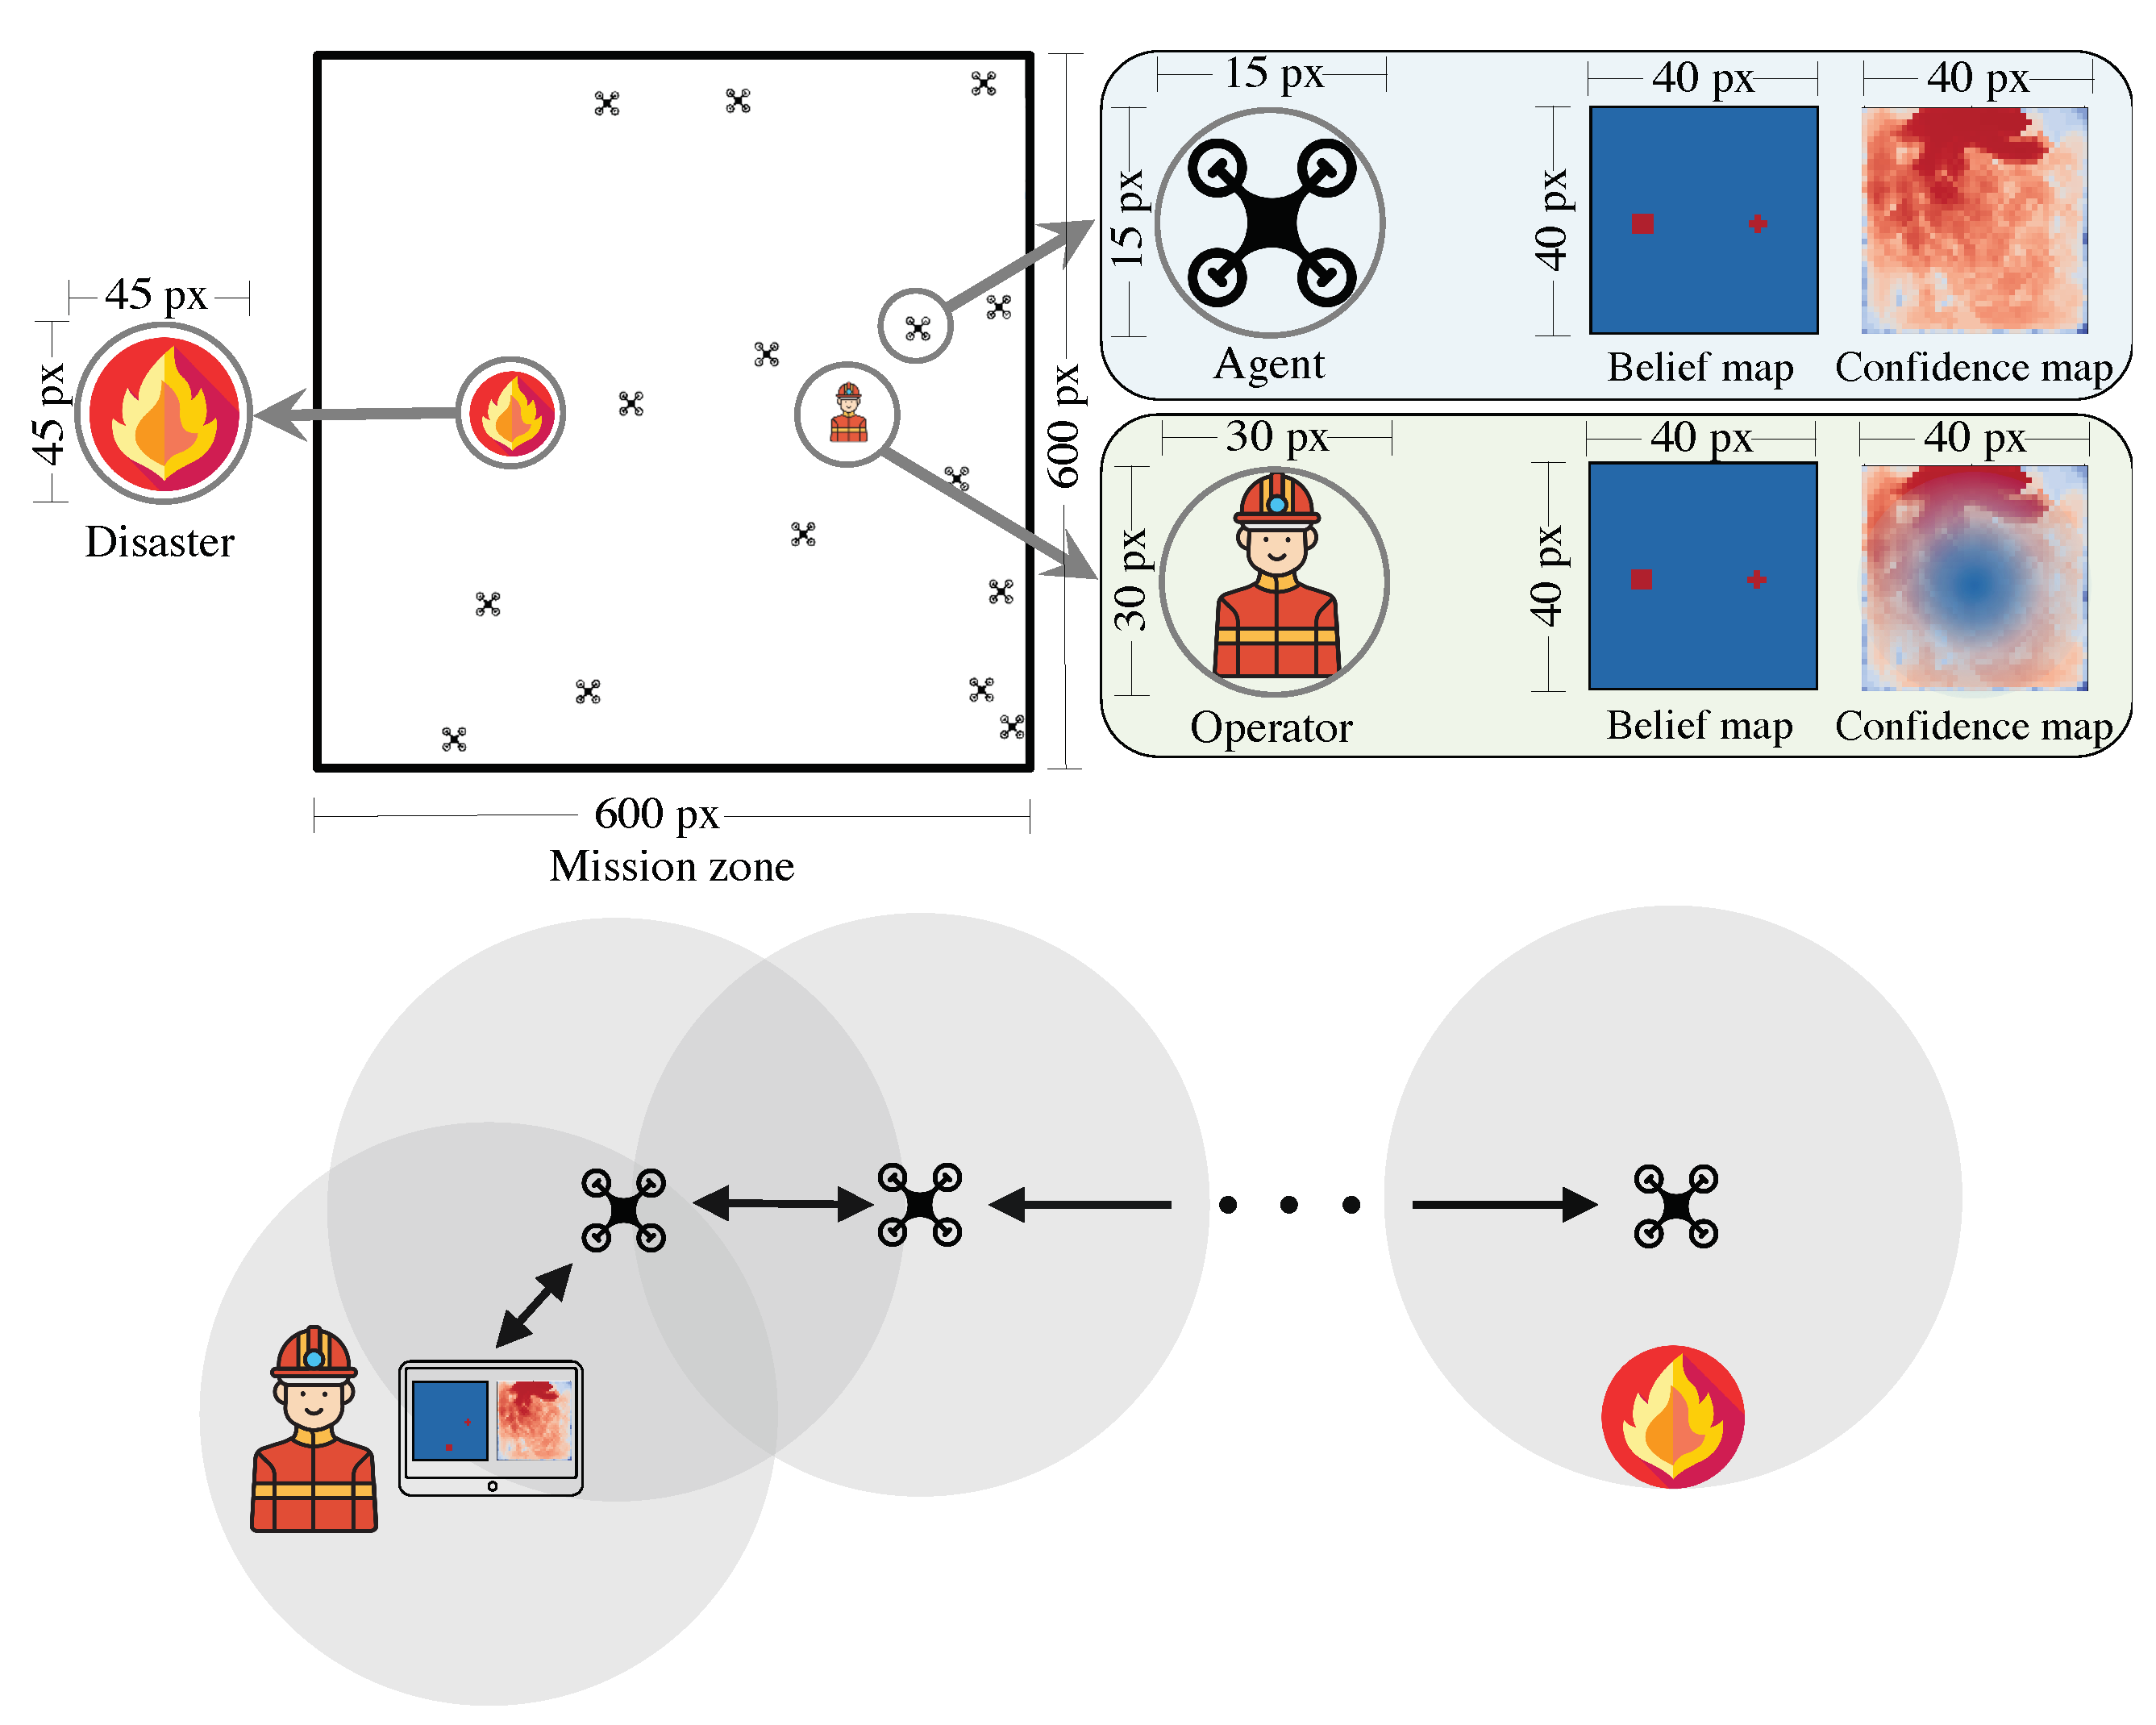
When UAVs or UAVs and HSIs have a certain distance between them, they can exchange data locally and update their perception of the environment (see
Figure 3). In both maps (belief and confidence maps), only the latest information is stored, and outdated information is deleted. The algorithm determines that UAVs, similar to a potential field, always navigate towards the regions with the least known or outdated information according to their confidence map. This allows UAVs to "refresh" outdated or missing information by collecting new data about those regions. Additionally, UAVs can also choose a random flight pattern to perform additional exploratory behavior.
Figure 3.
A map of a mission area with UAVs, a disaster, and a human operator. All agents (UAVs and the operator) have belief and confidence maps with a lower resolution (40 × 40) compared to the actual images (600 × 600). The operator uses the interface to communicate with the UAVs in its local neighborhood. This is a direct copy from [
13].
4.1. Exploratory Behavior
To apply the concept of pheromone trails in ant colonies [
7] to our UAVs, the algorithm from [
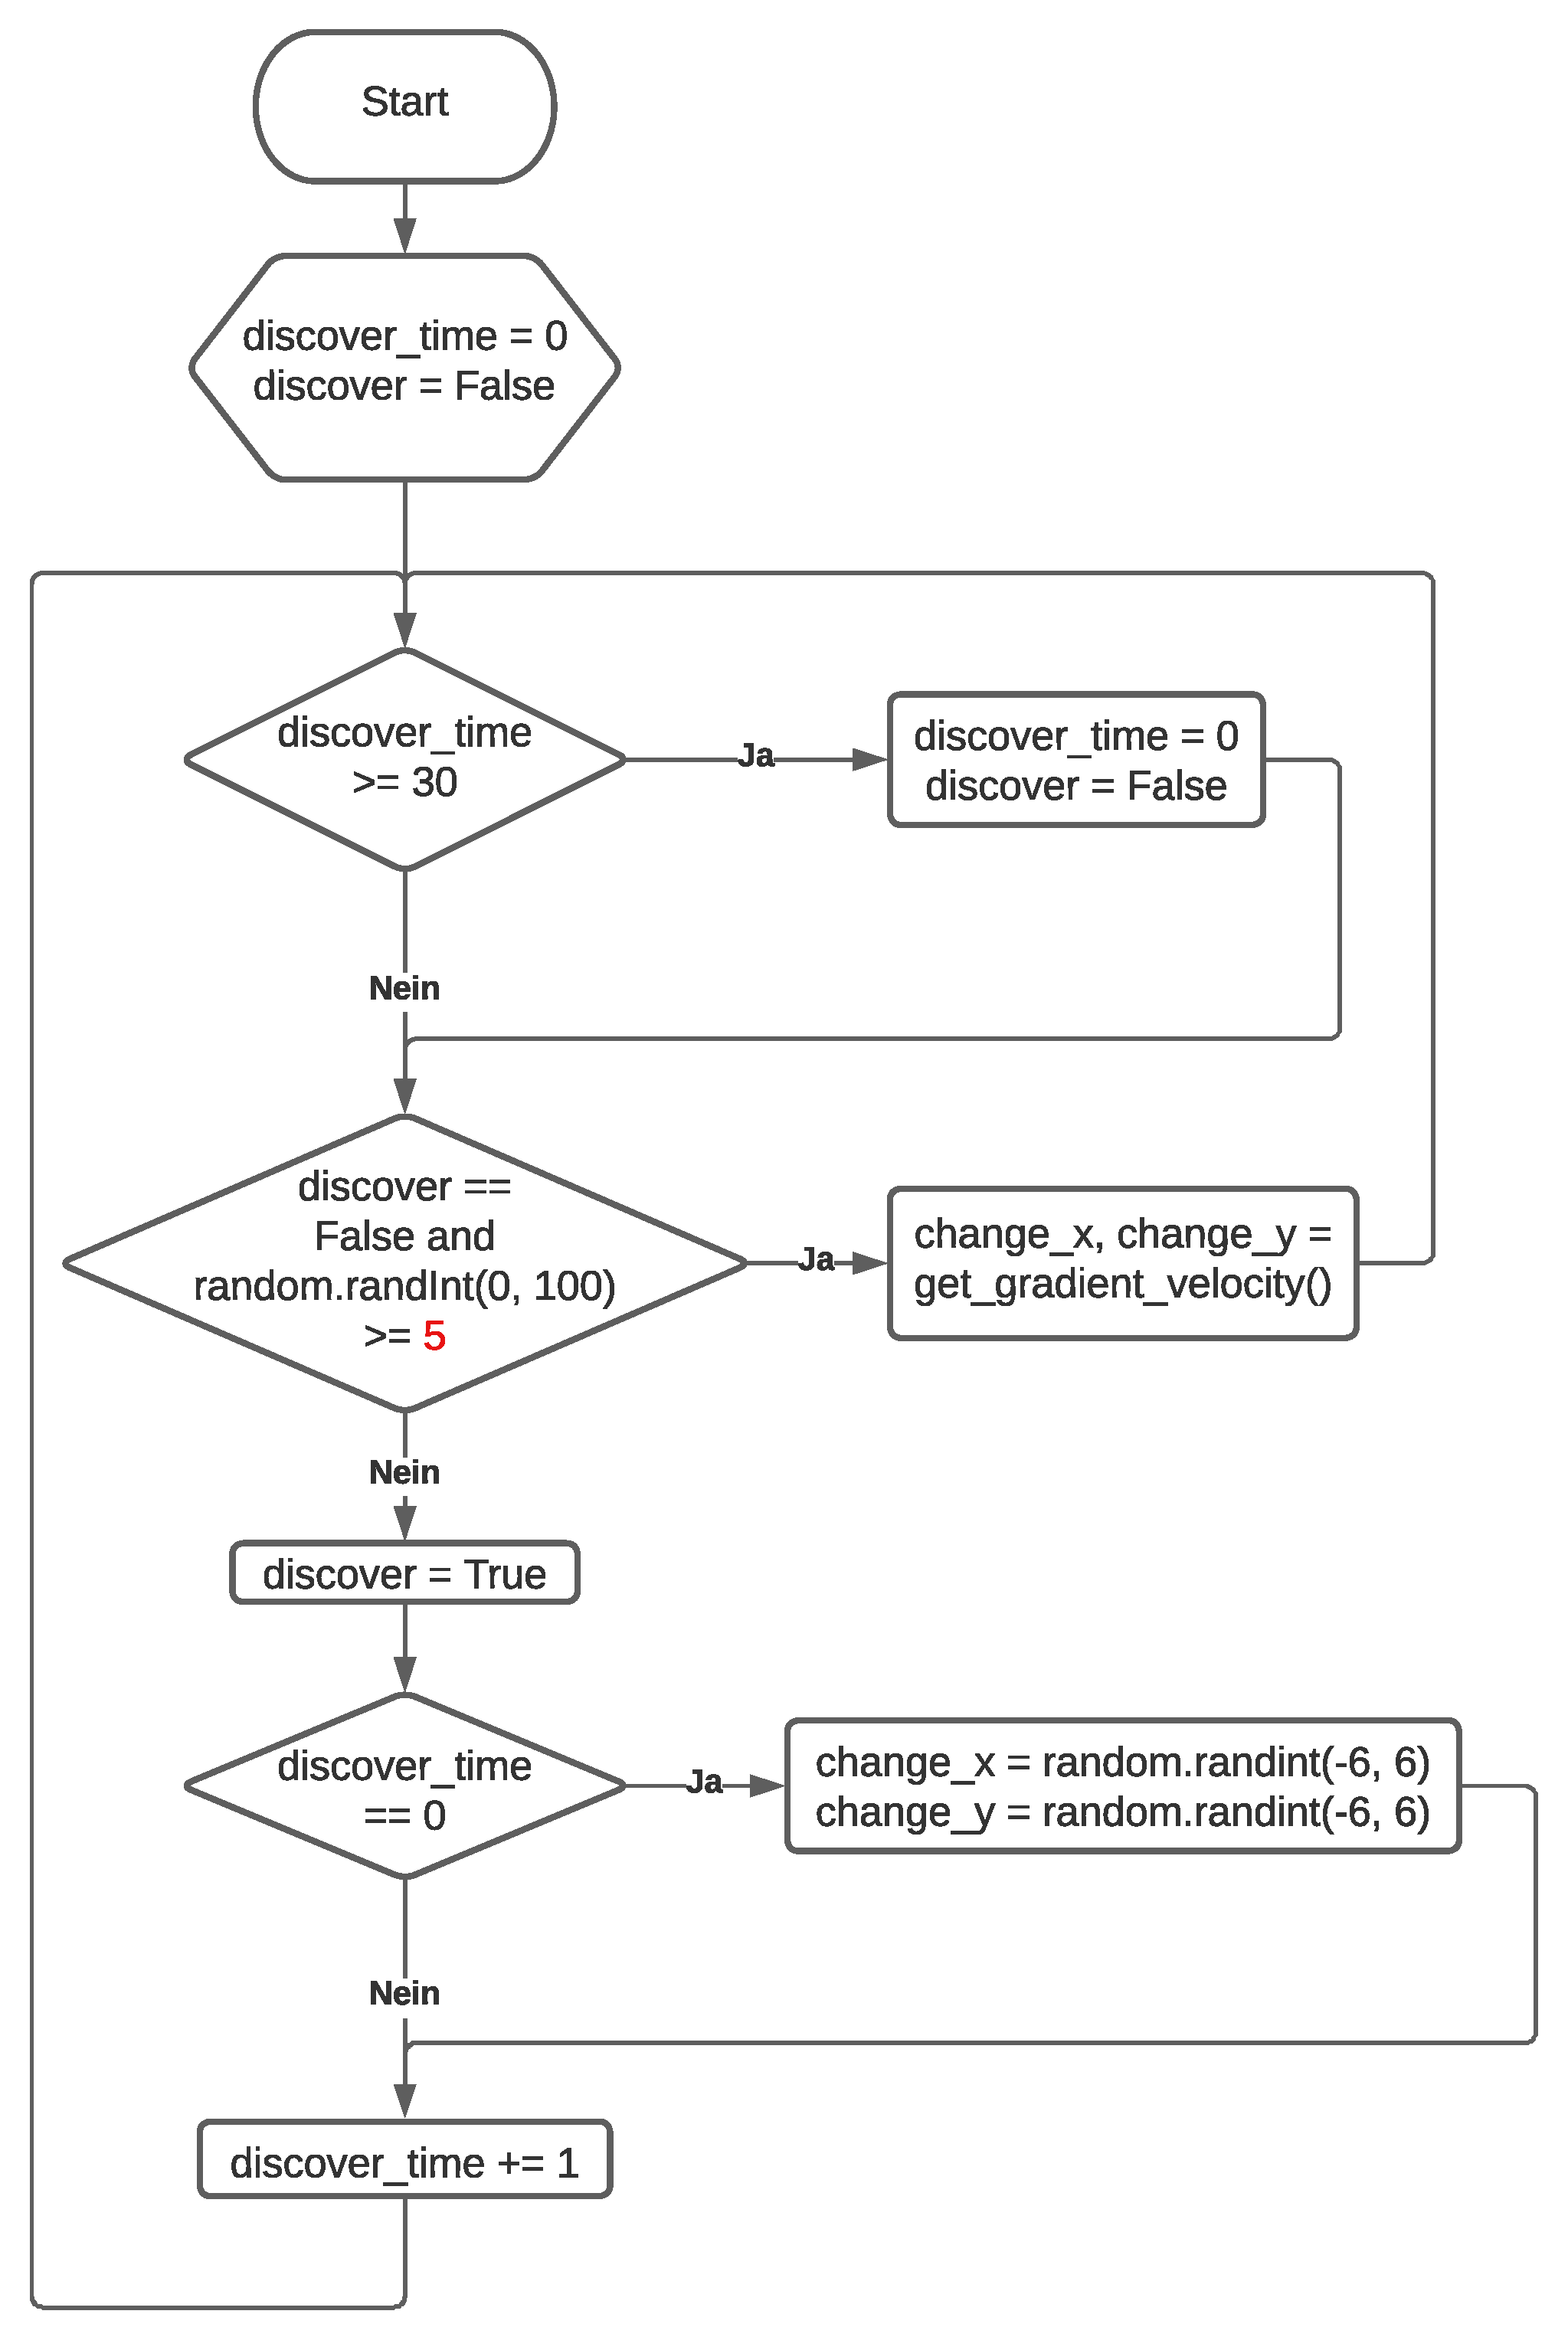
13] was slightly modified. In addition to the already implemented random flight behavior of the UAVs, a straight random flight behavior was implemented. The implementation can be found in the flowchart in
Figure 4. Based on a predetermined probability (indicated by a red number in
Figure 4), it is decided whether the new flight direction will be randomly determined for the next 30 steps. Afterward, the UAV can decide whether to follow its own exploratory behavior patterns or apply linear exploratory behavior again.
Figure 4.
Flowchart for the exploratory behavior algorithm.
Figure 4.
Flowchart for the exploratory behavior algorithm.
5. Network Interface
To enable data exchange between the simulation software and the used HSI system, a network interface has been integrated into the simulation software. The interface can be activated if necessary by using the startup parameter -exp_type unity_network. The simulation starts only when the interface has established a connection to the network interface. Subsequently, data from the simulation is shared over the network with each tick. Additionally, commands can now be transmitted from the interface to the simulation over the network. This extension enables the exchange of data and information between the simulation software and the HSI system.
To ensure smooth transmission, ports 5500 (UDP) and 65432 (TCP) need to be open.
5.1. UDP Packets
Once all events within the simulation are completed after a tick, all relevant information for the HSI is retrieved and prepared for network transmission.
Table 1 provides an overview of all parameters that are shared over the network.
Table 1.
List of all parameters transmitted over UDP by the network interface after each tick.
Table 1.
List of all parameters transmitted over UDP by the network interface after each tick.
| Parameter |
Description |
| drones |
The number of all UAVs in the current simulation |
| drones_x |
An array with all current X positions of the respective UAVs |
| drones_y |
An array with all current Y positions of the respective UAVs |
| humans |
The number of all human operators in the current simulation |
| humans_x |
An array with all current X positions of the human operators |
| humans_y |
An array with all current Y positions of the human operators |
| health |
The average health of all UAVs |
| known_drones |
The number of UAVs detected by the swarm |
| disaster |
An array with the positions of all disasters in the current simulation |
| internal_map |
The internal belief map of the human operator |
| confidence_map |
The internal confidence map of the human operator |
To ensure a disturbance-free network connection and reliable data transmission, the UDP protocol was chosen at this point. Unlike the TCP protocol, it does not check whether all data packets have reached the destination. This approach is justifiable in this case because the high frequency of ticks and thus sent data packets can compensate for any missing packets due to the large number of subsequent ticks. This allows for faster and more efficient data transmission and ensures smooth and delay-free simulation. The parameters marked in blue represent internal information. These are pieces of information available to the swarm. The other parameters pertain to the representation of the simulation in the respective HSI, providing external information accessible to the user but not the swarm algorithms. This is necessary as the current implementation is limited to the simulation, and these parameters would be omitted when testing the system in a real-world environment.
5.3. TCP Packets
When the HSI needs to send commands to the simulation, these data can be transmitted back. However, the network interface is limited to manipulating the confidence map, as it is currently the only parameter accessible to the HSI. Before transmission, the confidence map is converted from the HSI into the JSON format. The network interface receives the data and converts the confidence map into a Python array. Subsequently, the user’s old confidence map is overwritten with the new data. Unlike the parameters transmitted over UDP, this data needs to be sent via the TCP protocol to ensure higher reliability. It is important to note that the confidence maps created by the HSI are unique and cannot be reproduced in case of packet loss. Therefore, it must be ensured that the sent data actually reaches the receiver.
6. The VR-HSI
As part of this work, a Virtual Reality HSI has been developed. However, the long-term goal is to develop an Augmented Reality HSI, which can only be realized in a field experiment with real UAVs. As the swarm is currently implemented only in the simulation, a VR-HSI was used. Care was taken to ensure that both interfaces can be operated in the same way to achieve consistent results.
The VR-HSI was developed using the Unity engine and applied on an iPad within the scope of this work. However, thanks to Unity’s multi-platform support, it is also possible to export the application to other devices without code adjustments. This allows for flexible and easier use of the interface on different devices.
The program logic is implemented using scripts (see
Table 2). The respective scripts are either applied through a linked game object in the game or created as objects in the script logic.
Table 2.
Overview of all scripts of the VR-HSI.
Table 2.
Overview of all scripts of the VR-HSI.
| Script |
Description |
| ArcadeInterface |
UDP client for the network interface |
| Beacon |
Defines a landmark that can be attached to a disaster if needed |
| CompassManager |
Handles a compass integrated in the UI, which is important for orientation |
| Disaster |
Defines a disaster and simulates it in the environment |
| Drone |
Describes all properties a UAV can have in the simulation |
| GyroControl |
Controls the existing gyro sensor to obtain information about orientation and tilt |
| Vector |
A simple 2D vector class |
6.1. ArcadeInterface
The script ArcadeInterface opens a UDP socket on port 5500 upon startup and then waits in a loop for data packets from the simulator. Upon receiving the first packet, all UAVs and disasters are newly created and stored in corresponding lists based on this data. In subsequent packets, previously created UAVs and disasters are identified and updated with new data.
Another important task of the script is to make the data visible to the user in the belief and trust map. The values in the trust map are interpreted as a heatmap and displayed graphically to the user. The values in the belief map are also interpreted, and a beacon is placed at an appropriate location. Beacons with a belief value below 0.55 are no longer perceived as disasters by the script.
6.2. Beam
The script
Beam provides the user with the only input method. Through a light beam, the user can mark areas in their environment (Human pointing model [
9]). The script then calculates the marked world coordinates in such a way that the selected position corresponds to the trust map. Subsequently, a potential field is drawn in the trust map starting from this marked point. Depending on the selected tool, the marked point exerts either attractive or repulsive forces on the UAVs.
To transmit the input to the simulator, a TCP connection must first be established on port 65432. After the user confirms the input, the trust map is converted to JSON format and sent to the simulation.
Figure 5.
Exemplary configuration of network traffic between simulation and VR-HSI.
Figure 5.
Exemplary configuration of network traffic between simulation and VR-HSI.
6.3. GyroControl
The script GyroControl acts as an important interface that connects the gyroscope sensor of the device with the rest of the application. Thanks to the components provided by Unity, sensor data can be retrieved independently of the device type. The collected data is used to adjust the viewport based on the orientation and tilt of the device. In addition, the compass script accesses this information.
6.4. User Interface
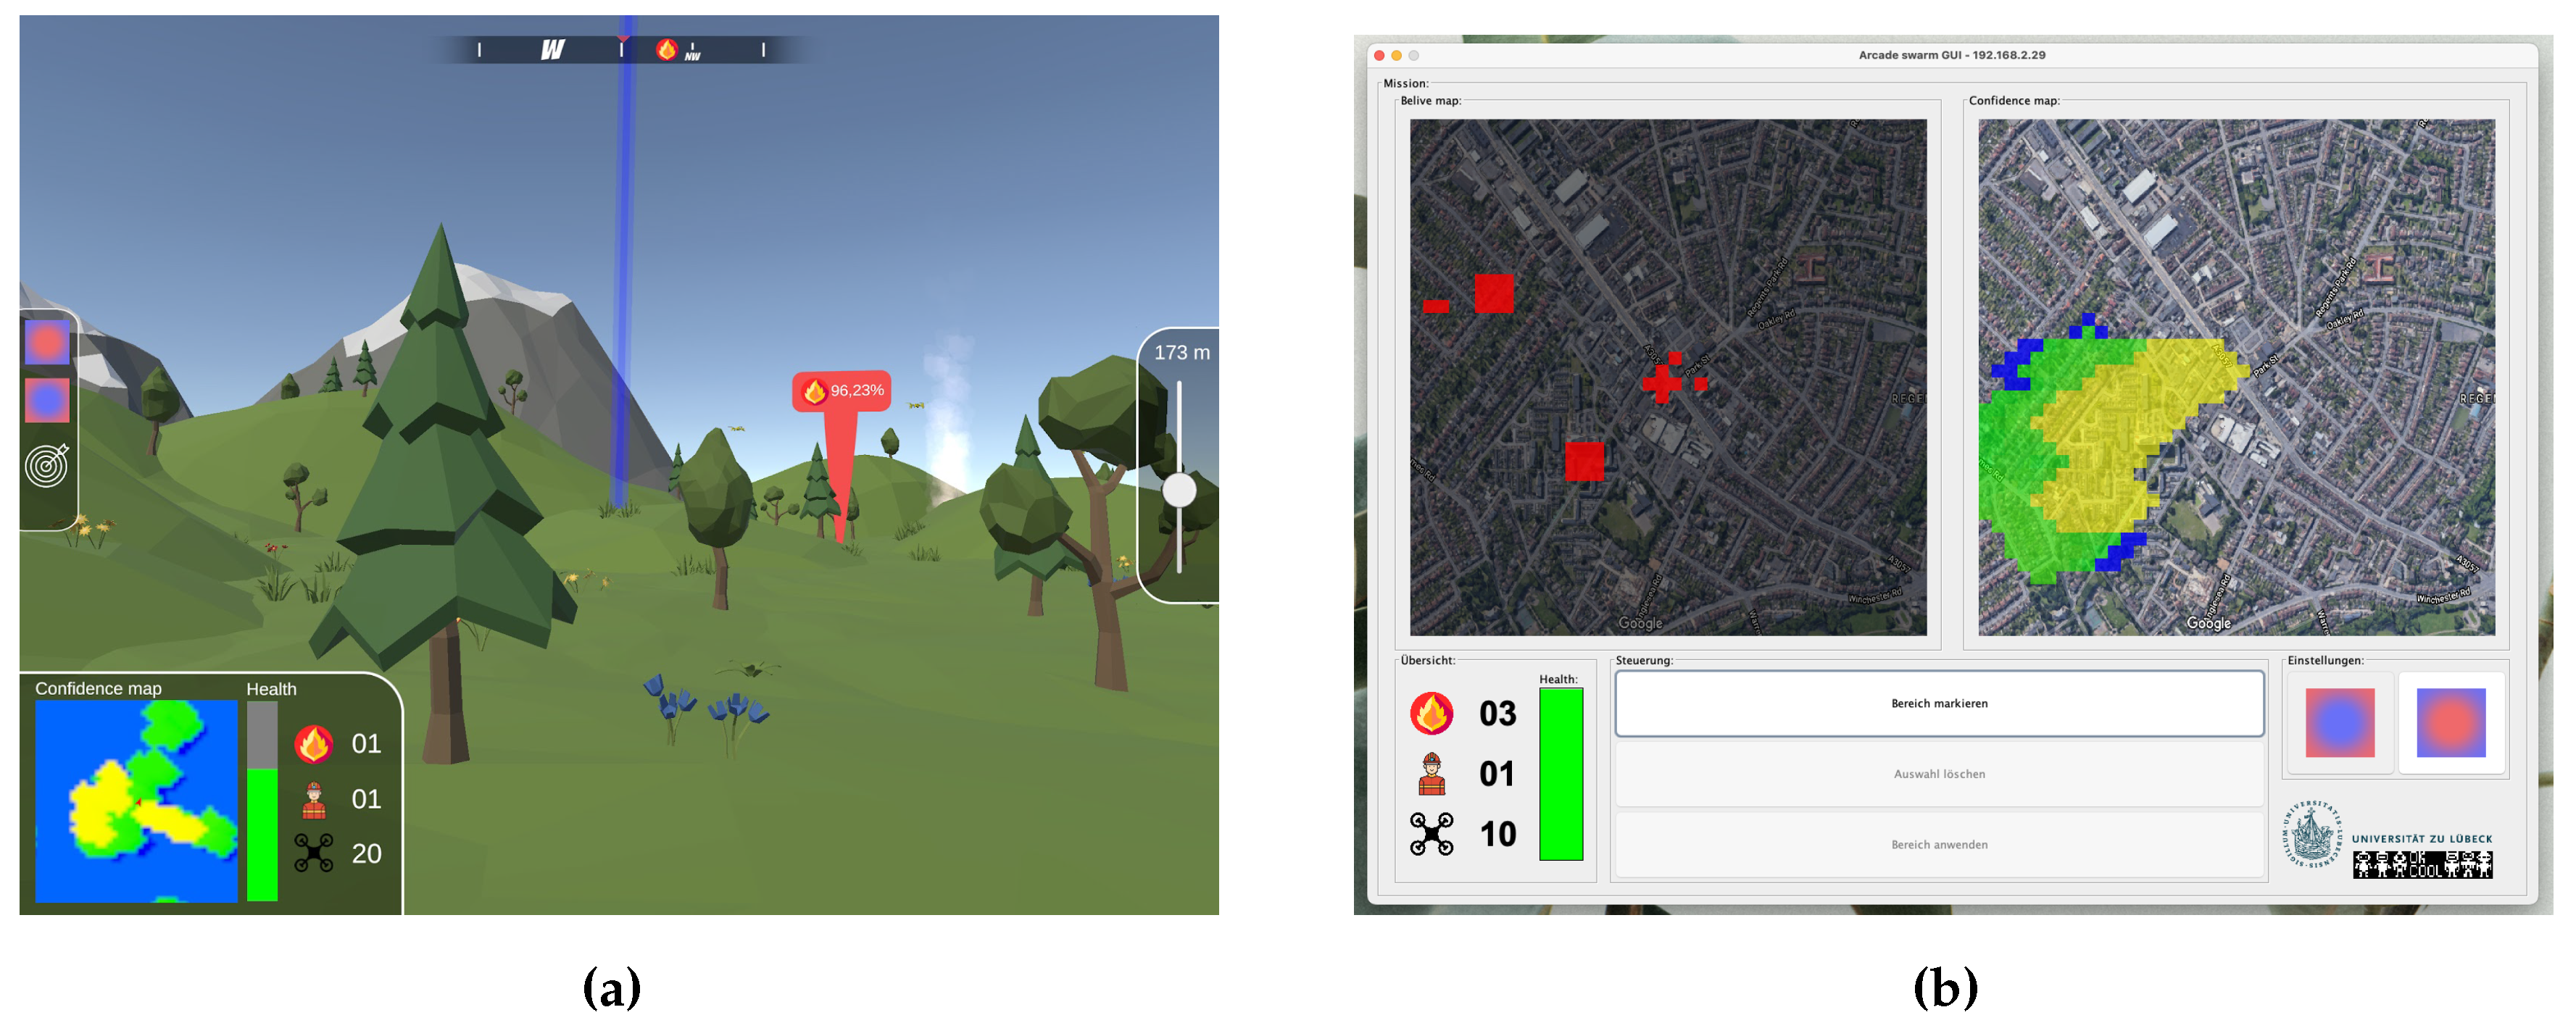
The trust map is displayed in the bottom left corner. Yellow regions indicate areas where UAVs are likely to be present, while green and blue regions represent lower security levels. Additionally, known information about the mission, such as the number of detected disasters, emergency forces, and known UAVs, is displayed, as well as the operational reliability of the swarm based on the average battery capacity. A compass at the top edge indicates detected disasters according to their orientation. When the HSI has sufficient information about a potential disaster, a beacon is placed at the corresponding position, indicating its credibility as a percentage.
Commands can be set through the interface on the left side. The target button activates the marker tool (Beam), which creates a light beam in the center of the field of view, with its distance adjustable using a slider on the right side. By looking around, any point in the environment can be selected. By default, the beam appears in blue, signaling the attract tool. A point is placed to attract UAVs to that location. The blue circle button on the left side activates this tool. When the red circle button is selected, the beam turns red, signaling the repel tool. A point is placed to keep UAVs away from that location. The command is transmitted to the surrounding UAVs by pressing the target button again.
7. Desktop-HSI
A classical desktop application was implemented as the second interface using Java. Similarly, connections to the network interface are established through ports 5500 and 65432. The data is continuously processed.
7.1. User Interface
The left map (belief map) marks the positions of disasters and emergency forces. Red squares represent disasters, while red crosses symbolize emergency forces. The overview displays the number of disasters, emergency forces, known drones, and the operational capability of the swarm, indicated by an estimated value of the remaining energy for the UAVs.
The trust map on the right side is the only means to make statements about the positions of the UAVs. This is because the interface only has access to internal information available to the swarm. By clicking on the "Mark Area" button, the selection tools are activated. In the settings on the right side, you can choose between a blue or red circle. The blue circle attracts the UAVs from the selected point, while the red circle repels the UAVs from the selected point. Once the correct tool is selected, a point can be marked on the left map using the mouse. By clicking the "Apply Area" button, the input is sent and executed.
Figure 6.
On the left, the user interface of the VR-HSI, and on the right, the user interface of the Desktop-HSI.
Figure 6.
On the left, the user interface of the VR-HSI, and on the right, the user interface of the Desktop-HSI.
8. Experiment
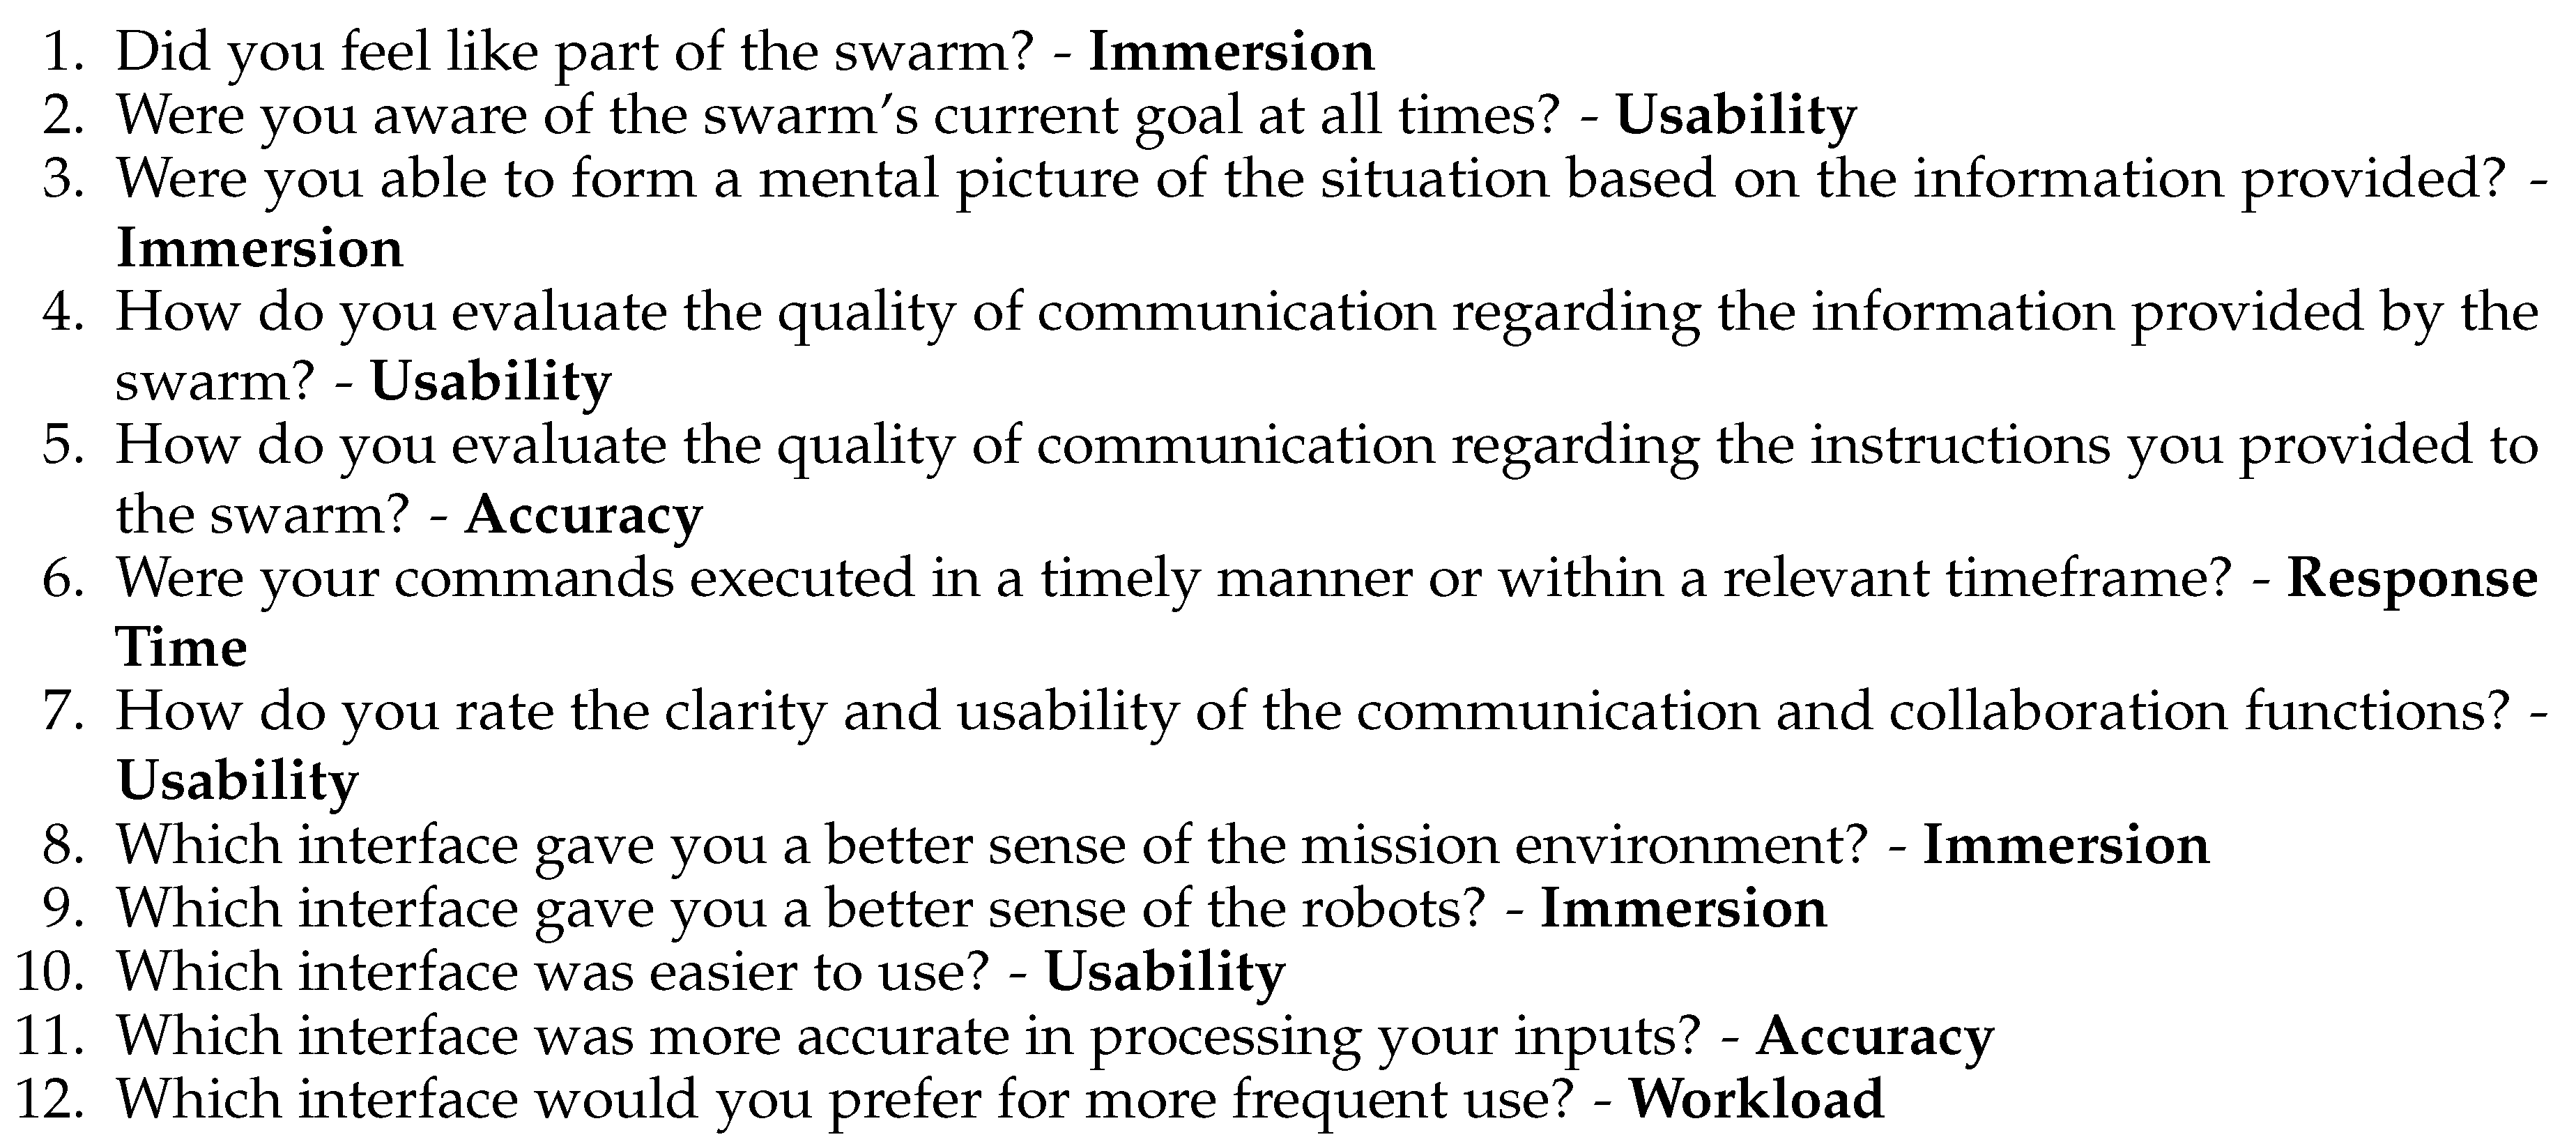
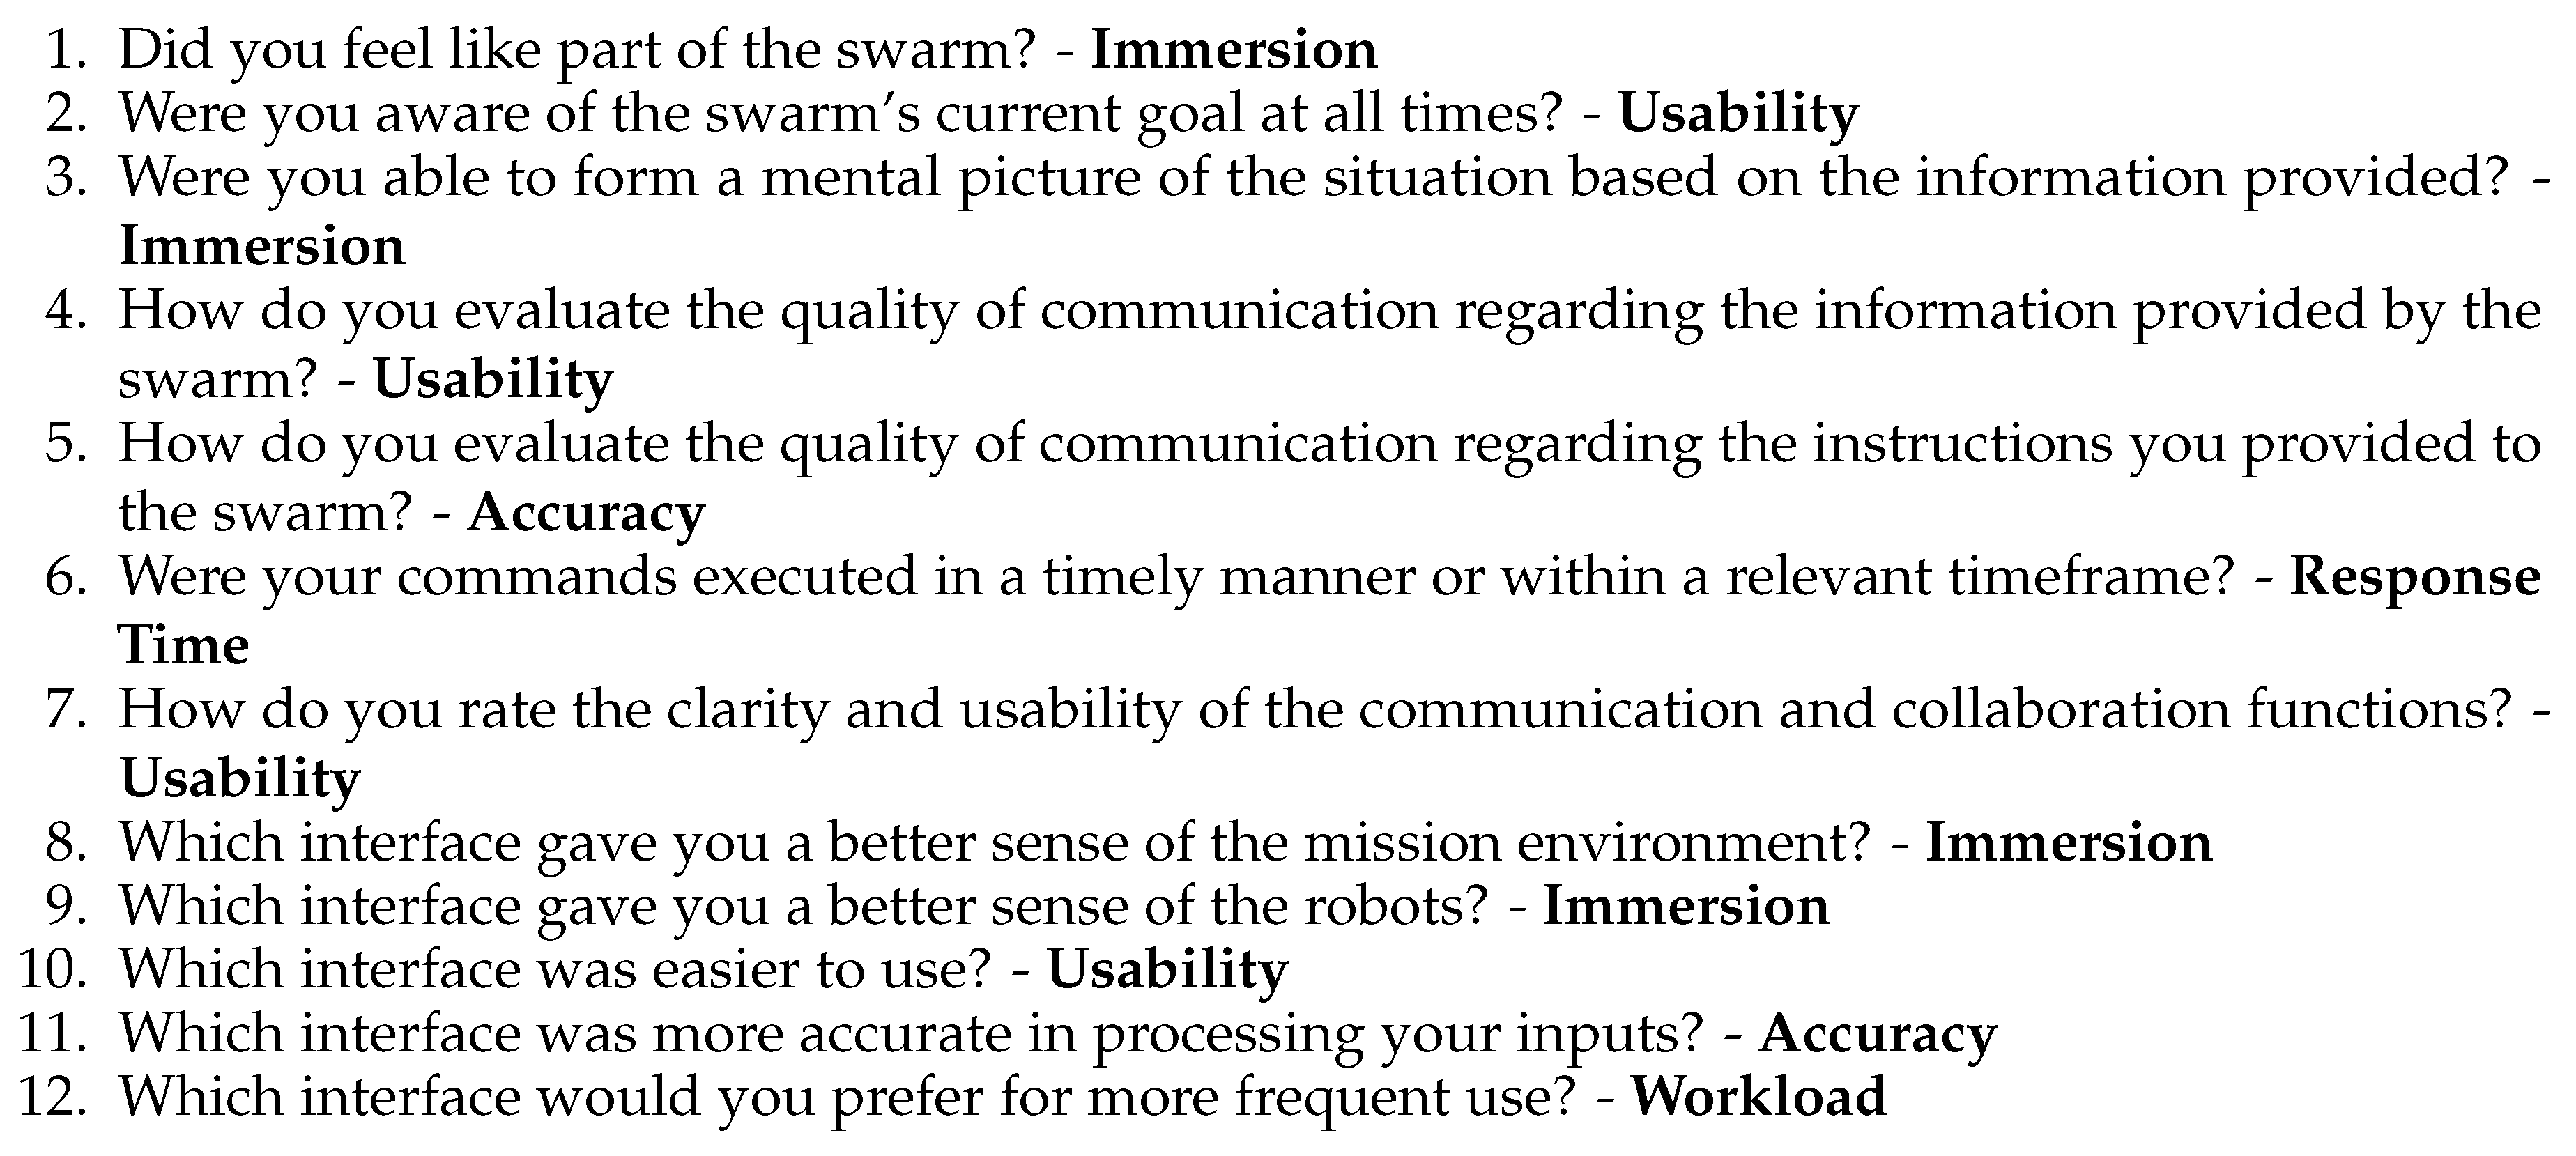
To identify the strengths and weaknesses of the VR-HSI compared to the Desktop-HSI in human-swarm interaction, a quantitative survey was conducted with eight participants from the local area. Before the actual survey, participants were asked to rate their current personal knowledge in handling IT systems and controlling robots (see
Figure 7). This was done to estimate the participants’ level of experience in using the technologies under investigation and to examine the potential influence of these experiences on the metrics to be tested. The survey itself consisted of a series of questions (see
Figure 9) aimed at capturing the participants’ opinions on a VR-HSI and a traditional Desktop-HSI. The questions targeted metrics such as usability, workload, immersion, response time, efficiency, accuracy, and also asked for random assessments of the potential of these technologies. In the subsequent evaluation, the collected results were statistically analyzed for significance. In addition to the quantitative survey, qualitative data was also collected through observations and brief debriefings to gain a more comprehensive insight into the participants’ experiences. Observations focused on the participants’ behavior during task completion and their interaction with the interface. A brief debriefing was usually conducted at the end of each session to obtain more detailed information about their experiences with both interfaces.
Figure 7.
Questionnaire used for the pre-survey. Adapted from [
14].
Figure 7.
Questionnaire used for the pre-survey. Adapted from [
14].
Since a time slot of 60 minutes was targeted for each participant, a total of eight appointments were scheduled to conduct the survey. To ensure a smooth process, a time limit of ten minutes was set for each required task. This ensured that each participant had enough time to understand the interface and the task at hand. As mentioned earlier, the participants had to complete a pre-survey before the actual experiment to assess their knowledge of IT and robot systems. This could be easily done on the computer where the Desktop-HSI was later tested. Depending on the given task, i.e., Desktop-HSI or VR-HSI, the participants either took a seat at the desk or went to the center of the room. Each participant was required to use and evaluate both the Desktop-HSI and the VR-HSI. To filter out possible biases from the results, half of the participants were shown the VR-HSI first, and the other half was shown the Desktop-HSI first. After successful completion of the first interface, the other interface was presented. It is important to mention that the questions for both interfaces were identical to obtain a usable comparison. The first run required the participant to locate four fires with the support of five UAVs. The mission was then repeated with ten UAVs and four fires. In all runs, the time was measured and recorded in parallel. Only after both runs were completed, the participant could take a seat at the computer and answer the respective questions about the interface. Subsequently, the other interface was presented to the participant. Technically, it was ensured that the participants had to complete the entire questionnaire to avoid invalid submissions.
Figure 8.
Questionnaire used in the survey. Adapted and modified from [
14].
Figure 8.
Questionnaire used in the survey. Adapted and modified from [
14].
Evaluation Before comparing both interfaces, it is important to analyze the quality of data from the sample. For this purpose, the participants underwent a pre-survey before the actual experiment. In this pre-survey, they were asked to assess their skills in handling the technologies used in the experiment, such as computer skills, experience with robot systems, or VR technologies. The results of this survey will be discussed in detail in the next chapter.
To determine the potential strengths and limitations of both interfaces, metrics such as effectiveness, accuracy, response time, usability, immersion, and workload were identified. These metrics will be discussed in detail in the following chapters.
9. Data Preparation
For each interface, the same set of questions was asked and compared pairwise. To conduct a meaningful comparison, the data needs to be normalized first. Since the sample size is small with only eight participants, the data is not normally distributed, and Z-score normalization is not suitable. Instead, min-max normalization is applied to normalize the data on a scale from zero to one.
Subsequently, the mean and standard deviation can be determined for each dataset. To identify significant differences in the datasets, a hypothesis testing is performed. The H0 hypothesis states that there is no significant difference between the two HSIs in the tested metric, while the H1 hypothesis assumes a difference.
To assess the H0 hypothesis, two test procedures, the paired t-test and the Mann-Whitney U test, are considered. Based on the test results, the H0 hypothesis can be either accepted or rejected to determine a significant difference between the HSIs.
10. T-Test
An important aspect of the t-test is the p-value or significance value, which indicates the likelihood that the difference between the two means is due to chance. The H0 hypothesis is rejected only if the p-value is smaller than the pre-determined significance level, usually set at 5% (p = 0.05). Only then is there a significant difference between the two means.
Figure 9.
Questionnaire used in the survey. Adapted and modified from [
14].
Figure 9.
Questionnaire used in the survey. Adapted and modified from [
14].
Evaluation Before comparing both interfaces, it is important to analyze the quality of data from the sample. For this purpose, the participants underwent a pre-survey before the actual experiment. In this pre-survey, they were asked to assess their skills in handling the technologies used in the experiment, such as computer skills, experience with robot systems, or VR technologies. The results of this survey will be discussed in detail in the next chapter.
To determine the potential strengths and limitations of both interfaces, metrics such as effectiveness, accuracy, response time, usability, immersion, and workload were identified. These metrics will be discussed in detail in the following chapters.
11. Data Preparation
For each interface, the same set of questions was asked and compared pairwise. To conduct a meaningful comparison, the data needs to be normalized first. Since the sample size is small with only eight participants, the data is not normally distributed, and Z-score normalization is not suitable. Instead, min-max normalization is applied to normalize the data on a scale from zero to one.
Subsequently, the mean and standard deviation can be determined for each dataset. To identify significant differences in the datasets, a hypothesis testing is performed. The H0 hypothesis states that there is no significant difference between the two HSIs in the tested metric, while the H1 hypothesis assumes a difference.
To assess the H0 hypothesis, two test procedures, the paired t-test and the Mann-Whitney U test, are considered. Based on the test results, the H0 hypothesis can be either accepted or rejected to determine a significant difference between the HSIs.
12. T-Test
An important aspect of the t-test is the p-value or significance value, which indicates the likelihood that the difference between the two means is due to chance. The H0 hypothesis is rejected only if the p-value is smaller than the pre-determined significance level, usually set at 5% (p = 0.05). Only then is there a significant difference between the two means, and the H0 hypothesis can be rejected.
However, the t-test requires normally distributed data, which may not be the case due to the small sample size of eight participants. Nevertheless, the t-test is applied and subsequently analyzed for its usefulness, as shown in
Table 3.
Table 3.
Results of the t-test. Significance levels are marked with (*) symbol. Data set from
Figure 9.
Table 3.
Results of the t-test. Significance levels are marked with (*) symbol. Data set from
Figure 9.
| Data Set |
VR-HSI |
Desktop-HSI |
t |
p-Value |
| Mean |
Std. Deviation |
Mean |
Std. Deviation |
| Question 1 |
0.55 |
0.26 |
0.31 |
0.11 |
2.19 |
0.065 |
| Question 2 |
0.61 |
0.16 |
0.49 |
0.27 |
1.09 |
0.311 |
| Question 3 |
0.85 |
0.11 |
0.66 |
0.15 |
2.71 |
0.030* |
| Question 4 |
0.74 |
0.16 |
0.56 |
0.20 |
1.90 |
0.099 |
| Question 5 |
0.70 |
0.19 |
0.66 |
0.21 |
0.33 |
0.750 |
| Question 6 |
0.71 |
0.16 |
0.65 |
0.24 |
0.66 |
0.529 |
| Question 7 |
0.81 |
0.12 |
0.74 |
0.13 |
1.34 |
0.222 |
The calculated p-values are significantly higher than the target level of 5%, except for the data set in
Figure 9 (Question 3). This means that only in one case can the H0 hypothesis be rejected, indicating a significant difference between the VR-HSI and Desktop-HSI. For the other questions, no significance can be detected at the desired significance level.
To gain insights from the data, the significance level could be increased. However, this requires a strong justification as raising the significance level makes the results less robust for scientific argumentation. Even if the significance level is raised to 0.3, which means that the H0 hypothesis can be falsely rejected in 30% of cases, only four datasets show significant differences.
Therefore, the results of the t-test would provide little to no meaningful insights on these datasets, and other analytical methods need to be explored to
gain further insights.
13. Mann-Whitney U Test
Unlike the t-test, the Mann-Whitney U test is more suitable for smaller sample sizes due to its independence from normal distribution. Rejecting the H0 hypothesis also requires a p-value smaller than 0.05. The U test is applied to the data to verify its applicability, as shown in
Table 4.
Table 4.
Results of the Mann-Whitney U test. Significance levels are marked with (*) symbol. Data set from
Figure 9.
Table 4.
Results of the Mann-Whitney U test. Significance levels are marked with (*) symbol. Data set from
Figure 9.
| Data Set |
VR-HSI |
Desktop-HSI |
p-Value |
| |
Mean |
Std. Deviation |
Mean |
Std. Deviation |
|
| Question 1 |
0.55 |
0.26 |
0.31 |
0.11 |
0.07 |
| Question 2 |
0.61 |
0.16 |
0.49 |
0.27 |
0.222 |
| Question 3 |
0.85 |
0.11 |
0.66 |
0.15 |
0.018* |
| Question 4 |
0.74 |
0.16 |
0.56 |
0.20 |
0.077 |
| Question 5 |
0.70 |
0.19 |
0.66 |
0.21 |
0.871 |
| Question 6 |
0.71 |
0.16 |
0.65 |
0.24 |
0.632 |
| Question 7 |
0.81 |
0.12 |
0.74 |
0.13 |
0.295 |
Here again, it becomes evident that the H0 hypothesis can only be rejected in one case, and there are only a few significant differences in the tested metrics between VR-HSI and Desktop-HSI. However, by raising the significance level to 30%, it is possible to classify five out of seven metrics as significant, providing slightly better results than the t-test. Even if this were possible, the results would still be less representative and not sufficiently robust for further argumentation. Therefore, other investigations are needed to obtain meaningful results.
14. Further Analytical Methods
Due to the small sample size, neither the t-test nor the Mann-Whitney U test were able to detect significant differences between the two HSIs. Hence, it is justified to assume that hypothesis testing is not meaningful at this sample size. Instead, descriptive statistics can be used to analyze the respective means and standard deviations of the survey and determine which interface was more favorable to the participants.
However, it is important to consider that the sample size is not large enough to obtain robust insights from the interpretation of these results.
15. Investigation of Exploratory Behavior
To measure whether the algorithm discussed in Chapter 4.1 provides a significant improvement in mission time in our use case, 25 missions were conducted with five UAVs and three disasters each. The occurrence probability for linear exploratory behavior was set to 0
Table 5 compares how the performance of the algorithm differs from the regular algorithm at different occurrence probabilities.
Table 5.
Results of the t-test for occurrence probabilities of linear exploratory behavior. The differences in occurrence probability are always compared to 0% occurrence probability. Mean and standard deviation are in seconds.
Table 5.
Results of the t-test for occurrence probabilities of linear exploratory behavior. The differences in occurrence probability are always compared to 0% occurrence probability. Mean and standard deviation are in seconds.
| Occurrence Probability |
Mean |
Std. Deviation |
t |
p-Value |
| 0% |
6.95 |
2.99 |
/ |
/ |
| 2% |
8.77 |
2.96 |
-2.08 |
0.048 |
| 5% |
9.59 |
4.08 |
-2.42 |
0.023 |
| 10% |
10.72 |
4.73 |
-3.51 |
0.002 |
| 20% |
17 |
9.60 |
-5.50 |
0.000 |
It is evident that the performance of the algorithm implemented by default is significantly superior to exploratory behavior. Additionally, the average time required to complete the mission increases with increasing occurrence probability of linear exploratory behavior. This is because the random navigation of the UAV caused by exploratory behavior reduces the accuracy in approaching interesting locations in the area. This also means that the probability increases that a UAV navigates randomly into an area that has already been well explored, thus wasting valuable time resources.
16. Sample Validation
This chapter examines how representative the chosen sample is of the general population and the influence of participants’ prior knowledge on the respective HSI. To achieve this, participants were subjected to a preliminary survey before the actual questionnaire to determine their computer skills, experience with robot and multi-robot systems, as well as computer games and VR technologies.
16.1. Computer Experience
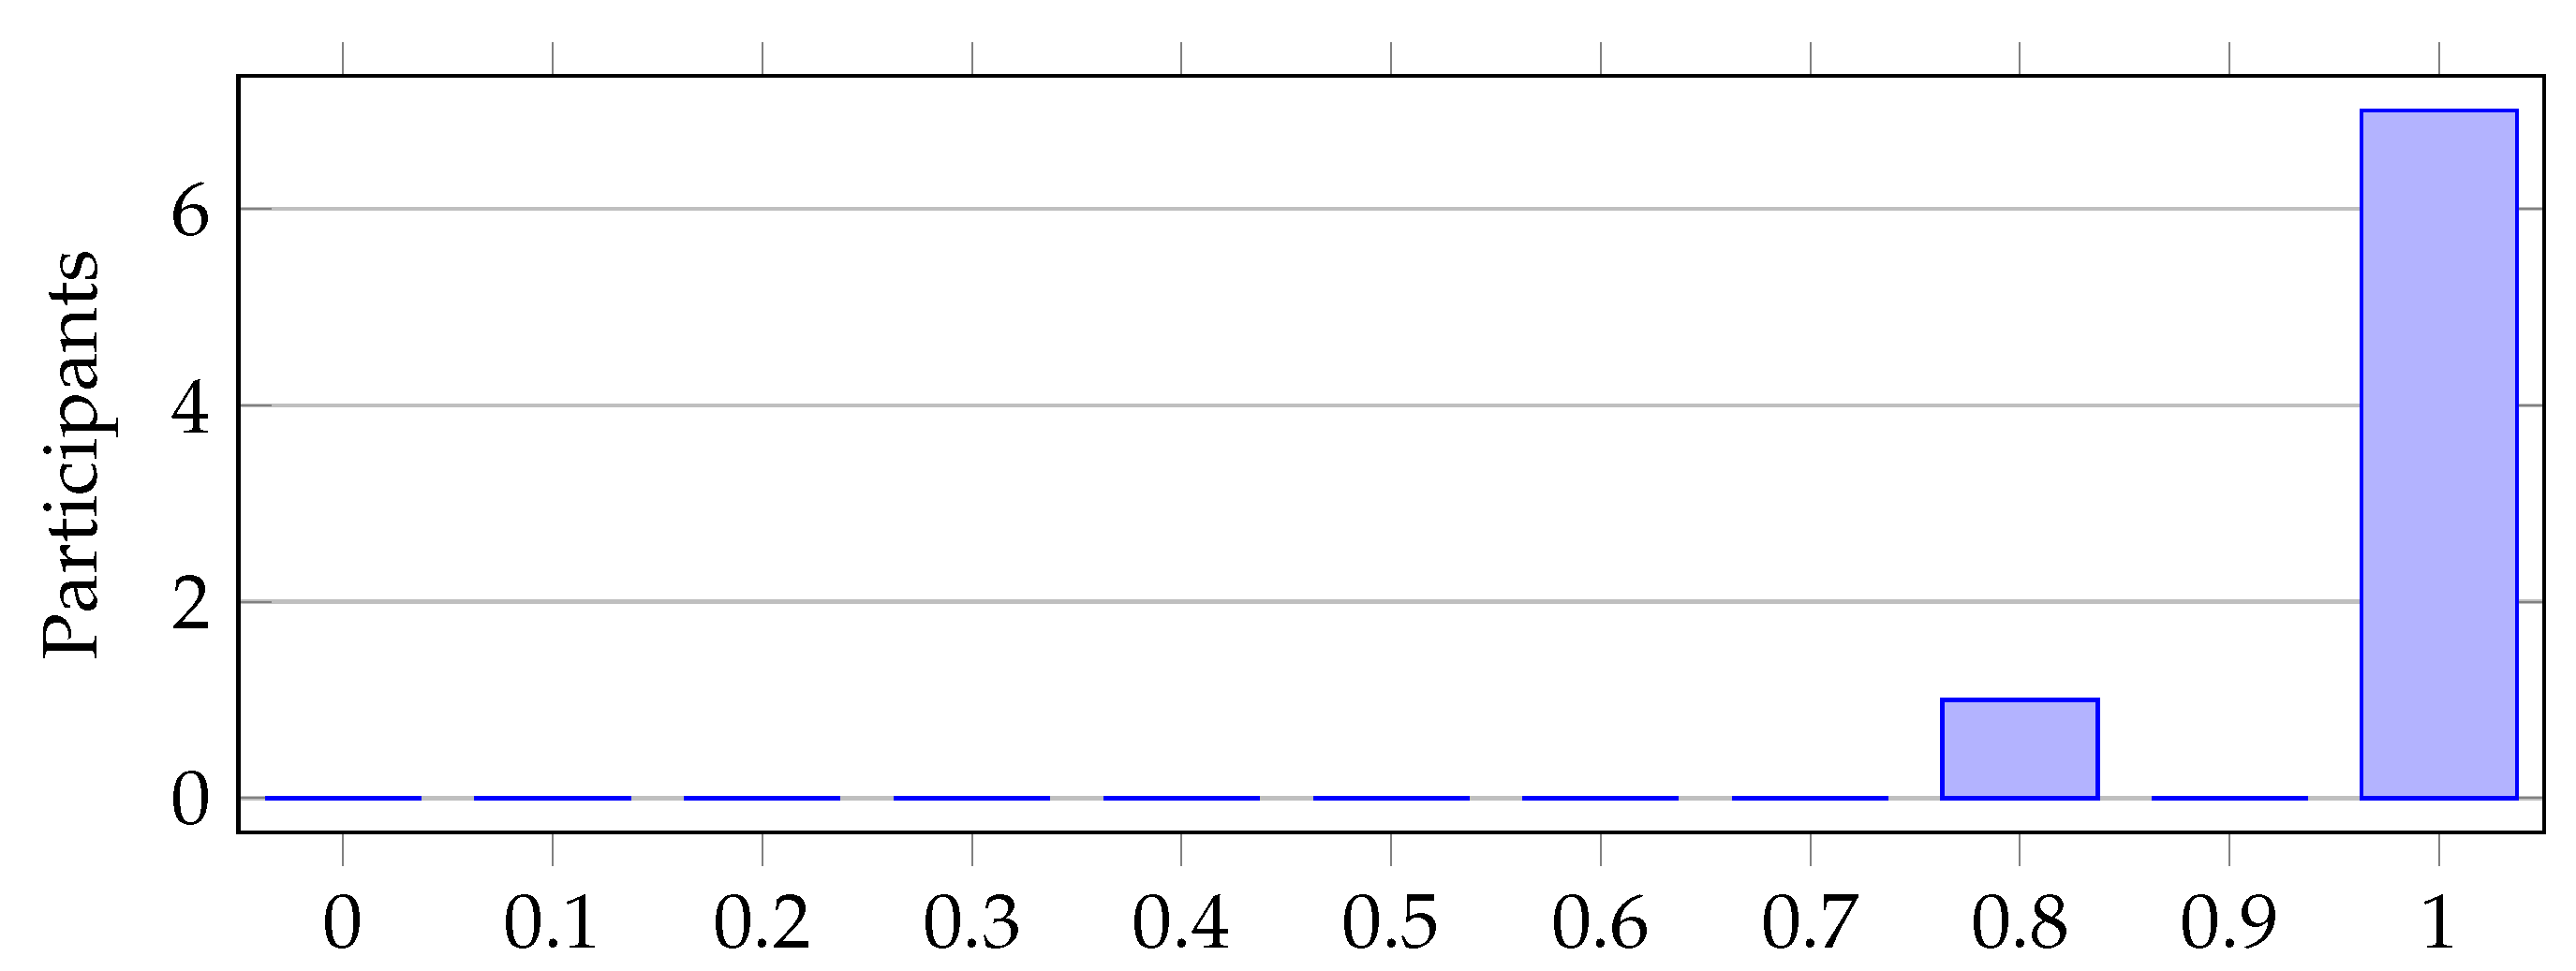
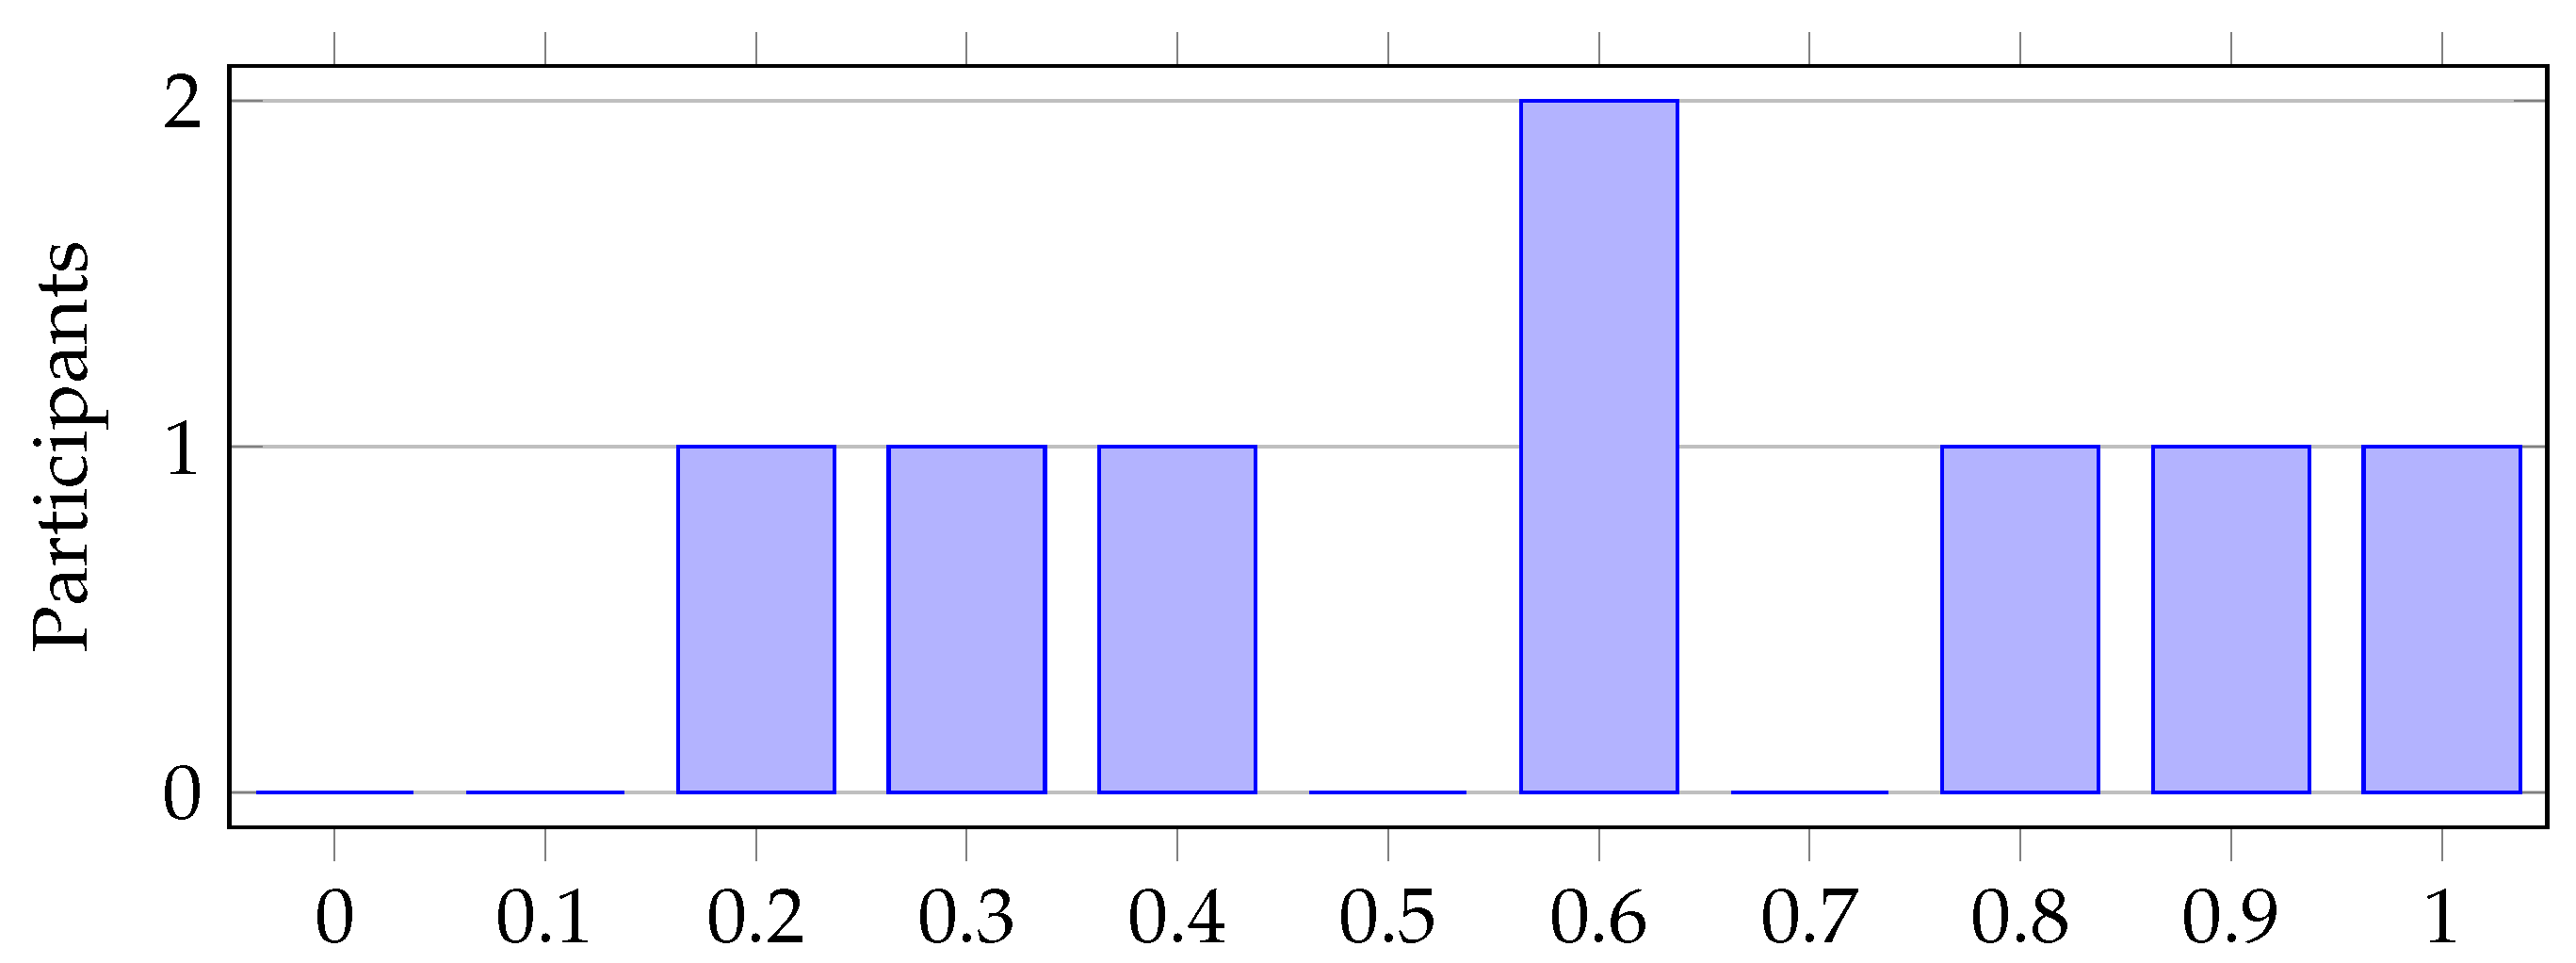
As can be seen from
Table 6 and the mean of 0.98, it can be assumed that all participants are well versed in computer usage. This assumption is further supported by the low standard deviation of 0.07, indicating that there are minimal differences between the participants’ levels of knowledge.
Table 6.
Evaluation of the question: How often do you use computers?
Table 6.
Evaluation of the question: How often do you use computers?
| Figure |
Mean |
Std. Deviation |
| Figure 10 |
0.98 |
0.07 |
Figure 10.
How often do you use computers? 0-Never, 1-Every day.
Figure 10.
How often do you use computers? 0-Never, 1-Every day.
16.2. Experience with Robots and Multi-Robot Systems
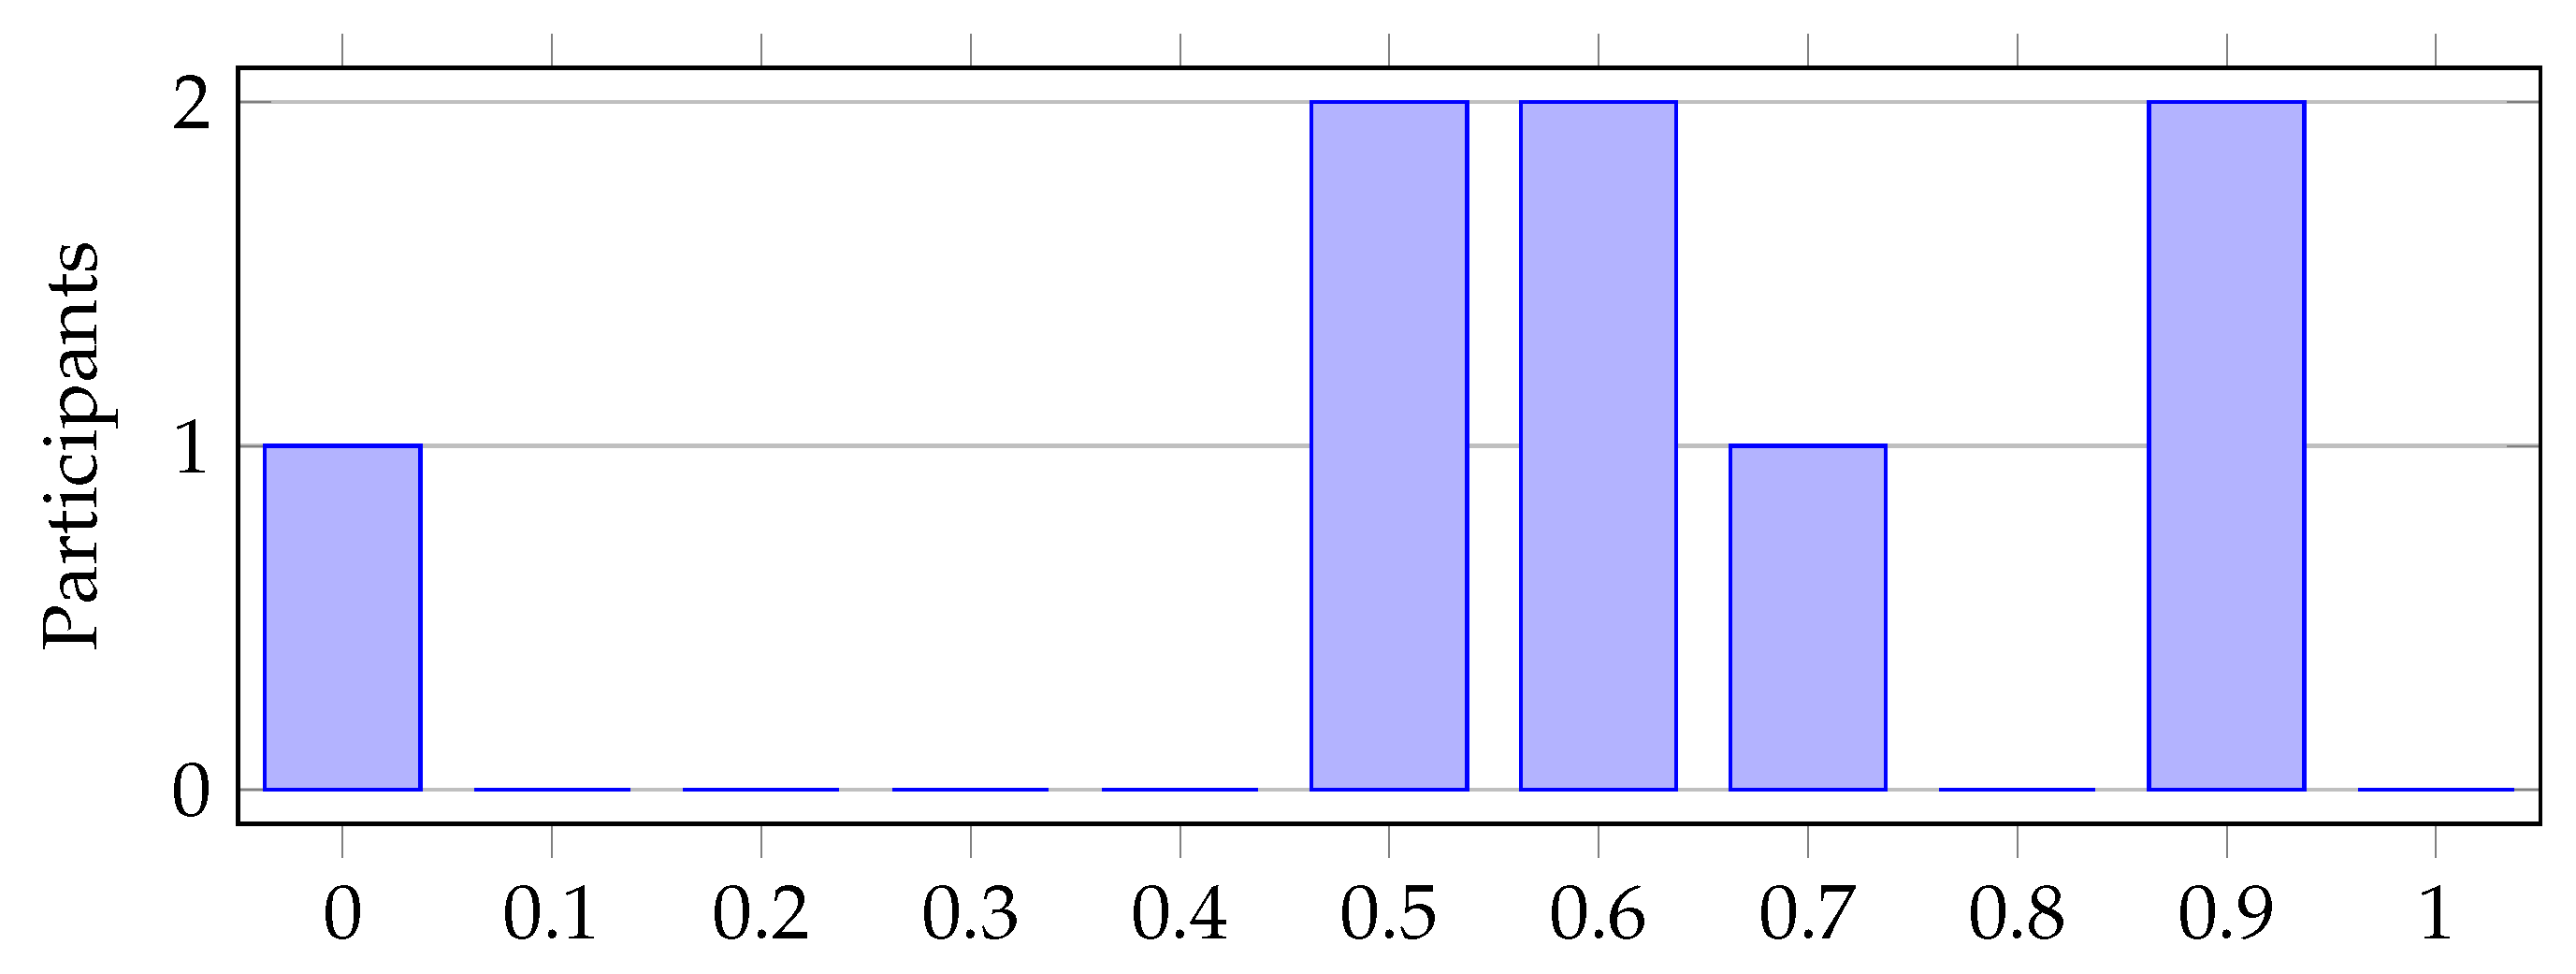
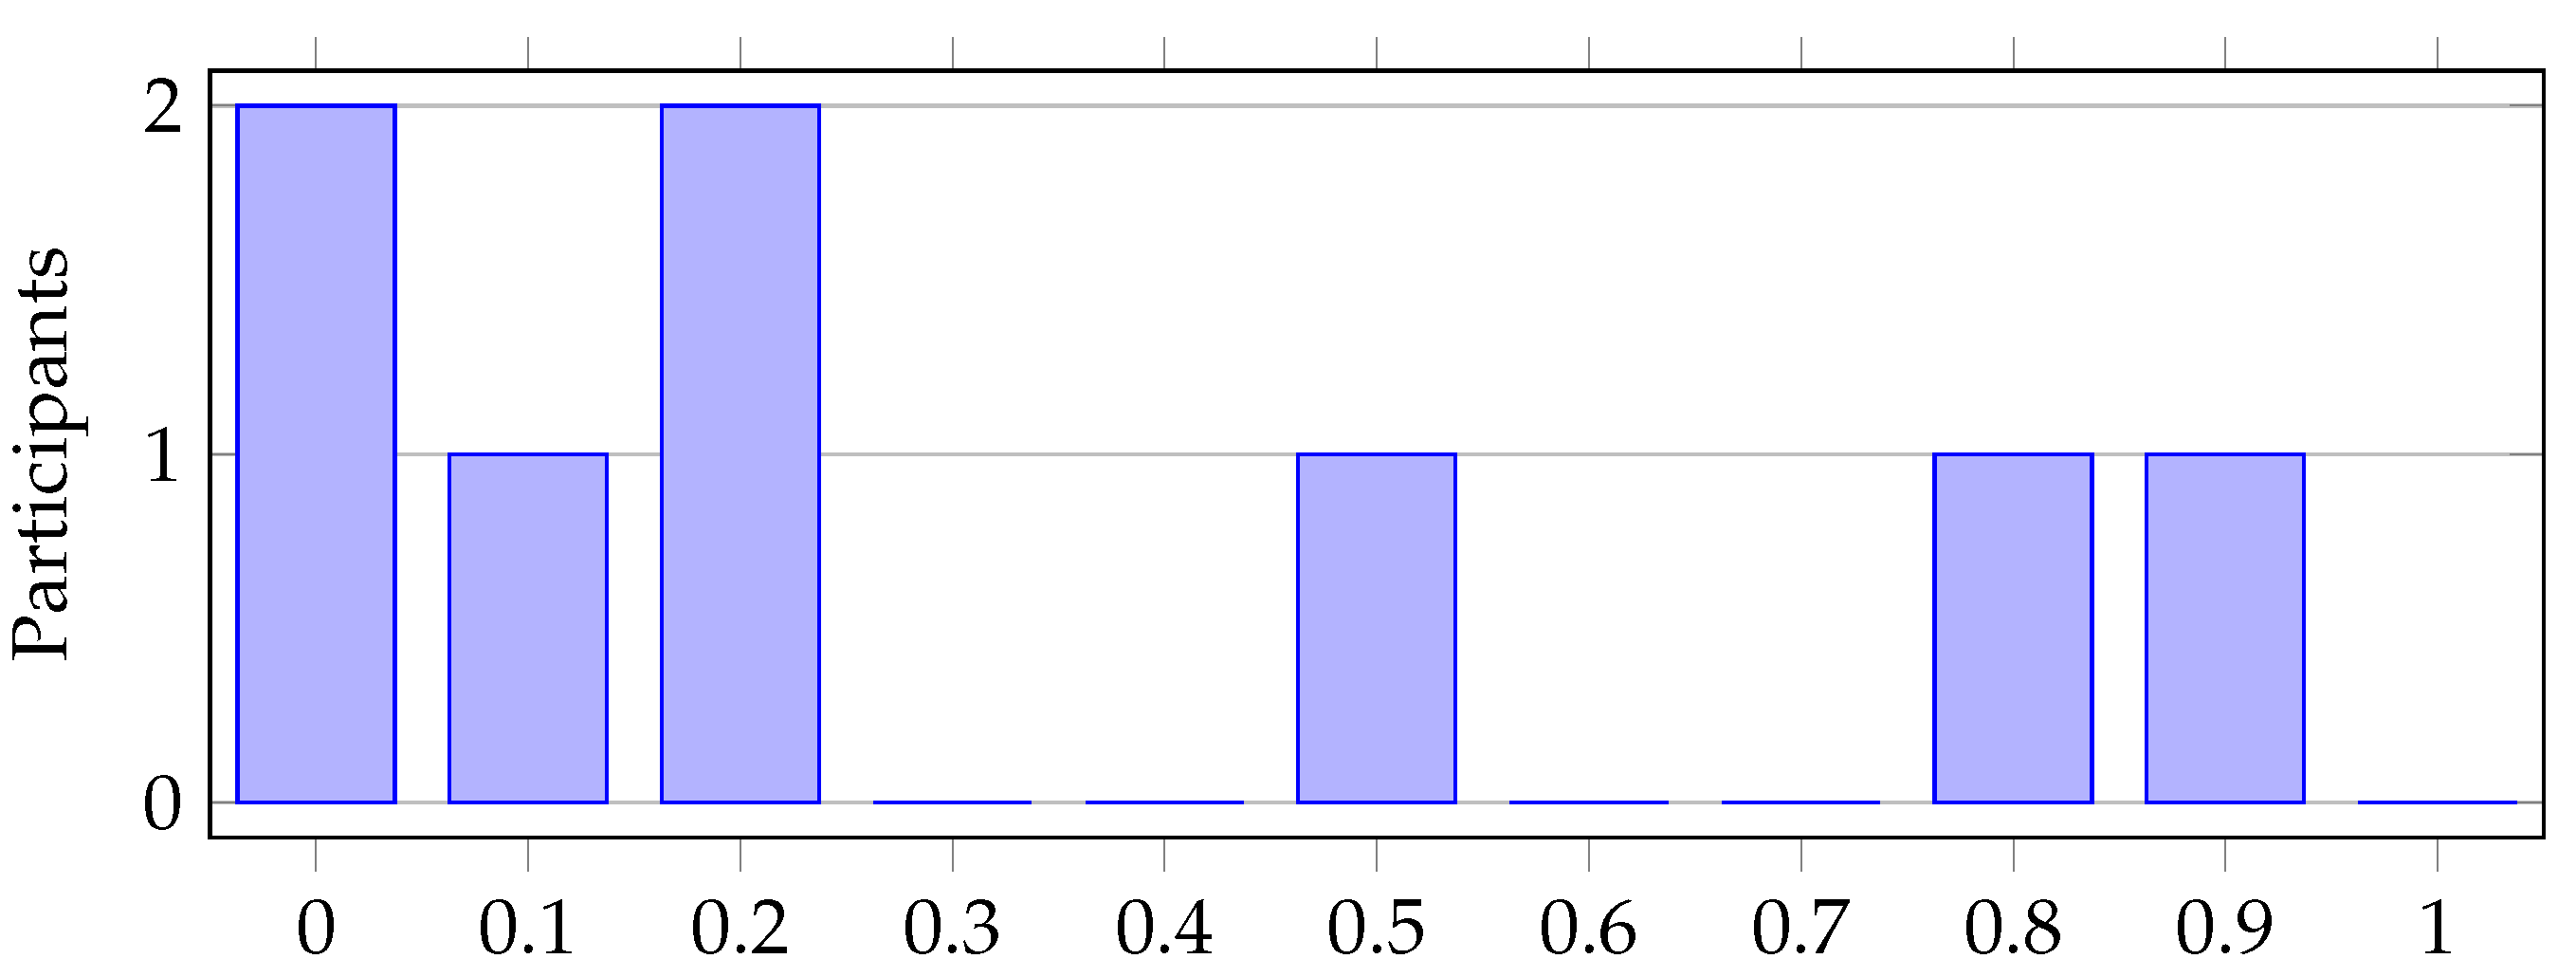
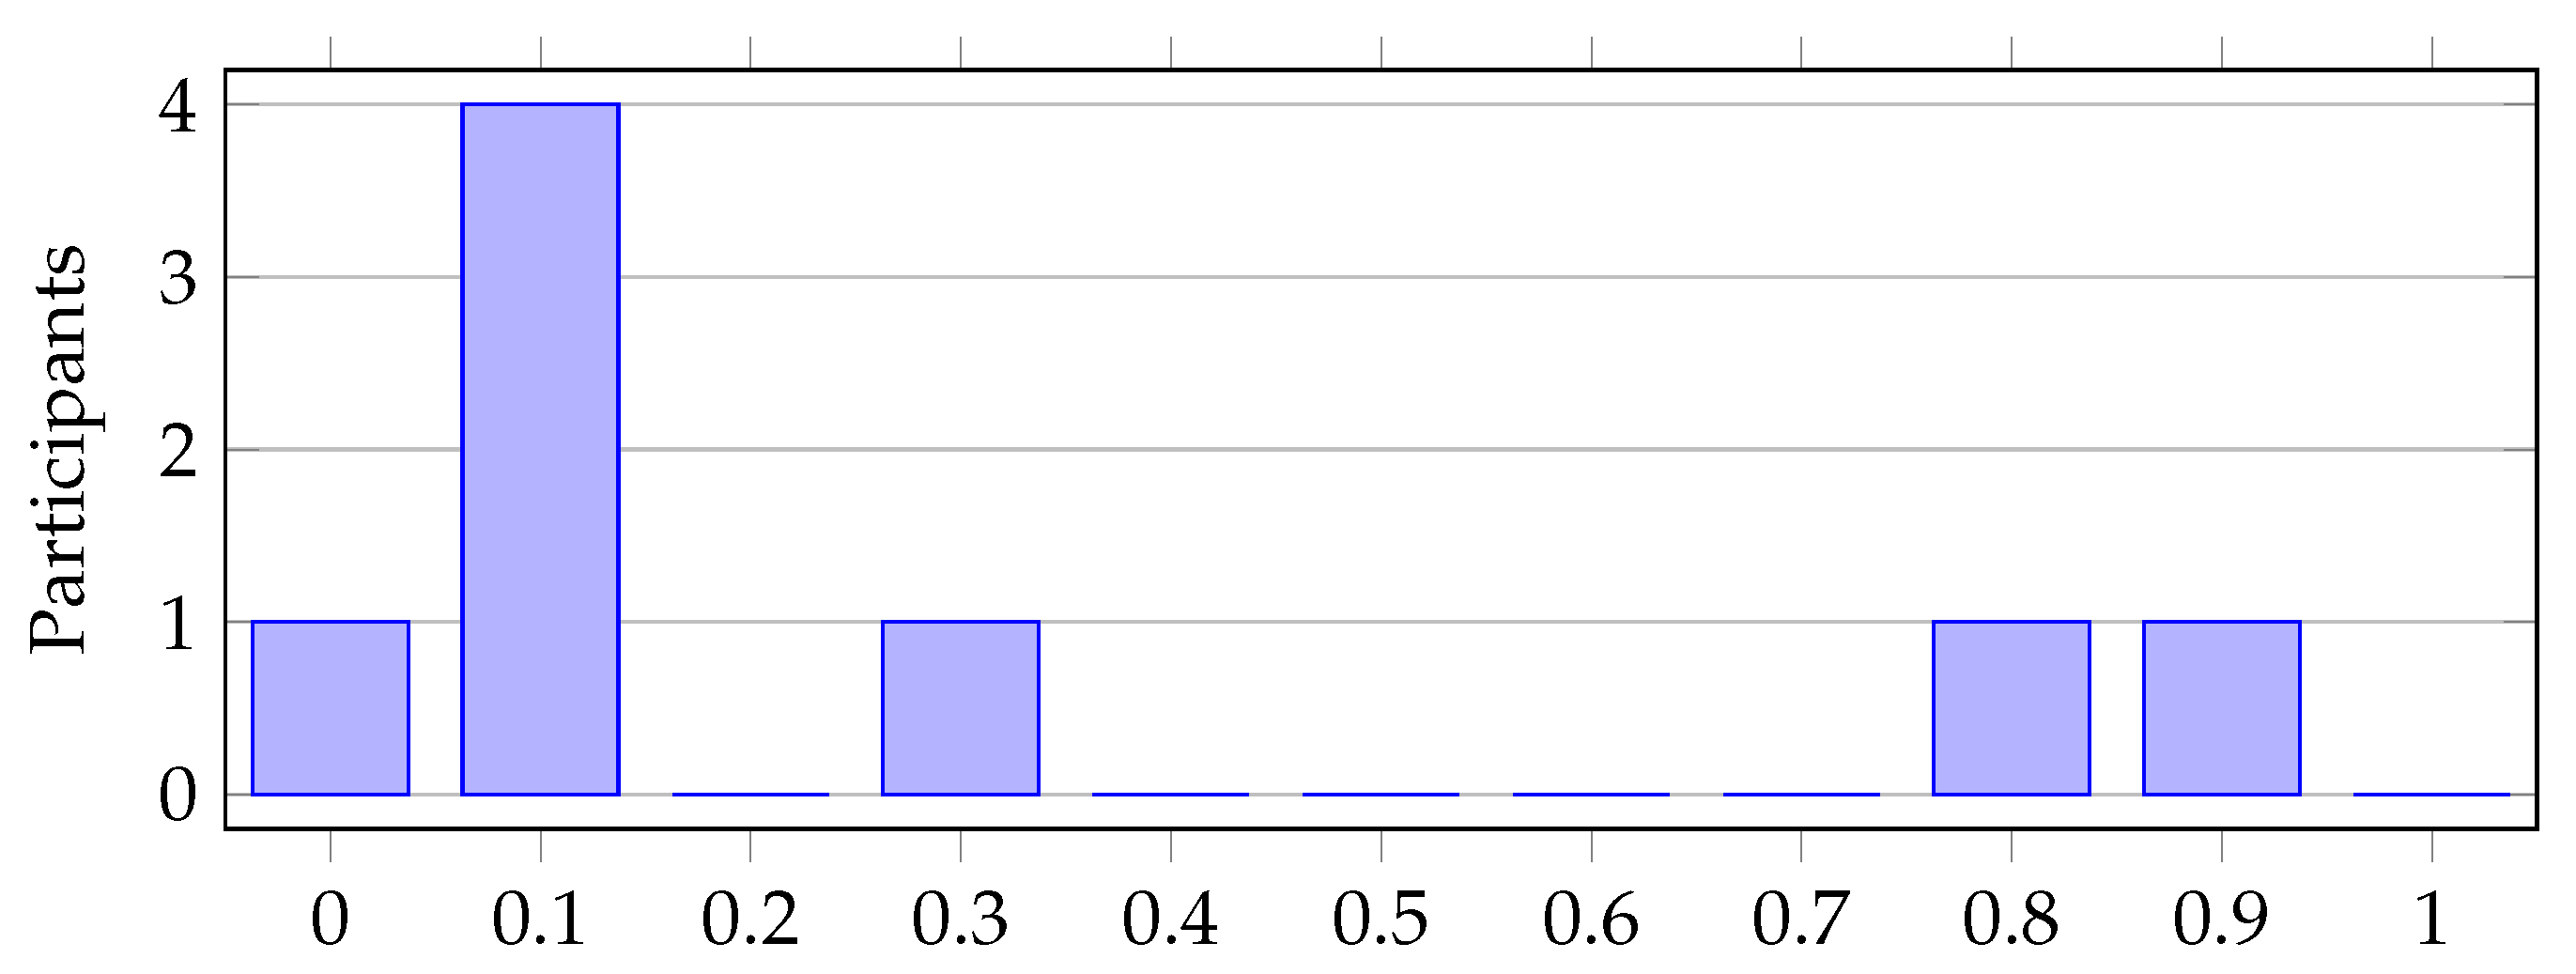
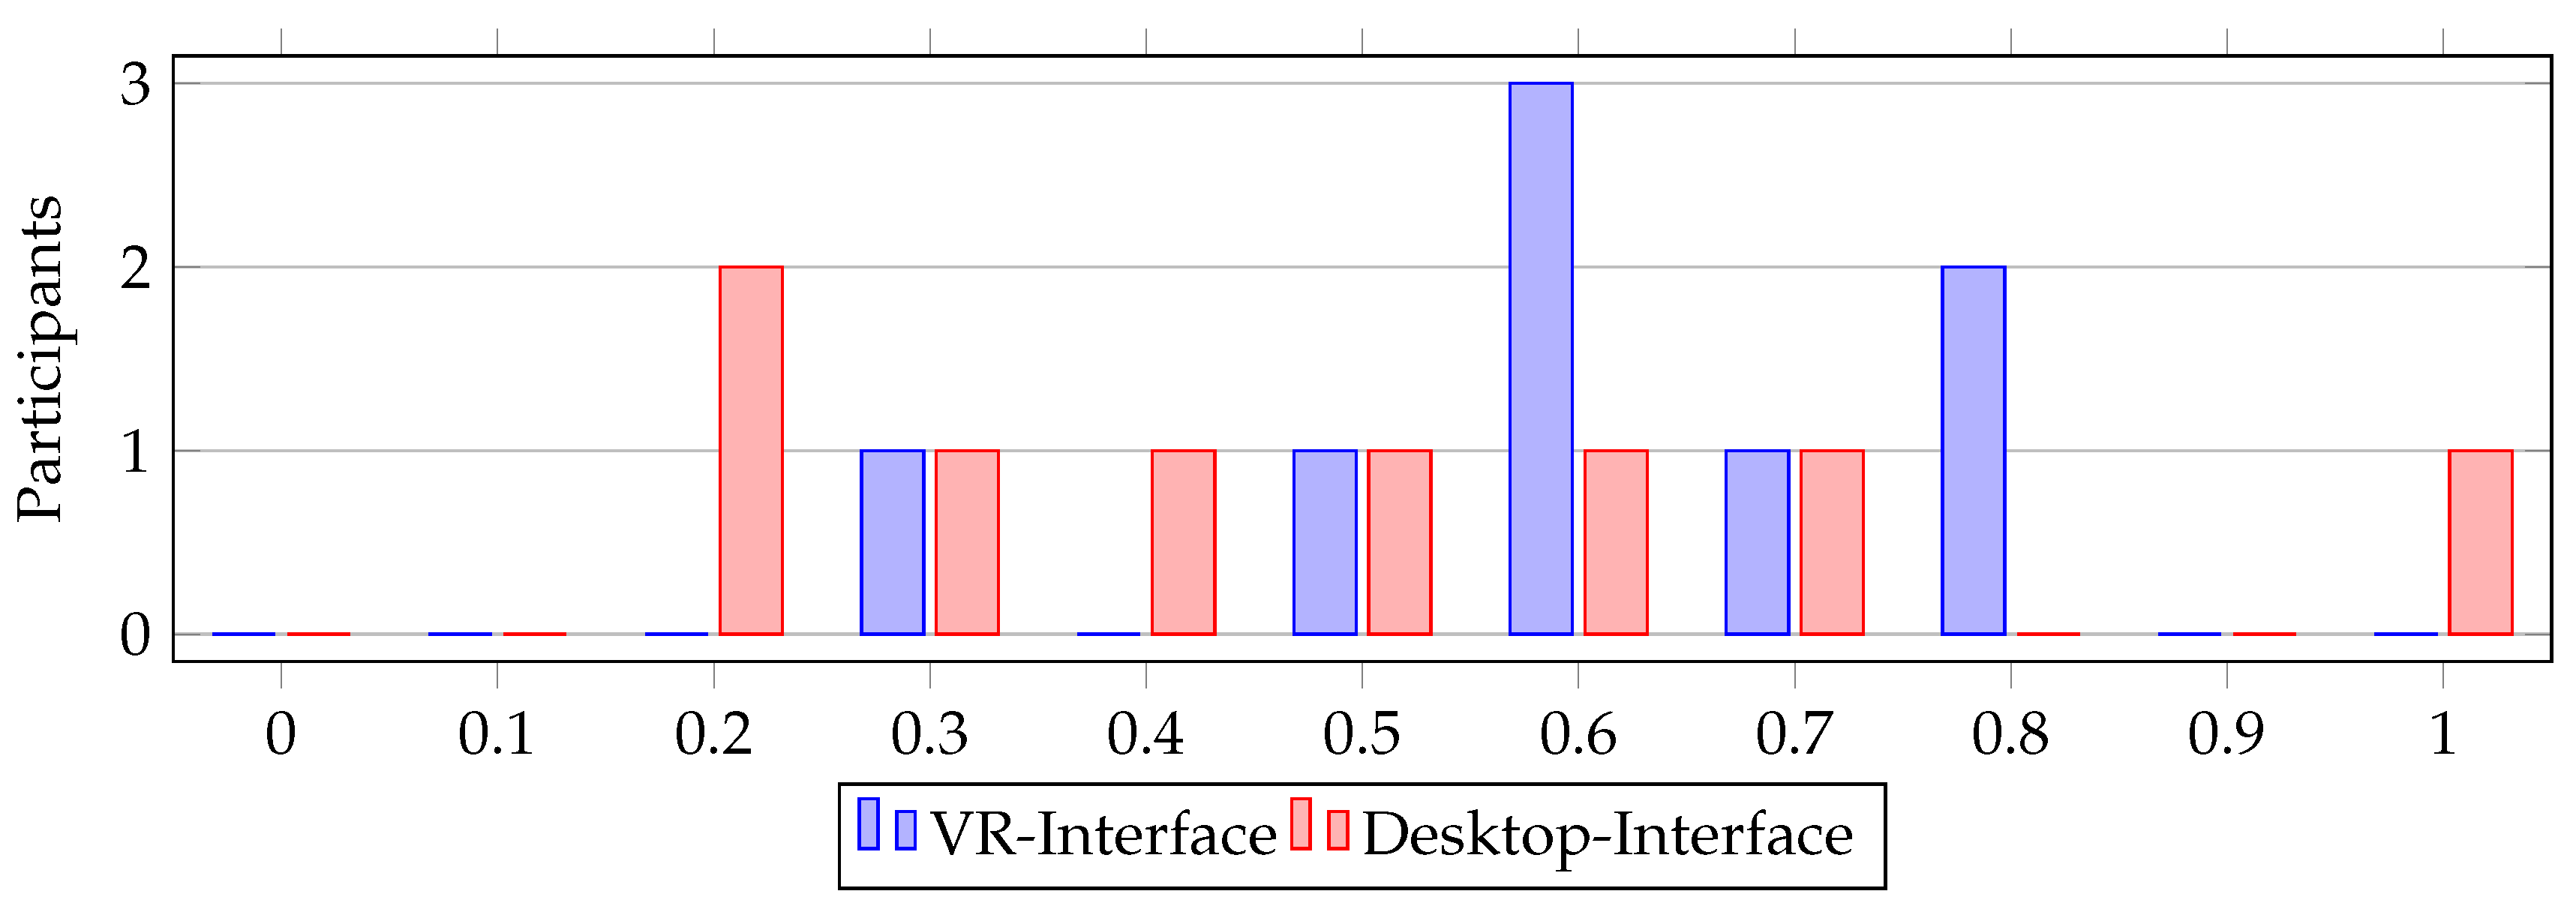
The query of participants’ frequency of interaction with robots and robot swarms aims to determine whether the participants are already familiar with possible behaviors of these systems. The results are shown in
Table 7 and indicate that, on average, the respondents interact occasionally with robots and rarely with robot swarms. However, the high standard deviation of 0.29 and 0.35 respectively suggests that a few participants are more engaged with robots and robot swarms and may respond better to the behavior of these systems (see Chapter 23.1 for more details).
Table 7.
Evaluation of the questions: How often do you interact with robots? and How often do you interact with robot swarms or multi-robot systems?
Table 7.
Evaluation of the questions: How often do you interact with robots? and How often do you interact with robot swarms or multi-robot systems?
Figure 11.
How often do you interact with robots? 0-Never, 1-Every day.
Figure 11.
How often do you interact with robots? 0-Never, 1-Every day.
Figure 12.
How often do you interact with robot swarms or multi-robot systems? 0-Never, 1-Every day.
Figure 12.
How often do you interact with robot swarms or multi-robot systems? 0-Never, 1-Every day.
16.3. Control of Robots and Robot Swarms
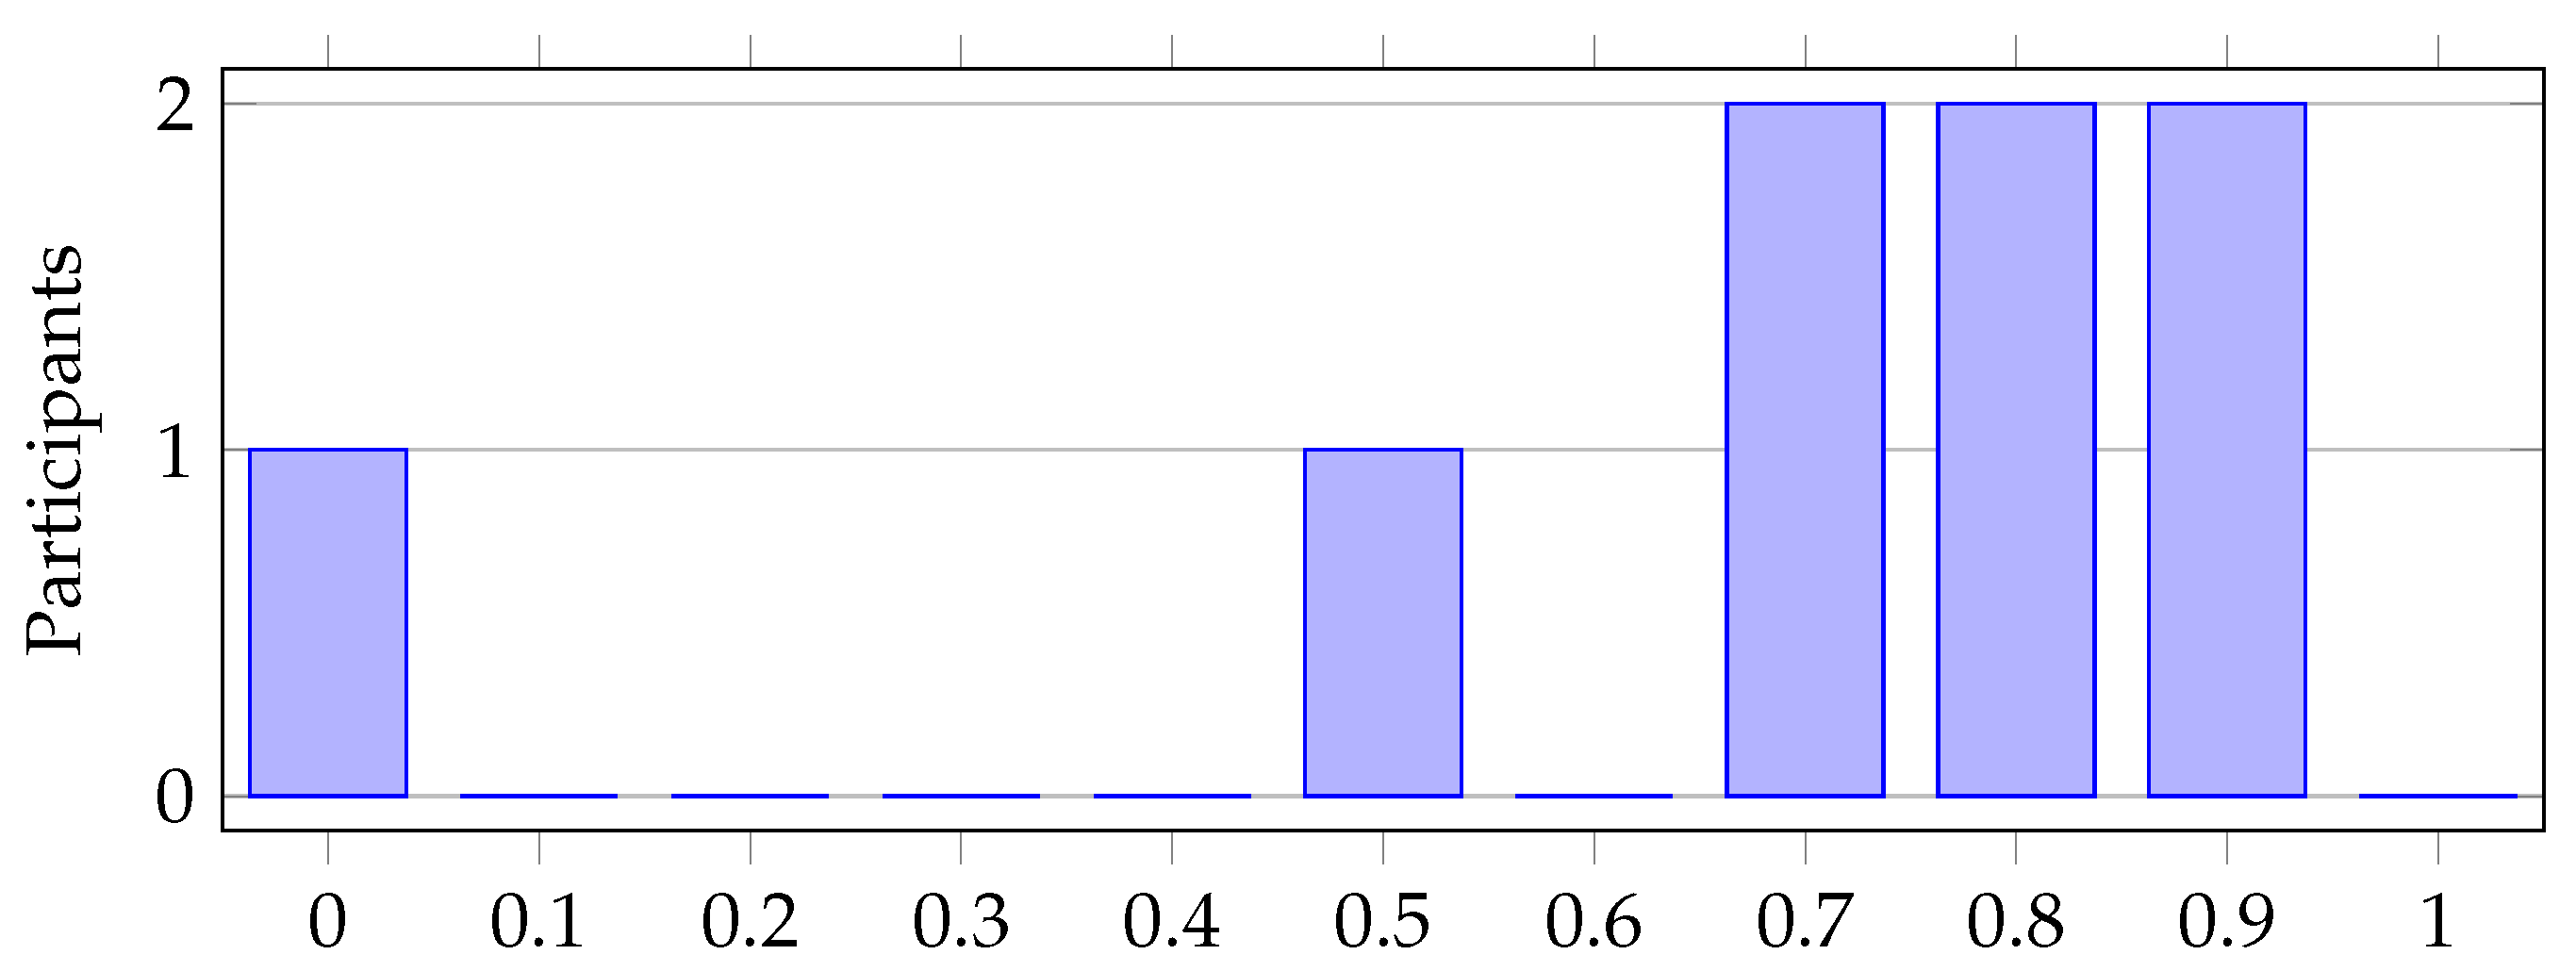
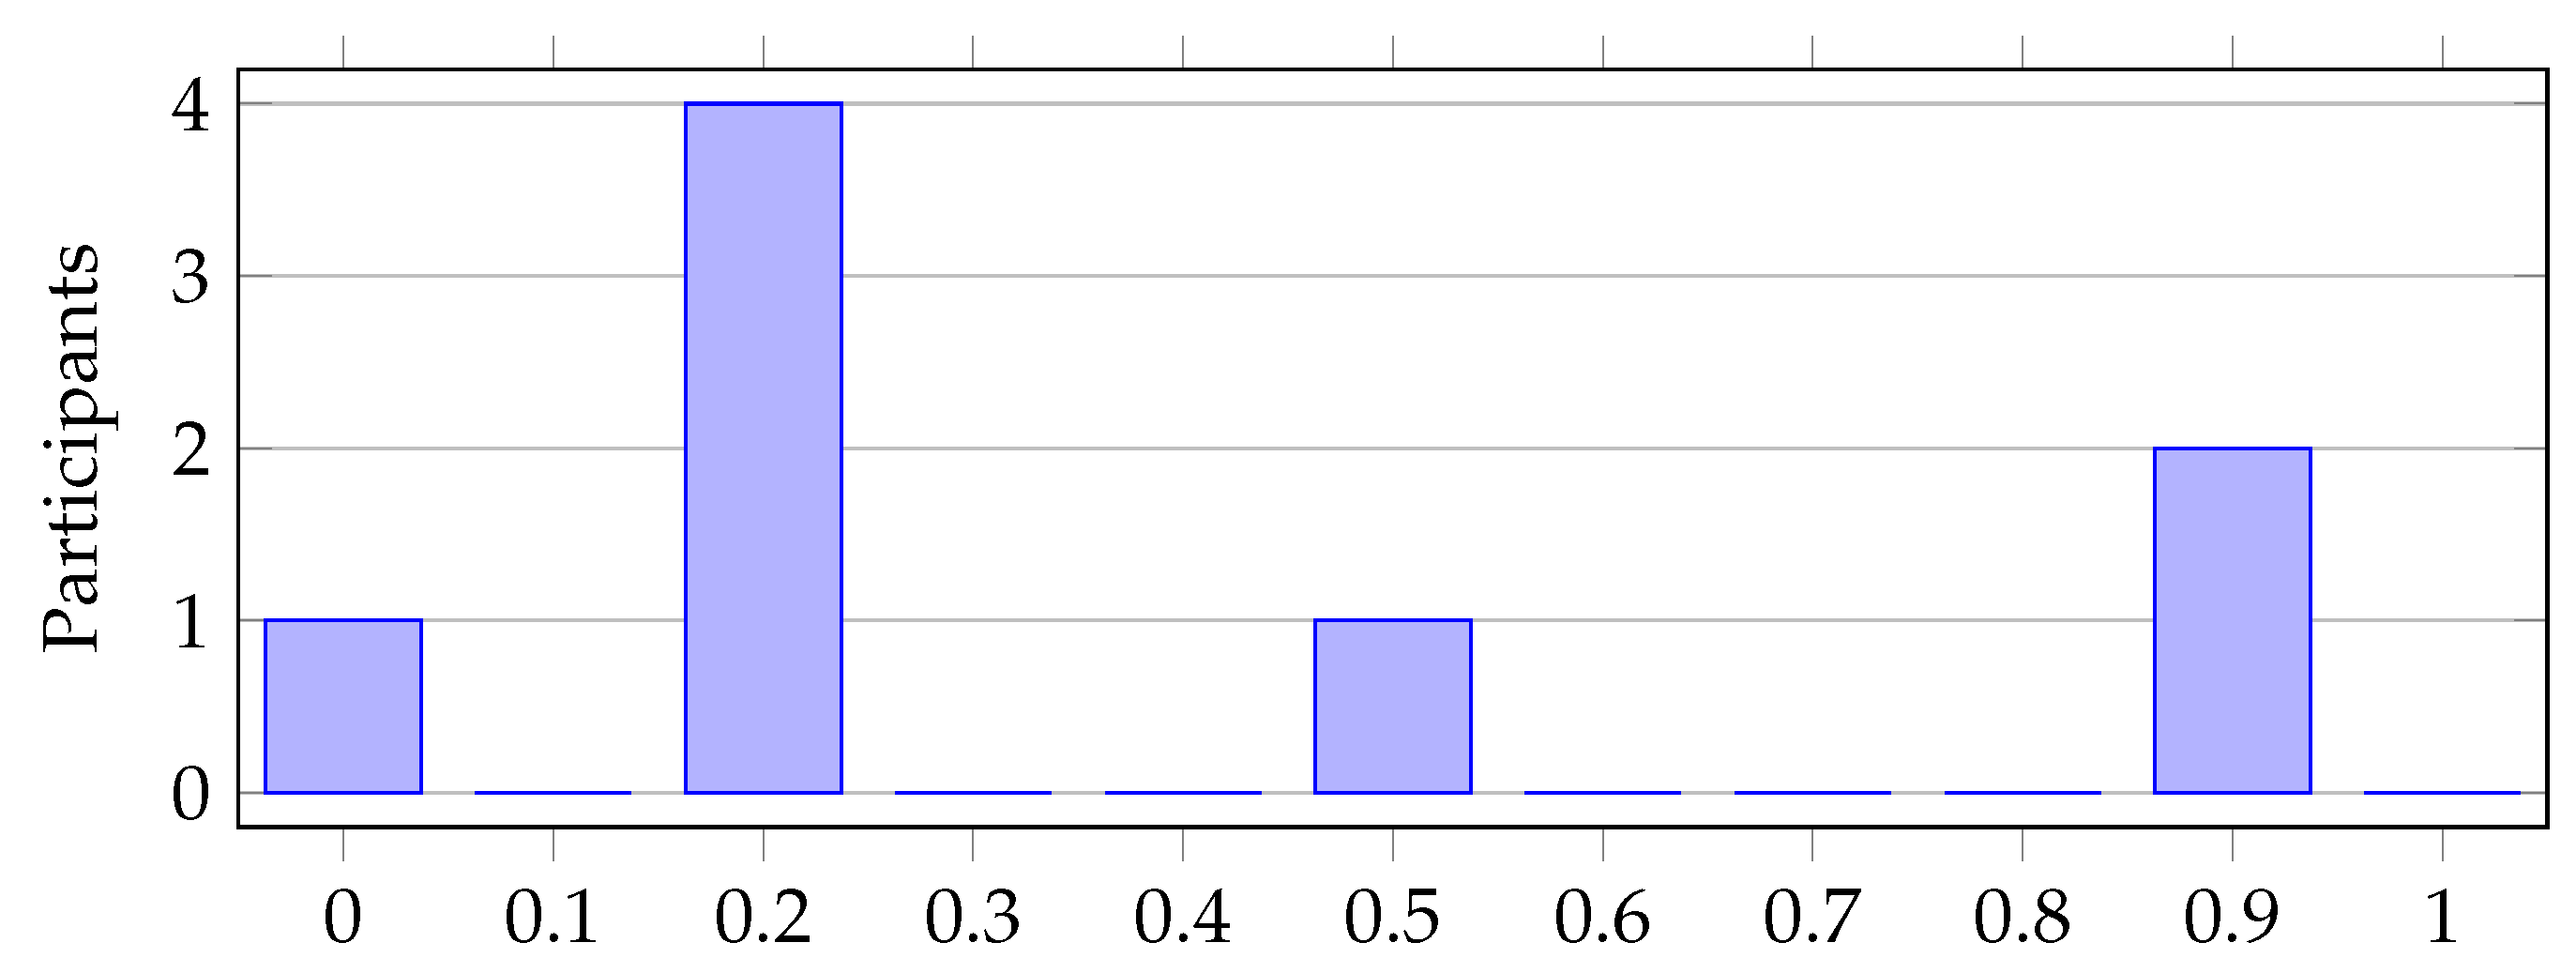
The results in
Table 8 indicate that the participants feel significantly more confident in controlling individual robots with a mean value of 0.66 compared to controlling robot swarms, where the mean value is only 0.39. Although some experience in controlling robot swarms exists, it is less pronounced. The two high standard deviations suggest a greater variation in the participants’ level of experience within the sample.
Table 8.
Evaluation of the questions: How would you rate your experience in controlling robots? and How would you rate your experience in controlling robot swarms?
Table 8.
Evaluation of the questions: How would you rate your experience in controlling robots? and How would you rate your experience in controlling robot swarms?
Figure 13.
How would you rate your experience in controlling robots? 0-No experience, 1-Expert.
Figure 13.
How would you rate your experience in controlling robots? 0-No experience, 1-Expert.
Figure 14.
How would you rate your experience in controlling robot swarms? 0-No experience, 1-Expert.
Figure 14.
How would you rate your experience in controlling robot swarms? 0-No experience, 1-Expert.
16.4. Handling VR Technologies and Video Games
The goal is to investigate whether concepts of VR technology, such as a simple human pointing model
2 [
9], can be used without further training or if participants already have experience from other areas such as video games or VR applications. Whether there is a connection between VR and video game experience in relation to the experiment will be summarized in Chapter 23.1. The level of experience in video game usage is twice as high as in the use of VR applications (see
Table 9). Therefore, it can be assumed that the participants already have a good understanding of interactive multimedia techniques. However, the individual participants’ experience values are widely spread due to the two high standard deviations.
Table 9.
Evaluation of the questions: How would you rate your experience with video games? and How would you rate your experience with VR/AR technologies in relation to video games or other applications?
Table 9.
Evaluation of the questions: How would you rate your experience with video games? and How would you rate your experience with VR/AR technologies in relation to video games or other applications?
Figure 15.
How would you rate your experience with video games? 0-No experience, 1-Expert.
Figure 15.
How would you rate your experience with video games? 0-No experience, 1-Expert.
Figure 16.
How would you rate your experience with VR/AR technologies in relation to video games or other applications? 0-No experience, 10-Expert.
Figure 16.
How would you rate your experience with VR/AR technologies in relation to video games or other applications? 0-No experience, 10-Expert.
16.5. Summary of Preliminary Survey
In summary, the participants are all familiar with computer usage. Regarding their knowledge of robots, the data shows that the participants have some experience with robots and robot swarms, although the average frequency of interaction is low. The large standard deviations suggest that some participants have more knowledge and experience in robotics than others. Experience in multimedia applications is present, indicating a good level of experience in video games. However, the majority of participants have little experience with VR, starting the experiment with limited VR experience.
17. Effectiveness
To determine which HSI was more effective in completing the mission, the time taken for successful completion was measured separately for each mission execution. The behavior of the different HSIs was monitored both with small UAV swarms (5 UAVs) and larger UAV swarms (10 UAVs). A mission was considered unsuccessful if the participant was unable to complete the mission within 10 minutes.
Table 10 shows that only the VR-HSI with 5 UAVs had an unsuccessful mission. However, both interfaces have a very high success rate (Desktop - 100%, VR - 87.5%), indicating that both are suitable for use as HSIs.
Table 10.
Overview of successful and unsuccessful missions.
Table 10.
Overview of successful and unsuccessful missions.
| Mission |
VR 5 UAVs |
VR 10 UAVs |
Desktop 5 UAVs |
Desktop 10 UAVs |
| Successful |
7 |
8 |
8 |
8 |
| Unsuccessful |
1 |
0 |
0 |
0 |
Table 11 presents the average completion times for each interface. It can be observed that the VR-HSI performs particularly well with larger UAV swarms. Although the Desktop-HSI is slightly more efficient with smaller swarms, the VR-HSI requires 25 seconds less on average to complete a mission.
Table 11.
Average time to complete a mission.
Table 11.
Average time to complete a mission.
| HSI |
5 UAVs |
10 UAVs |
Total |
| Desktop |
4:14 |
3:14 |
3:44 |
| VR |
4:37 |
2:00 |
3:19 |
Therefore, it can be assumed that for smaller UAV swarms, the Desktop interface is preferable over the VR-HSI, as the latter is slightly slower under these mission parameters and has a failure rate of 12.5%. However, if the mission parameters involve a swarm size of 10 or more UAVs, the VR-HSI surpasses the Desktop-HSI in terms of efficiency and performance.
18. Accuracy
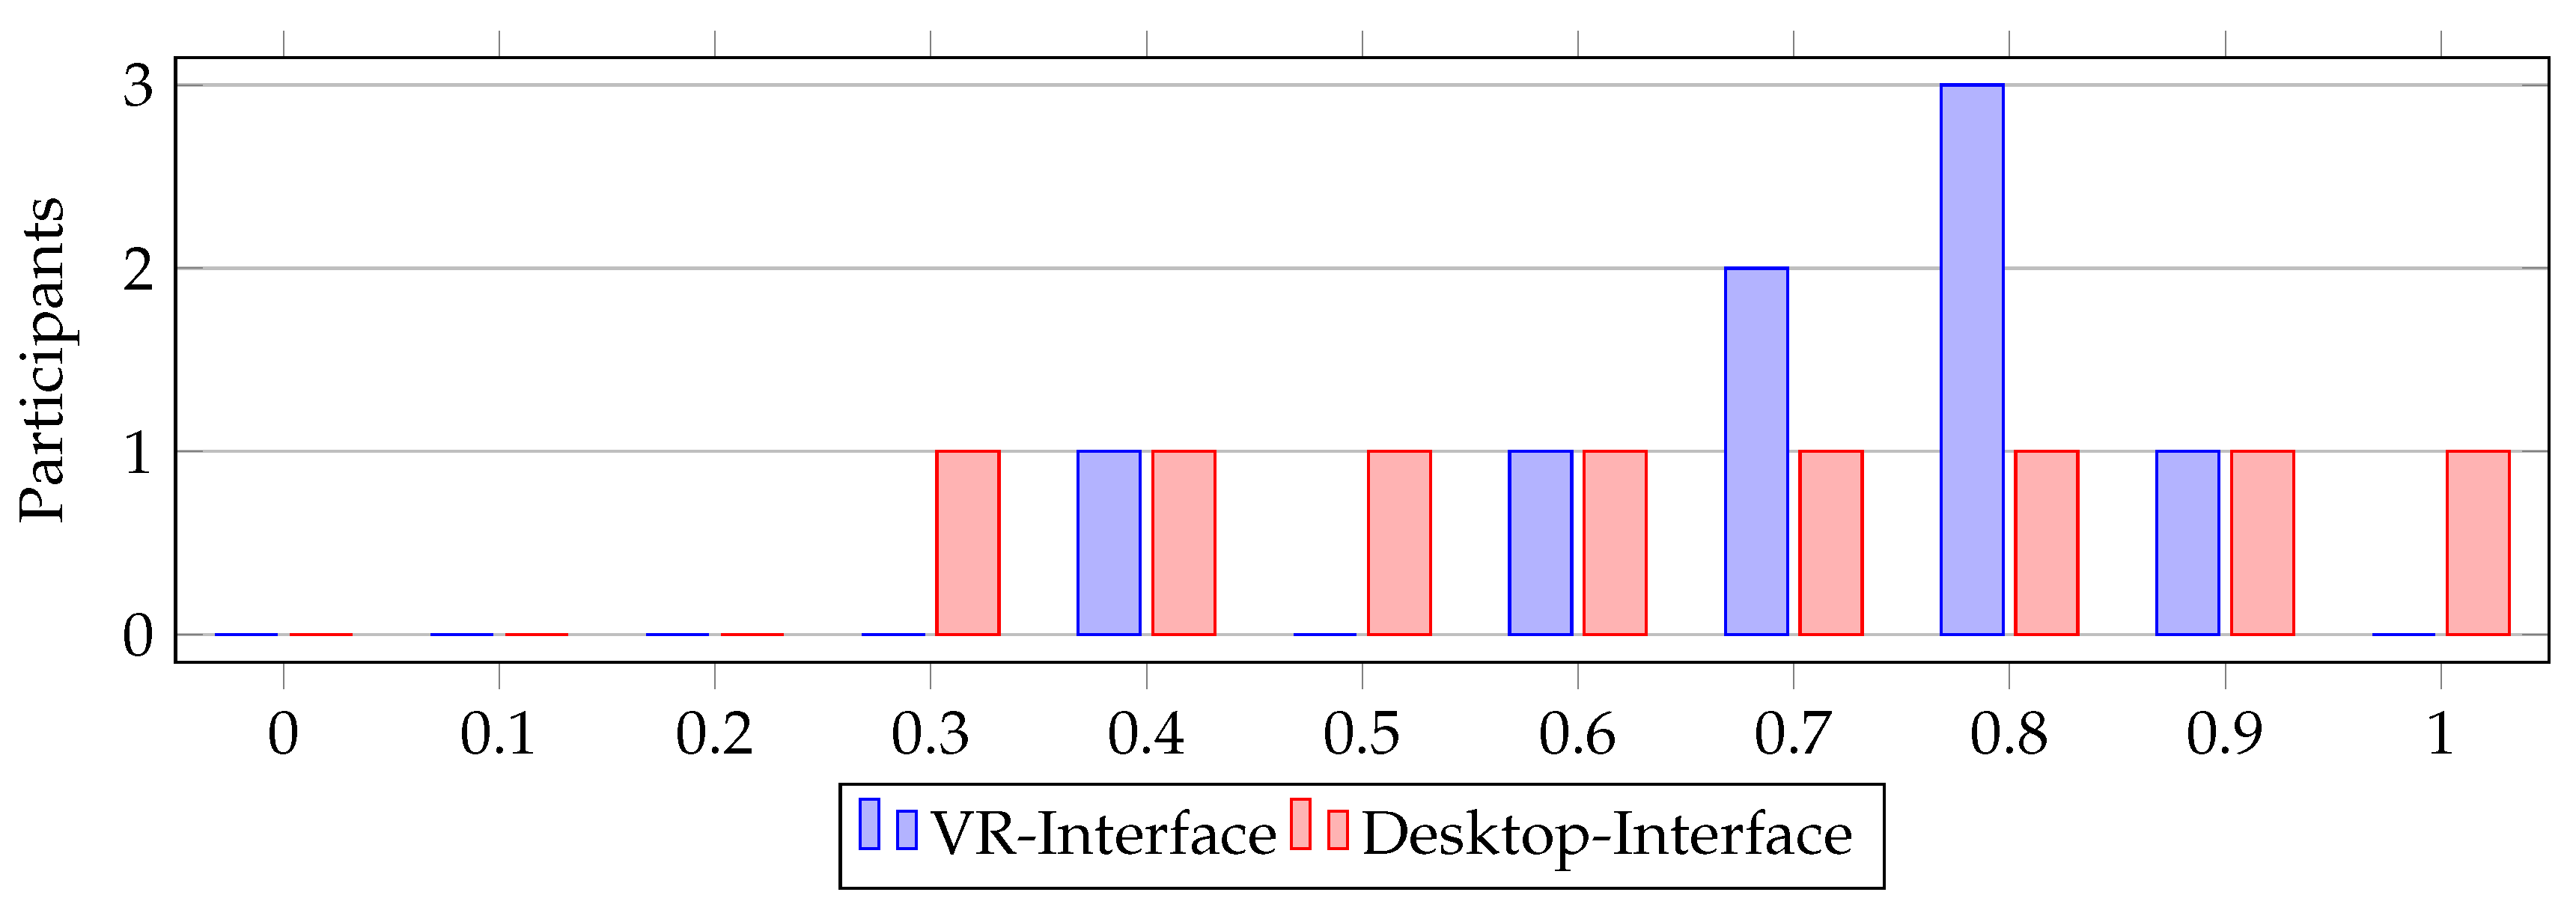
In the following, we will examine the accuracy of the interfaces shown in
Figure 18, measured by the correct execution of user-entered commands. Both interfaces perform well, with mean values of 0.66 (Desktop) and 0.7 (VR). However, the Desktop-Interface (Desktop-HSI) shows a higher dispersion towards lower values, as indicated by the standard deviation of 0.21, as shown in
Table 12. This becomes even more evident in
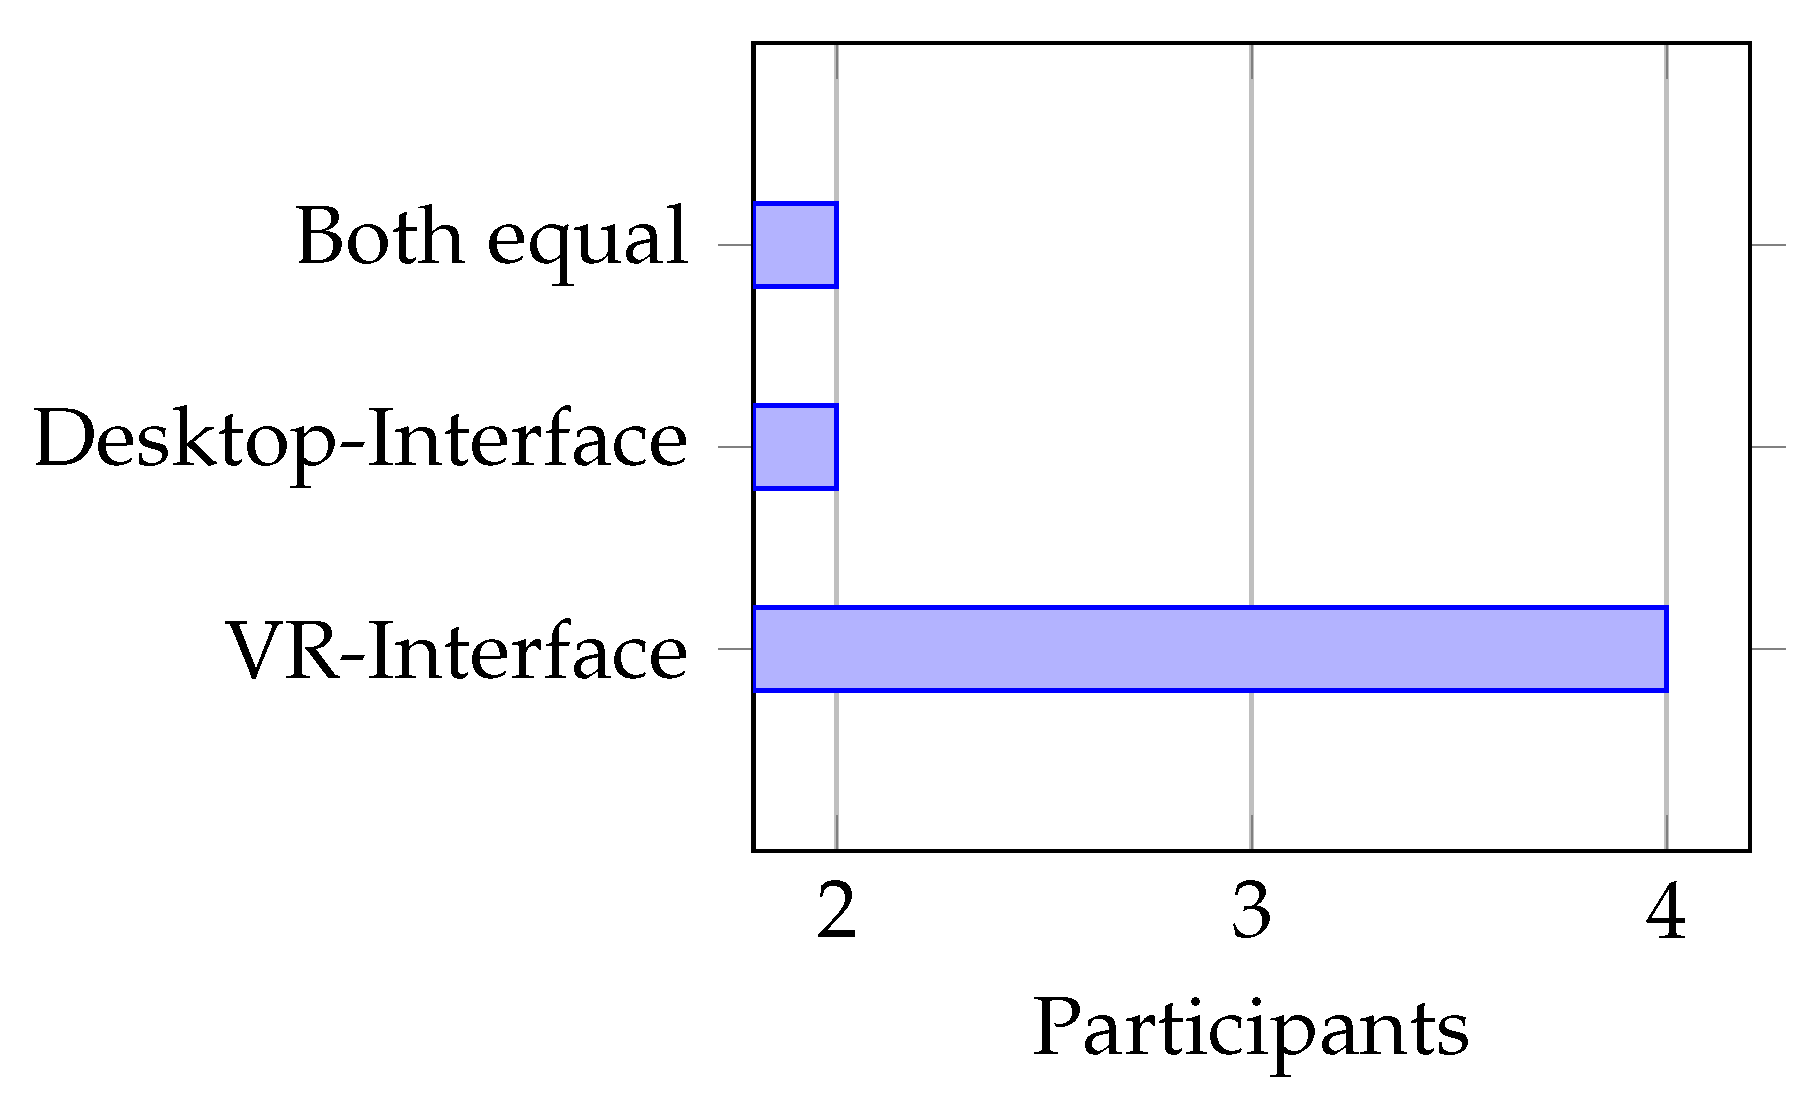
Figure 23, where the Desktop-HSI performs worse compared to the VR-HSI. During the debriefing, it was found that participants had difficulty abstracting information from the 2-dimensional map of the Desktop-HSI to their environment. In contrast, participants using the VR-HSI were directly present in the location of the swarm, receiving information and commands based on their line of sight and orientation. Therefore, they were able to provide the swarm with significantly more accurate instructions.
| HSI |
Mean |
Standard Deviation |
| Desktop |
0.66 |
0.21 |
| VR |
0.70 |
0.19 |
Figure 17.
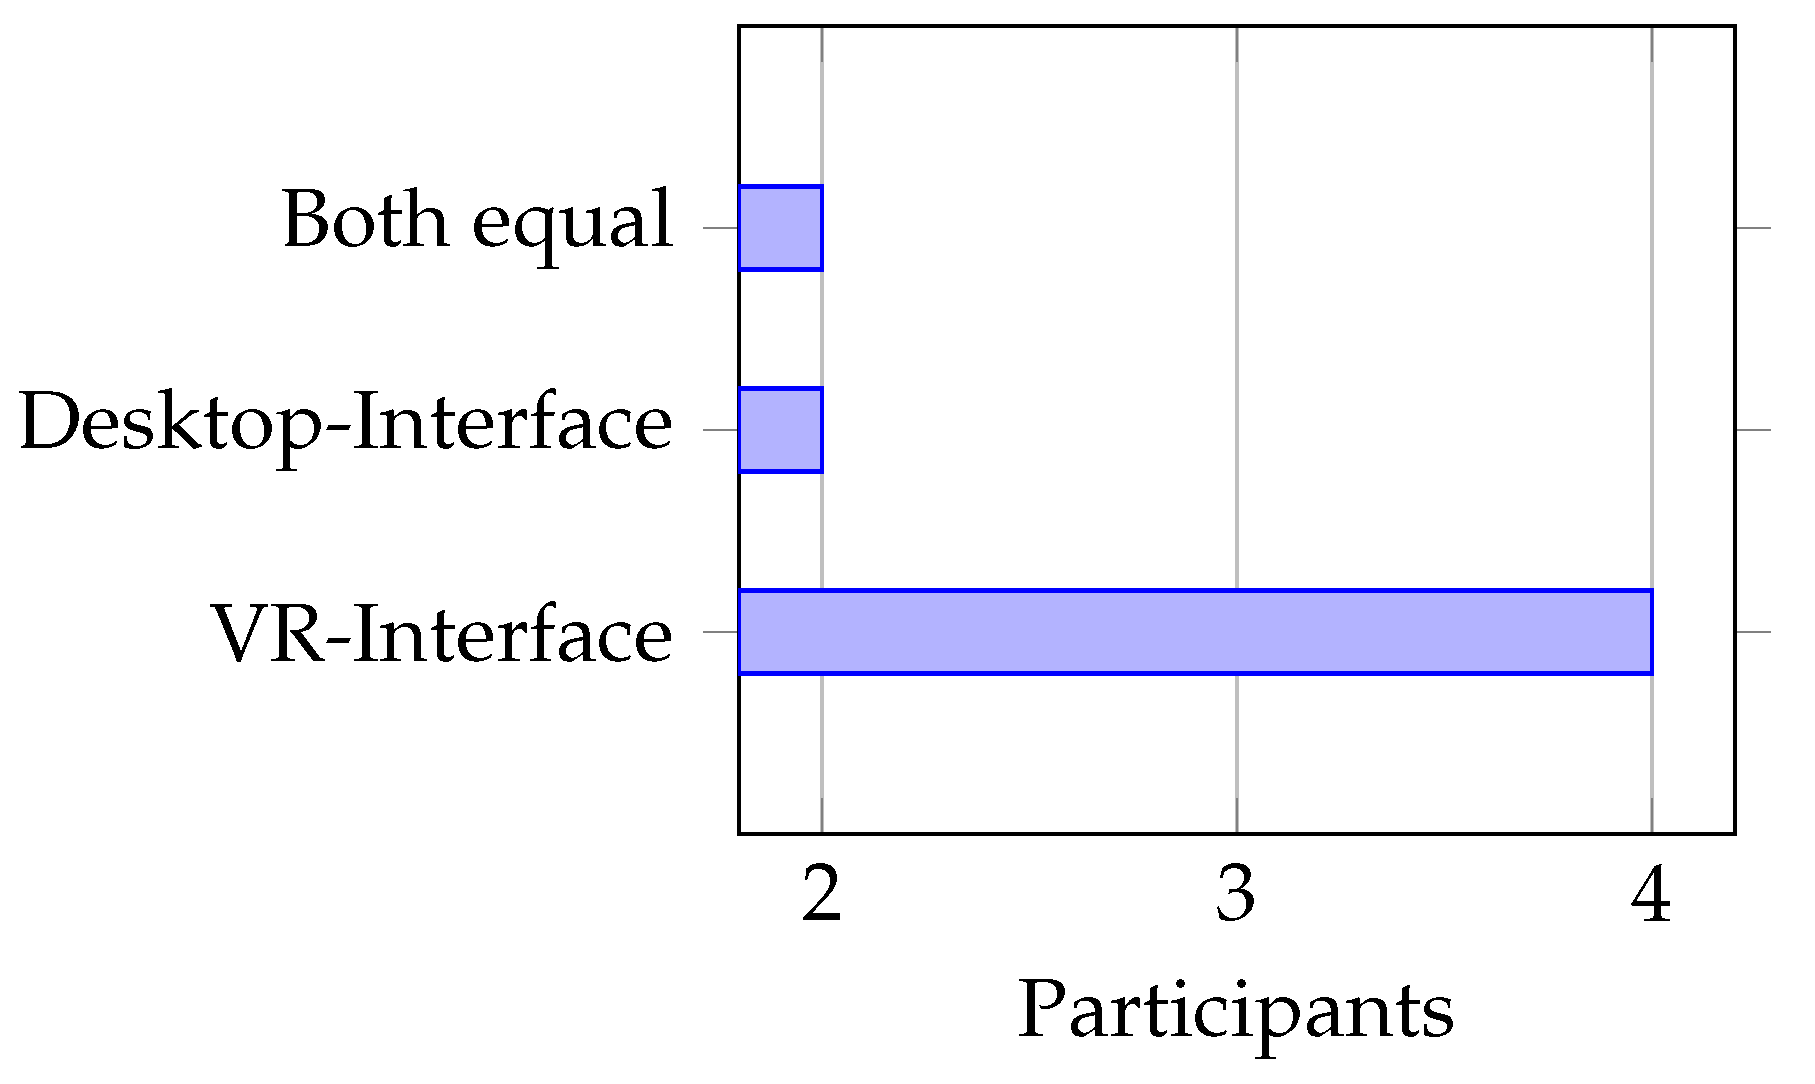
Which interface was more accurate in processing your inputs?
Figure 17.
Which interface was more accurate in processing your inputs?
Figure 18.
How do you rate the quality of communication regarding the instructions you provided to the swarm? 0-My instructions were not executed, 1-My instructions were executed precisely.
Figure 18.
How do you rate the quality of communication regarding the instructions you provided to the swarm? 0-My instructions were not executed, 1-My instructions were executed precisely.
19. Response Time
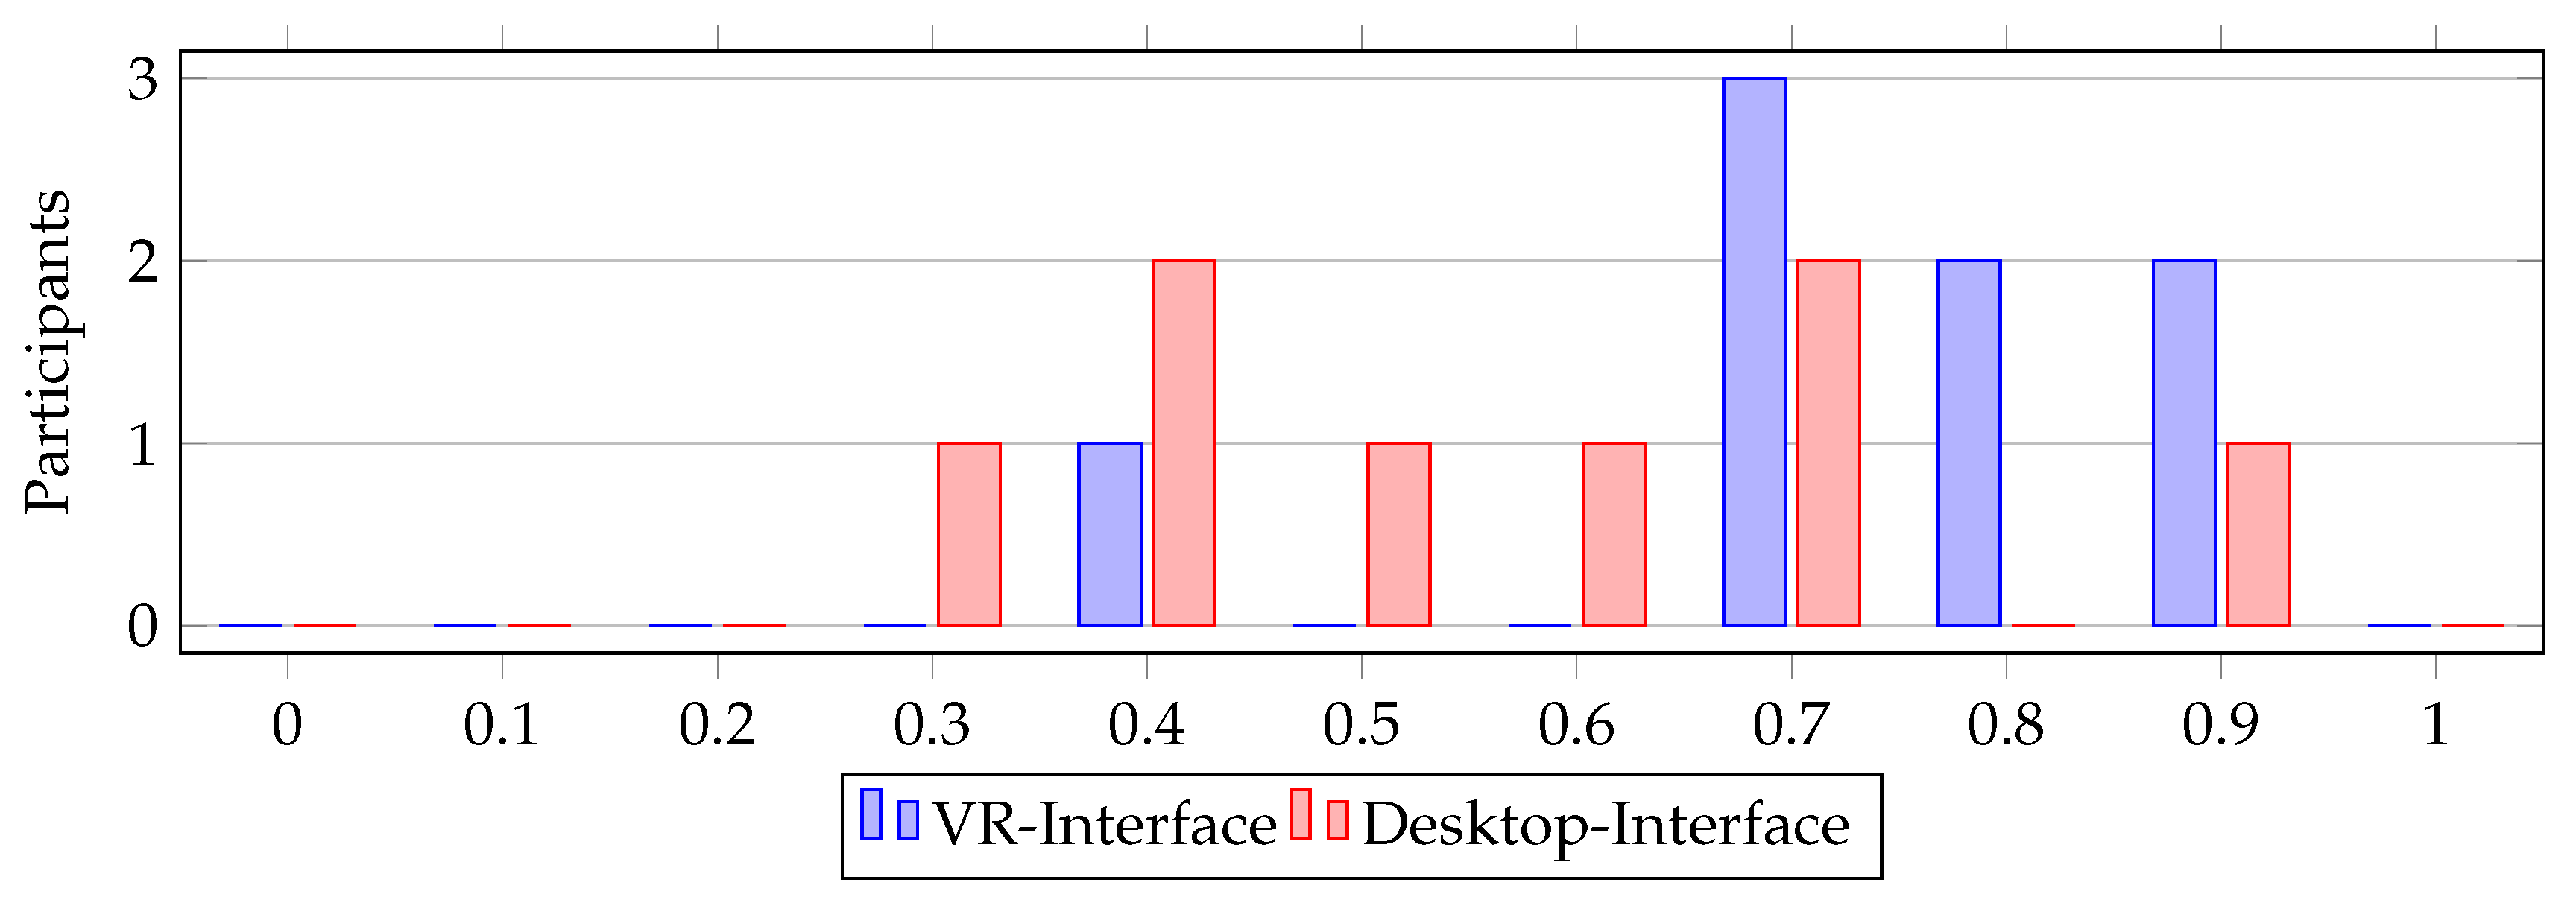
The response time heavily depends on when the participant issues the command. To ensure fast command execution, at least one UAV must be within the communication range of the HSI. Therefore, it is crucial to assess whether the HSI effectively conveys to the user whether a connection to the swarm exists. In the Desktop-HSI, this was achieved through the UAV footprint on the trust map. When high values were observed, it could be inferred that UAVs were recently nearby and still had to be present in the vicinity. Most participants were able to interpret the trust map well and achieved good response times, as shown in
Table 13. However, participants’ evaluations varied significantly, as evident from
Figure 19 and the standard deviation in
Table 13. Some participants struggled with the interpretation and chose poor timing to issue their commands. In contrast, the timing of command issuance in the VR-HSI was significantly better, as participants could access the same tool as in the Desktop-HSI and additionally visually inspect the UAVs near them through the interface. This is supported by the high mean value of 0.71 and low standard deviation of 0.16 in
Table 13.
Figure 19.
Were your commands executed promptly or within a relevant timeframe? 0-No, 1-Executed immediately and were relevant.
Figure 19.
Were your commands executed promptly or within a relevant timeframe? 0-No, 1-Executed immediately and were relevant.
| HSI |
Mean Value |
Standard Deviation |
| Desktop |
0.65 |
0.24 |
| VR |
0.71 |
0.16 |
20. Usability
Usability is divided into three subcategories: the way information about the swarm is presented, the way information about the mission objective is presented, and finally, the interface itself.
20.3. User-friendliness of the Interface
The user-friendliness of the interface refers to how well the various UI elements are understood and structured.
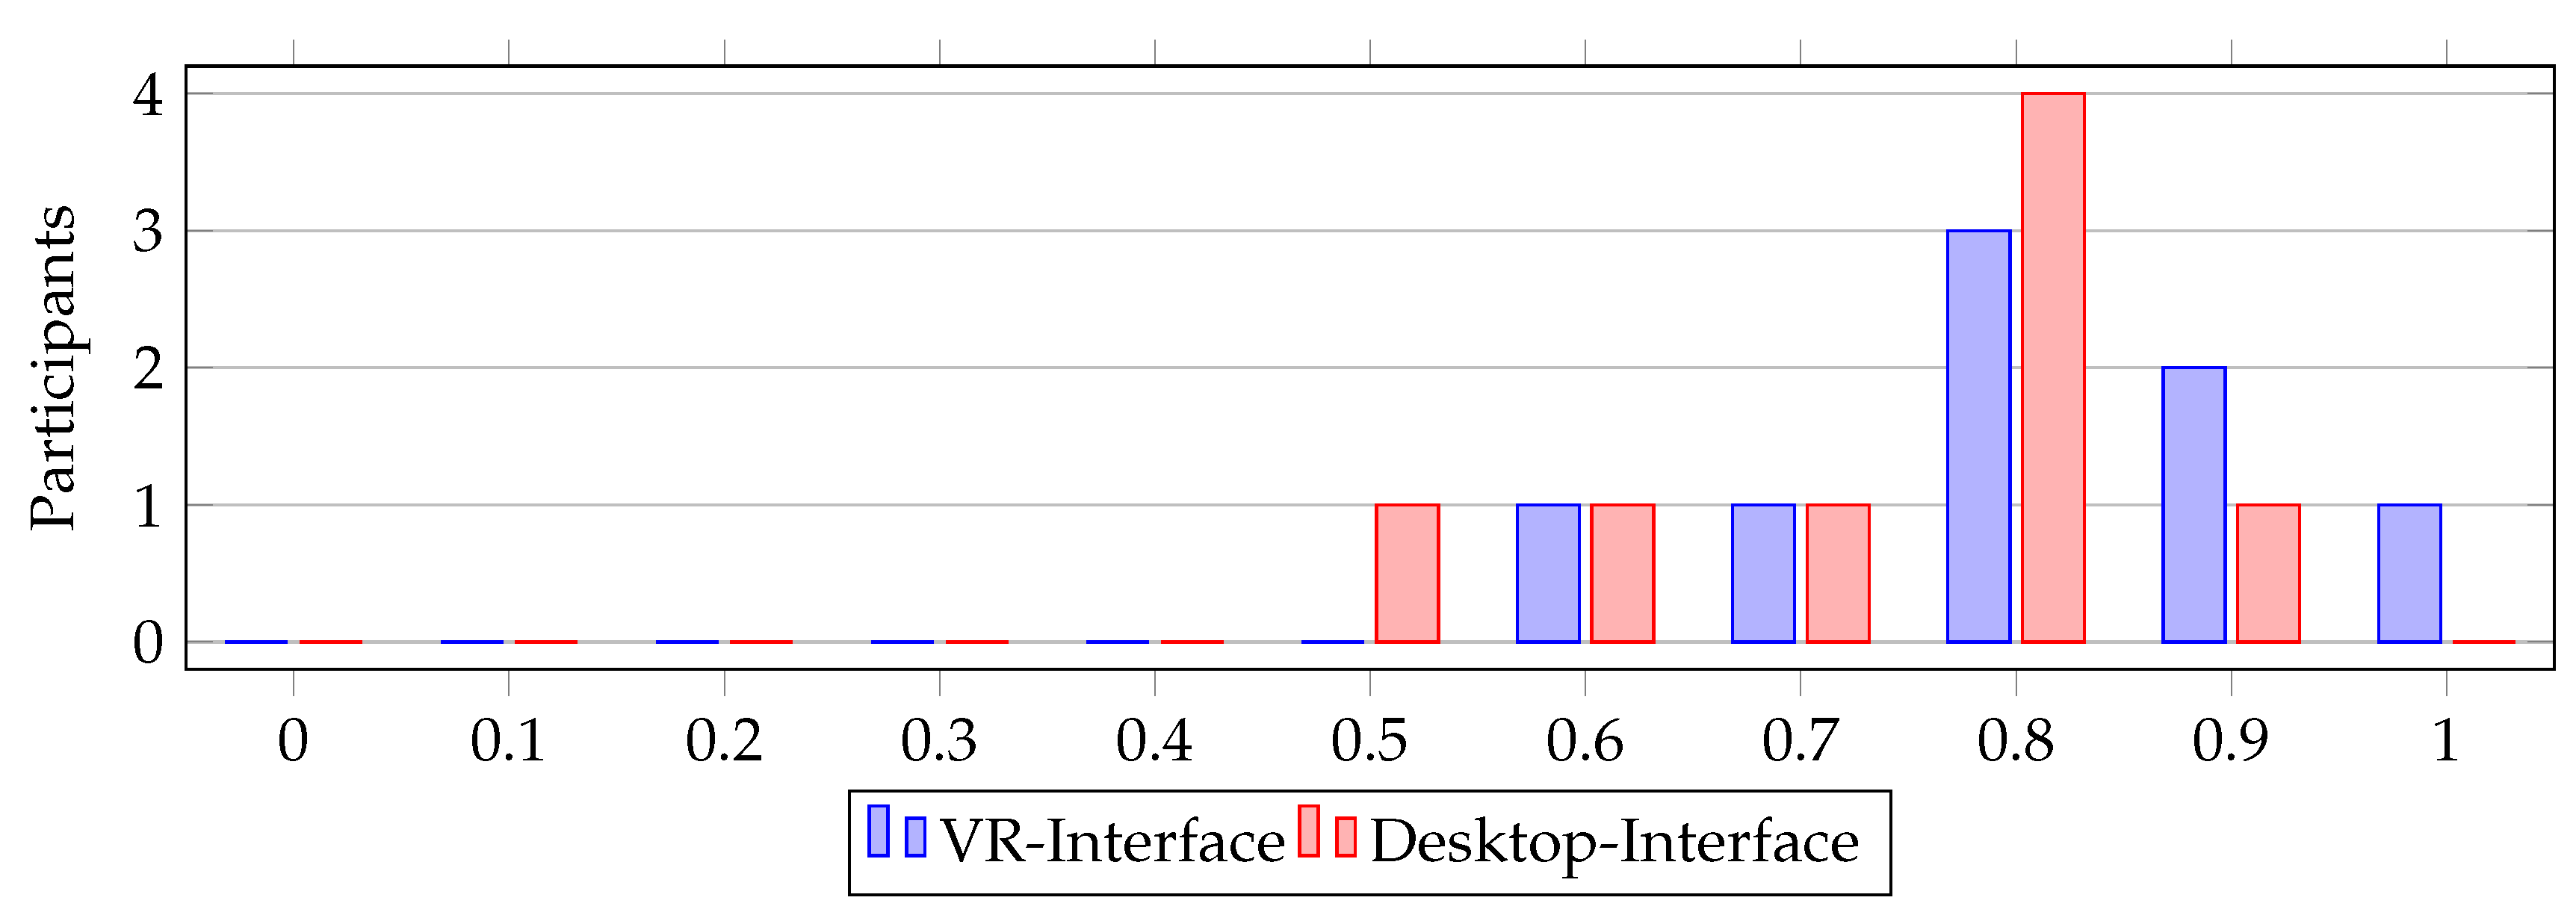
Table 16 shows that both interfaces were rated as highly user-friendly by the participants and had only minimal differences.
Although the majority of participants indicated that they were not particularly familiar with VR interfaces (more on this in the Discussion chapter), the VR-HSI performed better in terms of user-friendliness than the Desktop-HSI. However, it is important to note that six out of eight participants required further familiarization with the concepts of VR GUIs
3 The Desktop GUI was immediately understood by all participants, which can be attributed to their daily use of computers (see
Figure 10). After trying both interfaces, the majority of participants found the VR-HSI easier to use (see
Figure 23).
| HSI |
Mean Value |
Standard Deviation |
| Desktop |
0.74 |
0.13 |
| VR |
0.81 |
0.12 |
Figure 22.
How do you rate the clarity and user-friendliness of the communication and collaboration functions? 0-Not clear, 1-Very clear.
Figure 22.
How do you rate the clarity and user-friendliness of the communication and collaboration functions? 0-Not clear, 1-Very clear.
Figure 23.
Which interface was easier to use?
Figure 23.
Which interface was easier to use?
21. Immersion
Immersion is used to create an intense immersive experience in the swarm’s mission environment and activities. Internal information from the swarm is combined with external information from the environment. If the participants have had a good immersive experience, it is an indicator that they also perform significantly better in terms of efficiency and accuracy metrics [
12].
The evaluation in
Table 17 and
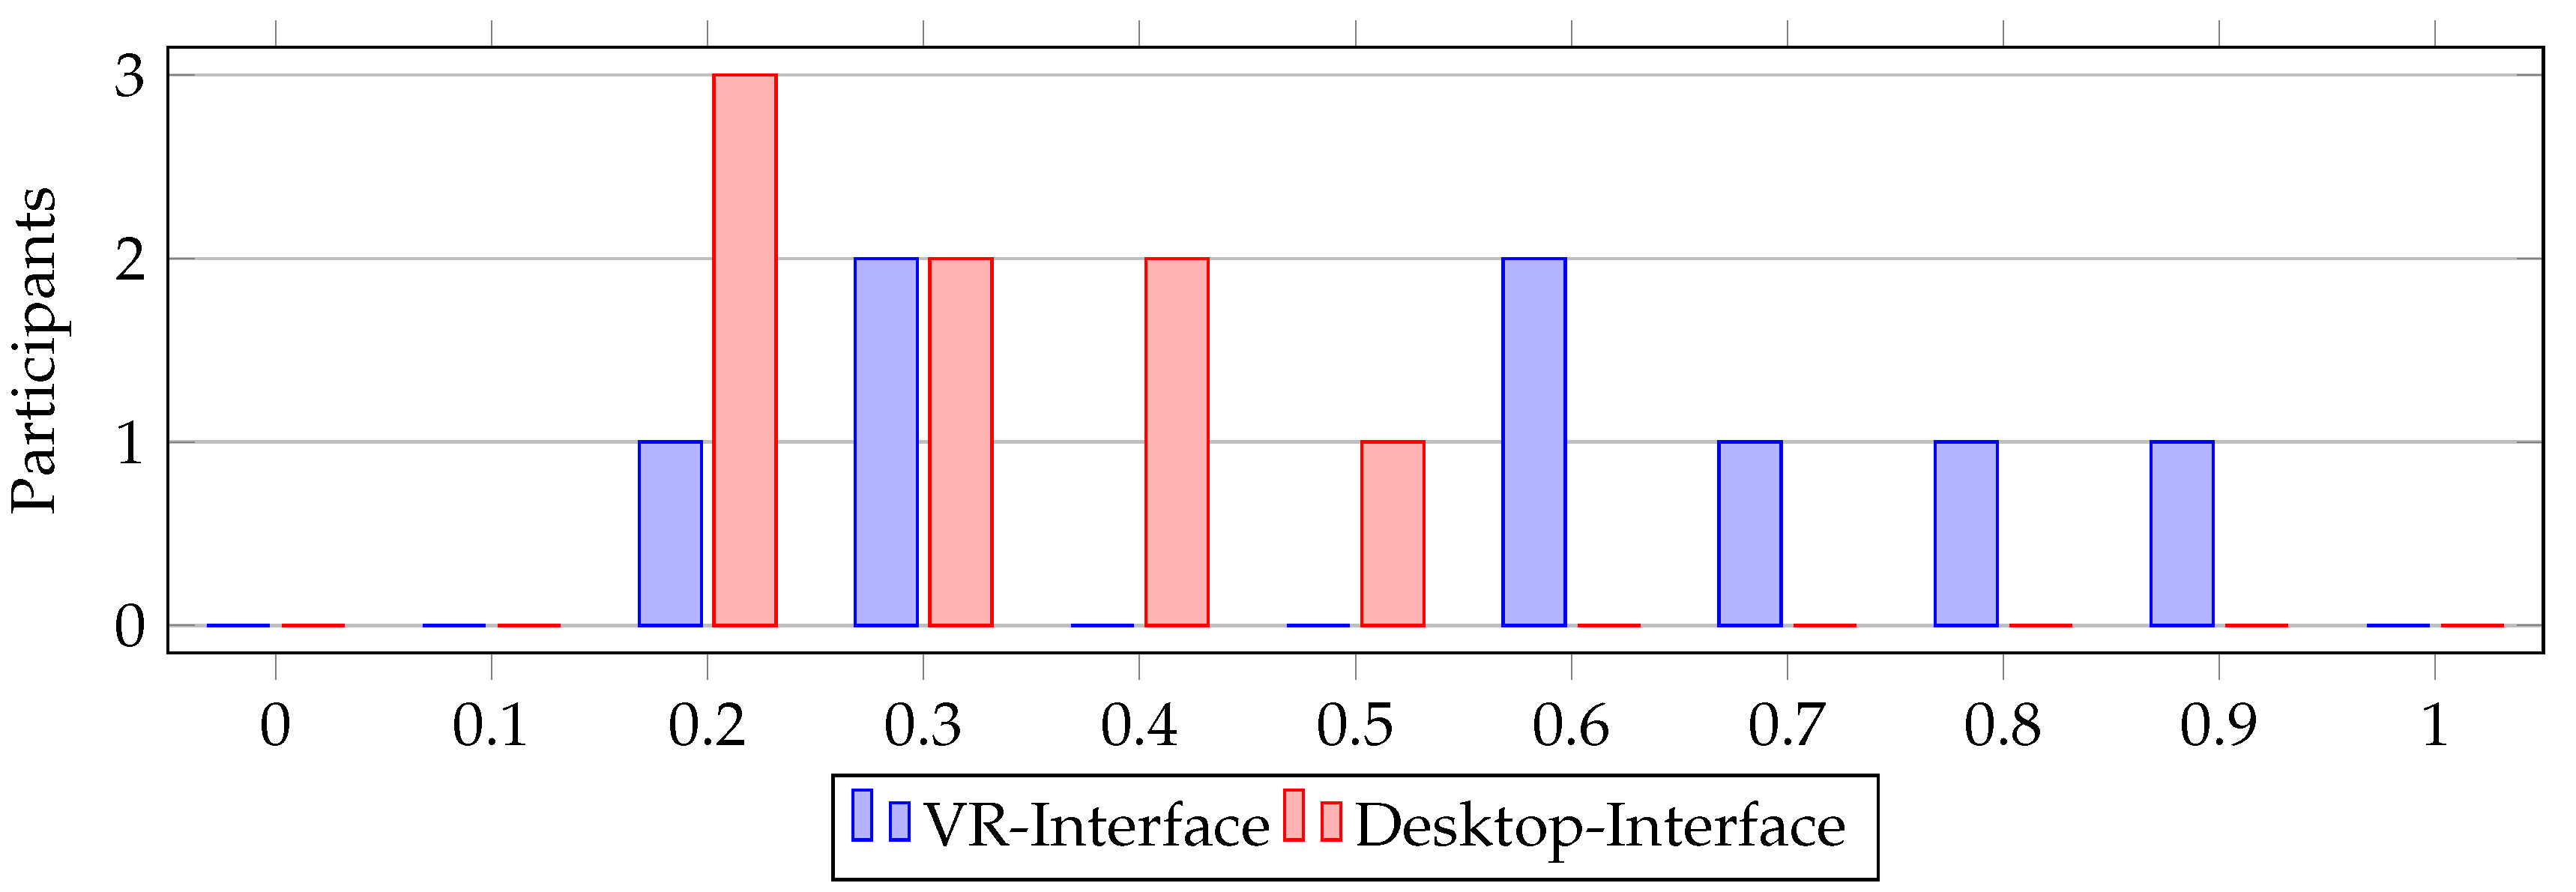
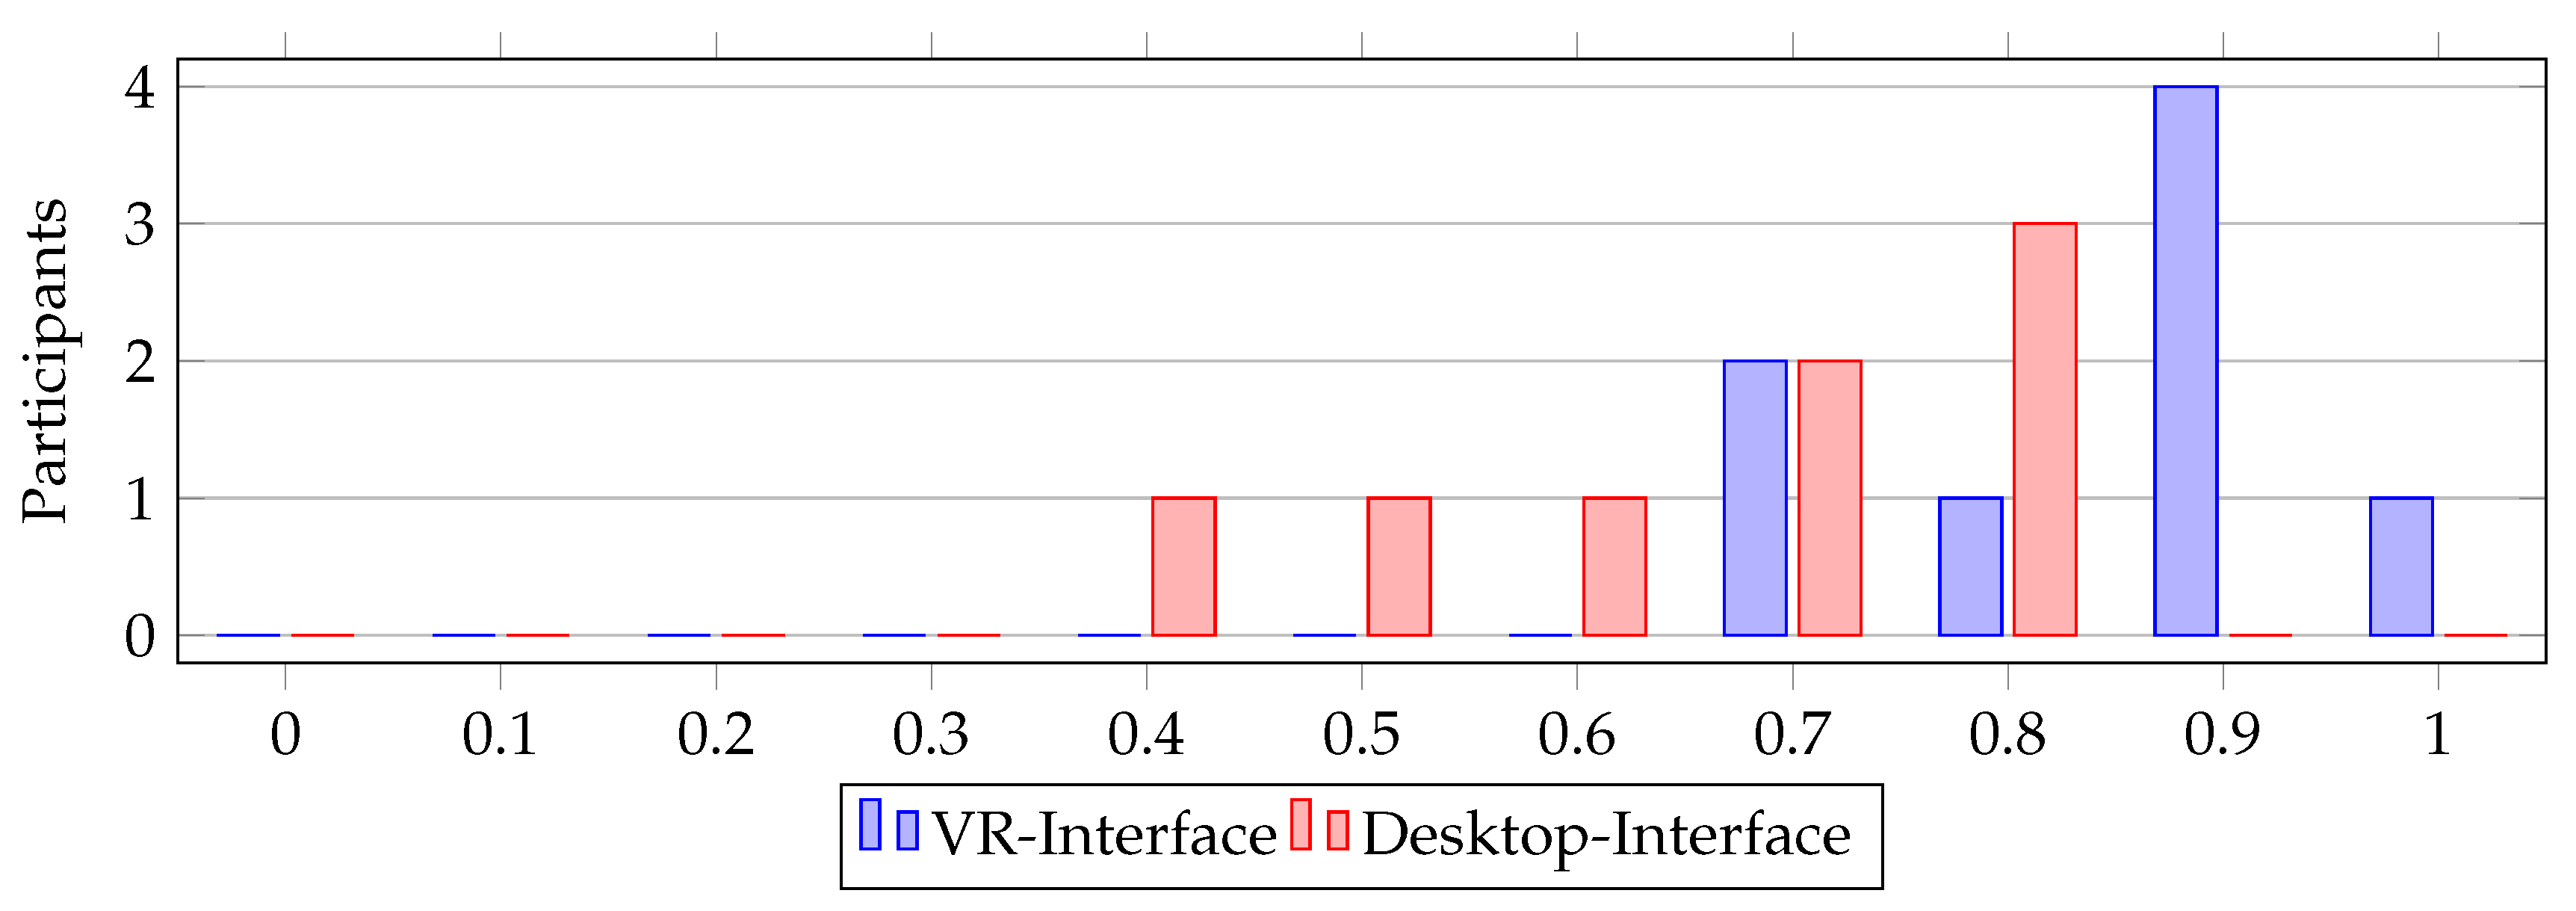
Table 18 shows that participants using the VR-HSI had a better sense of being part of the swarm and a better awareness of their environment. This suggests that the VR-HSI provides a better immersive experience for participants compared to the Desktop-HSI. This assumption is supported by
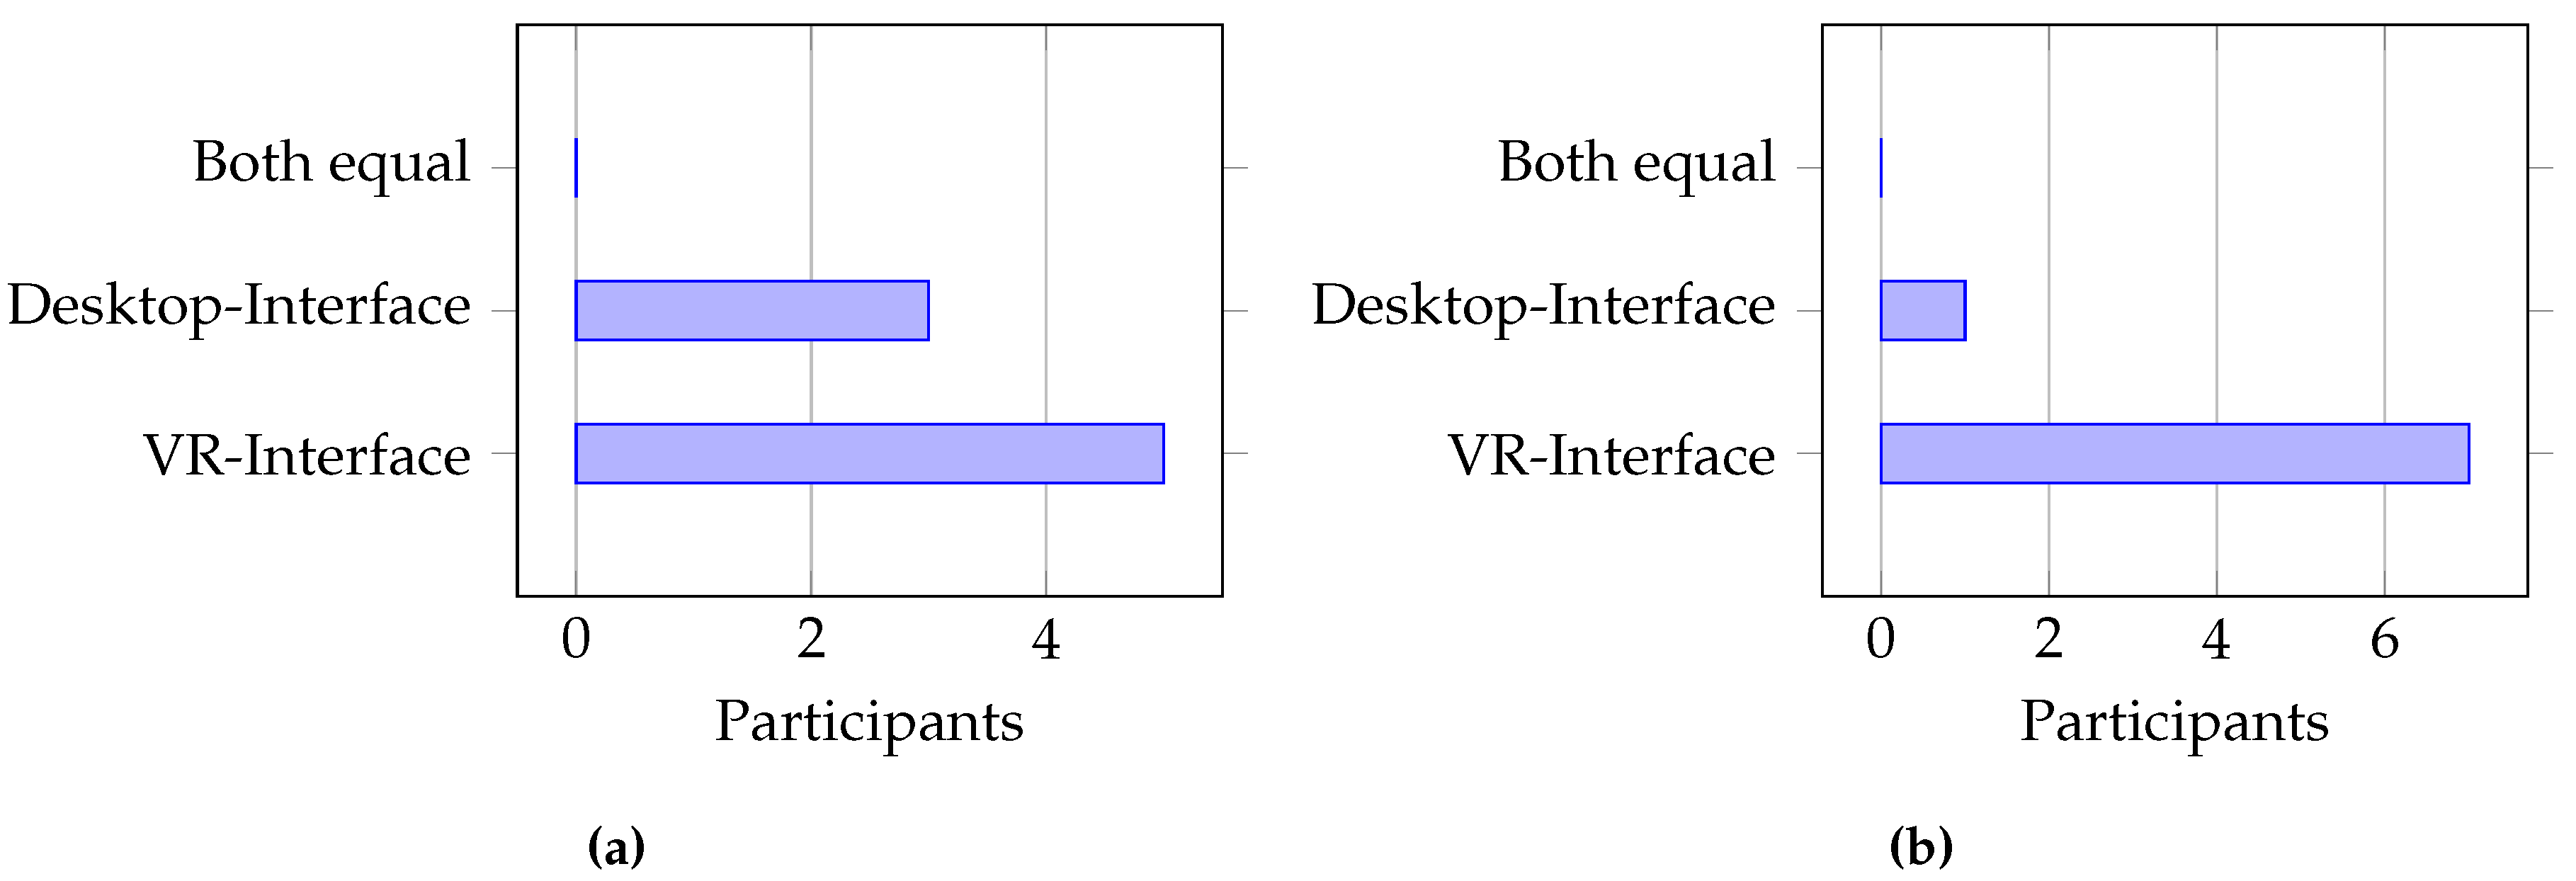
Figure 26a, where five out of eight participants perceived a better sense of the robots in the VR-HSI, and
Figure 26b, where seven out of eight participants felt more immersed in their environment.
| HSI |
Mean Value |
Standard Deviation |
| Desktop |
0.31 |
0.11 |
| VR |
0.55 |
0.26 |
| HSI |
Mean Value |
Standard Deviation |
| Desktop |
0.66 |
0.15 |
| VR |
0.85 |
0.11 |
Figure 24.
Did you feel like being part of the swarm? 0-I only felt like an observer, 1-I received and transmitted information.
Figure 24.
Did you feel like being part of the swarm? 0-I only felt like an observer, 1-I received and transmitted information.
Figure 25.
Were you able to get a sense of the situation with the given information? 0-I couldn’t learn anything about my surroundings, 1-I knew everything about my surroundings after the mission.
Figure 25.
Were you able to get a sense of the situation with the given information? 0-I couldn’t learn anything about my surroundings, 1-I knew everything about my surroundings after the mission.
Figure 26.
(a) Which interface gave you a better sense of the robots? and (b) Which interface allowed you to better understand the mission environment?
Figure 26.
(a) Which interface gave you a better sense of the robots? and (b) Which interface allowed you to better understand the mission environment?
22. Load
During the debriefing, five out of eight participants reported fatigue in their arms after the second run due to the weight of the iPad used in the VR-HSI. It is unclear whether this problem can be solved by using other technologies such as VR-Headset.
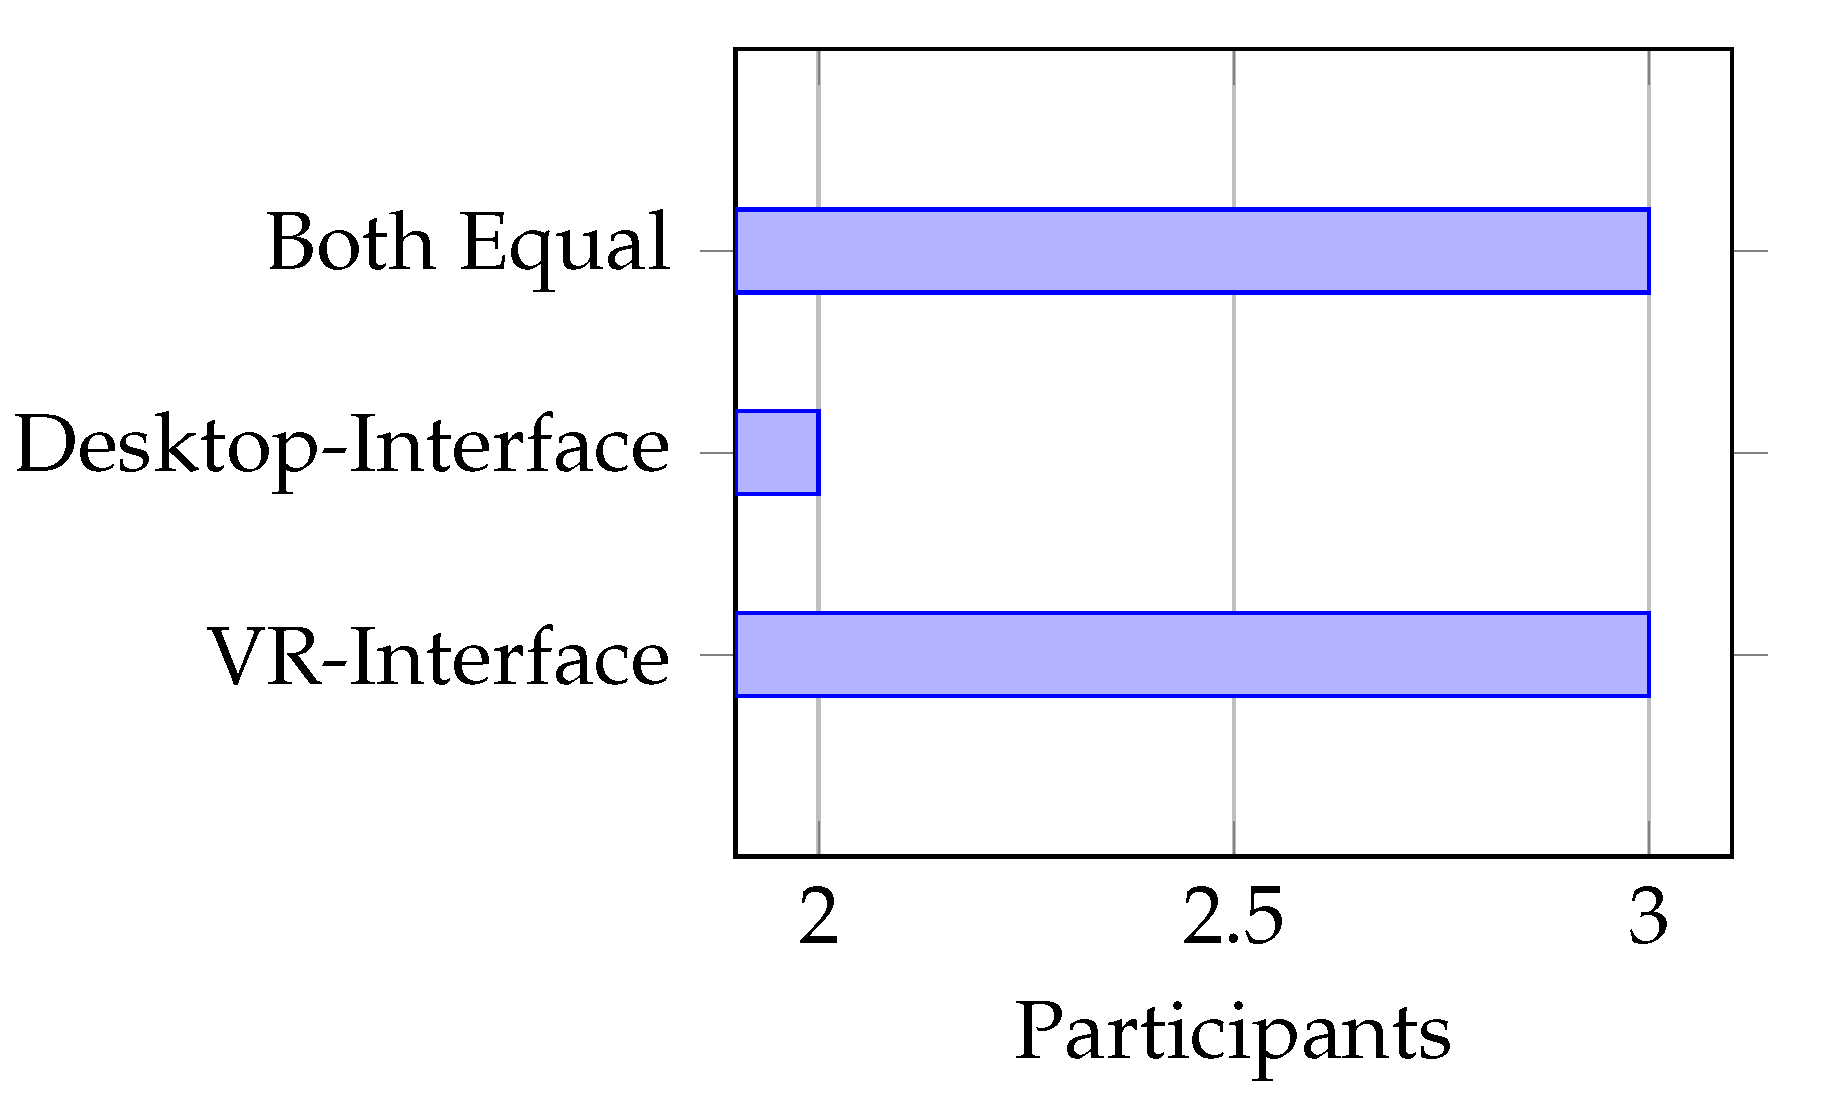
However, despite the perceived workload, the majority of participants preferred the VR-HSI over the Desktop-HSI for frequent use, as shown in
Figure 27.
Figure 27.
Which interface would you prefer for frequent use?
Figure 27.
Which interface would you prefer for frequent use?
Discussion
23. Interpretation
Due to our cognitive load capacity, swarm robotics systems are inherently complex and difficult to comprehend for humans [
2]. In the Desktop-HSI, the swarm and the user are further separated by the limitations of a traditional GUI. The desktop GUI can only provide the user with internal swarm information in the form of numerical values or interactive maps on the screen. Therefore, the user needs to have a certain level of abstraction to translate external information, which does not originate from the swarm itself, such as disasters or the overall behavior of the swarm, from reality to the GUI. Especially in situations where multiple tasks need to be performed simultaneously, participants struggle to effectively process this information, as indicated by the mean values measured in Chapter 21, which show a clear difference between the VR-HSI and the Desktop-HSI.
But what exactly makes the VR-HSI different in this regard? In the VR-HSI, the goal is to connect internal swarm information more closely with external environmental information by combining both sources (immersion). The swarm’s knowledge is not primarily presented in interactive maps but through the placement of beacons in the user’s environment. Through sensors such as gyroscopes and GPS, the VR-HSI precisely determines the distance and orientation at which the data from the swarm’s internal map needs to be placed in the user’s environment. This intertwined representation of information is the reason why the VR-HSI provides a better immersive experience. This is further supported by the question of whether participants were able to form a mental image of the situation based on the given information (
Figure 25). Due to the intertwined representation of internal and external information and its specific presentation, the VR-HSI significantly outperformed the Desktop-HSI in terms of forming a mental image, as indicated by the T-test in
Table 3 with a p-value of only 0.03.
Figure 28.
Left: The VR-HSI interprets the values from the trust map and places a beacon next to a disaster. Right: The Desktop-HSI marks significant values on the trust map with a red square.
Figure 28.
Left: The VR-HSI interprets the values from the trust map and places a beacon next to a disaster. Right: The Desktop-HSI marks significant values on the trust map with a red square.
The immersive experience of the user also has an impact on the user-friendliness. As can be seen in
Figure 21 in Chapter 20.3, the way the VR-HSI presents mission information in the form of beacons and thus links it to external information from the real world was rated better by the participants than the interactive maps of the Desktop-HSI.
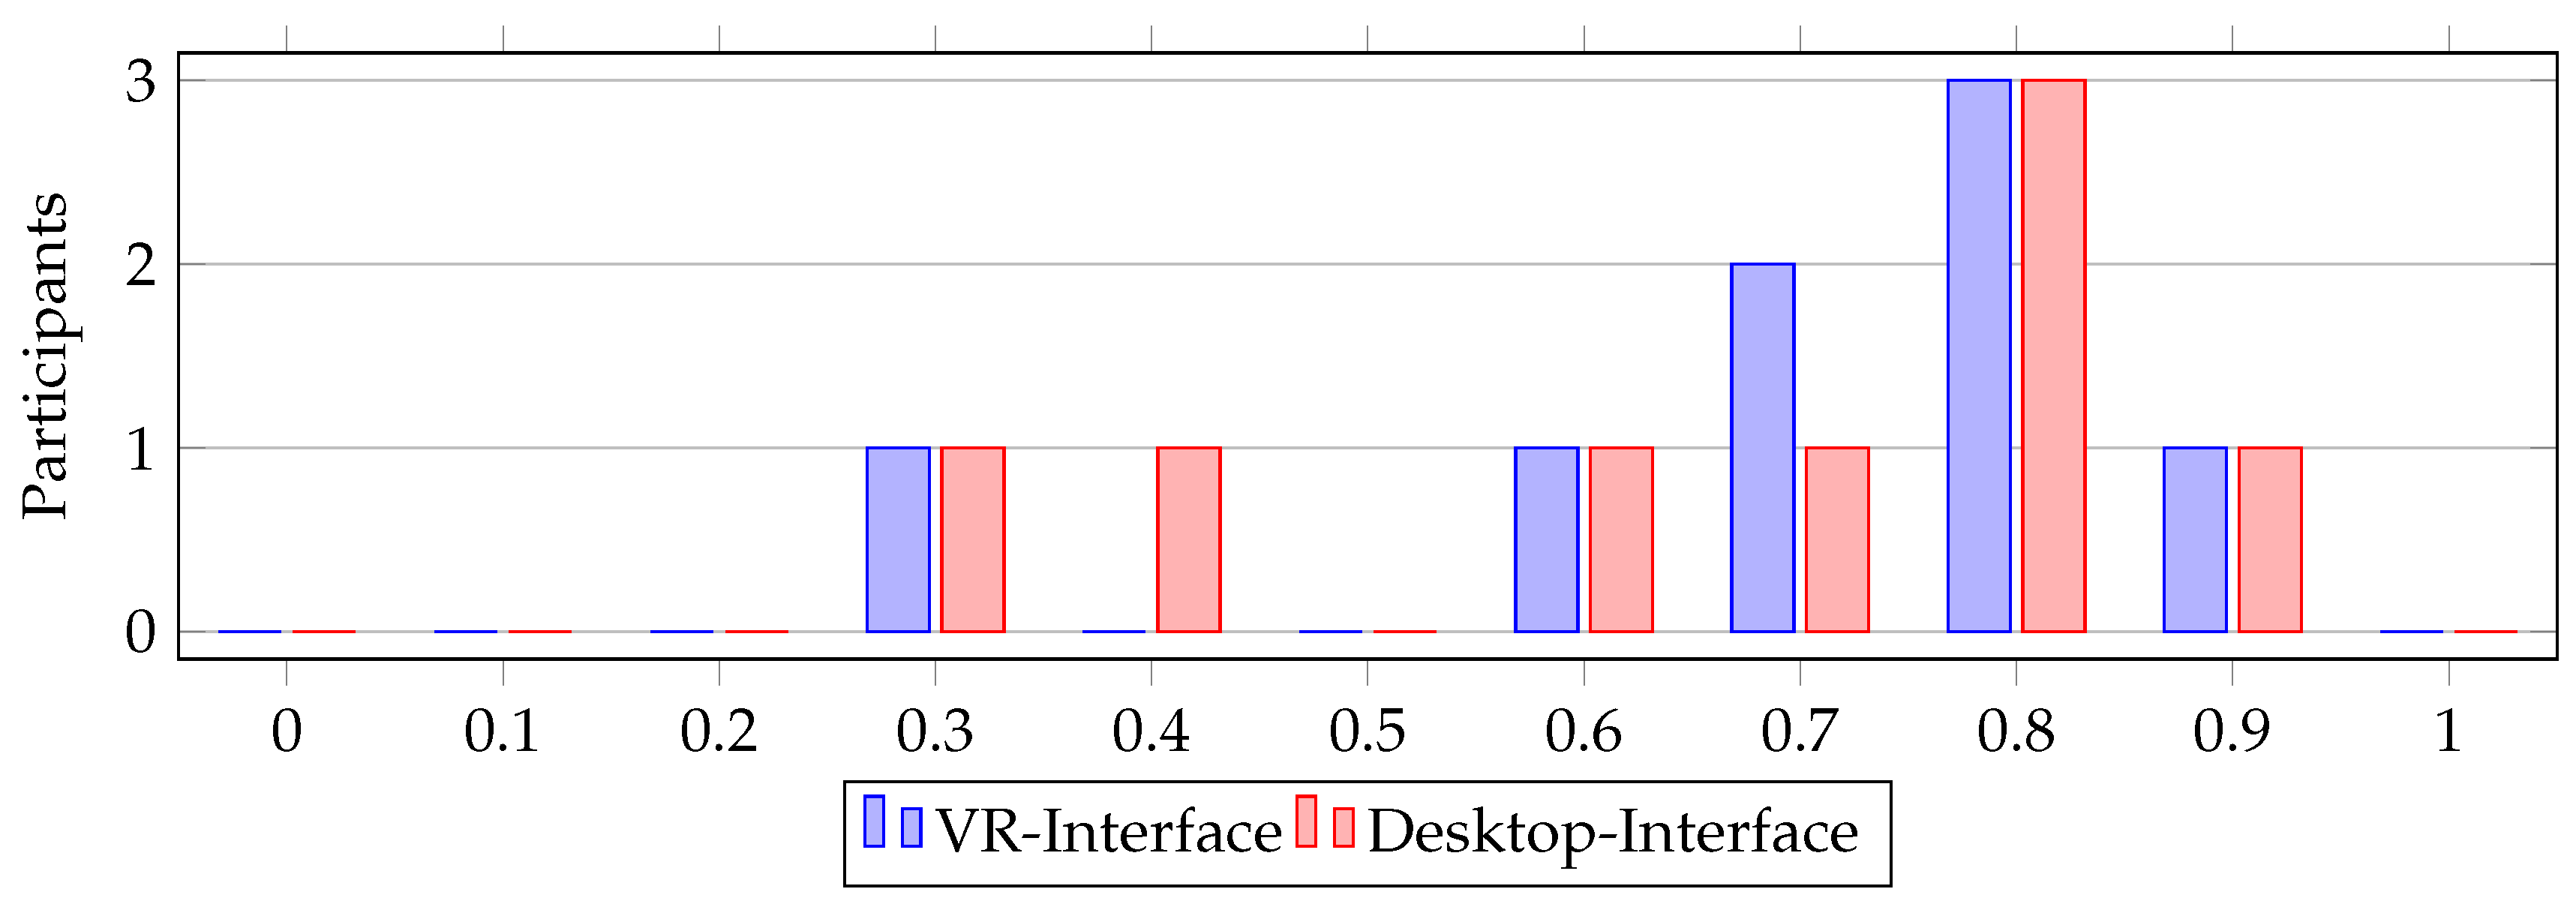
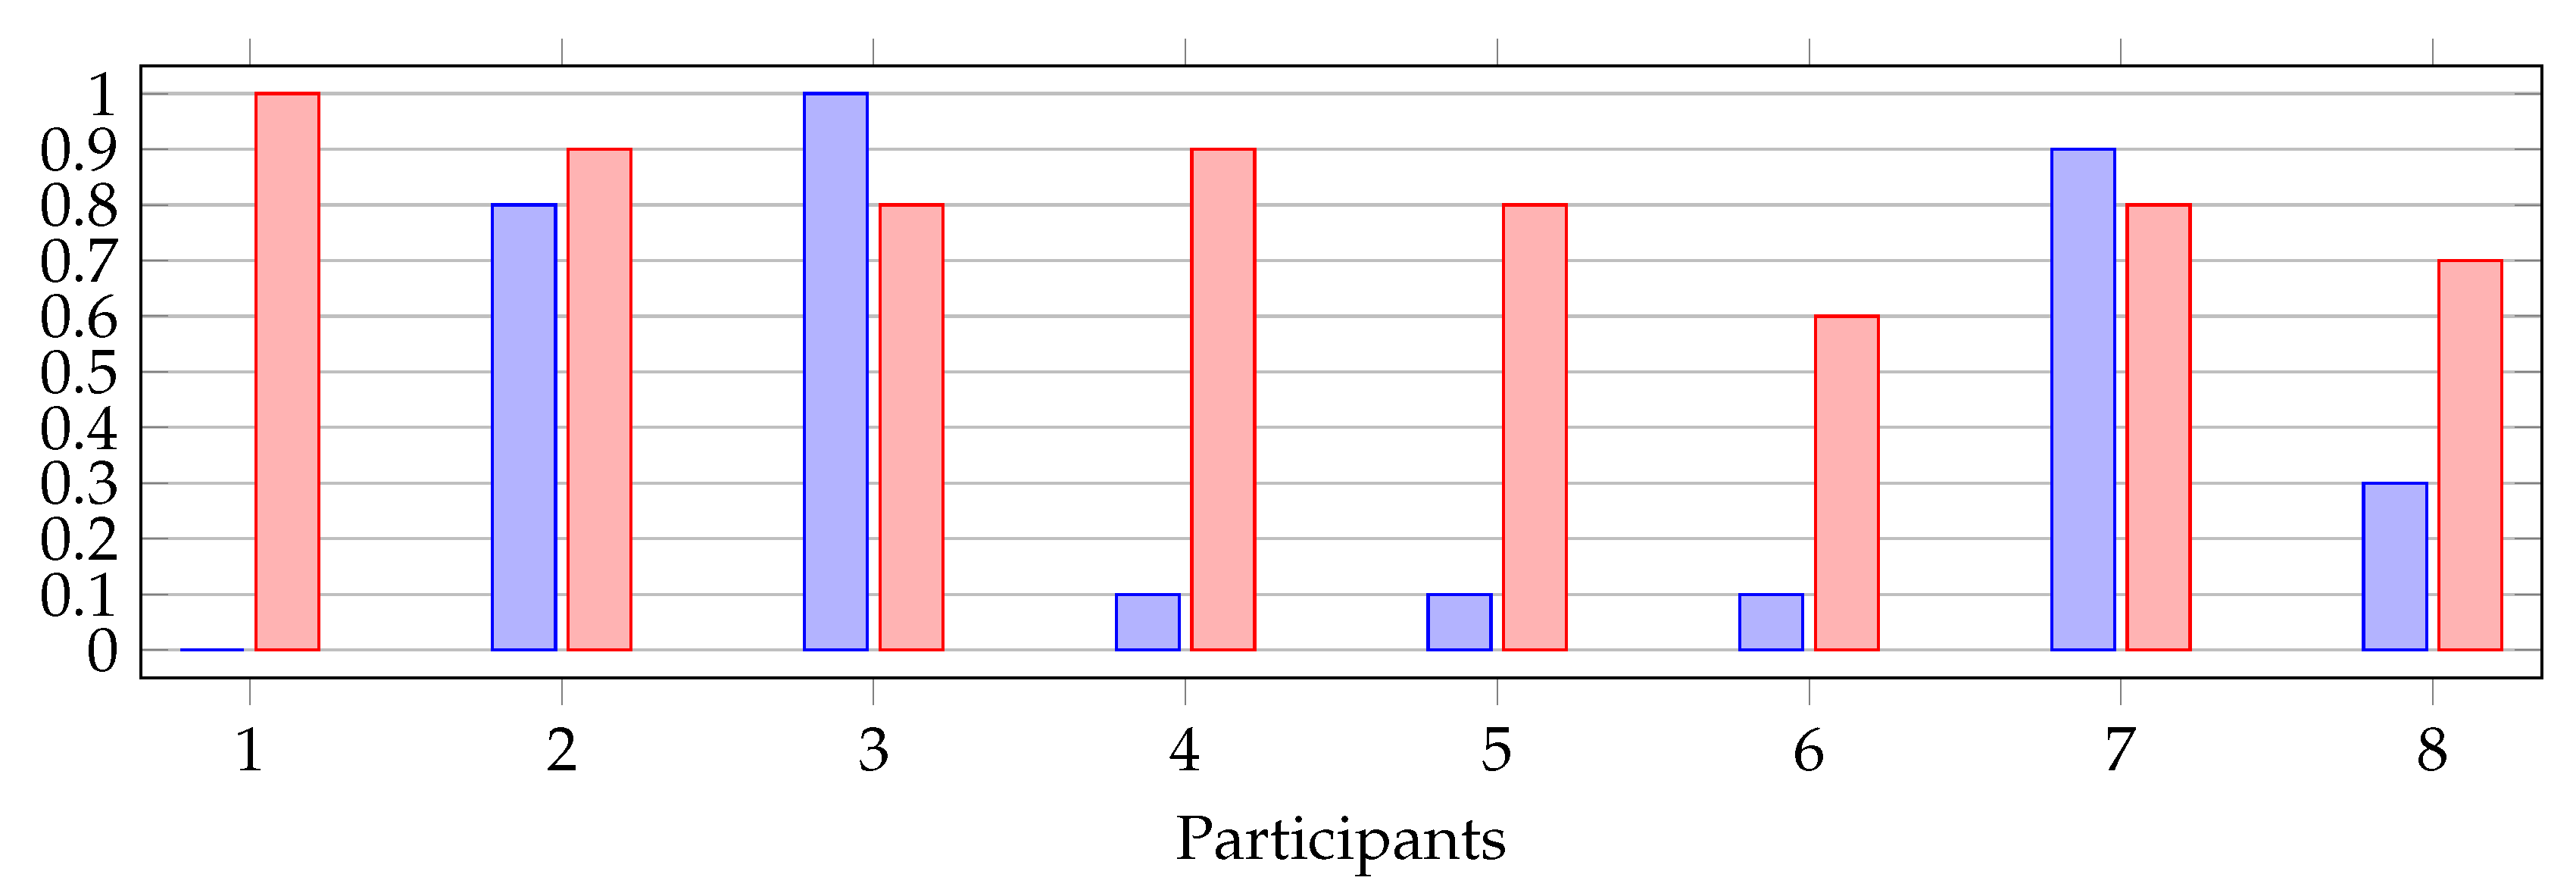
It is interesting to note that despite the predominantly poor prior experience of the participants with VR technologies, the majority managed well with the unfamiliar interaction concepts (see
Figure 29). Although the participants had little prior experience in VR, they perceived the VR-HSI as particularly clear and user-friendly. However, the full potential of the VR-HSI can only be realized when the user understands the user guidance concepts as well. During the presentation of the two interfaces, six out of eight participants required significantly more training in the VR-HSI.
Figure 29.
The figure compares for each participant their answers regarding VR prior experience from
Figure 16 (blue) with their answers regarding the clarity and user-friendliness of the VR-HSI from
Figure 22 (red).
Figure 29.
The figure compares for each participant their answers regarding VR prior experience from
Figure 16 (blue) with their answers regarding the clarity and user-friendliness of the VR-HSI from
Figure 22 (red).
Chapter 23.1 also shows that prior experience of the participants in the field of computer games had a positive influence on the VR-HSI. This leads to the assumption that the VR-HSI can be used as effectively as the Desktop-HSI with a wide range of users, without requiring sufficient experience in handling VR/AR applications.
In terms of timing, when a command should be issued to the swarm, the participants were better able to issue commands in the VR-HSI (see Chapter 19). A command can only be processed by the swarm if a UAV is within communication range of the HSI. Otherwise, the issued command is lost. The Desktop-HSI visualized this through high values on the trust map. The VR-HSI also did so, but participants could also consider external information such as flight direction and position of UAVs that were not within communication range through the interface. This allowed participants to estimate when UAVs would be available in the future. This led to a better rating of the VR-HSI in Chapter 19.
However, it should be noted that this advantage over the Desktop-HSI only applies when the user manually issues all commands. If both HSIs had an automatic mechanism to initially queue commands and then issue them only when a connection to the swarm is established, this would greatly improve user-friendliness. Nevertheless, this metric is part of the survey to illustrate the importance of immersion, i.e., the interaction between internal and external information in human-swarm interaction.
The use of beacons makes it easier for the user to make decisions for new commands. In addition, issuing new commands through the integrated Human Pointing Model [
9] in the VR-HSI is more precise and easier. As evident in Chapter 18, the participants preferred to use the Human Pointing Model to mark their external information about the disasters directly, rather than selecting them through the interactive map in the Desktop-HSI. This is not surprising, as the article by Ferran Argelaguet and Carlos Andujar [
9] shows that traditional input methods such as mouse and keyboard are inferior to Human Pointing Models in real-world applications
4 due to their limitations.
Although three out of eight participants noticed physical strain while using the VR-HSI, Chapter 22 states that this factor must be taken into account when developing such interfaces but does not present a significant disadvantage compared to the Desktop-HSI. Most participants noticed this strain because they had to constantly hold the iPad in the required position due to the use of the Human Pointing Model [
9]. To potentially make improvements in the future, it is important to also explore other control approaches for VR. Particularly exciting would be a combination of the VR technology described here with the Brain-Swarm-Interface (BSI) implemented by Aamodh Suresh and Mac Schwager [
11]. The user could transmit commands to the swarm based on their measured brain activities, while the VR interface complements the missing visualizations of internal and external information for the user. This could further enhance the immersive experience and improve cognitive load limits.
23.1. Influence of Prior Experience on VR and Desktop HSI
To examine whether the different levels of experience of the participants in handling and controlling robotic systems, as well as VR and computer gaming technology, have an influence on VR and Desktop HSI, the participants were divided into two groups. Participants with a rating of
were classified as experienced, while all others were considered inexperienced. The threshold of
was chosen because with a threshold of
, there were not enough data available for comparing all criteria due to the small sample size. The responses of both groups were compared in terms of efficiency and accuracy and tested for significance (see
Table 19). Although a t-test is not suitable for this sample size (see Chapter 12), it was still used to make the results more comparable for future tests with larger samples.
Table 19.
To calculate the significance between the inexperienced and experienced participants, a pairwise t-test was conducted. The data from VR-HSI were used for the metrics. Below is an overview of the results of the significance tests.
Table 19.
To calculate the significance between the inexperienced and experienced participants, a pairwise t-test was conducted. The data from VR-HSI were used for the metrics. Below is an overview of the results of the significance tests.
| Metrics |
Criteria |
Inexperienced |
Experienced |
t |
p |
| Mean |
Std. Dev. |
Mean |
Std. Dev. |
| Effectiveness |
Xp. with robots |
4.15 |
3.61 |
3.07 |
1.70 |
0.39 |
0.732 |
| |
Xp. robot swarms |
4.94 |
4.72 |
2.75 |
0.25 |
0.69 |
0.614 |
| |
Control of robots |
5.10 |
4.50 |
1.70 |
0.14 |
1.04 |
0.489 |
| |
Control of robot swarms |
4.94 |
4.72 |
2.75 |
0.25 |
0.69 |
0.614 |
| |
Xp. computer games |
5.07 |
3.18 |
1.94 |
0.43 |
1.51 |
0.271* |
| |
Xp. with VR |
5.04 |
4.58 |
2.26 |
0.93 |
0.71 |
0.606 |
| Accuracy |
Xp. with robots |
0.70 |
0.10 |
0.67 |
0.32 |
0.18 |
0.874 |
| |
Xp. robot swarms |
0.70 |
0.14 |
0.70 |
0 |
|
1 |
| |
Control of robots |
0.70 |
0.14 |
0.80 |
0 |
-1 |
0.500 |
| |
Control of robot swarms |
0.70 |
0.14 |
0.70 |
0 |
|
1 |
| |
Xp. computer games |
0.57 |
0.25 |
0.83 |
0.06 |
-2.22 |
0.
157* |
| |
Xp. with VR |
0.70 |
0.14 |
0.75 |
0.07 |
-0.33 |
0.795 |
Although no result in
Table 19 falls below the significance level of p=0.05, a potential significance could be suspected for the criteria marked with (*). By increasing the sample size, the p-value of these criteria could further decrease, potentially revealing an impact of gaming experience on accuracy and effectiveness.
Figure 30 reinforces this suspicion. On average, participants with more gaming experience achieved better completion times for the mission and attributed higher accuracy to the VR-HSI.
For the Desktop-HSI, no significant influences of prior experience can be observed (see
Table 20).
Figure 30.
Comparison of effectiveness and accuracy of the VR-HSI among participants with different levels of experience in computer games. Each point on the figures represents a participant, where the blue points represent inexperienced participants and the red points represent experienced participants.
Table 20.
To calculate the significance between inexperienced and experienced participants, a pairwise t-test was conducted using data from the Desktop-HSI. Below is an overview of the results of the significance tests.
Table 20.
To calculate the significance between inexperienced and experienced participants, a pairwise t-test was conducted using data from the Desktop-HSI. Below is an overview of the results of the significance tests.
| Metrics |
Criteria |
Inexperienced |
Experienced |
t |
p |
| Mean |
Std. Dev. |
Mean |
Std. Dev. |
| Effectiveness |
Xp. with robots |
3.58 |
0.53 |
4.28 |
3.17 |
-0.33 |
0.774 |
| |
Xp. with robot swarms |
3.35 |
0.49 |
3.48 |
0.78 |
-0.61 |
0.651 |
| |
Control of robots |
3.21 |
0.30 |
5.79 |
2.96 |
-1.37 |
0.401 |
| |
Control of robot swarms |
3.35 |
0.49 |
3.48 |
0.78 |
-0.61 |
0.651 |
| |
Xp. computer games |
2.78 |
0.79 |
4.88 |
2.62 |
-1.07 |
0.397 |
| |
Xp. with VR |
5.44 |
3.45 |
3.31 |
0.55 |
0.75 |
0.589 |
| Accuracy |
Xp. with robots |
0.70 |
0.10 |
0.63 |
0.29 |
0.38 |
0.742 |
| |
Xp. with robot swarms |
0.65 |
0.07 |
0.60 |
0.28 |
0.33 |
0.795 |
| |
Control of robots |
0.75 |
0.21 |
0.75 |
0.07 |
0 |
1 |
| |
Control of robot swarms |
0.65 |
0.07 |
0.60 |
0.28 |
0.33 |
0.795 |
| |
Xp. computer games |
0.77 |
0.15 |
0.60 |
0.26 |
0
.76 |
0.525 |
| |
Xp. with VR |
0.70 |
0.14 |
0.55 |
0.21 |
0.60 |
0.656 |
24. Limitations
To compare the performance between both HSIs in a user study, it is essential to have a representative and sufficiently large sample. In Chapter 16, a sample validation was conducted, which revealed that the majority of participants came from an academic context with a focus on robotics. This one-sided experience of the participants can lead to biased survey results. Another limitation of the survey is the significantly small sample size. To obtain robust and meaningful results, the results must be applicable to the significance tests known in statistics. Chapter 11 shows that this is not the case. Without proving that the means of the VR-HSI and Desktop-HSI truly differ significantly and are not due to random events, the results cannot be used for further research questions.
Nevertheless, it is helpful to compare the different means in the metrics side by side to make an initial assessment of possible trends. However, to transform these trends into solid statistics, the sample size must be significantly increased, and the sample itself must be diversified significantly. Only then can argumentatively robust and meaningful results be achieved that are suitable for the application of significance tests.
Therefore, these results should be viewed more as a foundation for further research. The use of metrics and significance tests for research is still possible, provided a more suitable sample is selected.
Conclusion
The aim of this study was to compare a VR-HSI with a Desktop-HSI in the field of Human-Swarm Interaction through a direct comparison. Where were the potentials of both interfaces, and where were the limits?
To conduct this comparison, a simple desktop application (the Desktop-HSI) was developed to provide users with basic interaction possibilities with a UAV swarm. Only information available to the swarm internally could be displayed. Subsequently, a VR application (the VR-HSI) with similar functionality and additional technical possibilities of VR/AR technology was developed. In addition, the VR-HSI could also represent external information, which was only available to the user, such as the actual position of disasters, flight direction, and the position of individual UAVs. The two HSIs were then used to fly a simulated mission with five to ten UAVs and locate four disasters on a map. The participants were able to extensively test both interfaces and share their experiences through a survey.
The surveys show that both HSIs have their justification. However, the results also show that the increased immersion of the VR-HSI, i.e., the integration of internal and external information, allowed for further improvement in performance in the metrics of accuracy and reaction time. Most participants had a better sense of their mission environment and the swarm through the VR-HSI.
Furthermore, it was found that the VR-HSI can also be used by users who had little or no prior experience with VR techniques. This significantly expands the user base for the VR-HSI.
It remains to be seen whether the Desktop-HSI has already reached the limits of its immersive capabilities, which further research could investigate.
In contrast, the VR-HSI offers much potential to increase immersion for the user and maximize performance in Human-Swarm Interaction. If users’ understanding of operating VR/AR technologies continues to increase, these technologies could provide a significant advantage over traditional desktop applications.
The question of which interface will prevail in the future depends entirely on the intended applications. If the autonomy of the swarm is to be preserved as much as possible and only information needs to be visualized, a traditional Desktop-HSI may already be sufficient. However, the more the human wants to intervene in the autonomy of the swarm and become a productive part of the swarm, the more important an increasing immersive experience through the interface becomes to facilitate the user’s work.
Abbreviations
The following abbreviations are used in this manuscript:
| MDPI |
Multidisciplinary Digital Publishing Institute |
| DOAJ |
Directory of open access journals |
| TLA |
Three letter acronym |
| LD |
Linear dichroism |
| 1 |
A situation from which a robot cannot free itself. |
| 2 |
In this application, the user can mark places in their environment by orienting and setting a distance using a light beam. |
| 3 |
Including orientation in the environment and control through a human pointing model [ 9]. |
| 4 |
Real-world applications refer to the practical use of technologies or concepts in real situations or environments. |
References
- Barca, J.C.; Sekercioglu, Y.A. Swarm robotics reviewed. Robotica 2013, 31, 345–359. [Google Scholar] [CrossRef]
- Castelló Ferrer, E. A Wearable General-Purpose Solution for Human-Swarm Interaction. In Proceedings of the Future Technologies Conference (FTC) 2018; Arai, K., Bhatia, R., Kapoor, S., Eds.; Springer International Publishing: Cham, 2019; pp. 1059–1076. [Google Scholar]
- Hexmoor, H.; McLaughlan, B.; Baker, M. Swarm Control in Unmanned Aerial Vehicles. IC-AI 2005, 911–917. [Google Scholar]
- Mills, K.L. A brief survey of self-organization in wireless sensor networks. Wireless Communications and Mobile Computing 2007, 7, 823–834. [Google Scholar] [CrossRef]
- Wong, T.; Tsuchiya, T.; Kikuno, T. A self-organizing technique for sensor placement in wireless micro-sensor networks. In Proceedings of the18th International Conference on Advanced Information Networking and Applications; 2004; Volume 1, pp. 78–83. [Google Scholar] [CrossRef]
- Berman, S.; Lindsey, Q.; Sakar, M.S.; Kumar, V.; Pratt, S.C. Experimental Study and Modeling of Group Retrieval in Ants as an Approach to Collective Transport in Swarm Robotic Systems. IEEE 2011, 99, 1470–1481. [Google Scholar] [CrossRef]
- Arvin, F.; Krajník, T.; Turgut, A.E.; Yue, S. COSF: Artificial pheromone system for robotic swarms research. In Proceedings of the 2015 IEEE/RSJ international conference on intelligent robots and systems (IROS), 2015; IEEE; pp. 407–412. [Google Scholar]
- Xiaoning, Z. Analysis of military application of UAV swarm technology. In Proceedings of the 2020 3rd International Conference on Unmanned Systems (ICUS), 2020; pp. 1200–1204. [Google Scholar] [CrossRef]
- Argelaguet, F.; Andujar, C. A survey of 3D object selection techniques for virtual environments. Computers & Graphics 2013, 37, 121–136. [Google Scholar] [CrossRef]
- Chen, M.; Zhang, P.; Wu, Z.; Chen, X. A multichannel human-swarm robot interaction system in augmented reality. Virtual Reality & Intelligent Hardware 2020, 2, 518–533. [Google Scholar] [CrossRef]
- Suresh, A.; Schwager, M. Brain-Swarm Interface (BSI): Controlling a Swarm of Robots with Brain and Eye Signals from an EEG Headset. 2016. [Google Scholar] [CrossRef]
- Triantafyllidis, E.; Mcgreavy, C.; Gu, J.; Li, Z. Study of Multimodal Interfaces and the Improvements on Teleoperation. IEEE Access 2020, 8, 78213–78227. [Google Scholar] [CrossRef]
- Divband Soorati, M.; Clark, J.; Ghofrani, J.; Tarapore, D.; Ramchurn, S.D. Designing a User-Centered Interaction Interface for Human–Swarm Teaming. Drones 2021, 5. [Google Scholar] [CrossRef]
- Oradiambalam Sachidanandam, S. Effectiveness of Augmented Reality Interfaces for Remote Human Swarm Interaction. PhD thesis, 2021. [Google Scholar] [CrossRef]
|
Disclaimer/Publisher’s Note: The statements, opinions and data contained in all publications are solely those of the individual author(s) and contributor(s) and not of MDPI and/or the editor(s). MDPI and/or the editor(s) disclaim responsibility for any injury to people or property resulting from any ideas, methods, instructions or products referred to in the content. |
© 2023 by the authors. Licensee MDPI, Basel, Switzerland. This article is an open access article distributed under the terms and conditions of the Creative Commons Attribution (CC BY) license (http://creativecommons.org/licenses/by/4.0/).
