1. Introduction
High voltage surge arresters have an important role in the power system, especially in protecting the insulation of power lines and transformers against lightning and switching overvoltages. Their appropriate selection makes it possible to obtain proper insulation coordination between the electrical strength of the protected insulation and the level of protection clearly defined by the protective characteristics of surge arresters. Periodical inspection of the technical condition of the arrester allows to control the maintenance of the insulation coordination margin and thus ensure the correct operation of the transformer in the conditions of voltage exposure. Information on the condition of surge arresters - similarly to other elements of the energy system - should be obtained already at the level of acceptance measurements, so as to determine the operationally acceptable reference levels of the arrester's quality indicators and the planned method of earlier liquidation of elements characterized by poor technical condition. This approach allows for higher operational reliability of the energy system, in which emergency shutdowns of the network are undesirable phenomena due to the problems of maintaining the continuity of electricity supply to consumers.
The basic element of the arrester are varistors made on the basis of zinc oxide ZnO (semiconductor) with many appropriate admixtures (mainly bismuth), which, as a consequence of the multi-phase structure, are characterized by non-linear voltage-current characteristics.
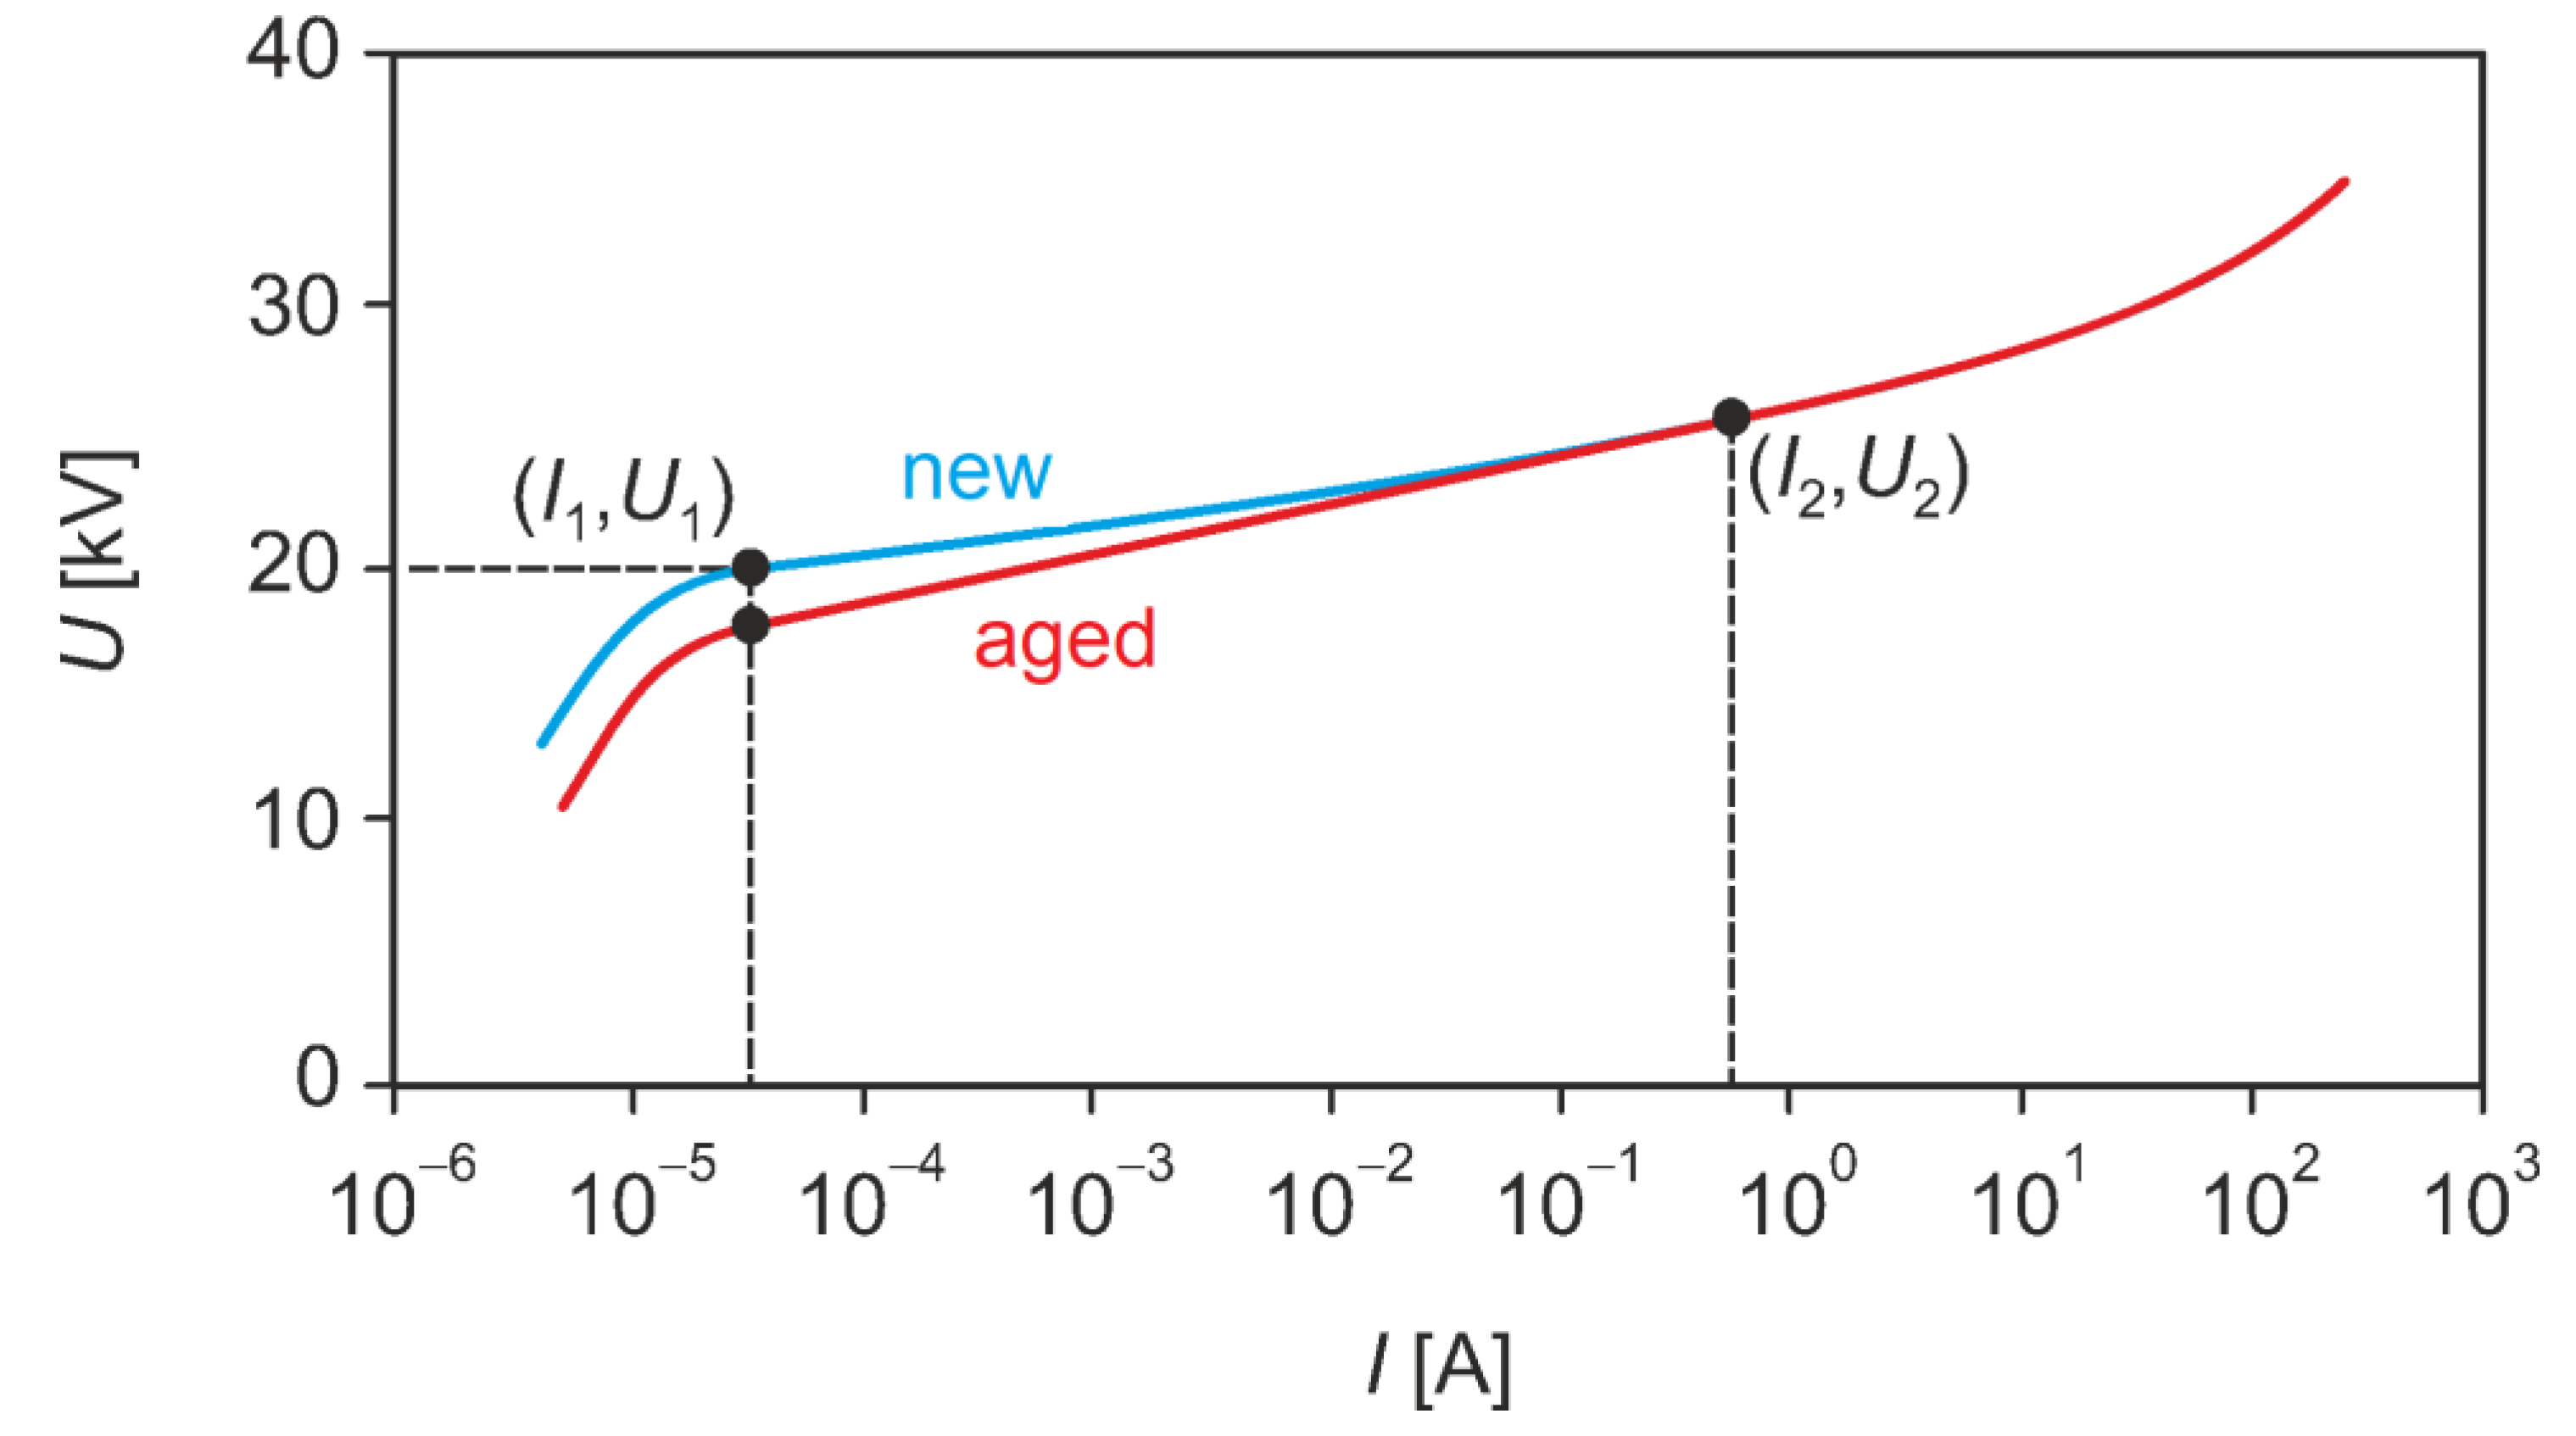
For the voltage-current characteristics of the varistor in the initial range, it is observed at voltages forcing the flow of small currents (e.g. up to 1 mA, (
Figure 1, point (I1, U1)), with the resistance value of the varistor in the order of gigaohms. On the other hand, for a small change in the voltage U in the area of the so-called breakdown (
Figure 1, point (I2, U2)), the current I reaches values of the order of kiloamperes, which is usually described by the power relationship (1):
where k – material dependent constant and α – nonlinearity coefficient. At higher voltages, due to the reduction of barriers between the grains, the current conduction character of the varistor is typically resistive with a resistance of a few ohms [
3].
Laboratory tests show that in ZnO ceramics, in the case of high-frequency waveforms, of the order of 1 MHz, typical for lightning overvoltages, there is a maximum dielectric loss factor. An increase in the temperature of the arrester strongly favors the increase of conductive properties. An increase in leakage and polarization currents is then observed. In addition, aging with current surges causes a shift to the right of the voltage-current characteristics, which is physically associated with a change in the grain size distribution in the varistor volume - especially as a result of negative polarity surges. This phenomenon is related to the influence of temperature on the conduction mechanisms, especially in smaller varistors (e.g. low voltage), where relatively small exposures, due to weaker absorption of current surges, can cause strong heating of the varistor and change its U(I) characteristic, which shifts to right towards larger currents [1, 3].
At the level of LV and MV grids, the commercial power industry usually operates the surge arresters until they fail, and any checks usually force the voltage to be switched off, the surge arrester disconnected from the grid system, measurements carried out using external voltage sources, a decision to replace or reconnect the apparatus to the grid. From the point of view of lightning and surge protection, it is periodically checked according to the internal operating instructions: in the scope of visual inspection - condition of insulators (cracks, scratches, traces of surface discharges), corrosion condition of fittings and connecting wires, damage or too high mechanical stress, number of surge arresters, value of leakage current, condition of earthing connections - condition of the conductor, continuity, corrosion, protective coatings. The result is an inspection card on which the condition of the device is entered - good, medium (within the scheduled date) and bad (immediate repair).
As part of a specialist or ad hoc review, specific lists of measurement activities can be proposed. This applies in particular to the area of power substations in the HV area, where power utilities have introduced their own inspection procedures consisting in testing surge arresters disconnected from the network or assessed online. Then, in order to assess surge arresters, the permissible levels of leakage current or reference voltage are given. For example, the manufacturer of the Tridelta arrester type SBK-II 96/10.2 expects a reference voltage level in the range of 101.6 - 106.3 kV when inducing a leakage current of a maximum value of 5 mA. In HV grid systems, the shutdown of the voltage is usually limited and in this case the activities are usually in the form of continuous measurements monitoring the technical condition of the surge arresters especially in places providing overvoltage protection for distribution systems at the transformer/switching station (T/S_S).
Recommendations for the diagnostics of MV and HV spark-free surge arresters are provided in Appendix D to the standard [
2] containing guidelines for their use and selection. The standard applies to surge arresters that will be operated in three-phase systems with a nominal voltage above 1 kV. The supplement is a review of methods widely used in the power engineering of the facility, unfortunately based on a literature review from the years up to and including 1993, and proposes the use of simple technical solutions consisting in the introduction of:
damage indicators that do not disconnect the arrester from the network, but only indicate the technical condition by indicating the amplitude and time of current flow or the temperature of the varistors;
devices signaling the state of partial or complete destruction of the varistor element (e.g. disconnectors);
special devices measuring the number and/or amplitude of current and/or voltage surges;
series spark gaps in solutions requiring disconnection from the network or remaining in the network system;
temperature analyzers;
measurements of harmonic leakage current or active power losses.
Indicator devices are a component of a complete arrester or its additional element connected in series and are divided into fault indicators, disconnectors and operation counters. Damage indicator, in case of exceeding the current amplitude or the duration of a certain critical current value, only indicates this fact, but without automatic disconnection of the arrester from the network. The disconnector, in turn, is designed to isolate the arrester from the network system at the time of its failure. Typically, an explosive element (solutions for MV) is used for this purpose, triggered by the flow of a short-circuit current of a certain amplitude and duration. The disadvantage of the applied solution is the fact that after the arrester is disconnected, there is no overvoltage protection in the power network section until it is replaced.
Another way to determine the degree of degradation of the surge arrester is to use a trip counter triggered by a discharge current exceeding a certain amplitude. In the case of multiple discharges with times between discharges of less than 50 ms, due to the design of the counting system, not all discharges may be counted. In some designs, a sufficiently long follow current flow is required for the meter to work, which may cause difficulties in counting short discharge currents.
An interesting method of analyzing the state of the surge arrester is to use a thermal imaging camera. Intensive heating of the varistor structure causes a local increase in the temperature of the insulating housing, indicating problems with the varistor or water penetration into the housing and local increase in surface currents in the varistor stack.
However, from the methods proposed by the standard [
2], the methods based on the determination of the leakage current and its resistive component gained special importance in the online diagnostics of HV arresters, and in the off-line diagnostics of MV and LV arresters. The standard specifies the level of the capacitive component in the range of 0.2 to 3 mA, depending on the capacitance of the arrester, which is typically 60 ÷ 150 pF per kV of the rated voltage, referred to the area of 1 cm
2 of the varistor element. The diagram given in the standard gives a typical U/U
r characteristic indicating a leakage current of about 1 mA at a voltage of 0.6 U
r. Doubling the active component usually causes a slight increase by approx. 10% of the leakage current, which means that the main diagnostic effort goes towards the development of methods analyzing the active component of the leakage current in which the third harmonic of this current has a significant share in the active current (from 10 to 40 %).
In most cases, in the power industry, there are methods that ensure constant monitoring of the leakage current of limiters, unfortunately in the presence of frequent external disturbances. The standard for calculating the active component proposes various methods of leakage current analysis (a method of using a voltage signal as a reference, a method of compensating the capacitive component using a voltage signal, a method of compensation without using a voltage signal, a method of compensation using the analysis of currents in three phases and harmonics analysis using the following methods: harmonic, third harmonic with harmonic compensation in mains voltage, first order harmonic analysis). Table 5 in [
2] indicates that in professional practice the methods of analysis of harmonics of the leakage current are generally used, the origins of which date back to the 1980s.
An undoubted advantage of the harmonic analysis method is the ability to measure the state of the arrester without disconnecting it from the network. Due to the significant error resulting from the content of the third harmonic in the supply voltage, even within the range of 100% ÷ 350%, in practice the method of third harmonic analysis with compensation with the signal related to the third harmonic of the limiter's capacitive current has become the most popular. In practice, the method of measuring the leakage current based on the determination of the active component or the power of losses isolated on the arrester is most often used. Both measurements on the surge arrester connected to the network (operational) or disconnected from the network (laboratory with DC or AC voltage) are used. In order to enable the measurement of the leakage current, a special insulated earthing clamp is installed between the arrester and the earthing, to which a measuring device is connected periodically (periodic diagnostics) or permanently (monitoring with recording the leakage current value on the memory card or in the supervisory system).
Currently, papers on new numerically advanced methods of determining the active component are still being published. A review of existing older and innovative ideas is included in publications [8, 9]. The work [
8] lists innovative extensions created after establishing the content of Appendix D of the standard. These include works [17-22], which analyze various techniques for analyzing the current signal - both only the total leakage current and additionally with a separate resistive component, allowing to obtain the amplitude and shift angles in the current signal for the components - total and/or resistive [17-20], as well as leading to the determination of the shape and similarity of current signals recorded in a synchronous manner [21, 22]. On the other hand, in the work [
9], a number of improved classical methods have been compiled that allow to obtain its resistive component from the current signal, specifying the limitations of their use, of which the presence of higher harmonics in the supply voltage was indicated in the first place.
New methods of determining the resistive component and their practical applications leading to online diagnostics of limiters are still described in the literature [11, 12, 23-31]. For example, an interesting solution is the online method of measuring the resistive component proposed in [
11], which uses a remote non-simultaneous method of measuring the resistive current (RNS). RNS remotely and non-simultaneously measures all types of resistive current parameters using remote non-simultaneous phase difference measurement methods and specific harmonic analysis algorithms. The results of the simulation and application of the proposed method showed sufficient accuracy, also in the conditions of frequency deviations and the presence of harmonic components in the supply voltage, which makes it possible to effectively use it in online diagnostics.
Great opportunities are offered by the machine learning method, which, by determining patterns of clearly defined damage, offers ways to effectively determine [13, 20, 21]:
For example, paper [
13] describes the results of the analysis of surge arresters from operation with a rated voltage of 11 kV (continuous operating voltage 9 kV, rated discharge current 5 kA), which were artificially soiled on the surface using the SLM method described in the IEC 60507 standard. This method uses a spray application of a mixture of NaCl and kaolin dissolved in distilled water. Using different compositions of the spray mixture, different conductivities of the outer layer were obtained after the process of appropriate drying in a thermal chamber. The correctness of the applied layer in terms of its uniformity was confirmed by using machine learning to detect dirt obtained at different concentrations of conductive material (5 levels) and relative humidity levels of 40% and 70%. During aging, an increase in the 3rd harmonic of the leakage current and a decrease in HR, defined as the ratio of the fundamental harmonic to the 3rd harmonic of the leakage current, was observed.
Measurements taken in the field are used to determine the lifetime of limiters in software and used in planning repairs. An example is the analysis [
14] of the MOSA test results leading to the creation of a model combining ANFIS and the SVR model used at a later stage to determine the remaining life of use. A time series consisting of the leakage current and the value of the third harmonic component obtained from field measurements was used to teach and validate the implemented models. Forecasting models were qualitatively and quantitatively assessed using inspection graphics and analysis of adopted metrics for four different time horizons, respectively. In methods of this type, it is important to determine the correct criterion indicating the critical level of the exploited ZnO ceramics, for which physical and chemical tests are necessary, also taking into account the statistical differences between the output parameters of new arresters, and then of elements subjected to aging in complex exposure conditions.
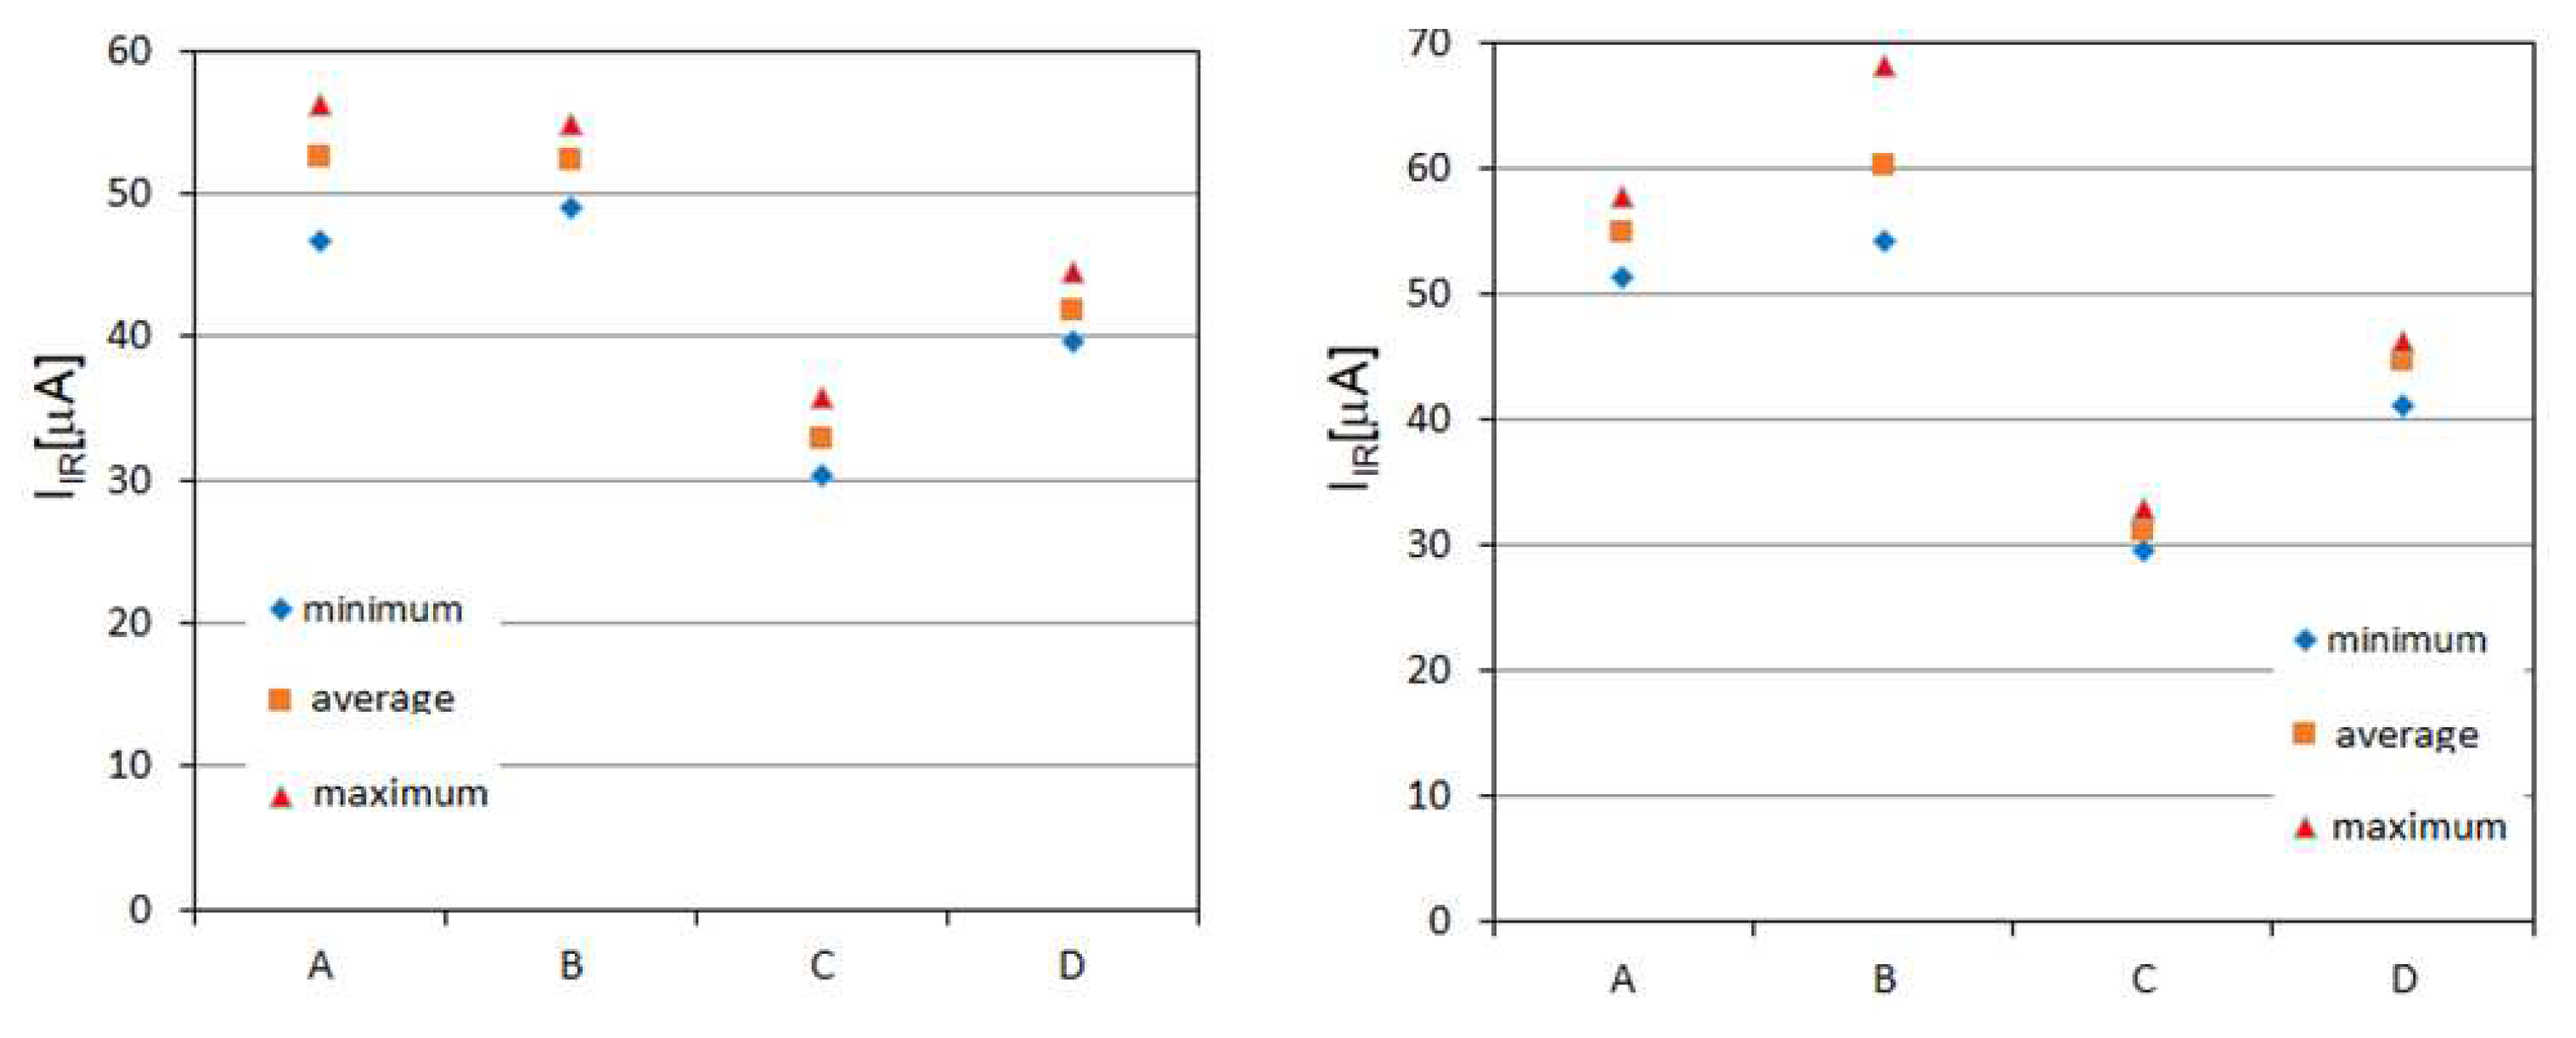
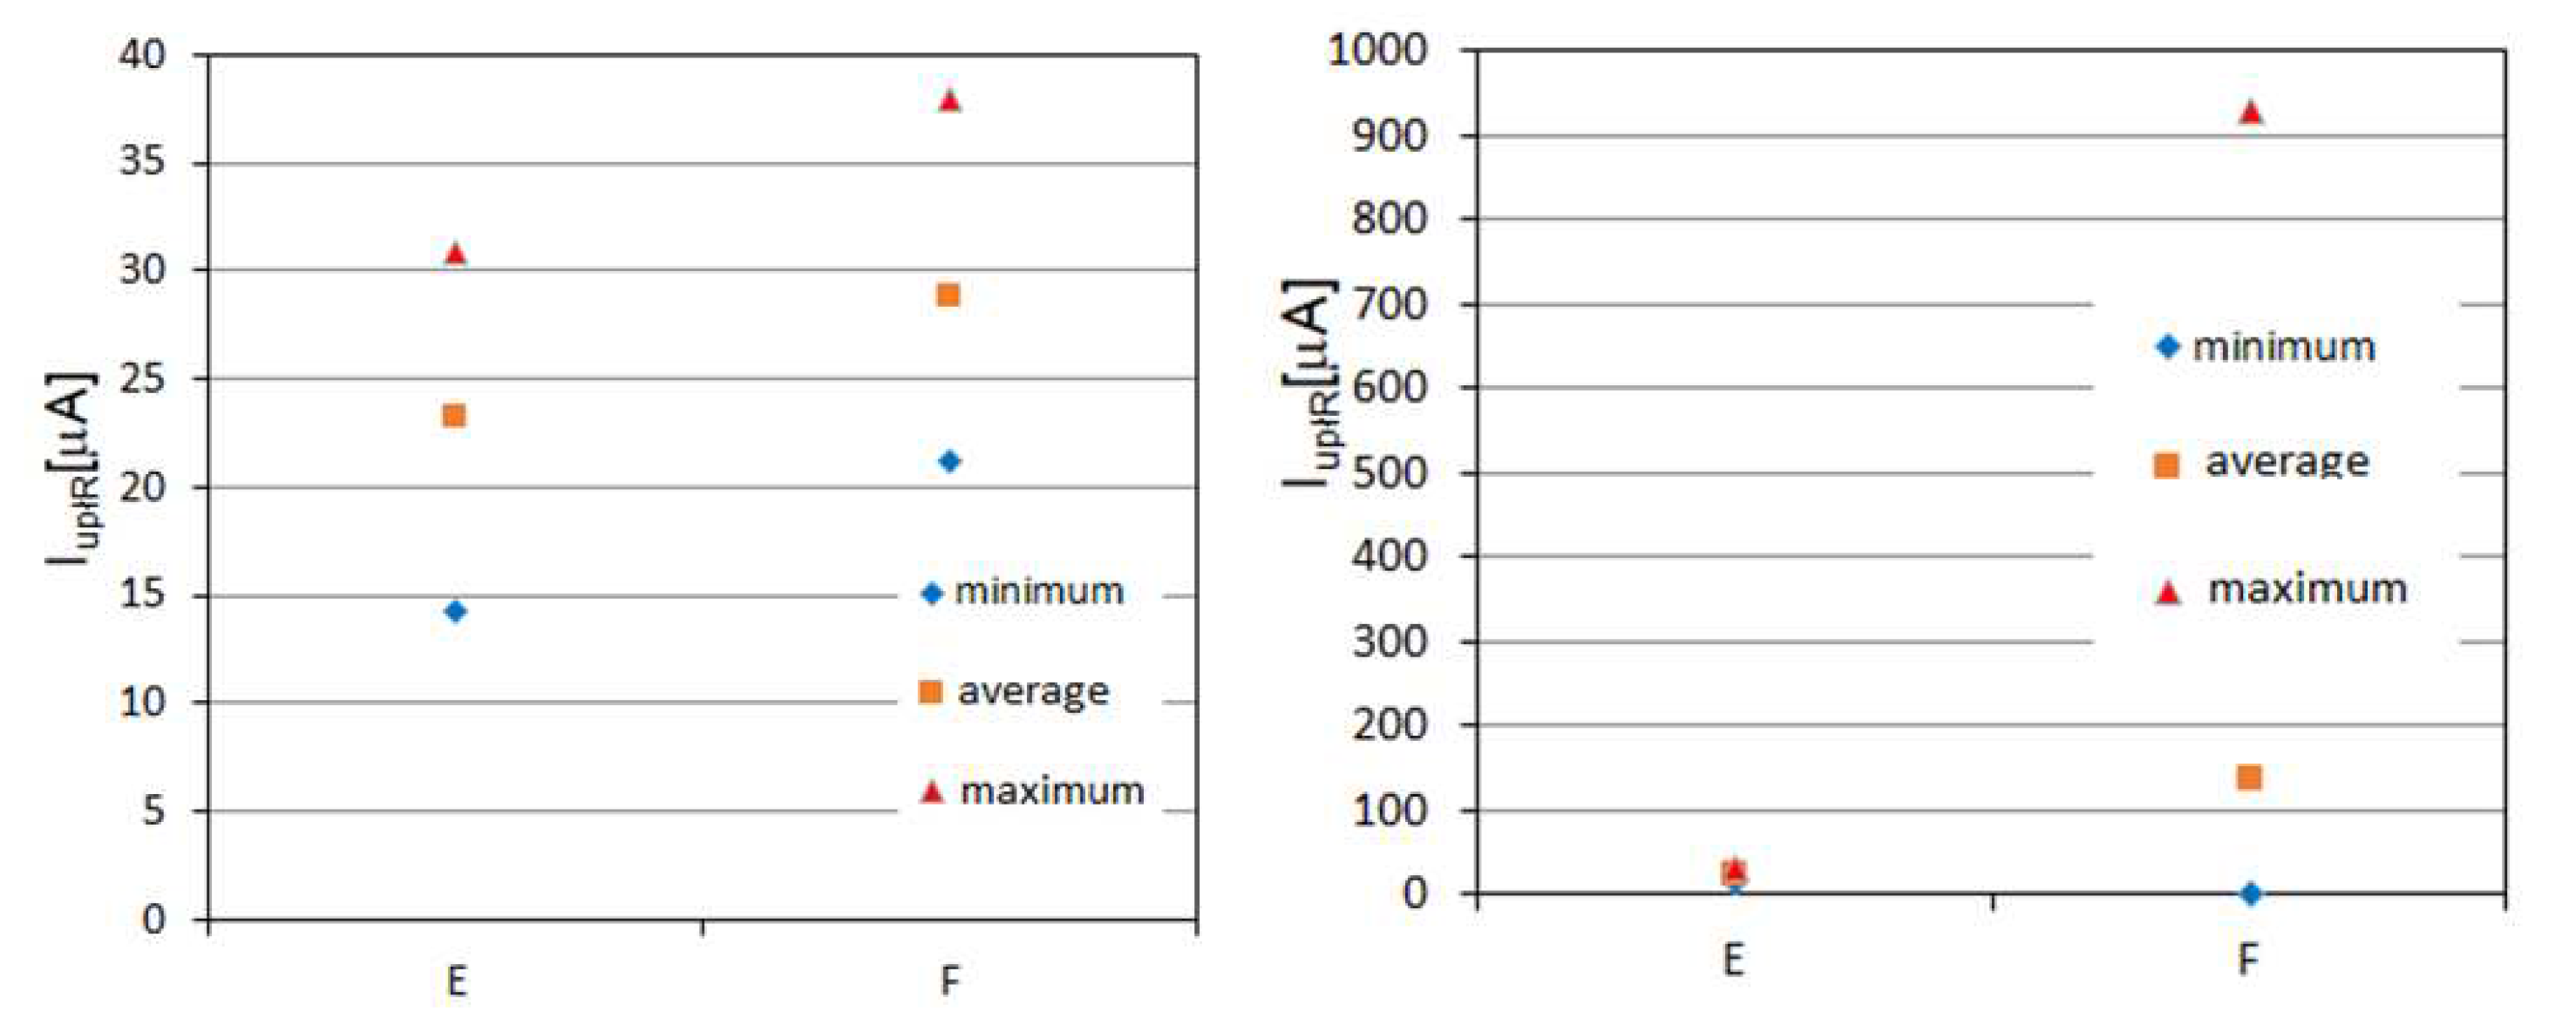
An example of test results obtained by the authors for two MV and LV oxide surge arresters is presented in
Figure 2 and
Figure 3, respectively. The dispersion of the obtained values of the active component of the leakage current indicates the extreme variation in production quality and the related difficulties in unambiguous conclusions eliminating the surge arresters from operation. In principle, this type of work should be carried out on specific control samples each time in power plants when a batch of surge arresters is put into operation. This applies in particular to very poor quality arresters, an example of which is shown in
Figure 3. The data collected in relation to individual technical solutions and manufacturers could be used as reference data for the analysis of operational results only in the case of observing the stability of the measurement results of leakage currents and reduced voltages. As can be seen from
Figure 3, for LV arresters, this kind of preliminary testing should be crucial even in the context of the decision to put the delivered batch of products into operation.
In some countries, power utilities use methods for HV surge arresters that measure the following parameters of the leakage current: peak and average value, and the content of harmonic components. On the basis of the determined values, the coefficients p1, p2 and p3 are calculated using the formulas (2-4):
which should be included in the range p
1∈(0,5; 0,76), p
2∈(0,01; 0,06), p
3∈(0,01; 0,09) [
32].
If the permissible values are exceeded, it is recommended to disconnect from the mains voltage and measure the leakage current at DC voltage. In order to check the effectiveness of the above-mentioned method at deformed mains voltage, when there are high distortions in the leakage current, additional tests can be performed to determine the suitability of the above-mentioned method in extreme operating conditions (rain, dirt).
2. An example of the leakage current measurement for HV surge arrester
During the tests, measurements of the leakage current of HV surge arresters were carried out using two voltage sources with different content of higher harmonics. The measurements concerned complete, operated overhead surge arresters with a continuous operating voltage of Uc = 77 kV and a rated discharge current of 10 kA.
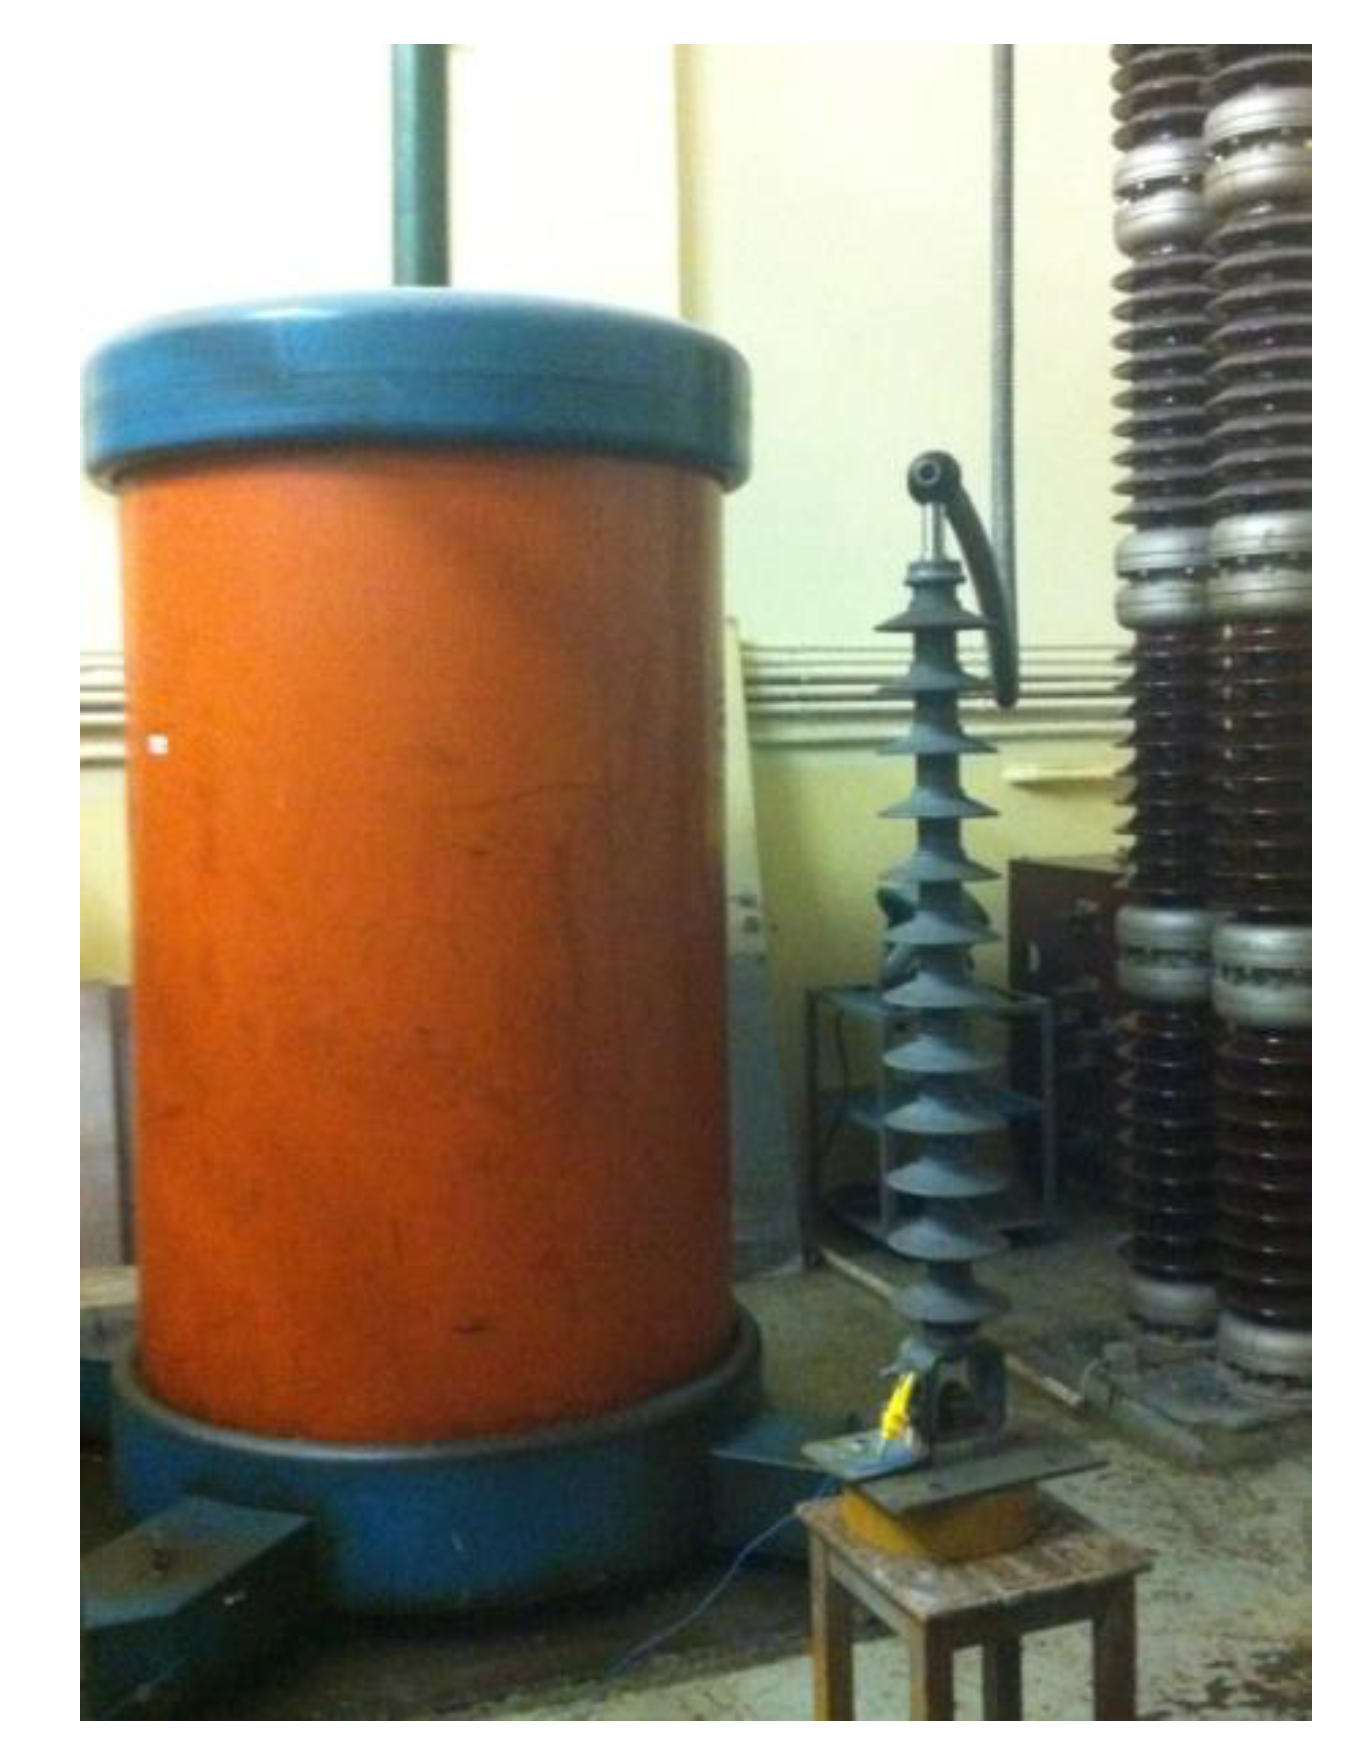
The tests were carried out using 50 Hz test sets with a voltage of up to 150 kV and 300 kV (
Figure 4) characterized by a significant distortion of the voltage curve (THD > 10%). The voltage was measured using a WMUT 3 meter connected to a capacitive divider, and the current was determined on the basis of voltage measurement on a non-inductive resistor. Both given values were recorded with the Tektronix TDS 5034B oscilloscope in order to perform the necessary calculations to determine the active component of the leakage current. The oscilloscope's input channels recorded 10,000 samples in 40 ms, from which the current and voltage harmonics were then calculated.
In order to determine the technical condition of six arresters, the leakage current was measured and its active component was determined at the continuous operating voltage U
c = 77 kV and rated U
r = 96 kV. In addition, in accordance with the manufacturer's data, the reference voltage of the arrester was checked by forcing the maximum value of the leakage current at the level of 5 mA, which, according to the manufacturer's guidelines, should be within the range of 101.6 ÷ 106.3 kV. In addition, for both test assemblies, characteristic values were determined in accordance with the methodology proposed by [
32]:
peak value;
average value;
harmonic content,
and then calculated values of p1, p2, p3 employing formulas 2 - 4.
The measurements were aimed at checking the correctness of the measurement of the leakage current with different content of higher harmonics in the supply voltage and to determine the impact of higher voltage harmonics on the obtained test results. A comparison of the test results of the limiter with a dry surface and during the influence of artificial rain was also made.
A summary of the measurement results on two test assemblies with a significant and different content of higher voltage harmonics is shown in
Table 1. Even with a significant content of higher harmonics, the p
1 indicators of the technical condition of the arrester are correct. On the other hand, the remaining p
2 and p
3 indices concerning higher harmonics clearly exceed the acceptable levels given in [
32].
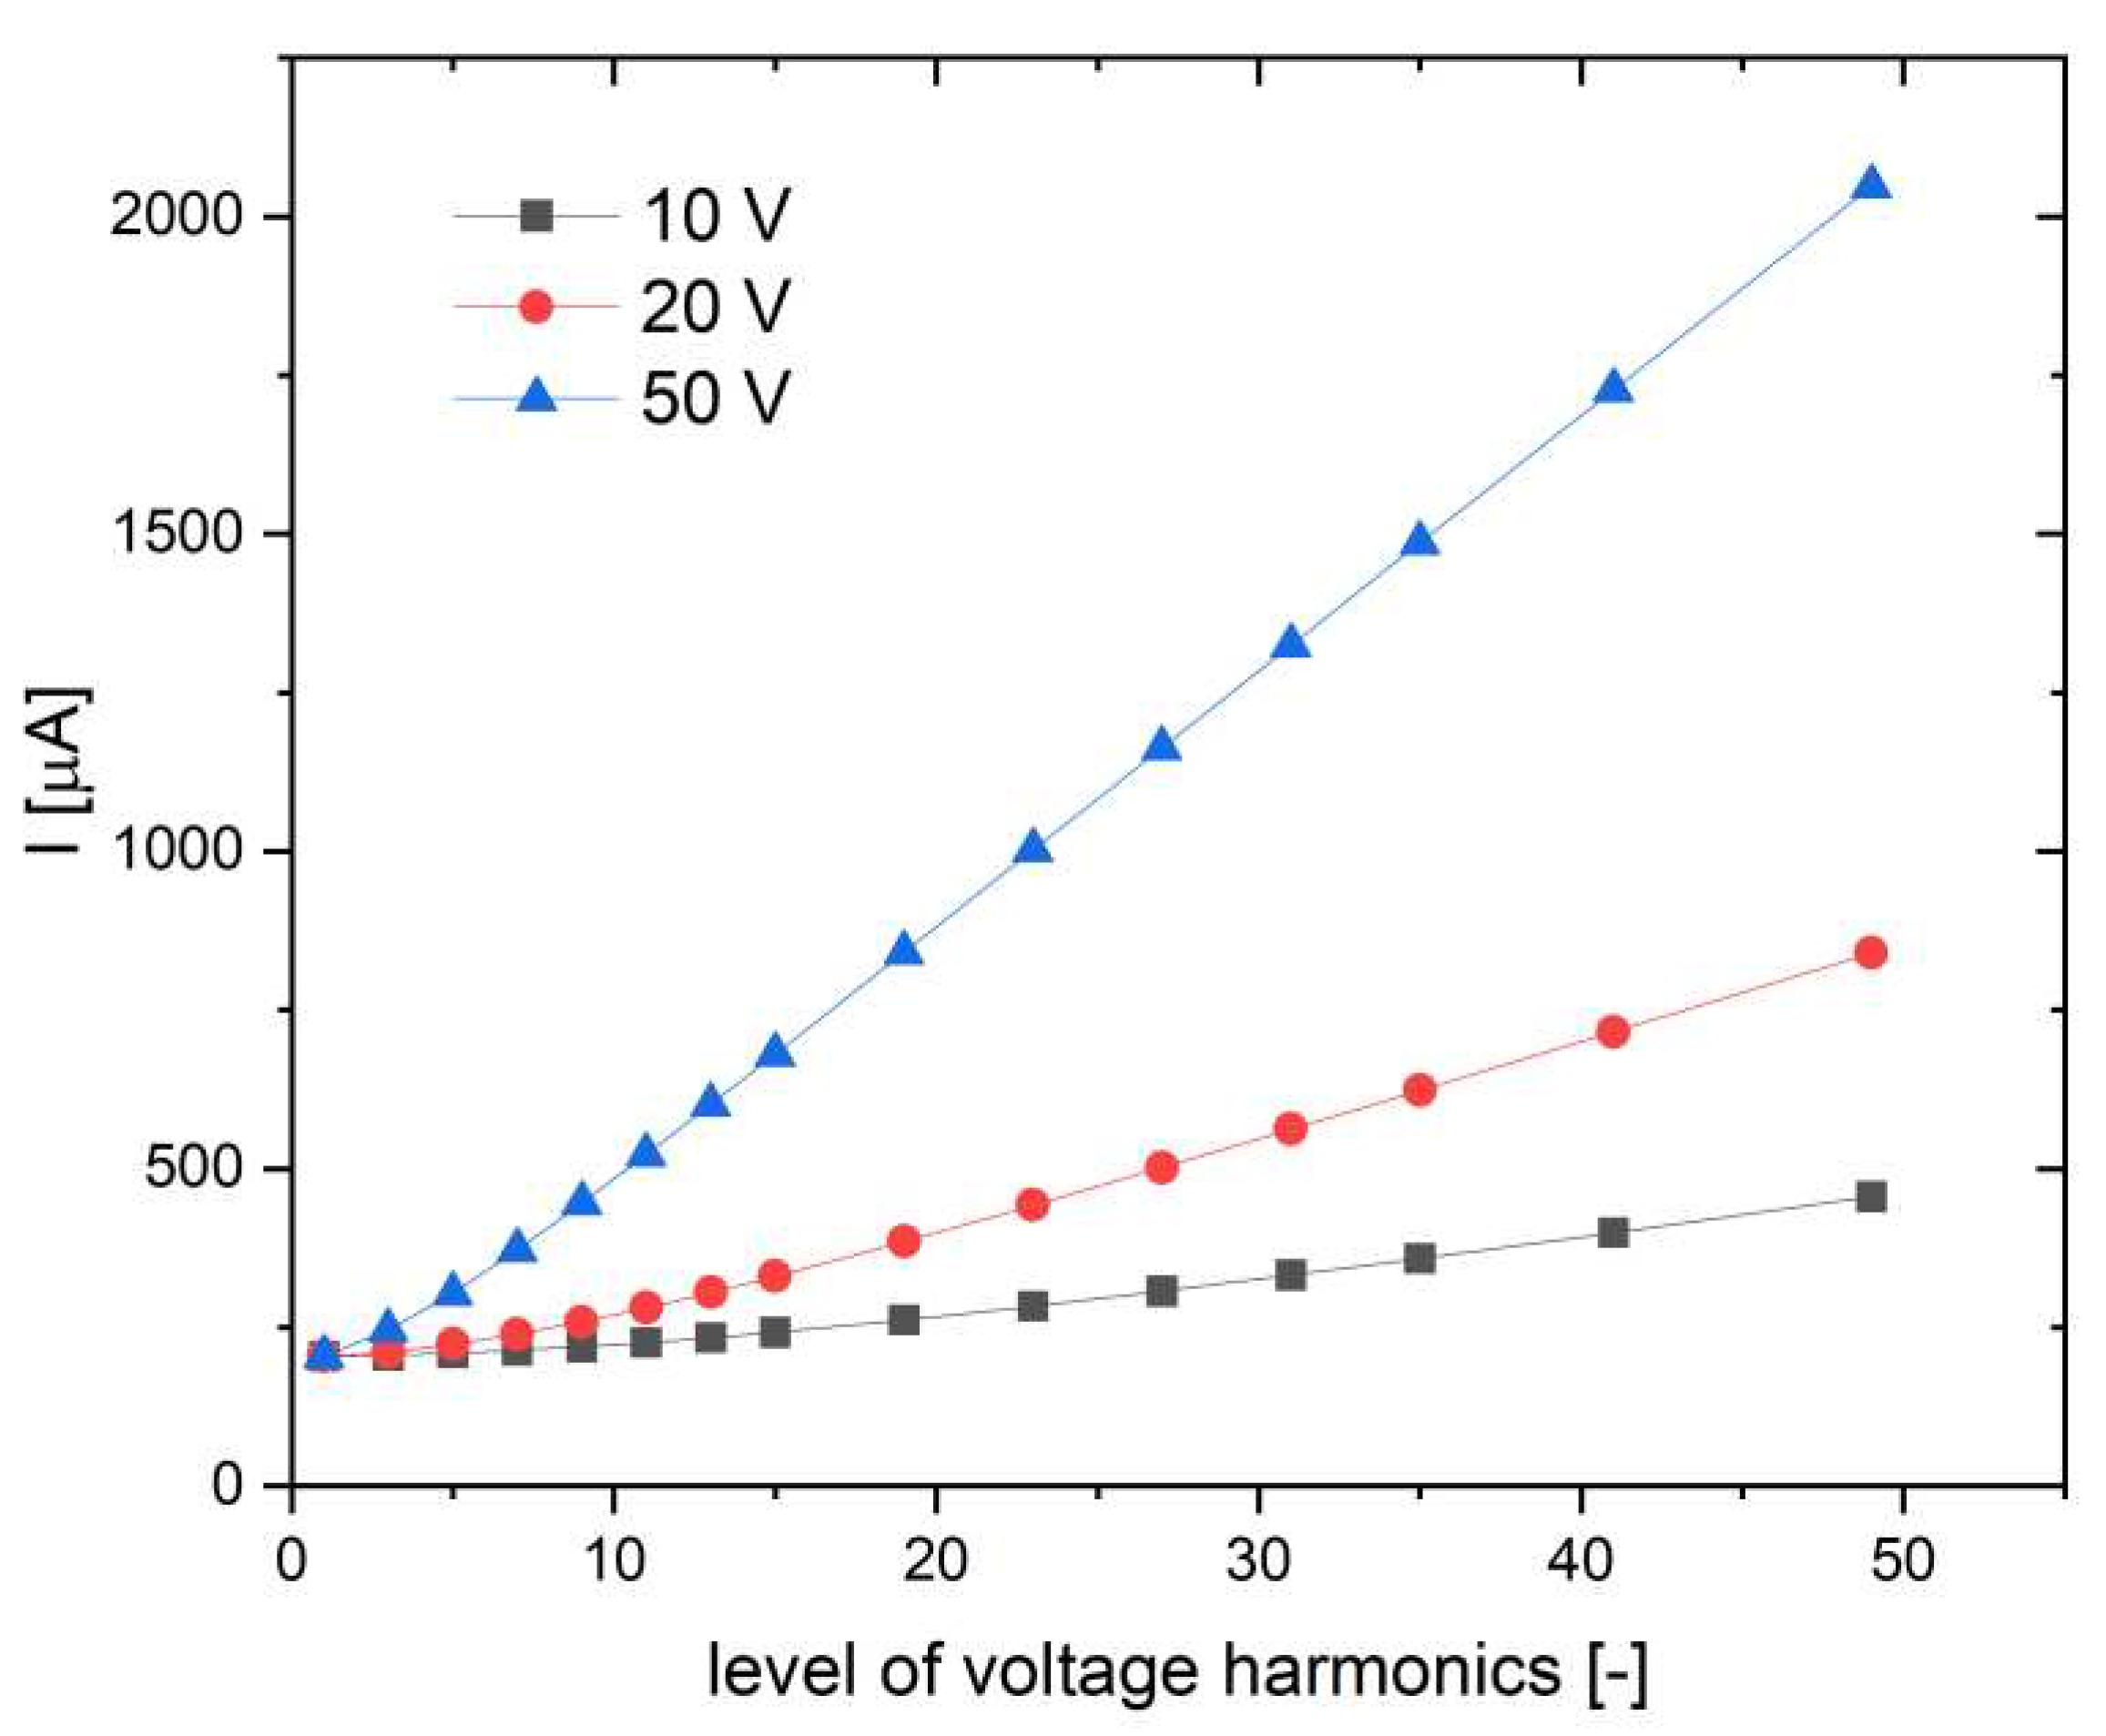
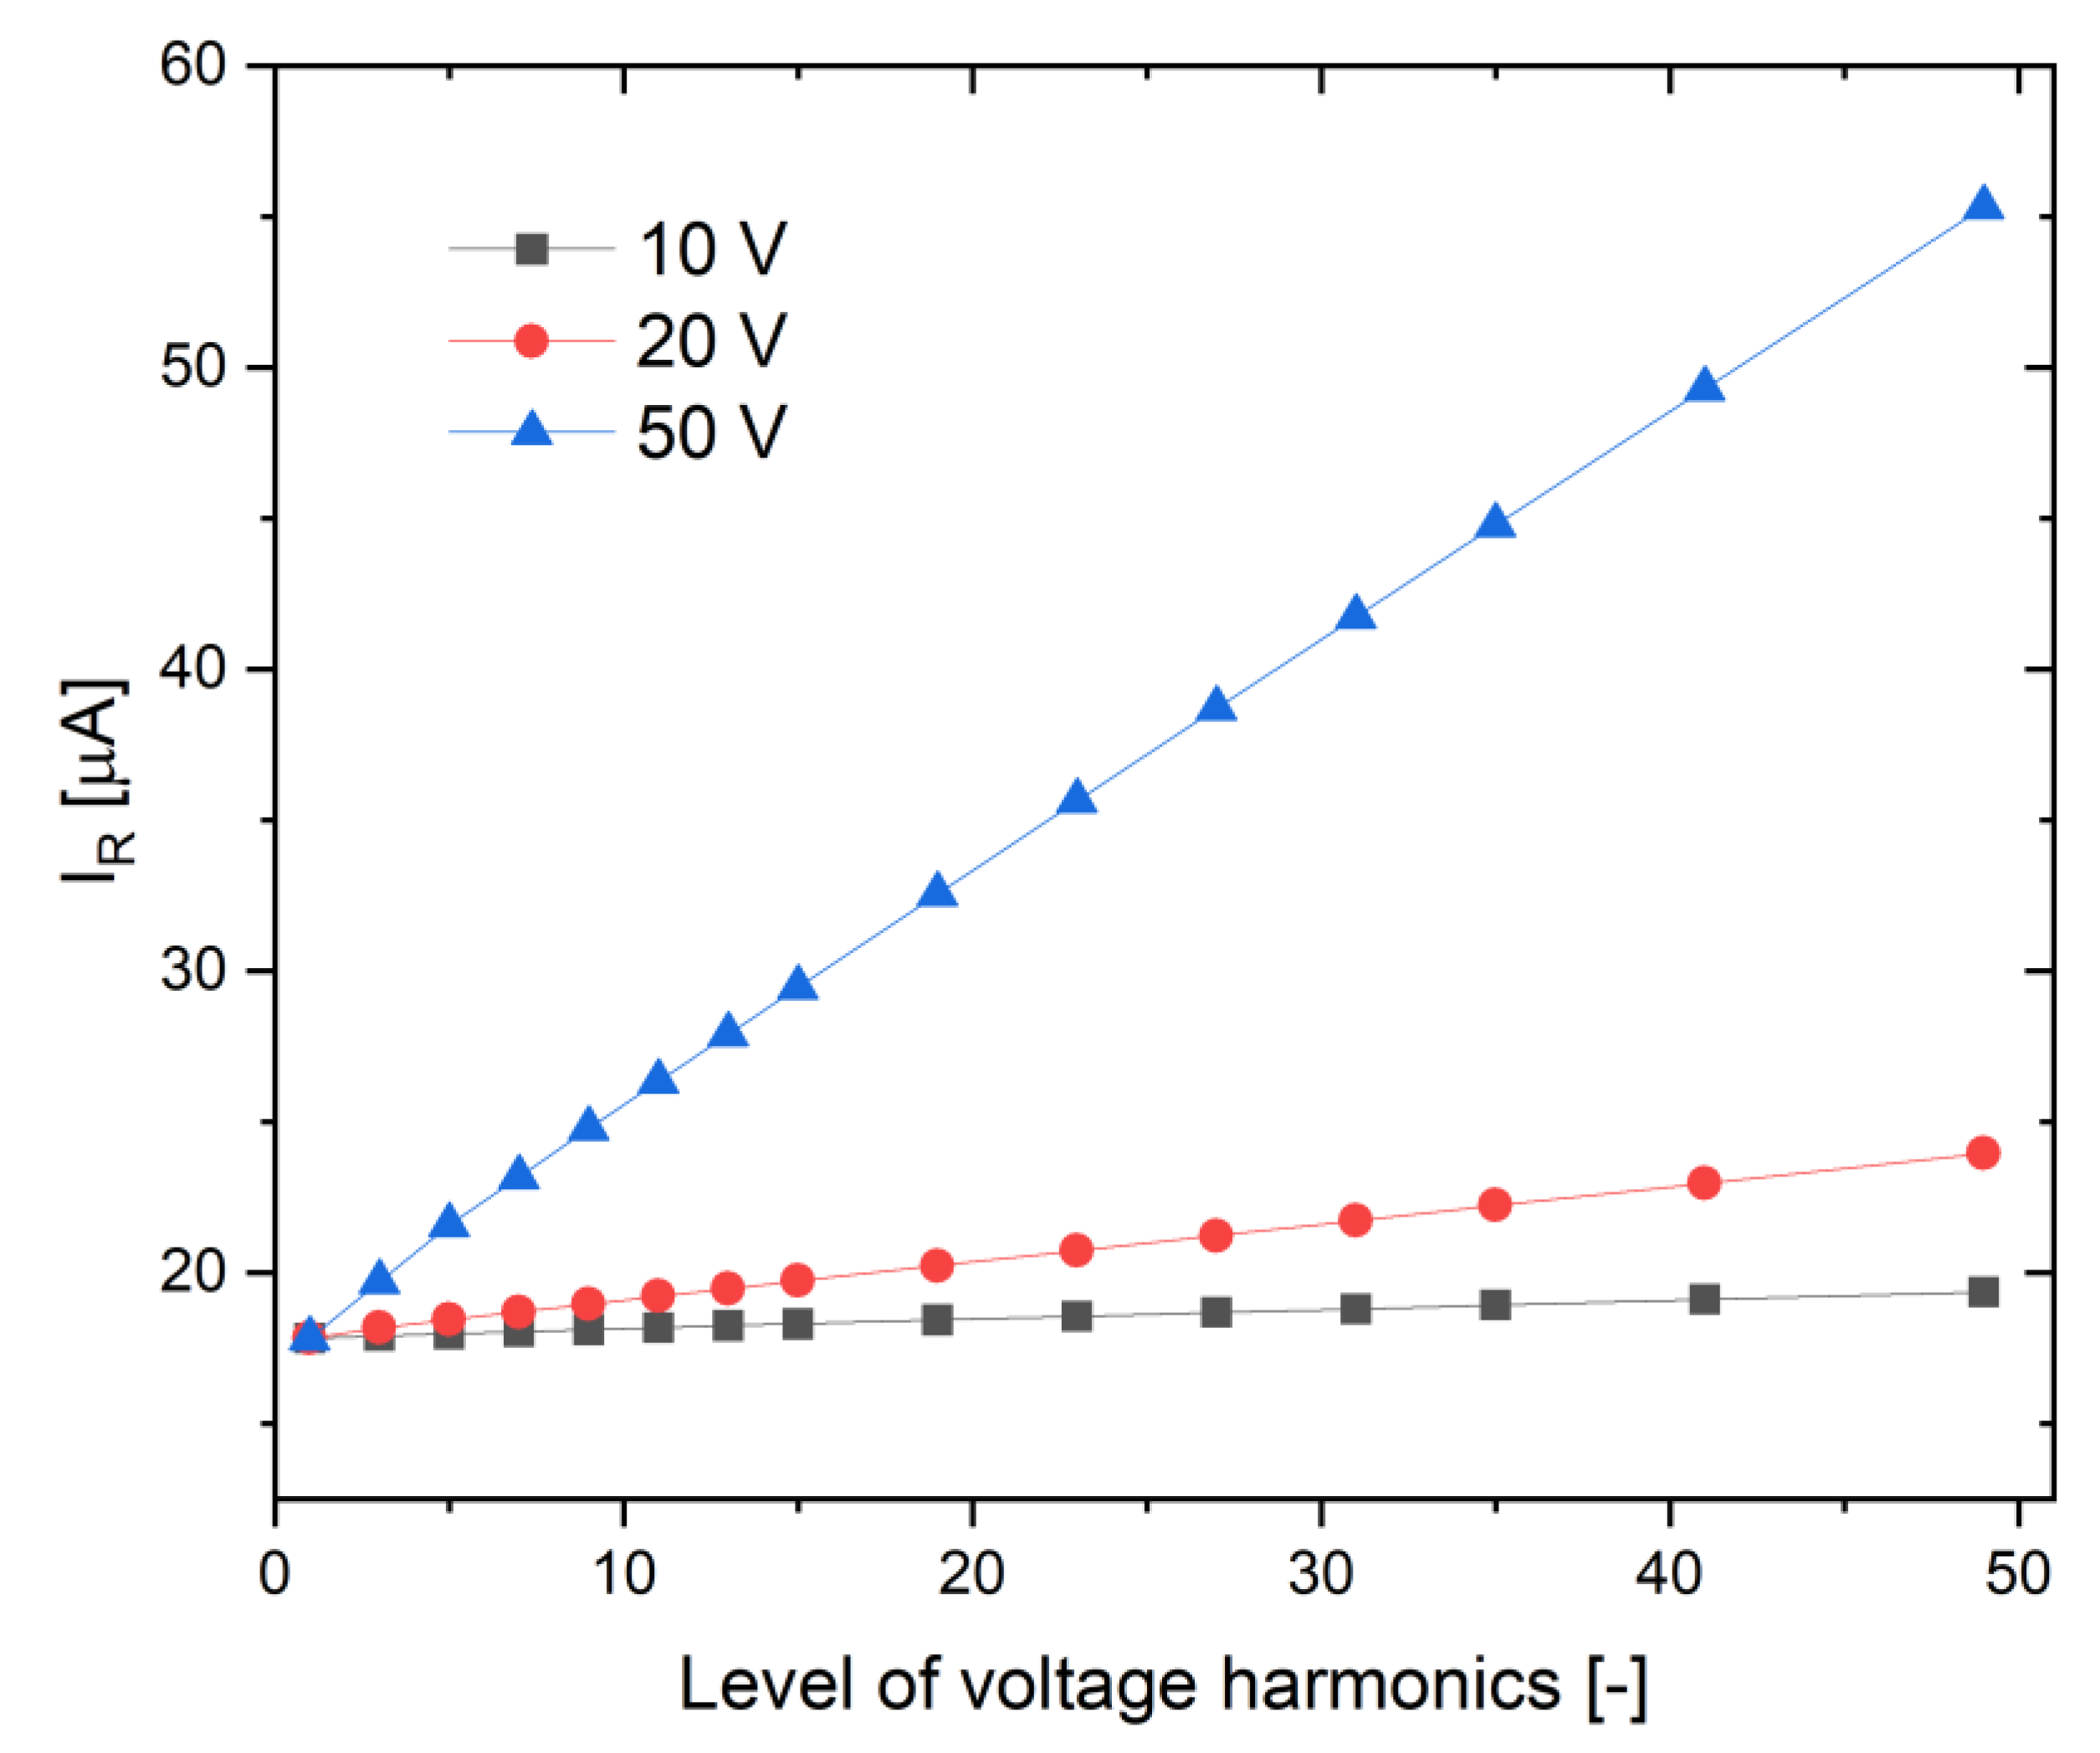
Large distortions of the voltage curve cause a strong increase in current harmonics of higher orders, which causes a significant increase in the value of the leakage current, including its active component. Calculation of the actual value of the active component of the leakage current additionally requires knowledge of the frequency characteristics of the arrester, which allows for the compensation of dominant harmonic components. The given example of leakage current measurement indicates the need to introduce advanced numerical analyzes that will enable determination of the active component in reference conditions.
The technical condition of the tested 6 surge arresters is similar.
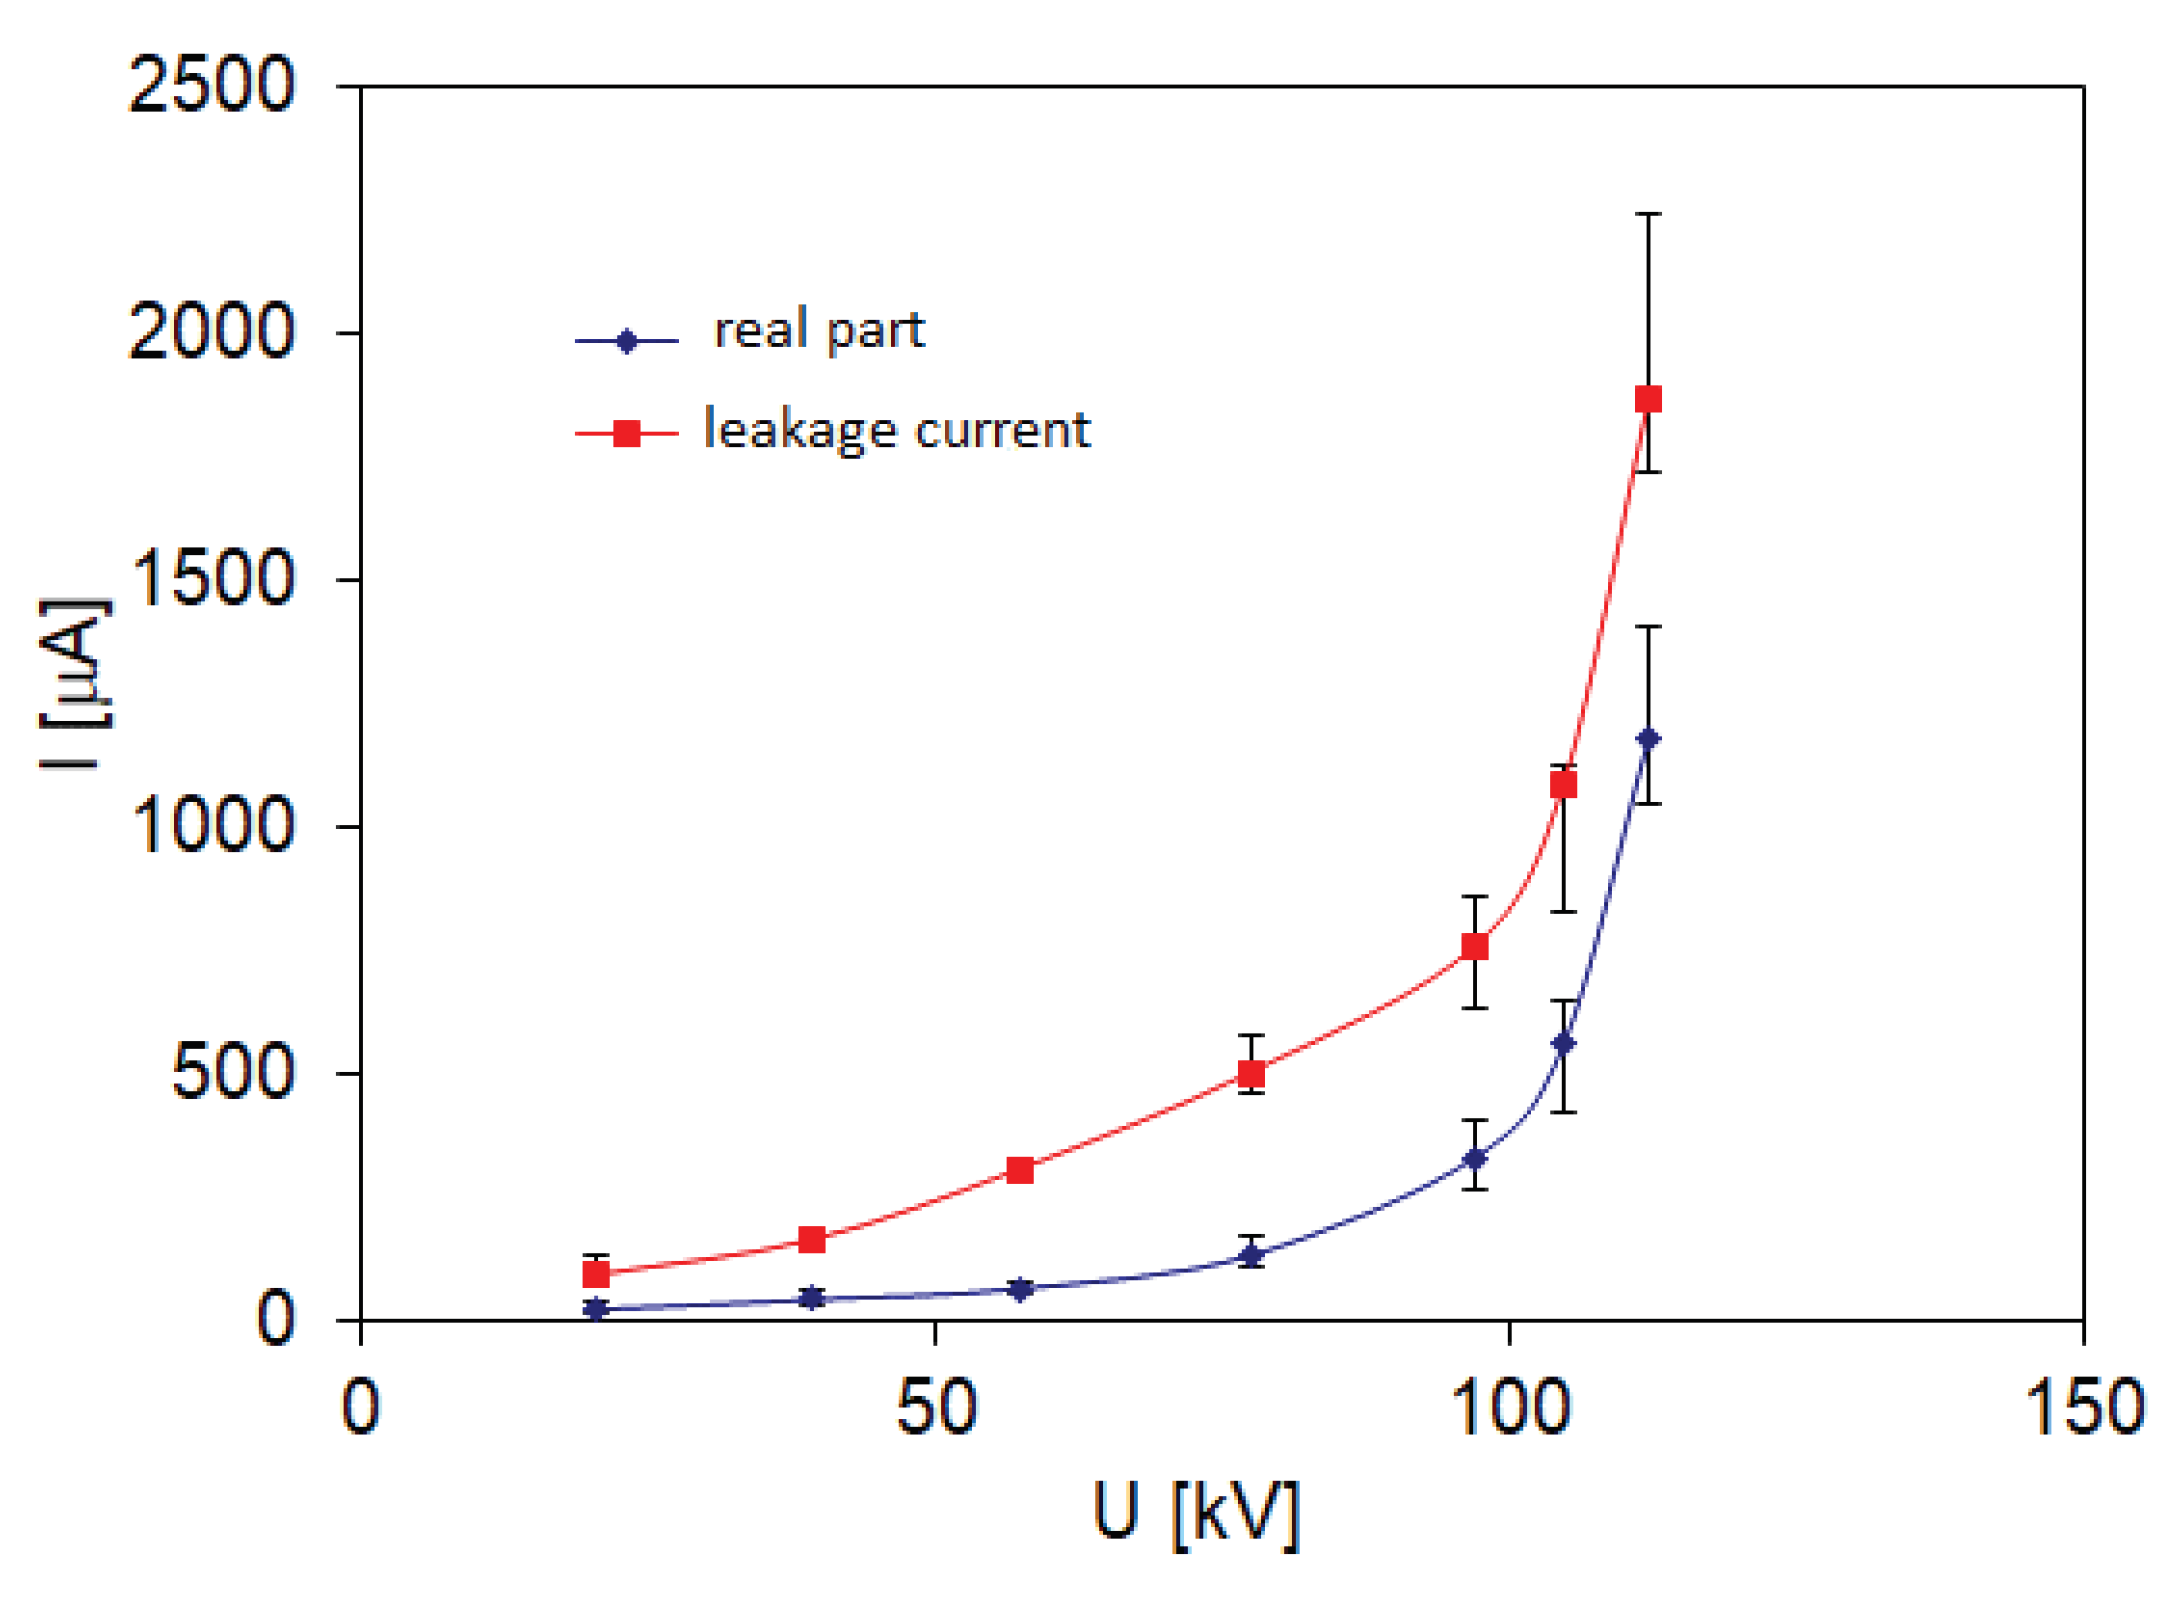
Figure 5 shows the level of the leakage current and its active component measured with the test unit B for the unit with a THDU of 20%. With a high content of the 3rd harmonic in the supply voltage, for individual arresters, the active component of the leakage current, with a small dispersion of the measured values, maintains a relatively low value up to and including the continuous operating voltage. For the tested limiters, a change in the I(U) characteristic is observed after exceeding the voltage U
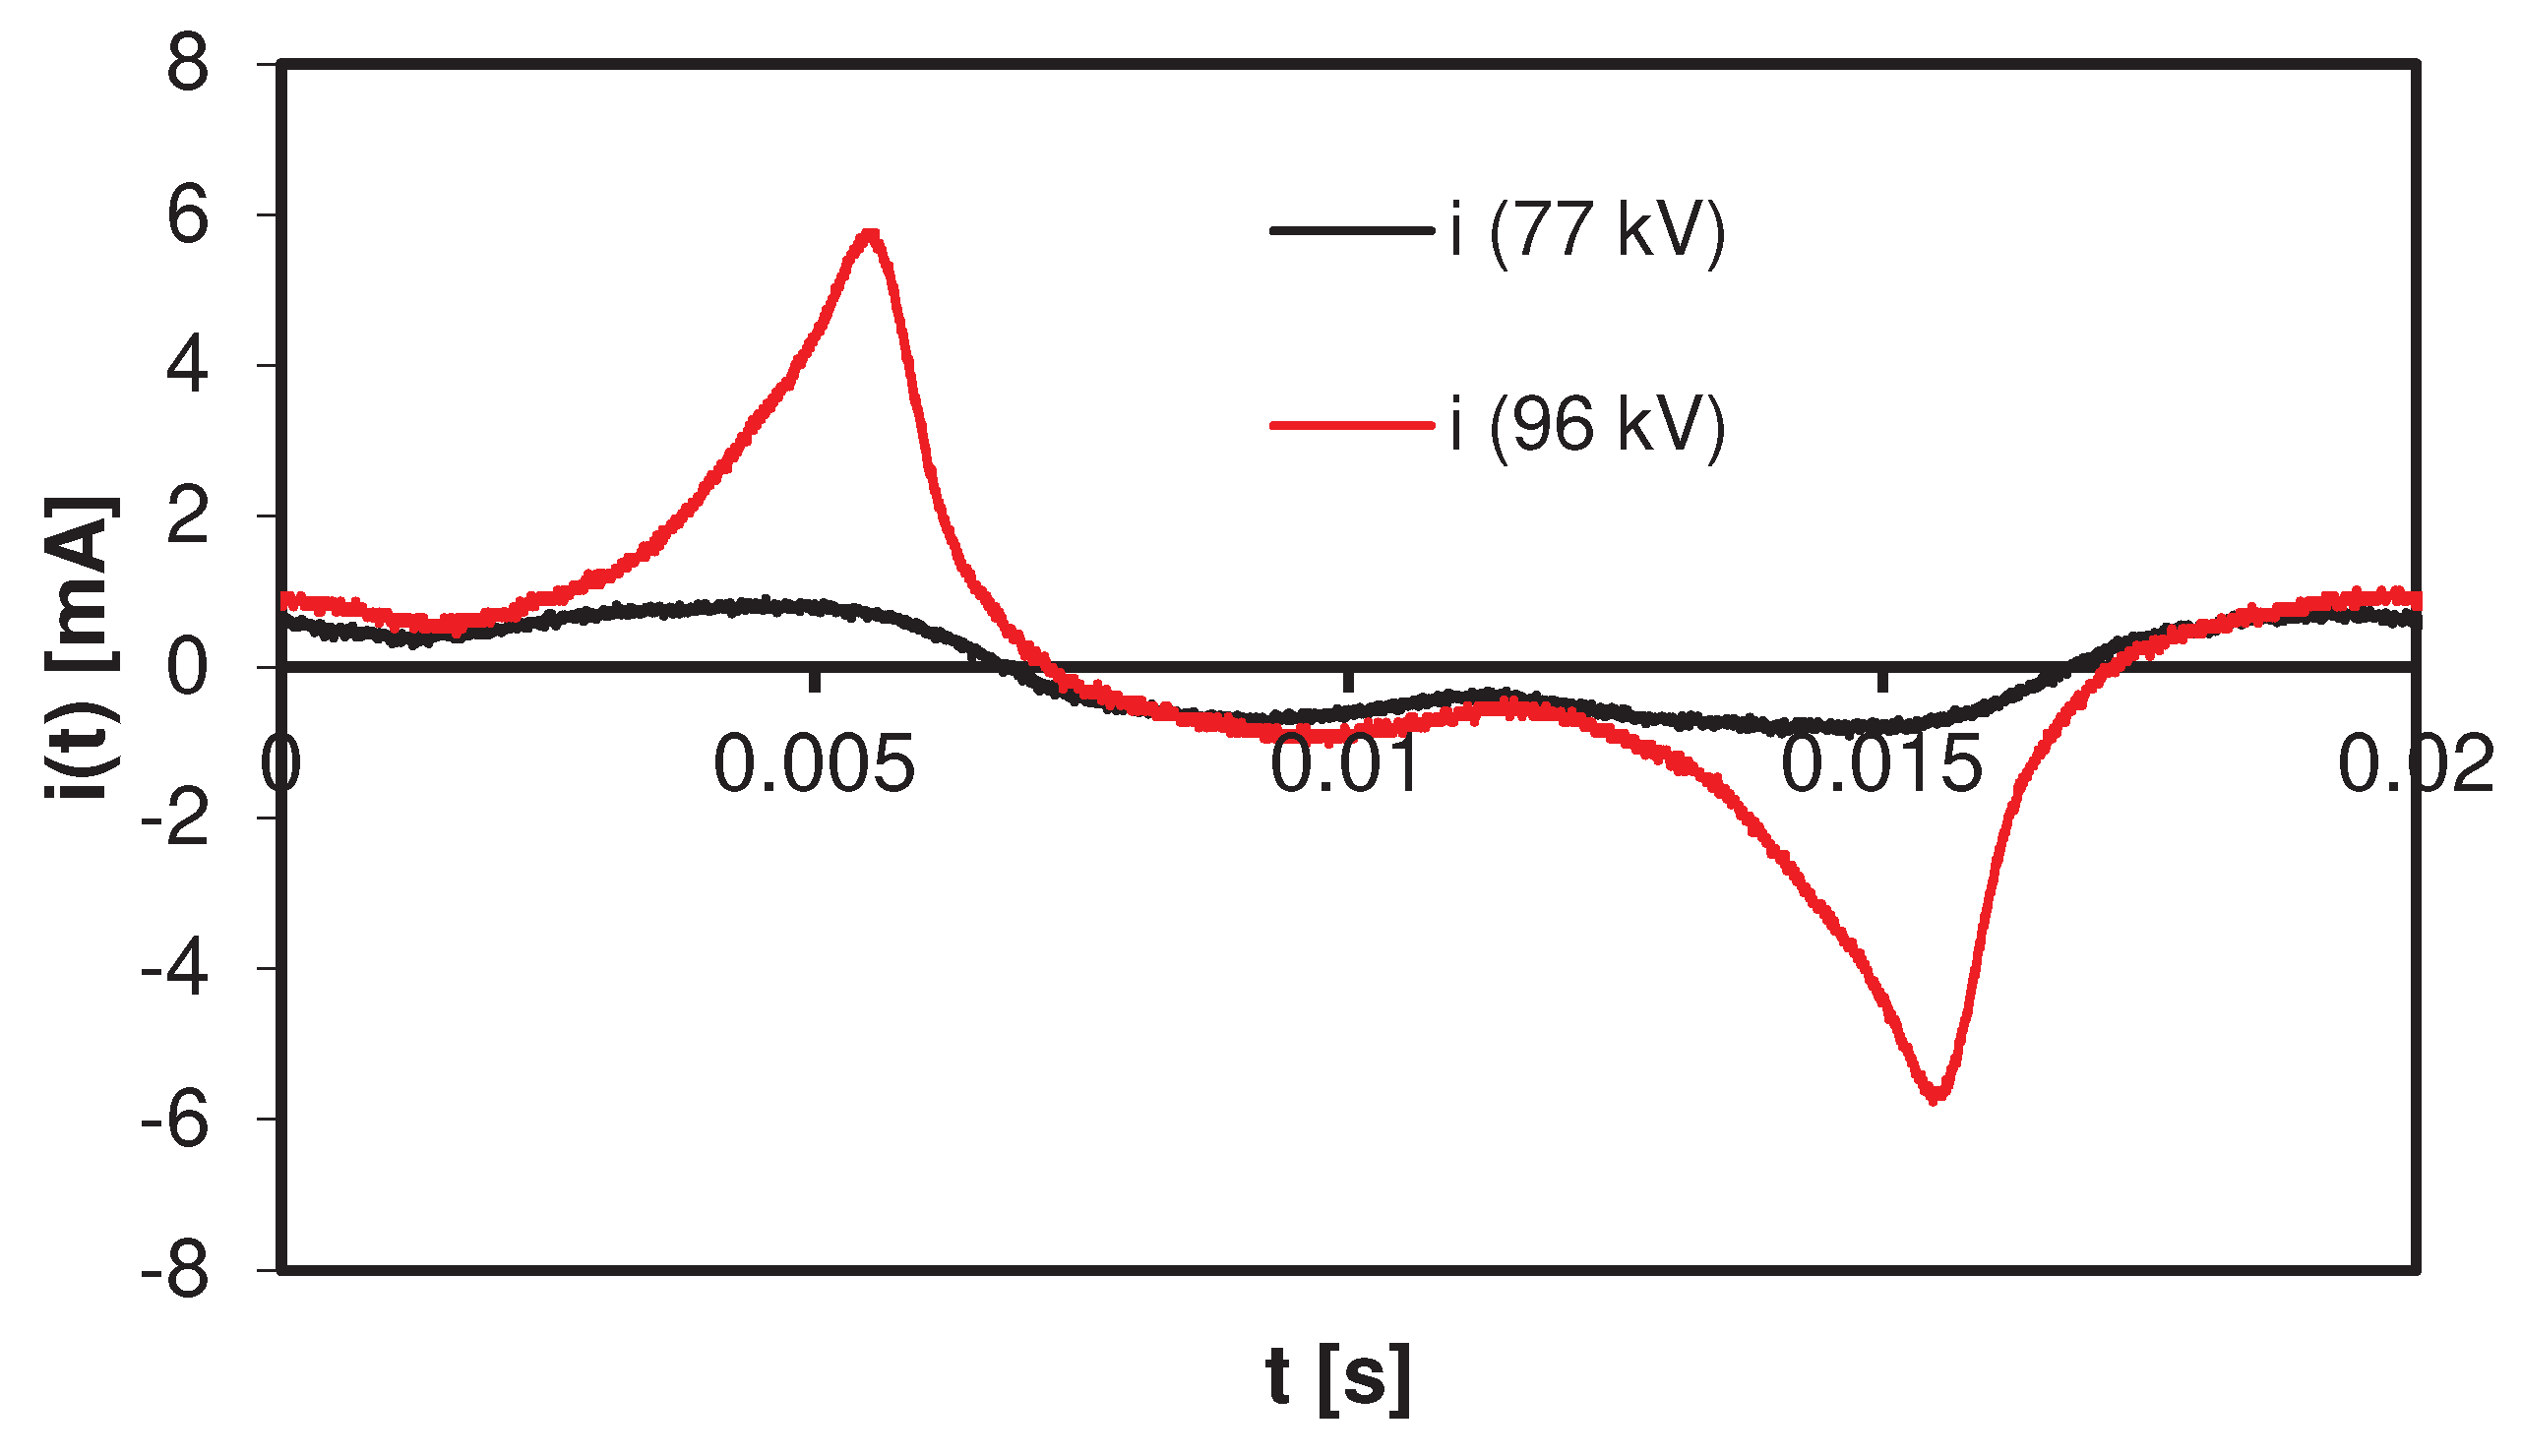
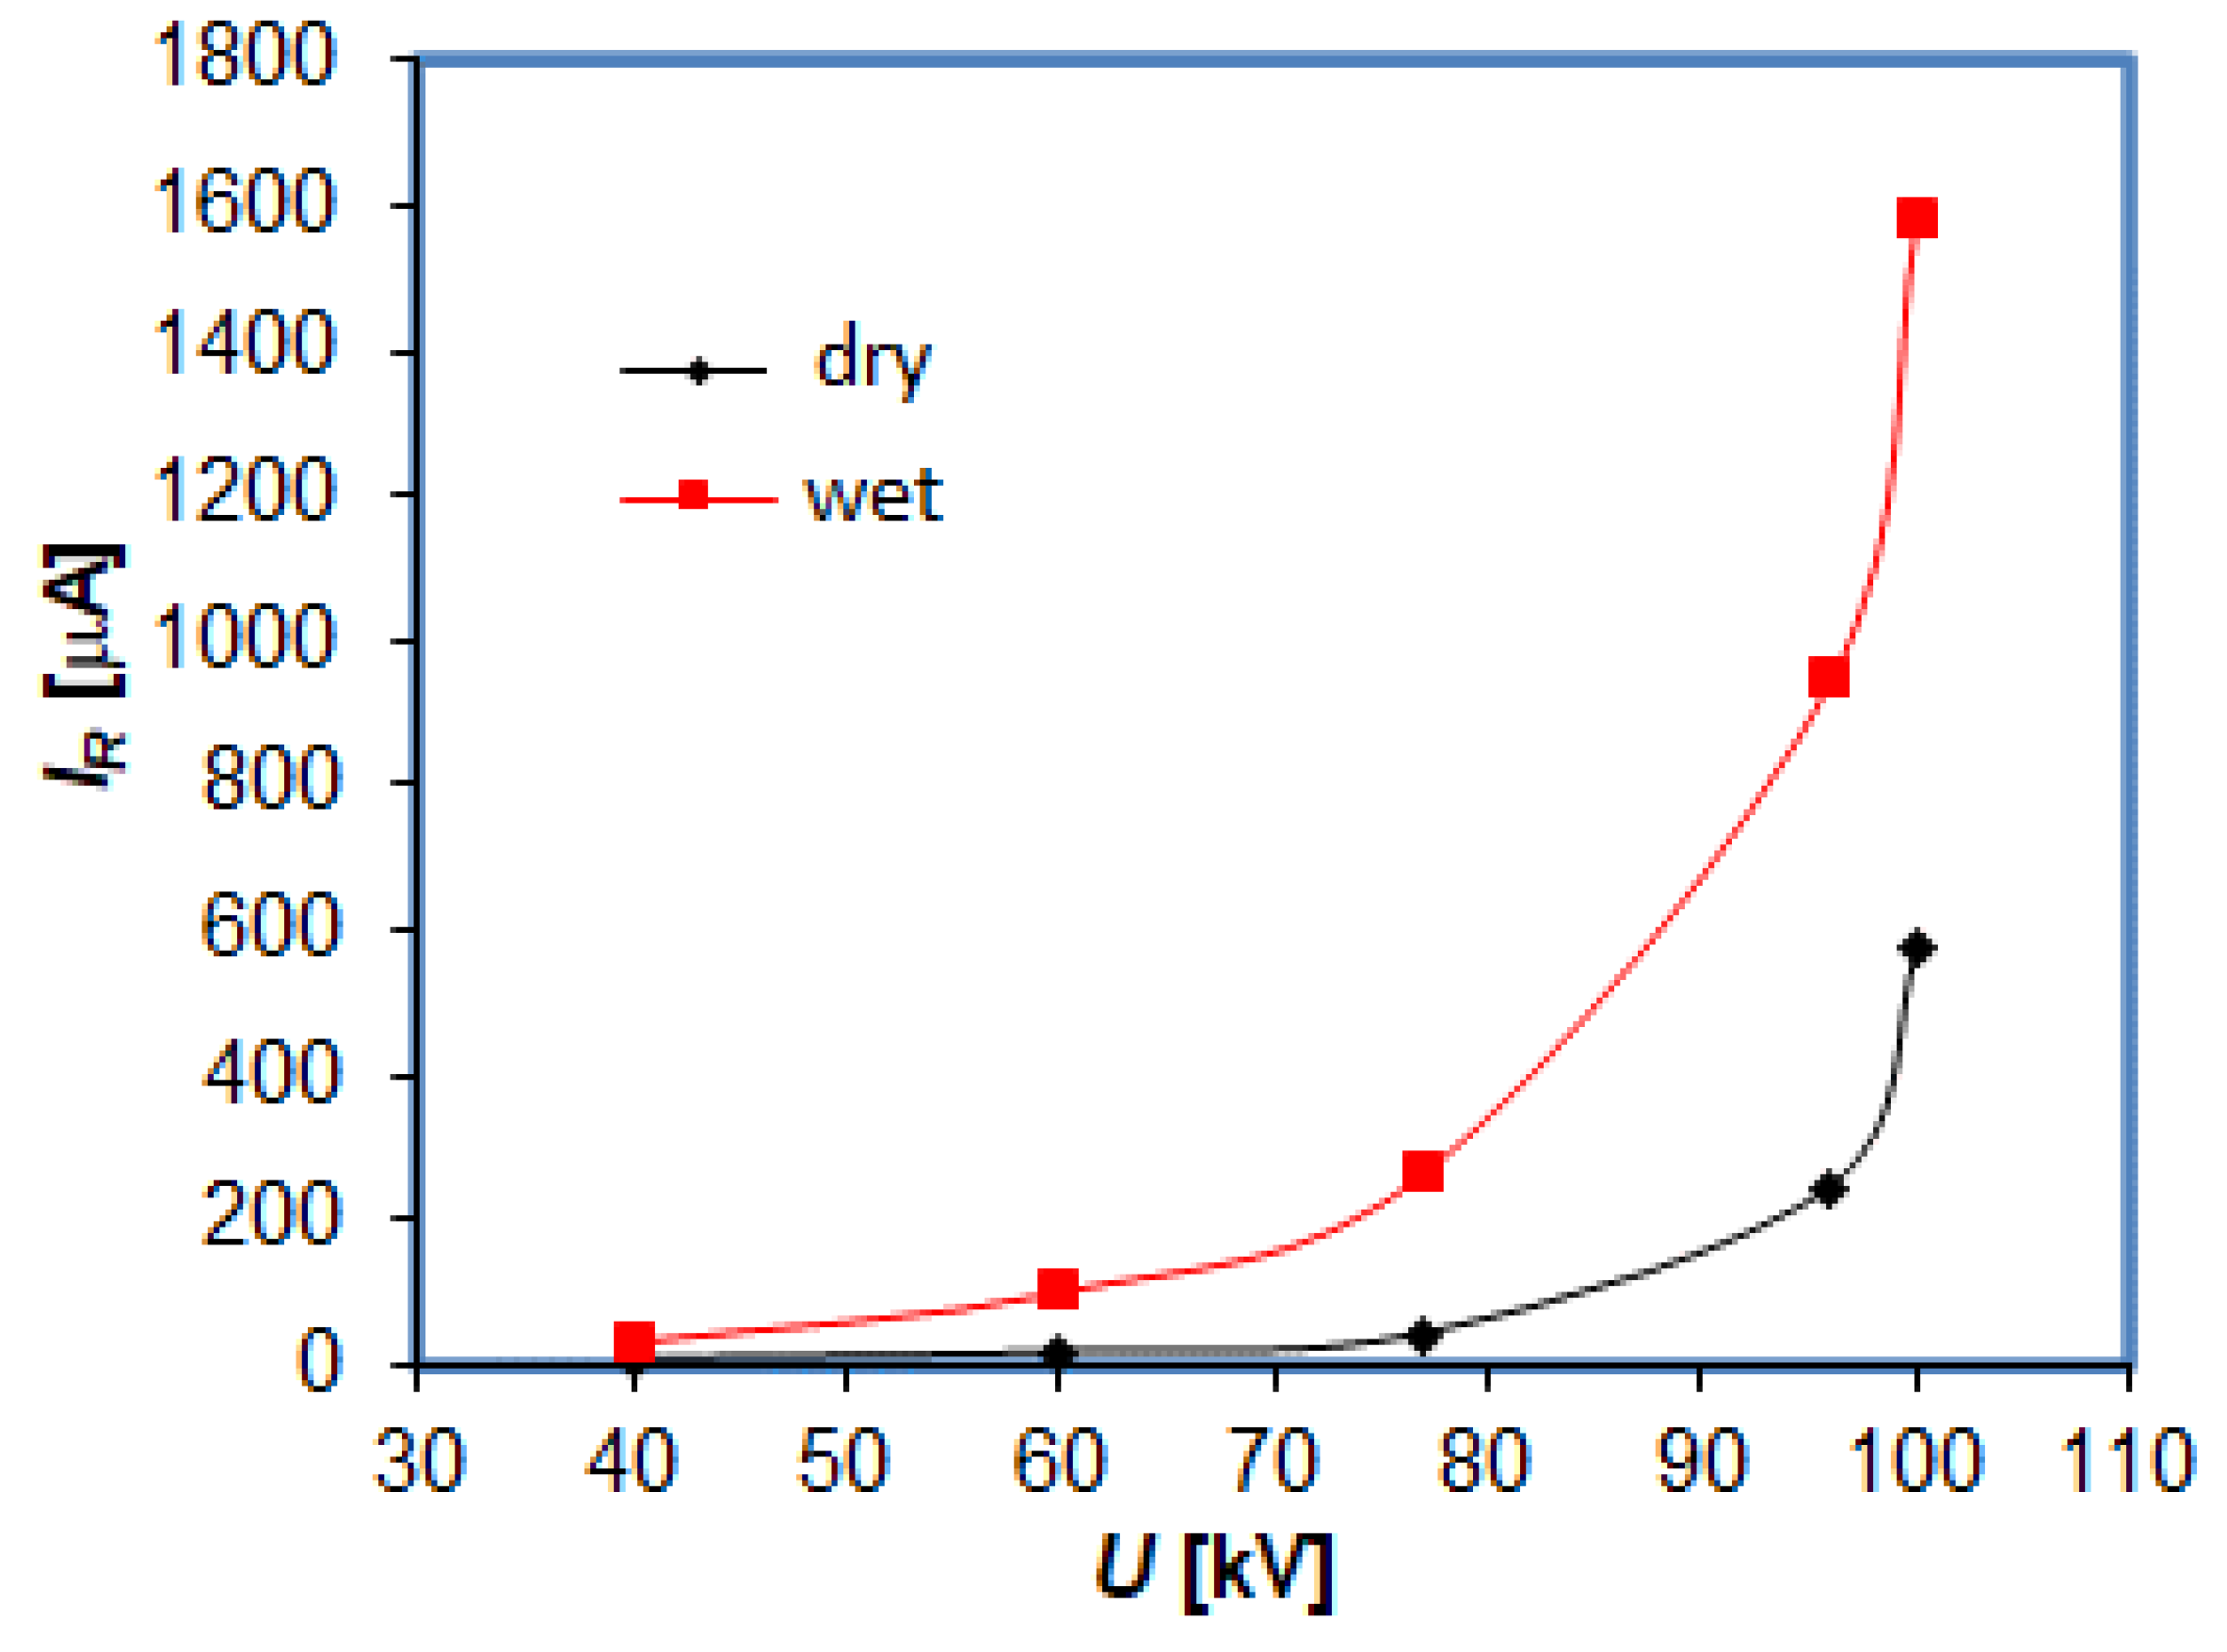
c, which is related to the increase in the resistive component in the leakage current (
Figure 6 and
Figure 7). In addition, the rms values of the voltage at the leakage current amplitude of 5 mA are in accordance with the requirements of the arrester manufacturer, which suggests their correct technical condition.
The comparison of the measurement results of the arrester with a dry and wet surface shows several times higher values of the active component of the leakage current in conditions of artificial rain (
Figure 7).
Figure 1.
U(I) characteristics of a new and aged surge arrester.
Figure 1.
U(I) characteristics of a new and aged surge arrester.
Figure 2.
Differentiation of leakage currents of MV arresters a) new and b) after applying a single current surge, obtained on the basis of testing 10 samples of an arrester with similar rated parameters from manufacturers A, B, C, D.
Figure 2.
Differentiation of leakage currents of MV arresters a) new and b) after applying a single current surge, obtained on the basis of testing 10 samples of an arrester with similar rated parameters from manufacturers A, B, C, D.
Figure 3.
Differentiation of leakage currents of LV arresters a) new and b) after applying a single current surge, obtained on the basis of testing 10 samples of an arrester with similar rated parameters from manufacturers E and F.
Figure 3.
Differentiation of leakage currents of LV arresters a) new and b) after applying a single current surge, obtained on the basis of testing 10 samples of an arrester with similar rated parameters from manufacturers E and F.
Figure 4.
Measuring stand with tested arrester: 1 - high voltage transformer 300 kV, 2 - voltage divider capacitor, 3 - surge arrester.
Figure 4.
Measuring stand with tested arrester: 1 - high voltage transformer 300 kV, 2 - voltage divider capacitor, 3 - surge arrester.
Figure 5.
Current-voltage characteristics for 6 tested arresters in the range of leakage current (average, maximum and minimum values of leakage current are marked) in the conditions of supplying unit B.
Figure 5.
Current-voltage characteristics for 6 tested arresters in the range of leakage current (average, maximum and minimum values of leakage current are marked) in the conditions of supplying unit B.
Figure 6.
The course of the leakage current of the arrester No. 4 measured at the voltage Uc = 77 kV and Ur = 96 kV with the power supply conditions of the test unit A.
Figure 6.
The course of the leakage current of the arrester No. 4 measured at the voltage Uc = 77 kV and Ur = 96 kV with the power supply conditions of the test unit A.
Figure 7.
Influence of the surface condition of the arrester No. 4 on the value of the resistive component of the leakage current.
Figure 7.
Influence of the surface condition of the arrester No. 4 on the value of the resistive component of the leakage current.
Figure 8.
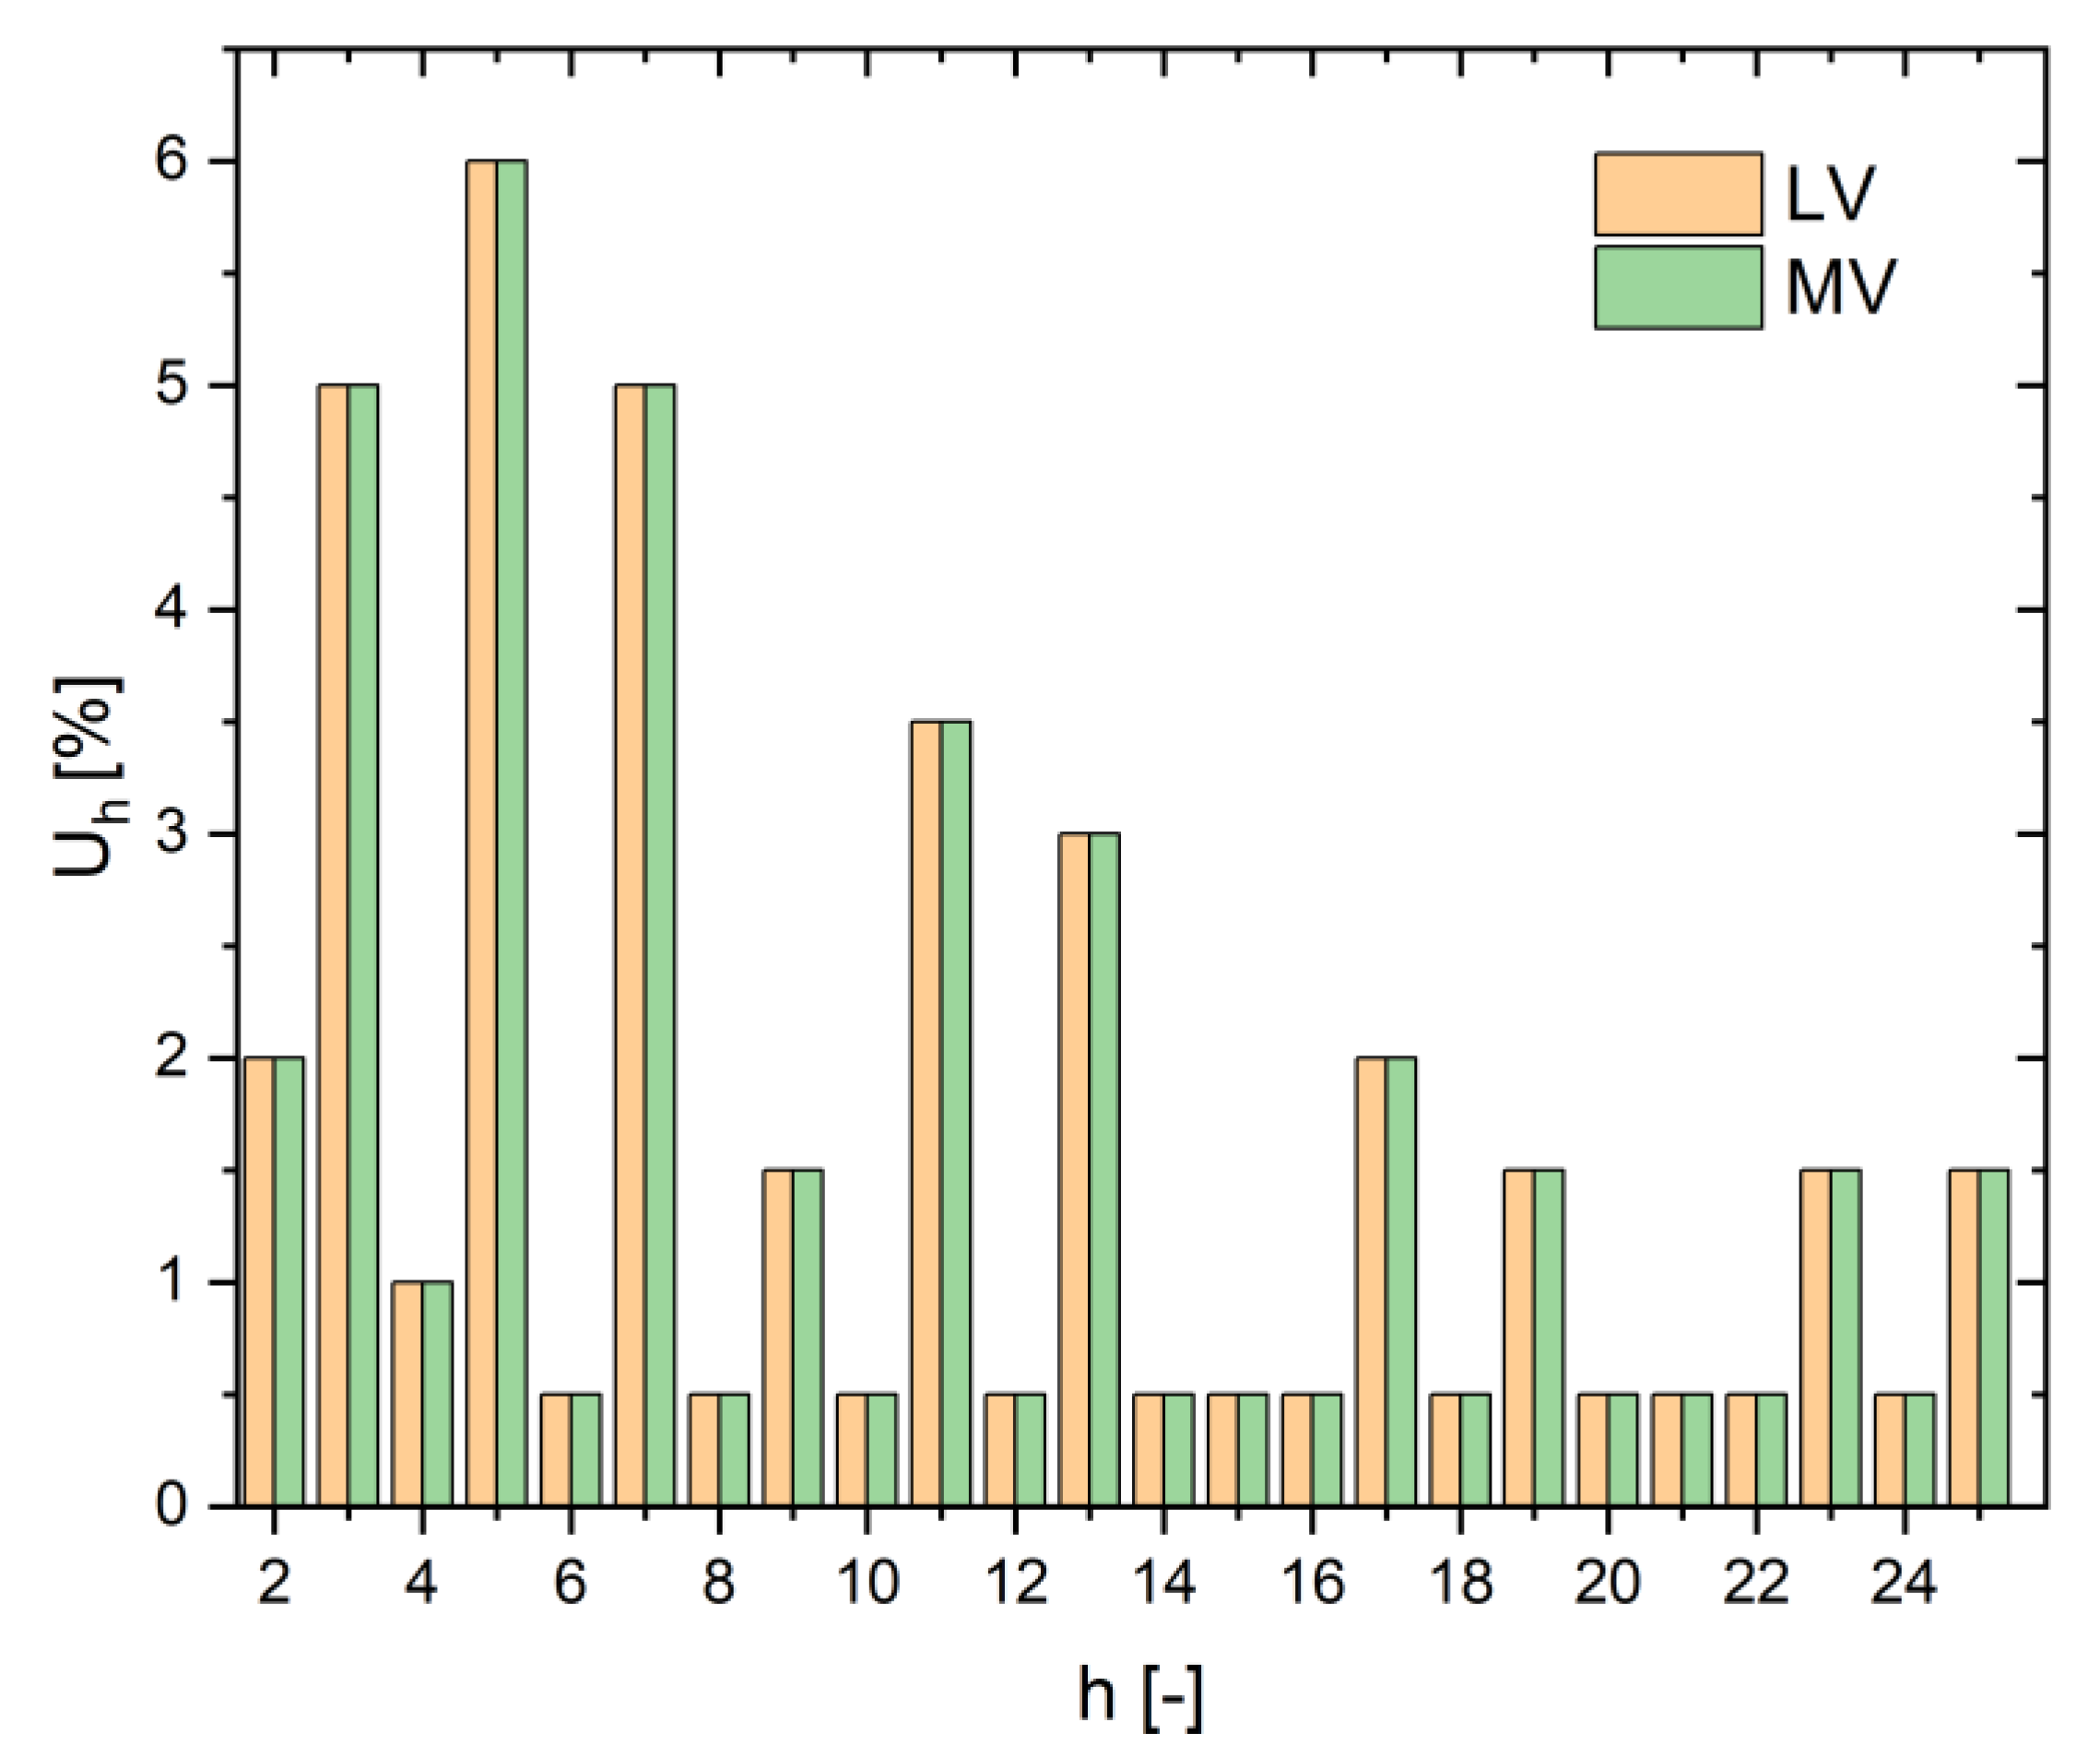
Permissible levels of harmonic components in LV and MV networks [
35].
Figure 8.
Permissible levels of harmonic components in LV and MV networks [
35].
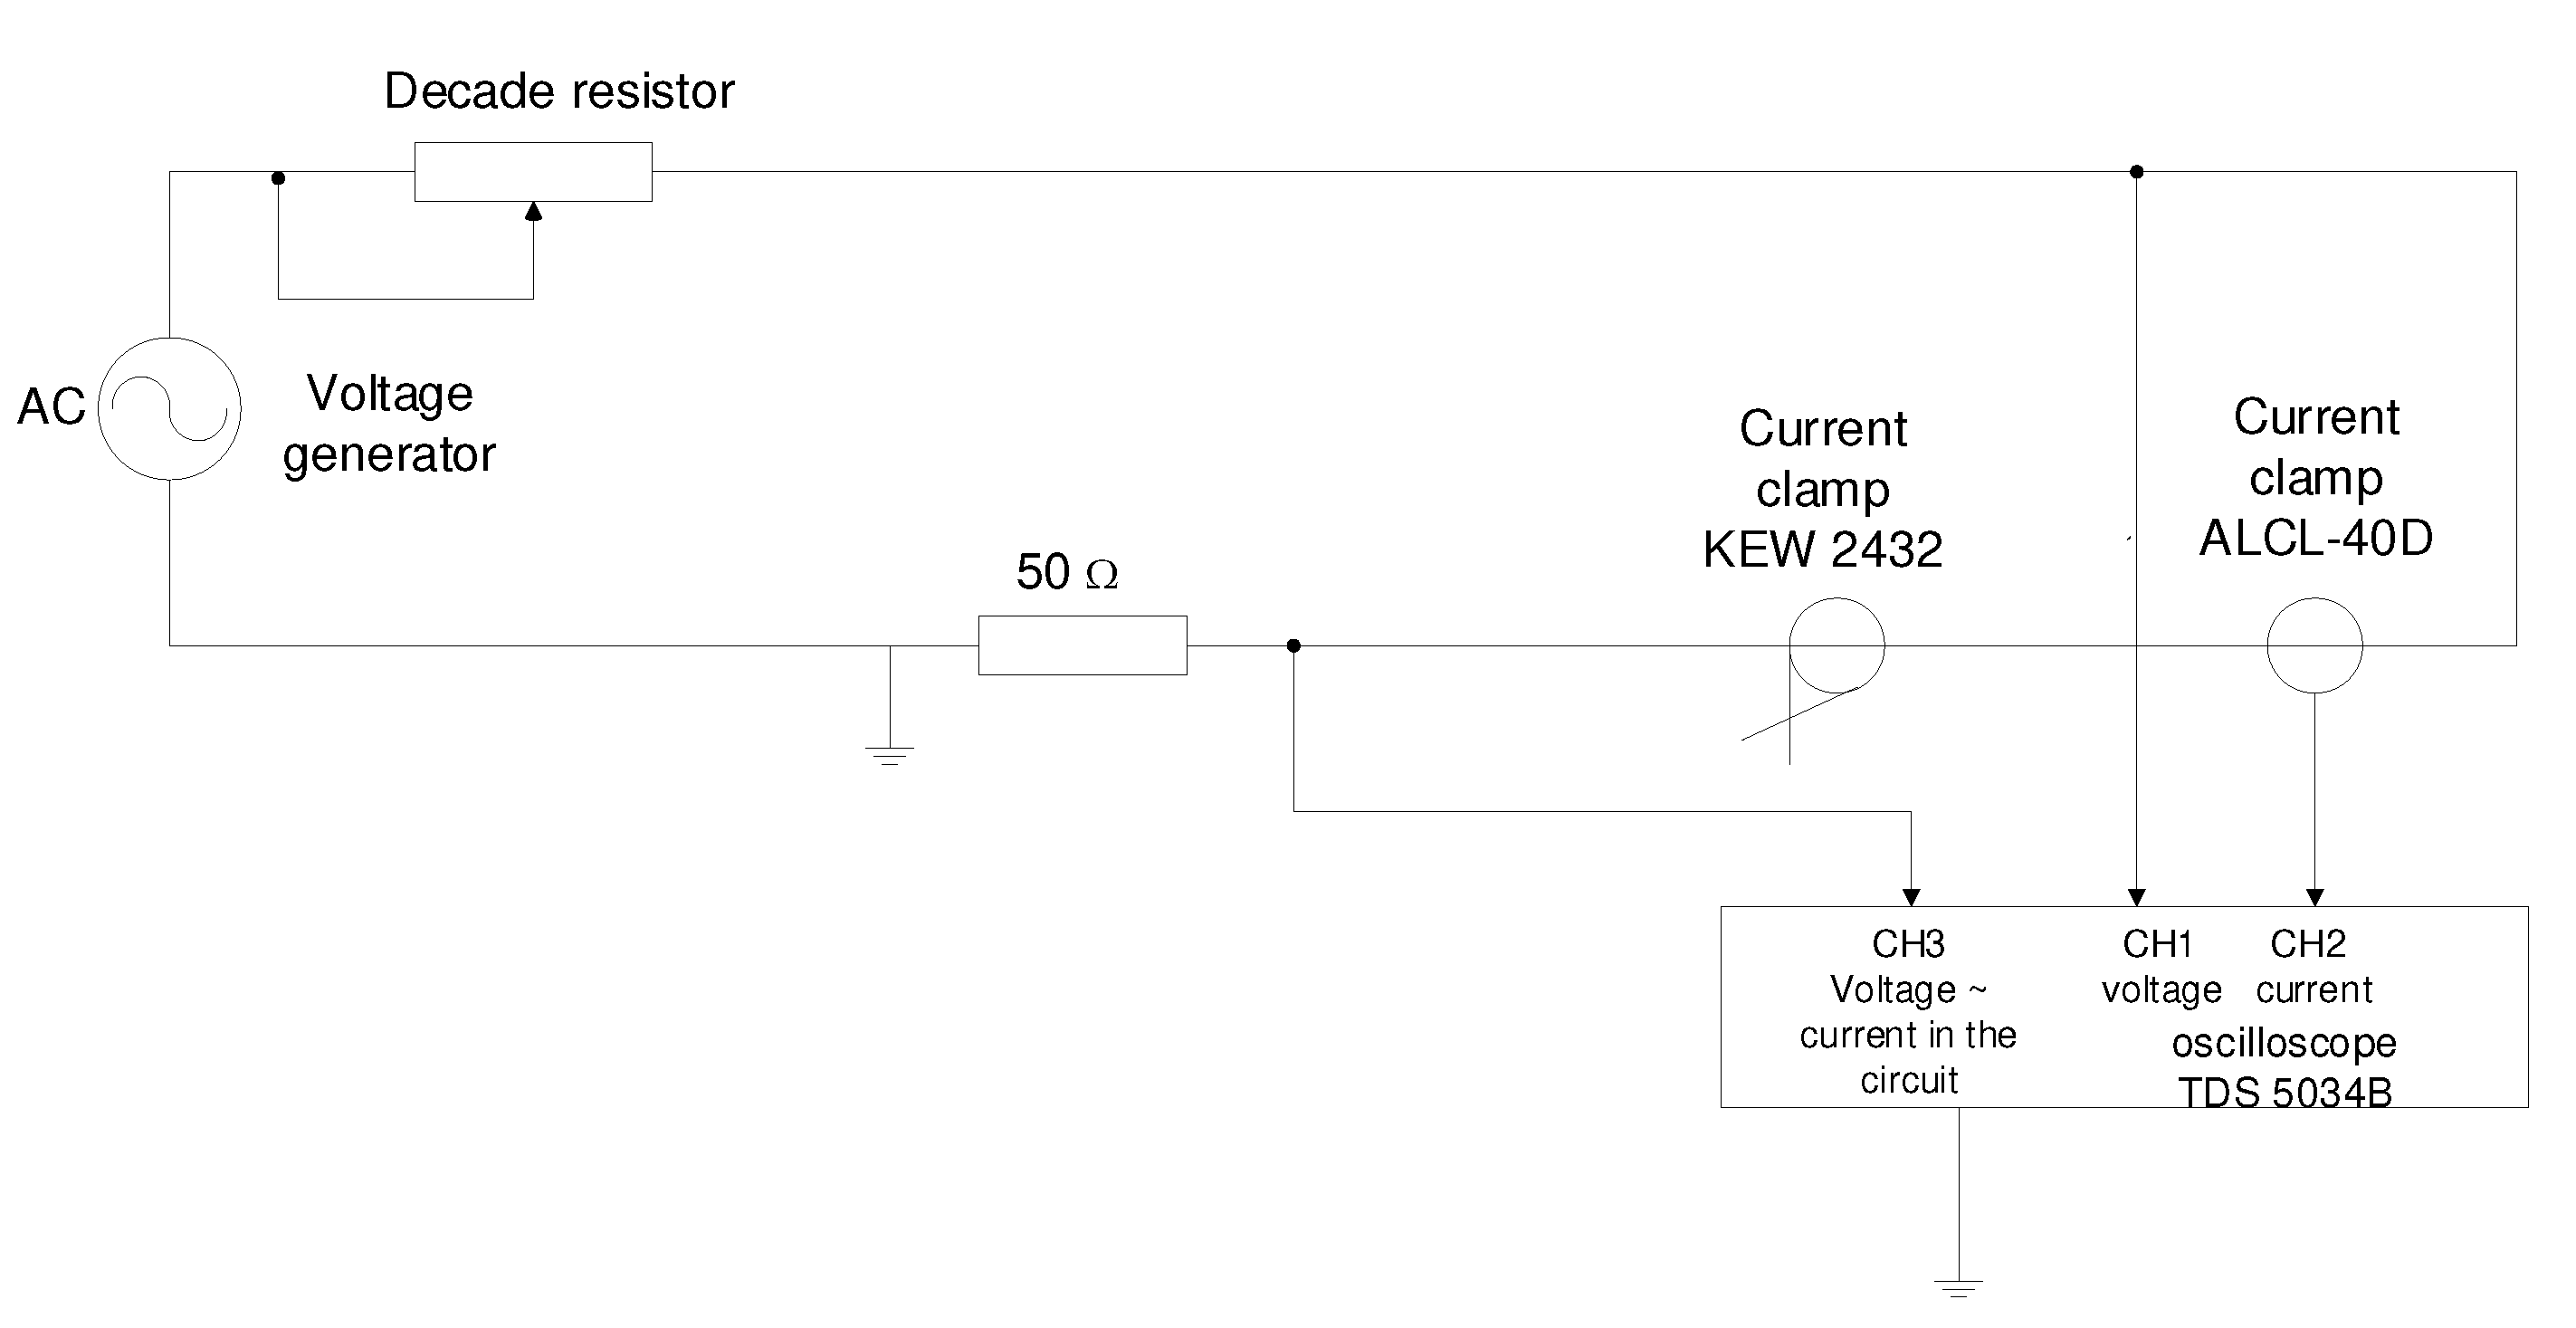
Figure 9.
Scheme of the measuring stand for current clamp calibration.
Figure 9.
Scheme of the measuring stand for current clamp calibration.
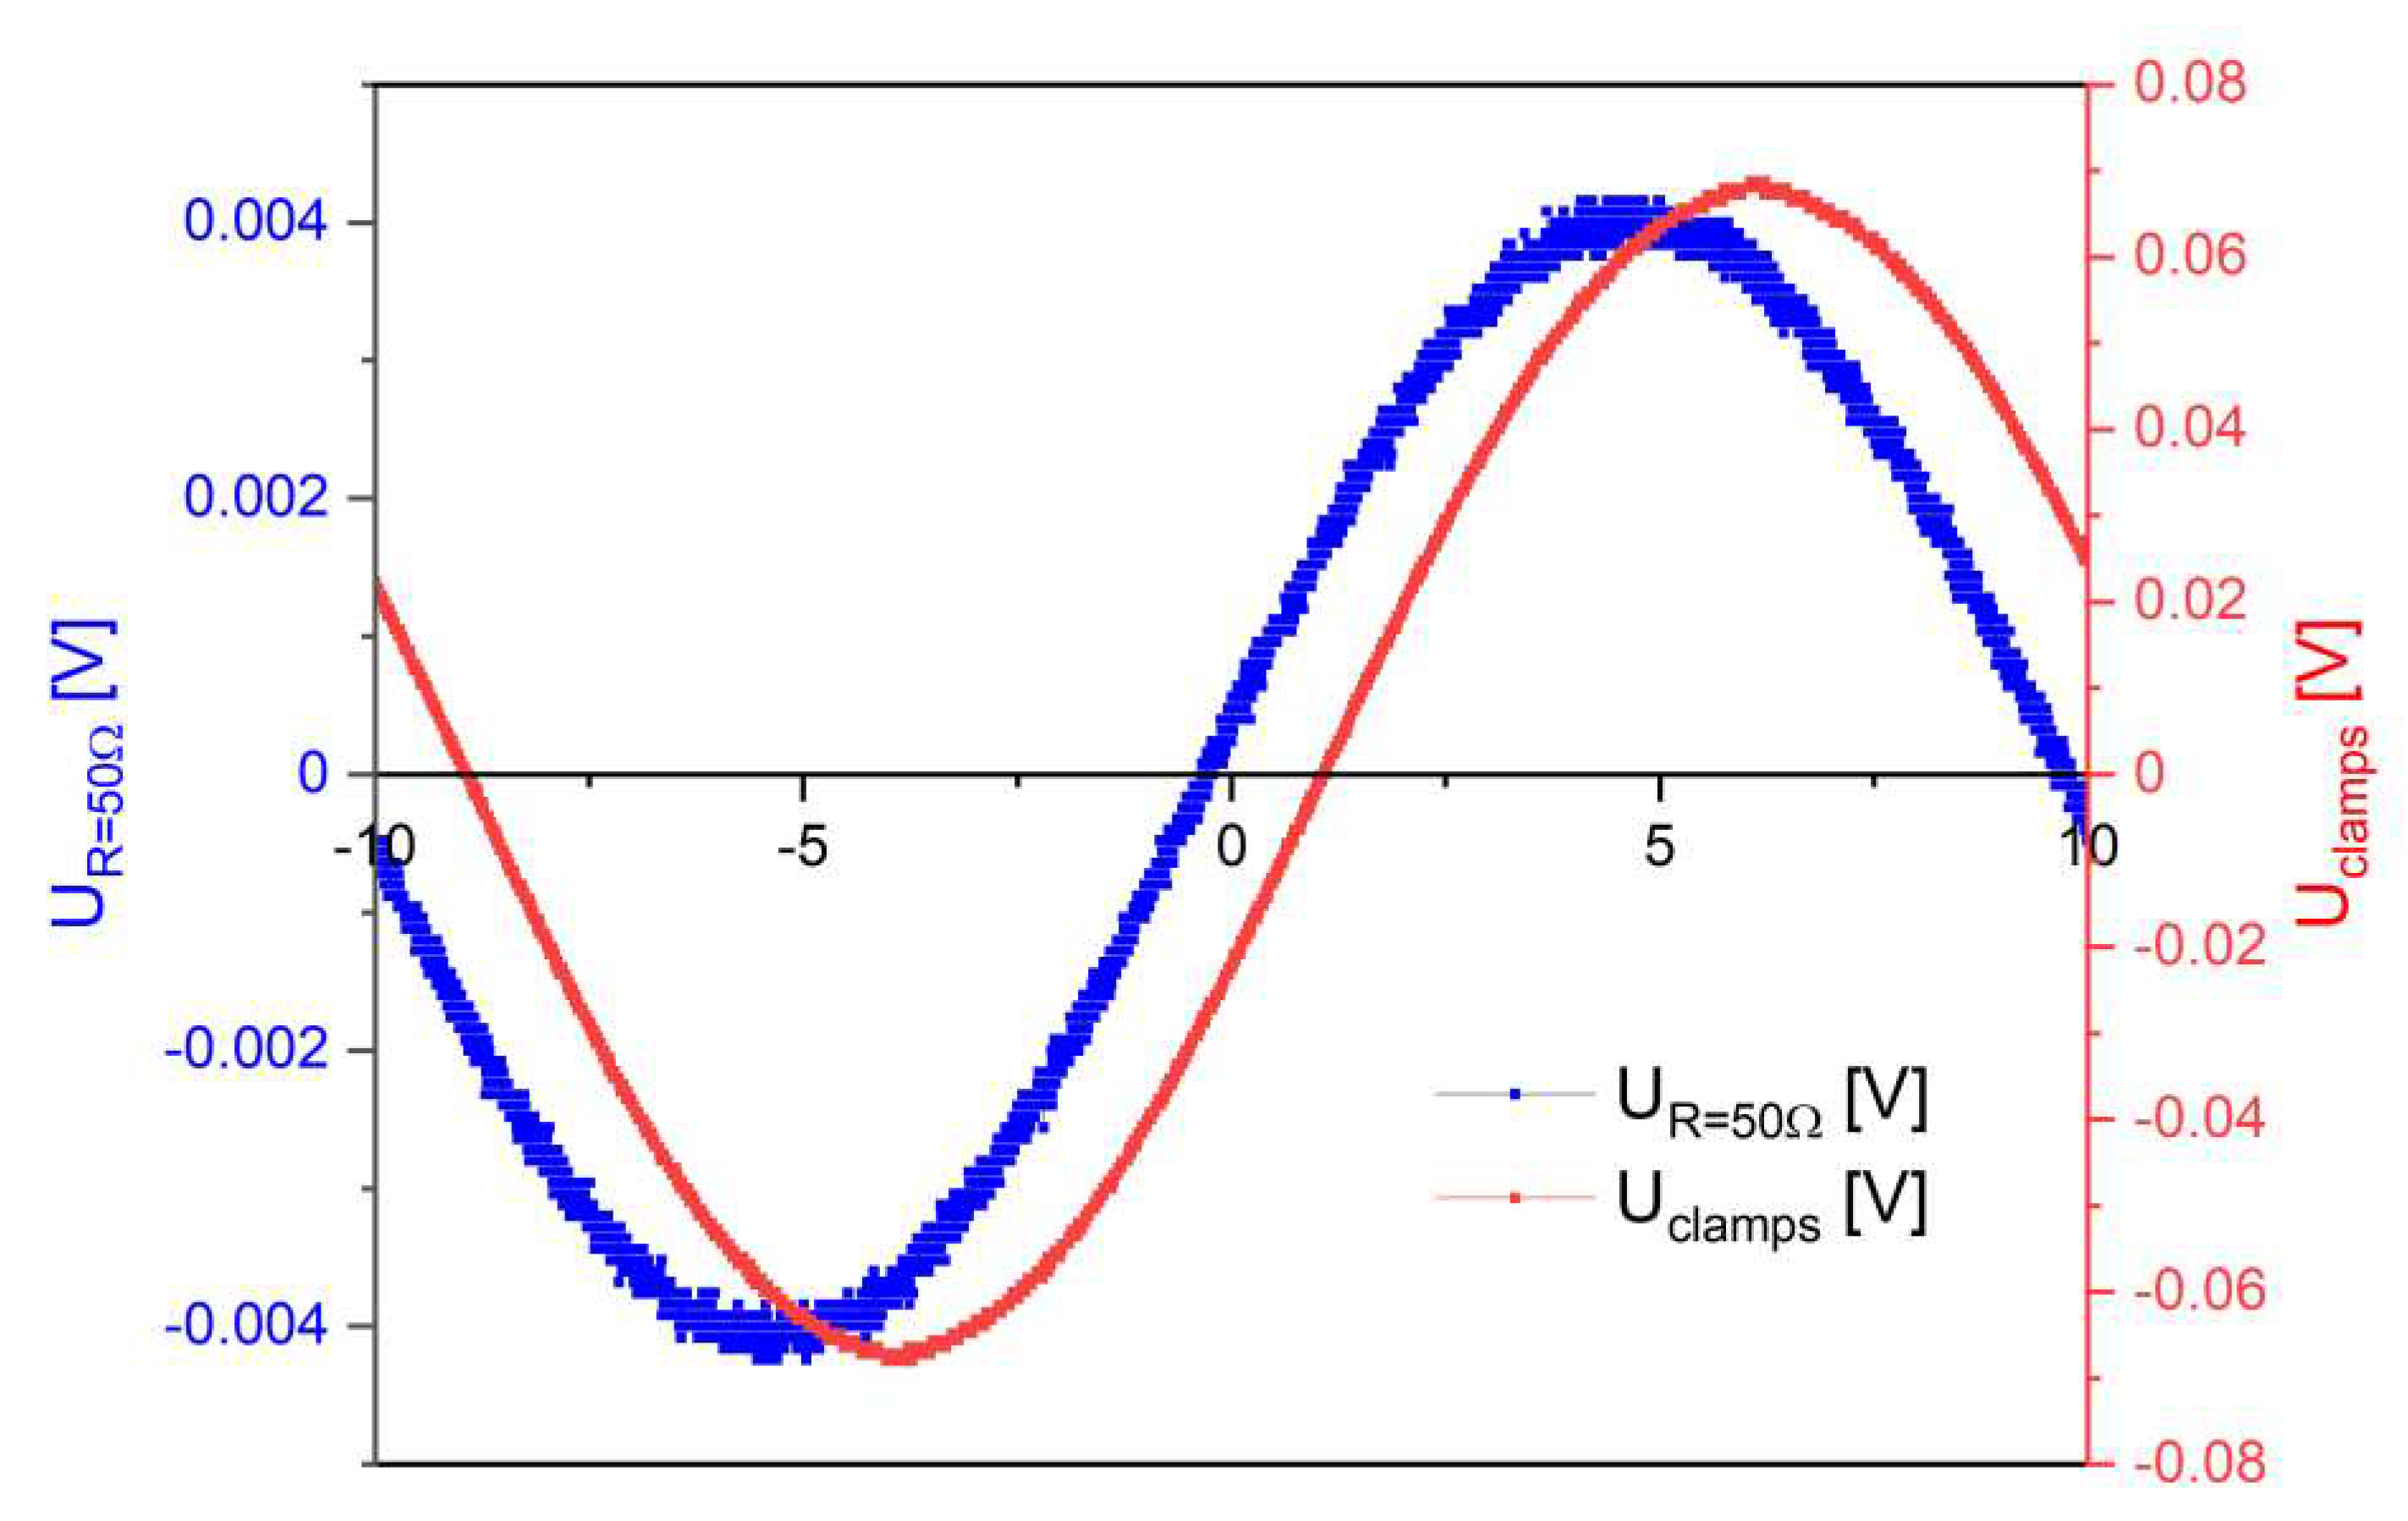
Figure 10.
Voltage waveform from current clamp Uclamp and non-inductive resistor UR = 50 Ω
Figure 10.
Voltage waveform from current clamp Uclamp and non-inductive resistor UR = 50 Ω
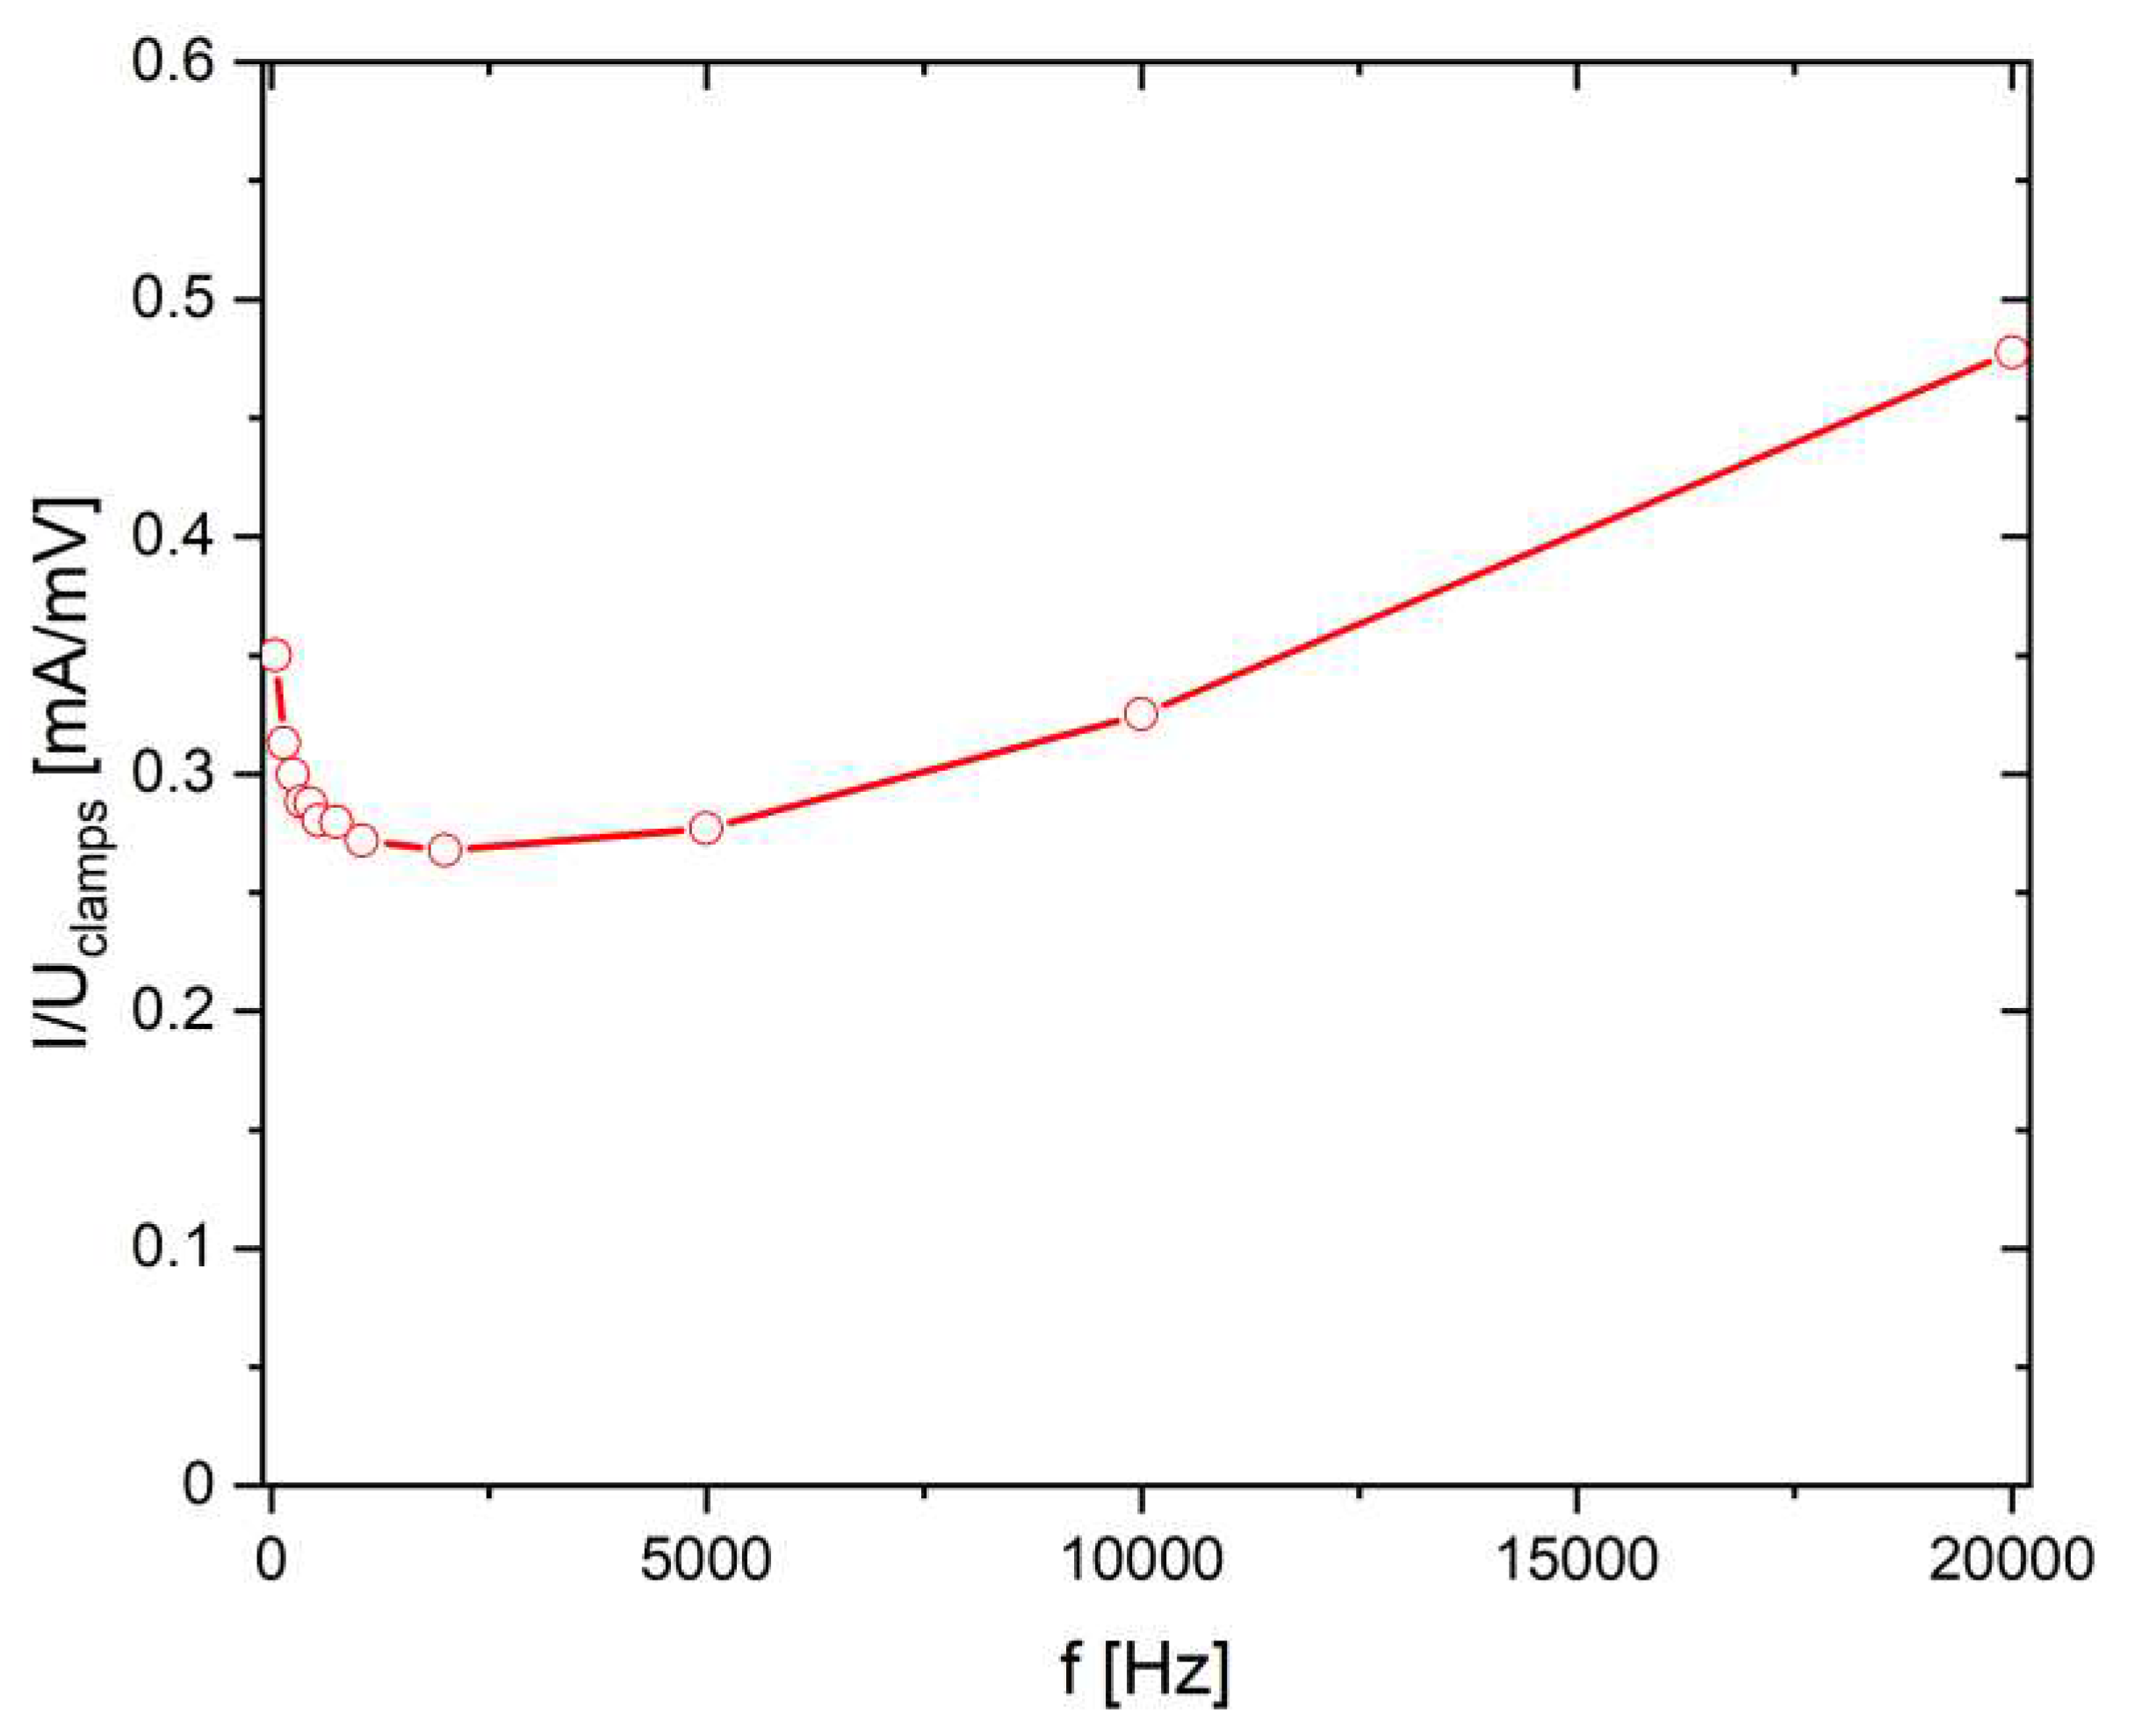
Figure 11.
Amplitude calibration coefficient determined by the quotient of the current in the circuit to the voltage generated at the output of the clamps.
Figure 11.
Amplitude calibration coefficient determined by the quotient of the current in the circuit to the voltage generated at the output of the clamps.
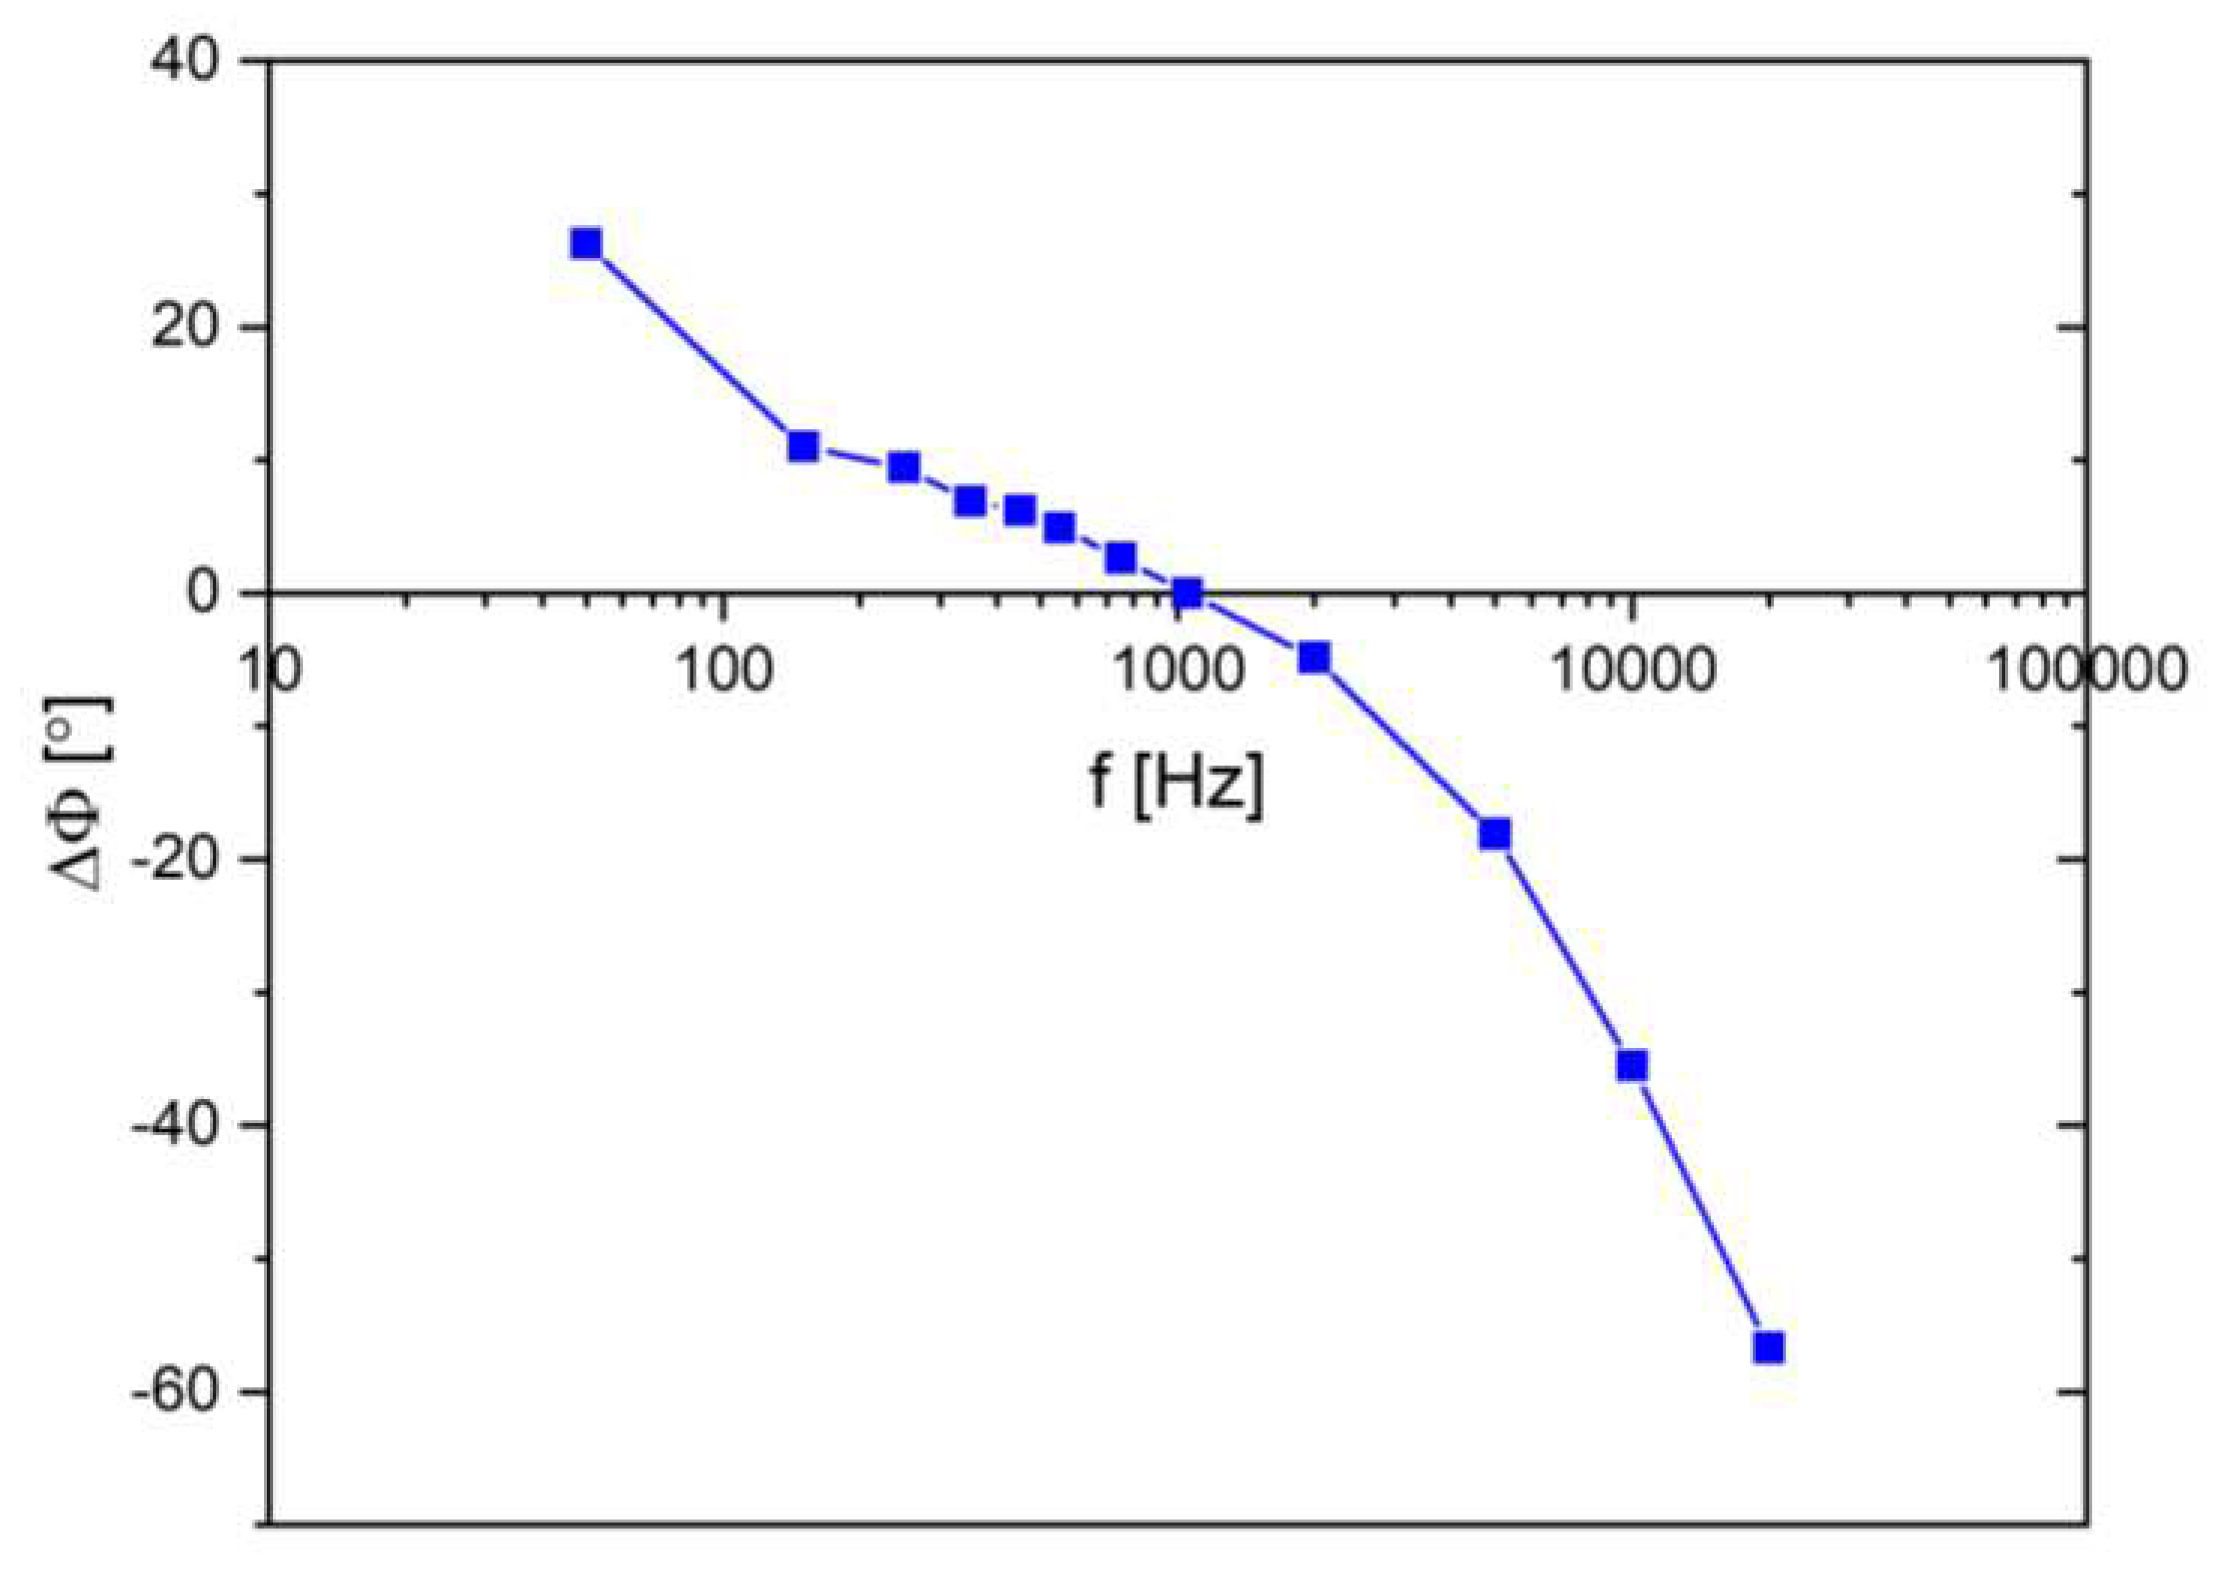
Figure 12.
Phase calibration coefficient determined by the shift of the clamp signal in relation to the real signal.
Figure 12.
Phase calibration coefficient determined by the shift of the clamp signal in relation to the real signal.
Figure 13.
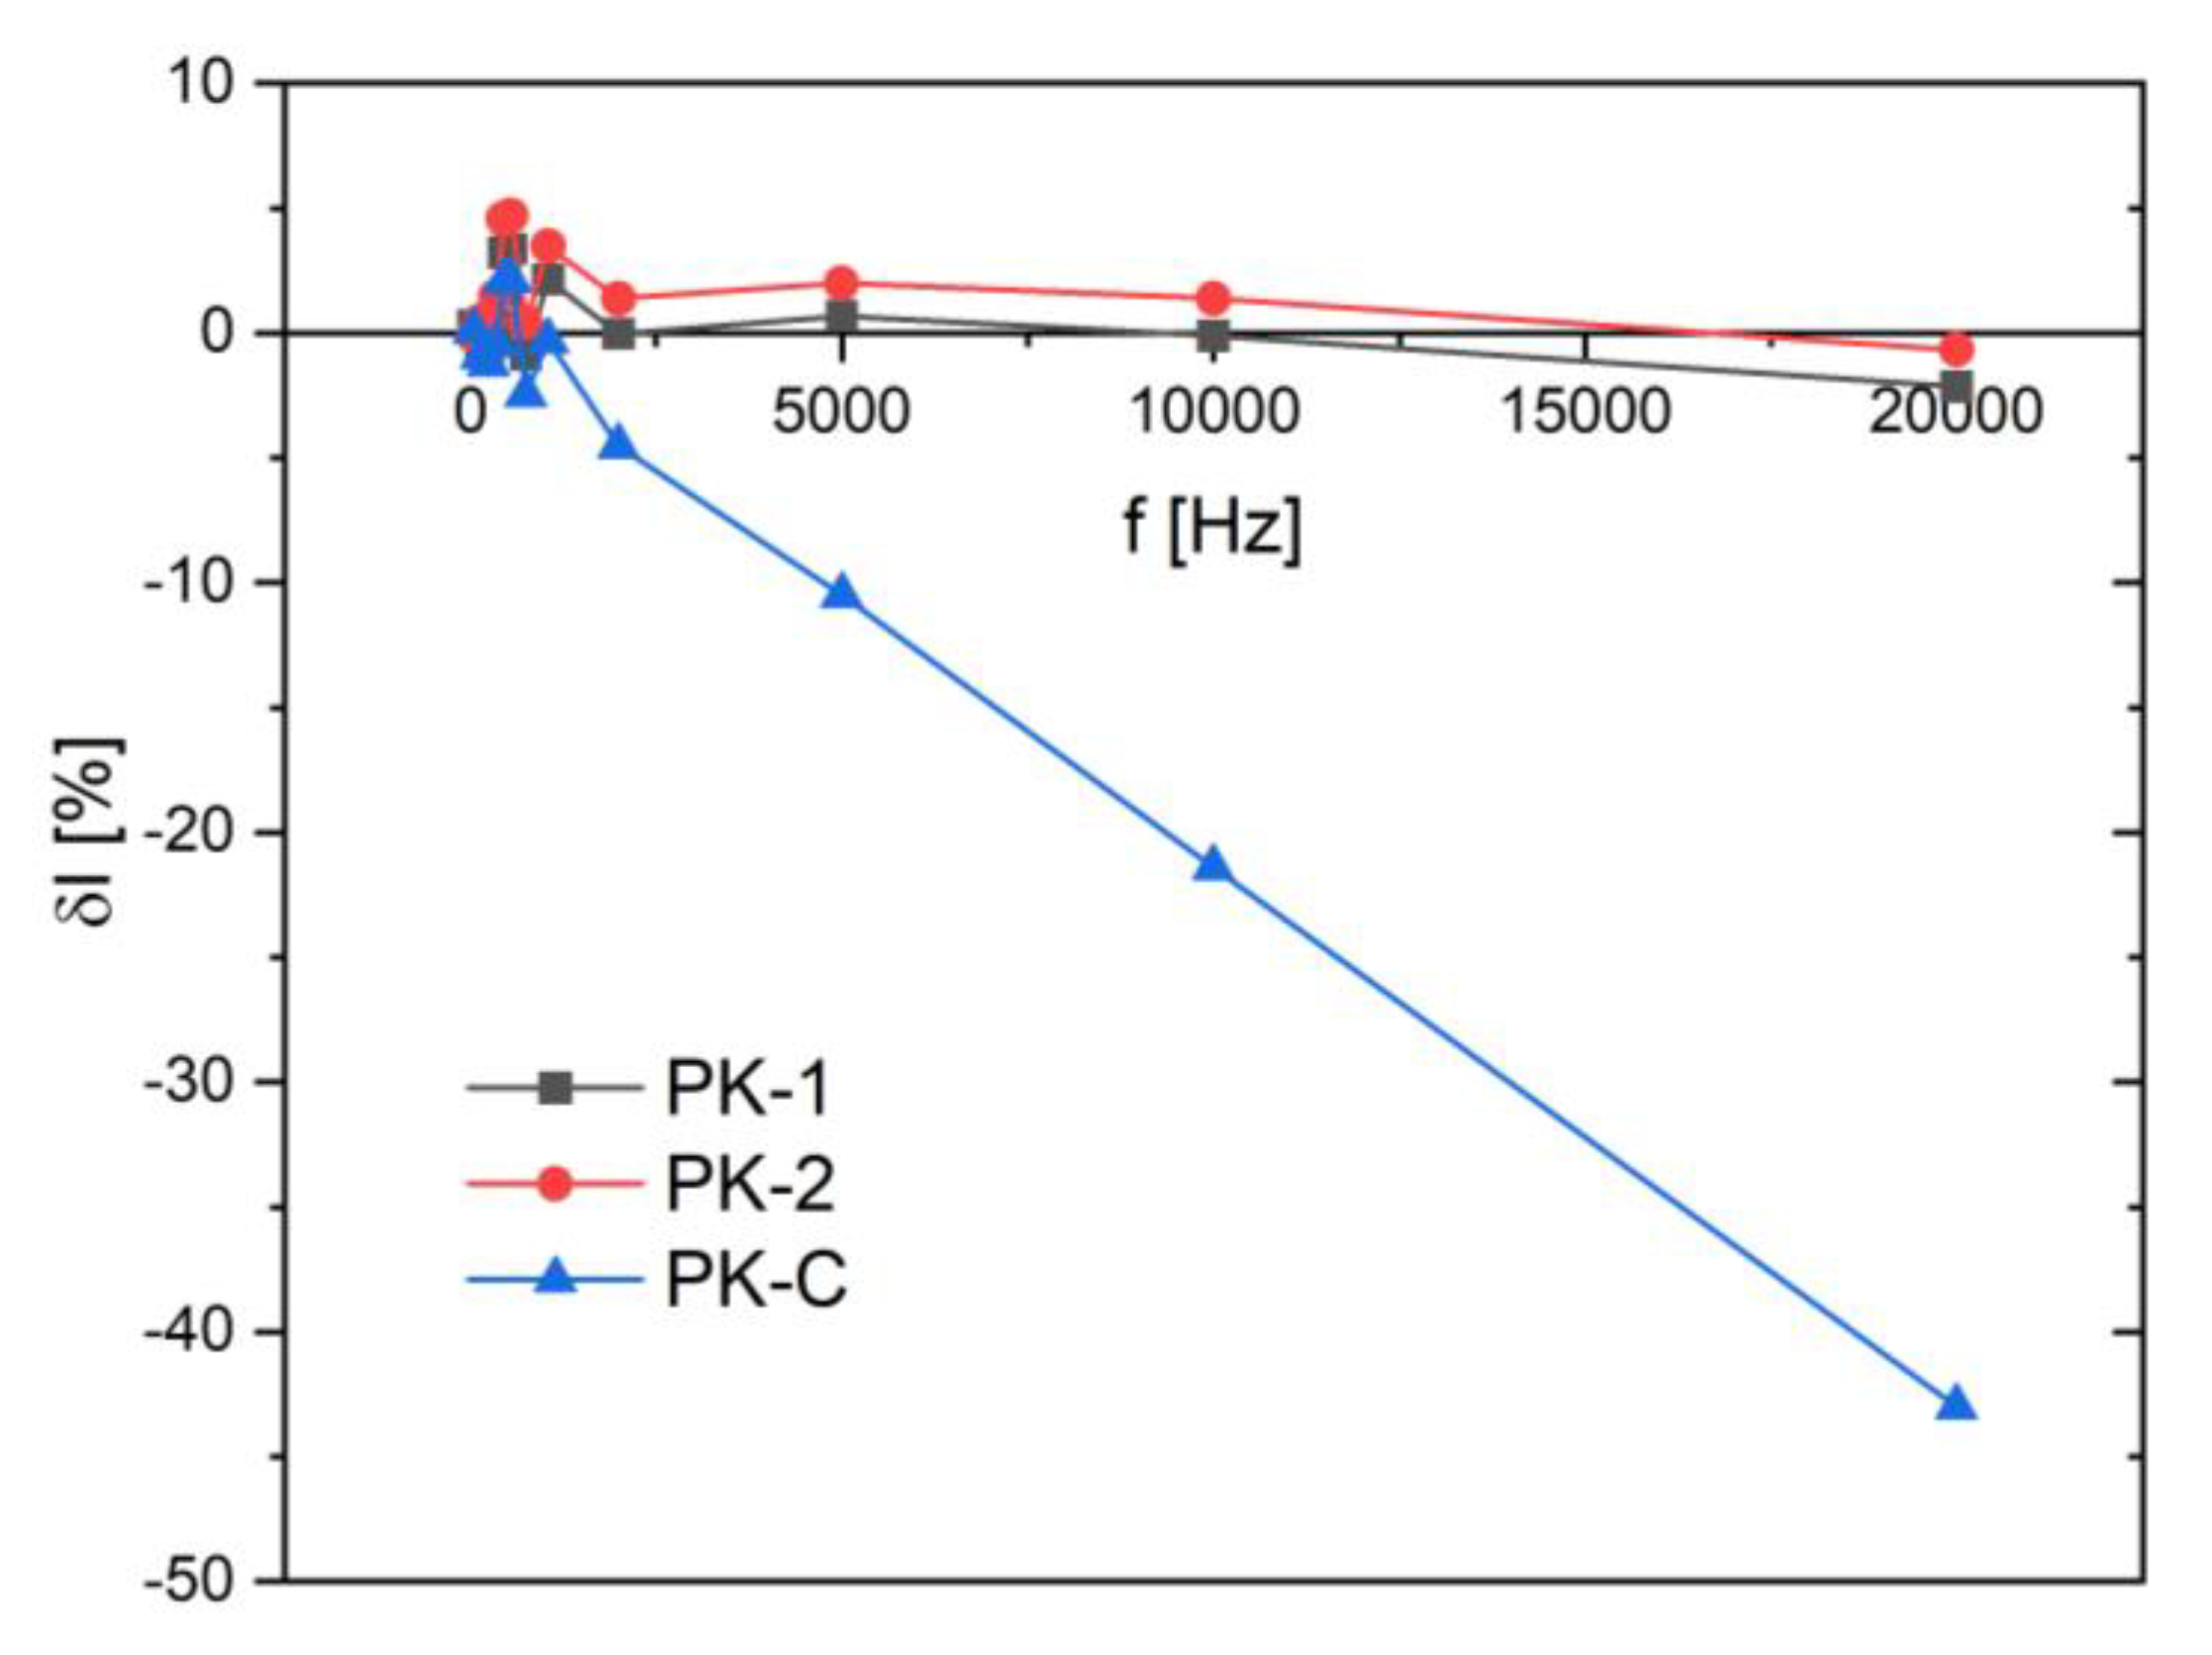
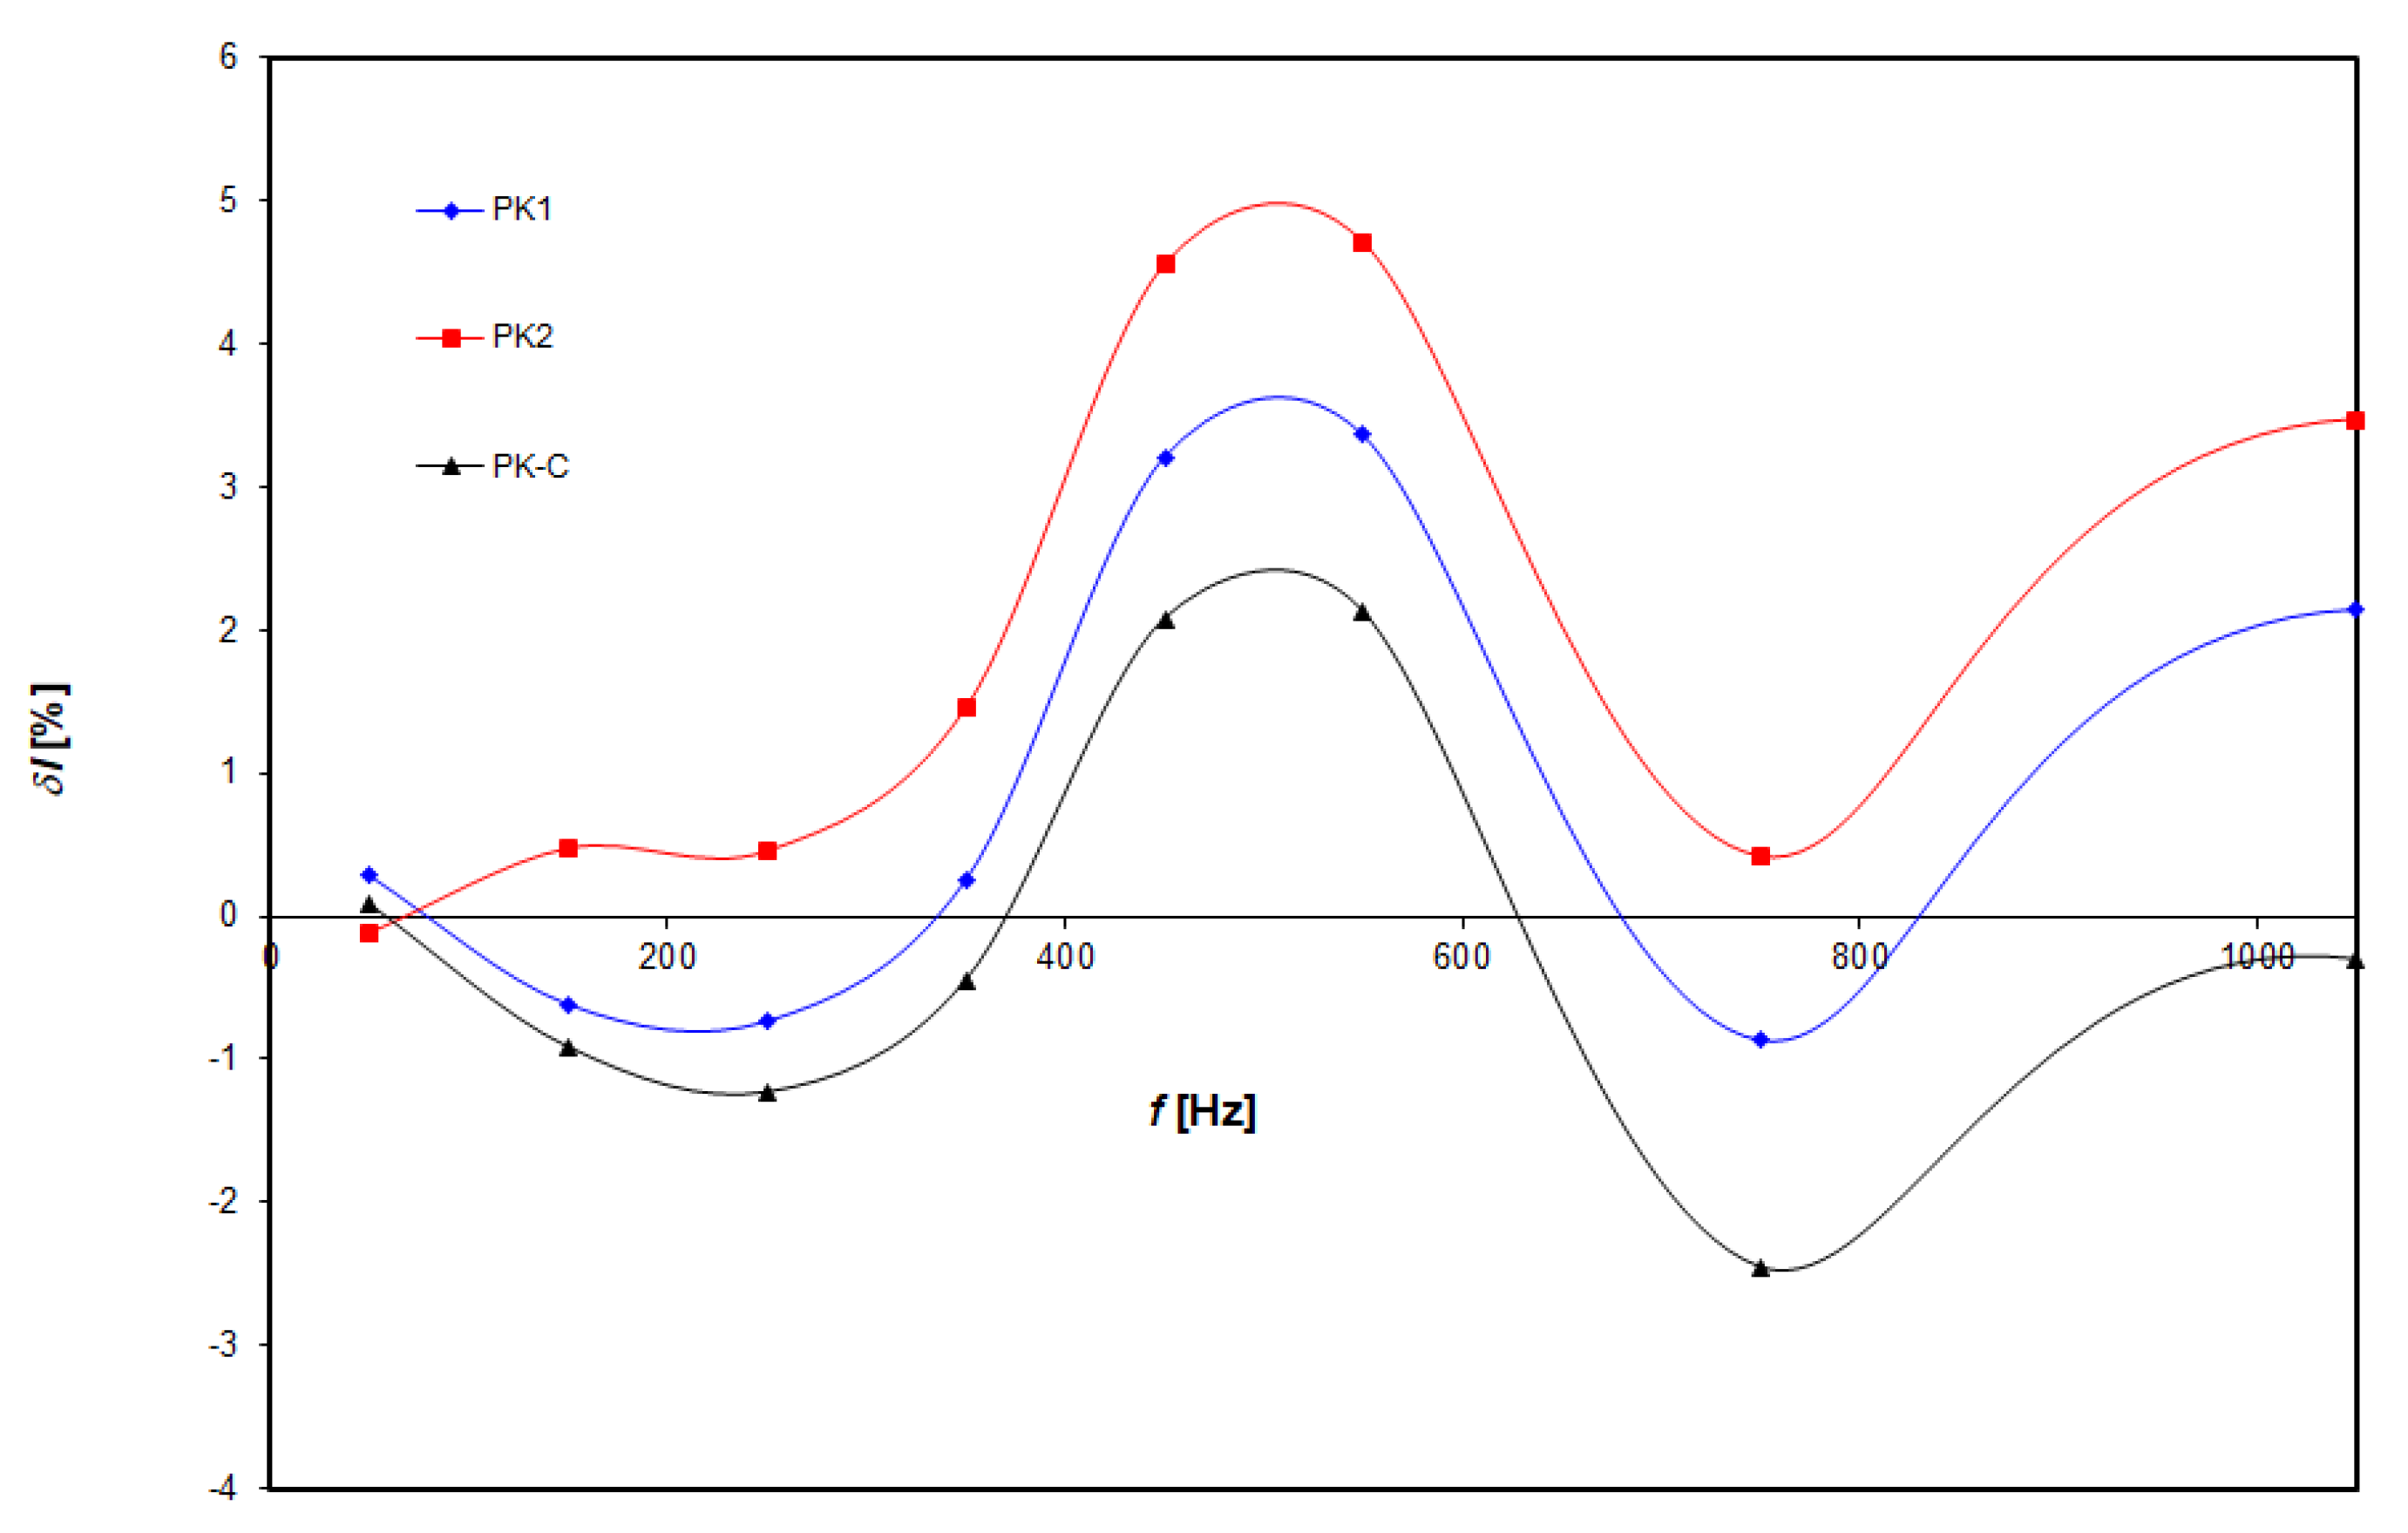
Amplitude error of current measurement for commercial meters in the range up to 1 kHz (PK1, PK2 - commercial instruments with voltage measurement function, PK-C - clamp meter with a sensitivity of 1 μA).
Figure 13.
Amplitude error of current measurement for commercial meters in the range up to 1 kHz (PK1, PK2 - commercial instruments with voltage measurement function, PK-C - clamp meter with a sensitivity of 1 μA).
Figure 14.
Amplitude error of current measurement for commercial meters in the range up to 1 kHz (PK1, PK2 - commercial instruments with voltage measurement function, PK-C - clamp meter with a sensitivity of 1 μA).
Figure 14.
Amplitude error of current measurement for commercial meters in the range up to 1 kHz (PK1, PK2 - commercial instruments with voltage measurement function, PK-C - clamp meter with a sensitivity of 1 μA).
Figure 15.
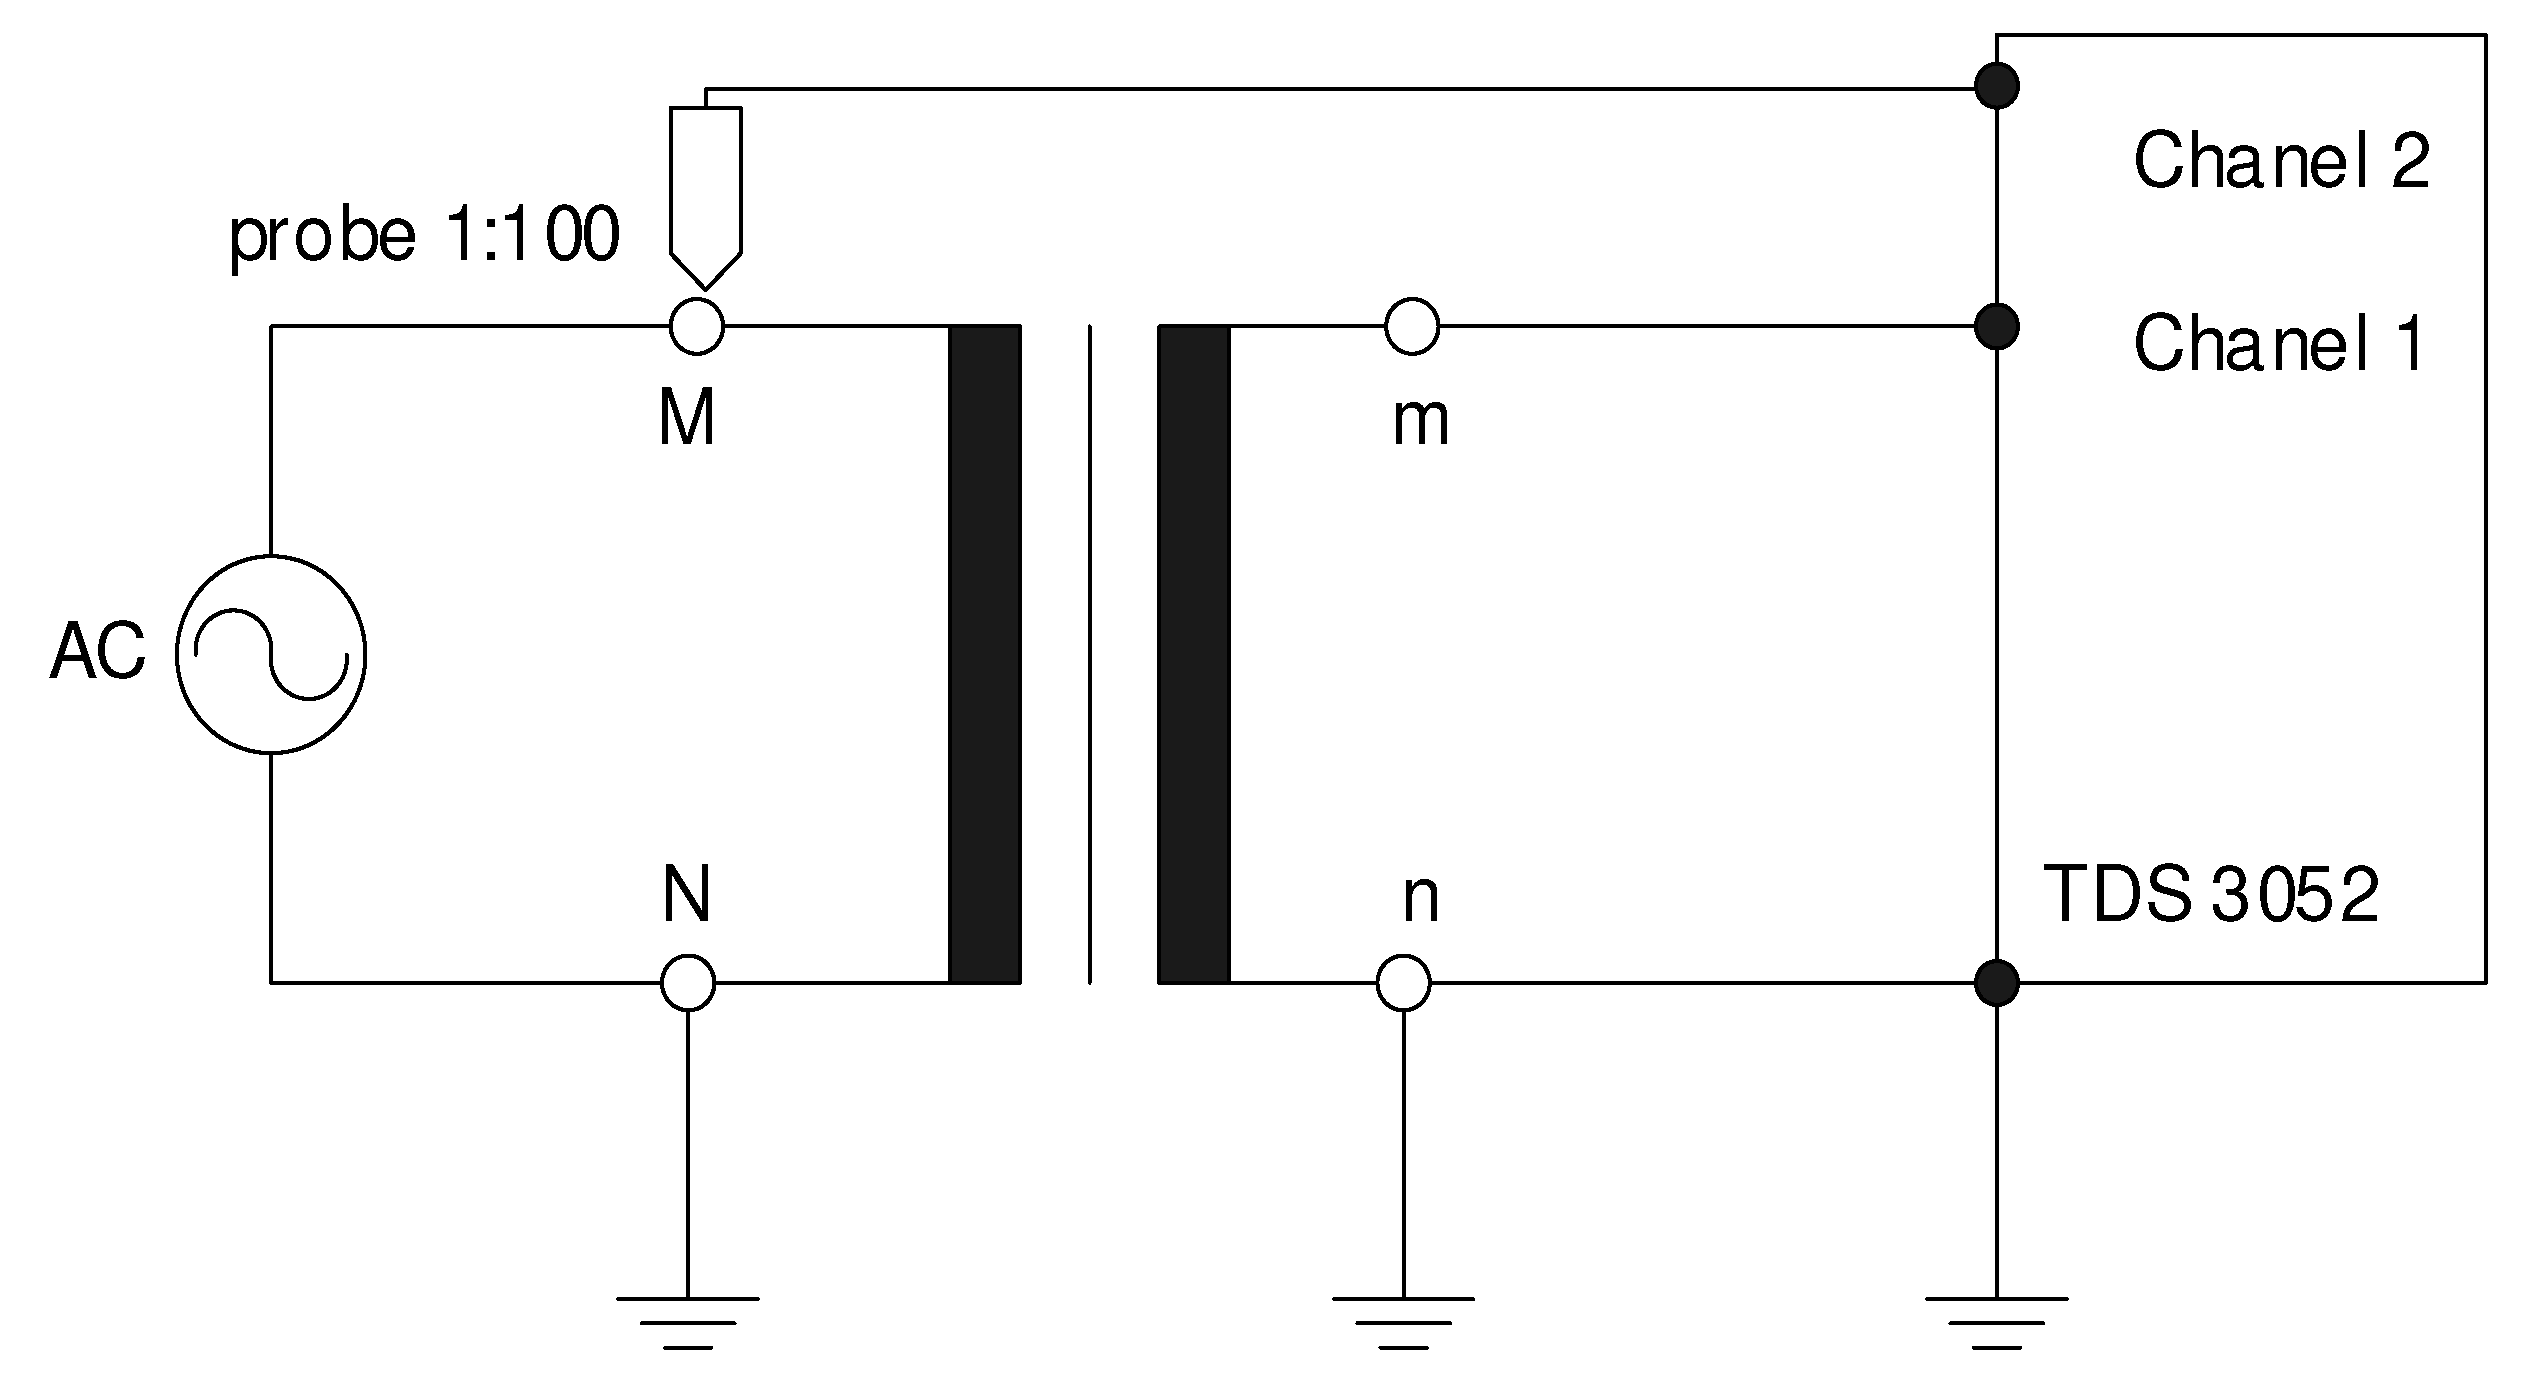
Measuring system for analysis of voltage transformer frequency characteristics.
Figure 15.
Measuring system for analysis of voltage transformer frequency characteristics.
Figure 16.
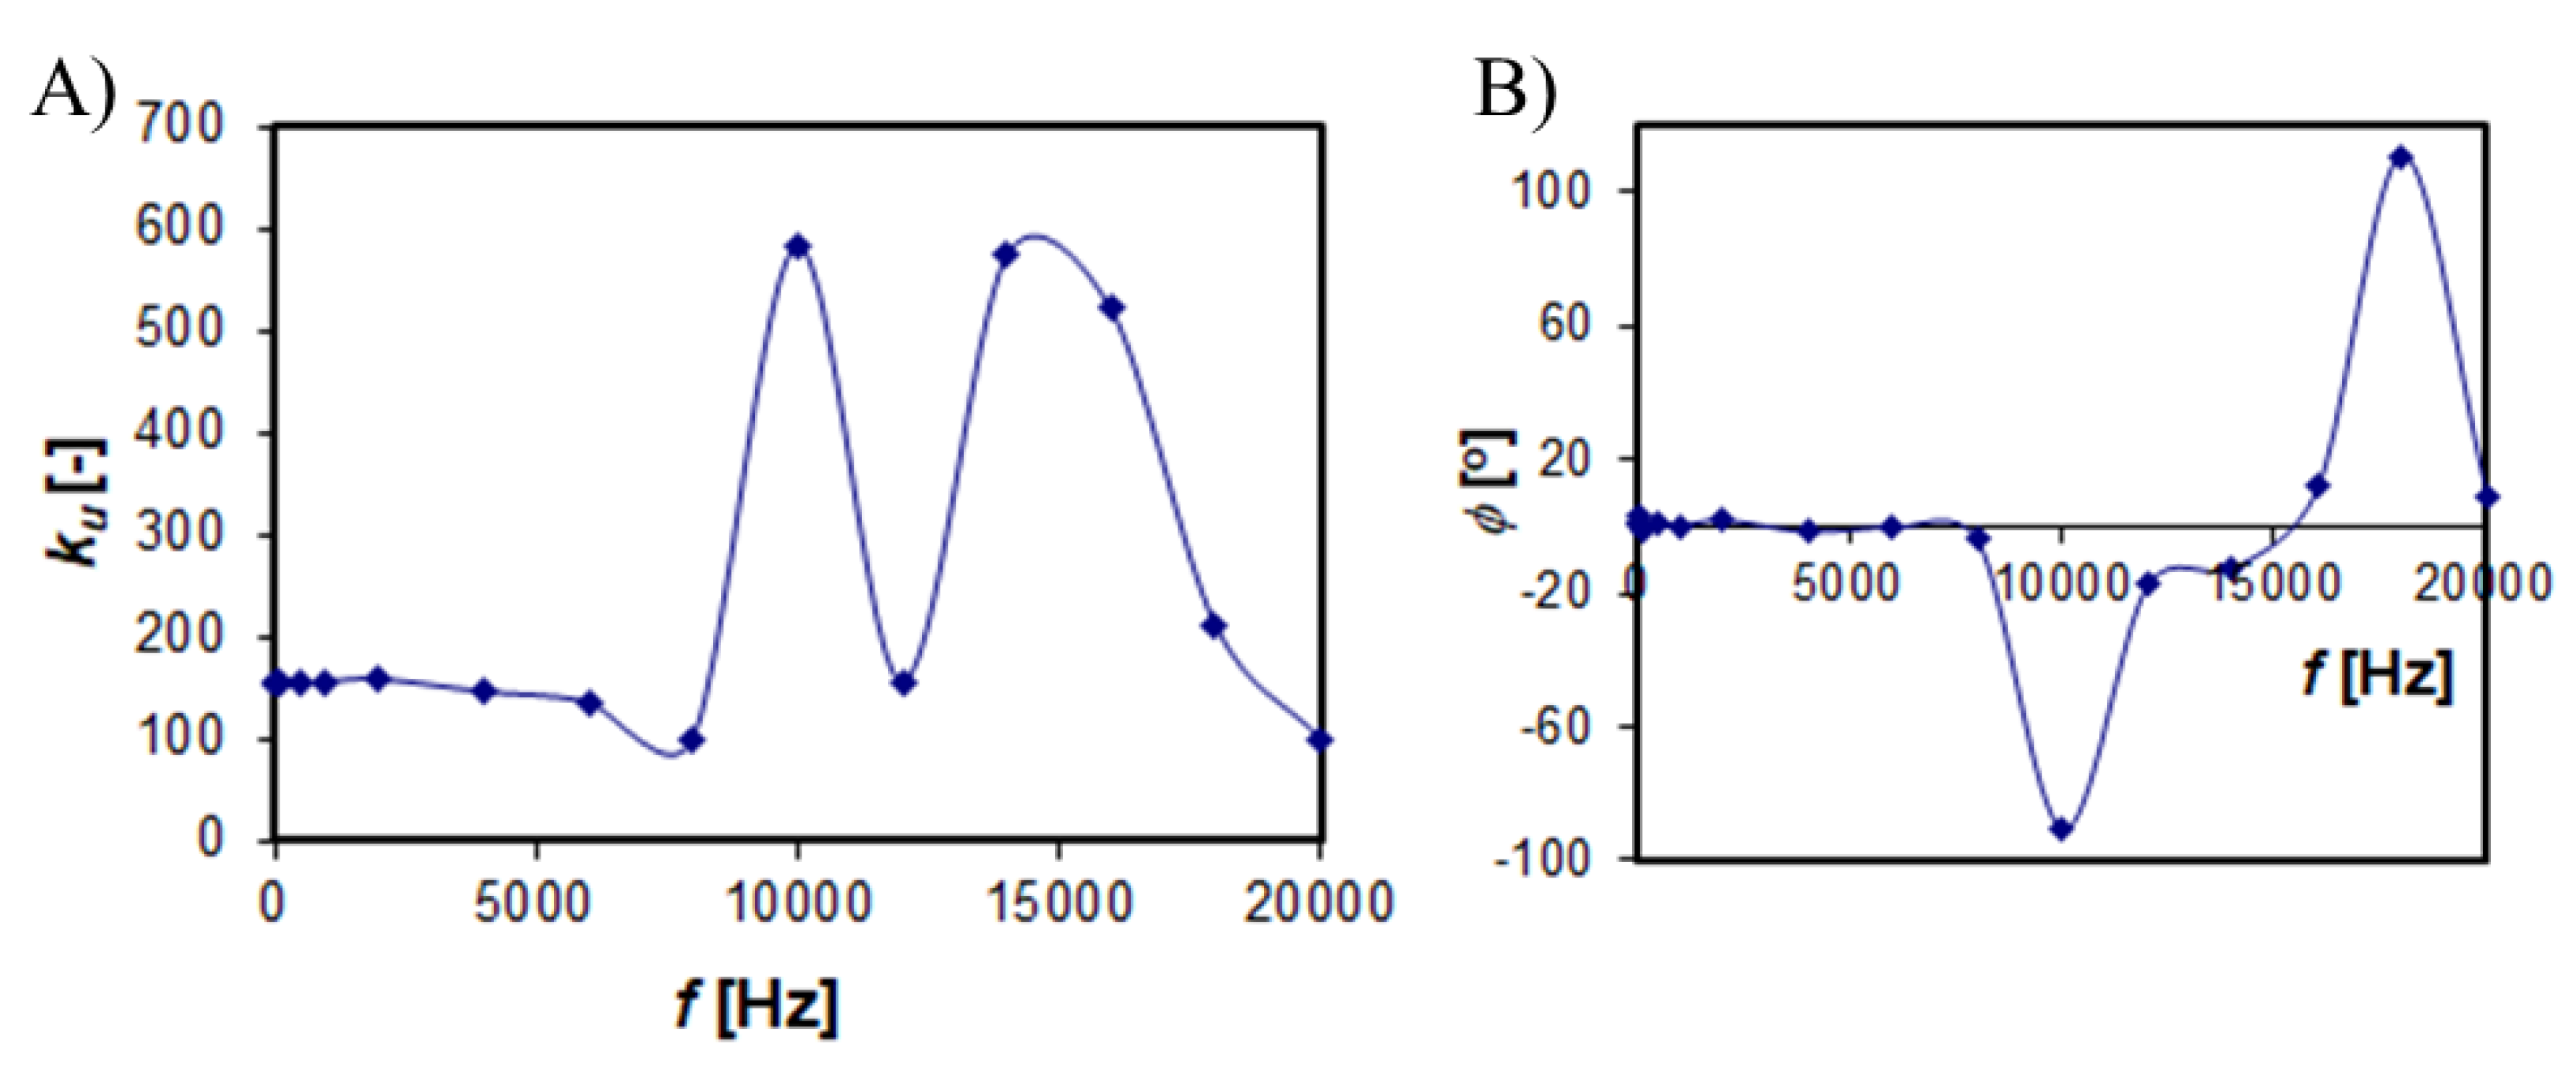
Frequency characteristics of the UMZ20 type transformer, a) voltage ratio, b) phase shift between the voltages of the primary and secondary windings.
Figure 16.
Frequency characteristics of the UMZ20 type transformer, a) voltage ratio, b) phase shift between the voltages of the primary and secondary windings.
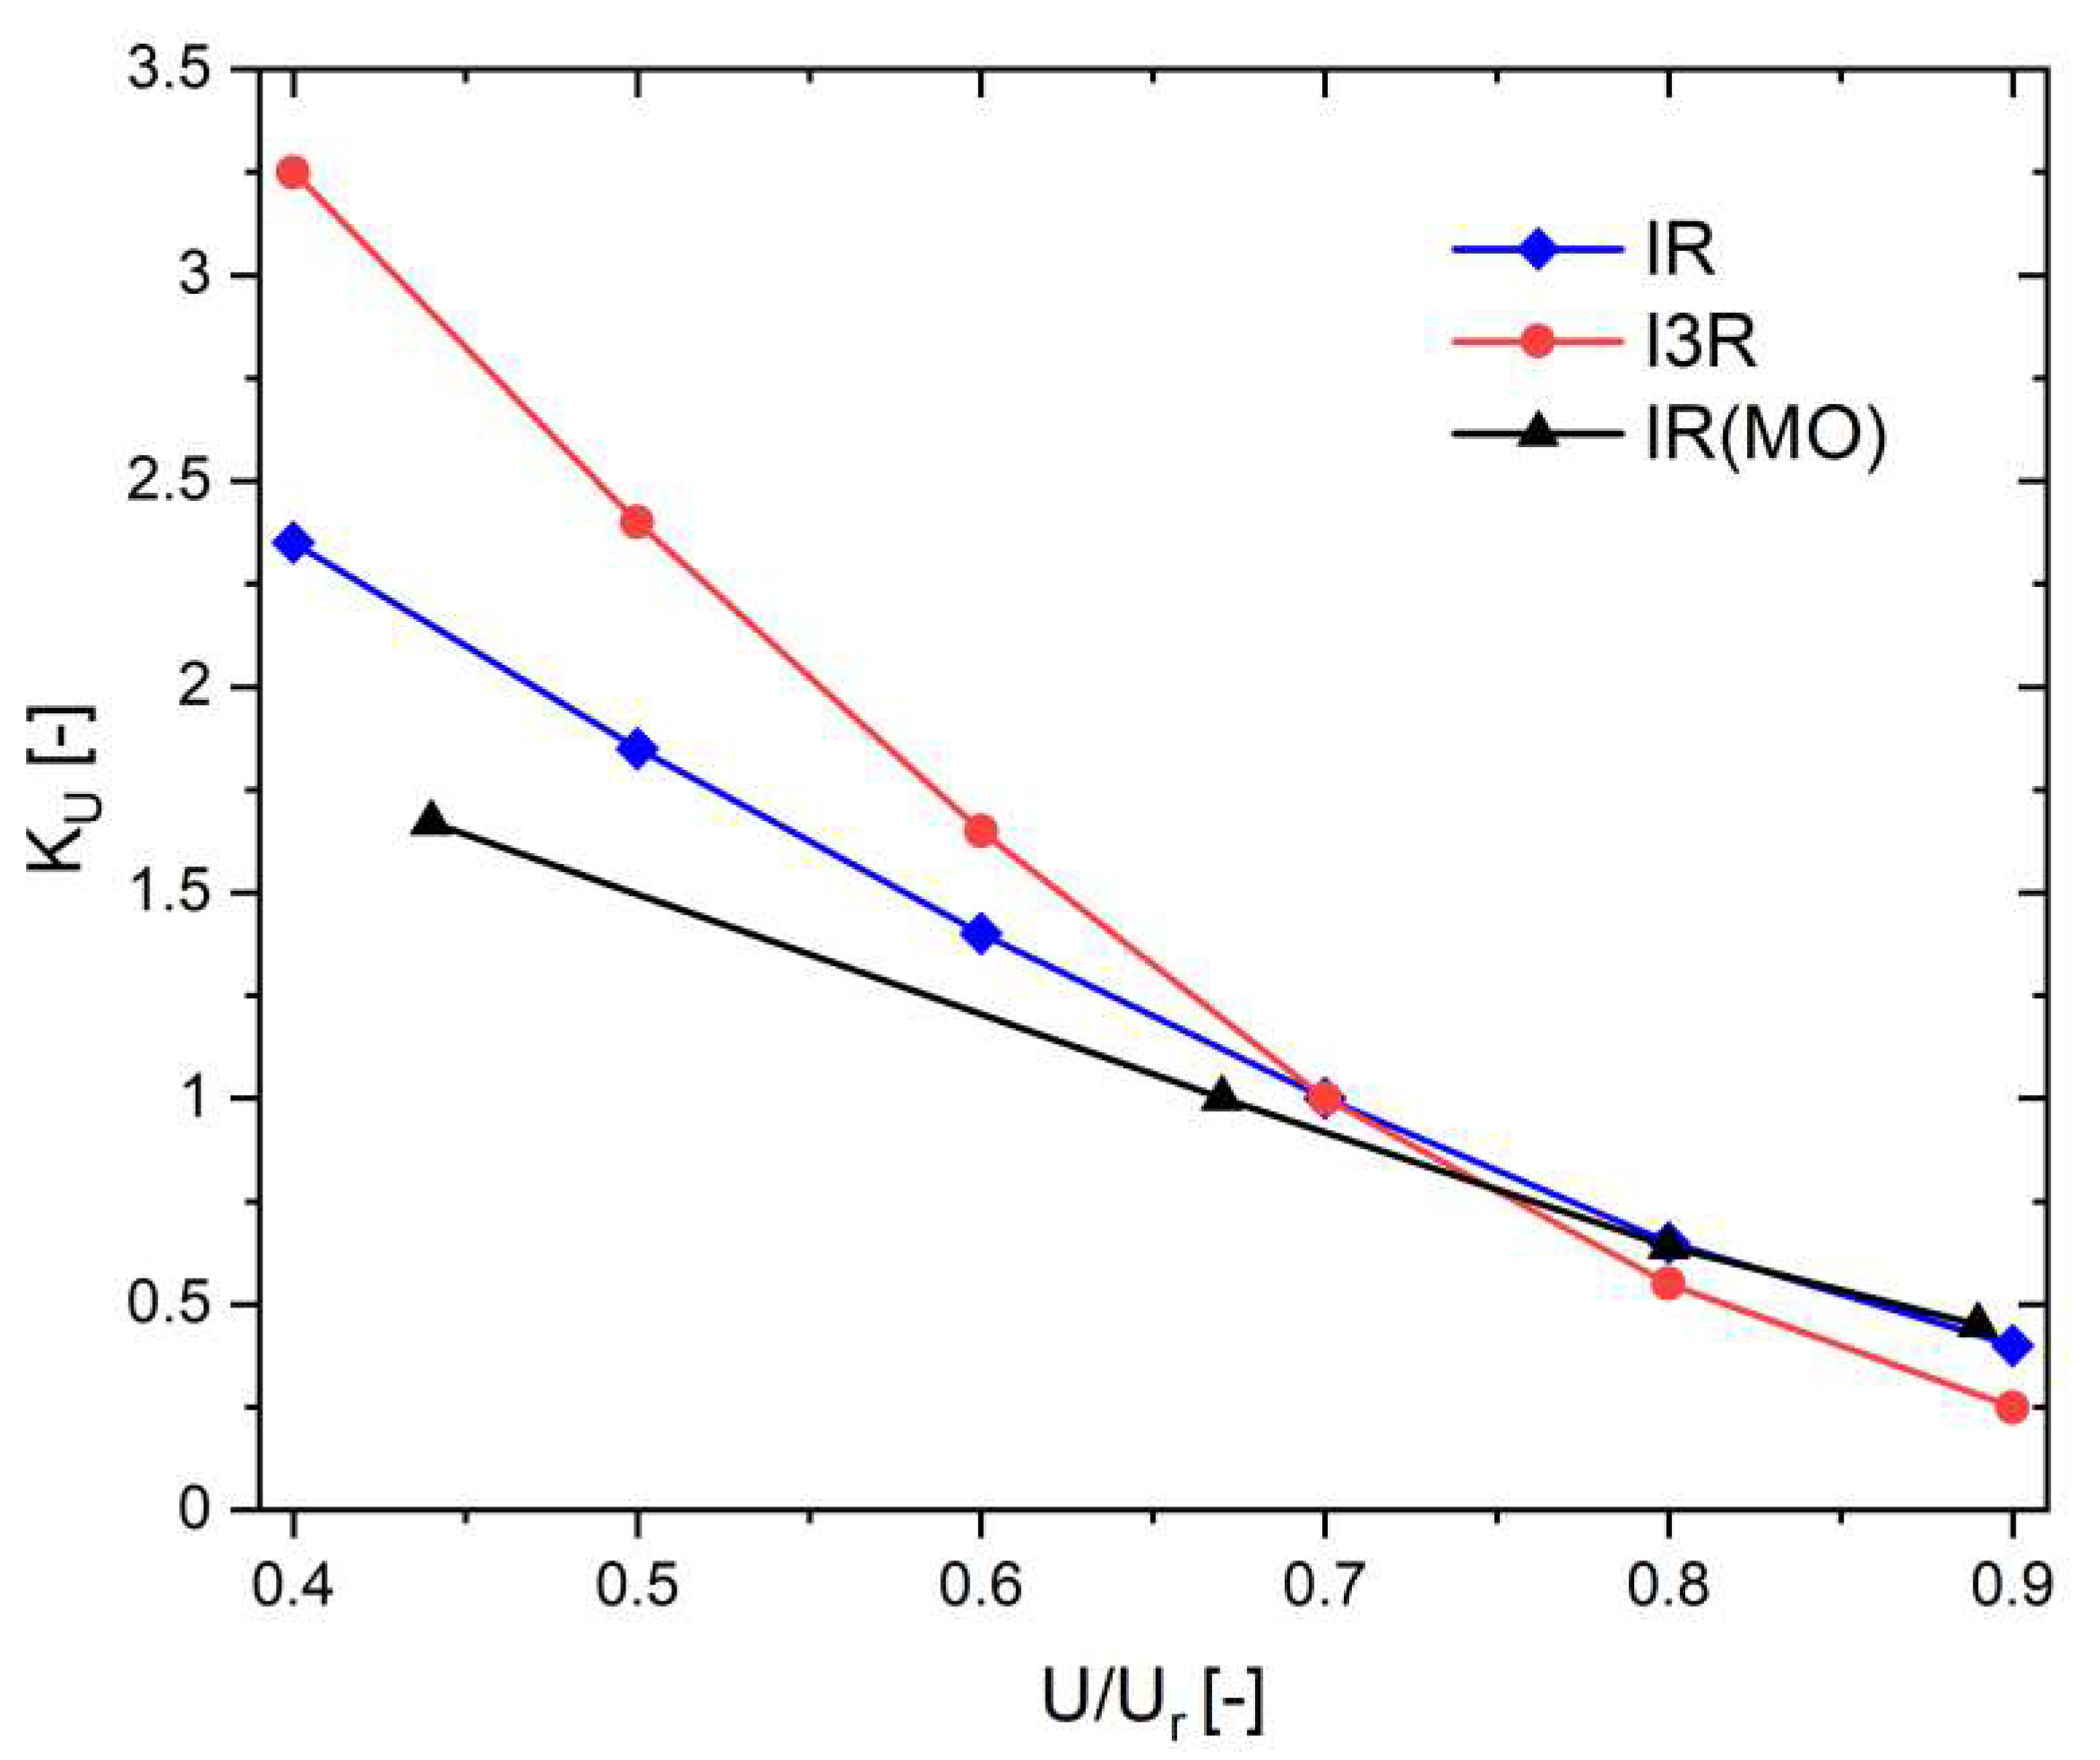
Figure 17.
Correction factors [
38] taking into account the influence of voltage, IR(MO) means correction factors k
U determined in own measurements.
Figure 17.
Correction factors [
38] taking into account the influence of voltage, IR(MO) means correction factors k
U determined in own measurements.
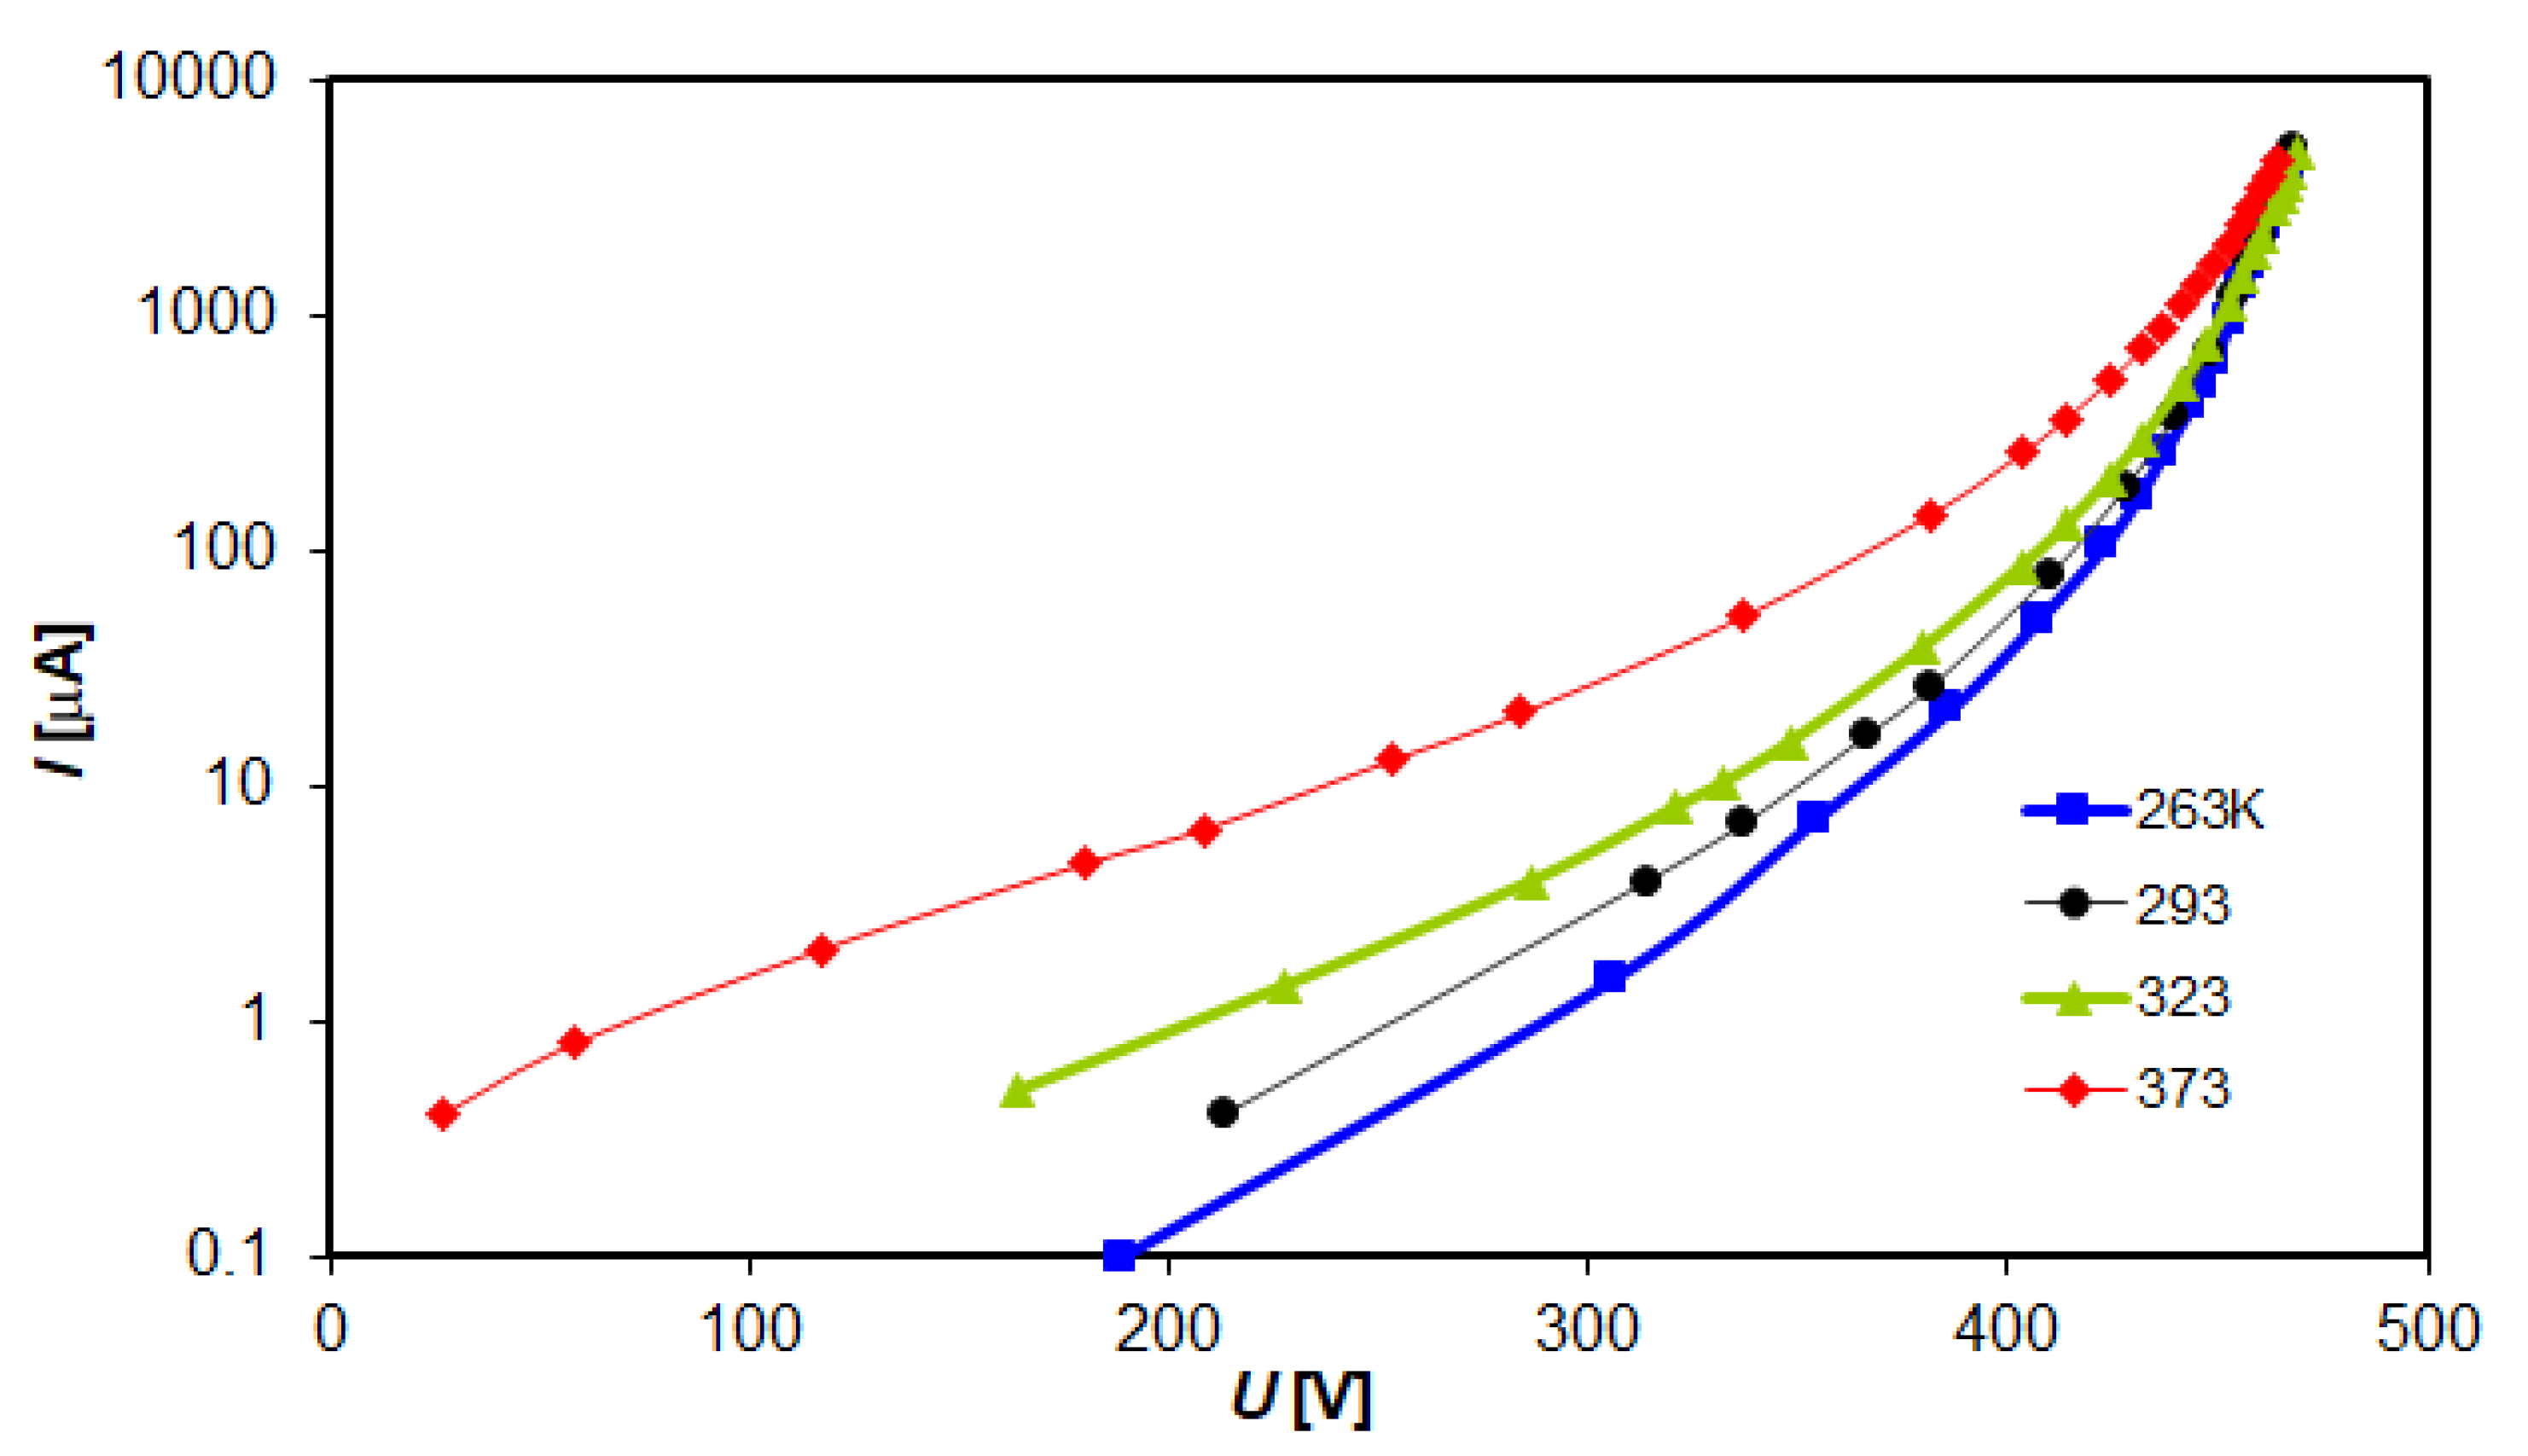
Figure 18.
I(U) characteristics for direct voltage of an exemplary surge arrester from manufacturer A.
Figure 18.
I(U) characteristics for direct voltage of an exemplary surge arrester from manufacturer A.
Figure 19.
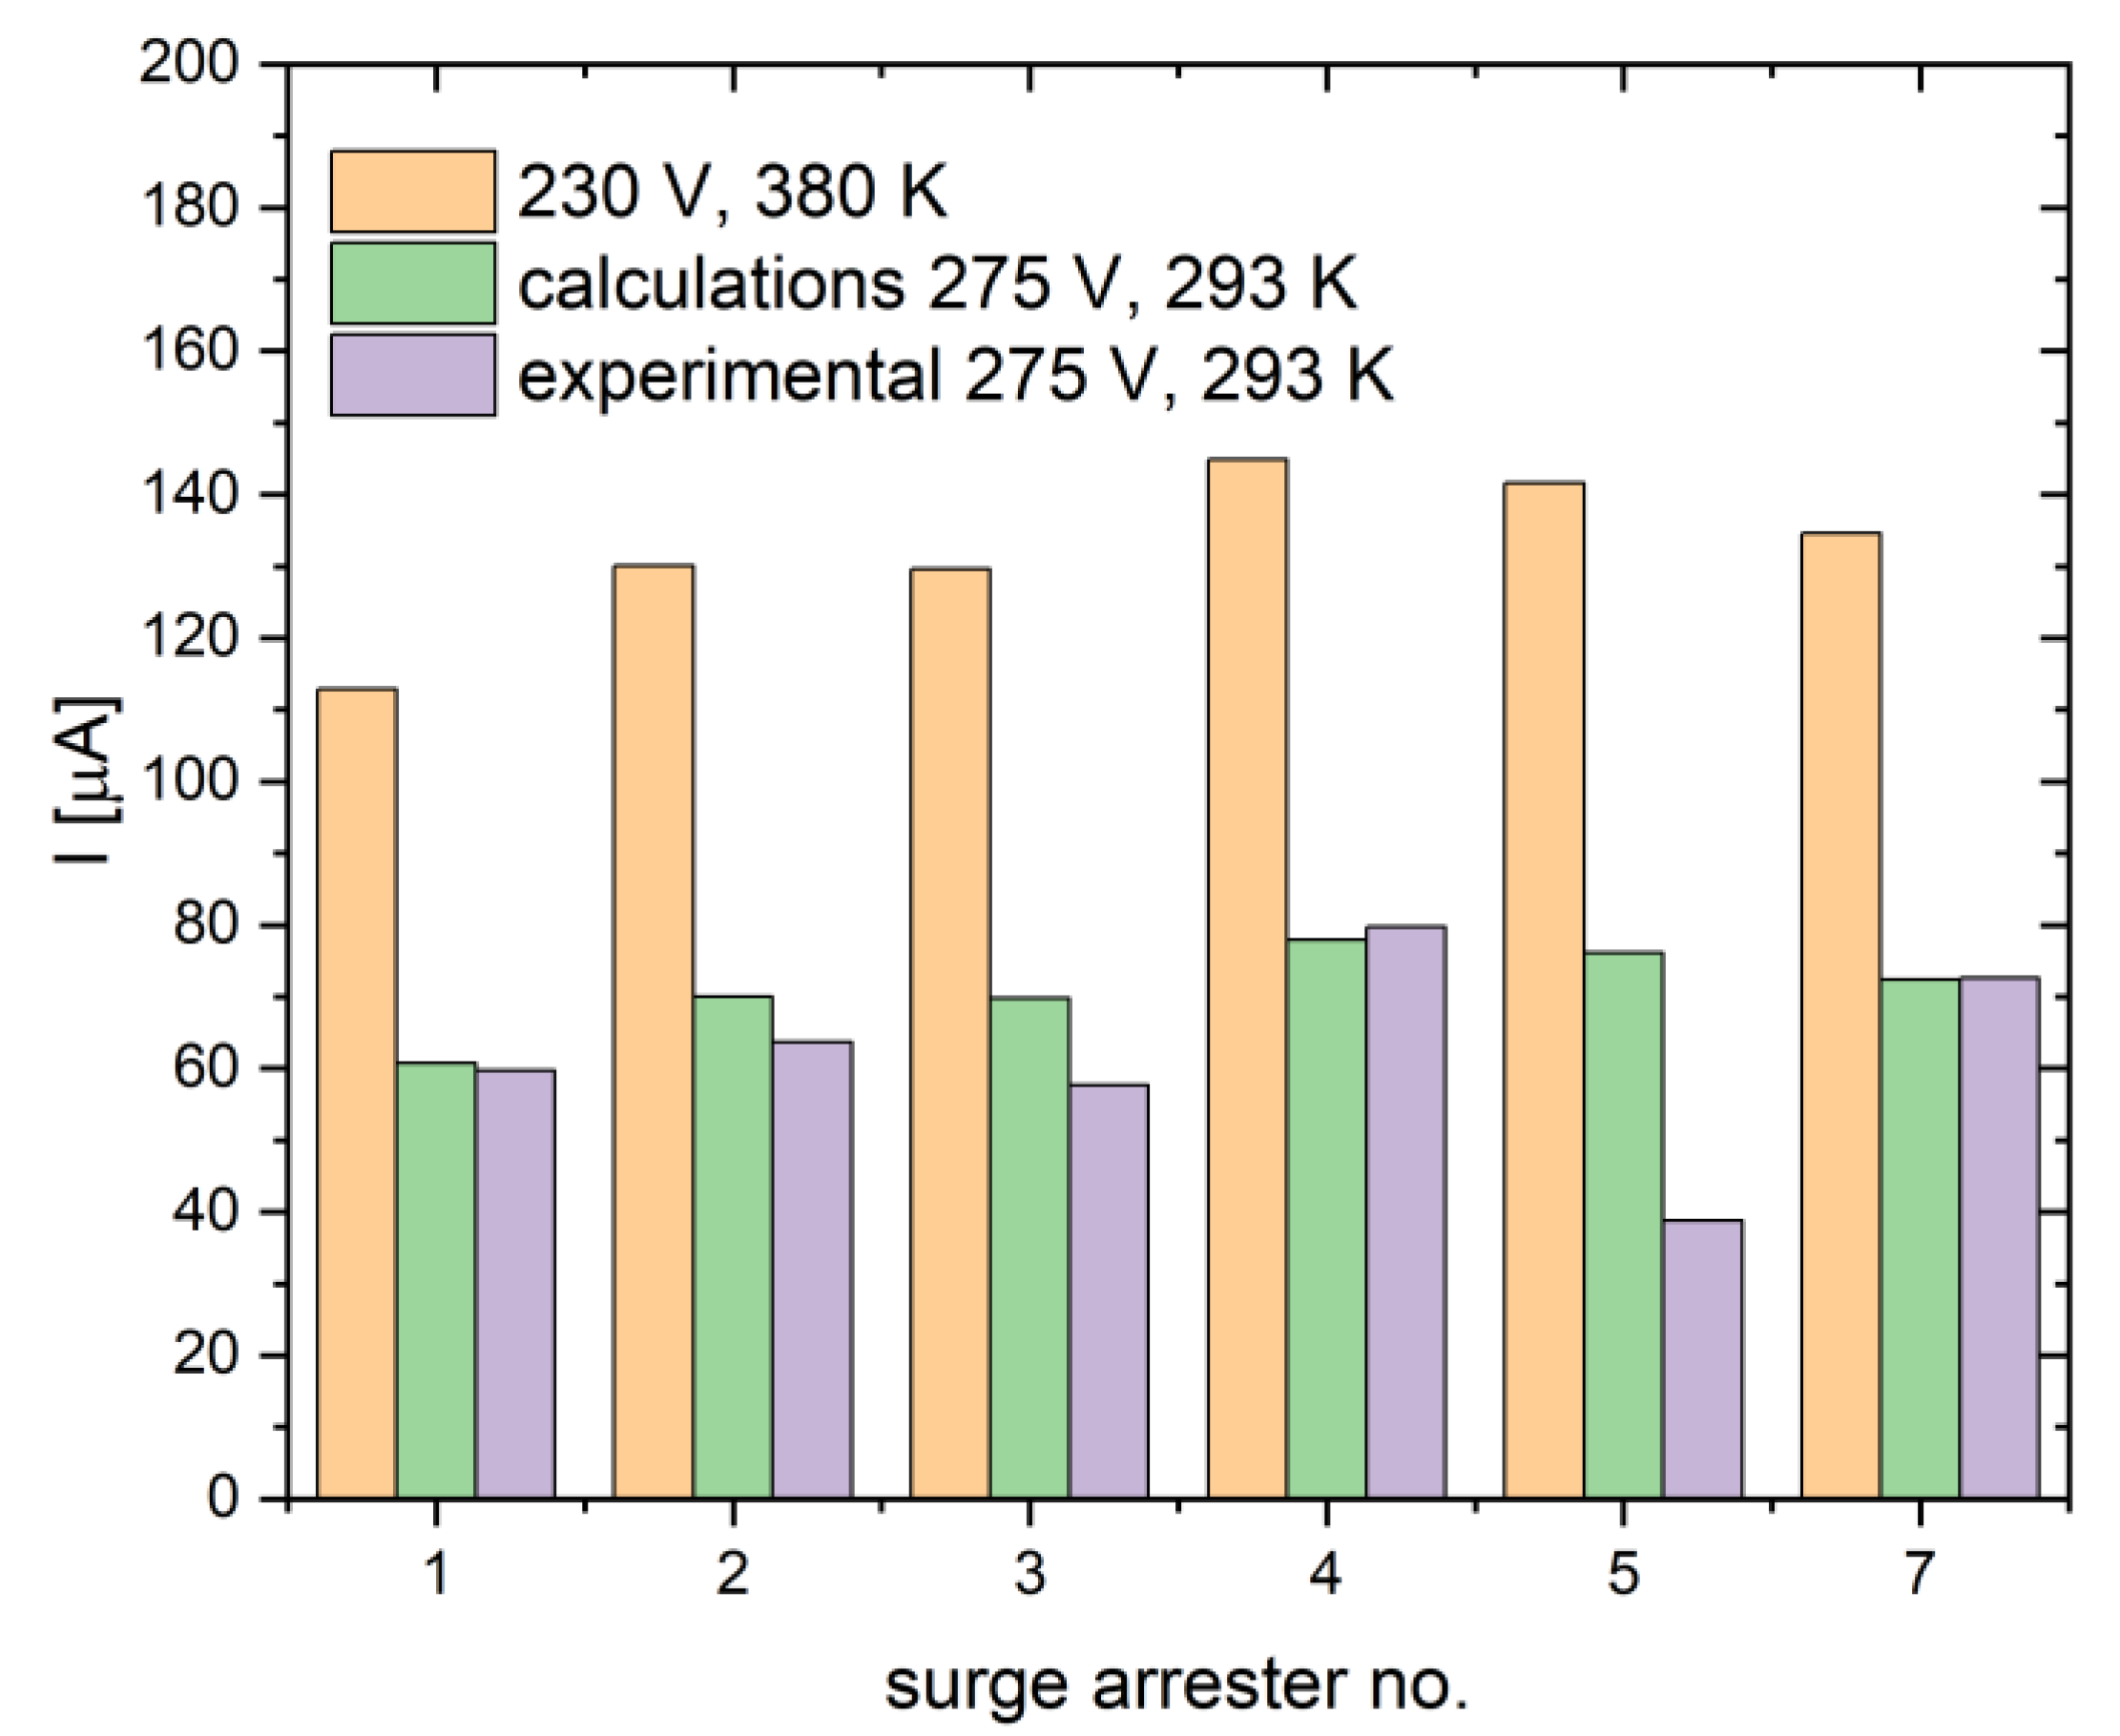
Temperature correction factors calculated from measurements at DC voltage to convert leakage current measurements to reference conditions for Tw = 293 K.
Figure 19.
Temperature correction factors calculated from measurements at DC voltage to convert leakage current measurements to reference conditions for Tw = 293 K.
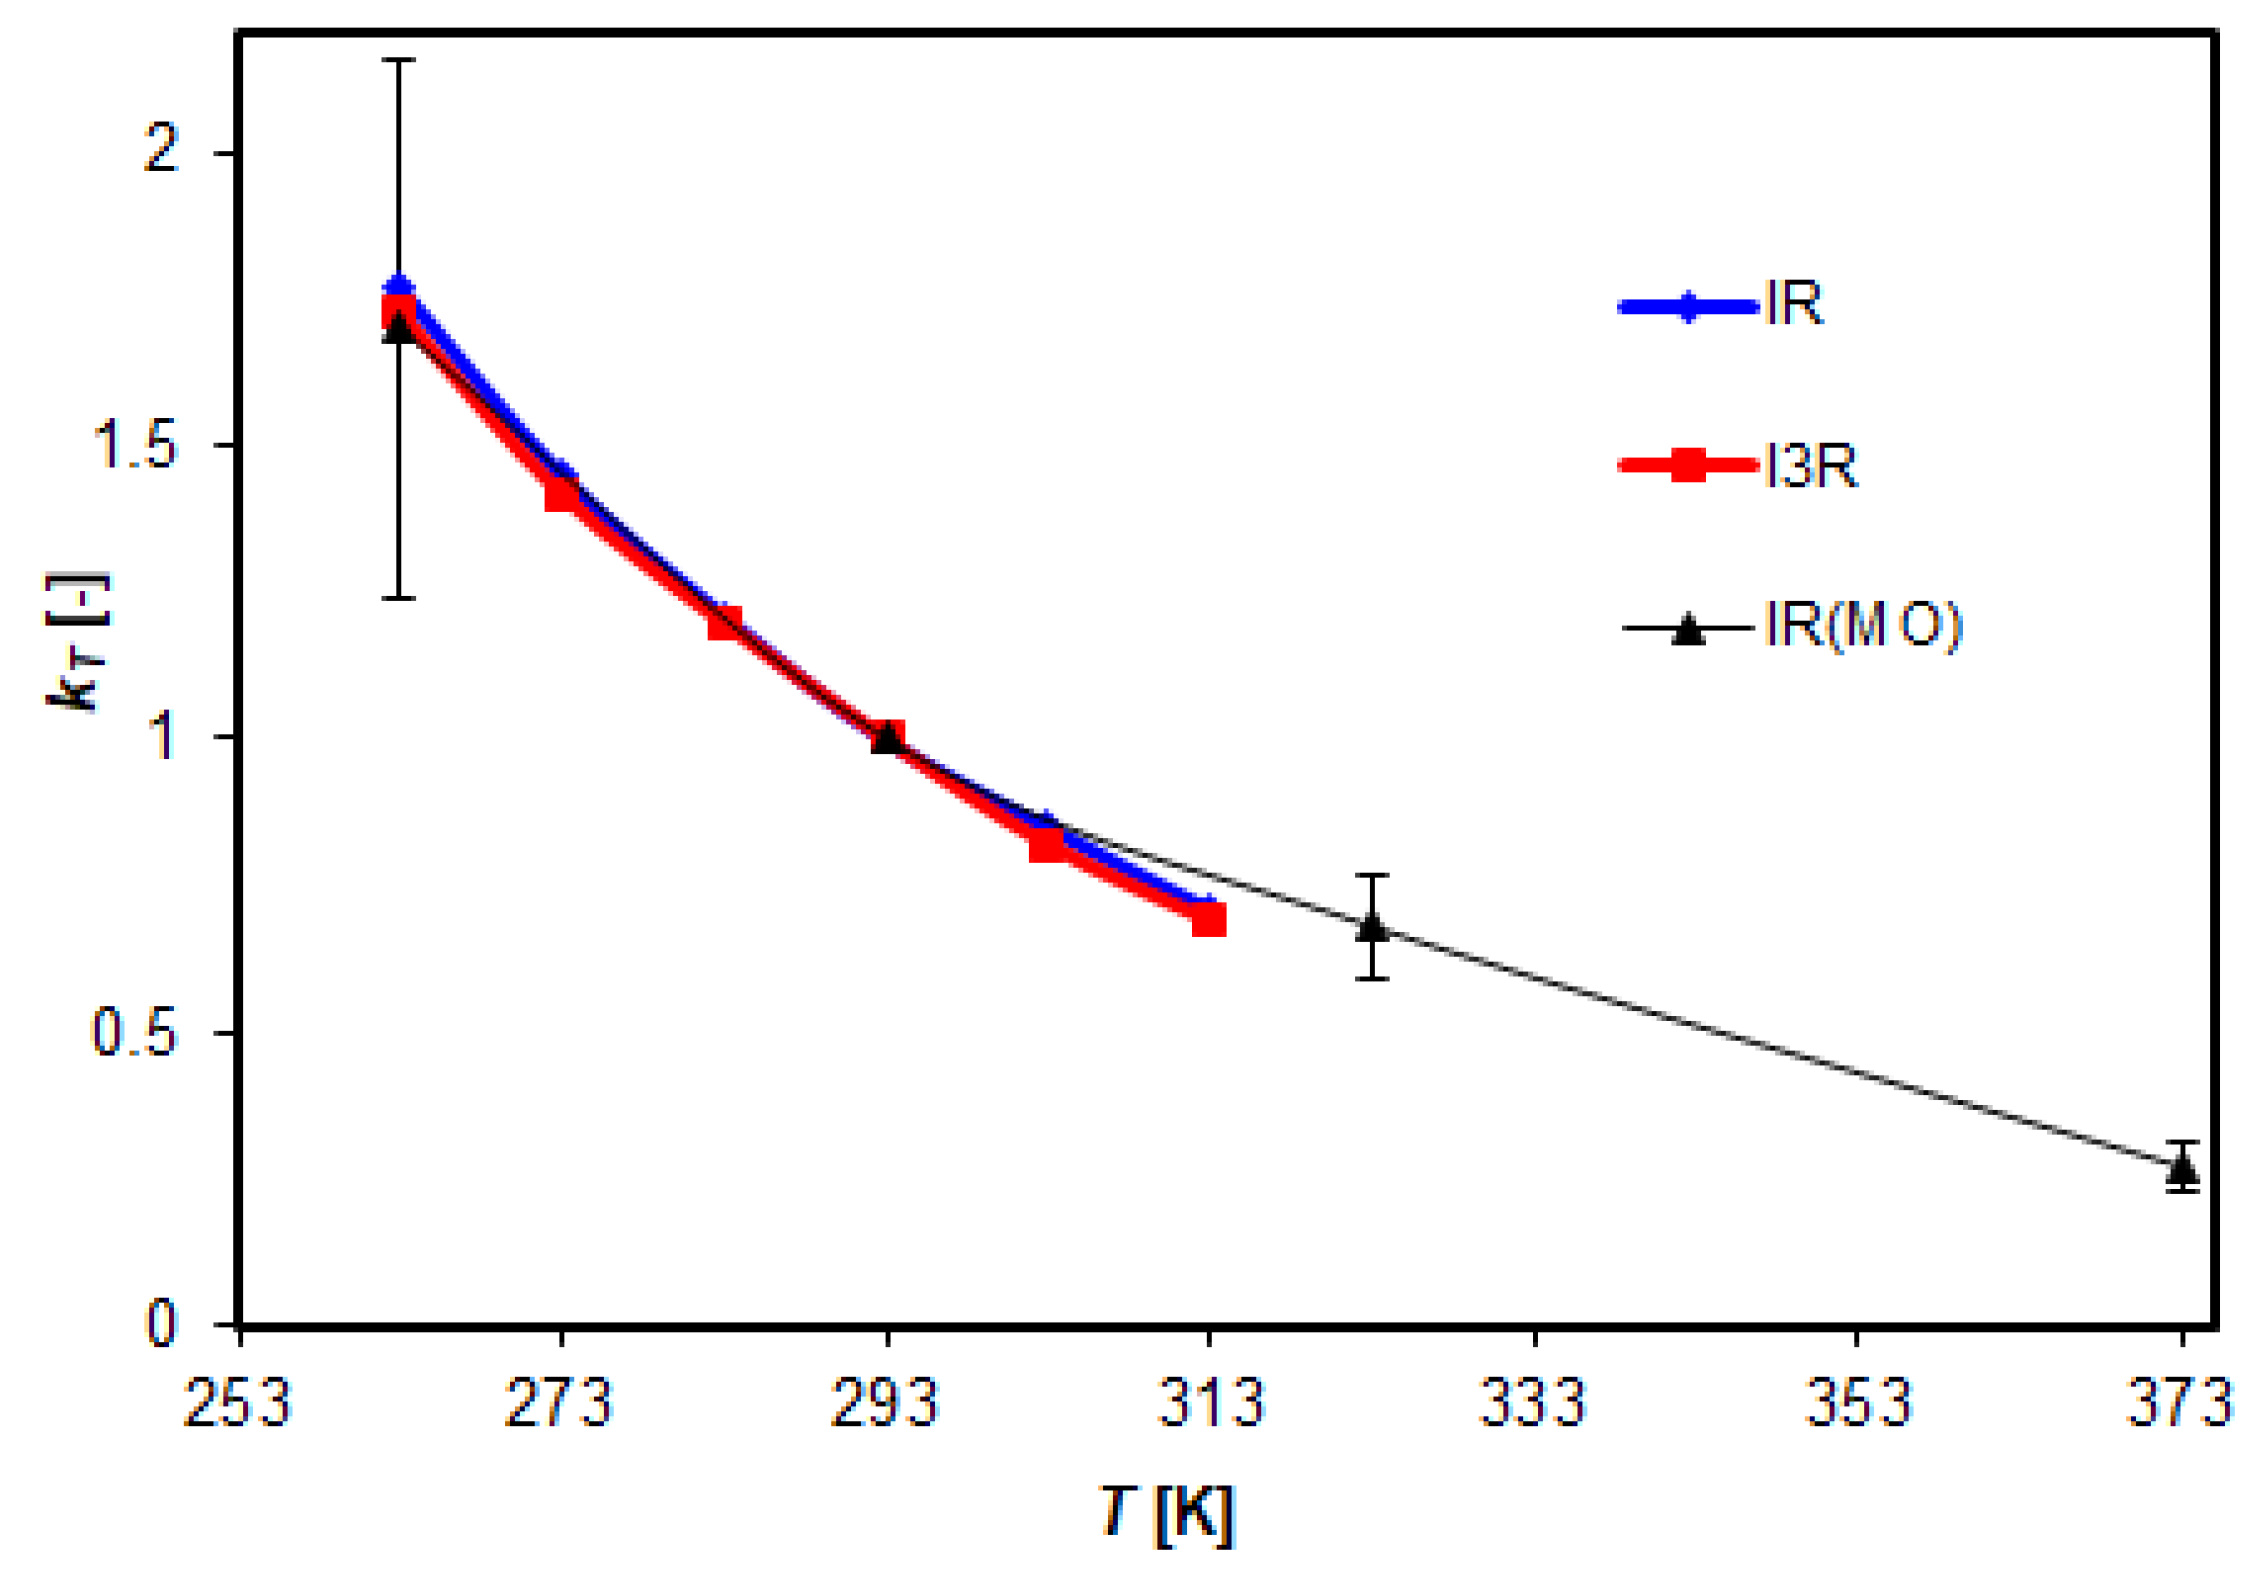
Figure 20.
Comparison of leakage current measurements at alternating voltage, IR, I3R - resistive component and its 3rd harmonic for leakage current according to [2, 39], IR(MO) - active component of leakage current determined in own measurements for the manufacturer A.
Figure 20.
Comparison of leakage current measurements at alternating voltage, IR, I3R - resistive component and its 3rd harmonic for leakage current according to [2, 39], IR(MO) - active component of leakage current determined in own measurements for the manufacturer A.
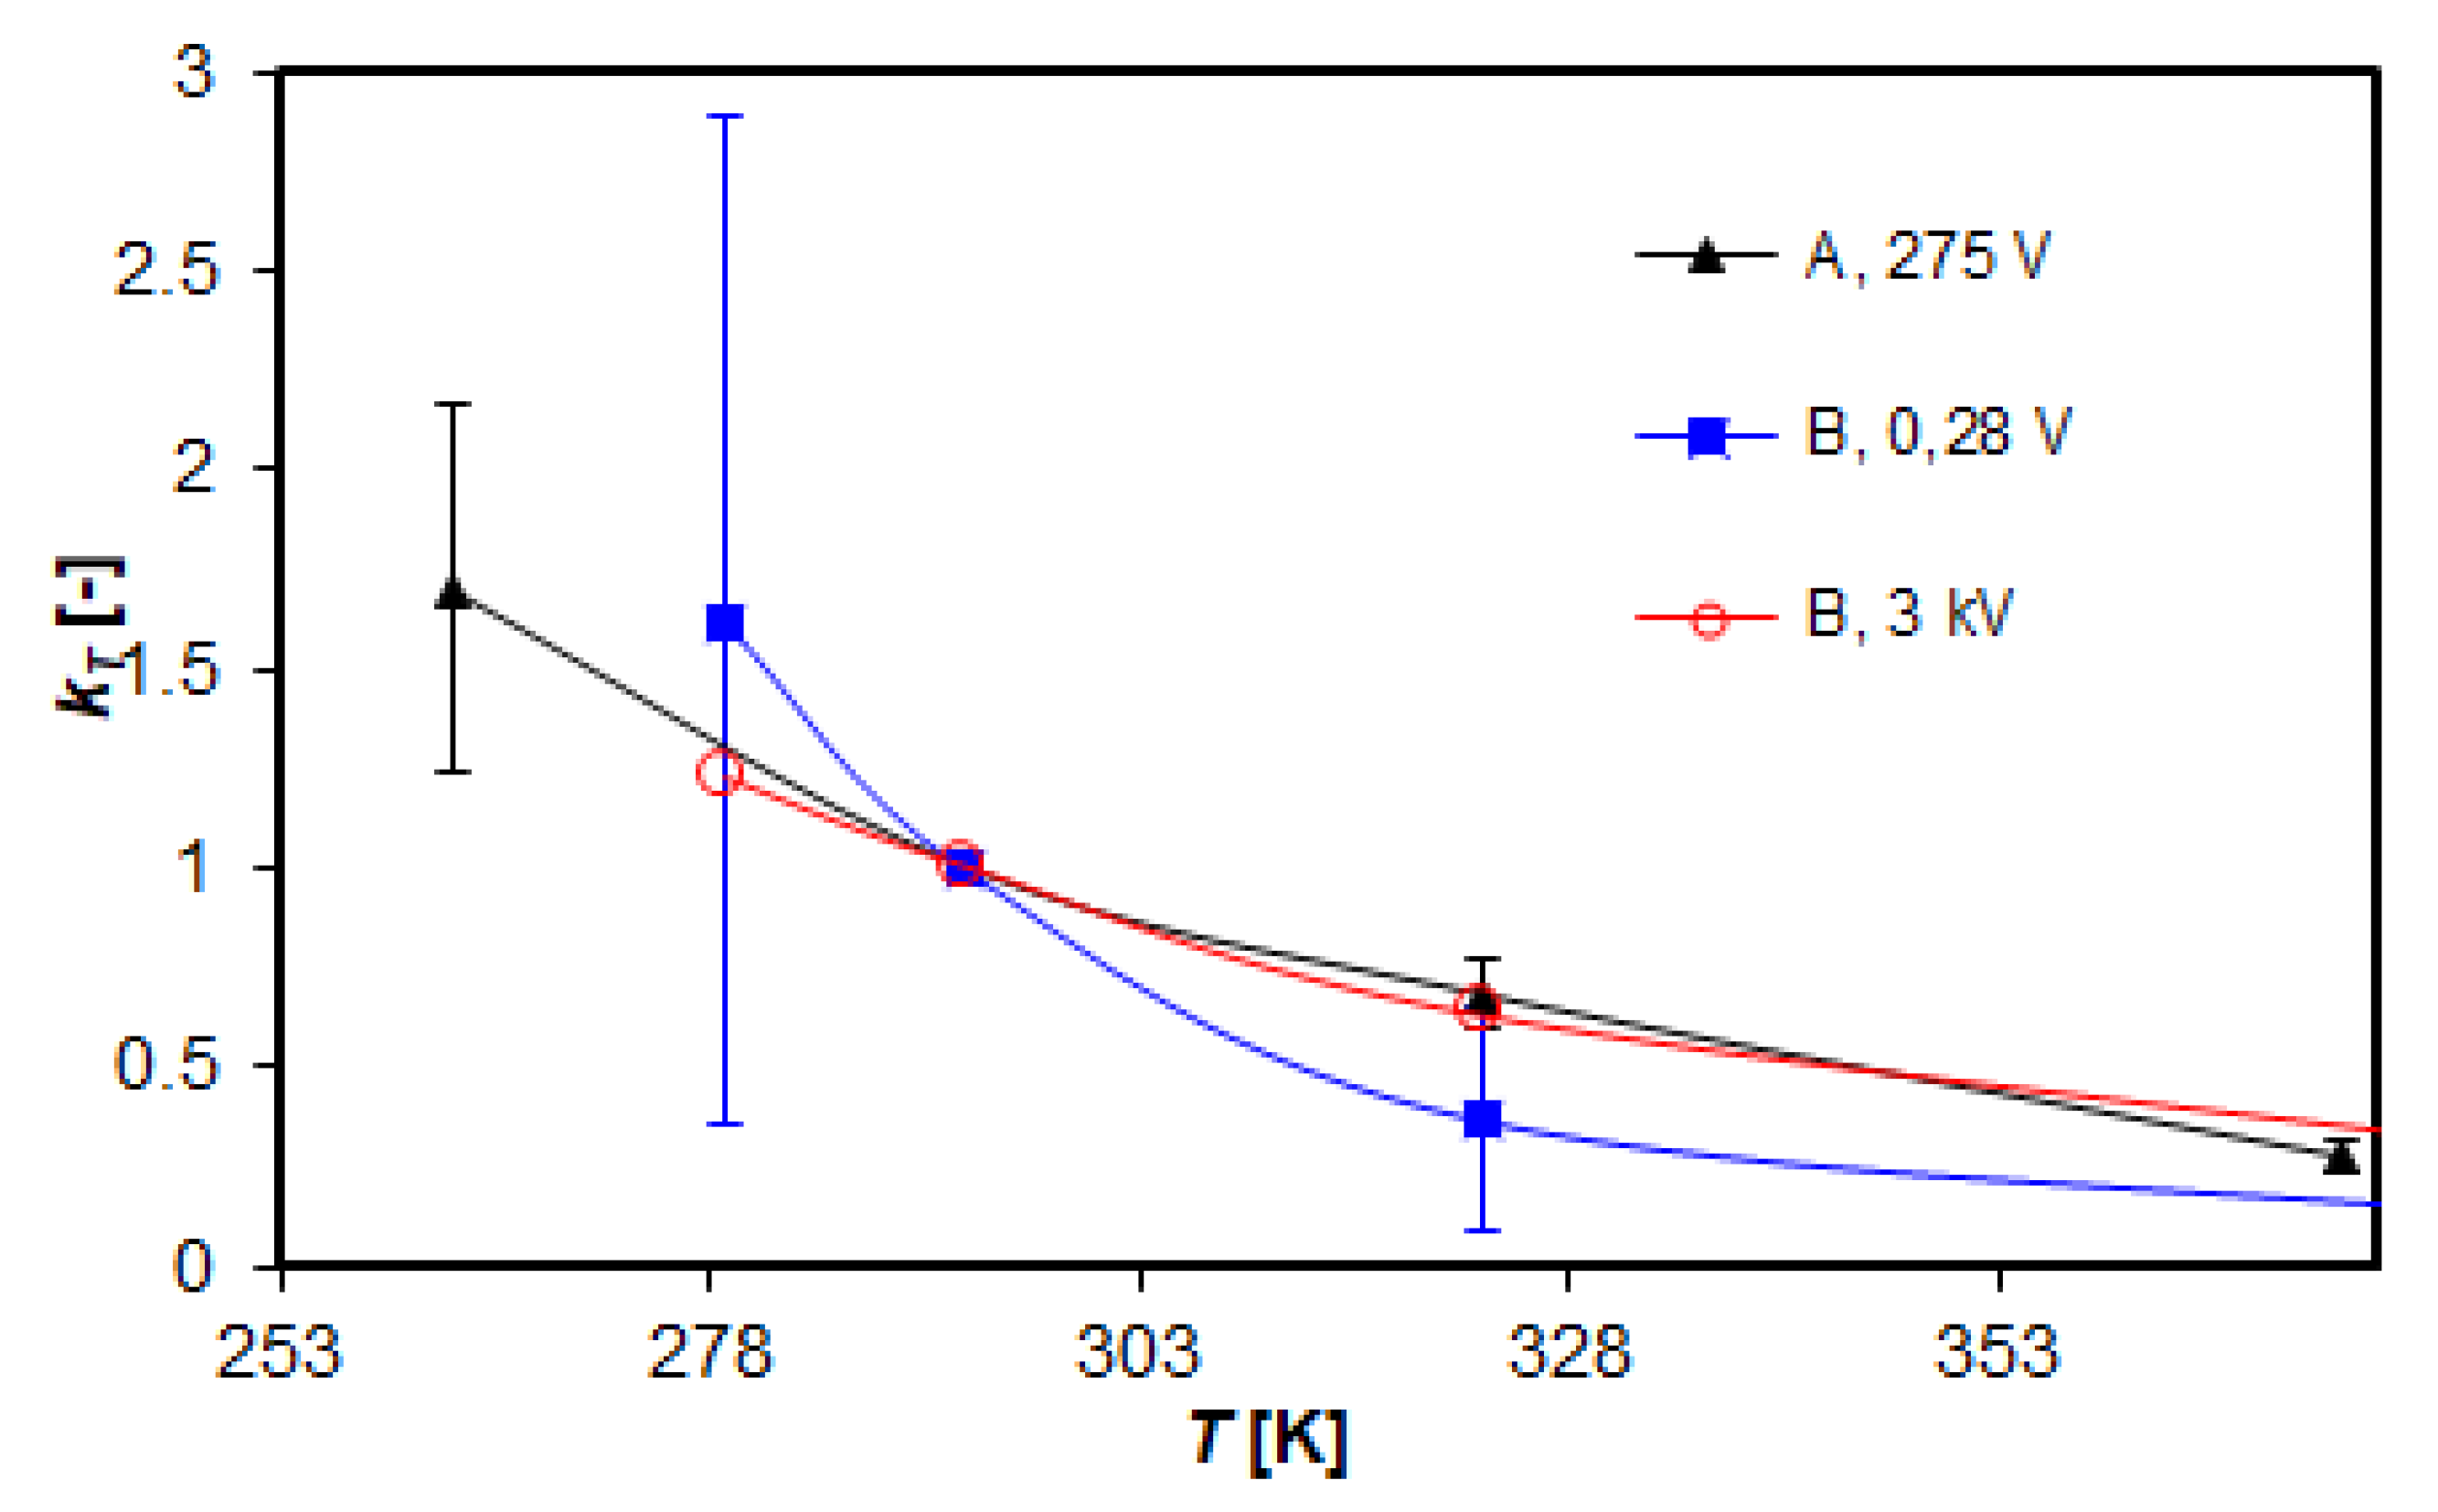
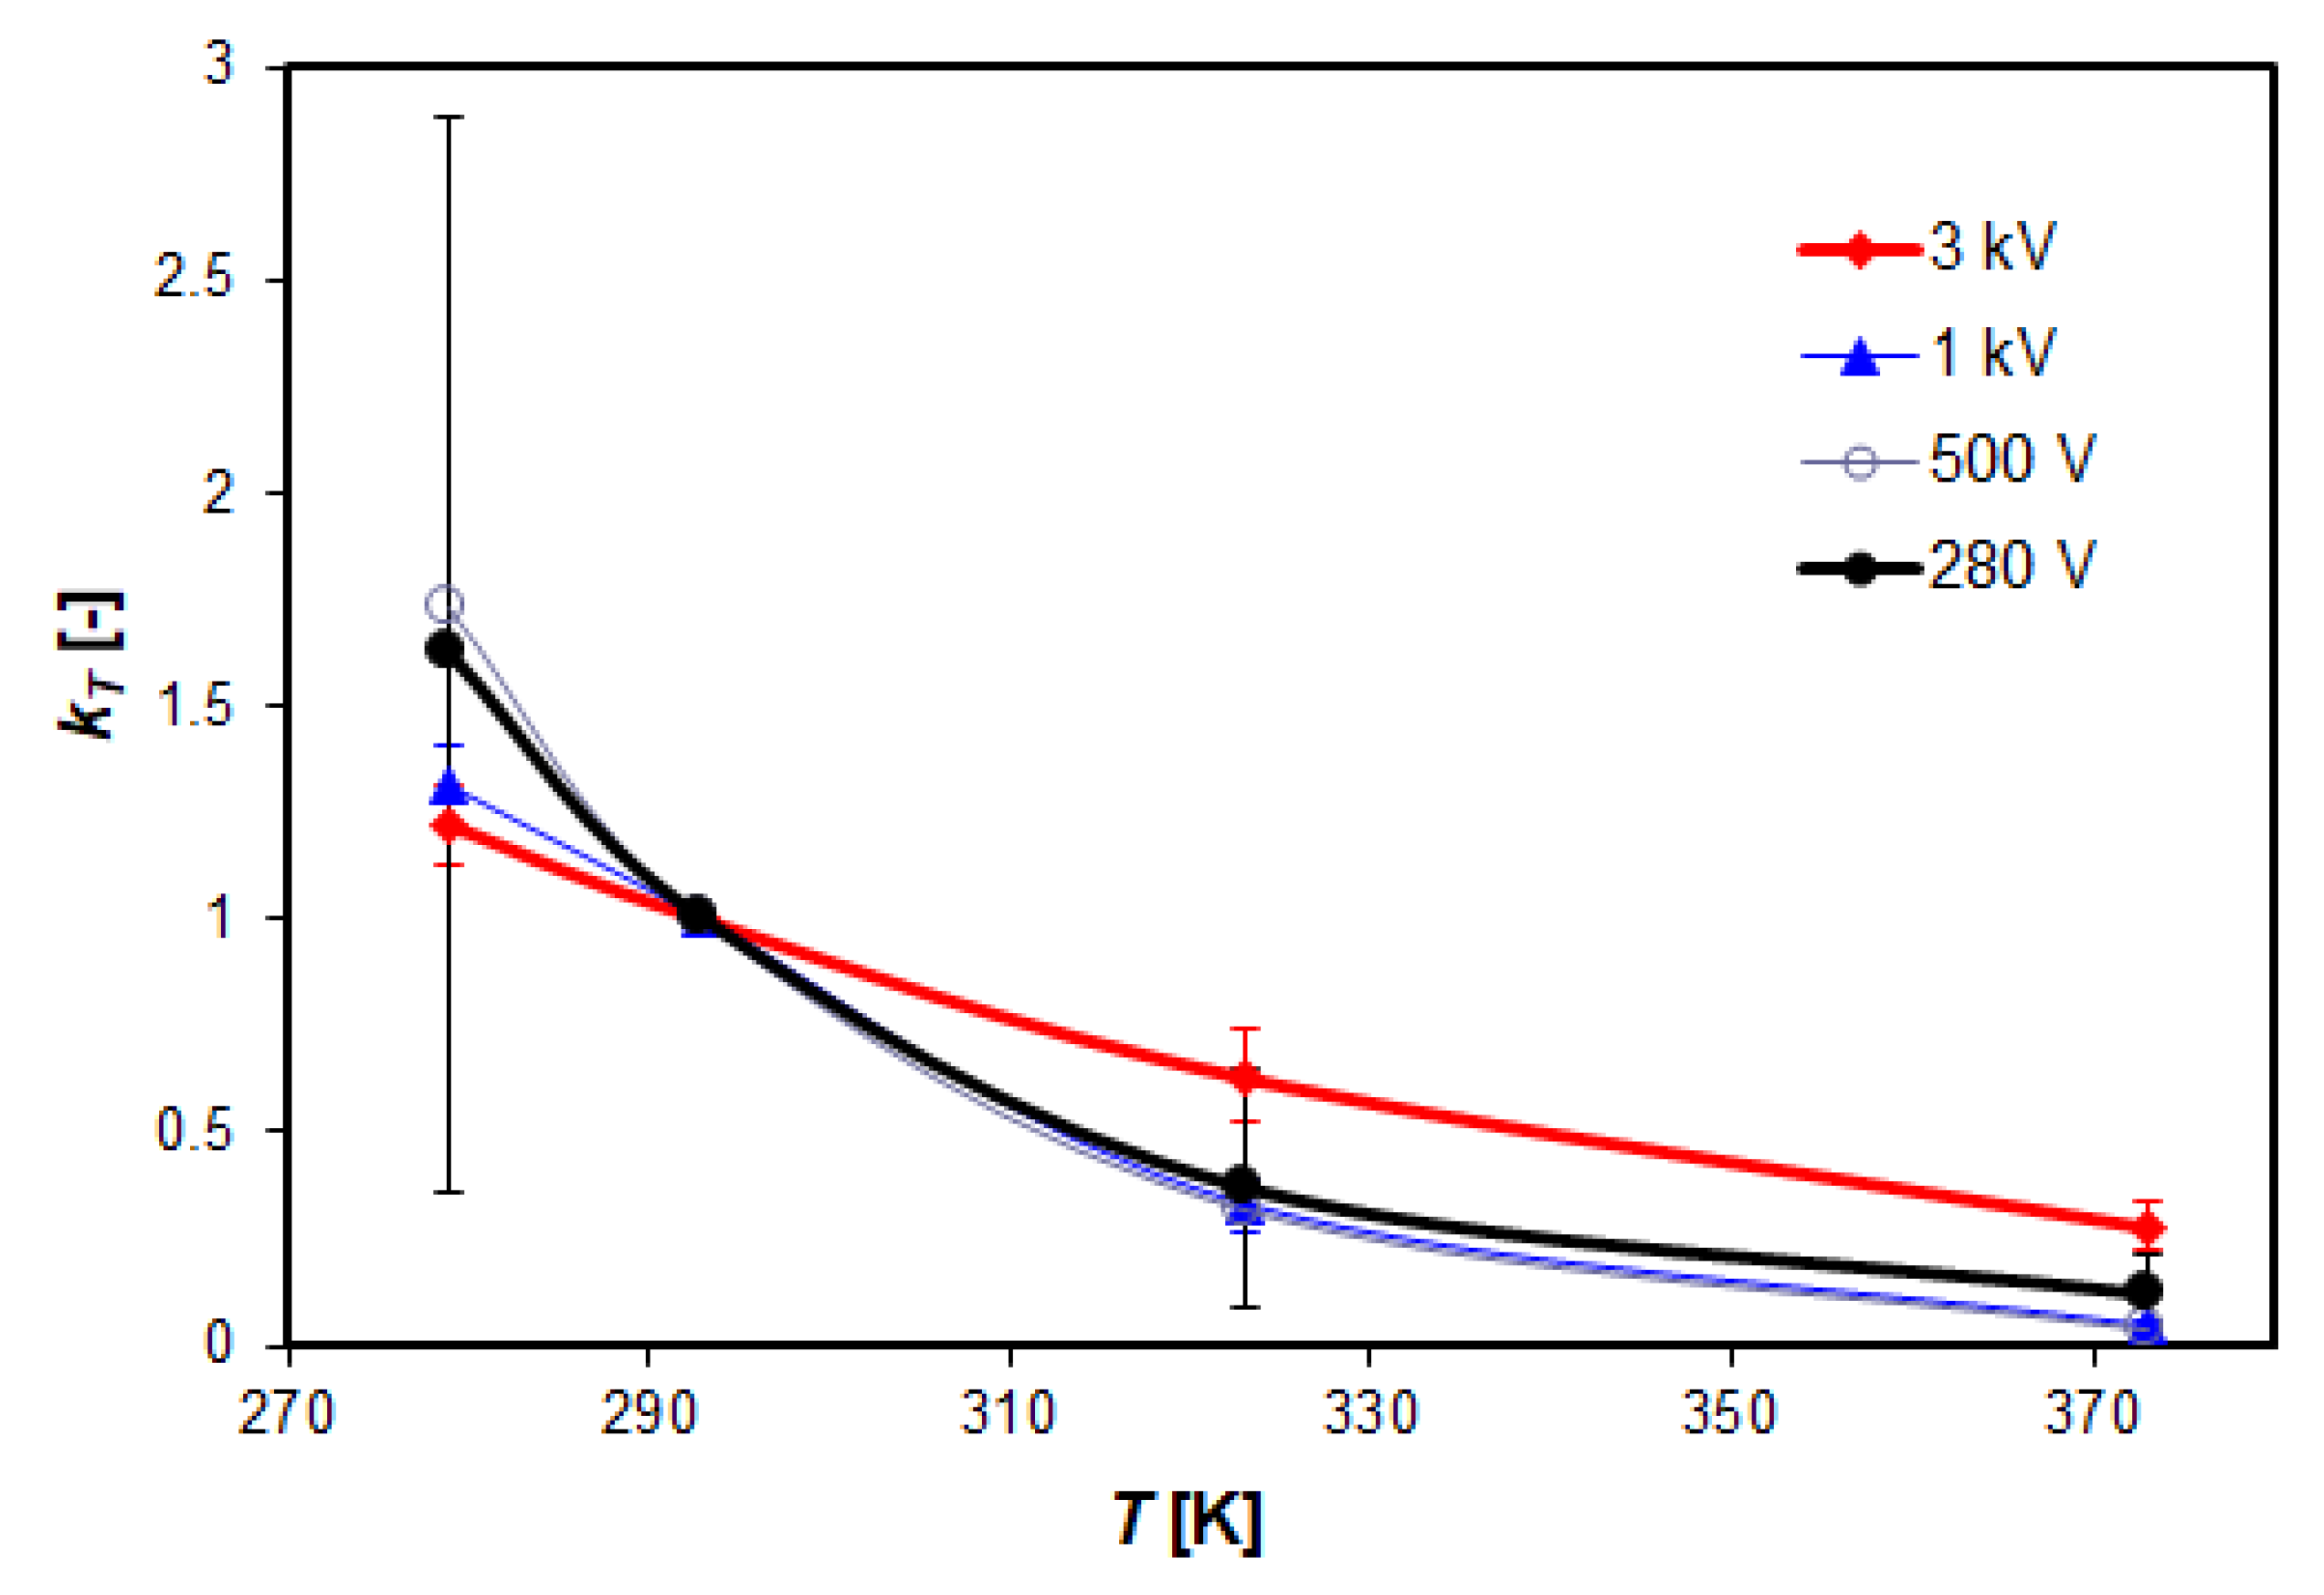
Figure 21.
Influence of the dimensions of the arrester manufacturer B (the height of the varistor is for 280 V - 3.5 mm, 0.5 kV - 5 mm, 1 kV - 8 mm and for 3 kV - 25 mm) on the value of the kT coefficient.
Figure 21.
Influence of the dimensions of the arrester manufacturer B (the height of the varistor is for 280 V - 3.5 mm, 0.5 kV - 5 mm, 1 kV - 8 mm and for 3 kV - 25 mm) on the value of the kT coefficient.
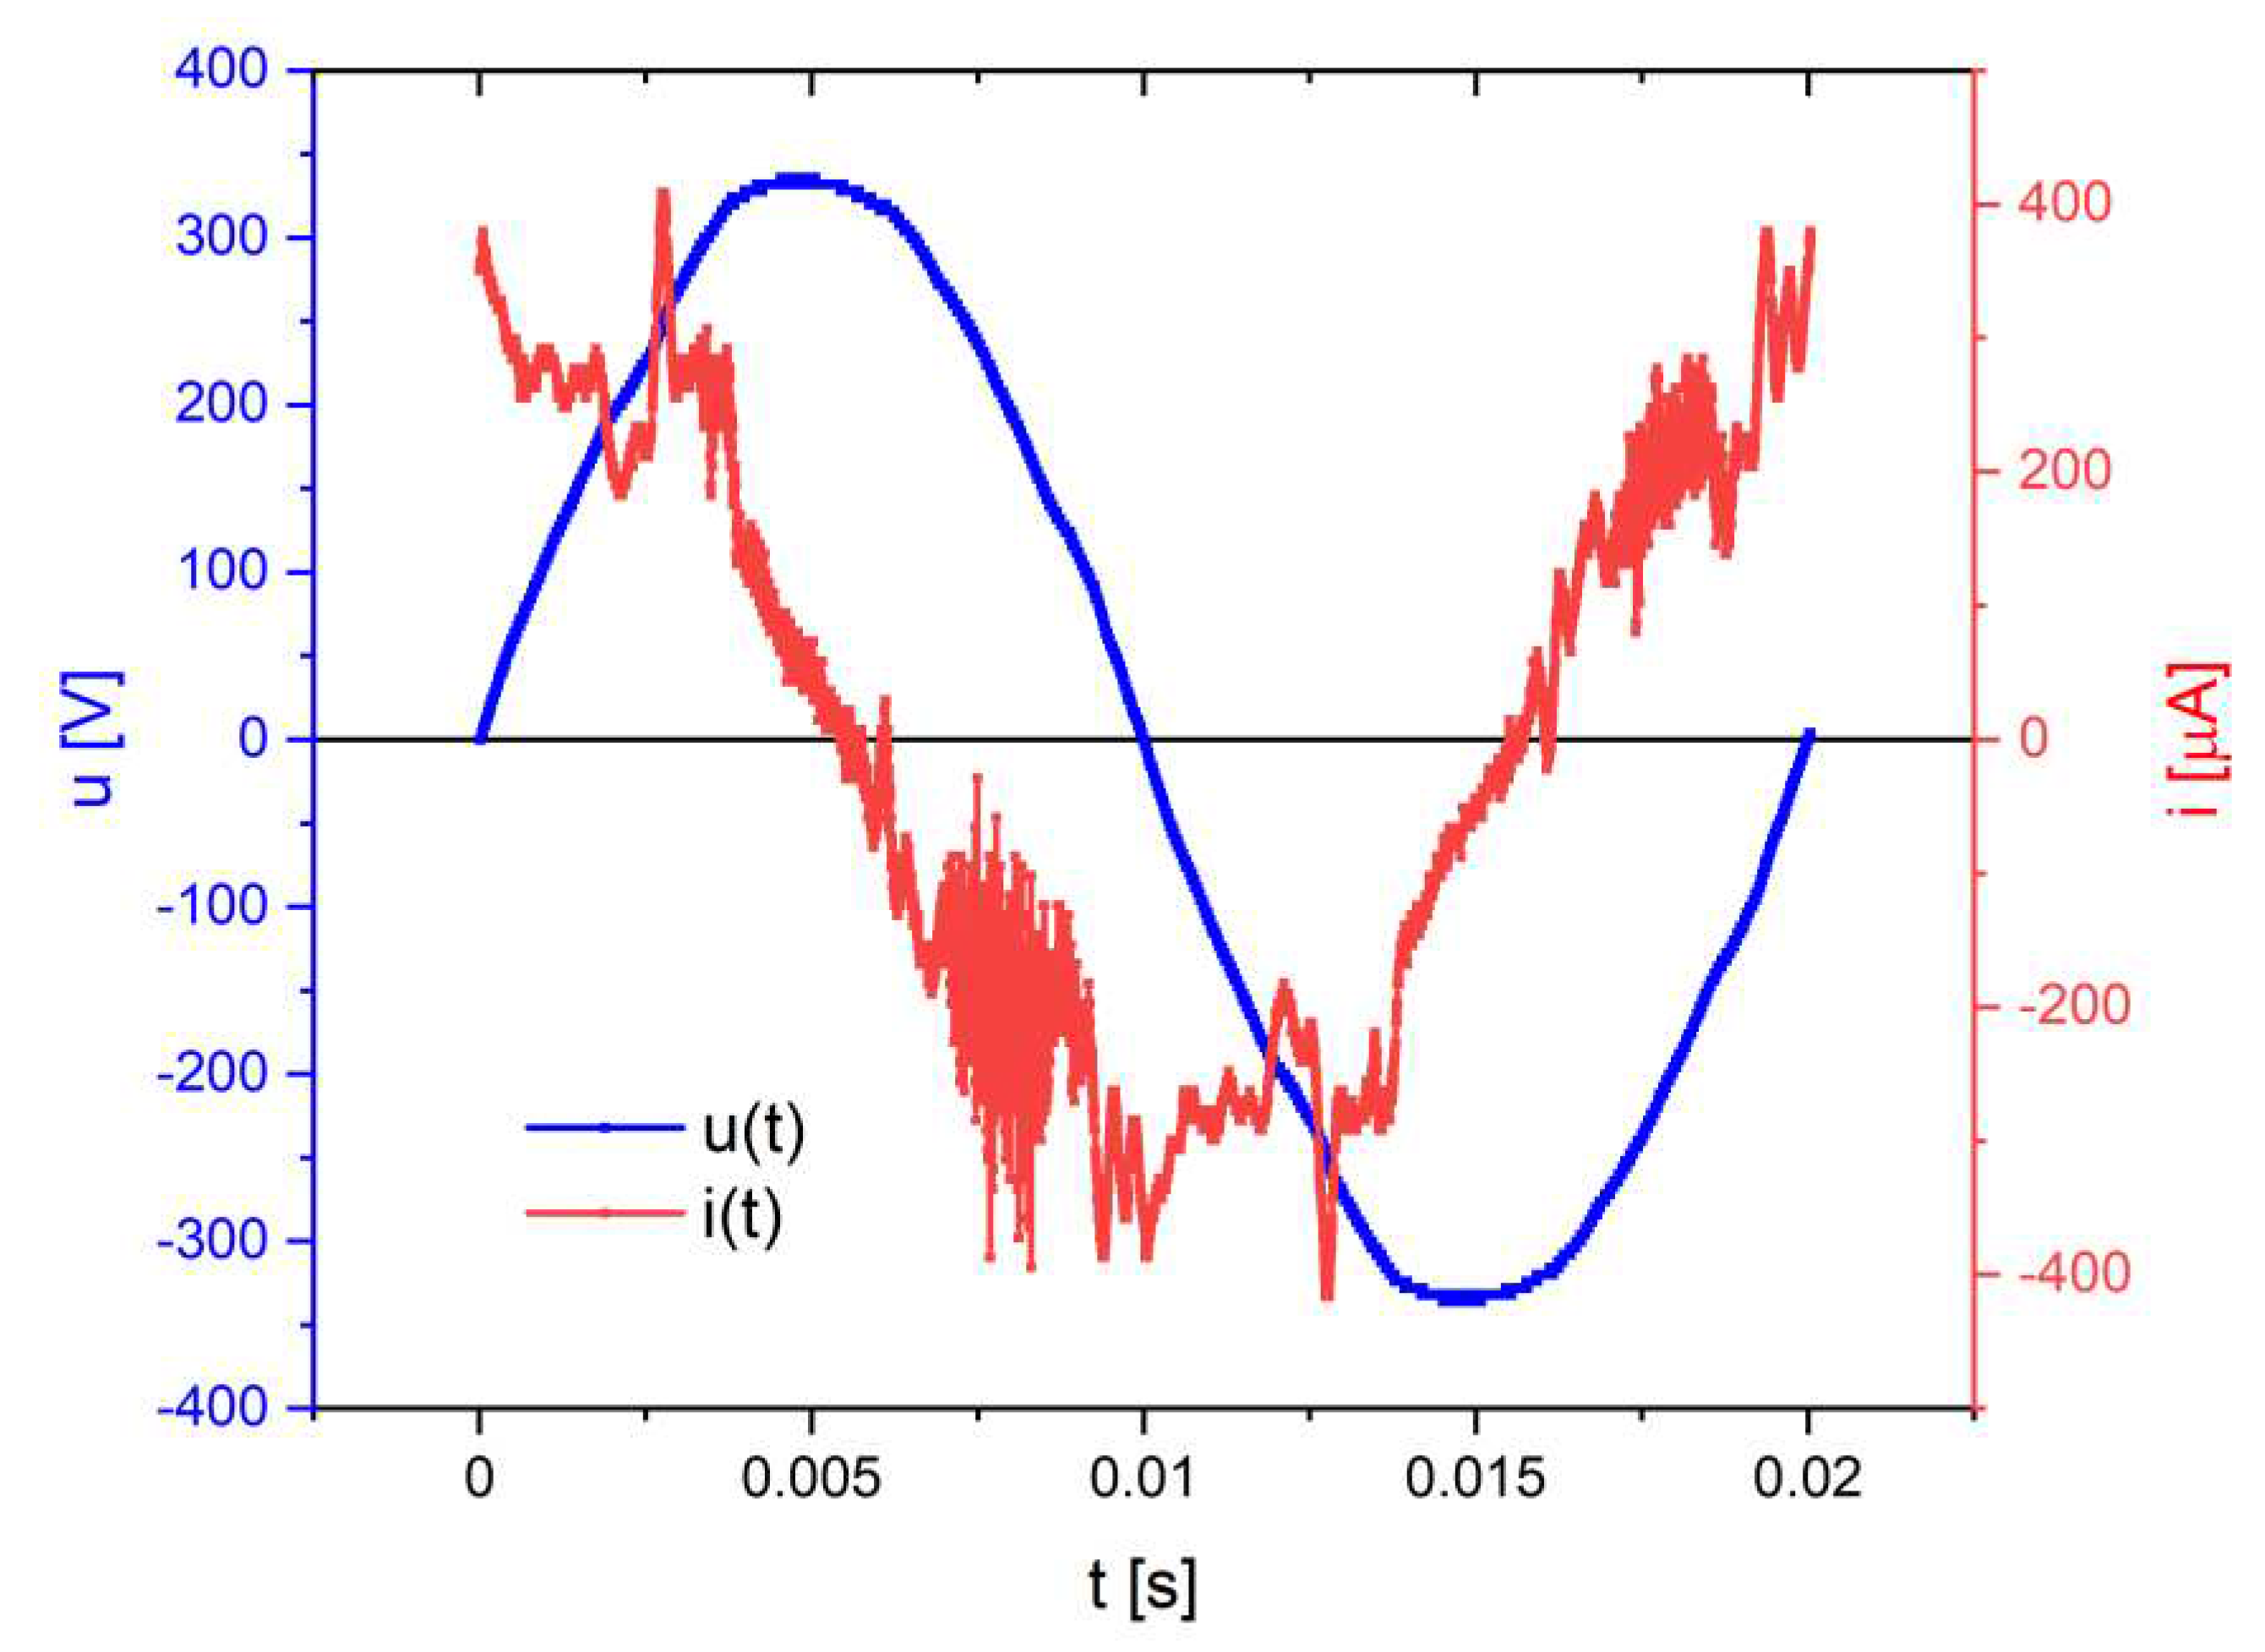
Figure 22.
Leakage current i(t) of surge arrester no. 8 measured at mains voltage u(t) with rms value of 237.9 V.
Figure 22.
Leakage current i(t) of surge arrester no. 8 measured at mains voltage u(t) with rms value of 237.9 V.
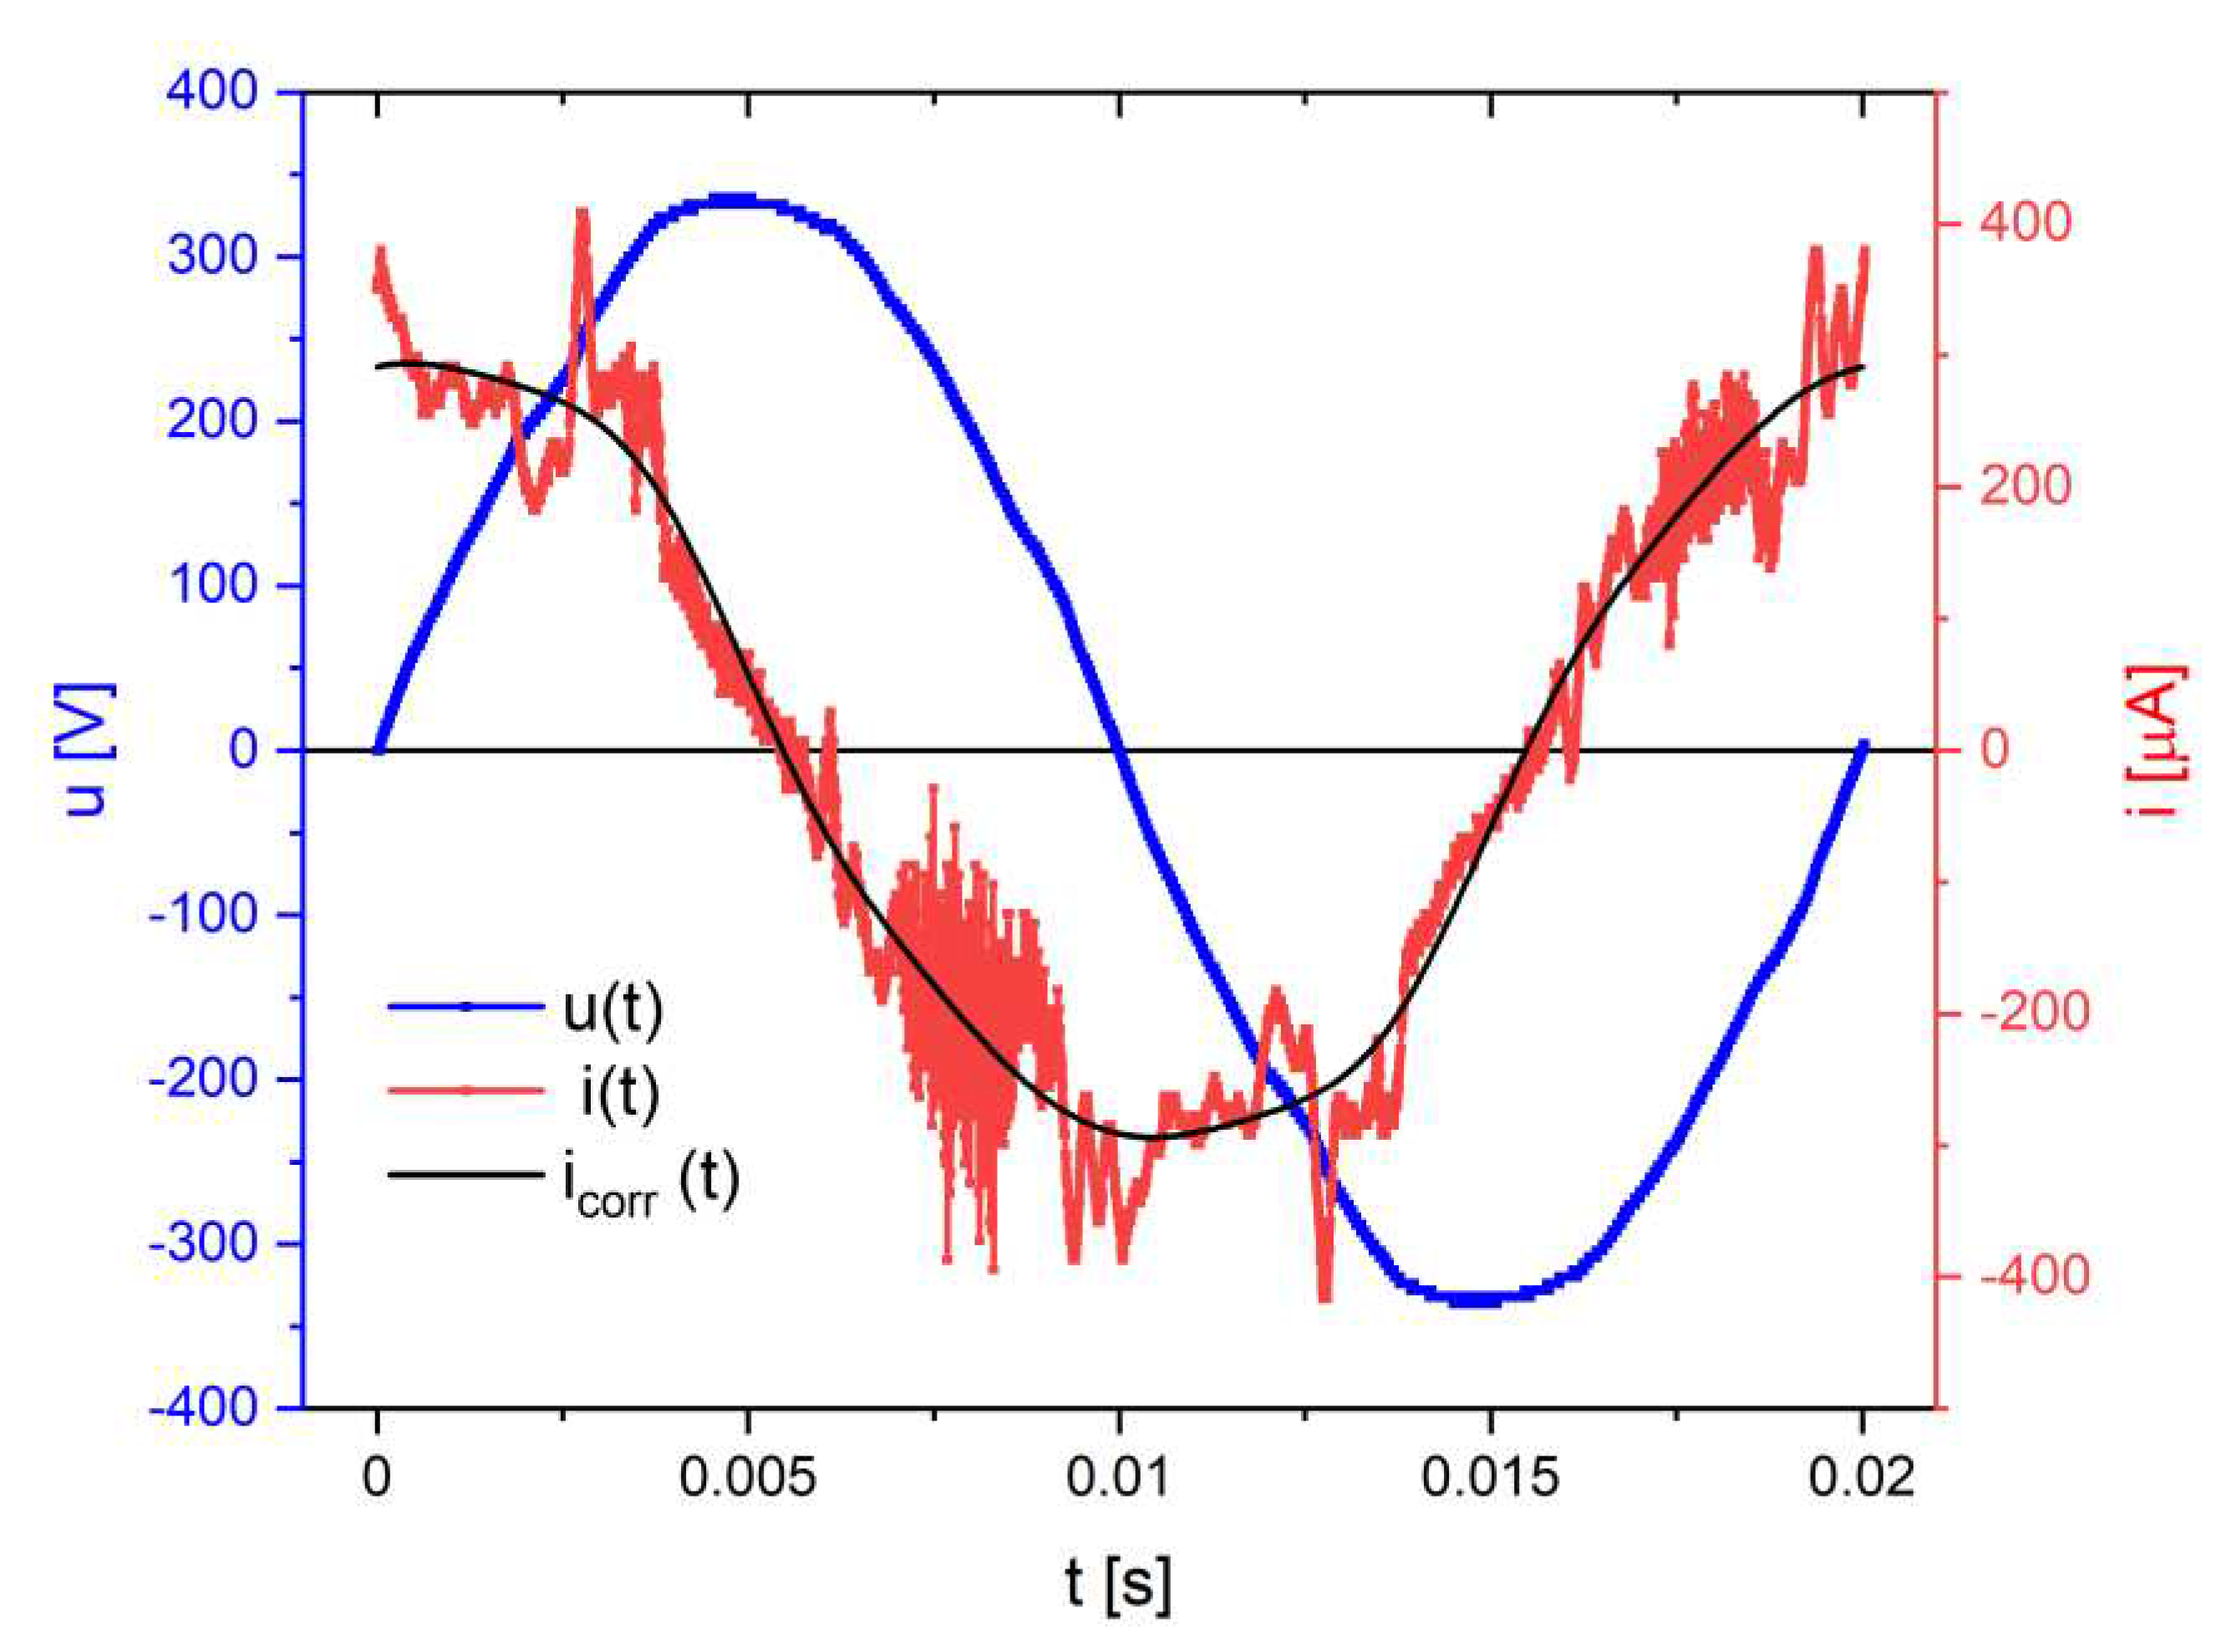
Figure 23.
Recorded values of voltage u(t) and leakage current i(t) at distorted voltage U=237.8 V. The corrected course of the leakage current icor(t) was calculated for odd harmonics from 1 to 15.
Figure 23.
Recorded values of voltage u(t) and leakage current i(t) at distorted voltage U=237.8 V. The corrected course of the leakage current icor(t) was calculated for odd harmonics from 1 to 15.
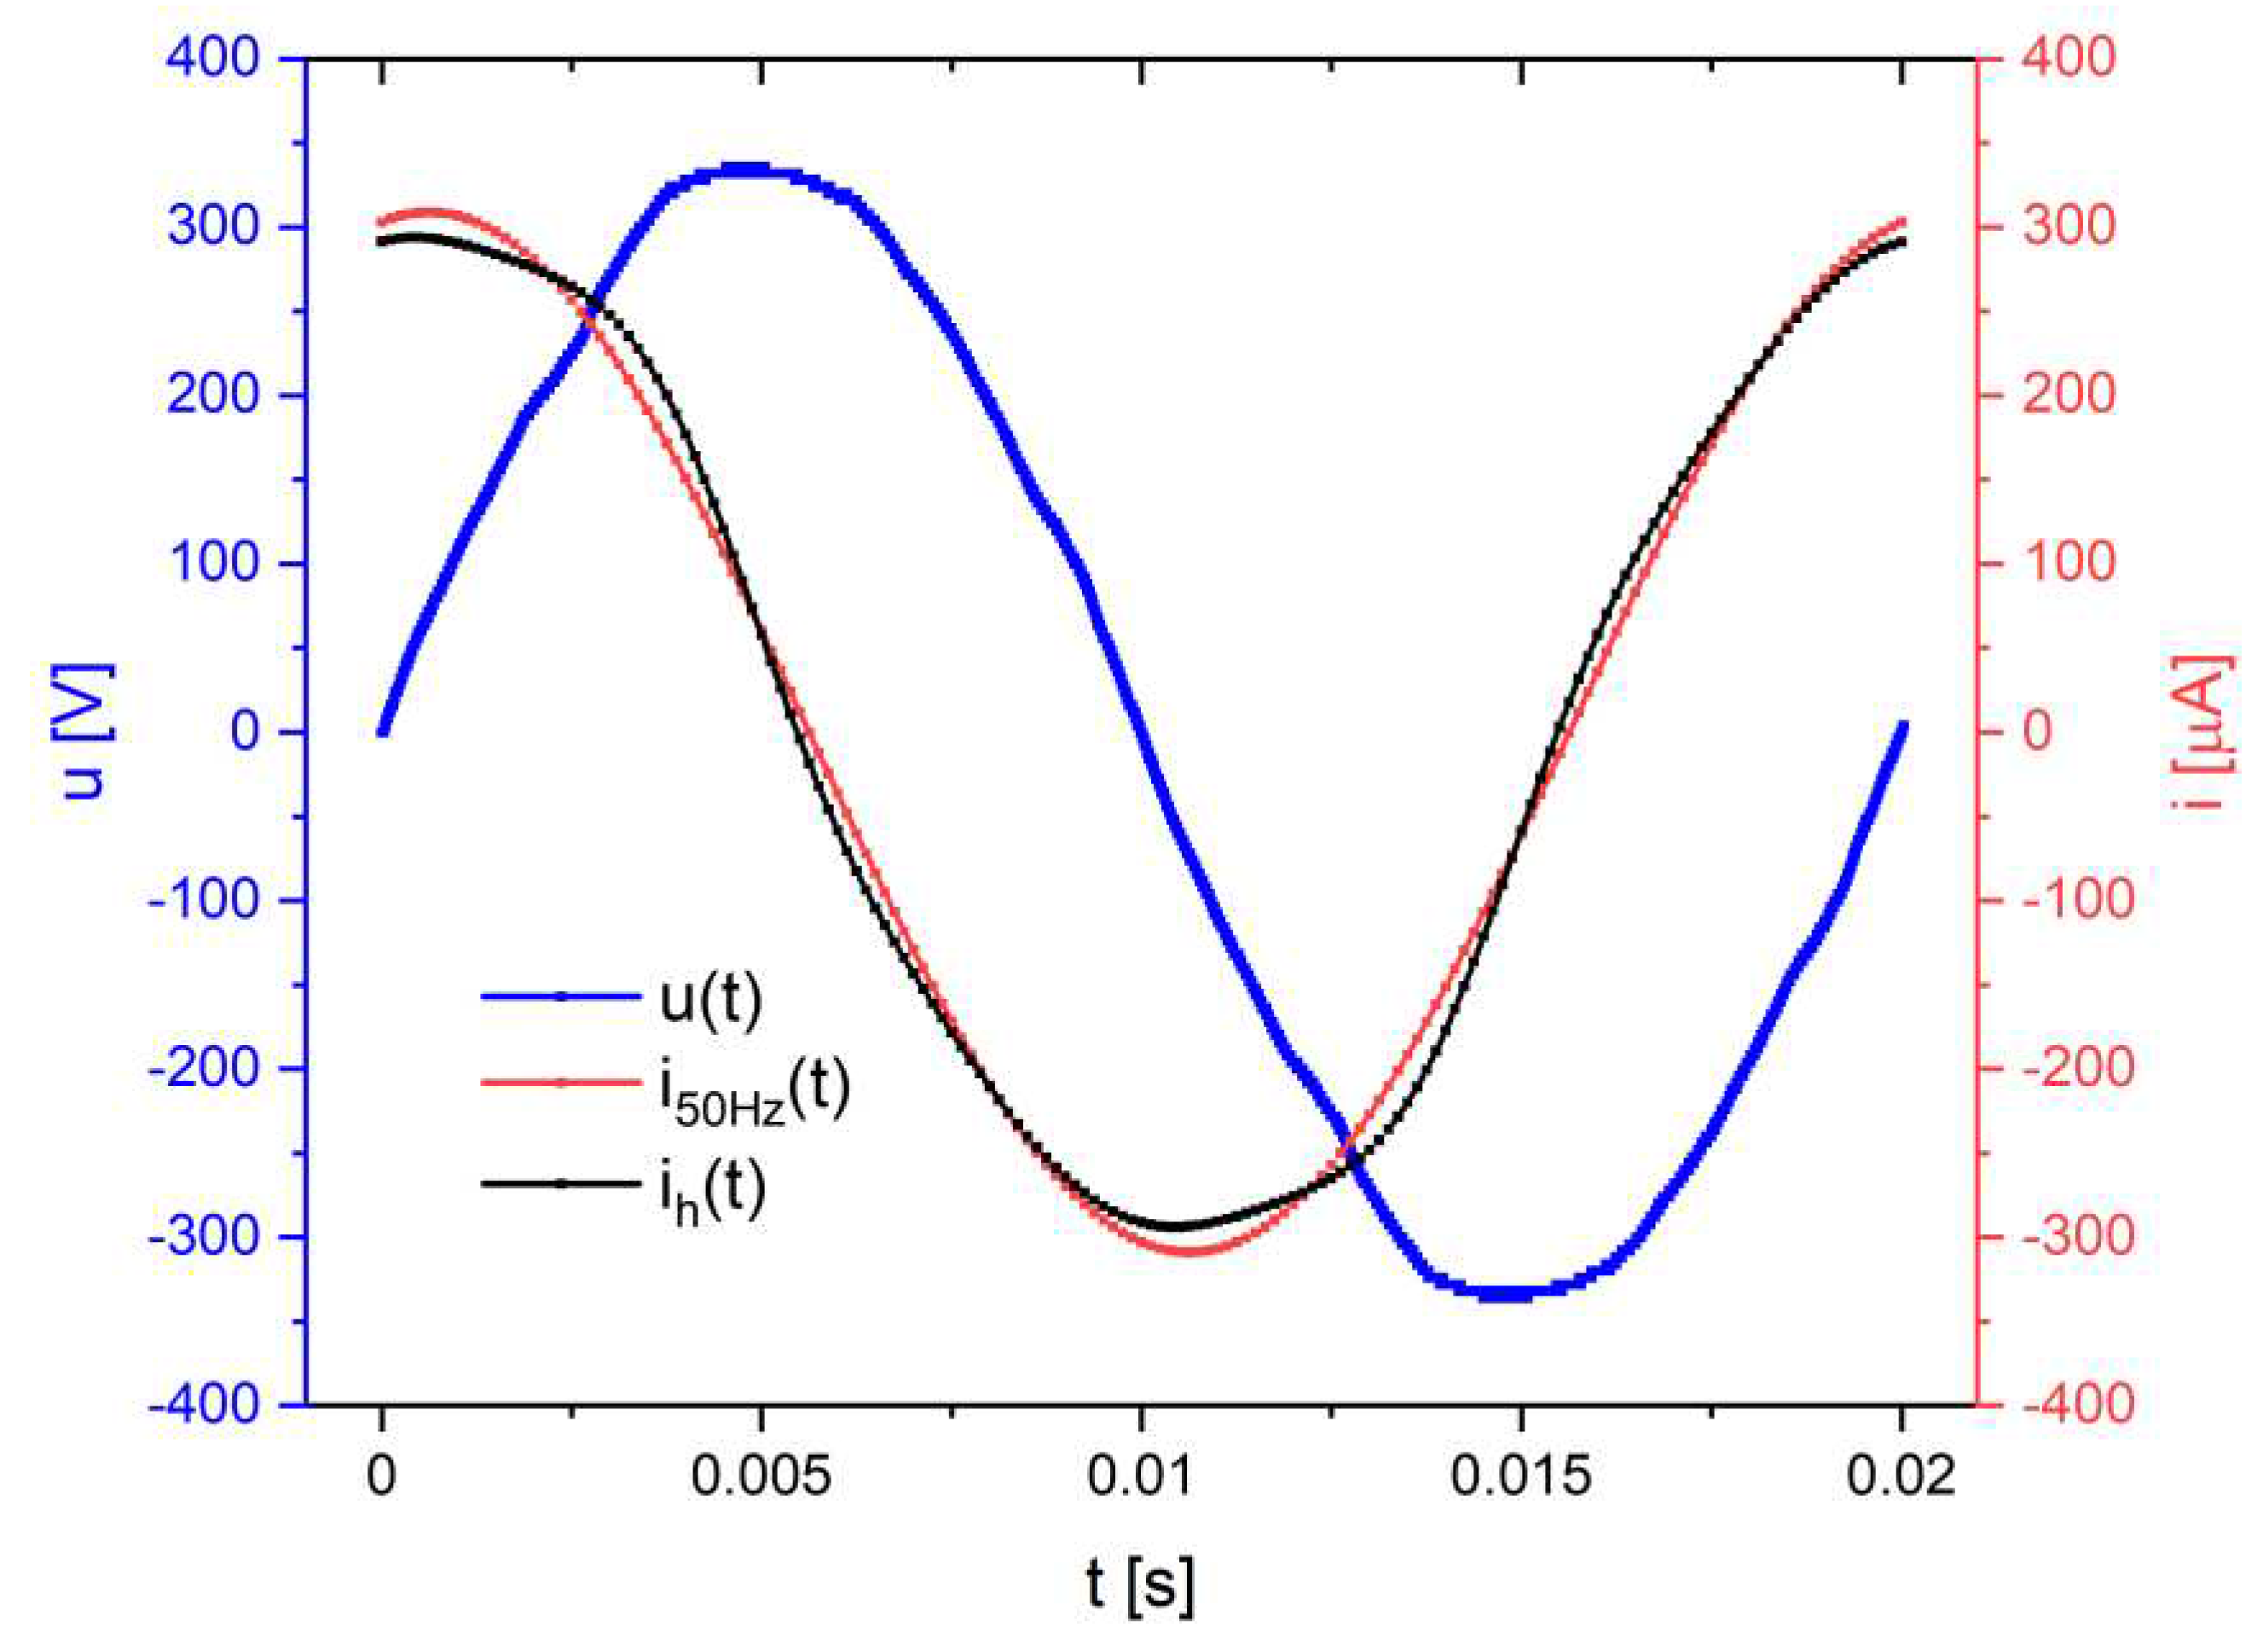
Figure 24.
Comparison of the corrected waveform of the leakage current icor(t) with the current of the fundamental harmonic 50 Hz i50Hz(t) resulting from the analysis with the FFT algorithm of the real waveform i(t).
Figure 24.
Comparison of the corrected waveform of the leakage current icor(t) with the current of the fundamental harmonic 50 Hz i50Hz(t) resulting from the analysis with the FFT algorithm of the real waveform i(t).
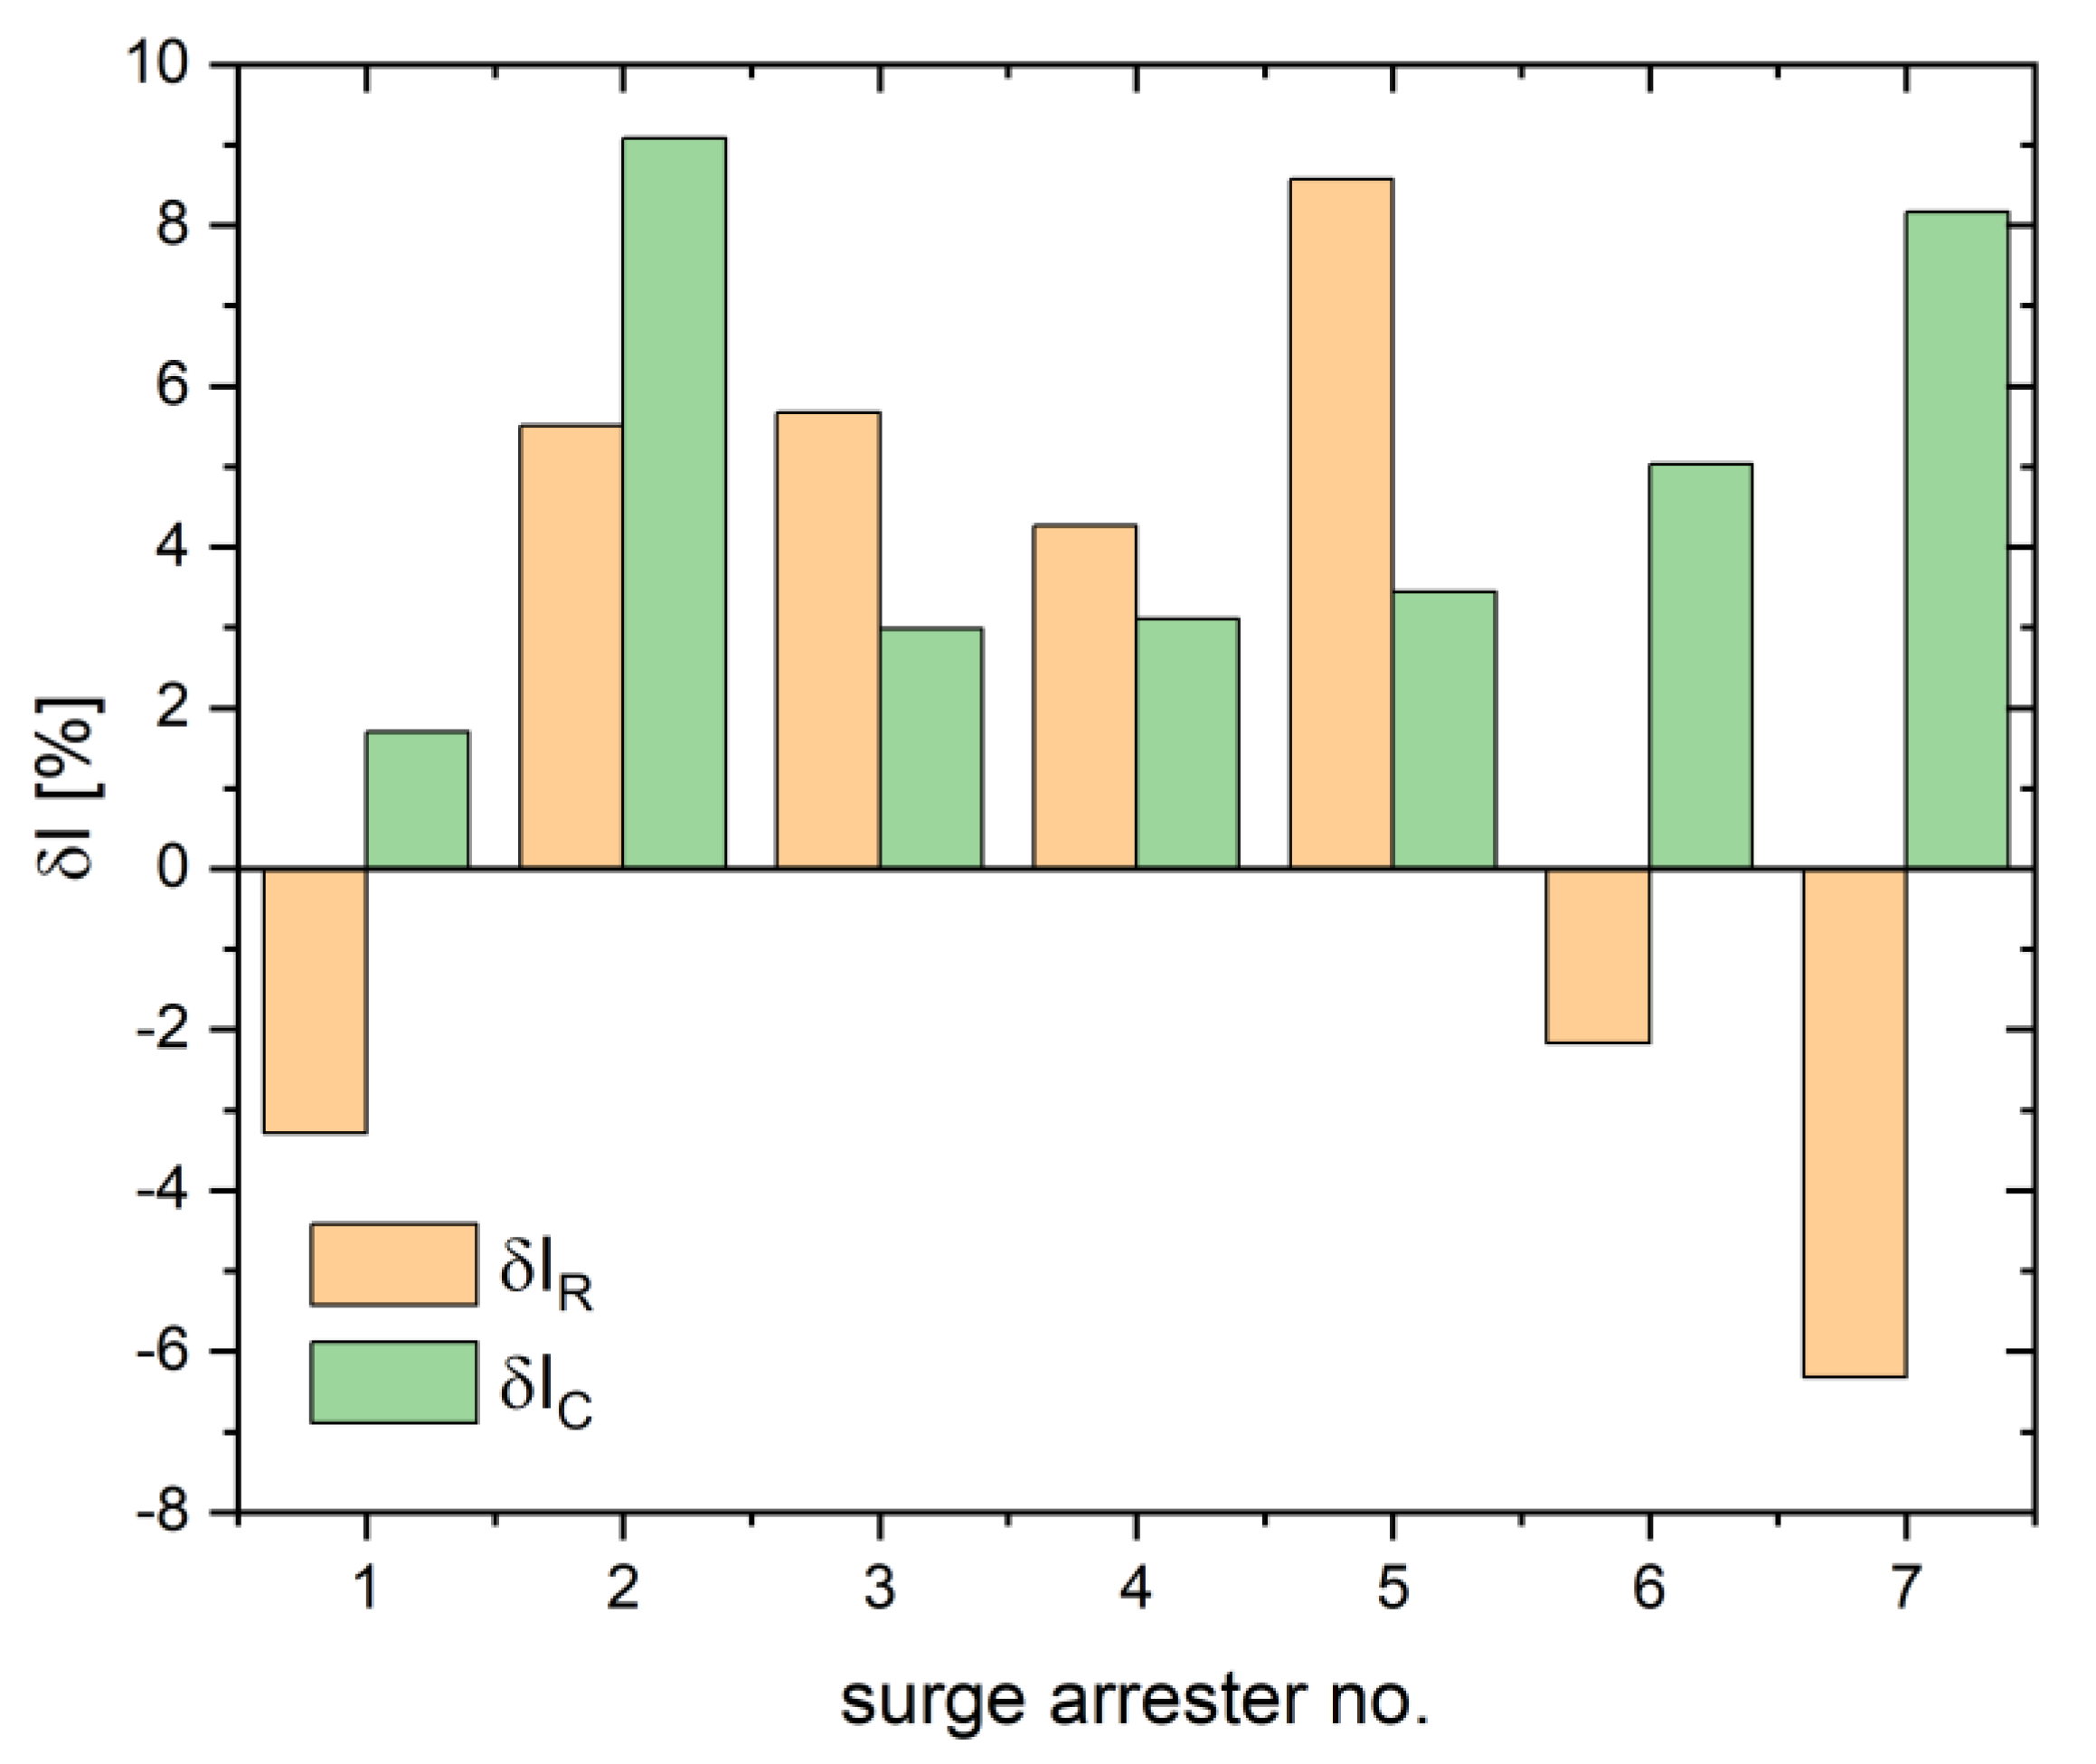
Figure 29.
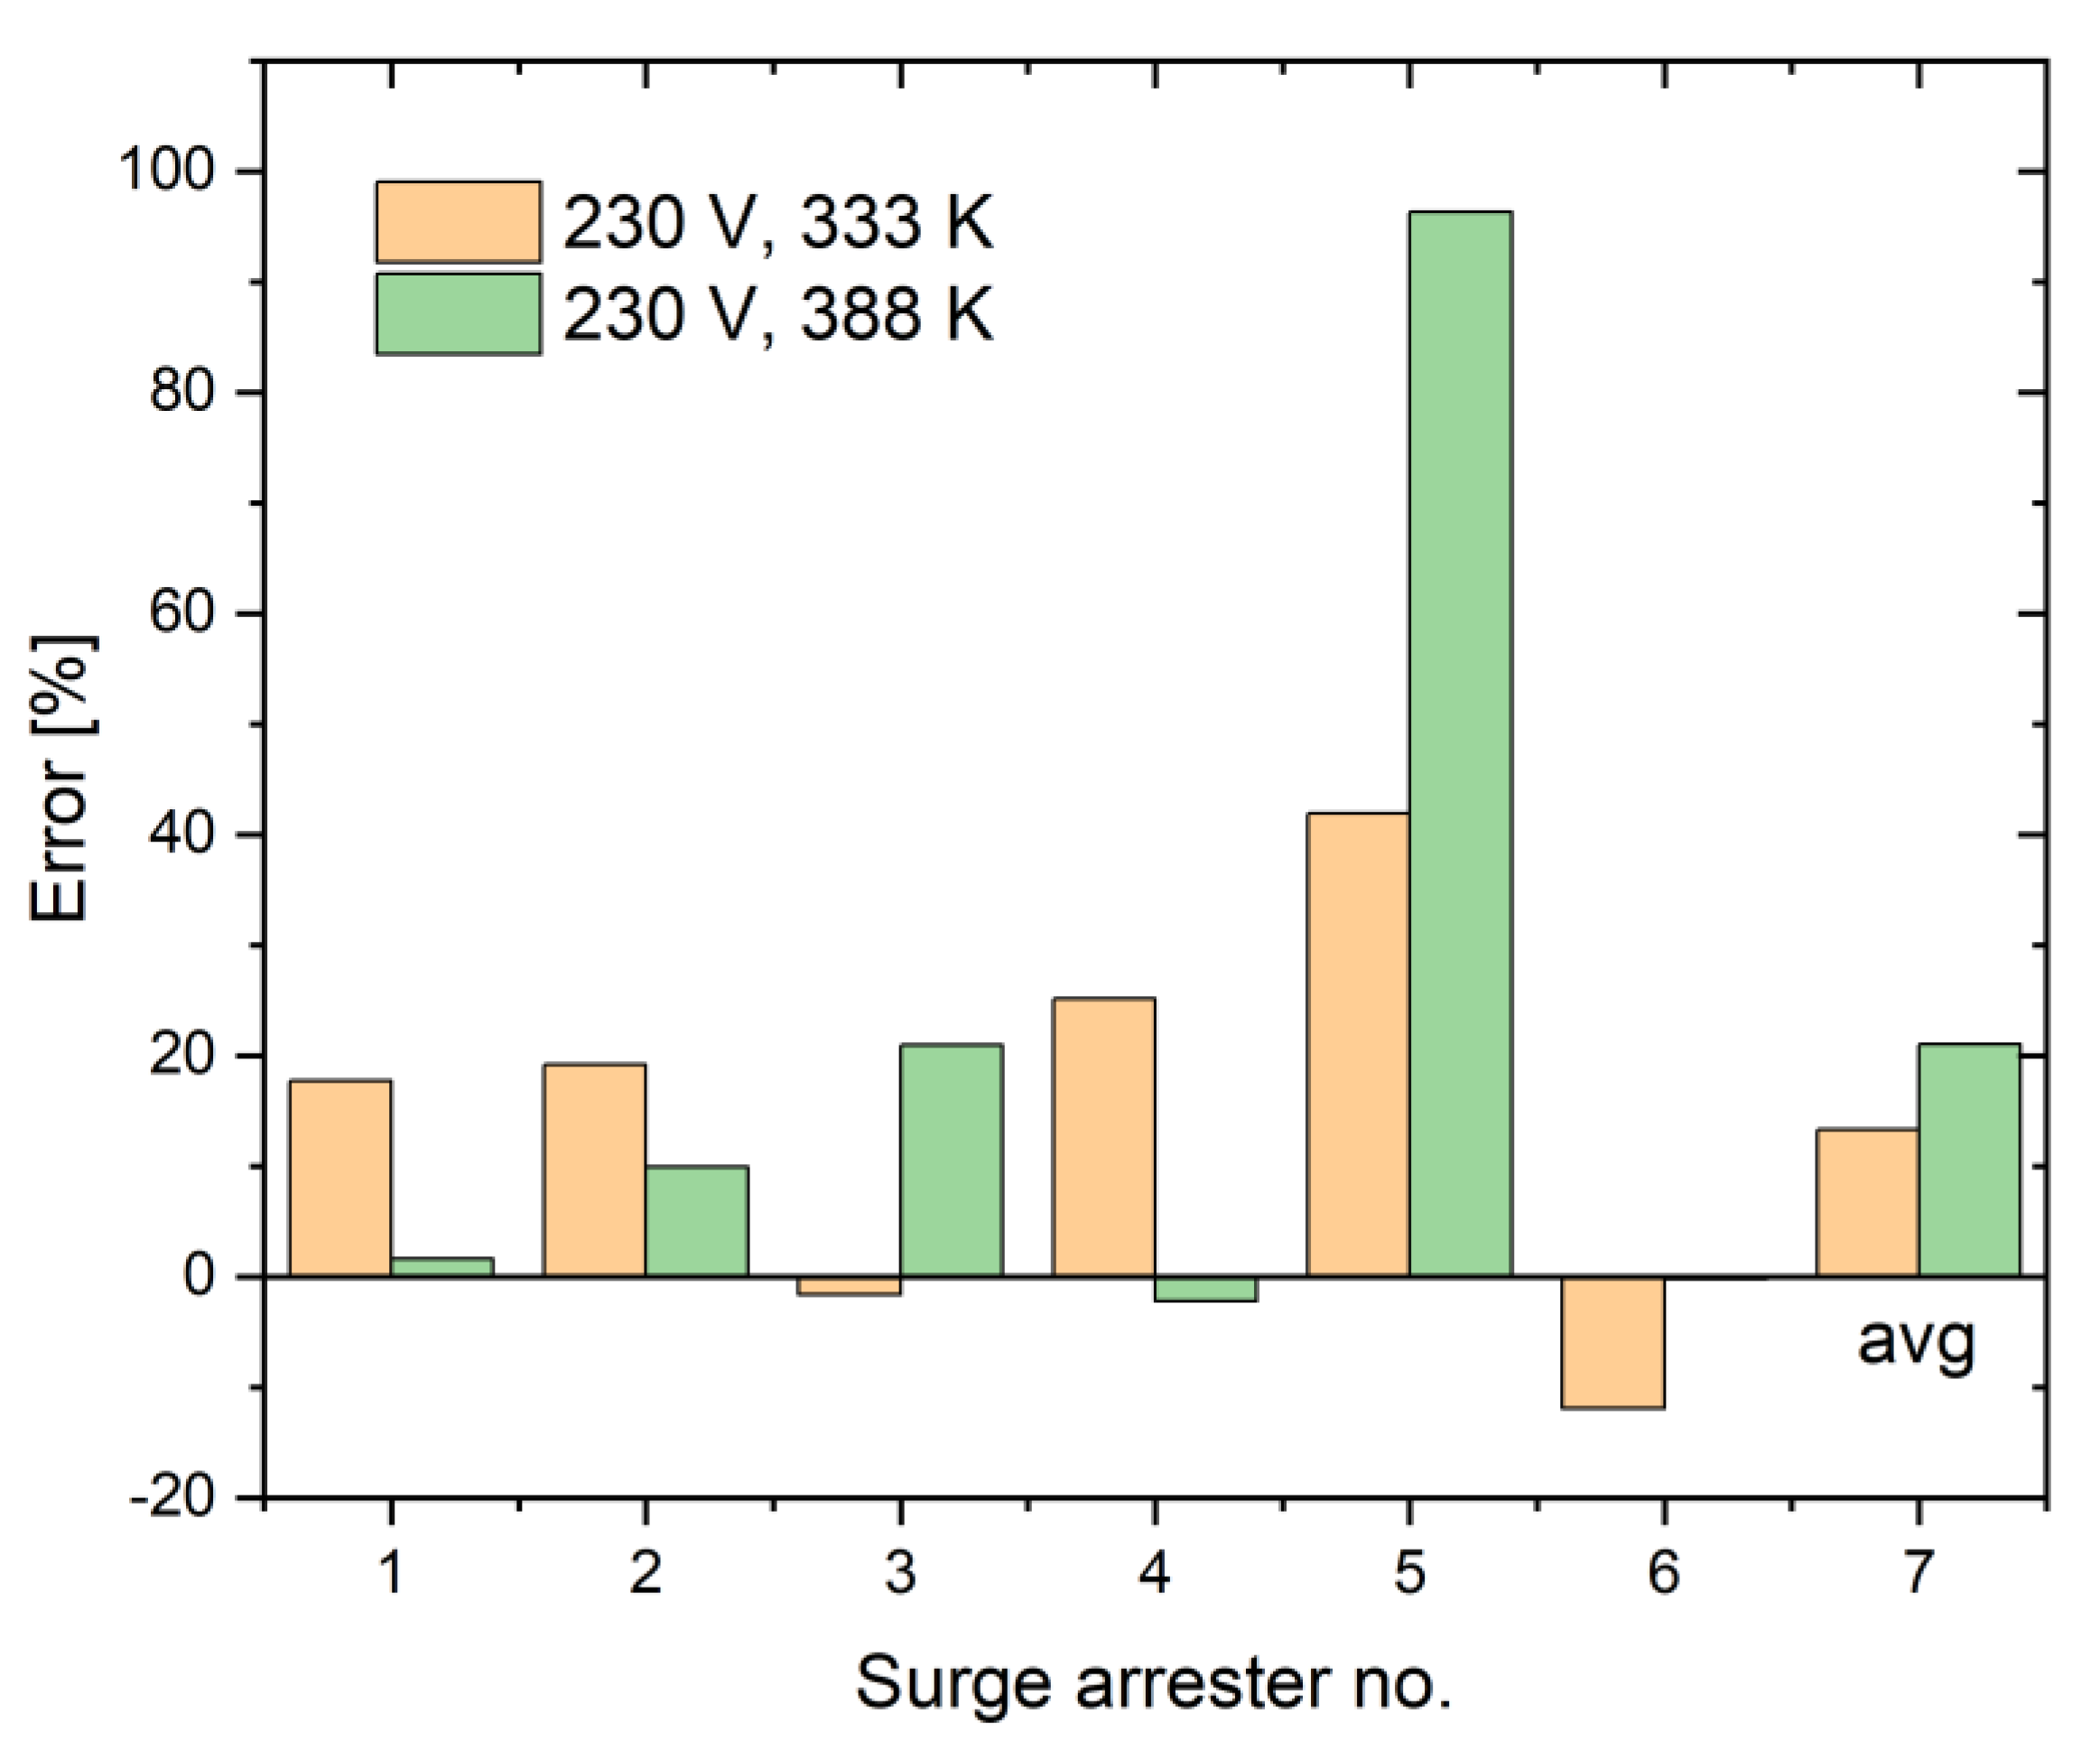
Error in determining the active component δIR and the capacitive component δIC for individual surge arresters on the basis of taking into account the first harmonic of the leakage current.
Figure 29.
Error in determining the active component δIR and the capacitive component δIC for individual surge arresters on the basis of taking into account the first harmonic of the leakage current.
Table 1.
Results of measurements and calculations of characteristic values of the leakage current for arrester no. 4.
Table 1.
Results of measurements and calculations of characteristic values of the leakage current for arrester no. 4.
| |
Test stand A |
Test stand B |
| Leakage current parameter |
U=77 kV
THDU 13% |
U =96 kV
THDU 11% |
U =77 kV
THDU 21% |
U =96 kV
THDU 18% |
| Peak value Imax [µA] |
678,8 |
1021,9 |
948,9 |
1328,5 |
| Average value Iavg [µA] |
408,4 |
597,8 |
491,1 |
779,0 |
| Harmonic content Ih [µA] |
171,5 |
308,1 |
415,2 |
510,4 |
|
p1
|
0,60 |
0,58 |
0,52 |
0,59 |
|
p2
|
0,25 |
0,30 |
0,44 |
0,38 |
|
p3
|
0,42 |
0,52 |
0,85 |
0,66 |
|
IR [µA] |
43,6 |
247,18 |
172,36 |
408,17 |
