Preprint
Article

Unravelling the Formation Mechanism of Sustainable Underground Pedestrian Systems: Two Case Studies in Shanghai

Altmetrics

Downloads

104

Views

23

Comments

0

A peer-reviewed article of this preprint also exists.

This version is not peer-reviewed

Submitted:

30 June 2023

Posted:

30 June 2023

You are already at the latest version

Alerts
Abstract
The development of subterranean non-motorized traffic infrastructure, commonly referred to as the underground pedestrian system (UPS), has become increasingly necessary in densely populated megacities worldwide as a means of advancing the Sustainable Development Goal 11, which aims to promote sustainable cities and communities. To improve the overall spatial performance, it is imperative to decipher the fundamental formation mechanism of sustainable underground pedestrian systems (SUPS) that is simultaneously influenced by spatial morphology and pedestrian behaviors. Thereby, two representative case studies, namely Wujiaochang UPS and Loushanguanlu UPS located in Shanghai, were selected for an in-depth investigation. This study employed correlation and regression analysis to examine the impact of spatial configuration variables and spatial attribute factors on pedestrian flow distributions in distinct SUPSs. The findings indicate that the variables of Betweenness, as measured by both Euclidean and Angular metrics, along with the presence of metro station locations and commercial space connected by UPS, are the three most significant factors influencing pedestrian behaviors in both scenarios. The disclosure has been made that Wujiaochang UPS is seamlessly integrated into a comprehensive three-dimensional pedestrian network both above and below ground. On the other hand, it appears that Loushanguanlu UPS exhibits a greater degree of self-sufficiency as an underground system. This study aims to elucidate the mechanism underlying the development of SUPSs, thus offering effective guidance for the implementation of three-dimensional walking systems in cities that prioritize sustainability.
Keywords: 
Subject: Social Sciences  -   Geography, Planning and Development

1. Introduction

Underground pedestrian system (UPS), which connects urban transportation infrastructures, retail complexes, department stores, and office buildings via underground corridors or commercial streets, is a comprehensive and integrated way for urban underground space (UUS) utilization [1,2,3,4,5]. UPS development aligns well with the United Nation’s Sustainable Development Goals (SDGs), particularly Sustainable Cities and Community (SDG 11), which seeks to make cities and human settlements inclusive, safe, resilient, and sustainable. UPS contributes to the construction of a more compact, walkable and sustainable megacity [6,7,8,9,10,11], improves urban resilience during catastrophic events [12,13], acts as a critical catalyst during urban regeneration [14,15,16,17], and reduces accidents caused by pedestrian-vehicle collision [18,19]. By creating a climate-controlled environment for all-weather urban activities, UPS provides additional public space for walking and resting in densely and intensively developed urban centers, which is widely applied in metropolitans such as Montreal [20], Singapore [21], Osaka [22], Hong Kong [23] and Shanghai [24,25]. In high-density cities such as Hong Kong [23] and Seoul [26], UPS involving both public underpasses and its connected private building basements grows larger and more complicated as UUS utilization increases. It interacts simultaneously with underground rail transit systems and simultaneously interacts with the street network aboveground to create a multidimensional urban public transportation system and a city that is compact and walkable.
In addition to the previously mentioned external contribution of UPS development to urban sustainability, this study will probe into the internal sustainability of UPS, i.e., the formation mechanism of sustainable UPS (SUPS). As a crucial component of a three-dimensional pedestrian network in a compact urban environment, the foremost indicator of a SUPS should be its spatial performance as measured by pedestrian mobility [27,28]. Regarding the formation mechanism, urban planners and architects tend to determine the underlying relationship between spatial performance and spatial morphology of UPS, which is the basis of the sustainable design of UPS.
UPSs typically have an uneven distribution of pedestrian flow. Some underground pathways are overcrowded and popular for pedestrians, whereas others have fewer users [10]. Furthermore, some UPSs are well designed, whereas others have poor operations and few pedestrians. The spatial morphology is a crucial consideration for urban sustainability [29,30]. As elaborated by Schwander et al (2012) [31], space is not homogenous. Socioeconomic activities and UUS development are likely to correlate to spatial morphology [32,33,34,35,36]. Previous research has demonstrated that network configuration and attractor distributions can influence simultaneously pedestrian movement patterns on the street [37,38,39]. To explain observed pedestrian flow rates, space syntax theory and the morphological measures such as integration and choice by a restricted radius are typically applied. It was discovered that pedestrians prefer to choose simple routes with the Euclidean shortest paths and angular shortest paths [38,40,41]. In addition, researchers confirmed that walking behaviors are jointly influenced by spatial attributes and conventional space configuration properties measured by space syntax. Chang & Penn (1988) employed movement attractors and generators to modify the conventional spatial configuration model [42]. Bhlla & Pant (1985) and Kang (2017, 2018) verified the positive relationship between pedestrian behaviors and urban land use characteristics, bus stop or metro station locations, and destination density for both the skywalk system and ordinary ground street network [43,44,45].
With development of compact city concepts and UUS utilization, numerous researchers have centered their attention on the pedestrian behaviors of UPSs within the entire three-dimensional network [46]. Similar to studies on street networks, spatial configurations are typically regarded as a significant factor in pedestrian distributions. Zacharias (2000) tested the relationship between UPS network integration and pedestrian density of Montreal UPS by means of regression analysis [47]. The result indicated that walking patterns are only weakly related to variables of the single-level (UPS level) configuration and Montreal UPS is not a self-contained walking system without ground networks. Moreover, observation of pedestrian flows in Tsim Sha Tsui UPS (Hong Kong) and its ground street network revealed a relationship between underground and ground walking systems to the pedestrian distribution in Hong Kong [23,48]. Zhuang et al (2014) proposed that conventional two-dimensional space syntax properties with factors such as vertical transition, vertical types, and floor levels can produce a more accurate regression results for pedestrian flows in a multilevel pedestrian network [49]. Recently, numerous underground or aboveground corridors of privately owned buildings have been integrated into a comprehensive public walking system as part of the construction of a three-dimensional walking network. Zhang & Alain (2019) conducted research on walking systems in Central Hong Kong and found that the variable of Betweenness within a combination of indoor and outdoor three-dimensional pedestrian network can better decode pedestrian activities and the spatial configuration [50]. Cui et al (2015) examined pedestrians via questionnaires in three UPSs in Shanghai, revealing that metros and commerce districts are two vital factors influencing UPS usage [24]. Most of the user destinations are retail locations associated with or within UPSs.
In conclusion, studies on single-level pedestrian networks (typically street networks) demonstrate that spatial morphological factors, such as spatial configuration and spatial attributes, can significantly influence walking behaviors and route selections. Moreover, it is revealed that pedestrian flows may be affected simultaneously by underground and aboveground networks, making a complete three-dimensional system more appropriate for spatial configuration analysis. Existing studies of regression analysis for pedestrian behavior, however, have been limited to specific cases, such as UPS in Montreal. There lacks quantitative analysis in densely populated urban built environment such as Chinese megacities. Also, the definition and selection criteria for a SUPS remains unclear, exerting substantial difficulties to decipher the formation mechanism of SUPS in distinct scenarios [24]. The subsequent question should be whether the analysis of UPS in China can still achieve a similar conclusion as in western countries, and if so, how to select the most appropriate metrics and variables of network spatial configurations and attributes to quantitatively identify the formation mechanism of a SUPS. In addition, it is essential to understand the relationship between a complex UPS and an urban street network to determine whether UPS truly interacts with ground street network to form a sustainable three-dimensional walking network.
In conjunction with the rapid development of metro systems and urban revitalization projects in Chinese cities in recent years, UPSs have been extensively constructed. Among these cities, Shanghai is the most representative regarding SUPS development. In this study, Wujiaochang UPS and Loushanguan Road UPS in Shanghai were selected as two typical cases of SUPSs in distinct scenarios. The first scenario is representative of integrated underground space planning. The latter is fully implemented under urban revitalization. In this study, the selection criteria of SUPS, outlines of two selected cases, and data sources are presented in Section 2. Section 3 illustrates fundamental analysis procedure and variables as the methodology, along with the results and discussion in Section 4. Conclusions are finally drawn in Section 5.

2. Data and Materials

2.1. Screening selection criteria of SUPS

To probe into the formation mechanism of SUPS, it is a prerequisite to define a SUPS accurately. As depicted in Section 1, the development of UPS typically aligns with the primary goals of SDG 11, thus making cities and human settlements more inclusive, safe, resilient, and sustainable. To this end, we set out to propose an explicit selection criterion for SUPS from the perspective of interior sustainability. Based on a thorough and holistic inspection on SDG 11, we ultimately selected two sub-goals that are most relevant to the interior sustainability of UPS as follows.
  • By 2030, provide access to safe, affordable, accessible and sustainable transport systems for all, improving road safety, notably by expanding public transport (SDG 11.2).
  • By 2030, provide universal access to safe, inclusive and accessible, green and public spaces (SDG 11.7).
We further interpreted these two SDG sub-goals into the screening selection criteria of SUPS. Firstly, a SUPS should be closely integrated with the surrounding public transports such as bus stops and metro stations. Secondly, a SUPS should act as a critical component of public activity spaces. Thirdly, a SUPS demands necessary spatial scale to form a three-dimensional walking system, and the corresponding spatial performance of SUPS measured by pedestrian flow should be superior to increase the overall beneficiaries of sustainable development.
Following the selection criteria of SUPS, we preliminarily determined 96 SUPSs in Shanghai, with all chosen cases interconnected to the surrounding metro-led underground space. To enhance the representativeness of the selected cases, we further strengthened the selection criteria regarding spatial scale and public activity spaces. According to Shanghai Master Plan 2017-2035, which is the latest and most important master planning in Shanghai, there is a hierarchical public activities center system, comprising of city center, city sub-center, local center, and community center. To jointly consider the spatial scale and the hierarchy of public activities center system, we reserved those SUPSs located in city center or city sub-center with a metro-led underground space over 70,000 m2. As shown in Table 1, there were 10 satisfactory SUPSs after two rounds of selection, and almost all of them receive good reputation from various media with regard to their spatial design and spatial experience.
Due to the tremendous labor cost of recording pedestrian flow in SUPSs, we had to reduce the size of selected cases again. For the third round of selection, we invited eight scholars, six planners, and five architects to form an expert team. All experts have at least five years of professional experience in UPS development, and they were asked to select only two cases from the aforementioned ten SUPSs. Based on the concrete materials of SUPSs provided by us, the experts need to make cautious decisions to determine the most representative SUPSs, with a holistic consideration of various factors concerning planning mode, service effects, and design quality. Ultimately, Wujiaochang UPS and Loushanguan Road UPS, which are the top two frequently chosen cases, were selected as the final representative SUPSs in Shanghai for subsequent case studies.

2.2. Outlines of study cases

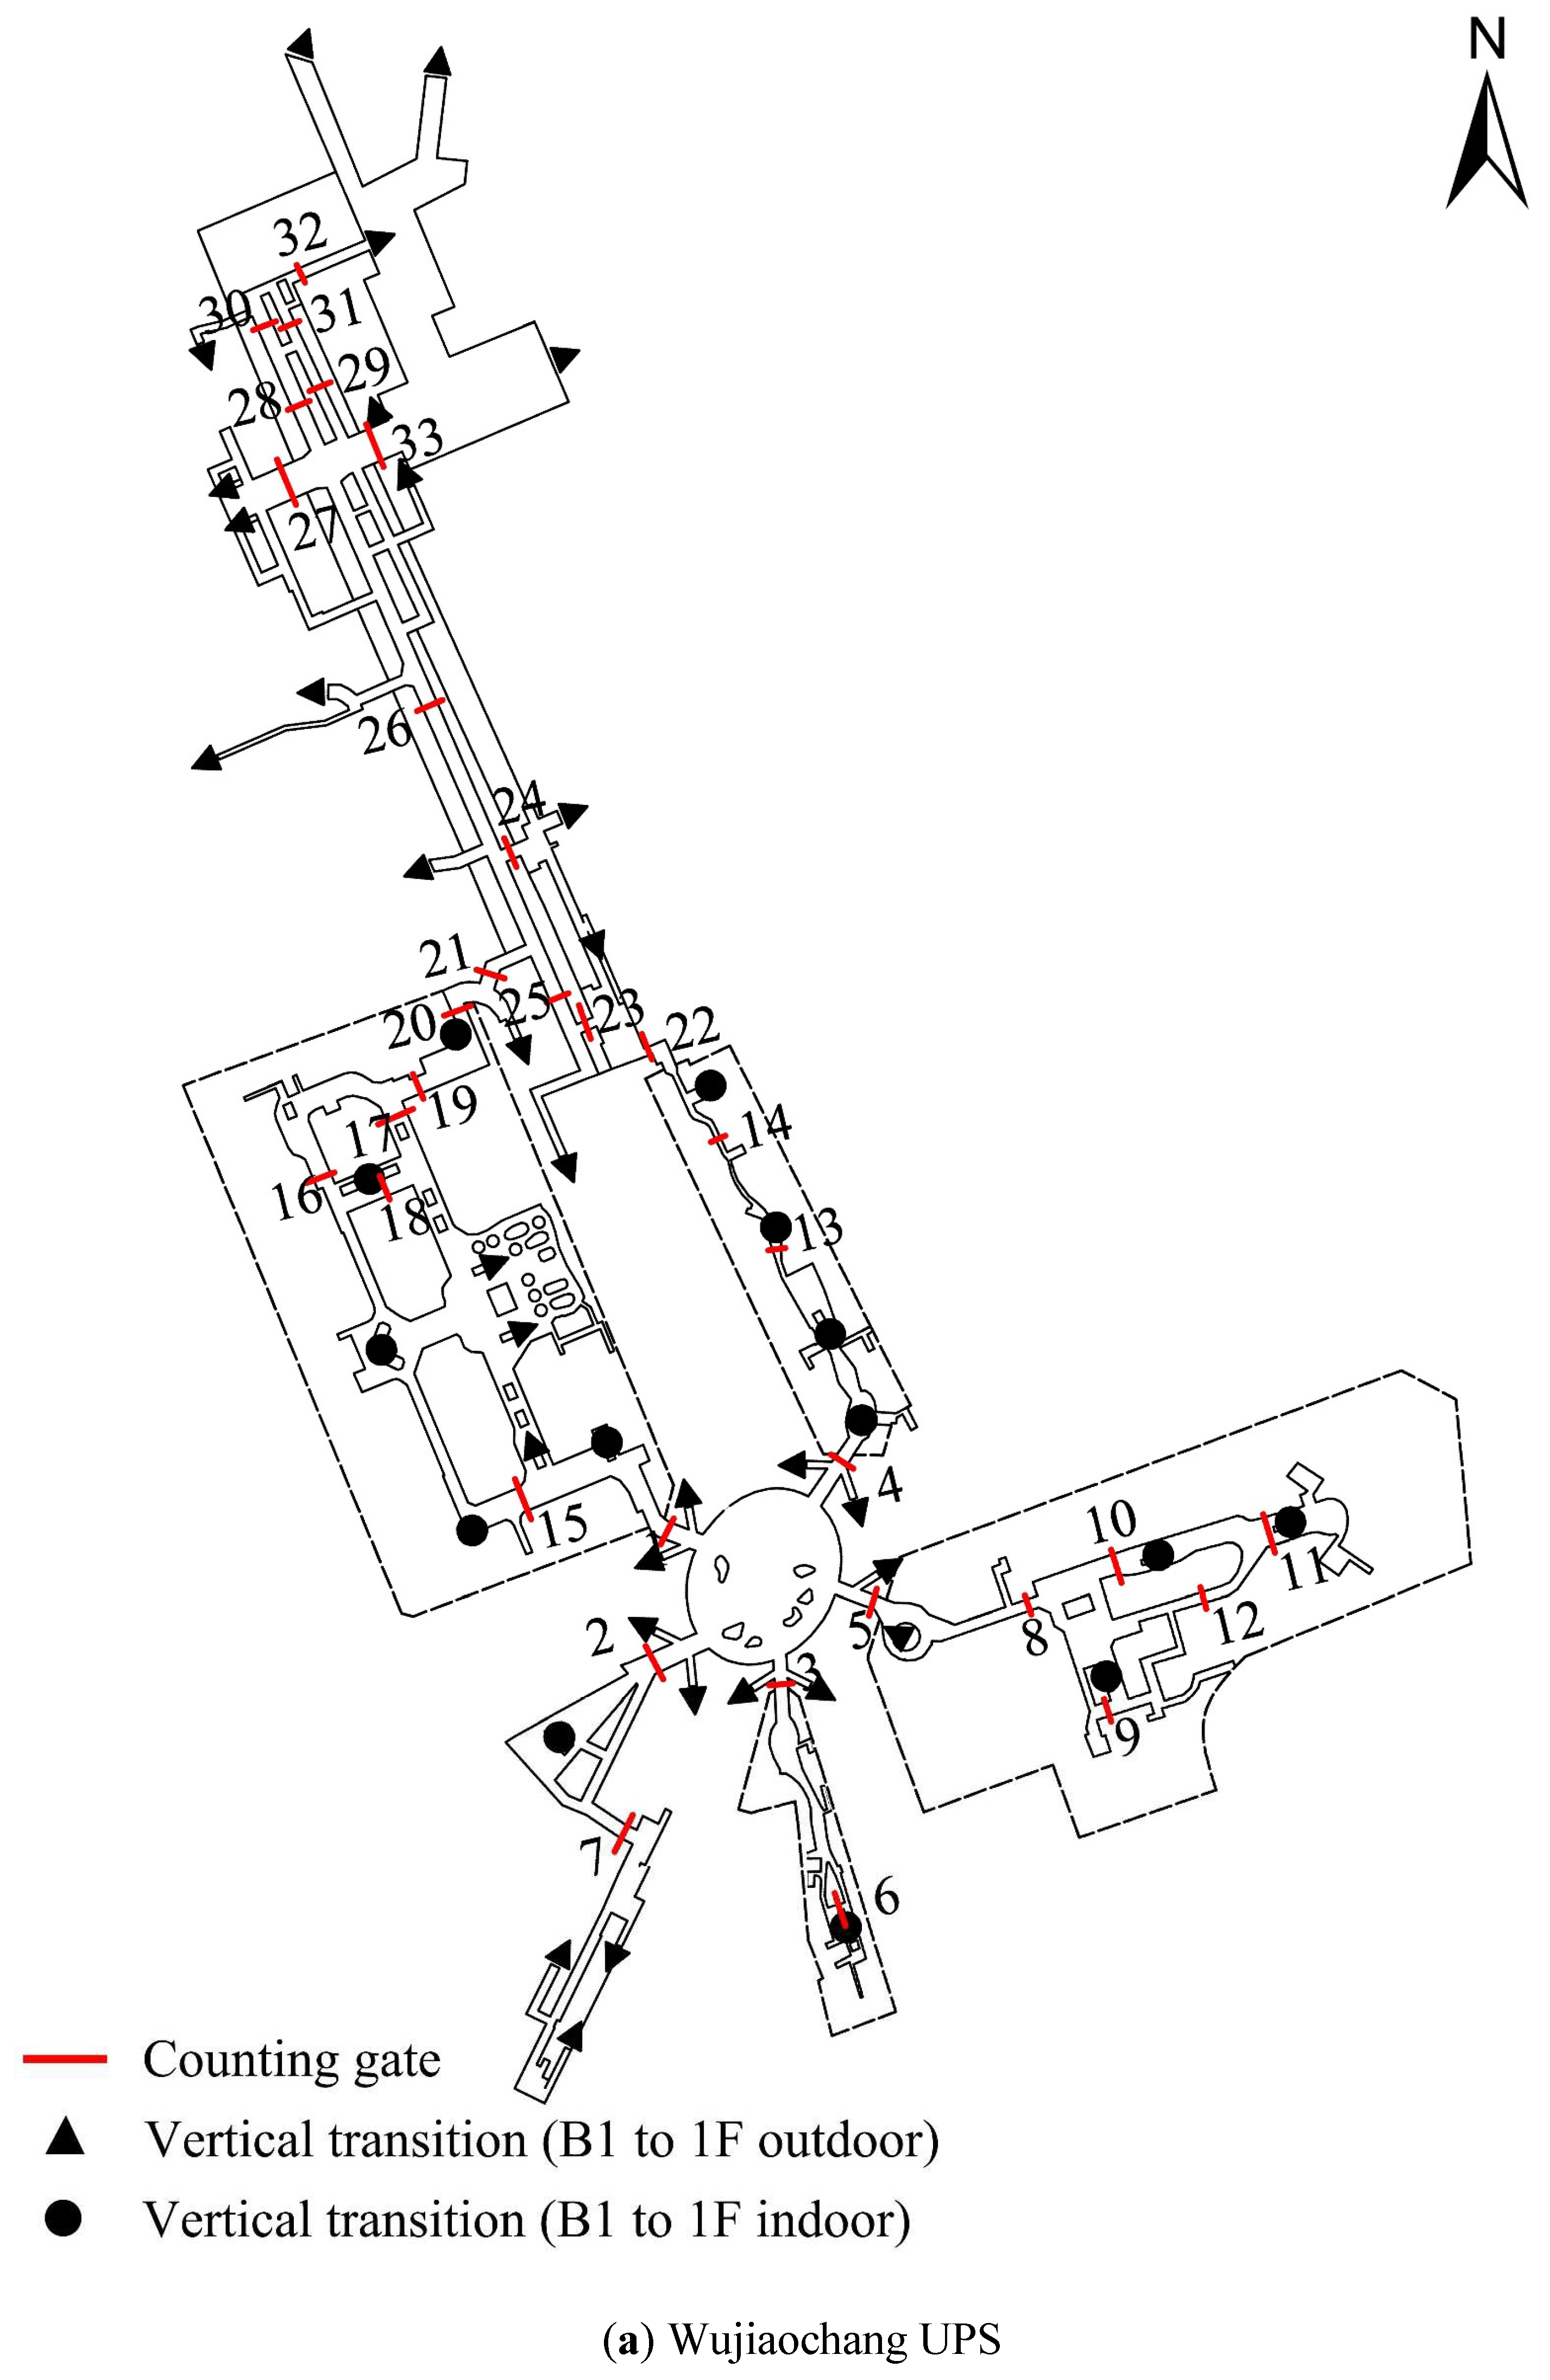
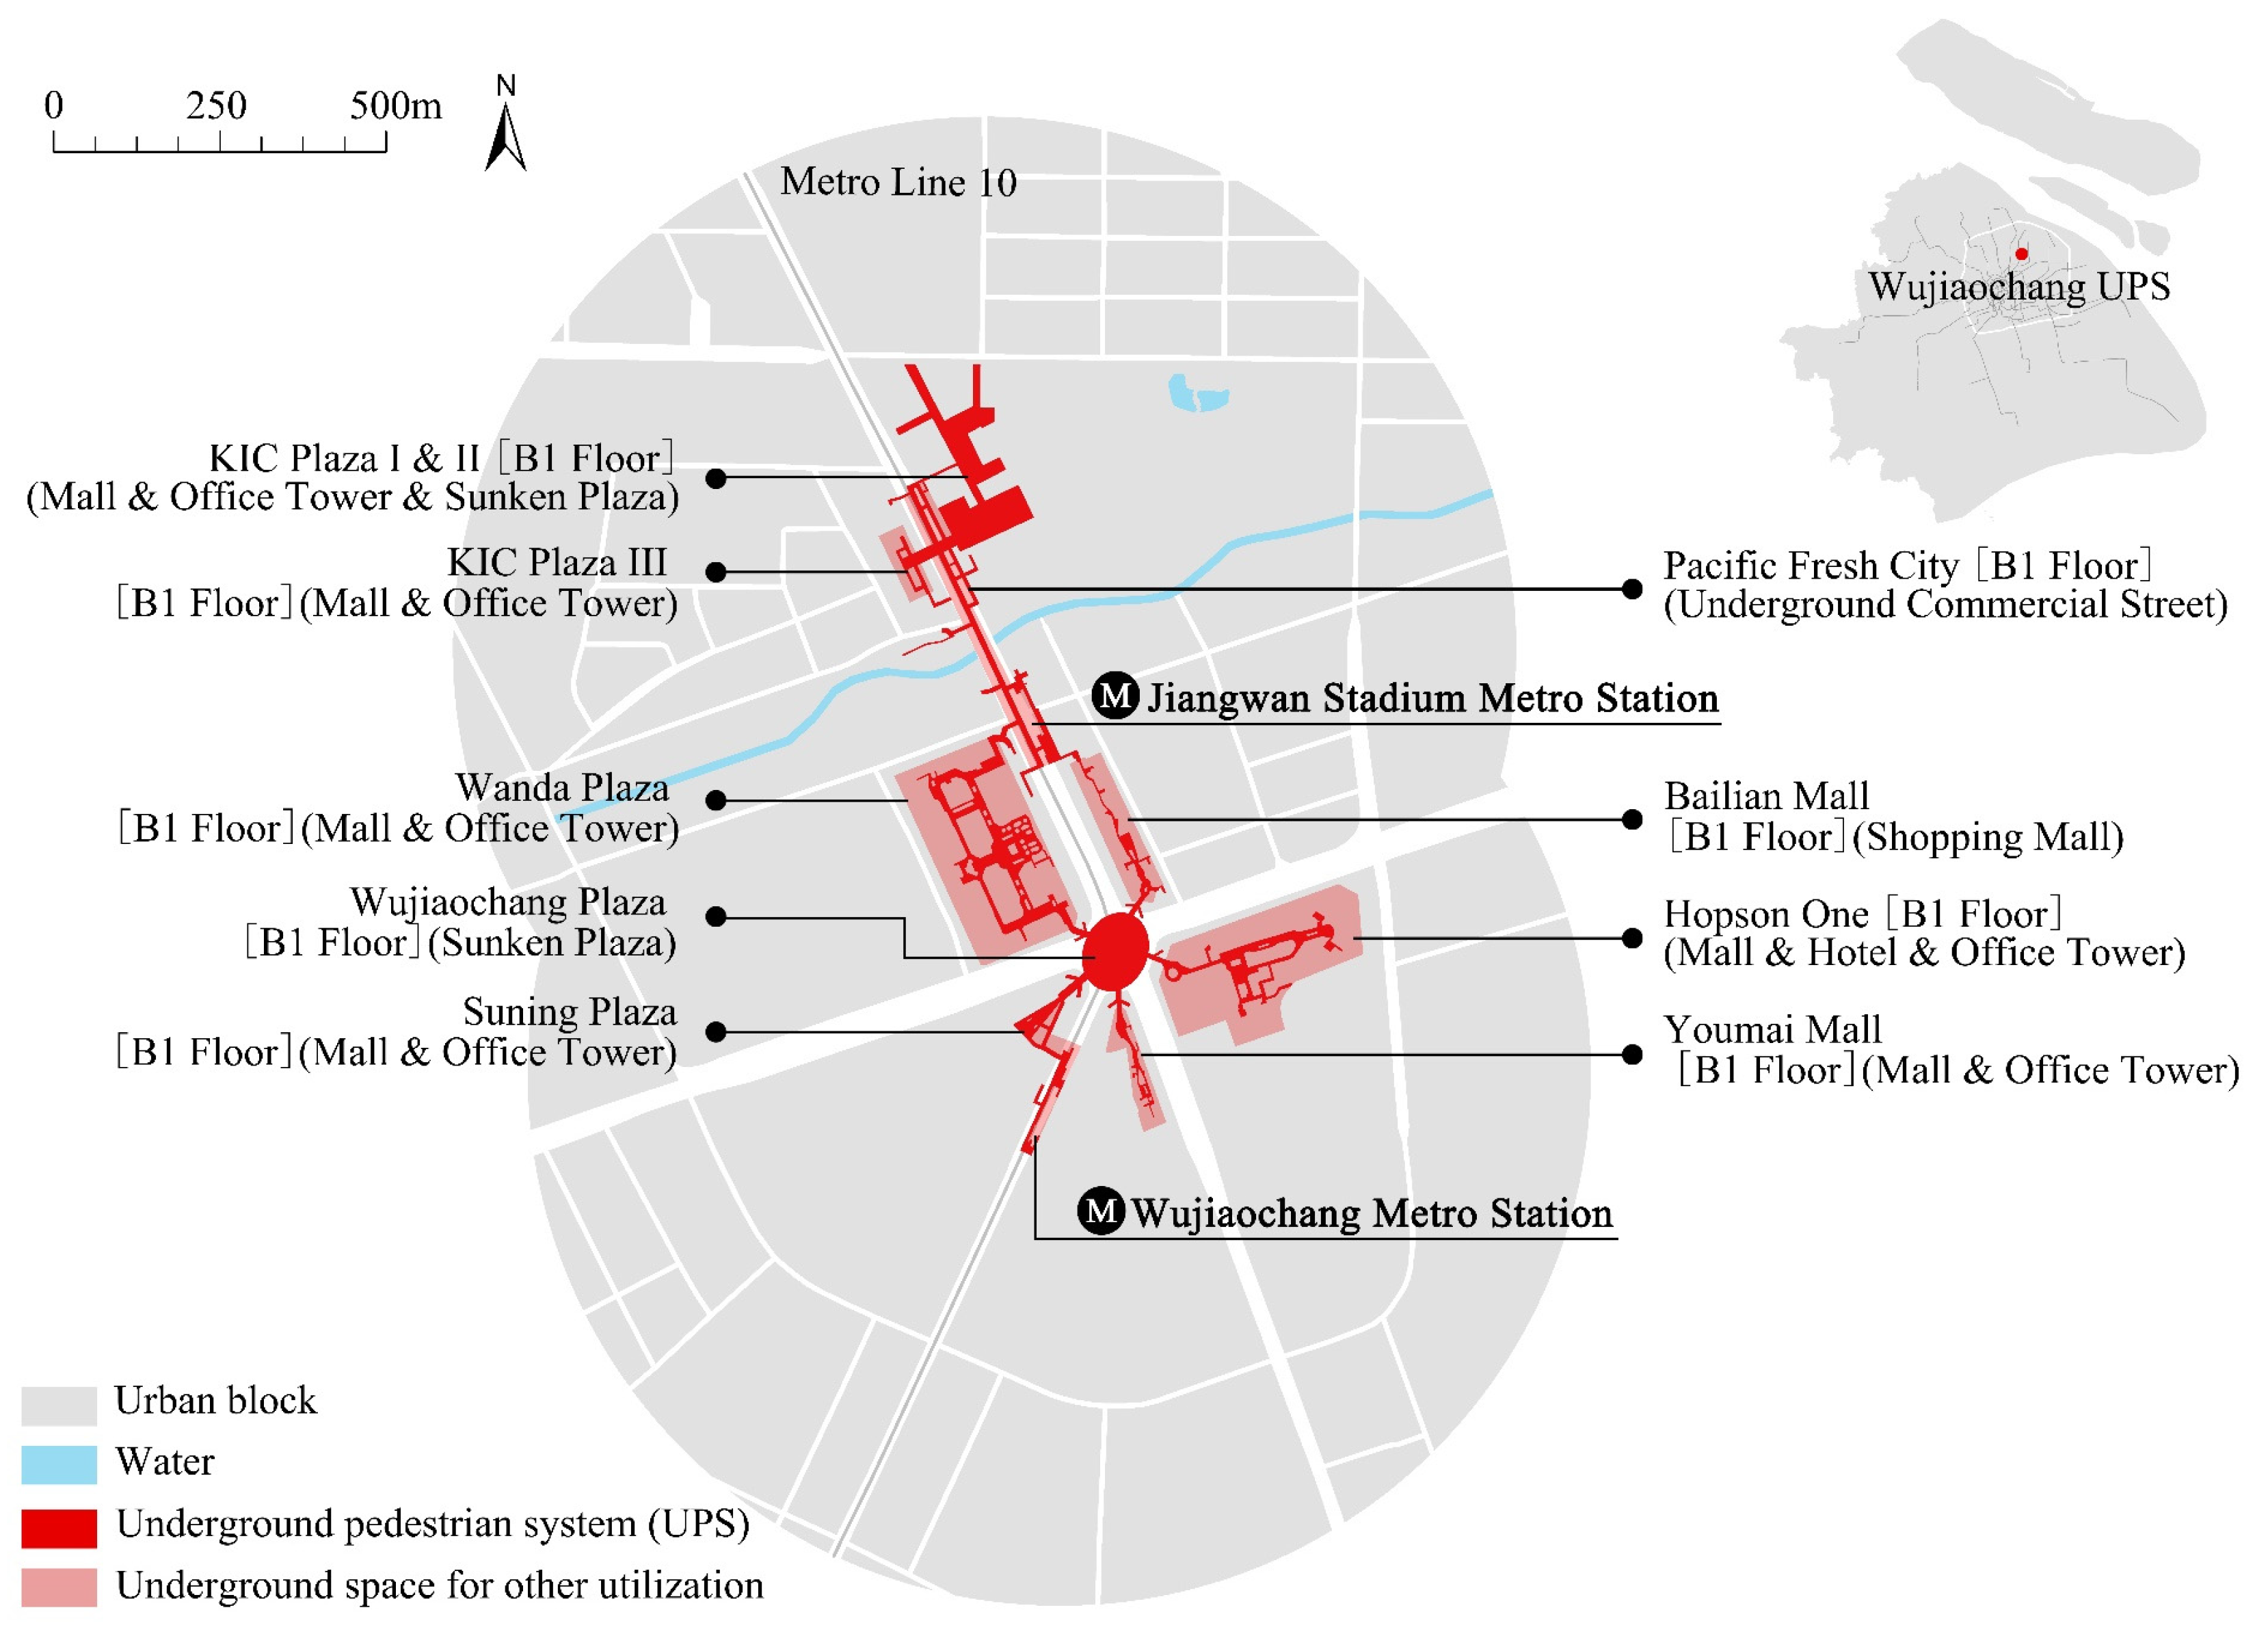
As shown in Table 2, Wujiaochang UPS is located in the core area of Jiangwan-Wujiaochang Sub-center in Shanghai with a total walking area of over 72,000 m2. As depicted in Figure 1, it connects two metro stations (Wujiaochang Station and Jiangwan Stadium Station), two sunken plazas (Wujiaochang Plaza and KIC Plaza I & II), one underground commercial street (Pacific Fresh City) and seven urban complexes or shopping malls on the B1 floor. The Implementation of Wujiaochang UPS constituted the majority of sub-center’s comprehensive planning for UUS from 2005 to 2017 [51]. The primary objective of the UPS planning is to make the sub-center more walkable and connect urban blocks separated by five wide arteries on the ground.
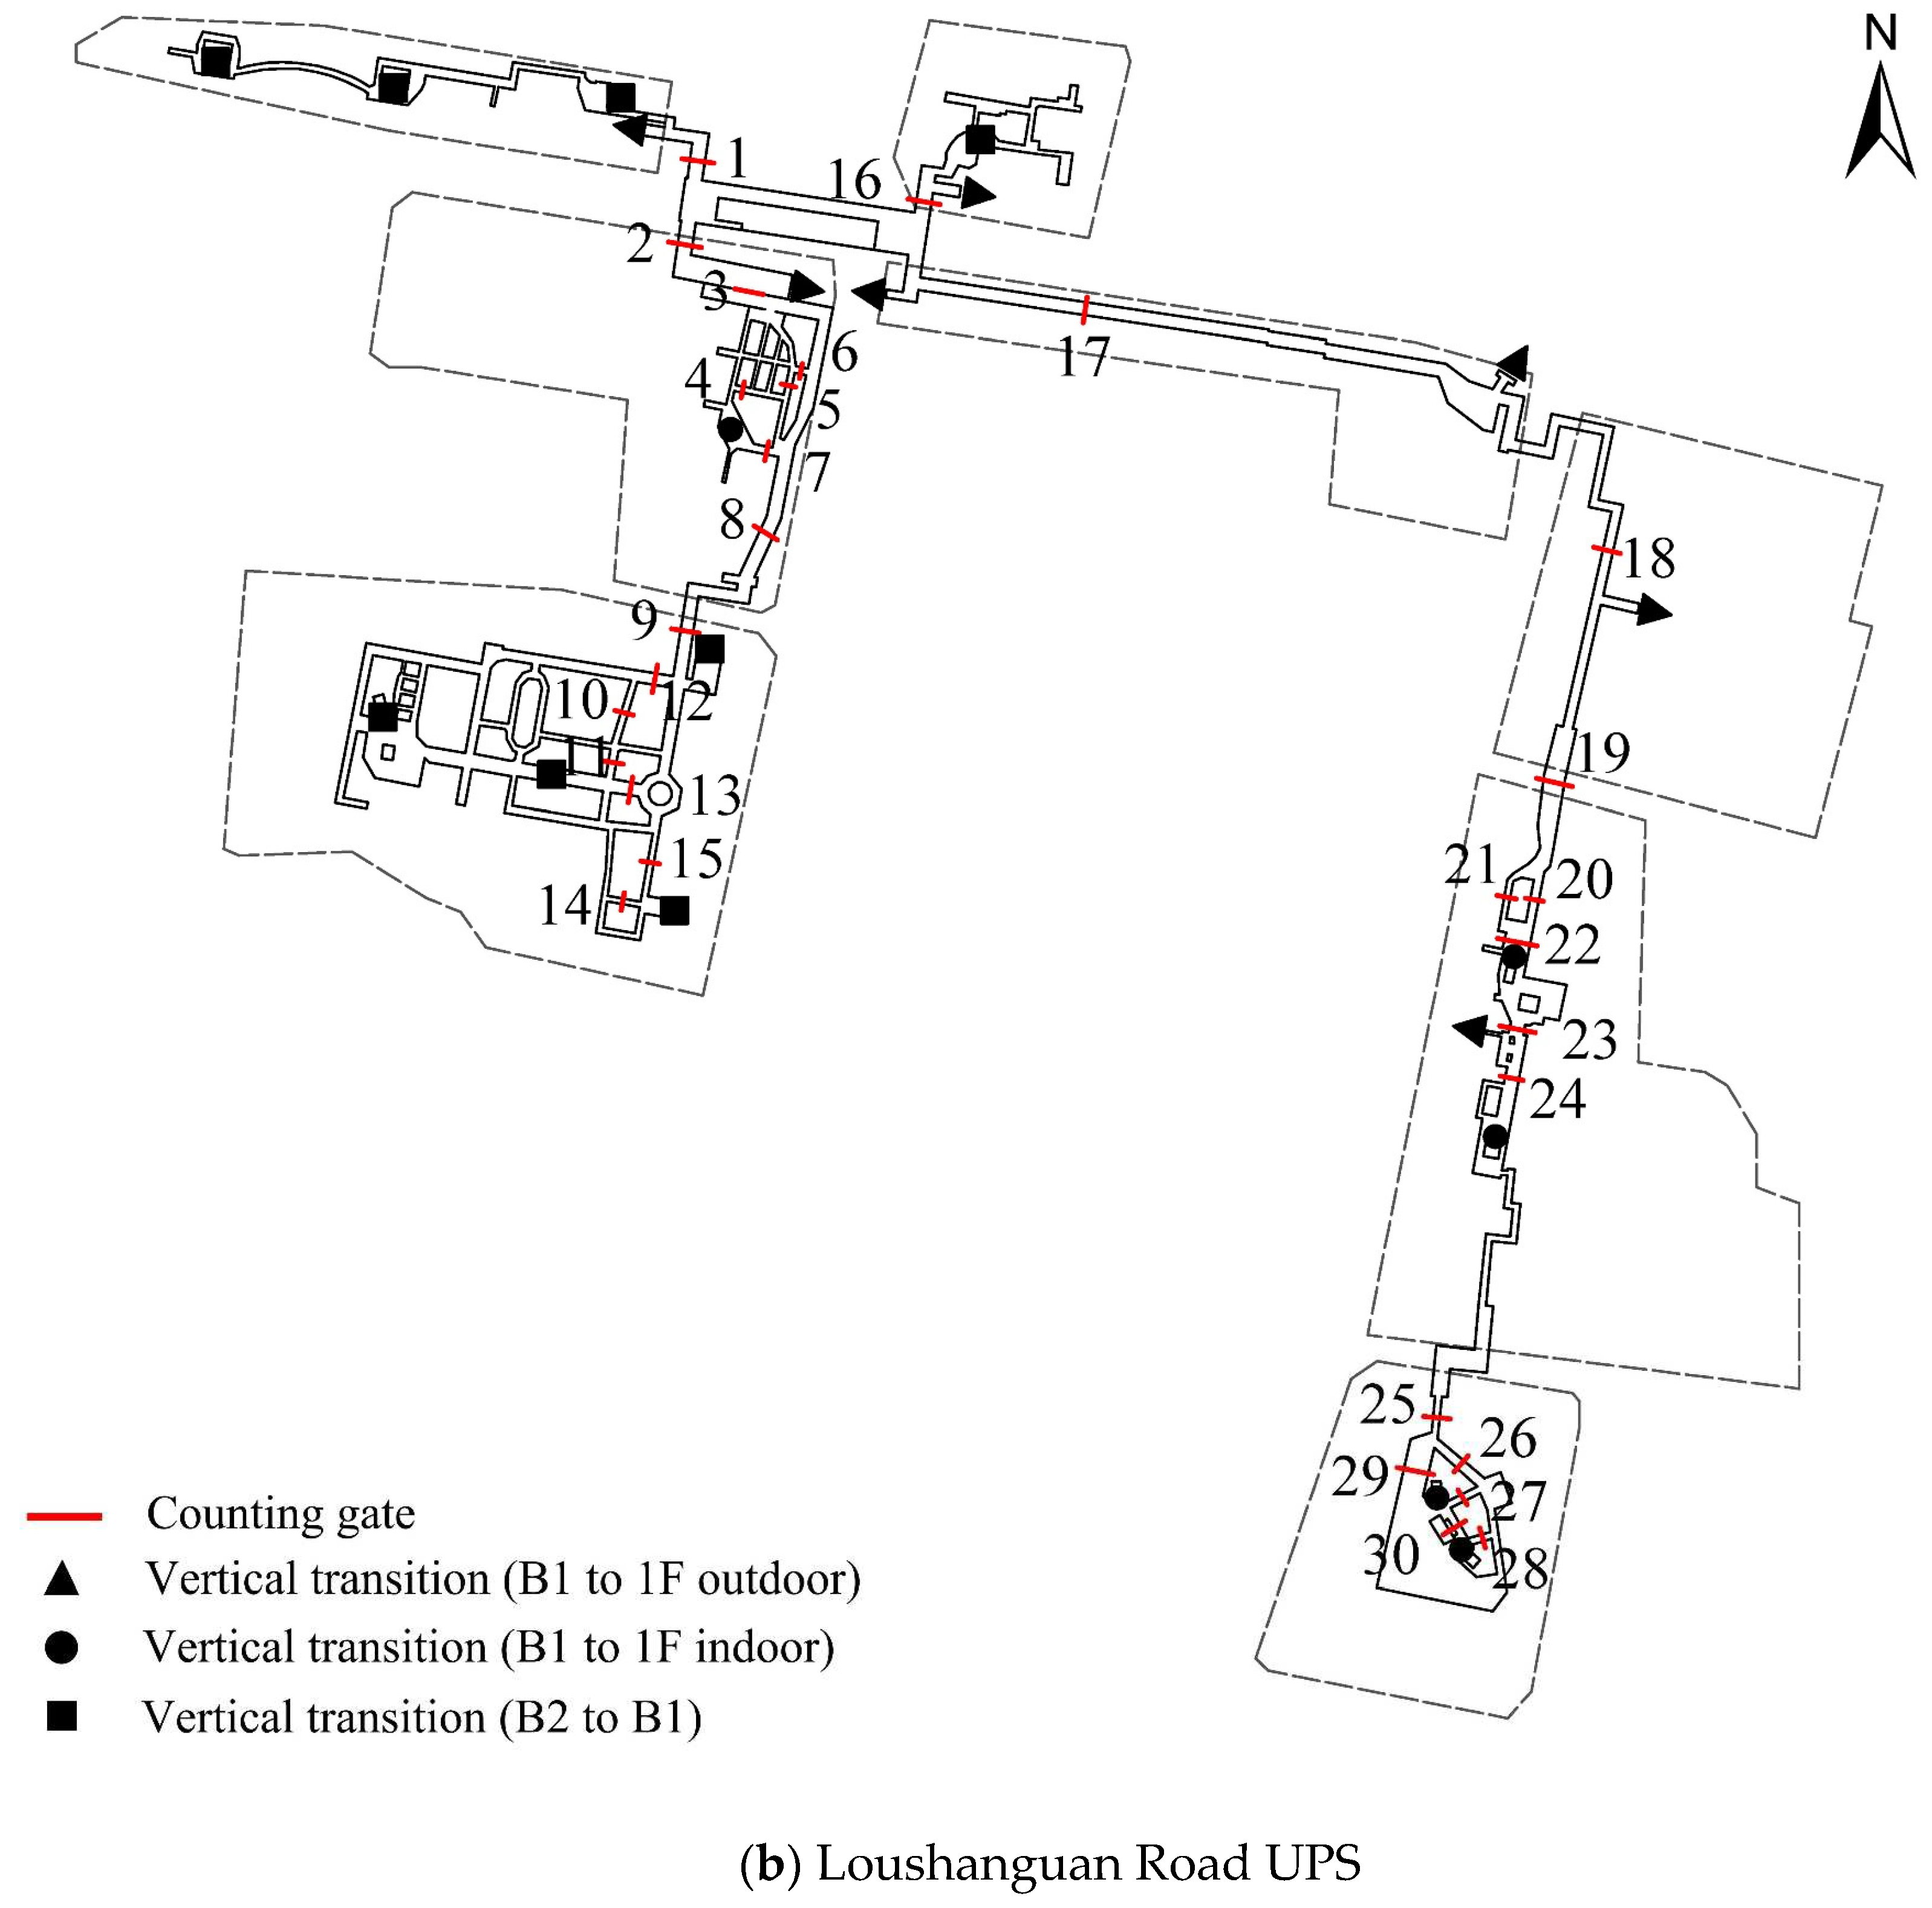
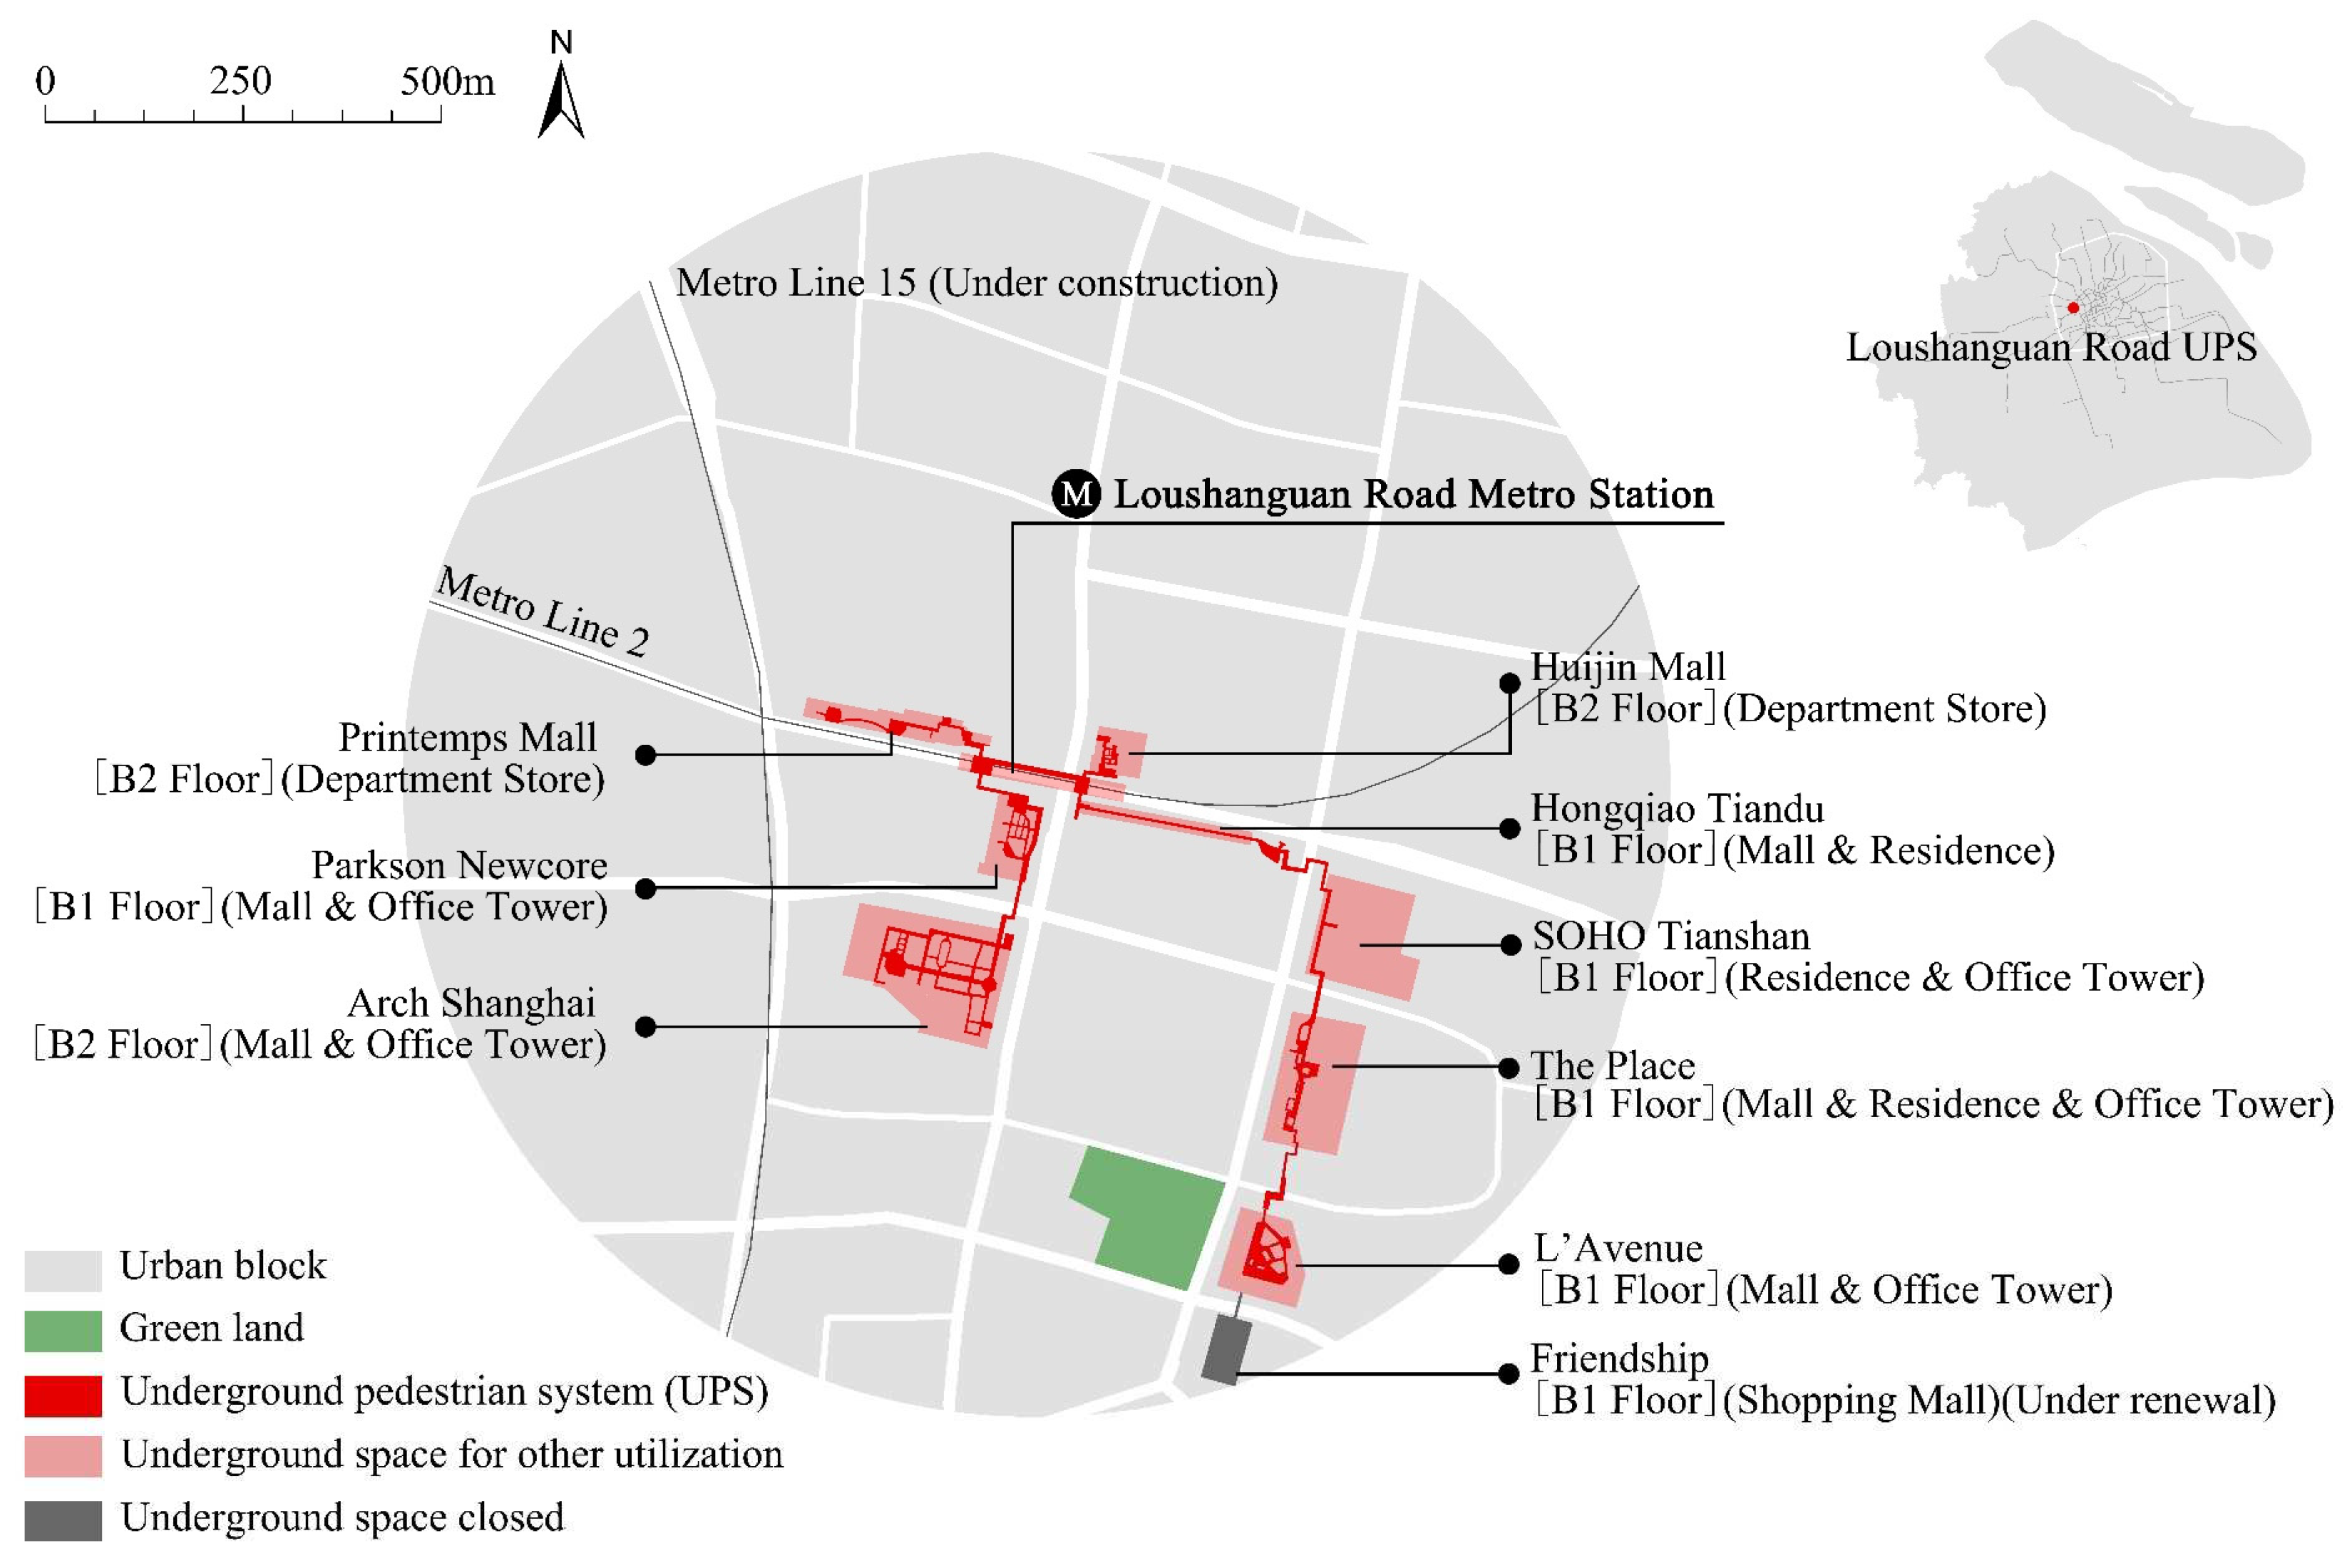
As depicted in Figure 2, Loushanguan Road UPS is located in Hongqiao Commercial Area and is a newly planned and built UPS based on the local urban regeneration project from 2015 to 2019. The area to the south of the Loushanguan Road Metro Station is dotted with shopping centers and complexes. The UPS plan aims to integrate them and create a walkable and accessible urban complex in order to improve the shopping experience for pedestrians and customers. Five newly constructed underpasses connect the metro station to nine shopping malls or complexes along Loushanguan Road UPS. Importantly, 84% of the approximately 31,000 m2 of total public walking space is the indoor walking space of the connected building basements owned by the private sector but accessible to the public. UPS connects different levels of existing buildings, including the B1 and B2 floors, due to the varying basement elevations of existing structures.

2.2. Data sources

2.2.1. Three-dimensional walking network

Two types of three-dimensional walking networks were established. The first only consists of the UPS and its associated UUS network, which is the Underground Network (UN). The second is the Entire Network (EN), which consists of the UN and surficial indoor and outdoor walking routes within an 800m buffer zone. The authors have rectified the raw walking networks from Open Street Map data (www.openstreetmap.org) to formulate a subtle model. Pedestrian routes and vertical transitions such as escalators and stairwells were mapped as center lines and intersections using a technique proposed by Cooper et al (2018) [39].

2.2.2. Location data

There are two types of location data, namely the transportation location and points of interest (POI) location. The former one includes locations of bus stops and metro stations. POI locations involve the data of local retail, catering, sports and recreation and life service information within the analyzing buffer specified in Section 2.2.1. All location data were retrieved from AMAP (www.amap.com), which is one of the leading online map service suppliers in China.

2.2.3. Floor area of commercial space

Internet inquiries were conducted to determine the floor area of commercial space that is connected to or in the UPS.

2.2.4. Pedestrian volume

In both SUPSs, pedestrian information was collected using the gate method. The number of pedestrians crossing a notional gate in both directions within a given time interval is counted as the movement dada [42,48]. 33 and 30 counting gates at underground corridors were selected in Wujiaochang UPS and Loushanguan Road UPS respectively, as shown in Figure 3. According to Zacharias’s study [47], rainy weather has a significant positive effect on pedestrian patronage of UPSs in Montreal so that the selected counting dates should avoid rainy days. Therefore, pedestrian counts were undertaken at 10:00 a.m. and 15:00 p.m. within 1.5 minutes on June 30th (Sunday) and July 10th (Wednesday) for Wujiaochang UPS in 2019 and October 6th (Sunday) and November 12th (Tuesday) for Loushanguan Road UPS in 2019. Moreover, the movement data collection also avoided the interference from the social distancing policies during COVID 19. Two SUPSs ultimately tallied 4968 and 1647 pedestrians, respectively. The average volume of pedestrian traffic at each counting gate is listed in Table 3.

3. Methodology

3.1. Analytical framework

3.1.1. Correlation analysis

The first step is to analyze the correlation between variables of spatial configuration and attribute and pedestrian volume of each SUPS in order to determine whether there exists a linear relationship within a statistical significance of 5%. Variables with no significant correlation should be eliminated prior to the subsequent regression analysis at the next step. On the other hand, correlations between pedestrian behaviors and configurational variables of the UN and EN models must be tested independently to determine whether the SUPSs in Shanghai are more self-contained systems or interconnected ones.

3.1.2. Linear regression analysis

The second step is to conduct linear regression analysis as expressed in the following Equation (1). Spatial configuration and attribute variables set aside in the first step are used as independent variables to test whether they influence pedestrian flows and to measure their effects on pedestrian flows based on partial correlation coefficients. Variance inflation factors (VIF) and the stepwise method are employed to identify multicollinearity and eliminate its side effect.
P i = β 0 + β 1 I V 1 + β 2 I V 2 + · · · + β n I V n + μ i
where Pi is pedestrian volume at counting gate i, β0 is the constant, β1 to βn are the estimated coefficients of each independent variable, IV1 to IVn are independent variables selected from the step one, μi is the error term of the regression model.

3.2. Spatial morphological measures

3.2.1. Spatial configurations

Spatial design network analysis (sDNA) simplifies urban streets and underground corridors into nodes and links with three-dimensional spatial information. It can be utilized to quantify the centrality, accessibility, and navigability of each space in three-dimensional network models [44,53,54,55]. In this study, spatial configuration variables including Betweenness and Closeness with defined radii and specific metrics of both the UN and EN models were selected by means of sDNA [56].
Betweenness reflects the through traffic potential of each underground corridor for pedestrians [57]. It measures the number of times the selected link lies on the shortest path via the selected metrics between other pairs of links within a scope of radii as expressed in Equation (2) [53]. The greater the Betweenness is, the greater the underground corridor's potential to attract through traffic. Closeness reveals the centrality or accessibility of each underground corridor in the whole walking network. In this study, Network quantity penalized by distance (NQPD) within a specific radius and selected metrics is employed as the variable of closeness as shown in Equation (3) [53]. It is calculated as the proportion of links divided by the distance between one link to any other links within the radius based on the selected metrics [44]. A greater NQPD indicates greater link accessibility.
B t M R = x N y R x P ( y ) O D ( x , y , z )
where BtMR means the Betweenness with metrics M and radius R; N represents the set of links in three-dimensional walking networks; Rx represents the set of links in the network radius R from link x; P(y) means the proportion of any link y within radius R, which is from 0 to 1 in continuous space; OD(x,y,z) means the shortest paths from link x to link z via link y based on metrics M.
N Q P D M R = y R x P ( y ) d M ( x , y )
where N Q P D M R means the variable of Closeness with metrics M and radius R; dM(x,y) represents the shortest paths form link x to link y within radius R based on metrics M.
In general, Angular metrics and Euclidean metrics are applied to the metrics of Betweenness and Closeness variables. Angular metric computes cumulative angular changes of pedestrians at corners and intersections, based on the premise that pedestrians prefer simple and direct routes over winding paths [31]. It reflects the cognitive difficulty inherent to navigation for individuals [40,41]. On the other hand, Euclidean metric measures meter-based length for pedestrian walking since people typically prefer shortest route to their destinations [44]. Underground spaces lack landmarks, and indoor mobile navigation systems are insensitive. In a large and complicated underground space, individuals with a poor sense of direction may become lost more easily. Additionally, previous research has demonstrated that people prefer shorter walking paths on the ground. This study employed both Angular and Euclidean metrics to test whether pedestrians can modify their walking patterns to enhance walking efficiency in SUPS and to determine which metric more accurately reflects pedestrian behavior.
Furthermore, influence scopes ranging from 400m to 800m were typically selected as analysis radii based on transit-oriented development (TOD) theory in previous studies [23,47,50,56]. Similarly, radii of 400m, 600m and 800m were applied respectively to test their effects in this study. All the selected variables of spatial configurations are listed in Table 4.

3.2.2. Spatial attributes

(1) Mean distance to metro stations (MDM)
Typically, metro stations construction is the impetus for UPS development. According to the previous research on UPS users in Shanghai, 68.2% of the people arrive at the UPS by metro and 70.7% of the users walk through UPSs in order to reach metro stations [24]. Metro stations are both significant pedestrian attractors and generators, so they should be factored into the evaluation. The variable describing metro station locations is computed as follows.
M D M = i I w i × d i
where I represents the amount of metro stations within the UPS and it is two for Wujiaochang UPS and one for Loushanguan Road UPS; wi means the weight of metro station i, which is computed by its average passengers of the station; di means the distance to metro station i from the gate counting point.
(2) Mean distance to bus stops radius R (MDBR)
Despite the fact that only about 11.5% of the interviewees in Shanghai UPSs arrive by bus [24], buses remain a significant component of urban public transportation systems. The likelihood that SUPSs will serve as a quick and convenient connection bridge between metro stations and bus stops influences the pedestrian distribution in SUPSs. There exists a service scope for each individual bus stop, and the number of passengers at each stop varies according to the number of bus lines. Therefore, the average distance between the gate counting point and bus stops within a service area of radius R and the number of bus lines is computed as the following Equation (5).
M D B R = j J w j × d j
where R is the influence radius of the bus stop, which is set as 400m, 600m and 800m corresponding to the radius of BtMR and NQPDMR; J represents the amount of bus stops within the scope of radius R; wj means the weight of bus stop j, which is computed by the bus lines of the stop; dj means the walking distance to bus stop j from the gate counting point.
(3) POI density within radius R (PDR)
Land use has impacts on pedestrian distribution for urban street networks and skywalk systems [43,44,47]. According to the aforementioned variables, retail, catering, sports and recreation, and life service-related points of interest were chosen to represent the land use influence within a specific service scope of 400m, 600m, and 800m. The variable can then be represented as follows.
P D R = n P O I S R
where nPOI is the total amount of POI within the service scope of radius R (400m, 600m and 800m) from the counting point; SR is the space area of real service scope of radius R.
(4) Mean distance to UPS connected commercial areas (MDCL)
According to previous research, commercial space adjacent to the UPS is highly correlated with pedestrian destinations and reflects the character of local land use pattern [24,48]. Subsequently, mean distance to UPS connected commercial areas is calculated in the following Equation (7).
M D C L = l L w l × d l
where L represents the amount of commercial space connected to UPS; wl means the weight of commercial space l, which is computed by floor area of the commerce; dl means the walking distance from the gate counting point to the center of the commercial space within the UPS.

4. Results and discussion

4.1. Pedestrian distribution analysis

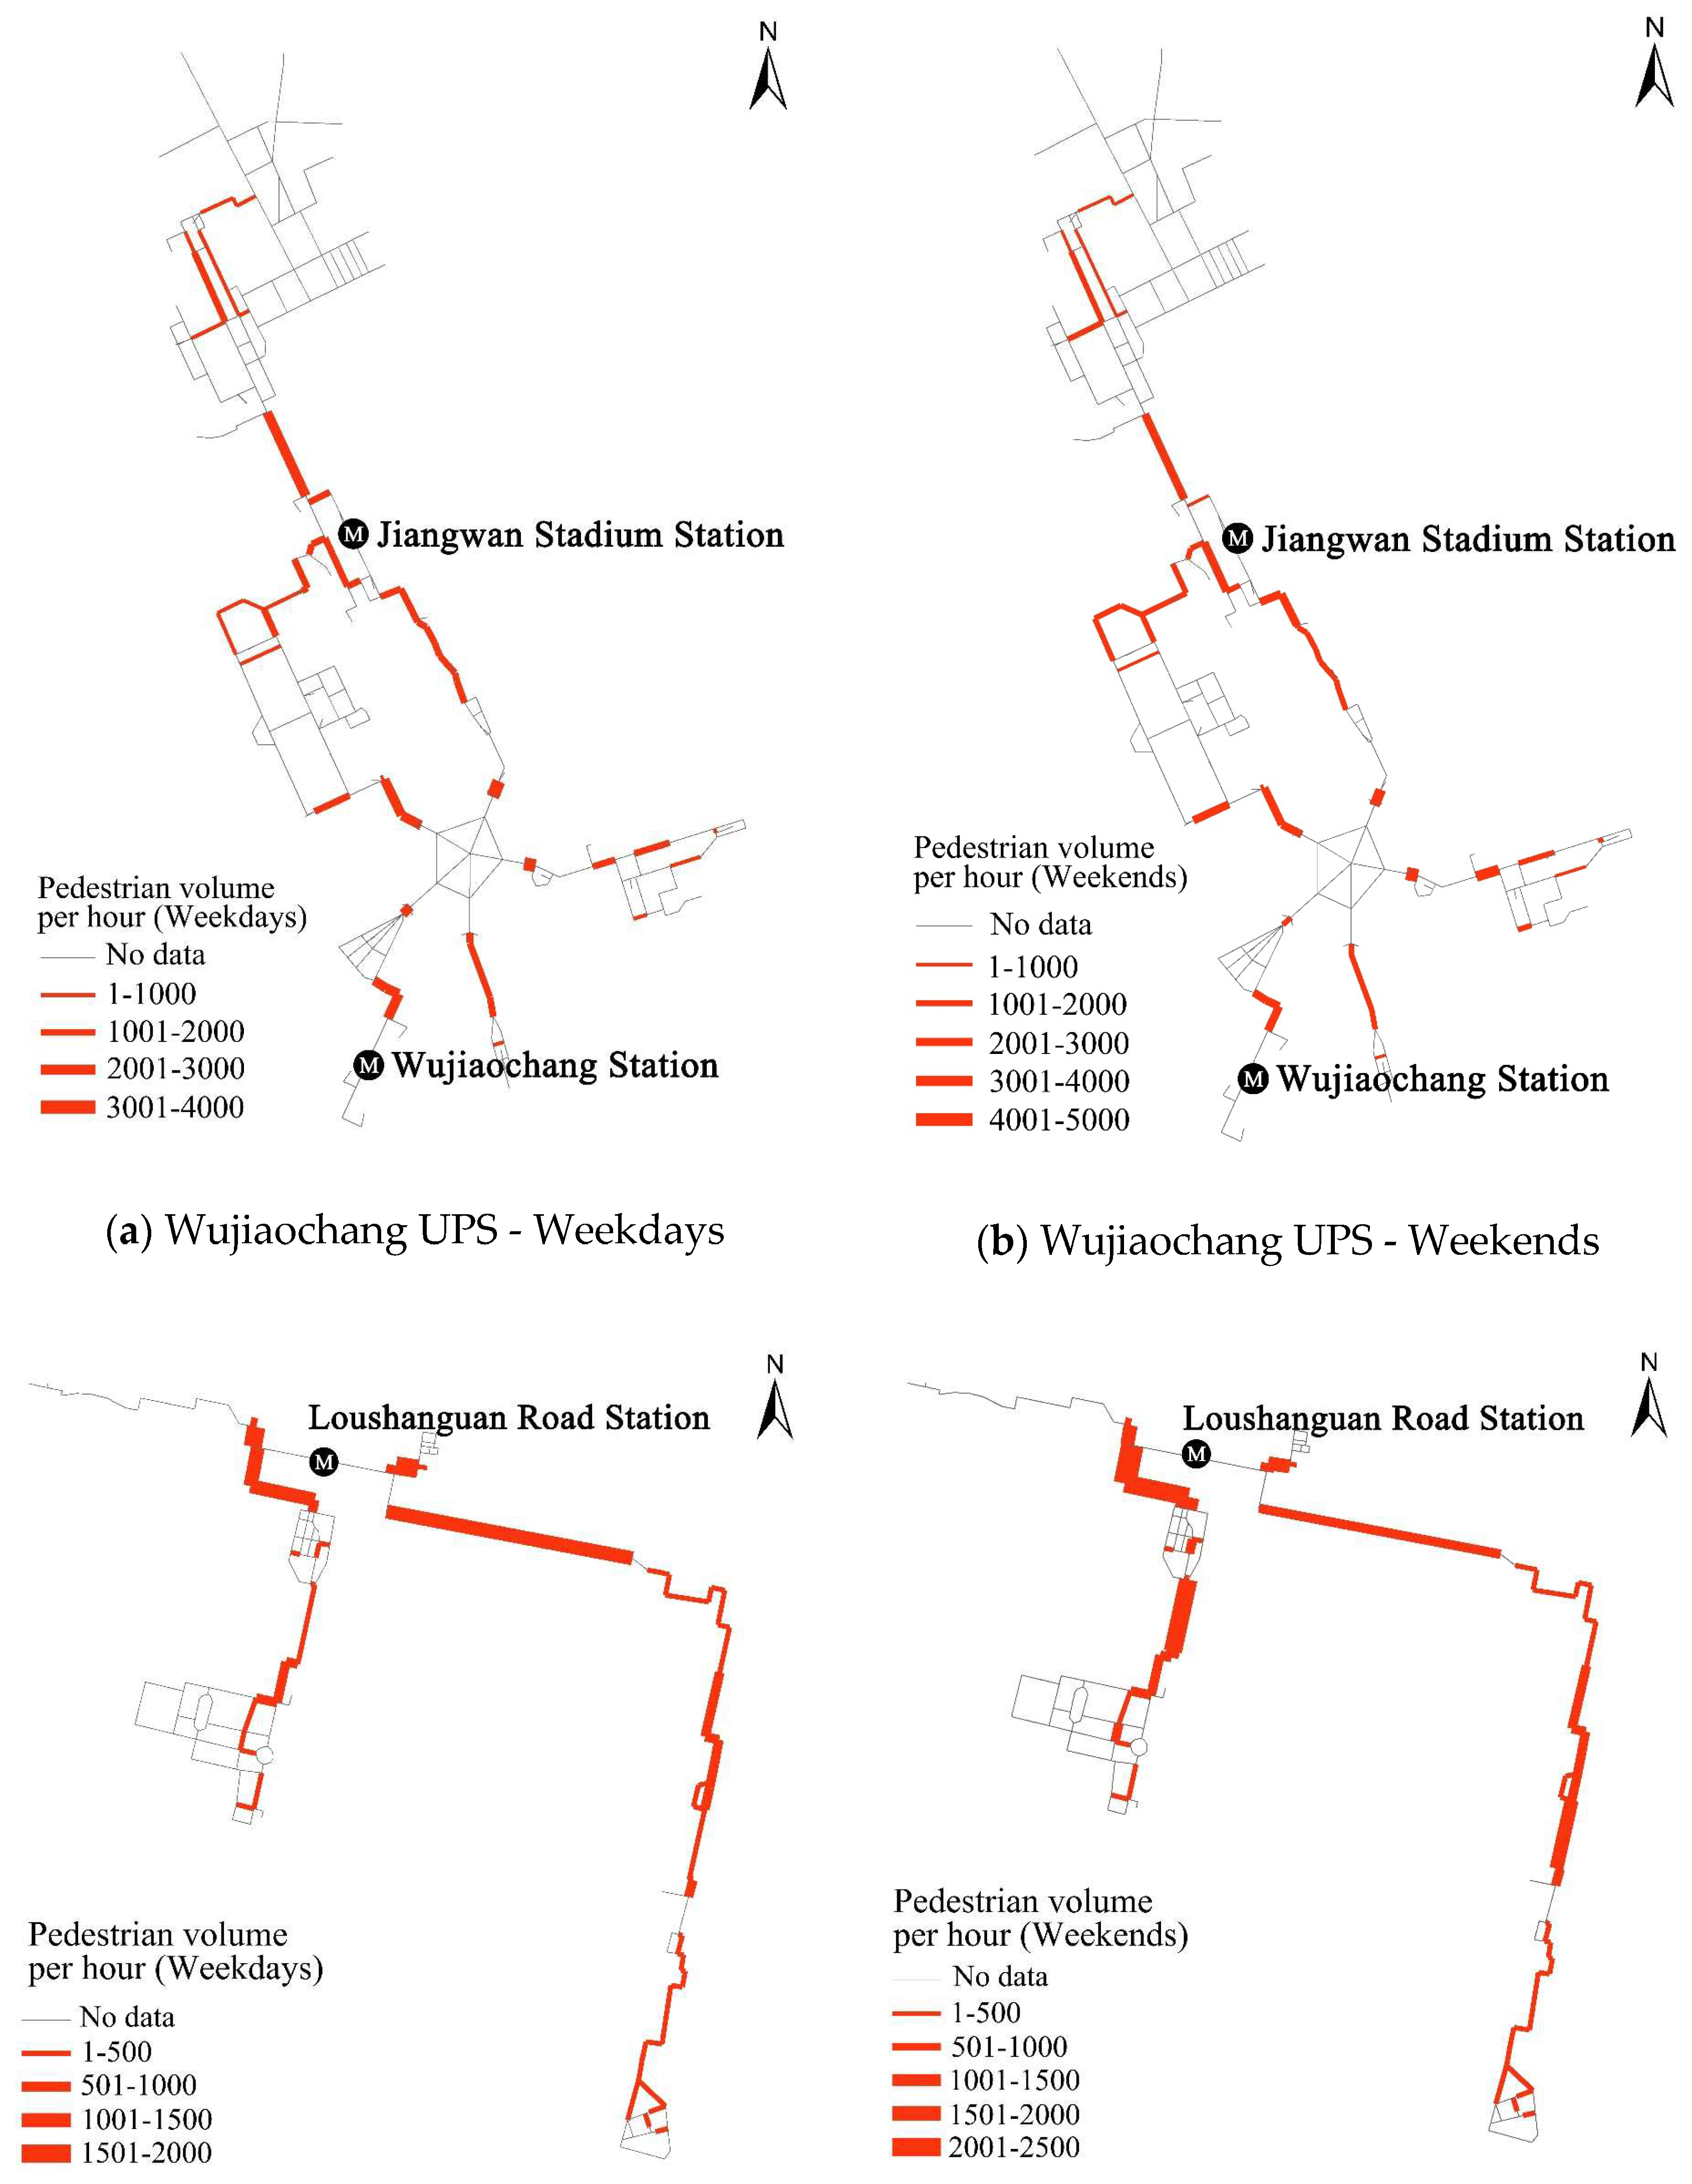
As the selected counting time avoids morning and evening peak hours, counting data were more likely to reflect pedestrian behaviors for shopping, strolling and traffic transferring rather than working. According to Table 3, SUPS pedestrian volume at weekends is greater than that on weekdays in both SUPSs. The differences between weekdays and weekends can be explained by the fact that both UPSs are in traditional commercial areas of Shanghai and it is evident that more shopping occurs on weekends, which can explain the differences between weekdays and weekends. As depicted in Figure 4, pedestrian flows of weekdays and weekends appear to follow similar patterns in both SUPSs. The correlation coefficients for pedestrian volumes in weekday and weekend within Wujiaochang UPS and Loushanguan Road UPS reached 0.85 and 0.77, respectively, which were both significant at the 0.01 level (double-tailed). Pedestrian distributions are relatively stable in both SUPSs, corroborating Zacharias's findings on walking behaviors in Montreal UPS [47].

4.2. Spatial configuration analysis

Table 5 and Table 6 present the correlation analysis results of Wujiaochang UPS and Loushanguan Road UPS respectively. It should be noted that an integrated variable of 0.5(BtE + BtA) was also applied to test the correlations of pedestrian volume since Euclidean metrics or Angular metrics have their own shortages to reflect walking behaviors. As suggested by prior research [39,57], the combination of the two metrics is likely to be more superior.
Comparable to street networks on the ground, spatial configurations do have impacts on pedestrian flows in SUPSs based on the results of two analyses. In both SUPSs based on the EN and UN models, variables of Betweenness (BtMR) had more significantly and highly positive correlations with pedestrian behaviors than the Closeness (NQPDMR). Betweenness of three-dimensional networks in Wujiaochang UPS had higher impacts than that in Loushanguan Road UPS.
Regarding Wujiaochang UPS, it was discovered that variables of Betweenness from both models had high correlations and the EN model seemed to have superior performance compared to the UN model. Only the variables of UN model in Loushanguan Road UPS exhibited a consistent and significant correlation with pedestrian behaviors. The outcome is diametrically opposed to that of Wujiaochang UPS and UPS in Montreal [47]. According to Figure 1, Wujiaochang Sub-center is separated by five radial arteries without ground crossings. The fact that UPS is the only pedestrian route with 32 outdoor entrances strengthens the connection between SUPS and the ground street network. Clearly, Wujiaochang UPS is more integrated with the entire three-dimensional networks of the neighborhood's surface. In contrast, Loushanguan Road UPS appears to be a more constrained pedestrian network. A local street network that is more walkable reduces the reliance of pedestrians on the UPS. In addition, the UPS consists of several basements of existing shopping malls with only seven exterior entrances. Fewer outdoor portals and more indoor vertical links concealed within buildings make it difficult for pedestrians to access the UPS from the street. Thus, it increases UPS's autonomy, and most pedestrians are metro passengers and customers of UPS-connected buildings and shopping malls.
In terms of metric selections, Betweenness with both Angular metrics and Euclidean metrics had similar correlations at significance of the 0.01 level (double-tailed) for the EN and UN models of Wujiaochang UPS and UN models of Loushanguan Road UPS. Variables with a combined metric of 0.5(BtE+BtA) even revealed higher correlations than single metrics in the case of Wujiaochang UPS. The results of the analysis indicate that UPS users have similar walking patterns to pedestrians on the ground. They prefer shorter with less walking distances to save time and fewer cumulative angular changes to avoid getting lost, so a combination of both Angular and Euclidean metrics can reveal pedestrian behaviors in SUPSs more accurately.
However, proposing a unified influence radius for the spatial configuration analysis remains vague. Radius of 600m of both EN and UN models produced the strongest correlations of Betweenness and pedestrian volume for Wujiaochang UPS. It is quite consistent with the study conclusions reached by Cui et al (2015) and Zhang et al (2015) based on the case study of Montreal UPS and questionnaires in Shanghai [24,56]. However, only BtE400 was significantly correlated to pedestrian flows for the EN model and radius of 800m yielded the highest correlation considering the UN model for Loushanguan Road UPS. Despite the absence of a unified answer regarding the selection of optimal analysis radii for spatial configurations, differences among correlations with three radii of two cases were relatively minor. It is believed that the suitable radius should range from 400m to 800m.
It has been demonstrated that the spatial configuration has significant effects on pedestrian distributions of SUPSs. In both cases of Shanghai, the integration of Betweenness with Euclidean and Angular metrics improves correlations. The relationship between underground systems and ground walking networks differs in the two SUPSs. Wujiaochang UPS substantially affects walking behaviors for local pedestrians in the entire neighborhood. However, Loushanguan Road UPS is more self-contained. Furthermore, spatial configurations can only partially explain pedestrian behaviors with different correlations in the two SUPSs. Other factors except the spatial layout elements need to be evaluated in the following sections.

4.3. Spatial attribute analysis

Table 7 reveals correlation coefficients between pedestrian volume and four types of spatial attribute variables on weekdays and at weekends. Analysis results of two SUPSs were quite consistent. MDM and MDCL both had a negative impact on pedestrian volume within radii from 400m to 800m. The proximity to pedestrian attractors such as metro stations and shopping districts increases pedestrian flow. The phenomenon completely corresponds to the questionnaires for UPS pedestrian behaviors of three UPSs in Shanghai [24]. It also confirms a strong attraction effect of both metro stations and commercial areas to UPS users. In both instances, correlation coefficients of MDM on weekdays were greater than that at weekends. It may be related to travel habits of pedestrians, as metro passenger volume are typically higher on weekdays, according to the data released by Shanghai Metro Company (www.shmetro.com).
On the other hand, variables of MDB had an inconsistent relationship with weekday and weekend pedestrian volume in two SUPSs. Analysis on MDB400 of Wujiaochang UPS showed a positive correlation coefficient at the 0.05 level (double-tailed), which is contrary to conventional belief that bus stops are also generators for UPS users. One possible reason is that other factors affect the distribution of pedestrian flows and interfere the correlation results of MDB, which should be further tested by partial correlation analysis. Furthermore, PD had a negligible effect on SUPS pedestrian behaviors, which should be eliminated before regression analysis. In comparison to the UPS-linked underground commercial space, the results demonstrate that aboveground commerce appears to have little influence on SUPS pedestrian distributions in both SUPSs. It is because that the distributions of vertical links for UPSs may not coincide with the distribution of commercial agglomeration areas on the ground. In addition, the analysis result demonstrates the significance of connecting commercial space to the entire underground system in order to attract UPS pedestrians and achieve underground space vitality.

4.4. Formation mechanism of SUPS

To quantitatvely identify the formation mechanism of SUPS, partial correlation coefficients were computed during the regression analysis. Variables of 0.5(BtE+BtA), MDM, MDB and MDCL of three radii are tested as shown in Table 8 and Table 9. UN model was chosen for Loushanguan Road UPS and EN model was selected in the case of Wujiaochang to reveal real impacts of spatial configurations. As stated in Section 4.1, the pedestrian distribution was relatively stable on weekdays and at weekends, the average pedestrian volume was applied here to simplify the analysis.
Partial correlation analysis results demonstrated that the relationship between spatial configurations and pedestrian behaviors is remarkably positive in both SUPSs. Whereas different results were obtained in terms of the spatial attributes. For Wujiaochang UPS, MDM was weakly correlated with the pedestrian volume. However, variables of MDB800 and MDCL were more highly relative to the pedestrian distribution in Loushanguan Road UPS. Then, examine the VIF values of two cases. Indices of MDM or MDCL were greater than 5.0 in both instances, which indicates a multicollinearity problem interfering with the regression results. By means of the correlation analysis, the coefficient of MDM and MDCL was 0.897 and 0.780 at the 0.01 level (double-tailed) for Wujiaochang UPS and Loushanguan Road UPS respectively, demonstrating a strongly positive relationship between each other. Meanwhile, it also reveals that the layout of commercial space connected by UPS is closely distributed around the metro stations in both of two cases. The overall layout of UPSs has emphasized the pivotal role of metro stations, which is a common element when constructing a UPS in Shanghai.
Stepwise regression was used to eliminate the multicollinearity issue and preserve the most significant variables influencing pedestrian behavior. Table 10 and Table 11 display the regression results. Regression models for Wujiaochang UPS were able to explain from 75.7% to 81.4% (Adjusted R2) of the model uncertainty and the ones of Loushanguan Road UPS could explain from 69.3% to 70.6%, indicating satisfactory effects of the regression for both cases. Regression results with different metric radii were similar to each other, demonstrating stable and consistent impacts of spatial configurations at the micro levels with radii from 400m to 800m. In terms of the influence levels, spatial configuration factors of 0.5(BtE+BtA) ranked first according to standardized coefficients for Wujiaochang UPS. The impact of spatial configurations on pedestrian behaviors was nearly 1.69 to 1.89 greater than the metro station location (MDM). Nevertheless, variables of MDB were eliminated as they could not pass the significance test during the regression. By comparison, the influence of commercial space locations (MDCL) was 1.24 to 1.52 times of that of the spatial configurations for Loushanguan Road UPS. Bus stop location was also considered as one of the pedestrian generators despite a relatively low correlation around the SUPS. It should be noted that although MDM was eliminated owing to the multicollinearity with MDCL, it still had a much stronger impact on walking behaviors in Loushanguan Road UPS than the location of bus stops. Metro station remains one of the most crucial elements for SUPSs.
Subsequently, compare the influence of MDM and MDCL. By means of a stepwise regression method, the factor of MDM was reserved for Wujiaochang UPS while MDCL was retained in the models of Loushanguan Road UPS to avoid the multicollinearity of the regression results. The significantly different outcomes appear to be attributable to the planning purposes of two SUPSs. Wujiaochang UPS originates from the integrated UUS planning of Jiangwan-Wujiaochang Sub-center. It emphasizes the integration of metro stations and other underground space to form a more walkable network, which is applied to sew up the disconnected surficial urban blocks. The greater impacts of spatial configurations and MDM may indicate the achievement of its planning objective and proves its integrating function for the entire walking systems on the ground and under the ground. On the other hand, the UPS surrounding Loushanguan Road Station is intended to connect regionally dispersed commercial districts. A greater impact of MDCL on pedestrian volume verifies that pedestrian behaviors are indeed strongly related to the locations of commercial space connected by the UPS and the planning purpose has been partially attained.
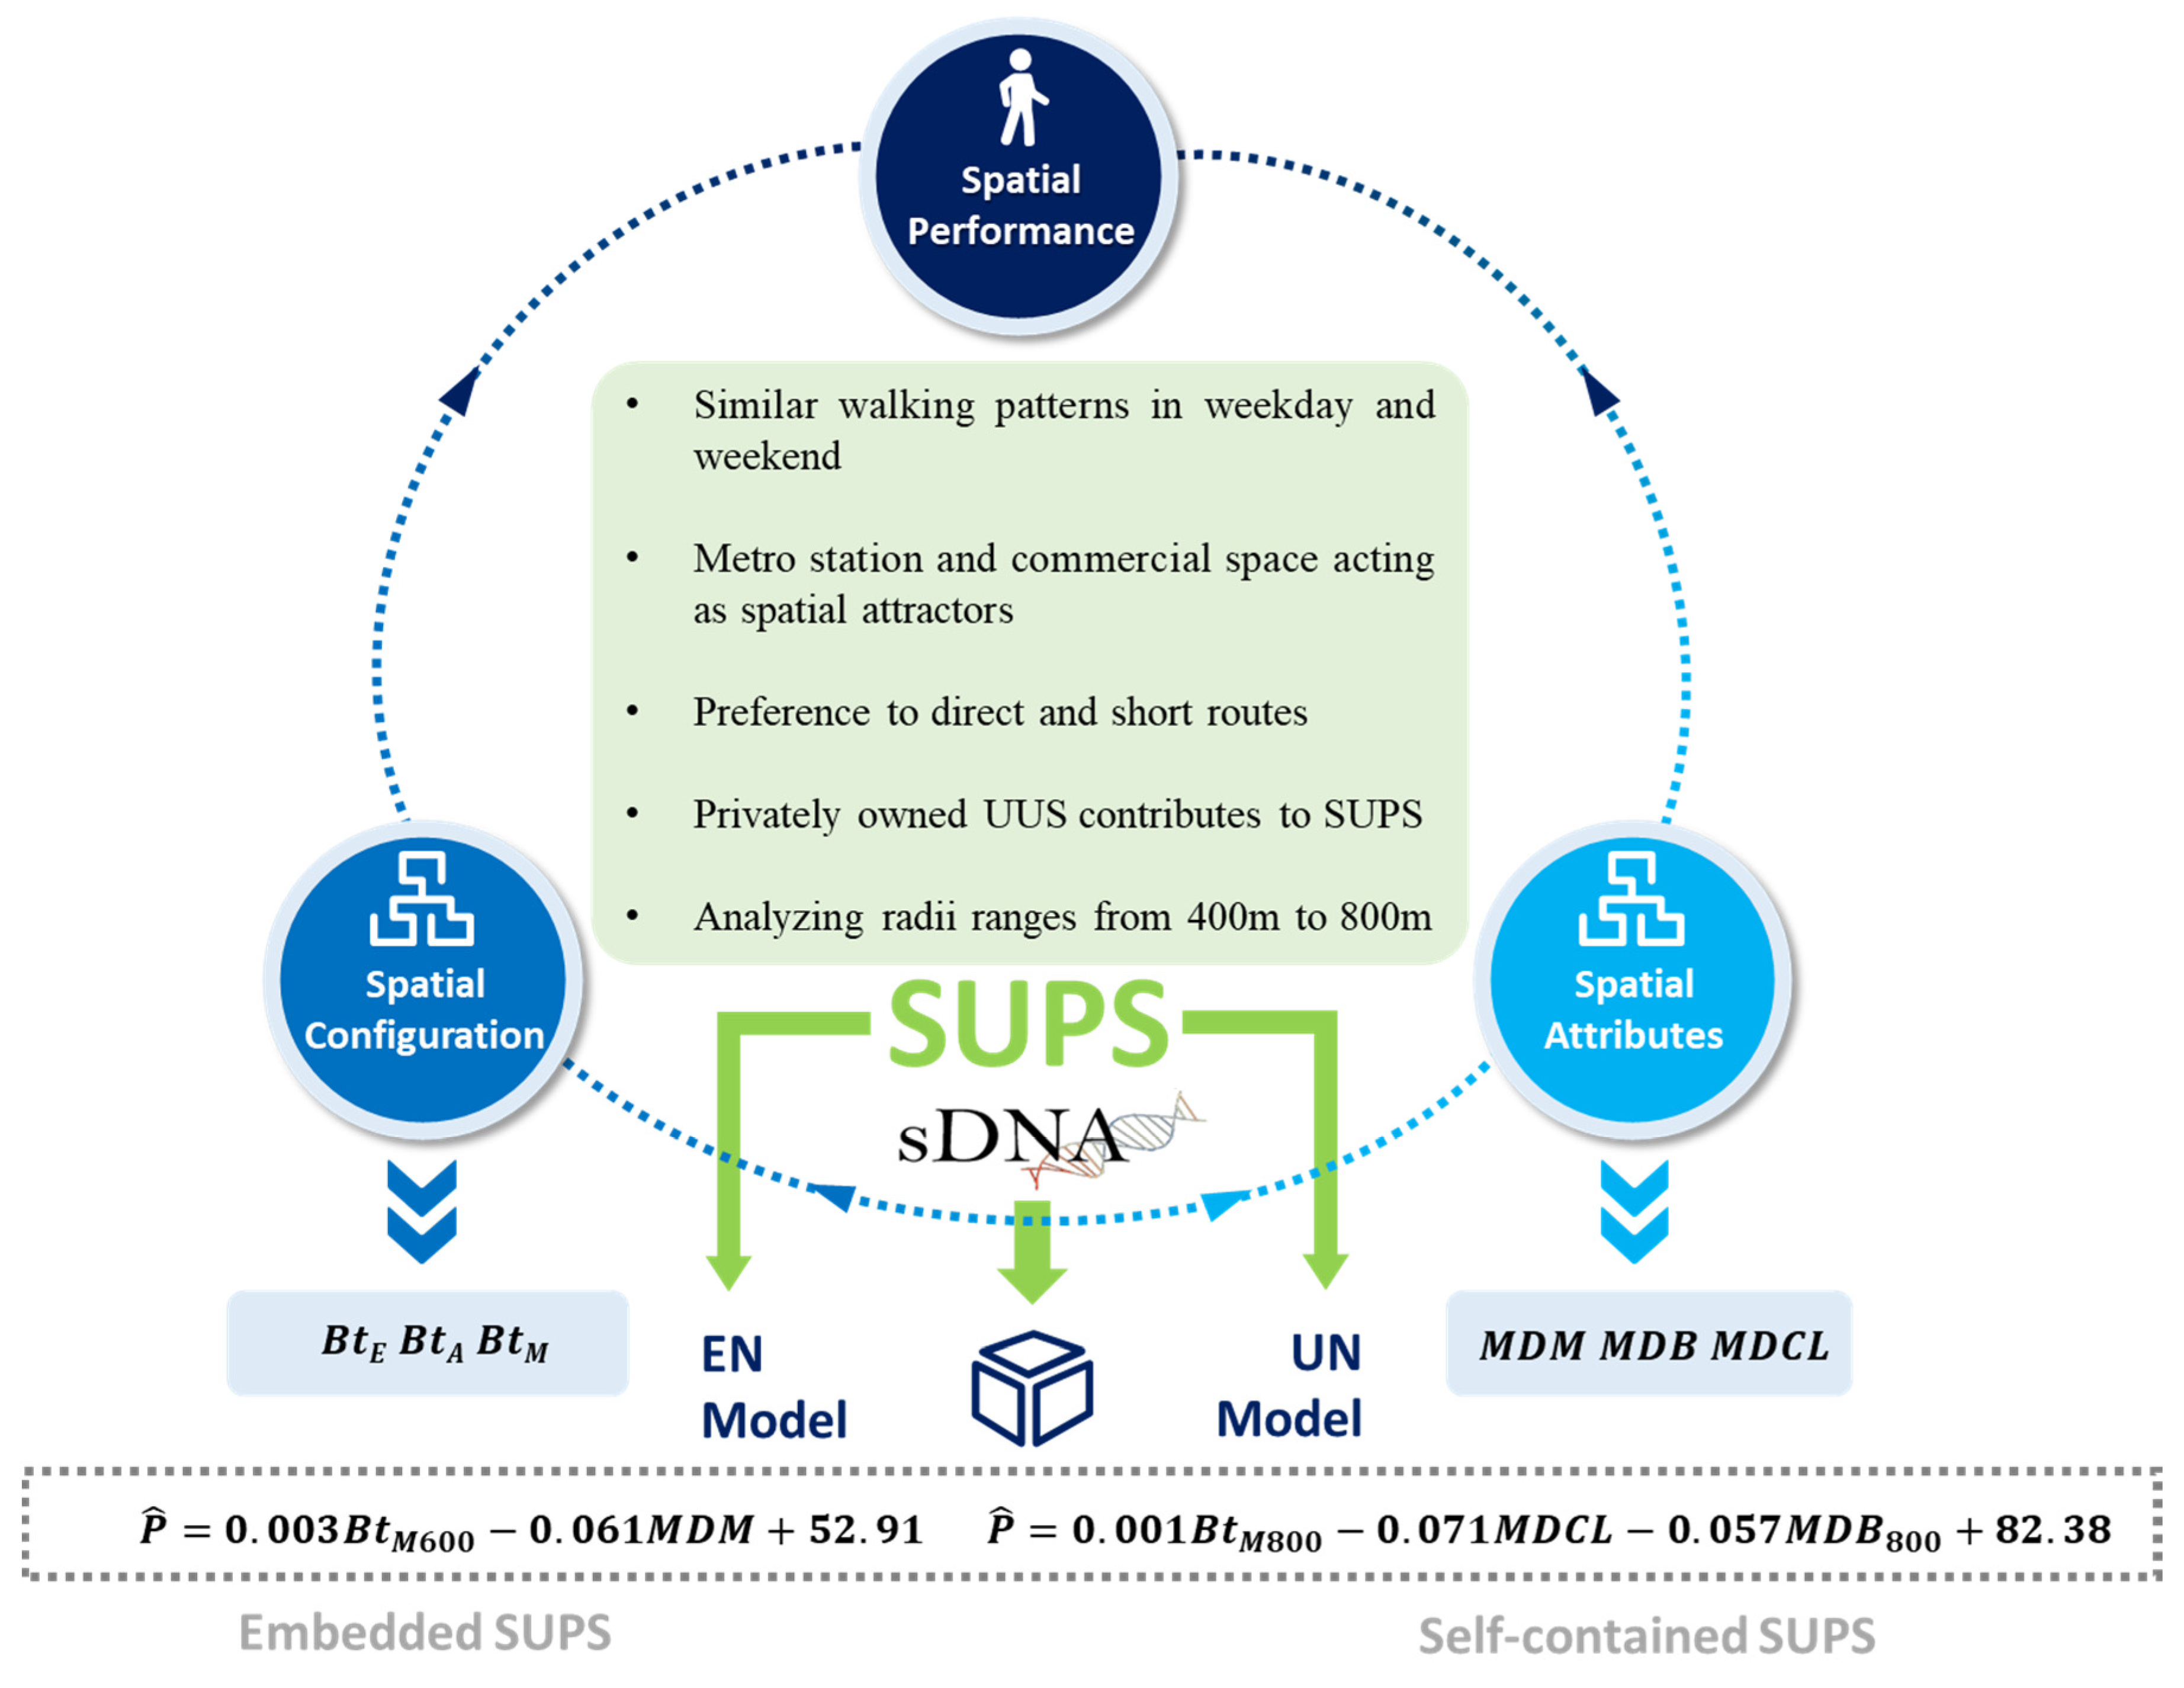
As depicted in Figure 5, we proposed the formulation mechanism and corresponding analytical techniques for SUPS based on the quantitative analysis. Most importantly, spatial configuration and spatial attributes were demonstrated to have a joint influence on the spatial performance (measured by the pedestrian flow) of SUPS. In general, there are five fundamental principles concerning SUPS development as follows.
  • The pedestrian distribution of SUPS of weekdays and weekends tend to be similar, with the overall pedestrian volume on weekends being higher than that of weekdays.
  • Metro stations and commercial spaces appear to be the most important spatial attractors for pedestrians in SUPS, and planners should maintain the metro stations as the core and persuade adjacent private sectors of commercial space to connect with the SUPS.
  • The walking behavior in SUPS resembles that of ground pedestrian system, i.e., pedestrians prefer more direct (fewest angle changes) and shorter routes (minimum walking length).
  • Privately owned public space contributes to the establishment of the primary spatial configuration of SUPS.
  • The appropriate analyzing radii for pedestrian behavior within SUPS typically range from 400m to 800m.
The formation mechanism can be further integrated into the data-driven design and analysis of SUPSs. The outcomes indicate that sDNA is applicable to the study of three-dimensional street networks underground and aboveground. Spatial configurations have significant positive impacts on the pedestrian distribution in SUPS. Variables of Betweenness and Closeness can reflect the centrality of walking routes, and Betweenness can better reveal underground walking behaviors for pedestrians in SUPSs. Among spatial attributes of urban transportations, the influence of metro station locations (MDM) on pedestrian flows is significantly greater than that of bus station distributions (MDB). Metro stations are one of the most important generators and destinations of SUPS pedestrians. Additionally, compared with the entire commercial space density (PD) around the counting points, the commercial space (MDCL) directly connected by the SUPS has a significant positive correlation with the distribution of pedestrian flows. It quantitatively proves that commerce is indeed a pivotal factor for SUPS utilization.
Another important contribution should be the diverse formation mechanism of distinct SUPSs. Wujiaochang UPS is perfectly integrated into the entire walking system underground and aboveground. The two metro stations, namely Jiangwan Stadium Station and Wujiaochang Station, are important attractors, which reveals that the SUPS is a TOD walking system. By contrast, Loushanguan Road UPS seems to be a more self-contained underground system. SUPS users are closely associated to commercial space connected to the SUPS, indicating that it is an UUS system geared toward the connectivity of local commercial areas. Thereby, we formulated distinct models to simulate the pedestrian distribution in two representative SUPSs, namely embedded SUPS (such as Wujiaochang UPS) and self-contained SUPS (Loushanguan Road UPS). It can be observed that the mixed measure of Betweenness is adaptive to both SUPSs, whereas the spatial attributes factors differ in distinct models. For embedded SUPS, MDM, which measures the interconnection between SUPS and metro stations, play a more important role. For self-contained SUPS, MDB and MDCL, which quantifies the connection of SUPS with commercial spaces and bus stops, appear to be more critical. Once the planners and decision-makers determine the development mode of SUPS, they can adopt the identified formulation mechanism to generate plausible design schemes of SUPS. Moreover, the quantitate model proposed in this study can also act as an efficient tool for the optimization and comparison of multiple schemes.

5. Conclusions

UPS has become an imperative to achieve SDGs in densely populated built environment, however, the formation mechanism of SUPS of high-density megacities remains unexplored, hindering the efficient and plausible design of UPS towards urban sustainability. To bridge the research gap, we grounded the selection criteria of SUPSs to response to SDG 11, and revealed the underlying relationship between spatial performance and spatial morphology of SUPS using statistical methods. Wujiaochang UPS and Loushanguan Road UPS in Shanghai were employed as two representative cases to examine the formation mechanism of SUPSs. Specifically, the influence of spatial configurations and spatial attributes on SUPS pedestrian behaviors was quantitatively identified. The outcomes indicated that the spatial configurations and spatial attributes do have impacts on SUPS pedestrian behaviors, jointly constituting a diverse development mechanism for SUPSs. Underground walking behaviors resemble that of street networks on the ground. Commerce and metro transportation are two vital attractors or generators of SUPS pedestrians. Ultimately, we summarized the formation mechanism and corresponding design strategies for both self-contained and embedded SUPSs.
Nonetheless, this study has some limitations to be solved. First, the selected SUPSs had not been quantitatively evaluated regarding the gain of urban sustainability, resulting in an over simplified formation mechanism of SUPSs. Despite that the spatial performance measured by pedestrian volume, which is one of the most significant indicators concerning SUPS, a holistic assessment index system as well as the quantitative evaluation method need to be proposed. Second, a moderately insufficient sample size due to the limit of labor expense might partially diminish the validity of the study's conclusions. Only part of the underground corridors was counted and only two days with two off-peak time in the morning and in the afternoon were selected as the sampling time. The influence of variables on office worker behaviors in SUPS has not been researched. This research would contribute to sustainable planning and design of UPSs the from an overall perspective, however, the refined regularities in distinct scenarios need to be further studied in upcoming research.
Author Contributions

Conceptualization, Y.H.D.; Software, C.P. and C.X.M.; Methodology, Y.H.D. and C.X.M.; Validation, C.P. and Y.H.D.; Investigation, C.P. and C.X.M.; Data Curation, C.P.; Visualization, C.X.M.; Resources, C.P., C.X.M. and Y.H.D.; Writing-original draft, C.P.; Writing-reviewing and editing, Y.H.D. and C.X.M.; Supervision, Y.H.D. All authors have read and agreed to the published version of the manuscript.

Funding

This research received no external funding.

Institutional Review Board Statement

Not applicable.

Informed Consent Statement

Not applicable.

Data Availability Statement

The data that support the findings of this study are available from the corresponding author upon reasonable request.

Acknowledgements

The authors are grateful to the team members of Research Center for Urban Underground Space, Tongji University, for their solid work in pedestrian data counting.

Conflicts of Interest

The authors declare no conflict of interest.

References

  1. Cui, J.Q. and Lin D., Utilisation of underground pedestrian systems for urban sustainability. Tunnelling and Underground Space Technology, 2016. 55: p. 194-204.
  2. Bélanger, P. Underground landscape: The urbanism and infrastructure of Toronto’s downtown pedestrian network. Tunn. Undergr. Space Technol. 2007, 22, 272–292. [CrossRef]
  3. Durmisevic, S. The future of the underground space. Cities 1999, 16, 233–245. [CrossRef]
  4. Peng, F.-L.; Qiao, Y.-K.; Zhao, J.-W.; Liu, K.; Li, J.-C. Planning and implementation of underground space in Chinese central business district (CBD): A case of Shanghai Hongqiao CBD. Tunn. Undergr. Space Technol. 2019, 95, 103176. [CrossRef]
  5. Dong, Y.-H.; Peng, F.-L.; Du, Y.; Men, Y.-Q. Automatic identification and feature recognition of the metro-led underground space in China based on point of interest data. Undergr. Space 2023, 9, 186–199. [CrossRef]
  6. Bobylev, N., Mainstreaming sustainable development into a city's Master plan: A case of Urban Underground Space use. Land Use Policy, 2009. 26(4): p. 1128-1137.
  7. Bobylev, N. Transitions to a High Density Urban Underground Space. Procedia Eng. 2016, 165, 184–192. [CrossRef]
  8. Qiao, Y.-K.; Peng, F.-L.; Sabri, S.; Rajabifard, A. Low carbon effects of urban underground space. Sustain. Cities Soc. 2018, 45, 451–459. [CrossRef]
  9. Cui, J. Building three-dimensional pedestrian networks in cities. Undergr. Space 2020, 6, 217–224. [CrossRef]
  10. Dong, Y.H., Peng F.L., and Guo T.F., Quantitative assessment method on urban vitality of metro-led underground space based on multi-source data: A case study of Shanghai Inner Ring area. Tunnelling and Underground Space Technology, 2021. 116.
  11. Dong, Y.-H.; Peng, F.-L.; Qiao, Y.-K.; Zhang, J.-B.; Wu, X.-L. Measuring the monetary value of environmental externalities derived from urban underground facilities: Towards a better understanding of sustainable underground spaces. Energy Build. 2021, 250, 111313. [CrossRef]
  12. Qiao, Y.K., Peng F.L., and Wang Y., Monetary valuation of urban underground space: A critical issue for the decision-making of urban underground space development. Land Use Policy, 2017. 69: p. 12-24.
  13. Qiao, Y.K., Peng F.L., and Wang Y., Valuing external benefits of underground rail transit in monetary terms: A practical method applied to Changzhou City. Tunnelling and Underground Space Technology, 2019. 83: p. 91-98.
  14. Sterling, R., et al., Sustainability issues for underground space in urban areas. Proceedings of the Institution of Civil Engineers - Urban Design and Planning, 2012. 165(4): p. 241-254.
  15. Cui, J.; Allan, A.; Lin, D. SWOT analysis and development strategies for underground pedestrian systems. Tunn. Undergr. Space Technol. 2019, 87, 127–133. [CrossRef]
  16. Dong, Y.-H.; Peng, F.-L.; Zha, B.-H.; Qiao, Y.-K.; Li, H. An intelligent layout planning model for underground space surrounding metro stations based on NSGA-II. Tunn. Undergr. Space Technol. 2022, 128. [CrossRef]
  17. Chen, Z.; Su, L.; Zhang, C. Research on the Synergy Degree of Aboveground and Underground Space along Urban Rail Transit from the Perspective of Urban Sustainable Development. Sustainability 2016, 8, 934. [CrossRef]
  18. Wu, R.; Zheng, X.; Xu, Y.; Wu, W.; Li, G.; Xu, Q.; Nie, Z. Modified Driving Safety Field Based on Trajectory Prediction Model for Pedestrian–Vehicle Collision. Sustainability 2019, 11, 6254. [CrossRef]
  19. Ma C.X. and Peng F.L., Monetary evaluation method of comprehensive benefits of complex underground roads for motor vehicles orienting urban sustainable development. Sustainable Cities and Society, 2021, 65.
  20. Besner, J. Cities Think Underground – Underground Space (also) for People. Procedia Eng. 2017, 209, 49–55. [CrossRef]
  21. von der Tann, L., et al., Systems approaches to urban underground space planning and management – A review. Underground Space, 2020. 5(2): p. 144-166.
  22. Peng, J.; Peng, F.-L.; Yabuki, N.; Fukuda, T. Factors in the development of urban underground space surrounding metro stations: A case study of Osaka, Japan. Tunn. Undergr. Space Technol. 2019, 91, 103009. [CrossRef]
  23. He, J.; Zacharias, J.; Geng, J.; Liu, Y.; Huang, Y.; Ma, W. Underground Pedestrian Network for Urban Commercial Development in Tsim Sha Tsui of Hong Kong. Procedia Eng. 2016, 165, 193–204. [CrossRef]
  24. Cui, J.; Allan, A.; Taylor, M.A.; Lin, D. An Examination of Pedestrian Trip Behaviour in Underground Pedestrian Systems. Int. Plan. Stud. 2014, 20, 209–227. [CrossRef]
  25. Zhao, J.-W.; Peng, F.-L.; Wang, T.-Q.; Zhang, X.-Y.; Jiang, B.-N. Advances in master planning of urban underground space (UUS) in China. Tunn. Undergr. Space Technol. 2016, 55, 290–307. [CrossRef]
  26. Jeong, D.Y.; Kim, H.J. Sustainable Development of Underutilized Pedestrian Underpass in Seoul. Sustainability 2022, 14, 7878. [CrossRef]
  27. Ma, C.-X.; Peng, F.-L.; Qiao, Y.-K.; Li, H. Evaluation of spatial performance of metro-led urban underground public space: A case study in Shanghai. Tunn. Undergr. Space Technol. 2022, 124, 104484. [CrossRef]
  28. Santilli, D.; D’apuzzo, M.; Evangelisti, A.; Nicolosi, V. Towards Sustainability: New Tools for Planning Urban Pedestrian Mobility. Sustainability 2021, 13, 9371. [CrossRef]
  29. Lai, P.-C.; Chen, S.; Low, C.-T.; Cerin, E.; Stimson, R.; Wong, P.Y.P. Neighborhood Variation of Sustainable Urban Morphological Characteristics. Int. J. Environ. Res. Public Health 2018, 15, 465. [CrossRef]
  30. Mobaraki, A.; Vehbi, B.O. A Conceptual Model for Assessing the Relationship between Urban Morphology and Sustainable Urban Form. Sustainability 2022, 14, 2884. [CrossRef]
  31. Schwander, C., et al., Compositional and Urban Form Effects on Centers in Greater London. Proceedings of the ICE - Urban Design and Planning, 2012. 165: p. 21-42.
  32. Askarizad, R.; Safari, H. The influence of social interactions on the behavioral patterns of the people in urban spaces (case study: The pedestrian zone of Rasht Municipality Square, Iran). Cities 2020, 101, 102687. [CrossRef]
  33. nder, D.E. and Y. Gigi, Reading urban spaces by the space-syntax method: A proposal for the South Haliç Region. Cities, 2010. 27(4): p. 260-271.
  34. Mohamed, A.A.; Stanek, D. The influence of street network configuration on sexual harassment patterns in Cairo. Cities 2019, 98, 102583. [CrossRef]
  35. Dong, Y.-H.; Peng, F.-L.; Bao, Z.-H.; Qiao, Y.-K. Identification of the spatial distribution pattern and driving forces of underground parking space based on multi-source data: A case study of Fuzhou City in China. Sustain. Cities Soc. 2021, 72, 103084. [CrossRef]
  36. Dong, Y.-H.; Peng, F.-L.; Li, H.; Men, Y.-Q. Spatial autocorrelation and spatial heterogeneity of underground parking space development in Chinese megacities based on multisource open data. Appl. Geogr. 2023, 153. [CrossRef]
  37. Hillier, B.; Penn, A.; Hanson, J.; Grajewski, T.; Xu, J. Natural movement: or, configuration and attraction in urban pedestrian movement. Environ. Plan. B: Plan. Des. 1993, 20, 29–66. [CrossRef]
  38. Hillier, B., Space is the Machine. 1996, Cambridge: Cambridge University Press.
  39. Cooper, C., et al., Testing the ability of Multivariate Hybrid Spatial Network Analysis to predict the effect of a major urban redevelopment on pedestrian flows. 2018.
  40. Cooper, C.H.V.; Fone, D.L.; Chiaradia, A.J.F. Measuring the impact of spatial network layout on community social cohesion: a cross-sectional study. Int. J. Heal. Geogr. 2014, 13, 11–11. [CrossRef]
  41. Chiaradia, A., E. Moreau, and N. Raford, Configurational Exploration of Public Transport Movement Networks: A Case Study, The London Underground. Proceedings of 5th International Space Syntax Symposium, 2005.
  42. Chang, D.; Penn, A. Integrated Multilevel Circulation in Dense Urban Areas: The Effect of Multiple Interacting Constraints on the Use of Complex Urban Areas. Environ. Plan. B: Plan. Des. 1998, 25, 507–538. [CrossRef]
  43. Bhalla Manmohan, K. and D. Pant Prahlad, Pedestrian Traffic on Cincinnati Skywalk System. Journal of Transportation Engineering, 1985. 111(2): p. 95-104.
  44. Kang, C.-D. Measuring the effects of street network configurations on walking in Seoul, Korea. Cities 2017, 71, 30–40. [CrossRef]
  45. Kang, C.-D. The S + 5Ds: Spatial access to pedestrian environments and walking in Seoul, Korea. Cities 2018, 77, 130–141. [CrossRef]
  46. Yuan, H.; He, Y.; Zhou, J.; Li, Y.; Cui, X.; Shen, Z. Research on compactness ratio model of urban underground space and compact development mechanism of rail transit station affected area. Sustain. Cities Soc. 2020, 55, 102043. [CrossRef]
  47. Zacharias, J., Modeling Pedestrian Dynamics in Montreal's Underground City. Journal of Transportation Engineering, 2000. 126(5): p. 405-412.
  48. Zacharias, J. and He J., Hong Kong’s urban planning experiment in enhancing pedestrian movement from underground space to the surface. Tunnelling and Underground Space Technology, 2018. 82: p. 1-8.
  49. Zhuang, Y., Song X.Y., and Dai X.L., Influence of vertical transition in multi-level pedestrian systems of prediction models of pdestrian movement. Journal of Tongji University (Natural science), 2014. 7(42): p. 1051-1057.
  50. Zhang, L.Z. and C. Alain, Three-dimensional Spatial Network Analysis and Its Application in a High Density City Area, Central Hong Kong. Urban Planning International, 2019. 34(01): p. 46-53.
  51. Mou, J., The Discussion of Comprehensive Developing Underground Space in Near Future (2010). Shanghai Urban Planning Review, 2005. 3.
  52. Schmidt, S.; Nemeth, J.; Botsford, E. The evolution of privately owned public spaces in New York City. Urban Des. Int. 2011, 16, 270–284. [CrossRef]
  53. Cooper, C., Spatial Design Network Analysis (sDNA) version 4.0 Manual, C. University, Editor. 2019.
  54. Cooper, C., A. Chiaradia, and C. Webster. Spatial Design Network Analysis software, version 4.0. 2019; Available from: http://www.cardiff.ac.uk/sdna/.
  55. Sarkar, C.; Webster, C.; Pryor, M.; Tang, D.; Melbourne, S.; Zhang, X.; Jianzheng, L. Exploring associations between urban green, street design and walking: Results from the Greater London boroughs. Landsc. Urban Plan. 2015, 143, 112–125. [CrossRef]
  56. Zhang, L.Z., A. Chiaradia, and Zhuang Y., A Configurational Accessibility Study of Road and Metro Network in Shanghai, China, in Recent Developments in Chinese Urban Planning: Selected Papers from the 8th International Association for China Planning Conference, Guangzhou, China, June 21 - 22, 2014, Q. Pan and J. Cao, Editors. 2015, Springer International Publishing: Cham. p. 219-245.
  57. Zhang, L.; Ye, Y.; Zeng, W.; Chiaradia, A. A Systematic Measurement of Street Quality through Multi-Sourced Urban Data: A Human-Oriented Analysis. Int. J. Environ. Res. Public Health 2019, 16, 1782. [CrossRef]
Figure 1. Overall layout of Wujiaochang UPS.
Preprints 78162 g001
Figure 2. Overall layout of Loushanguan Road UPS.
Preprints 78162 g002
Figure 3. Layout of vertical transitions and pedestrian counting gates.
Preprints 78162 g003aPreprints 78162 g003b
Figure 4. Mean weekday or weekend pedestrian volume per hour in Wujiaochang UPS and Loushanguan Road UPS (Pedestrian data are adjusted to the volume per hour for better display effects).
Preprints 78162 g004
Figure 5. Formulation mechanism of SUPS.
Preprints 78162 g005
Table 1. Selected SUPSs in Shanghai.
SUPS (Name by the interconnected metro station) Development area of interconnected metro-led underground space (104 m2)
Hongqiao Railway Station 43.06
Wujiaochang 17.60
Yaohua Road- 13.58
Lujiazui 11.76
Shanghai South Railway Station 9.94
Loushanguan Road 9.57
Jinshajiang Road 9.42
People’s Square 8.05
Linping Road 7.80
Century Avenue 7.22
Table 2. Space information of Wujiaochang UPS and Loushanguan Road UPS
Wujiaochang UPS Loushanguan Road UPS 1
Floor area of UPS 2 (m2) 72,000 31,000
Floor area of UPS-connected UUS 3 (m2) 399,000 357,000
Floor area of UPS-connected building space (m2) 1,141,000 1,115,900
Length of underground walking route (km) 5.1 2.7
Privately owned public space (POPS) proportion of UPS 4 58% 84%
Vertical transition 5 Indoor 14 13
Outdoor 32 7
1 Friendship Mall and its connected underpass are excluded. 2 Only including pedestrian walking space. 3 Including walking space, commercial areas and parking lot areas. 4 POPS refers to the space built and owned by private sectors but open to the public for walking and resting to act as public space [52]. In both of two UPSs, some of the key underground public routes are composed by the privately owned building basements to act as POPS. 5 Only including staircases and escalators.
Table 3. Mean weekday or weekend pedestrian movement volume per 1.5 min at counting points.
Wujiaochang UPS Loushanguan Road UPS
Counting gate number Weekdays Weekends Total average Counting gate number Weekdays Weekends Total average
1 75 57.5 66.25 1 38 28 33
2 56 46 51 2 35.5 45.5 40.5
3 42 28 35 3 24 52 38
4 78 91 84.5 4 1 8 4.5
5 89 120.5 104.75 5 10.5 13 11.75
6 9.5 20.5 15 6 1.5 0.5 1
7 57 62 59.5 7 5 19 12
8 45 77 61 8 12 32 22
9 17.5 28.5 23 9 20.5 22.5 21.5
10 39 44.5 41.75 10 3.5 8 5.75
11 18 41 29.5 11 6 14.5 10.25
12 6 21.5 13.75 12 19 19 19
13 43 43.5 43.25 13 6 10.5 8.25
14 32 38.5 35.25 14 0.5 1 0.75
15 41 60.5 50.75 15 4 2.5 3.25
16 19.5 35 27.25 16 46 28.5 37.25
17 29 37.5 33.25 17 30.5 8.5 19.5
18 11 23.5 17.25 18 11.5 4 7.75
19 17 41 29 19 13 22 17.5
20 29.5 29 29.25 20 13 17.5 15.25
21 33 31.5 32.25 21 2 4 3
22 33.5 52.5 43 22 11 28.5 19.75
23 27.5 43 35.25 23 18.5 24.5 21.5
24 41.5 22.5 32 24 11 2 6.5
25 45.5 57 51.25 25 2.5 3 2.75
26 66 75 70.5 26 3 4.5 3.75
27 24.5 28.5 26.5 27 3.5 6 4.75
28 33.5 30.5 32 28 3.5 7.5 5.5
29 10 10 10 29 3.5 3 3.25
30 17.5 21.5 19.5 30 1 1.5 1.25
31 6 5 5.5
32 10.5 17 13.75
33 23.5 17 20.25
Total 2253 2715 4968 Total 721 926 1647
Table 4. Spatial configuration variables of three-dimensional networks
Types Metrics Radii (m) Variables
Betweenness Euclidean 400 BtE400
600 BtE600
800 BtE800
Angular 400 BtA400
600 BtA600
800 BtA800
Closeness Euclidean 400 NQPDE400
600 NQPDE600
800 NQPDE800
Angular 400 NQPDA400
600 NQPDA600
800 NQPDA800
Table 5. Pearson correlation coefficient between weekday or weekend pedestrian volume and spatial configuration variables of Wujiaochang UPS (EN Model & UN Model)
Model1 Radius BtE BtA NQPDE NQPDA 0.5(BtE+BtA)
WD2 WE3 WD WE WD WE WD WE WD WE
EN 400 0.741** 0.740** 0.799** 0.711** 0.554** 0.321 0.679** 0.462** 0.790** 0.742**
600 0.768** 0.795** 0.790** 0.729** 0.514** 0.284 0.622** 0.408* 0.814** 0.795**
800 0.733** 0.750** 0.749** 0.680** 0.401* 0.156 0.431* 0.187 0.799** 0.773**
UN 400 0.746** 0.659** 0.732** 0.629** 0.192 0.110 0.683** 0.481** 0.744** 0.649**
600 0.737** 0.653** 0.756** 0.647** 0.151 0.120 0.642** 0.560** 0.751** 0.654**
800 0.626** 0.558** 0.599** 0.511** 0.112 0.088 0.475** 0.425* 0.617** 0.539**
1 EN refers to the entire network model for both underground and surficial street networks; UN refers to the underground walking system that is the UPS only. 2 WD represents correlation between pedestrian volume on weekdays and variables. 3 WE represents correlation between pedestrian volume at weekends and variables. *p<0.05 **p<0.01
Table 6. Pearson correlation coefficient between weekday or weekend pedestrian volume and spatial configuration variables of Loushanguan Road UPS (EN Model & UN Model)
Model1 Radius BtE BtA NQPDE NQPDA 0.5(BtE+BtA)
WD2 WE3 WD WE WD WE WD WE WD WE
EN 400 0.395* 0.483** -0.019 -0.058 0.211 0.321 -0.045 0.036 0.228 0.259
600 0.379* 0.388* 0.116 0.078 0.367* 0.332 -0.004 0.047 0.327 0.313
800 0.340 0.286 0.051 0.053 0.314 0.281 -0.029 0.035 0.250 0.216
UN 400 0.536** 0.635** 0.561** 0.665** -0.191 -0.092 -0.098 0.038 0.555** 0.657**
600 0.540** 0.657** 0.583** 0.706** -0.153 -0.053 0.041 0.176 0.571** 0.694**
800 0.562** 0.692** 0.616** 0.754** -0.142 -0.055 0.122 0.199 0.603** 0.740**
1 EN refers to the entire network model for both underground and surficial street networks; UN refers to the underground walking system that is the UPS only. 2 WD represents correlation between pedestrian volume on weekdays and variables. 3 WE represents correlation between pedestrian volume at weekends and variables. *p<0.05 **p<0.01
Table 7. Pearson correlation coefficient between weekday or weekend pedestrian volume and spatial attribute variables of Wujiaochang UPS and Loushanguan Road UPS
UPS Radius MDM MDB PD MDCL
WD1 WE2 WD WE WD WE WD WE
Wujiaochang UPS 400 -0.606** -0.563** 0.467** 0.359* 0.330 0.414* -0.536** -0.583**
600 -0.532** -0.309 0.190 0.297
800 -0.555** -0.421* 0.048 0.159
Loushanguan Road UPS 400 -0.570** -0.564** -0.512** -0.572** 0.223 0.335 -0.626** -0.622**
600 -0.335 -0.339 0.169 0.201
800 -0.346 -0.304 0.114 0.215
1 WD represents correlation between pedestrian volume on weekdays and variables. 2 WE represents correlation between pedestrian volume at weekends and variables. *p<0.05 **p<0.01
Table 8. Partial correlation coefficients between average pedestrian volume and spatial configuration & attribute variables of Wujiaochang UPS (EN Model)
Metric Radius (m) Variable Standardized Coefficient Pearson Correlation Coefficient Partial Correlation Coefficient VIF
400 0.5(BtE400+BtA400) 0.665 0.794** 0.686** 2.270
MDM -0.394 -0.606** -0.297 7.333
MDB400 0.108 0.426* 0.194 1.356
MDB600 -0.018 -0.430* -0.027 1.946
MDB800 0.037 -0.503** 0.056 2.016
MDCL 0.037 -0.583** 0.028 7.610
600 0.5(BtE600+BtA600) 0.706 0.835** 0.767** 2.042
MDM -0.460 -0.606** -0.378* 7.419
MDB400 0.050 0.426* 0.103 1.380
MDB600 0.039 -0.430* 0.067 2.013
MDB800 -0.032 -0.503** -0.059 1.742
MDCL 0.101 -0.583** 0.088 7.661
800 0.5(BtE800+BtA800) 0.671 0.815** 0.783** 1.770
MDM -0.448 -0.606* -0.381* 7.364
MDB400 0.031 0.426* 0.065 1.393
MDB600 0.083 -0.430* 0.142 2.103
MDB800 -0.132 -0.503** -0.254 1.570
MDCL 0.038 -0.583** 0.035 7.390
*p<0.05 **p<0.01
Table 9. Partial correlation coefficients between average pedestrian volume and spatial configuration & attribute variables of Loushanguan Road UPS (UN Model)
Metric Radius (m) Variable Standardized Coefficient Pearson Correlation Coefficient Partial Correlation Coefficient VIF
400 0.5(BtE400+BtA400) 0.446 0.652** 0.622** 1.489
MDM 0.373 -0.605** 0.325 5.579
MDB400 -0.161 -0.581** -0.157 4.859
MDB600 0.262 -0.360 0.354 2.277
MDB800 -0.427 -0.345 -0.448* 3.444
MDCL -0.868 -0.666** -0.696** 3.790
600 0.5(BtE600+BtA600) 0.451 0.681** 0.616** 1.553
MDM 0.374 -0.605** 0.324 5.585
MDB400 -0.182 -0.581** -0.175 4.916
MDB600 0.256 -0.360 0.345 2.272
MDB800 -0.413 -0.345 -0.431* 3.495
MDCL -0.826 -0.666** -0.673** 3.859
800 0.5(BtE800+BtA800) 0.483 0.723** 0.645** 1.625
MDM 0.376 -0.605** 0.334 5.571
MDB400 -0.182 -0.581** -0.180 4.894
MDB600 0.257 -0.360 0.355 2.271
MDB800 -0.405 -0.345 -0.435* 3.489
MDCL -0.787 -0.666** -0.663** 3.927
*p<0.05 **p<0.01
Table 10. Linear regression analysis results of Wujiaochang UPS (EN Model)
Radius Variables Unstandardized Coefficient(β) Standardized Coefficient Partial Correlation Coefficient VIF Adjusted R2
400 Constant 55.204 0.757
0.5(BtE+BtA) 0.007 0.670 0.800** 1.109
MDM -0.063 -0.396 -0.618** 1.109
600 Constant 52.910 0.814
0.5(BtE+BtA) 0.003 0.714 0.851** 1.113
MDM -0.061 -0.378 -0.651** 1.113
800 Constant 55.121 0.813
0.5(BtE+BtA) 0.002 0.703 0.850** 1.080
MDM -0.067 -0.415 -0.690** 1.080
*p<0.05 **p<0.01
Table 11. Linear regression analysis results of Loushanguan Road UPS (UN Model)
Variables Unstandardized Coefficient(β) Standardized Coefficient Partial Correlation Coefficient VIF Adjusted R2
400 Constant 88.098 0.693
0.5(BtE+BtA) 0.005 0.384 0.527** 1.397
MDCL -0.079 -0.585 -0.719** 1.163
MDB800 -0.058 -0.247 -0.381* 1.303
600 Constant 86.512 0.693
0.5(BtE+BtA) 0.003 0.390 0.526** 1.448
MDCL -0.075 -0.560 -0.693** 1.230
MDB800 -0.059 -0.249 -0.384* 1.296
800 Constant 82.375 0.706
0.5(BtE+BtA) 0.002 0.423 0.555** 1.524
MDCL -0.071 -0.523 -0.665** 1.314
MDB800 -0.057 -0.239 -0.378* 1.297
*p<0.05 **p<0.01
Disclaimer/Publisher’s Note: The statements, opinions and data contained in all publications are solely those of the individual author(s) and contributor(s) and not of MDPI and/or the editor(s). MDPI and/or the editor(s) disclaim responsibility for any injury to people or property resulting from any ideas, methods, instructions or products referred to in the content.
Copyright: This open access article is published under a Creative Commons CC BY 4.0 license, which permit the free download, distribution, and reuse, provided that the author and preprint are cited in any reuse.
Prerpints.org logo

Preprints.org is a free preprint server supported by MDPI in Basel, Switzerland.

Subscribe

© 2024 MDPI (Basel, Switzerland) unless otherwise stated