Preprint
Article

Identifying the Drivers of Inter-Regional Patients’ Migration: An analysis on Hospital Beds Endowment

Altmetrics

Downloads

106

Views

31

Comments

0

A peer-reviewed article of this preprint also exists.

Submitted:

29 June 2023

Posted:

30 June 2023

You are already at the latest version

Alerts
Abstract
Background: In a Beveridgean decentralized healthcare system, like the Italian one, where regions are responsible for their own health planning and financing, the analysis of patients’ migration appears very interesting as it has economic and social implications. The study aims to analyze both patients’ migration for hospital rehabilitation and if the beds endowment is a driver for these flows; Methods: from 2011 to 2019, admissions data were collected from the Hospital Dis-charge Cards database of the Italian Ministry of Health, population data from Italian National Institute of Statistics and data of beds endowment from the Italian Ministry of Health website. To evaluate patients’ migration, we used Gandy’s Nomogram, while to assess if beds endowments are mobility drivers, we have created two matrices, one with attraction indexes (AI) and one with escape indexes (EI). The beds endowment, for each Italian region, were correlated with AI and EI. Spearman’s test was carried out through STATA software; Results: Gandy’s Nomogram showed that only some northern regions had good hospital planning for rehabilitation. A statistically significant correlation between beds endowment and AI was found for four regions, while with EI for eight regions. Conclusions: Only some northern regions appear able to satisfy the care needs of their residents, with an attraction minus escapes positive epidemiological balance. The beds endowment seems to be a driver of Patients’ migration, mainly for escapes. Certainly, the search for mobility drivers needs further investigation given the events in Molise and Basilicata.
Keywords: 
Subject: Public Health and Healthcare  -   Health Policy and Services

1. Introduction

In recent years, globalization, and the resulting growth in the market for healthcare have promoted patients’ travel between countries to access healthcare services [1,2]. The healthcare services for which patients are willing to travel range from fertility treatments to dental care and various types of surgery [3]. Consequently, the analysis of cross-border patient migration has lately become a hot topic for policymakers and researchers from different disciplines [4,5,6]. Even if the focusing international dynamics masks the fact that patient migration often occurs within national borders, this is particularly evident in decentralized, tax-funded healthcare systems characterized by significant long stories of socio-economic disparities between regions, such as in Italy [4,7,8]. Then, the analysis of this phenomenon not only involves aspects such as the quality of health services (real or perceived) and equity of access it also has important economic implications [9,10,11]. In Italy, the National Health Service (NHS), established in 1978 is financed through general taxation at the central level, while planning and resource allocation takes place at the local level. Since the 1990s, the NHS has experienced a strong process of decentralization, ending in 2001 with a constitutional reform that established fiscal decentralization for the health sector. So, the NHS was restructured into several regional systems, each responsible for planning services and allocating resources and financing them [8,12,13]. These reforms have set up a quasi-market system in which the health services of each region are in potential competition with each other [9,14]. The process of decentralization has produced mixed results, as some regions have taken advantage of it to strengthen their systems, while others have been unable to develop an effective steering role [12]. In this context of competition, where the patient is free to choose, the study of these flows appears to be very interesting as their determinants could challenge universalism and equity of access at the national level [15,16]. Today, the factors influencing the choice of place of care are heterogeneous [17,18]. They include the socio-economic status [19], the patient’s clinical severity [20,21], the reputation of the hospital department and direct knowledge of the physician working there [22], the waiting times [23], the distance and clinical quality of the hospital [24]. Other factors influencing patient-service interaction include technological equipment [25], the level of specialization and the number of doctors per patient [26,27]. Finally, recent studies have highlighted the importance of regulatory issues in driving patients’ migration [10,14]. However, despite the flourishing literature, little is still known about the process that leads to choosing a specific place of care [28].
The study aims are: (i) to evaluate the fulfilment of needs on site and patients' migration for hospital rehabilitation and (ii) to investigate if beds endowment drives patients’ migration.

2. Materials and Methods

2.1. Admissions, beds endowment, population data and catchment area

Admissions data were collected from the Hospital Discharge Cards (HDCs) database of the Italian Ministry of Health from 2011 to 2019. We included the hospitalisation of Italian patients for hospital rehabilitation for all Major Diagnostic Categories (MDCs). We excluded the hospitalisation of patients residing in other states and the admissions of Italian patients to a foreign hospital. Beds endowment data were collected from the Italian Ministry of Health website, which publishes a report with the total number of beds endowment divided by year, region and type of activity (acute, rehabilitation and long-term care) [29]. We included all beds endowment only for the hospital rehabilitation activity. Population data were extracted from “Health for All”, a database periodically released by the Italian National Institute of Statistics [30]. To indicate the number of beds per 1,000 inhabitants for region Xi (with i = 1,….,21) and for year Yi (i = 2011,….,2019) was calculated through the following formula.
NB x 1,000 inhabitants Xi/Yi = TB x 1,000 / TP
Where NB x 1,000 inhabitants Xi/Yi = number of beds x 1,000 inhabitants for region Xi and for year Yi; TB = total beds endowment in the area Xi and for the year Yi; TP = total population in the year Yi.
As a catchment area, we considered every single Italian region. For each Italian region, the healthcare mobility flows were carried out through data of hospitalisation of Residents in their own region (R), of Attractions from other regions (A) and of Escapes to other regions (E).

2.2. Gandy's Nomogram

Hospitalization of R, A and E data were processed through Gandy’s Nomogram, which makes it possible to provide a brief representation of the access to the hospital facilities allocated in a given catchment area In fact, it is useful for comparing many geographical areas in a single representation, and also allows trends over time to be analysed [9,13,31,32,33]. Gandy’s Nomogram is a squared area placed in a Cartesian plan with the side of 100, this one can be divide into four squares by two lines parallel to the two axis; wich start at X=0, Y=50 and X=50; Y=0. A diagonal divides the plan in an upper area, in which the Y value is higher than the X one; in this part of Cartesian plan there are more Attractions than Escapes. The lower area shows the opposite situation. The diagonal start from the point named “O” with coordinates X=0 and Y=0 and end in the point named “W” with coordinates X=100 and Y=100. In the point O the Attrations have a maximum value, while in the point W are null. When the point falls on the diagonal, the values of Attractions and Escapes are equal.
The value in the x-axis (X) indicates Residents (R) out of Residents (R) plus the Attractions (A) as in the following formula:
X = R / (R+A) x 100
The value in the y-axis (Y) inicates Residents (R) out of Residents (R) plus the Escapes (E) as in the followinf formula:
Y = R / (R+E) x 100
The four quadrand obtained in the Cartesian plan show the different capacity of a catchment area to satisfy the needs of their Residents and its epidemiological balance Attractions minus Escapes:
-The upper left quadrant describes the catchment areas “marked oriented”, in which are admitted more patients attracted than residents and the Escapes are minus than Attractions and Residents admission (E < R < A). In the point X = 0 and Y = 100 is shown the paradoxical condition in which are admitted only attracted patients and there are no Escapes.
-The upper right quadrant describes the catchment areas, which are able to meet the care needs of their residents on site. In part above the bisector, named “hemi-quadrant of quality) the Attractions are more than Escapes and the latter less than residents’ admissions (E < A < R). In the part under the bisector the Escapes are more than Attractions and the letter are less residents’ admissions.
-The lower less quadrant describes the catchment areas in which the residents’ admissions are less both Escapes and Attractions. In the part above the bisector the Escapes are lower than Attractions (R < E < A), while in the part under the bisector are shown the opposite situatiuon (A < R < E).
-The lowe right quadrant descibes the catchment areas in which the residents’ admission are lower than Escapes, but higher than Attractions (A < R < E).

2.3. Attraction and Escape Indexes

To measure the incidence of attraction and escapes in a region, we used the Attraction Index (AI) and the Escape Index (EI) [34]. The AI indicates the percentage of Attraction (A) out of the total admissions in the Region (A + R) in the following formula:
AI = A/(R + A) × 100
The EI indicates the percentage of Escapes (E) out of the total discharges of residents wherever hospitalised (R + E) in the following formula:
EI = E/(R + E) × 100.
These two indexes allow us to quantify both a region's capacity to attract patients (AI) and the propensity of its citizens to leave (EI).

2.4. Graphical representation of AI, EI and NB x 1,000 inhabitants:

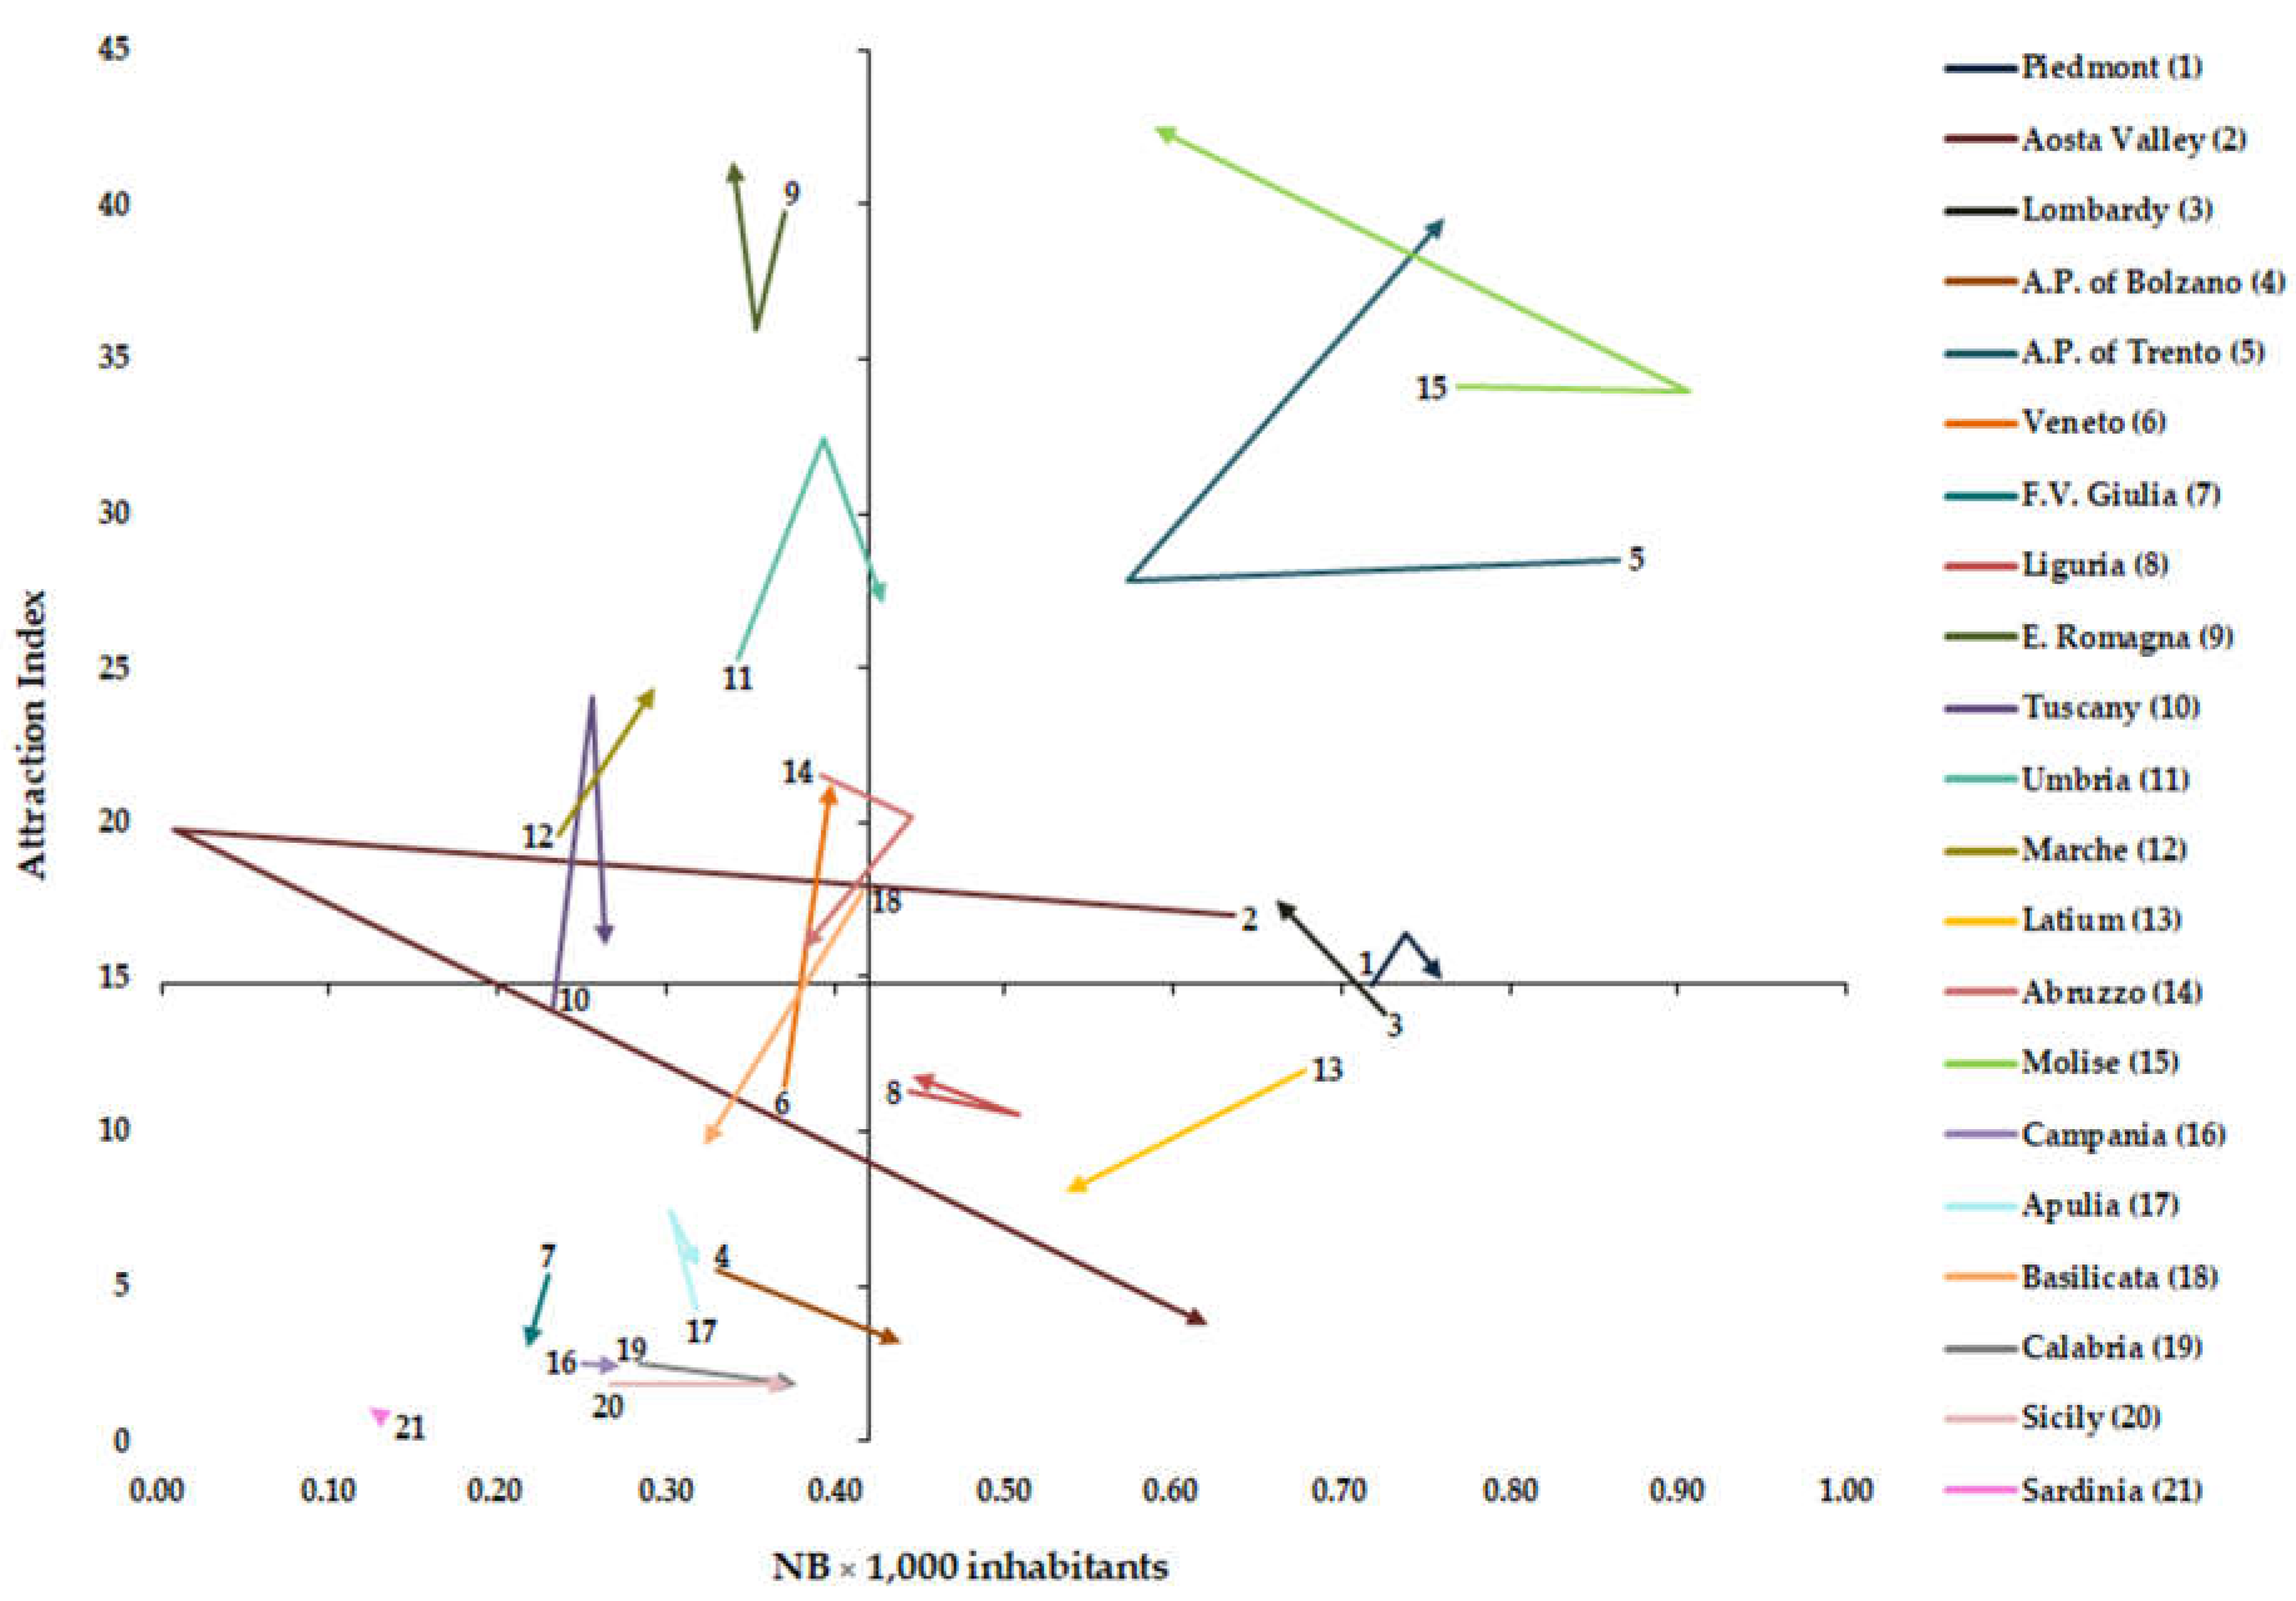
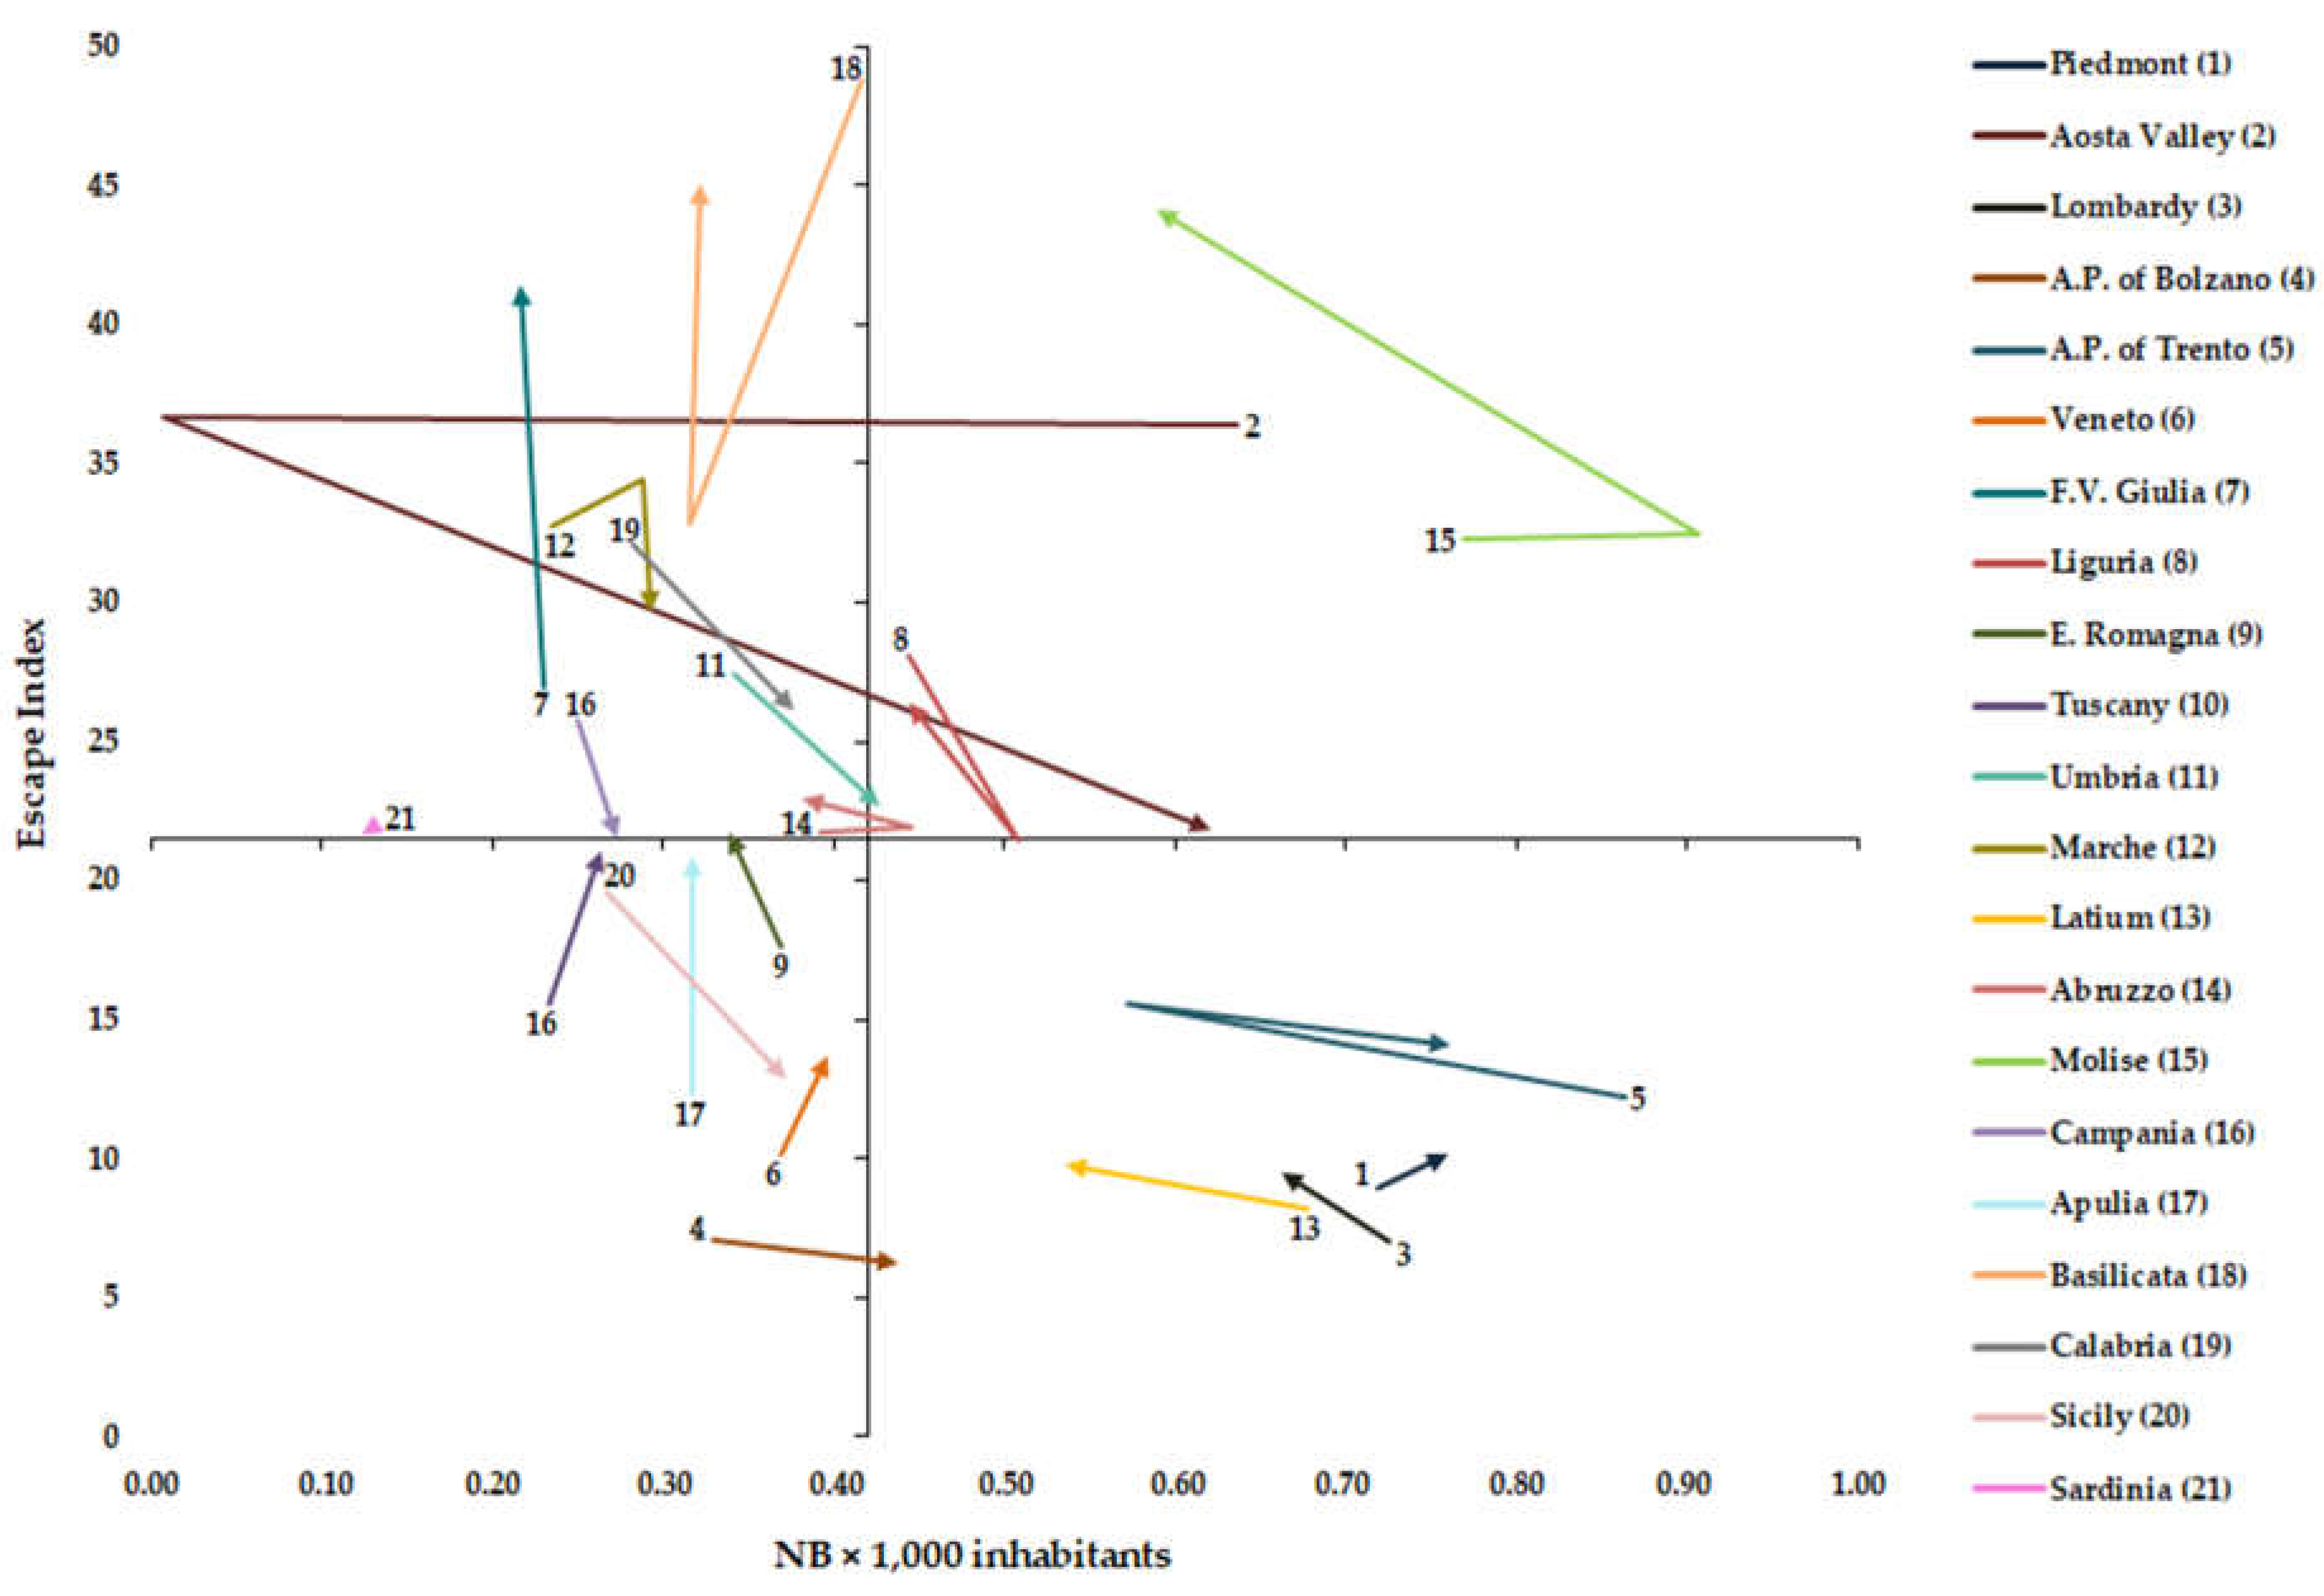
From these two indexes (AI and EI) and the NB x 1,000 inhabitants, we created two matrices model, one for attractions and one for escapes. For both models, we have designed a cartesian plan. In the x-axis was always the NB x 1,000 inhabitants. In the y-axis, the first model was the AI, while the second was EI. In both cartesian planes, the two axes were intersected at the national mean of NB x 1,000 inhabitants and the corresponding national mean of the index (AI or EI) [1].

2.5. Vectorial and statistical analysis

For every region, both for Gandy’s Nomogram and for the two graphical representations mentioned above, the point born from the coordinates of the X and Y axis were linked to obtaining a vector. If there were a monophasic trend over the years (same direction of the points), 2011 was linked to 2019. If there was a biphasic trend over the years (change of law), 2011 was linked to the point of changing direction, which was linked to 2019 [13,31,35]. STATA software SE/14.0 (StataCorp LLC, College Station, TX, USA) were used for statistical analysis. Trends were studied with Cuzick’s test, the difference in the ORD/DH ratio between residents and mobility admissions was studied with the Mann-Whitney U-test. Finally, the correlations between AI, EI and NB x 1,000 inhabitants were studied through Sperman’s rank correlation test. The level of significance was set up at the level of 95% (p < 0.05).

3. Results

Table 1 shows the admissions, in ordinary regime (ORD) and Day Hospital (DH), for hospital rehabilitation divided into residents and mobility from 2011 to 2019. In the studied period, the total number of admissions decreased (p<0.05), even if the hospitalization in mobility increased (p<0.05). The hospitalizations in ORD regime increased (p<0.05) for mobility admissions, while for residents, after the initial increase, they decreased to lower values than at the start. The admissions in DH decreased (p<0.05) both for residents and for mobility. Thus the ORD/DH ratio increased (p<0.05). Moreover, ORD/DH ratios varied if admissions were in mobility or for residents (p<0.05).
Figure 1 shows the upper right quadrant of Gandy’s Nomogram for each Italian region for hospital rehabilitation from 2011-2019. Only Piedmont, Lombardy, A.P. of Trento, Veneto, and E. Romagna were in the hemi-quadrant of quality for all studied periods. Molise and Latium lost their good position in the last years of the studied period, while Umbria improved it. Tuscany had bypassed the bisector, only to return to the starting hemi-quadrant in 2018. The attractions increased significantly for Lombardy, A.P. of Trento, Veneto and Molise, while they decreased significantly for Aosta Valley, A.P. of Bolzano, F.V. Giulia, Abruzzo and Basilicata (p<0.05). Escapes decreased significantly for Aosta Valley, Campania, Calabria, and Sicily, while they increased substantially for Veneto, F.V. Giulia, E. Romagna, Tuscany, Lazio, Molise, and Apulia (p<0.05).
Table 2 shows the NB x 1,000 inhabitants for of every Italian region for the years from 2011 to 2019. At the national level, the average values of NB x 1,000 inhabitants were 0,49 with higher value in 2019 and lower in 2012, 2013 and 2015. It was higher for Piedmont, Aosta Valley (except in 2011), Lombardy, A.P. of Trento, Latium, and Molise. In the studied period, the NB x 1,000 inhabitants increased significantly (p<0.05) for A.P. of Bolzano, Tuscany, Umbria, Marche, and Sicily, while decreased significantly (p<0.05) for E. Romagna and Latium.
Figure 2 shows the matrix between NB x 1,000 inhabitants and Attraction Index (AI) from 2011 to 2019. The AI increased significantly (p<0.05) for Lombardy, A.P. of Trento, Veneto, and Apulia, while it decreased for Aosta Valley, A.P. of Bolzano, F.V. Giulio, Abruzzo, and Basilica (p<0.05). A statistically significant correlation between NB x 1,000 inhabitants and AI was for Veneto (Spearman’s rho= 0.7000), Latium (Spearman’s rho= 0.7333), Molise (Spearman’s rho= -0.8667) and Basilicata (Spearman’s rho= 0.8500).
Figure 3 shows the matrix between NB x 1,000 inhabitants and Escape Index (EI) from 2011 to 2019. The EI decreased significantly (p<0.05) for Aosta Valley, Campania, Sicily, and Calabria, while it increased for Lombardy, Veneto, F.V. Giulia, E. Romagna, Tuscany, Latium, Molise, and Apulia (p<0.05). A statistically significant correlation between NB x 1,000 inhabitants and EI was for A.P. of Bolzano (Spearman’s rho= -0.667), E. Romagna (Spearman’s rho= -0.7000), Umbria (Spearman’s rho= -0.6667), Latium (Spearman’s rho= -0.8333), Molise (Spearman’s rho= -0.7333), Basilicata (Spearman’s rho= 0.7667), Calabria (Spearman’s rho= -0.7776) and Sicily (Spearman’s rho= -0.9500).

4. Discussion

Cross-border patients’ migration is becoming a predominant phenomenon for the reallocation of healthcare resources between countries, regions, and provinces [36]. In Italy, approximately one in ten hospital admissions are due to patient mobility, and this phenomenon indirectly indicates how the Italian NHS's mission is being pursued: to meet the care needs of its residents on-site [9,37]. Some flows may be considered “physiological” because they are due either to shifts of patients between bordering areas or to the size of the catchment areas of high specialty hospitals: the latter may pose a threat to equity in that patients from lower socio-economic groups may find it difficult to bear the costs of moving [38]. Other flows must be considered 'pathological' since they are related to both qualitative and quantitative (real/perceived) inadequacy of the healthcare offer on site: this might cause discomfort to the citizen who must turn to healthcare facilities outside his area to obtain better conditions in terms of quality and accessibility of care [9,39]. Although, low hospital quality may persist in the long run because the local population may find good hospital quality elsewhere. Therefore, it is essential for the national government to implement some policies that can improve the quality of hospitals in regions with low hospital quality. In fact, an NHS with asymmetrical quality of healthcare in different regions could generate social problems for the local population [40]. However, it is not easy to imagine a healthcare system that provides all types of services, especially those of high complexitỳ, in every territorial context. The study aims to assess how the various regional health services responded to the demand for rehabilitation hospital services and the inter-regional patients’ migration for these flows. In addition, we analyzed whether there is a correlation between the rehabilitation hospital beds endowment and the mobility flows studied.
During the period studied, the demand for total hospital rehabilitation decreased, while the one for orthopedic intensive rehabilitation increased [31] due to a significant reduction in DH admissions. The increase in rehabilitation admissions in ORD does not justify such a high decrease in DH. This logically caused an increase in the ORD/DH ratio of both resident and mobility admissions; for the latter it was more pronounced. The reasons could be due to a more strategic allocation of resources and a consequent more efficient reorganization of outpatient rehabilitation activity [41], thus leading to a shift of the demand to the outpatient level. Indeed, the outpatient system plays a central role in meeting the population's needs at a more local level [42]. At the same time, mobility admissions increased (+2% approximately), showing higher values than “acute” hospital admissions [9].
Although all regions appear to be able to meet the rehabilitation needs of their residents on-site, Gandy’s Nomogram shows a heterogeneous pattern with only a few areas in northern Italy with a positive epidemiological balance (attractions minus escapes) for all studied years. Umbria, in contrast to Latium, in addition to having implemented interests for a few years, seems to have started a process of escape recovery. Other regions, such as Tuscany and Molise had implemented attractions, but this was not enough to keep a positive epidemiological balance due to the increase in escapes. The islands and some southern regions show low attractiveness, but they, too, have started on a path of decreasing escapes.
In the analysis of mobility drivers, it is important to differentiate the factors that can be controlled by policymakers (quality, regulation issues, and availability of resources) and those minimally influenced by health policies (macroeconomic, social, and individual factors) [1]. Higher values of NB x 1000 inhabitants were observed for four regions in the north (Piedmont, Aosta Valley, Lombardy and A.P. of Trento), one in the center (Latium) and one in the south (Molise). Aosta Valley, Lombardy and Molise show confirm, for hospital rehabilitation, above-average values of beds as shown for that in acute hospitals [9]. Certainly, these regions have a strong tendency to keep their beds endowment high. Over the period studied, a significant increase in rehabilitation beds has been observed for five regions (A.P. of Bolzano, Tuscany, Umbria, Marche, and Sicily), although this does not indicate a higher quality of care [1] but could indicate a better response to the demand for care from its citizens. In our work, for some areas, in contrast to the results of another study [43], the beds endowment is correlated with the choice of the place of care. Specifically, we found a positive correlation between AI and beds endowment for three regions (Veneto, Latium, and Basilicata), while Molise shows a negative correlation. With EI, a negative correlation, as logical, was found for seven regions (A.P. of Bolzano, E. Romagna, Umbria, Latium, Molise, Calabria, and Sicily), while a positive correlation for Basilicata. This heterogeneity may be due to the different characteristics of the various regional systems in which the role of competition appears very different. In fact, in a more centralized system such as that of E. Romagna all hospitals are perceived as homogeneous providers, and therefore patients are less aware of differences in clinical quality. Whereas in other more decentralized contexts, where competition between providers is more aggressive, patients are more aware that quality is different between them [28]. The situation found in Basilicata and Molise, the latter region also has beds values above the national average, might make us reflect on the fact that in smaller regions, where the whole territory 'is border', it is necessary to investigate other factors influencing patient migration. These are probably not to be found in the structural endowment of their hospitals, but, for example, should be found in the waiting times or in the availability of services in a specific area of the region where a particular health service is not provided [18].

Limitations

This study has some limitations: (i) the data analyzed predates the pandemic period; we chose not to analyze 2020 because Covid-19 changed healthcare planning and organization, and therefore there may have been a new organizational setting in terms of beds utilization; (ii) we analyzed hospital rehabilitation in its totally without breaking it down by pathologies; (iii) we do not quantify proximity mobility (movements from areas near regional borders), but we considered the flows in total.

5. Conclusions

Inter-regional patients ‘migration for hospital rehabilitation is a phenomenon that has increased in recent years, so it is crucial to understand the drivers of this phenomenon. The results show that some northern regions seem to meet the needs of their residents better, maybe also due to their higher beds endowment, and perform better in attracting patients. However, outflows for some areas seem to decrease on the islands and in some southern regions, which show low attractiveness. In the long run, this phenomenon, constantly growing, could generate even more regional disparities and risk causing discrimination between different citizens in different regions, especially in those with lower socio-economic statuses.
For some regions, the bed's endowment seems to drive patient migration. Notably, we observed that a decrease in the endowment is correlated with an increase in escapes to extra-regional hospitals in one-third of the Italian regions. Indeed, the search for the drivers of patient migration needs further investigation, especially considering the events in Molise and Basilicata.
We believe the tools used to analyze the correlation between mobility indicators and beds endowment can provide valuable insight for policymakers. Furthermore, it could be applied in relating other structural factors, such as the number of doctors per patient, both to provide easy-to-read indications to health policymakers and to identify possible other drivers of patients’ migration.

Author Contributions

Conceptualization, G.G. and N.N.; methodology, G.G.; validation, G.G., G.M. and N.N.; formal analysis, G.G. and G.M.; investigation, G.G.; resources, S.C.; data curation, S.C.; writing—original draft preparation, G.G. and N.N.; writing—review and editing, G.G.; G.M. and N.N.; visualization, G.G.; supervision, G.M. and N.N.; project administration, S.C. and N.N.; All authors have read and agreed to the published version of the manuscript.

Funding

This research received no external funding.

Institutional Review Board Statement

Not applicable.

Informed Consent Statement

Not applicable.

Data Availability Statement

Data obtained from HDCs database—General Directorate for Health Planning of Italian Ministry of Health upon specific request.

Conflicts of Interest

The authors declare no conflict of interest.

References

  1. Ricci, A.; Barzan, E.; Longo, F. How to identify the drivers of patient inter-regional mobility in beveridgean systems? Critical review and assessment matrix for policy design & managerial interventions. Health Serv. Manage. Res. 2021, 34, 258–268. [Google Scholar] [CrossRef] [PubMed]
  2. Lunt, N.; Mannion, R. Patient mobility in the global marketplace. A multidisciplinary perspective. Int. J. Health Policy Manag. 2014, 2, 155–157. [Google Scholar] [CrossRef] [PubMed]
  3. Horsfall, D. Medical tourism from the UK to Poland: How the market masks migration. J. Ethn. Migr. Stud. 2019, 46, 4211–4229. [Google Scholar] [CrossRef]
  4. Perna, R.; Cruz-Martínez, G.; Moreno Fuentes, F.J. Patient mobility within national borders. Drivers and politics of cross-border healthcare agreements in the Spanish decentralized system. Health Policy. 2022, 126, 1187–1193. [Google Scholar] [CrossRef] [PubMed]
  5. Yang, Y.; Wang, Y. Analysis of the charateristics of Cross-Regional Patient Group and Differences in Hospital Service Utilization in Beijin. Int. J. Environ. Res. Public Health 2022, 19, 3227. [Google Scholar] [CrossRef]
  6. Diesenreiter, C.; Österle, A. Patients as EU citizens? The implementation and corporatist stakeholders’ perceptions of the EU cross-border health care directive in Austria. Health Policy 2021, 125, 1498–1505. [Google Scholar] [CrossRef]
  7. Pecoraro, F.; Luzi, D.; Clemente, F. The Impact of Hospital Accessibility on Interregional Patient Mobility in Italy. Stud Health Technol Inform. 2022, 25, 684–688. [Google Scholar] [CrossRef]
  8. Rotulo, A.; Paraskevopoulou, C.; Kondilis, E. The Effects of Health Sector Fiscal Decentralisation on Availability, Accessibility, and Utilisation of Healthcare Services: A Panel Data Analysis. Int J Health Policy Manag. 2021, 11, 2440–50. [Google Scholar] [CrossRef]
  9. Nante, N.; Guarducci, G.; Lorenzini, C.; Messina, G.; Carle, F.; Carbone, S.; Urbani, A. Inter-Regional Hospital Patients’ Mobility in Italy. Healthcare 2021, 9, 1182. [Google Scholar] [CrossRef]
  10. Fattore, G.; Petrarca, G.; Torbica, A. Traveling for care: Inter-regional mobility for aortic valve substitution in Italy. Health Policy 2014, 117, 90–97. [Google Scholar] [CrossRef]
  11. Aggarwal, A.; Lewis, D.; Mason, M.; Sullivan, R.; Van Der Meulen, J. Patient Mobility for Elective Secondary Health Care Services in Response to Patient Choice Policies: A Systematic Review. Med. Care Res. Rev. 2016, 74, 379–403. [Google Scholar] [CrossRef] [PubMed]
  12. Lega, F.; Sargiacomo, M.; Ianni, L. The rise of governmentality in the Italian National Health System: physiology or pathology of a decentralized and (ongoing) federalist system? Health Serv Manage Res. 2010, 23, 172–80. [Google Scholar] [CrossRef] [PubMed]
  13. Nante, N.; Messina, G.; Lispi, L.; Serafini, A.; Prisco, G.; Moirano, F. Mobility trends of Patients across Italian Regions: implications for planning and evaluation of hospital services. Ann Ig. 2016, 28, 328–38. [Google Scholar]
  14. Int J Health Policy Manag. 2015, 4, 363–72. [CrossRef]
  15. Balia, S.; Brau, R.; Moro, D. Choice of hospital and long-distances: Evidence from Italy. Reg. Sci. Urban Econ. 2020, 81, 103502. [Google Scholar] [CrossRef]
  16. Levaggi, R.; Zanola, R. Patients’ migration across regions: The case of Italy. Appl. Econ. 2004, 36, 1751–1757. [Google Scholar] [CrossRef]
  17. Ferré, F.; Seghieri, C.; Nuti, S. Women's choices of hospital for breast cancer surgery in Italy: Quality and equity implications. Health Policy. 2023, 131, 104781. [Google Scholar] [CrossRef]
  18. Pecoraro, F.; Accordino, F.; Cecconi, F.; Paolucci, M. Agent Based Modelling for Simulating the Interregional Patient Mobility in Italy. Stud Health Technol Inform. 2023, 302, 297–301. [Google Scholar] [CrossRef]
  19. Rubino, C.; Di Maria, C.; Abbruzzo, A.; Ferrante, M. Socio-economic inequality, interregional mobility and mortality among cancer patients: A mediation analysis approach. Socio-Econ. Plan. Sci. 2022, 82, 101247. [Google Scholar] [CrossRef]
  20. Beukers, P.D.C.; Kemp, R.G.M.; Varkevisser, M. Patient hospital choice for hip replacement: Empirical evidence from the Netherlands. Eur. J. Health Econ. 2013, 15, 927–936. [Google Scholar] [CrossRef]
  21. Ruwaard, S.; Douven, R.C.M.H. Hospital Choice for Cataract Treatments: The Winner Takes Most. Int. J. Health Policy Manag. 2018, 7, 1120–1129. [Google Scholar] [CrossRef] [PubMed]
  22. Nante, N.; Ricchiardi, G.; Al Farraj, O.; Morgagni, S.; Siliquini, R.; Moirana, F.; Messina, G.G.; Sassi, F. Hospital patient migration: Analysis using a utility index. In Public Health in Europe; Kirch, W., Ed.; Springer: Berlin/Heidelberg, Germany, 2004; pp. 293–316. [Google Scholar]
  23. Sivey, P. The effect of waiting time and distance on hospital choice for English cataract patients. Health Econ. 2012, 21, 444–56. [Google Scholar] [CrossRef]
  24. Moscelli, G.; Siciliani, L.; Gutacker, N.; Gravelle, H. Location, quality and choice of hospital: Evidence from England 2002-2013. Reg Sci Urban Econ. 2016, 60, 112–124. [Google Scholar] [CrossRef] [PubMed]
  25. Pinto, C. Percived quality and formation of inter-regional networks of health care migration. Adv. Manag. Appl. Econ. 2017, 7, 93–111. Available online: https://www.scienpress.com/journal_focus.asp?main_id=55&Sub_id=IV&Issue=259775 (Accessed on 27 May 2023).
  26. Schnatz, P.F.; Murphy, J.L.; O'Sullivan, D.M.; Sorosky, J.I. Patient choice: comparing criteria for selecting an obstetrician-gynecologist based on image, gender, and professional attributes. Am J Obstet Gynecol. 2007, 197, 548.e1–7. [Google Scholar] [CrossRef] [PubMed]
  27. Howell, E.A.; Gardiner, B.; Concato, J. Do women prefer female obstetricians? Obstet Gynecol. 2002, 99, 1031–5. [Google Scholar] [CrossRef] [PubMed]
  28. Martini, G.; Levaggi, R.; Spinelli, D. Is there a bias in patient choices for hospital care? Evidence from three Italian regional health systems. Health Policy. 2022, 126, 668–679. [Google Scholar] [CrossRef]
  29. Italian Ministry of Health. Beds per hospital facility. Available online: https://www.dati.salute.gov.it/dati/dettaglioDataset.jsp?menu=dati&idPag=114 (Accessed on 3 April 2023).
  30. ISTAT. Health for All—Italia. Update December 2022. Available online: http://www.istat.it/it/archivio/14562. (Accessed on 3 January 2023).
  31. Guarducci, G.; Messina, G.; Carbone, S.; Urbani, A.; Nante, N. Inter-Regional Patients’ Migration for Hospital Orthopedic Intensive Rehabilitation: The Italian Experience. Int. J. Environ. Res. Public Health 2022, 19, 13726. [Google Scholar] [CrossRef]
  32. Gandy, R.J. A graphical representation of the inter-relationship between districts. Hosp. Health Serv. Rev. 1979, 75, 50–51. [Google Scholar]
  33. Gandy, R.; Franci, A.; Gurrieri, C.; McClelland, R. Demonstrating Access to Public Services Diagrammatically. Int. J. Public Adm. 2011, 34, 516–527. [Google Scholar] [CrossRef]
  34. De Curtis, M.; Bortolan, F.; Diliberto, D.; Villani, L. Pediatric interregional healthcare mobility in Italy. Ital. J. Pediatr. 2021, 47, 1–7. [Google Scholar] [CrossRef]
  35. Griffiths, I.W. Principles of Biomechanics & Motion Analysis; Lippincott Williams & Wilkins: Philadelphia, PA, USA, 2006. [Google Scholar]
  36. Blàsquez-Fernàndez, C.; Cantarero-Prieto, D.; Pascual-Sàez, M. Patient cross-border mobility: New findings and implications in Spanish regions. Econ. Sociol. 2017, 10, 11–21. [Google Scholar] [CrossRef]
  37. Berta, P.; Guerriero, C.; Levaggi, R. Hospitals’ strategic behaviours and patient mobility: Evidence from Italy. Socio-Econ. Plan. Sci. 2021, 77, 101030. [Google Scholar] [CrossRef]
  38. Rubino, C.; Di Maria, C.; Abbruzzo, A.; Ferrante, M. Socio-economic inequality, interregional mobility and mortality among cancer patients: A mediation analysis approach. Socio-Econ. Plan. Sci. 2022, 82, 101247. [Google Scholar] [CrossRef]
  39. Conference of the Regions and Autonomous Provinces. Health Pact 2019-2021. Available online: http://www.regioni.it/newsletter/n-3750/del-07-01-2020/patto-per-la-salute-2019-2021-il-testo-20616/ (Accessed on 10 June 2023).
  40. Berta, P.; Martini, G.; Spinelli, D.; Vittadini, G. The beaten paths effect on patient inter-regional mobility: An application to the Italian NHS. Papers in Regional Science. 2022, 101, 945–77. [Google Scholar] [CrossRef]
  41. Calovi, M.; Seghieri, C. Using a GIS to support the spatial reorganization of outpatient care services delivery in Italy. BMC Health Serv Res. 2018, 18, 883. [Google Scholar] [CrossRef]
  42. Seghieri, C.; Calovi, M.; Ferrè, F. Proximity and waiting times in choice models for outpatient cardiological visits in Italy. PLoS One. 2018, 13, e0203018. [Google Scholar] [CrossRef]
  43. Roh, C.Y.; Lee, K.H.; Fottler, M.D. Determinants of hospital choice of rural hospital patients: the impact of networks, service scopes, and market competition. J Med Syst. 2008, 32, 343–53. [Google Scholar] [CrossRef]
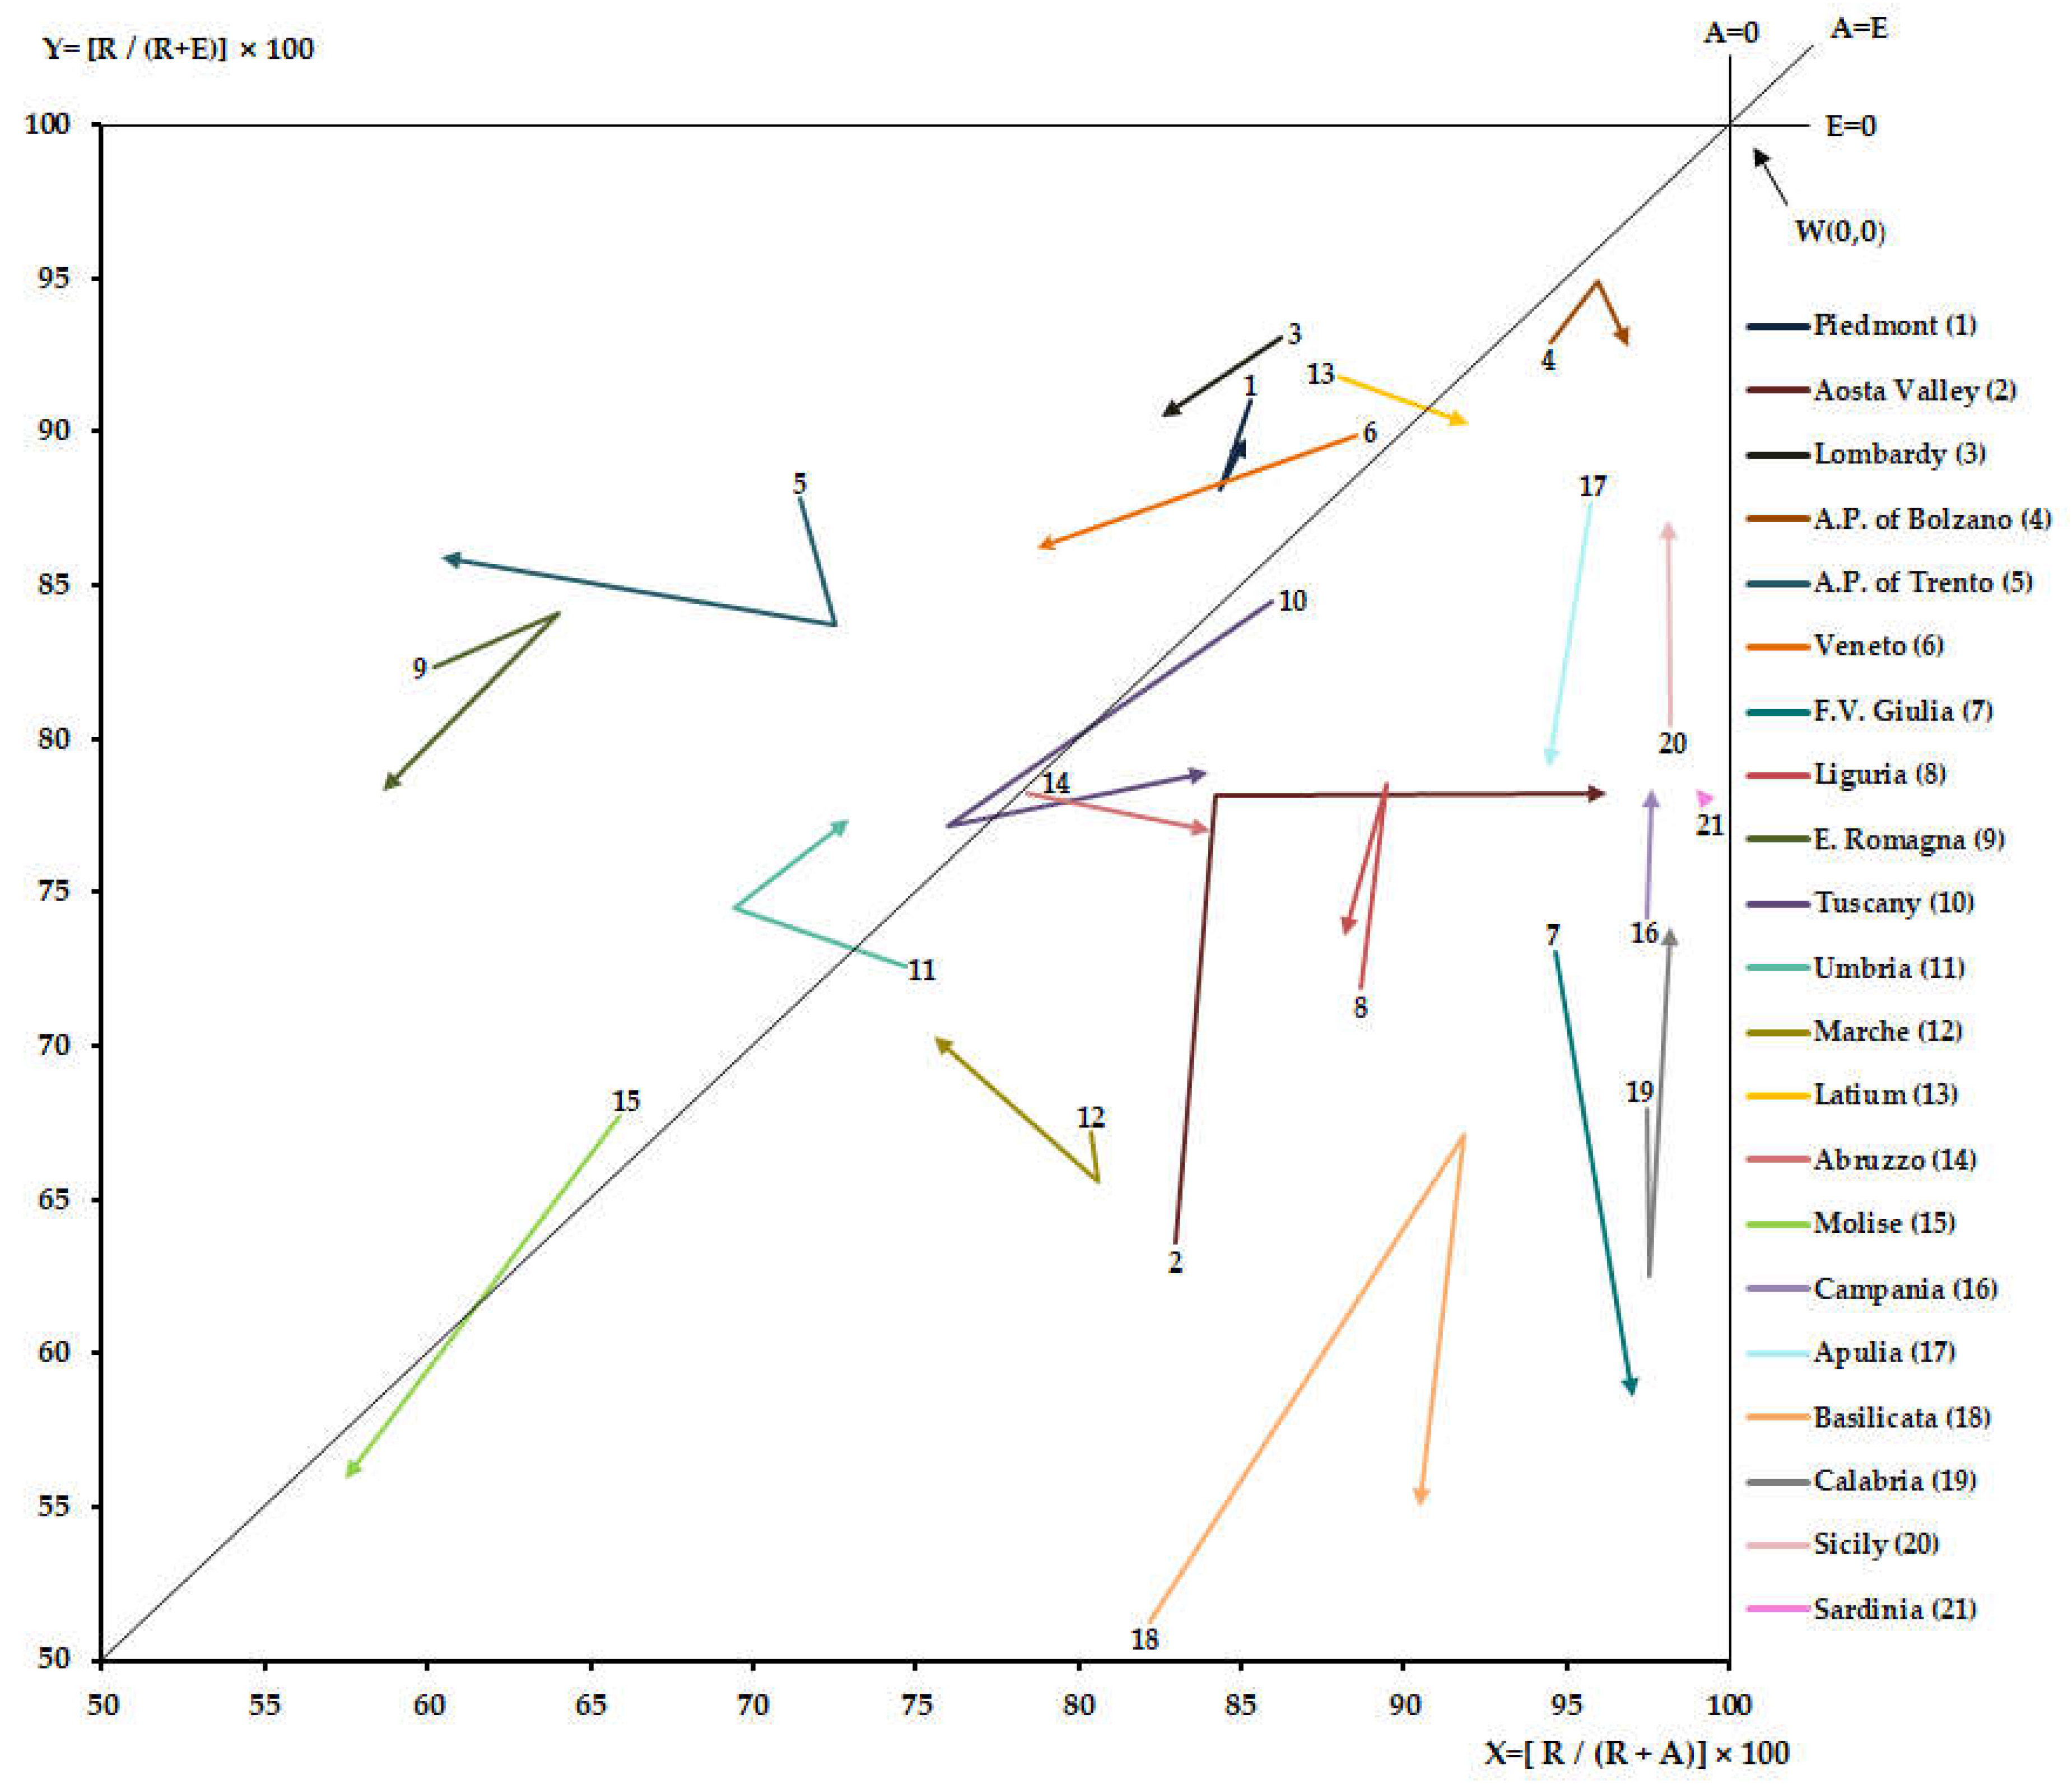
Figure 1. Upper right quadrant of Gandy’s Nomogram, Italian regions 2011-2019.
Preprints 78062 g001
Figure 2. Graphical representation of NB x 1,000 inhabitants and AI.
Preprints 78062 g002
Figure 3. Graphical representation of NB x 1,000 inhabitants and EI.
Preprints 78062 g003
Table 1. Patients’ admissions to Italian hospitals for rehabilitation, 2011–2019.
Year Residents Mobility Total Total (ORD+DH)
ORD DH ORD/DH ORD DH ORD/DH ORD DH ORD/DH
2011 263,884 47,550 5.55 44,067 5,733 7.69 307,951 53,283 5.78 361,234
2012 266,029 39,783 6.69 46,069 5,328 8.65 312,098 45,111 6.92 357,209
2013 269,373 36,419 7.40 48,132 4,452 10.81 317,505 40,871 7.77 358,376
2014 265,473 31,692 8.38 48,462 3,173 15.27 313,935 34,865 9.00 348,800
2015 267,010 30,812 8.67 50,466 3,236 15.60 317,476 34,048 9.32 351,524
2016 265,753 28,905 9.19 51,796 2,949 17.56 317,549 31,854 9.97 349,403
2017 263,474 27,716 9.51 51,579 3,001 17.19 315,053 30,717 10.26 345,770
2018 260,856 25,477 10.24 50,596 2,974 17.01 311,452 28,451 10.95 339,903
2019 261,481 25,524 10.24 49,386 3,092 15.97 310,867 28,616 10.86 339,483
Table 2. NB x 1,000 inhabitants, Italian region 2011-2019.
Region 2011 2012 2013 2014 2015 2016 2017 2018 2019
Piedmont 0,72 0,75 0,75 0,74 0,74 0,74 0,74 0,75 0,76
Aosta Valley 0,64 0,01 0,51 0,61 0,59 0,59 0,59 0,62 0,62
Lombardy 0,73 0,67 0,65 0,65 0,66 0,67 0,66 0,66 0,66
A.P. of Bolzano 0,33 0,33 0,34 0,37 0,37 0,43 0,42 0,44 0,35
A.P. of Trento 0,86 0,57 0,80 0,75 0,69 0,69 0,71 0,70 0,76
Veneto 0,37 0,37 0,37 0,37 0,38 0,40 0,40 0,40 0,40
F.V. Giulia 0,23 0,22 0,24 0,24 0,23 0,24 0,23 0,23 0,22
Liguria 0,44 0,41 0,48 0,51 0,43 0,46 0,45 0,45 0,44
E. Romagna 0,37 0,37 0,36 0,35 0,35 0,35 0,34 0,34 0,34
Tuscany 0,23 0,24 0,24 0,25 0,26 0,25 0,24 0,26 0,26
Umbria 0,34 0,35 0,39 0,39 0,39 0,40 0,42 0,43 0,43
Marche 0,24 0,24 0,25 0,25 0,26 0,29 0,29 0,29 0,29
Latium 0,68 0,59 0,56 0,56 0,55 0,54 0,54 0,53 0,54
Abruzzo 0,39 0,39 0,39 0,38 0,38 0,45 0,38 0,39 0,38
Molise 0,77 0,75 0,91 0,78 0,77 0,77 0,65 0,65 0,59
Campania 0,25 0,24 0,25 0,25 0,24 0,25 0,25 0,25 0,27
Apulia 0,32 0,30 0,31 0,31 0,30 0,30 0,30 0,30 0,32
Basilicata 0,42 0,33 0,34 0,34 0,34 0,32 0,32 0,32 0,32
Calabria 0,28 0,26 0,32 0,41 0,37 0,36 0,40 0,41 0,38
Sicily 0,27 0,29 0,31 0,32 0,32 0,32 0,32 0,35 0,37
Sardinia 0,13 0,13 0,10 0,13 0,13 0,13 0,13 0,13 0,12
Italy 0,49 0,48 0,48 0,49 0,46 0,49 0,49 0,49 0,50
Disclaimer/Publisher’s Note: The statements, opinions and data contained in all publications are solely those of the individual author(s) and contributor(s) and not of MDPI and/or the editor(s). MDPI and/or the editor(s) disclaim responsibility for any injury to people or property resulting from any ideas, methods, instructions or products referred to in the content.
Copyright: This open access article is published under a Creative Commons CC BY 4.0 license, which permit the free download, distribution, and reuse, provided that the author and preprint are cited in any reuse.
Prerpints.org logo

Preprints.org is a free preprint server supported by MDPI in Basel, Switzerland.

Subscribe

© 2024 MDPI (Basel, Switzerland) unless otherwise stated