1. Introduction
Today, technological innovations (big data, cloud technologies, artificial intelligence, distributed registry, the Internet of Things, and others) are increasingly changing our lives, allowing us to rebuild business and management models, remove intermediaries between producers of goods/services and their consumers, and implement direct transactions between them [
1]. Changes in technologies and business models in traditional industries within the framework of the fourth industrial revolution are carried out annually, which requires an increase in the speed of management decision-making [
2,
3]. The authors of the work [
4] note that currently, for the production of an innovative product (providing a service) that meets the requirements of users, it is necessary, as a rule, to combine the resources and competencies of several companies. The most significant conclusion of the article [
5] is that to ensure the preparedness of industries for future pandemics, research and development are needed in various important directions, primarily digital equipment maintenance, end-to-end automation, etc.
Digital technologies provide homogeneity of data, their distribution, editability, and ability to self-referencing the ability to reprogram them [
6]. Such characteristics of digitization allow multiple inheritances to be implemented in distributed software applications when no single owner owns the platform's core and dictates the entire design hierarchy. By combining the modularity of physical goods with a layered software architecture, the resulting solutions can be arbitrarily combined through standardized interfaces, making products open to new uses after they are manufactured [
7].The latter allows postponing the final decision about the features of the product to the future, which, as a result of a distributed innovation process, becomes free from prematurely limiting the capabilities of third-party developers.
Implementing the concept of condition-based maintenance (CBM) [
8], which monitors the actual condition of the equipment to decide on the need for maintenance, has many advantages. CBM provides an opportunity to improve equipment reliability and reduce maintenance resource costs compared to a late-scheduled maintenance strategy. According to CBM, maintenance should only be performed when specific metrics show declining performance or future failures.
The main problem of CBM is the need to spend significant resources on implementing equipment condition monitoring tools, which usually include such non-invasive measurements as visual inspection, power consumption measurement, noise, vibration, etc.
For various mechanical systems, the quantitative measurement and subsequent analysis of motion characteristics occurring at different trajectories, amplitudes, and frequencies are critical to understanding the interaction of component systems and improving their performance and reliability. These tasks are central in many fields of application, such as production, transport, and energy generation, so vibration diagnostics is a fundamentally important method of assessing the condition of mechanical systems. Vibration is the most versatile parameter that considers almost all aspects of the unit's state, allowing operating modes to determine the technical condition of the equipment.
Vibration acceleration is the vibration value directly related to the force that caused the vibration. Vibration acceleration characterizes the power interaction dynamic of elements inside the unit, which causes this vibration. The use of vibration acceleration is theoretically ideal since the accelerometer measures exactly the acceleration, and it does not need to be specially converted. The disadvantage is that there are no practical developments regarding norms and threshold levels and no generally accepted physical and spectral interpretation of the features of the manifestation of vibration acceleration. It is successfully used to diagnose defects that have a shocking nature - in rolling bearings and gearboxes.
Usually, for the vibration diagnostic, it is necessary to measure the vibration velocity. Vibration velocity is the speed of movement of the controlled point of the equipment during its precession along the measurement axis. Standard ISO 20816-1:2016 establishes general conditions and procedures for measuring and evaluating vibration using measurements throw vibration velocity root mean square value (RMS). The physical essence of the vibration velocity RMS parameter is the equality of the energy impact on the machine supports of an actual vibration signal and a fictitious constant, numerically equal in value to the RMS.
The paper [
9] proposes an integrated framework, which takes a broad perspective on CBM implementation, and integrates technological, organizational, and user-related elements. This study contributes to the field of CBM with a comprehensive view of implementation challenges and solutions in real-world implementation from the OEM's point of view.
Authors of the paper [
10] emphasize the difference between Condition-based Maintenance (CBM) and Predictive based Maintenance (PM) as two effective maintenance complementary methods: the CBM monitors the current condition, the PM uses the CBM results to generate a future prediction for a machine.
Methods of analyzing the state of equipment and detecting damage using vibration diagnostics were classified in the paper [
11] based on the level of identification:
determining the presence of damage in the structure;
determination of the geometric location of the damage;
quantitative assessment of damage severity;
remaining service life as a prediction of a future failure.
In the literature, the primary attention is paid to the first three levels. Well-known publications such as [
12,
13] provide constructive solutions and consider practical issues of confirming the accuracy of measurements but do not describe methods for predicting the service life of the diagnosed equipment, which is undoubtedly the ultimate goal for the PM concept [
14,
15].
Damage detection methods also differ in the number of sensors required for operation. Resonant frequencies can be measured using only one sensor while determining shape or dynamic flexibility requires multiple sensors. Thus, questions of cost-effectiveness arise, especially if the intent is to control a network of equipment.
Smart sensors are a necessary component of a vibration diagnostics system. According to the IEEE 1451.0-2007 standard [
16], sensors that provide functions that exceed the minimum sufficient to perform measurements should be considered intelligent. In addition to the digital interface and self-testing, this redundant sensor functionality simplifies its integration into applications in a networked environment and typically includes the following capabilities:
self-identification and self-writing;
presentation of not only the quantitative result of the measurement but also metrics, units of measurement, background history, notifications about activation, etc.;
network access and ease of use (plug-and-play).
Overcoming the significant resource consumption of the CBM concept is possible by applying digital maintenance of industrial equipment and end-to-end automation based on IoT technologies. The well-known publication [
17,
18] considers in sufficient detail the construction of low-cost hardware and software solutions for vibration diagnostics, which is achieved by using modern MEMS. At the same time, the authors ignore the issue of using IoT solutions for vertical integration of measuring devices with digital platforms. It is a platform-oriented solution using BigData technologies, complex event processing (Complex Event Processing), and online analytics that provide new opportunities for fault diagnosis, state forecasting, and implementation of the CBM concept.
This article offers just such a solution, the purpose of which is to develop new resource-efficient IoT-oriented solutions and technologies for vibration diagnostics, which realize the contact method of vibration measurement using a microelectromechanical system (MEMS) of accelerometers. MEMS-accelerometers are mechanical structures with freely moving elements. These moving elements can be susceptible to mechanical influences (shocks, shakes) and much more sensitive than the electronics themselves.
The accelerometer manufacturer, after a wide variety of tests, determines the output characteristics, which usually include sensitivity, frequency and phase response, resonant frequency, amplitude linearity, transverse sensitivity, temperature response, time constant, capacitance, and dependence on operating conditions, such as sensitivity to changes in temperature, magnetic fields, etc.
Modern standards of the ISO 16063 series [
19] in four sections determine the requirements for vibration sensors and their calibration methods, including primary and secondary calibration, calibration in difficult conditions etc. The simplest way to calibrate a MEMS-accelerometer is to average the measurements (samples) values using the so-called scheme with a single point of calibration. In a single-point calibration scheme, the accelerometer system is oriented so that one axis, usually the Z axis, is in a 1 g gravitational field, and the other X and Y axes are in a 0 g field. Conducting at least 10 samples with an interval of 0.1 s at a measurement frequency of 100 Hz is recommended.
Usually, the accelerometer requires additional calibration after installation at a specific location. This calibration is performed by comparing the measurement results with a reference accelerometer that has a guaranteed low sensitivity to noise under the calibration conditions. Both sensors are subject to general mechanical excitation, so their output signals can be directly compared [
20,
21].
Displacement at 0 g is a vital accelerometer metric because it defines the threshold for measuring actual acceleration. Additional measurement errors occur when mounting a system with an accelerometer. These errors can be caused by stresses in the printed circuit board during mounting by applying different compounds to the component. Therefore, calibration is recommended to be carried out after assembling the system to compensate for their influence [
22].
The paper [
23] proposes a method for estimating the thermal behavior of capacitive MEMS accelerometers and compensating for their drifts. The proposed algorithm for reducing orientation and temperature effects can be performed in a microcontroller with a small computing power.
2. Materials and Methods
2.1. Software and hardware solutions IoT platform for vibration diagnostics of industrial equipment
Microsoft Azure IoT [
24] is Microsoft's cloud computing platform that provides infrastructure for creating and managing applications in the cloud. The Azure Internet of Things Suite is an integrated service that uses all the relevant capabilities of Azure to connect devices. The suite captures a variety of data that these devices generate. The Azure Internet of Things Suite integrates and organizes the flow of this data, manages it, analyzes it, and presents it in a format that helps people make relevant decisions. This highly analyzed and managed data also help automate various processes and operations.
Thus, we will choose Microsoft Azure IoT for further implementation, as this platform offers established solutions, and its budget requirements are acceptable for startups at the initial stage.
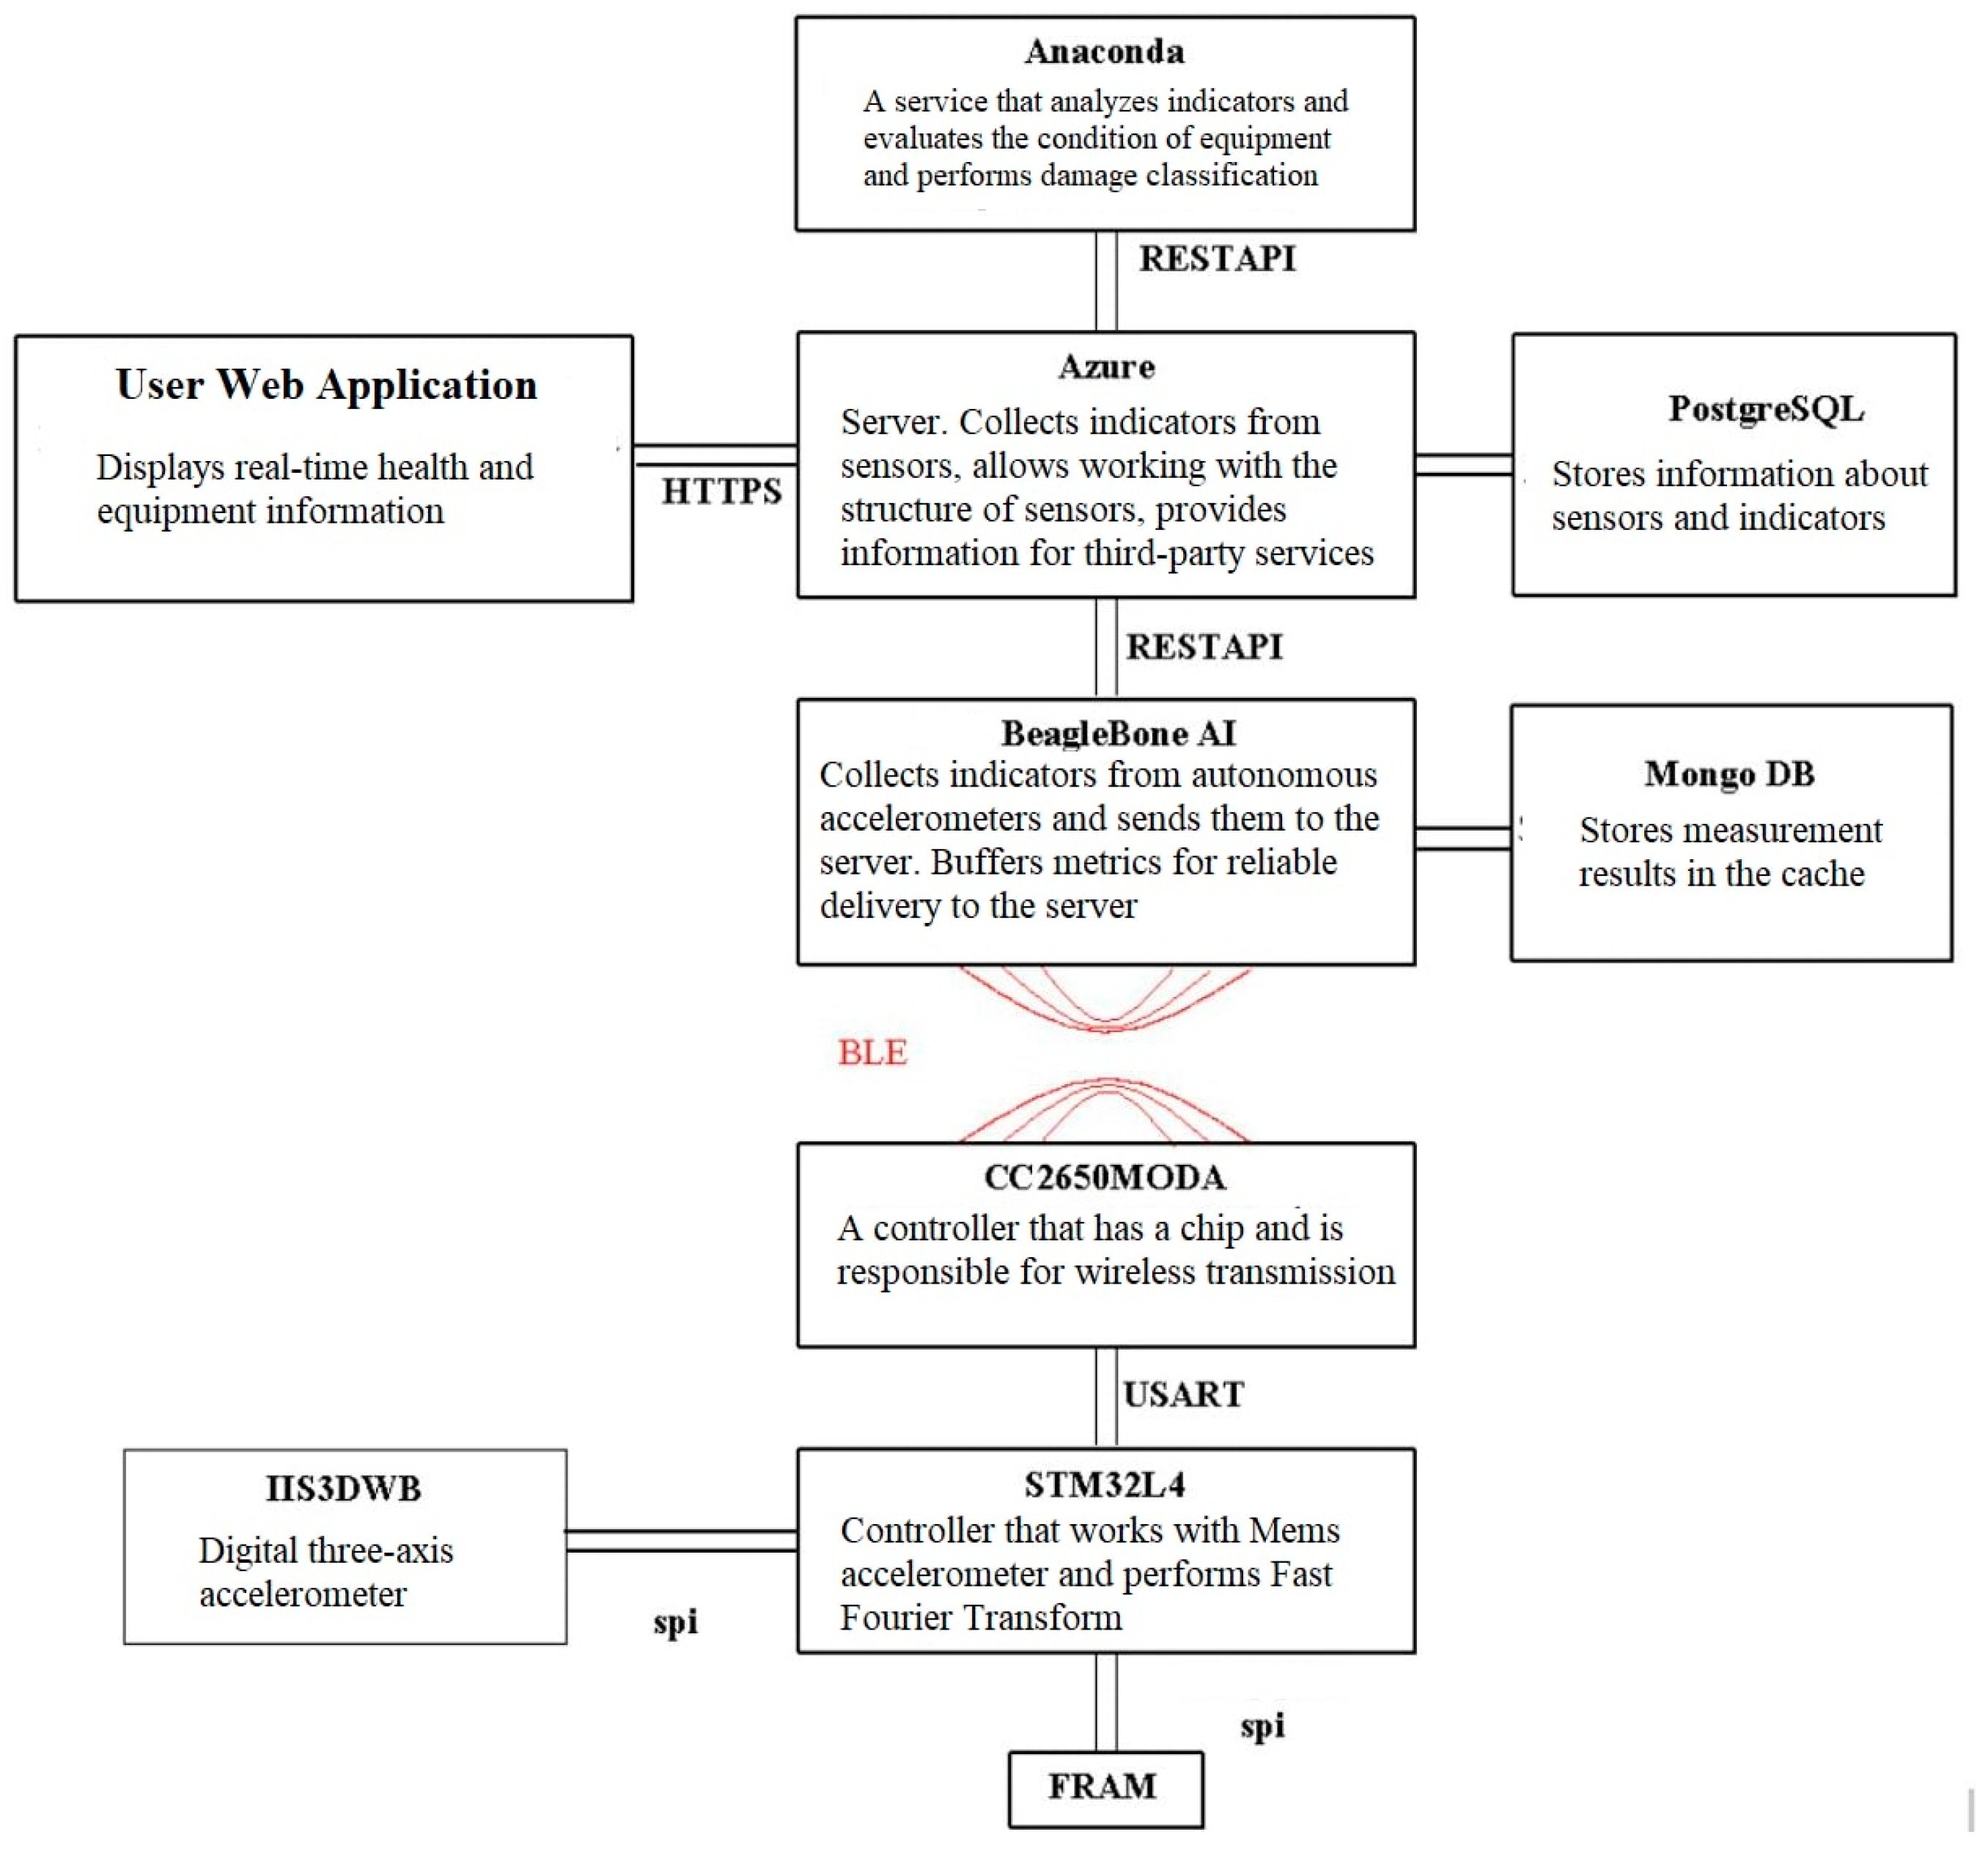
The architecture of the IoT platform of the vibration diagnostics system is presented in
Figure 1.
The system's hardware is built on an STM32L476 microcontroller and a three-axis digital accelerometer IIS3DWB. The IIS3DWB accelerometer is installed on the monitoring object (for example, on the milling head of a CNC milling machine) and is connected via the SPI bus to the microcontroller.
The IIS3DWB is a miniature three-axis digital accelerometer from STMicroelectronics with low power consumption, high resolution (16 bits), and a measurement range that can be programmed from ±2g, ±4g, ±8g, ±16g. The measurement result can be read byte by byte through the digital interface SPI (3- or 4-wire) or I2C in the form of 16-bit data.
IIS3DWB belongs to the class of capacitive accelerometers with a bandwidth from 0.05 to 6000 Hz, which allows recording vibration with a frequency of 1000 Hz). This characteristic is affected by the sampling frequency of the built-in ADC of the accelerometer, which should be at least twice the bandwidth. The maximum sampling frequency of the IIS3DWB ADC is 25600 Hz.
These values are stored in the OFFSET registers of the IIS3DWB accelerometer and used for automatic error compensation. The content of each register is added to the measured acceleration value along the corresponding axis, and the results are placed in the DATA data registers.
2.2. Digital platform database
A digital platform for vibration diagnostics of industrial equipment must store data for a long time. To achieve this goal, the PostgreSQL DBMS was chosen. PostgreSQL is a robust open-source database. PostgreSQL has been in development since 1996 and has a proven architecture that has earned a high reputation for reliability, data integrity, and correctness. PostgreSQL has advanced features such as Multi-Version Concurrency Control (MVCC), asynchronous replication, and nested transactions (savepoints). We shoe the NoSQL database MongoDB for caching indicators on the BeagleBone AI Mini PC.
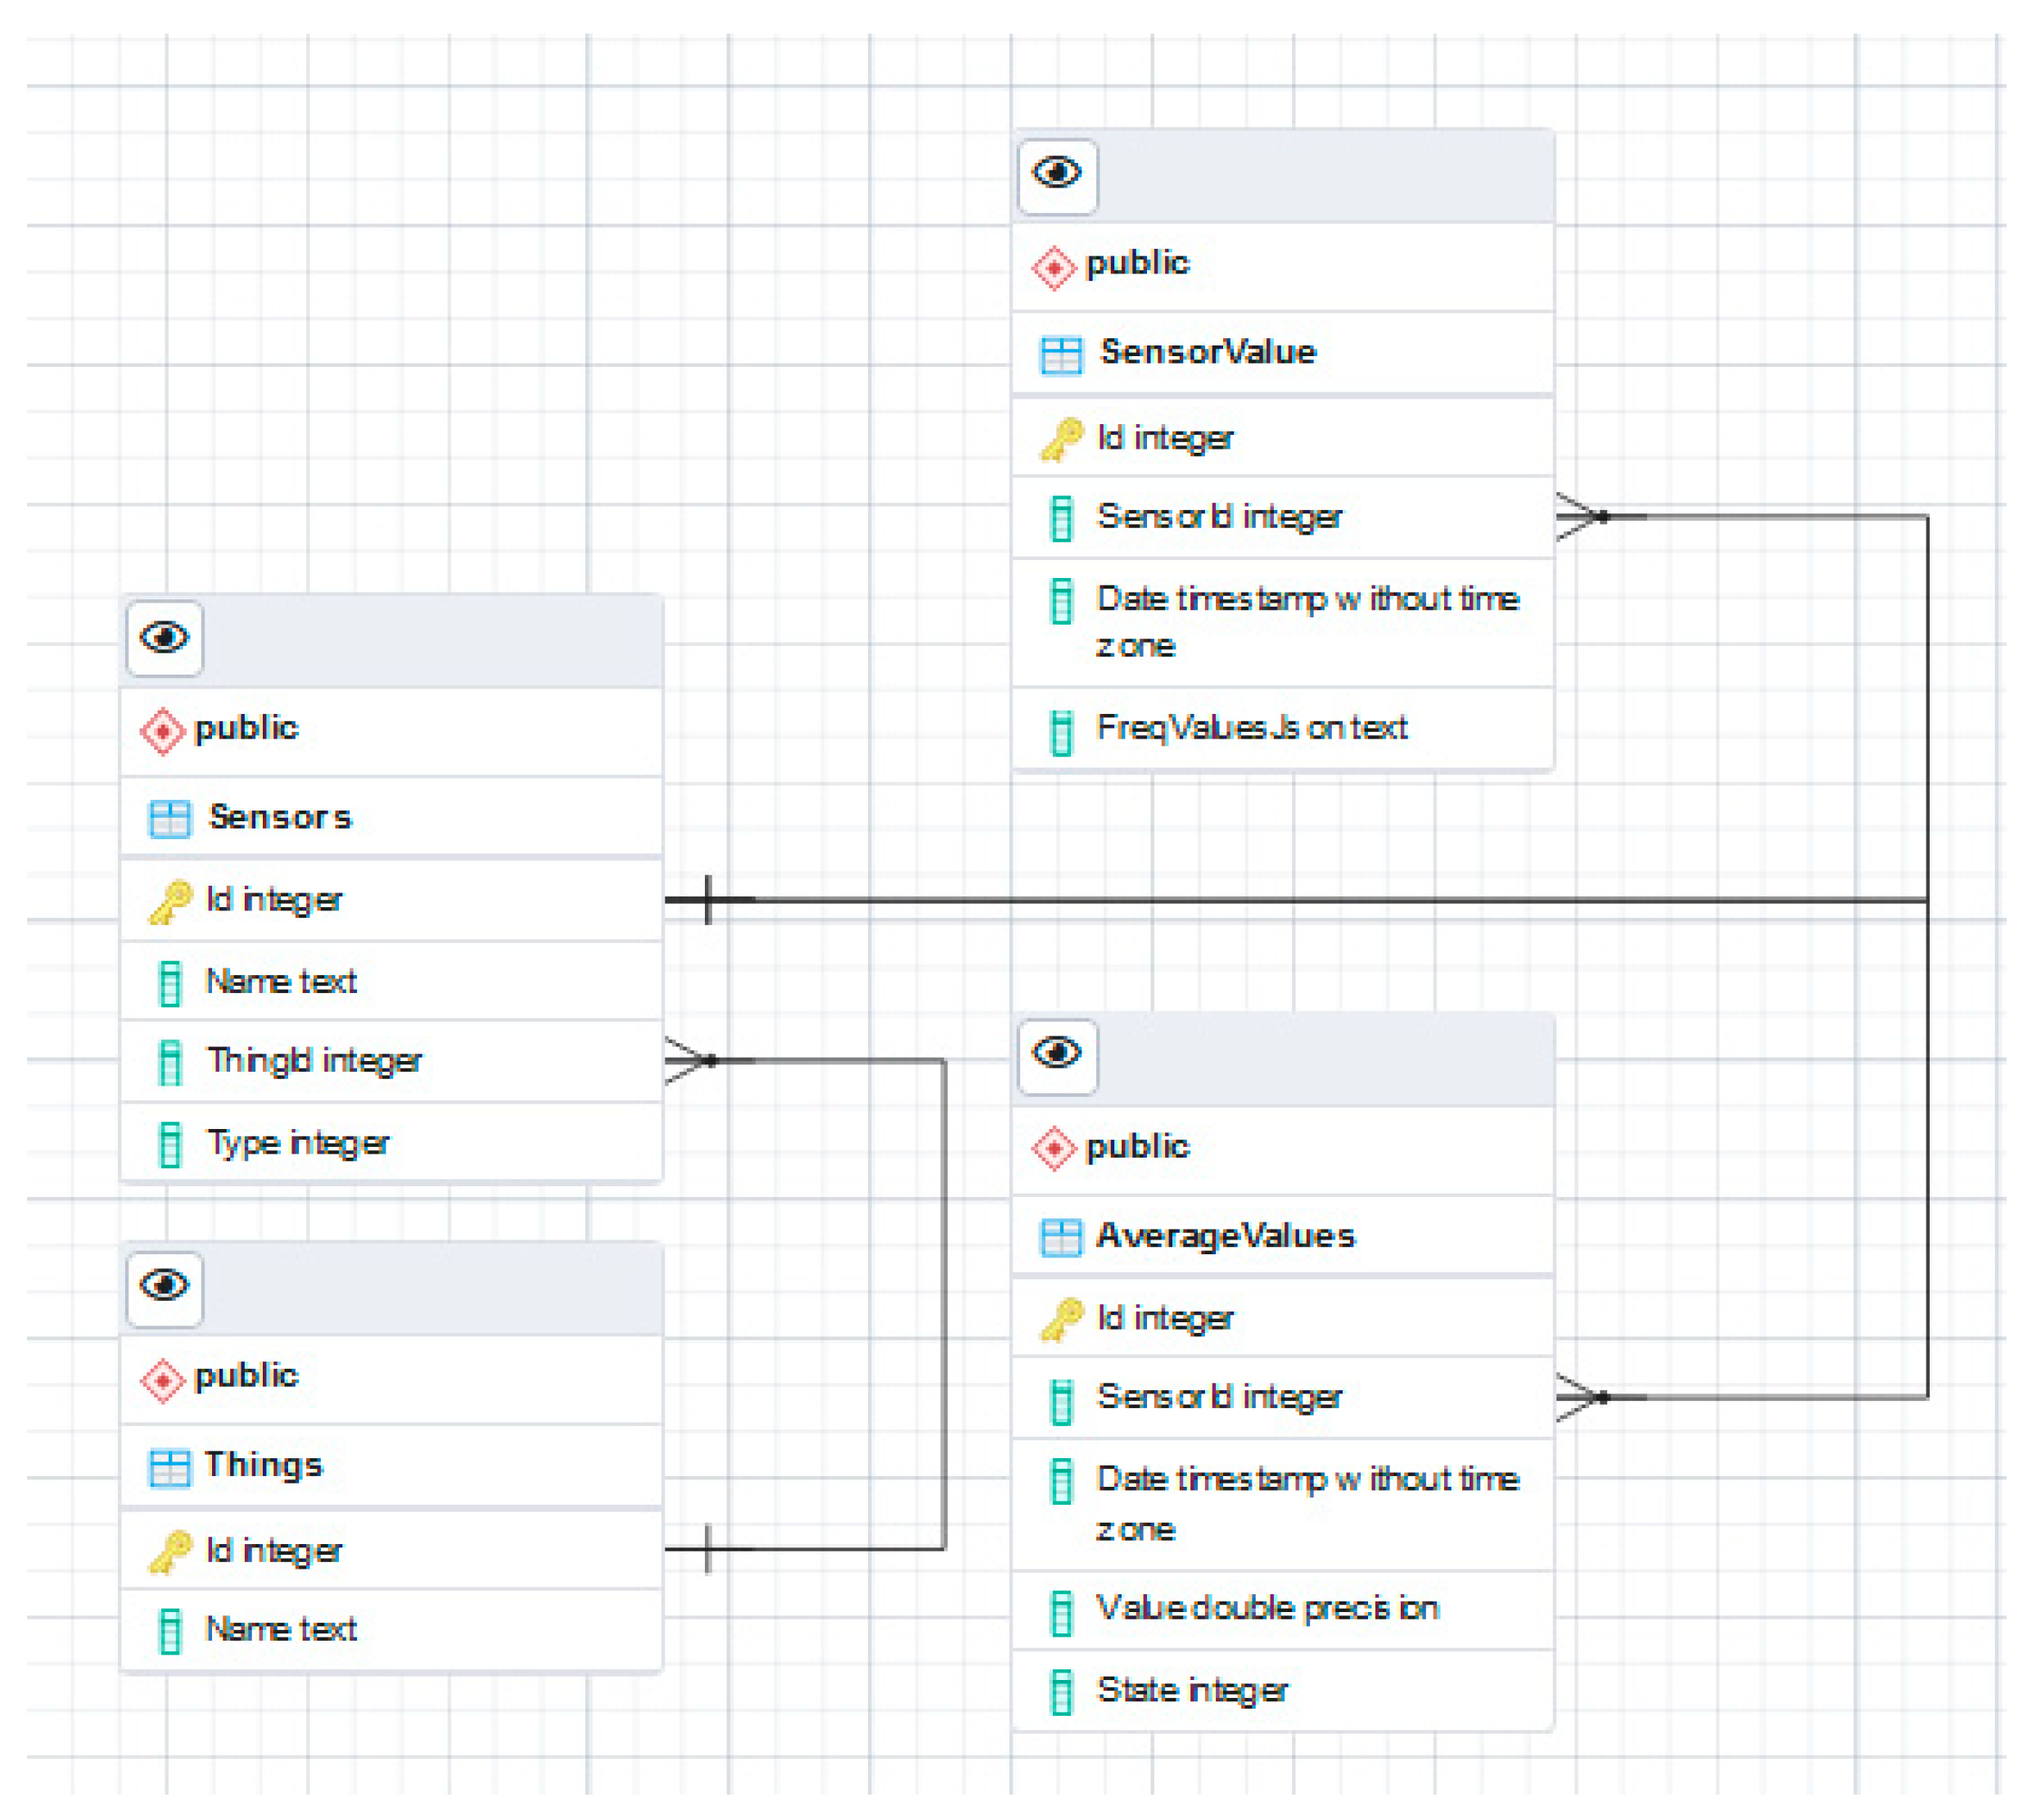
The ER model of the digital platform database (
Figure 2) characterizes the relationships between the following entities: sensors, IoT devices to which they are included, and data on the results of measurements by these sensors.
Entities in the database, which is the basis for business logic, contain the following data following the IEEE 1451.0-2007 standard:
AverageValue – average values of measurement results by sensors, such as average rotation speed;
Sensor – data about sensors: sensor identifier, name;
SensorValue – data on current and historical measurement results: timestamp (Timestamp) and result (Value);
Thing - data about the equipment on which the sensors are installed: name and location.
The definitions of relationships between entities are presented as follows:
The «Sensor» entity is related to the «AverageValue» entity by the ratio «1: N» - each sensor has many numerical indicators;
the «Sensor» entity is related to the «SensorValue» entity by a «1: N» relationship - each sensor has many measurement results;
the «Thing» entity is related to the «Sensor» entity by a «1:N» relationship - each industrial equipment can have many sensors.
2.3. Peculiarities of the organization of customer interaction and the digital platform
Multilevel data transmission and processing is the main feature of the organization of customer interaction and the digital platform. It imposes certain limitations on data collection methods, analysis and wireless transmission to reduce installation and operation costs and ensure high energy efficiency for long autonomous operation.
Based on the above limitations, an architecture with three levels was chosen:
The level of autonomous sensors that read indicators of vibration acceleration. Depending on the survey frequency, these sensors are designed for autonomous operation for 6-12 months. Digital wireless data transmission technology BLE (Bluetooth low energy - Bluetooth with low energy consumption) is used to transfer indicators to the Hub l;
The Hub level is implemented on a device built on the basis of a single-board microcomputer BeagleBone® AI, which is designed to work with artificial intelligence algorithms. Receives indicators from the level of autonomous sensors and transmits them to the server level. Depending on the selected analysis algorithm, it can pre-process the indicators before sending, significantly reducing the server's load.
The server-level provides an API for work with the structure of sensors and data to the client and third-party services.
2.4. Calibration of the IoT system sensors for vibration diagnostics of industrial equipment
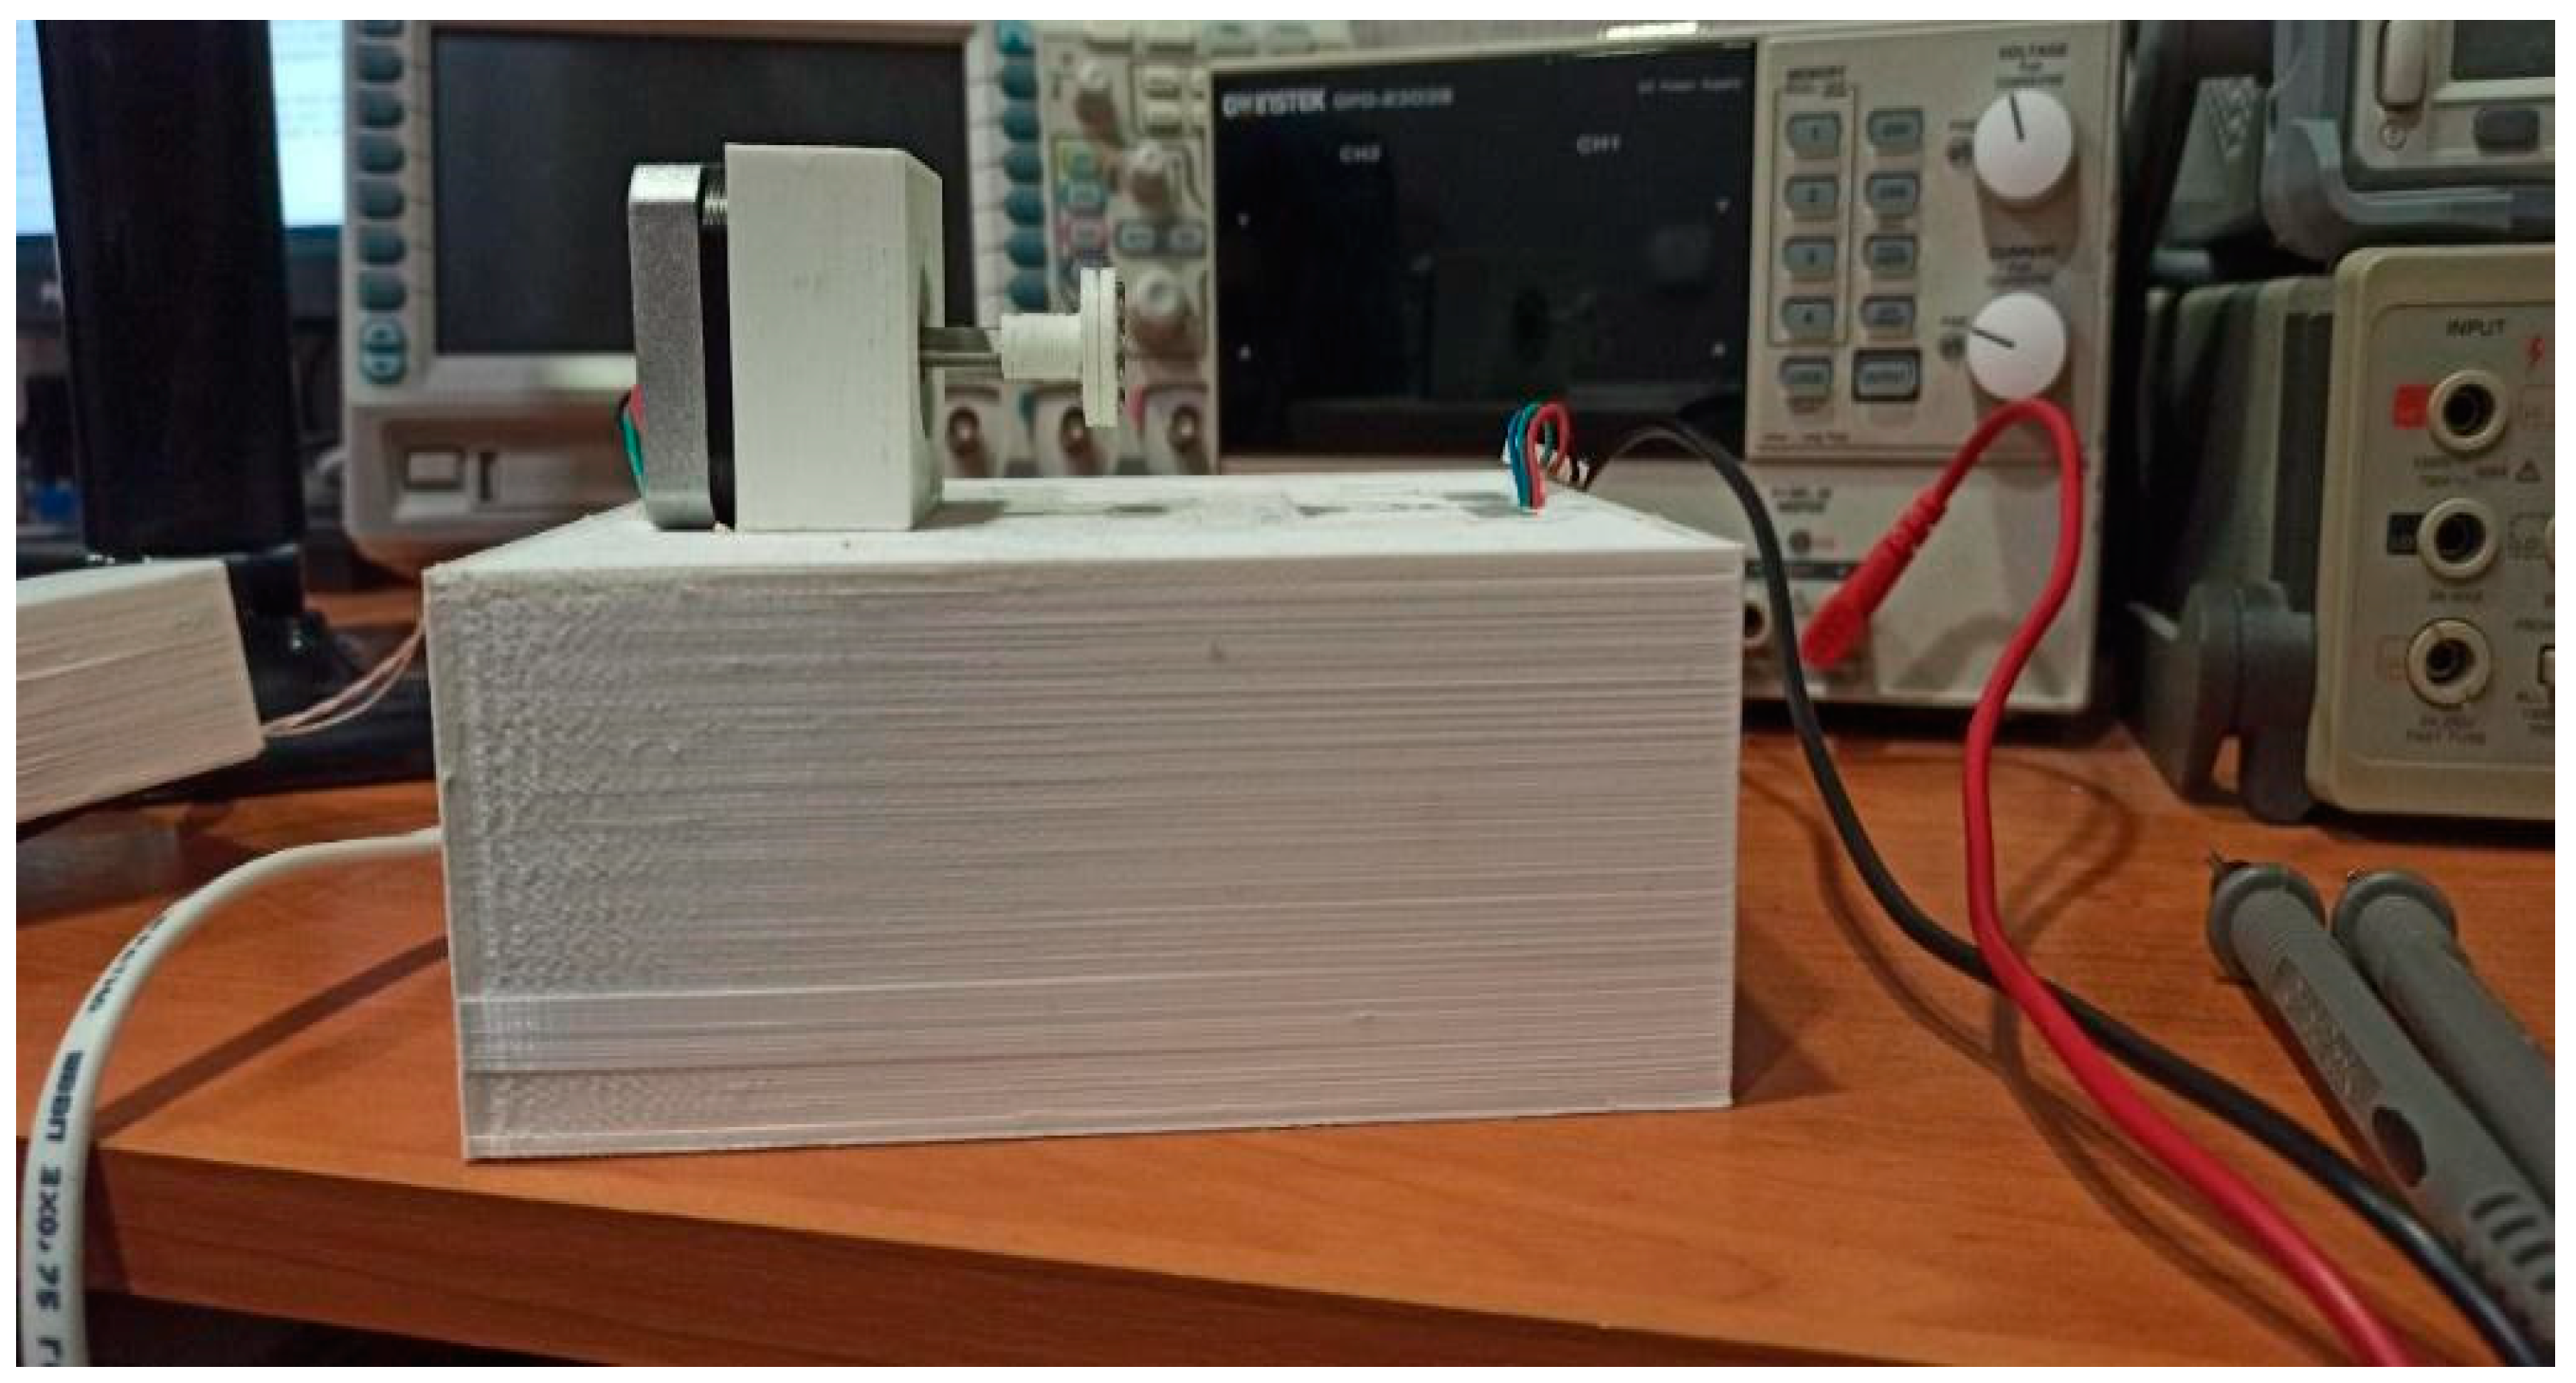
To evaluate the system's suitability, a stand (
Figure 3) was made, simulating an electric motor and generator connected by a coupling, for which the Anycubic Mega S 3D printer was used.
The stand simulates the working conditions of the pumping unit at the enterprise. One of the advantages of the selected components of the stand is the ability to adjust and obtain the speed indicators not only on the built-in controller but also in the system, which allows comparing the speed of rotation and the obtained results of measurement by the vibration sensor.
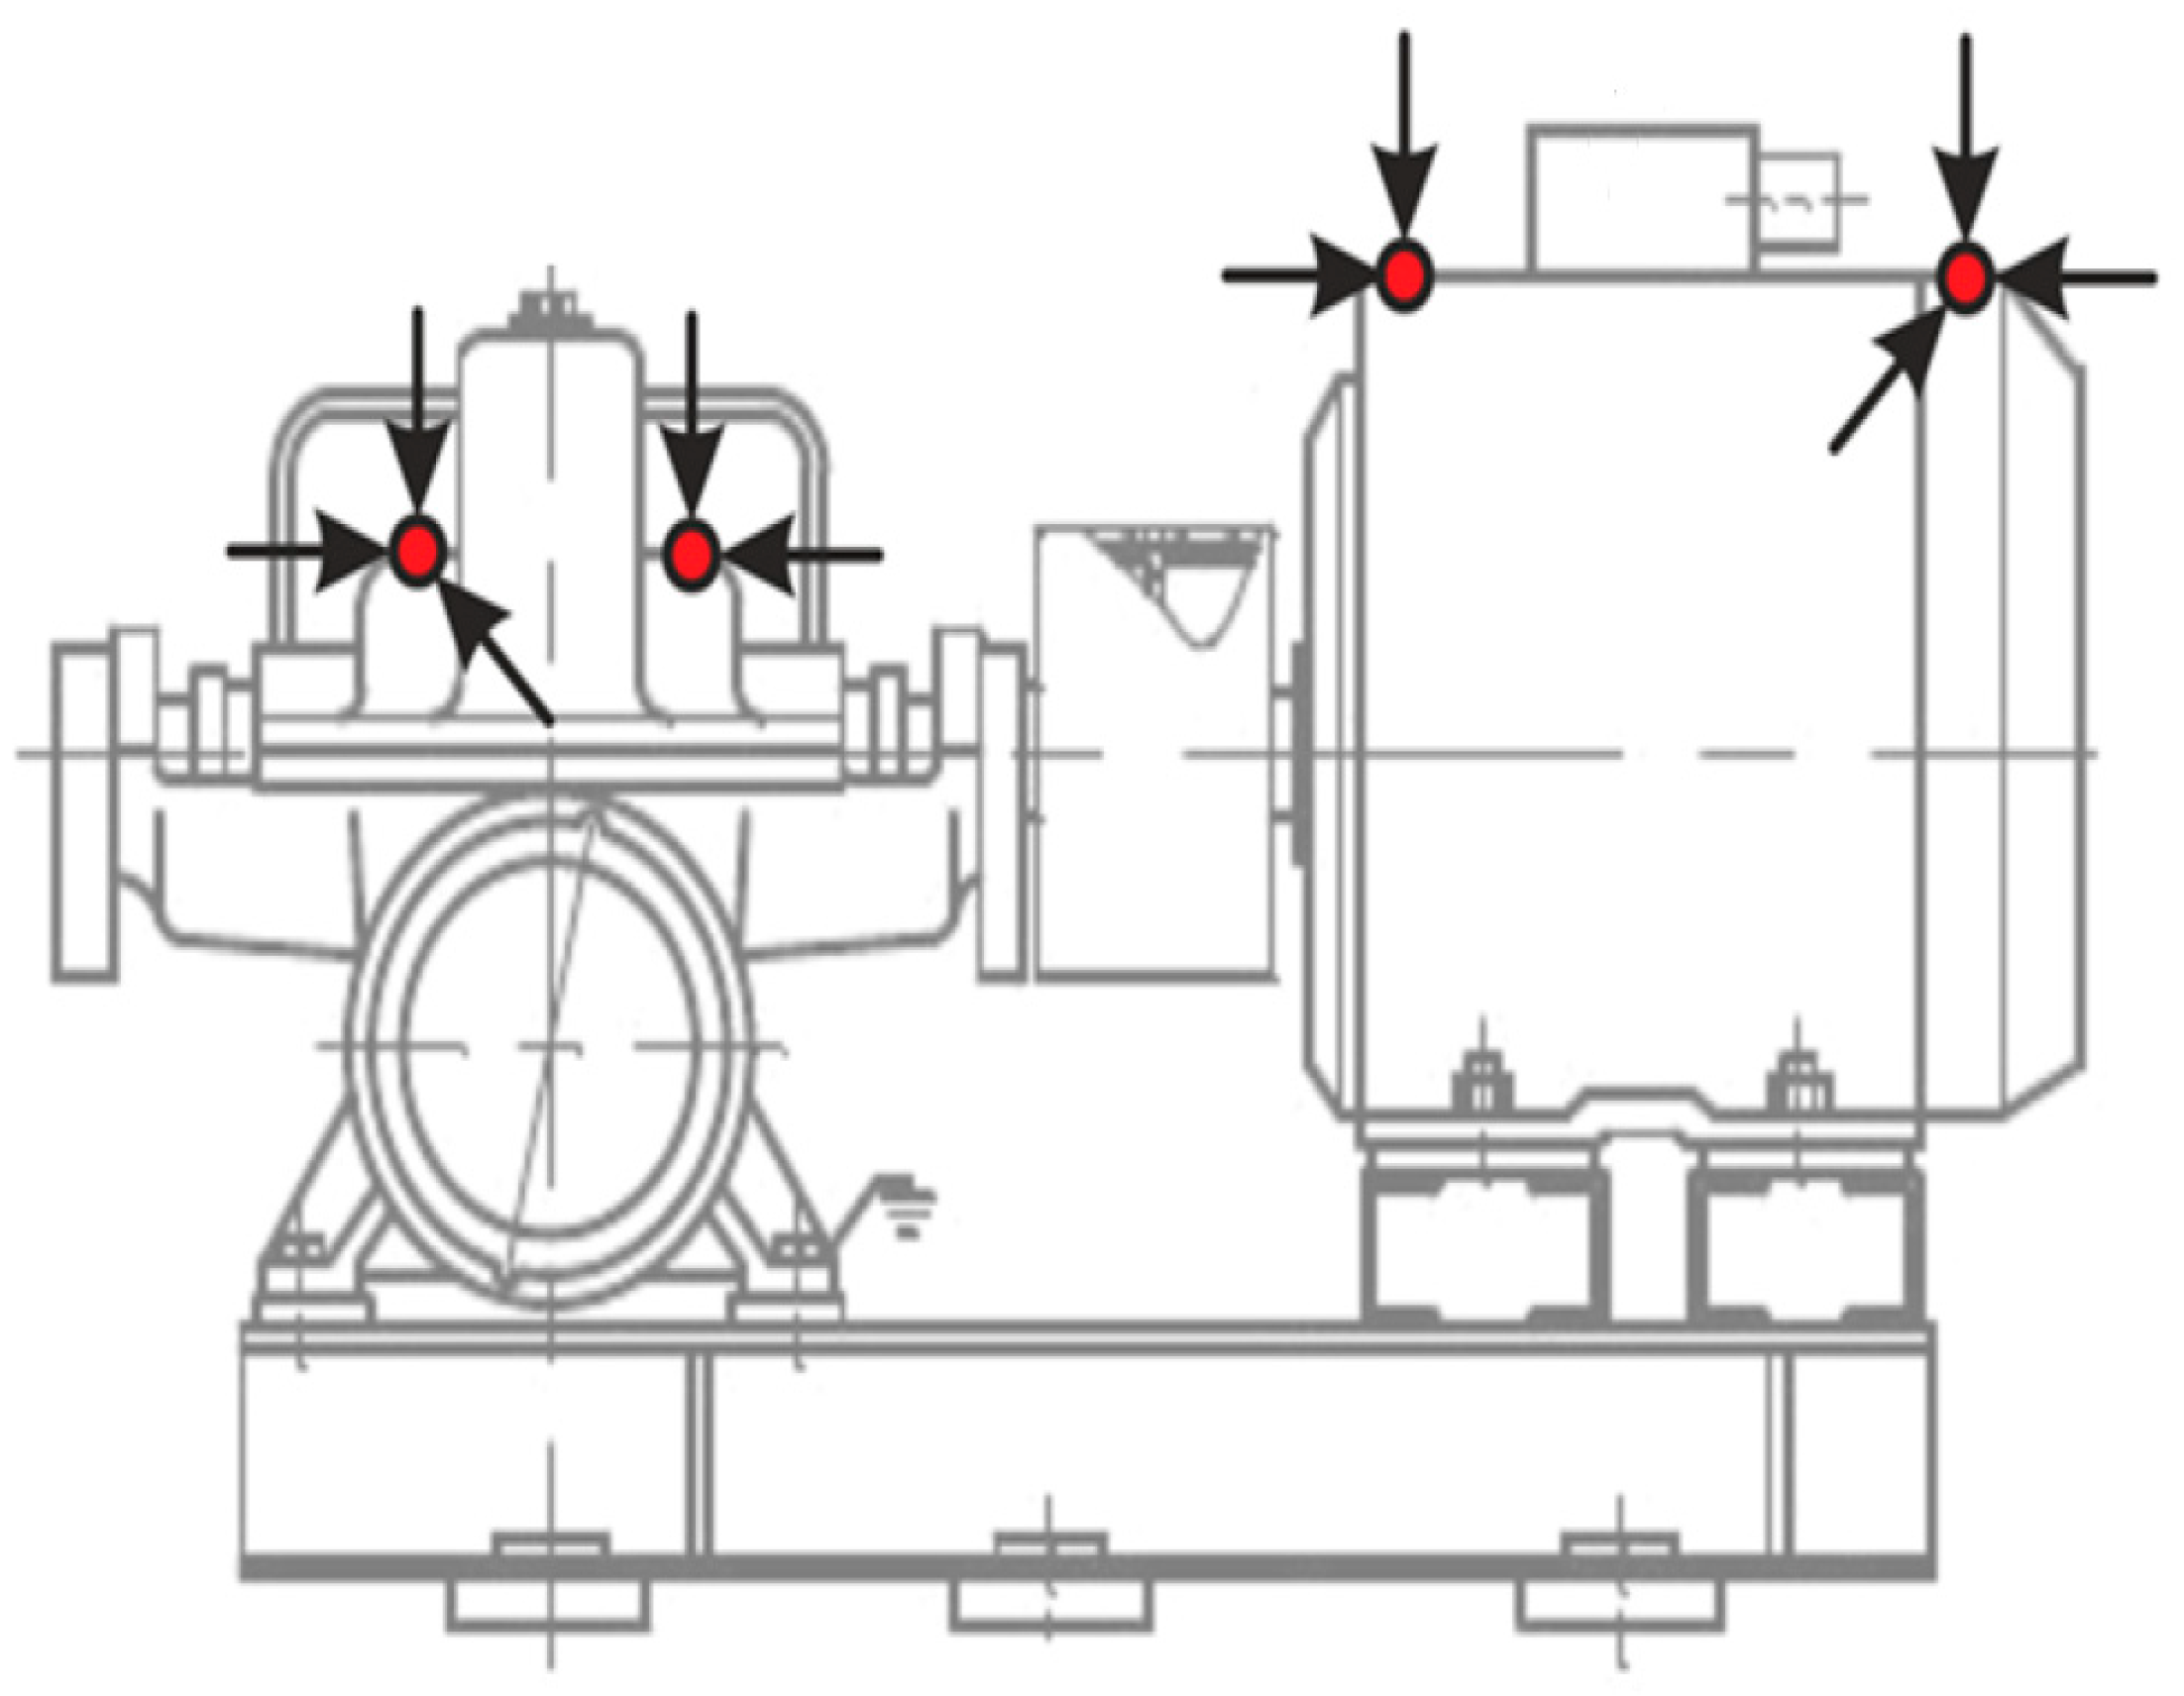
The body of the stand houses a power supply unit and electronic boards that control the motors located on top: one of the motors simulates an electric motor, and the second is a generator. A vibration sensor is attached to the body of the second engine. The control panel with a graphic interface allows to control the engine speed. The stand includes two stepper motors (one of them is a load), a stepper motor controller, an AC adapter, an STM32F4 Discovery test board, and a DC-DC converter. The control panel, built based on the STM32F437 controller, has a graphic touch screen for displaying information and accepting commands. Vibration control in such units is carried out at the load and engine nodes. A schematic representation of the sensor mounting locations is shown in
Figure 4.
The algorithm of the measurement system includes the following steps.
Initialization of the IIS3DWB accelerometer on the SPI bus.
Reading the value from the WHO_AM_I register and checking the accelerometer number.
Reading the IIS3DWB accelerometer settings.
Setting sampling values and interrupt mode.
Setting the measurement range and distributed capacity.
Start measurement.
Writing values to the buffer after an interrupt and waiting for the buffer to fill up.
After the buffer is filled, use the DFT to convert the series into a frequency representation.
Transmission via BLE.
After the transmission, repeat the steps starting with point 6.
According to the algorithm, the most energy-consuming steps will be steps 6 and 9. Calibration should be carried out in two stages: testing energy consumption in all possible modes using measuring equipment and long-term testing in field conditions.
2.5. Sensor calibration
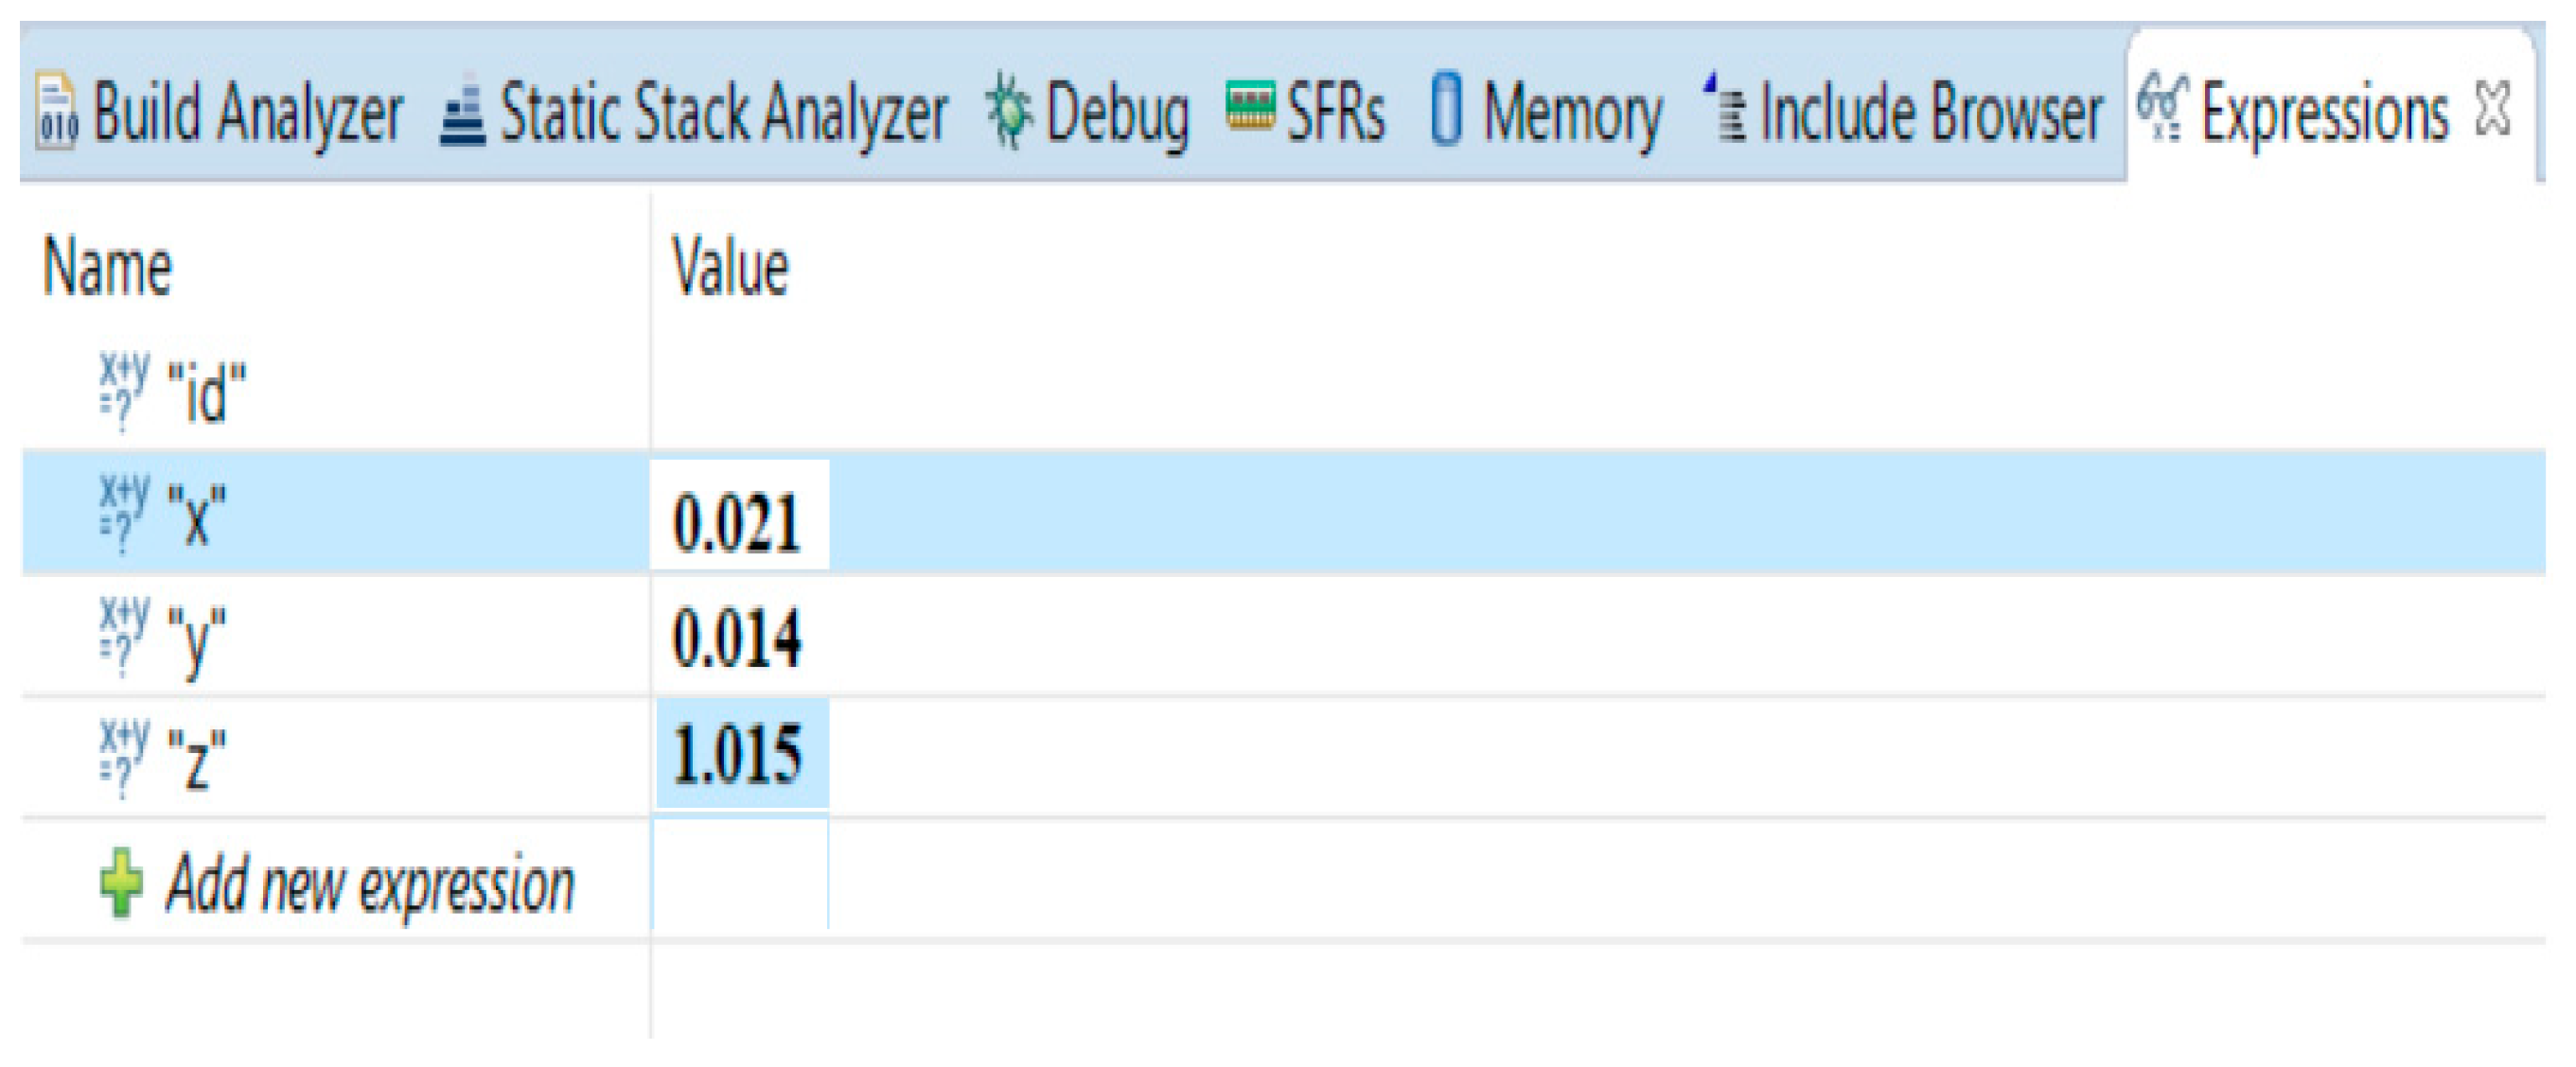
Before starting the test, it is necessary to check the accuracy of the sensor calibration. For this, it is possible to use debugging using the JTAG interface. The sensor has three axes, so the calibration is carried out under the condition that one axis is installed perpendicular to the plane of the work table.
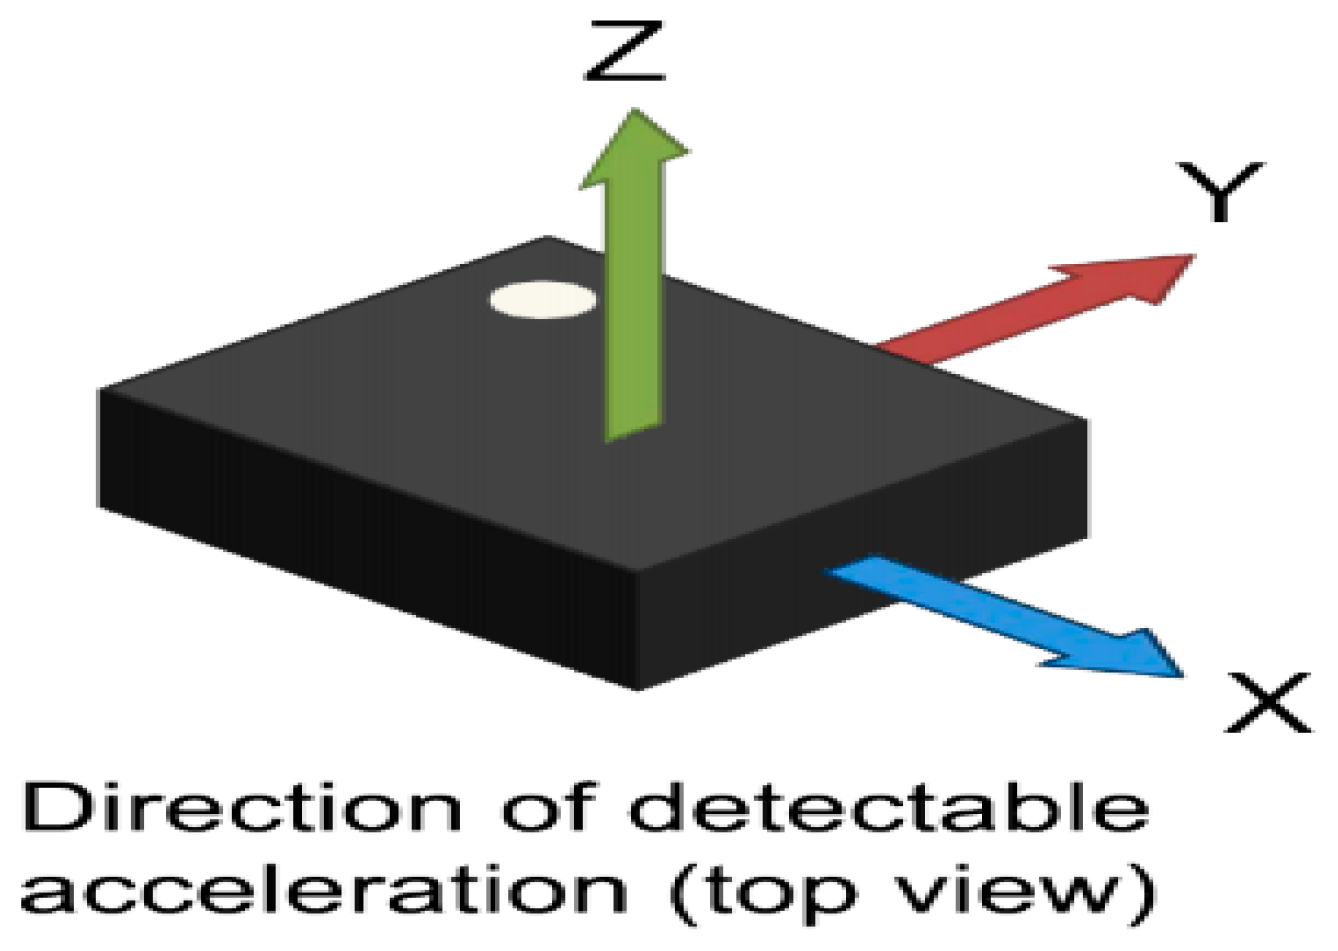
If the Z axis is perpendicular to the plane of the desktop (
Figure 5), then the measurement results at rest along the Z axis will equal 1 g and along the X and Y axes - 0 g. Two identical designs along the measurement axes can be made perpendicularly to obtain a biaxial accelerometer, but the third axis, usually vertical - Z, requires a different construction. This results in poorer performance for this third axis, reducing sensitivity and increasing error and noise [
25].
The measurement of the result during sensor calibration is presented in
Figure 6.
2.5. The method
The digital platform provides customers with an assessment of the condition of the equipment in the form of classification: «good,» «satisfactory,» or «unsatisfactory.» When developing an evaluation algorithm, first of all, it is necessary to achieve the minimum requirement of the algorithm in training when the evaluation of the condition of the equipment requires the smallest amount of labeled data. For this, the algorithm needs to be able to identify patterns and learn from unlabeled input data. Such techniques are called System Identification. The Python programming language was used to implement the algorithm because it has a significant library of tools for signal analysis, working with neural networks, and rich functionality. Since a microservice architecture was chosen during the construction of the system, the algorithm for evaluating the condition of the equipment is also presented as a separate service. It allows for easy and convenient scaling by adding new service instances.
The noise analyses of accelerometers using the Allan variance method includes the following steps.
1. Primary statistical data processing.
For statistical processing of the initial information, at the first stage, the correspondence of the data to the normal law of the probability density distribution is checked.
Then, for each run, the arithmetic means of the measurements
for all measurements in each position (average at the start) and the standard deviation (SD) of the spread of measurements at points relative to the average - instability at the start are calculated:
For groups of positions in the runs, the average overall runs and the instability of the average from run to run are calculated, taking into account the rejection of anomalous measurements.
Compliance with the normal distribution law, we check using the Shapiro–Wilk test [
26]. It uses the sum of squared modules of the difference between the characteristic functions based on sample data and a normal distribution with weighting coefficients.
2. Allan deviation analysis provides excellent differentiation between the particular noise types. We use the Allan transform to quickly check whether the measurement results are consistent with «white» noise, as proposed in the paper [
27]. The formula for calculating the Allan variance
under the condition of a uniform polling step
is as follows:
where L - the total number of measurements;
l - total number of measurements in the averaging interval ;
- measurement result at the time .
3. For noise spectral density analysis:
we use discrete Fourier transform (DFT), which realizes transformation:
The Discrete Fourier Transform (DFT) algorithm is used to improve autonomy at the level of autonomous sensors, which determines the frequency composition of discrete signals. The created software for calculating the DFT uses software from the FFTW library. Spectral data from the DFT of vibration acceleration signals for each axis are recorded.
4. To determine the standard deviation of the vibration velocity (RMS
VV), as recommended by standard ISO 20816-1:2016, we use the integration of the measured vibration acceleration (VA) with a correction for the moving average of the vibration acceleration (MA
VA) and vibration velocity (MA
VV):
3. Results
Calibration of sensors is carried out to evaluate the possible use of the hardware part without maintenance. At the same time, the results obtained with the help of the debugger and visualization tools of the development environment are compared with the data visualized by the digital platform.
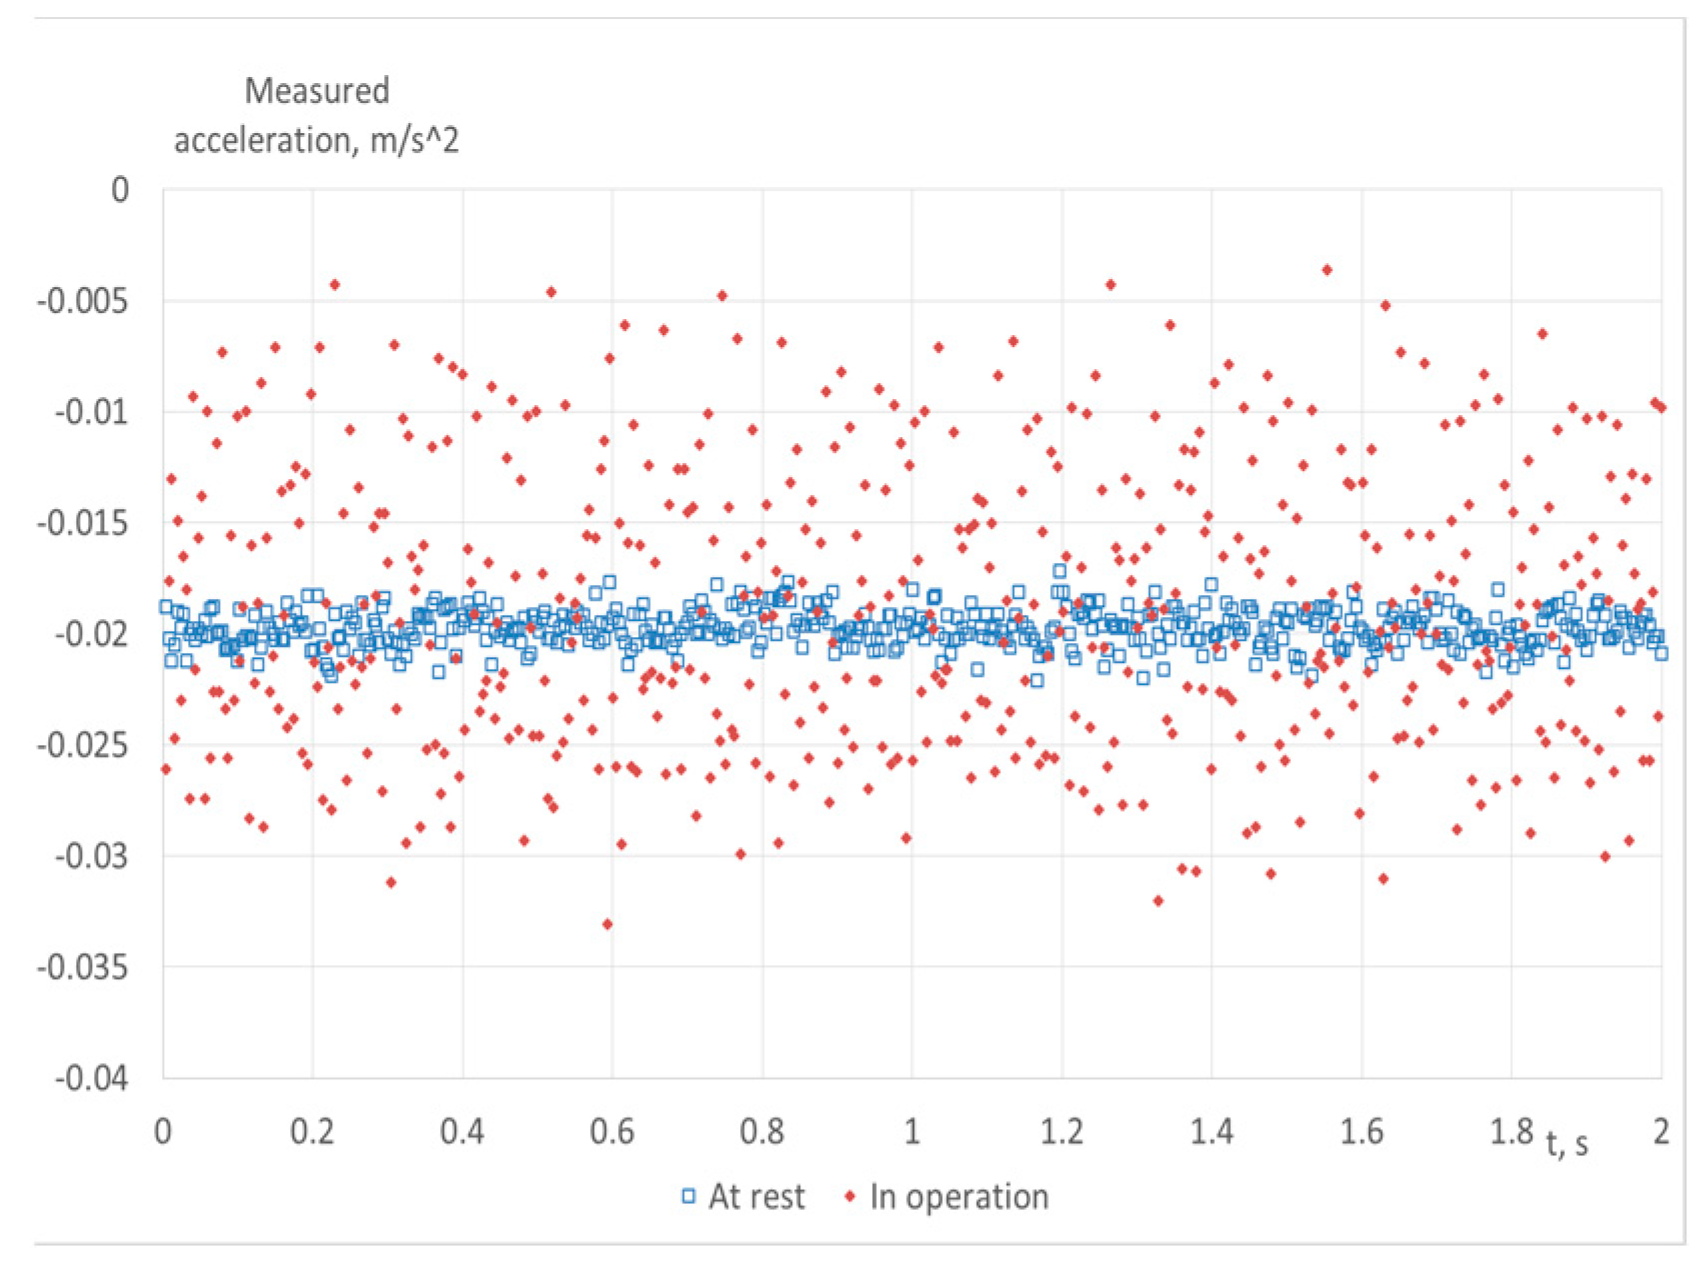
1. Despite pre-calibration, the raw data contains a significant bias error (Figure 7). One of the main reasons for its occurrence is the temperature dependence of the IIS3DWB - accelerometer characteristics [
28]. Without compensation, this error is integrated and leads to entirely unreliable results.
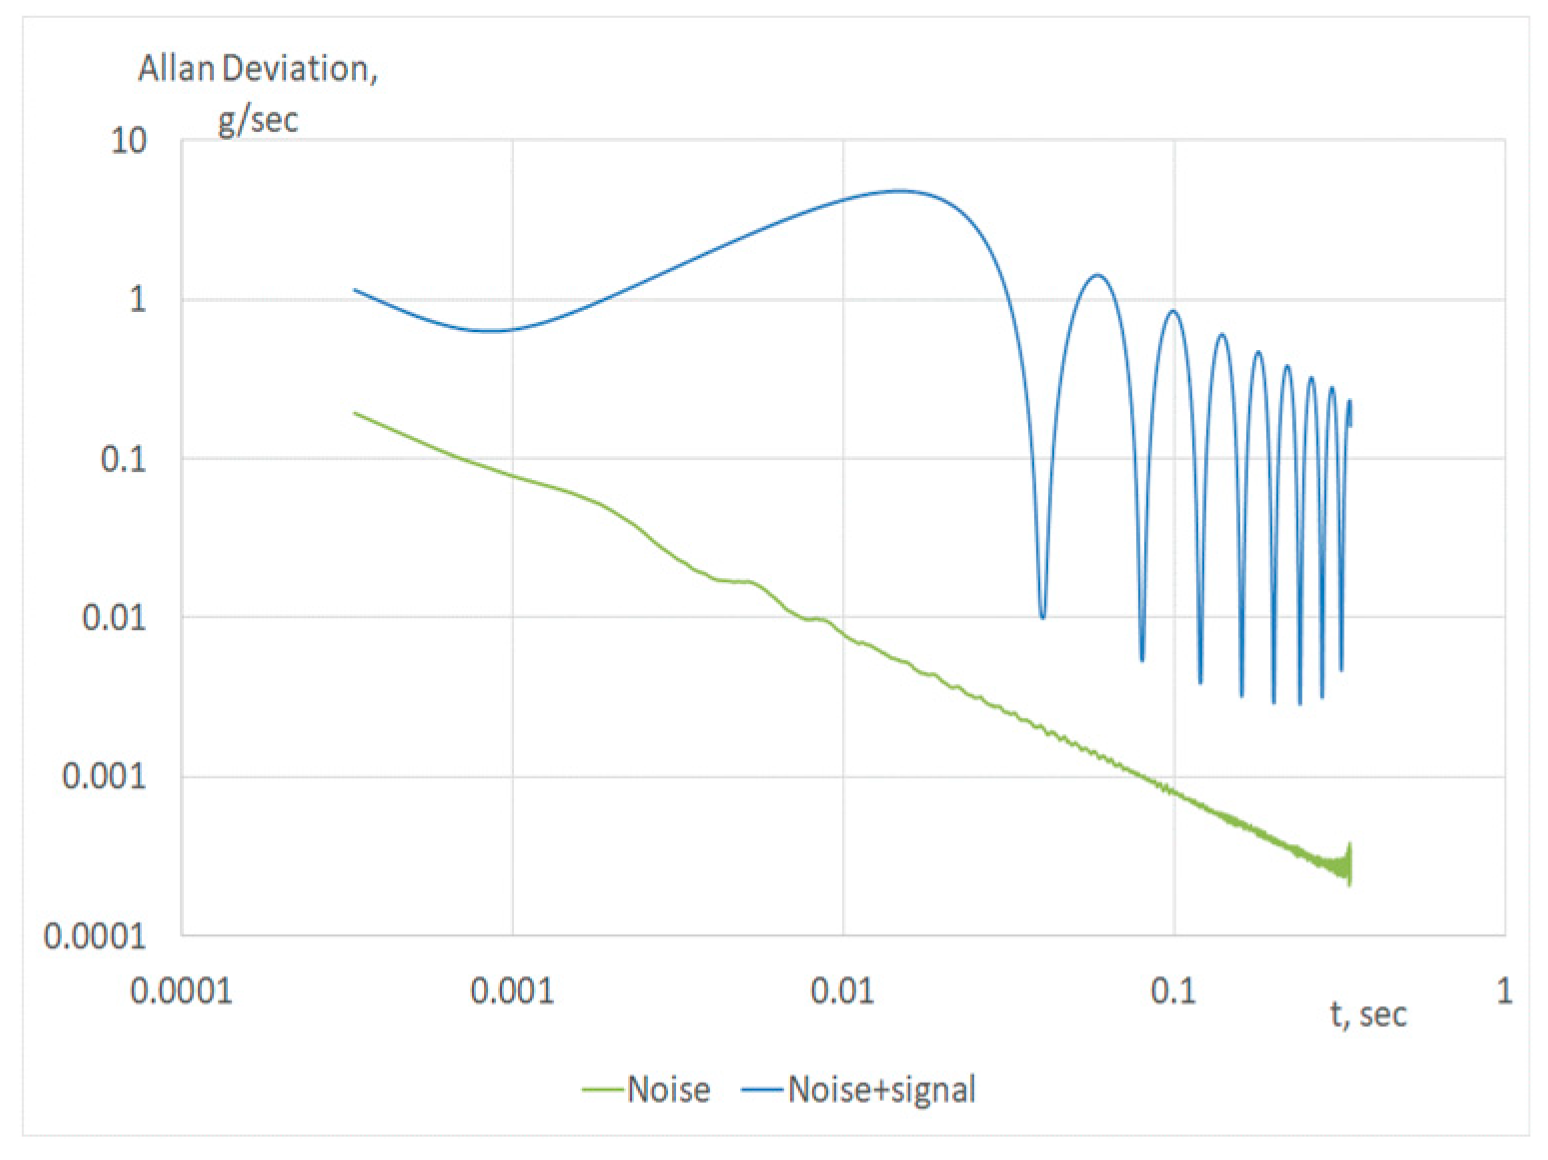
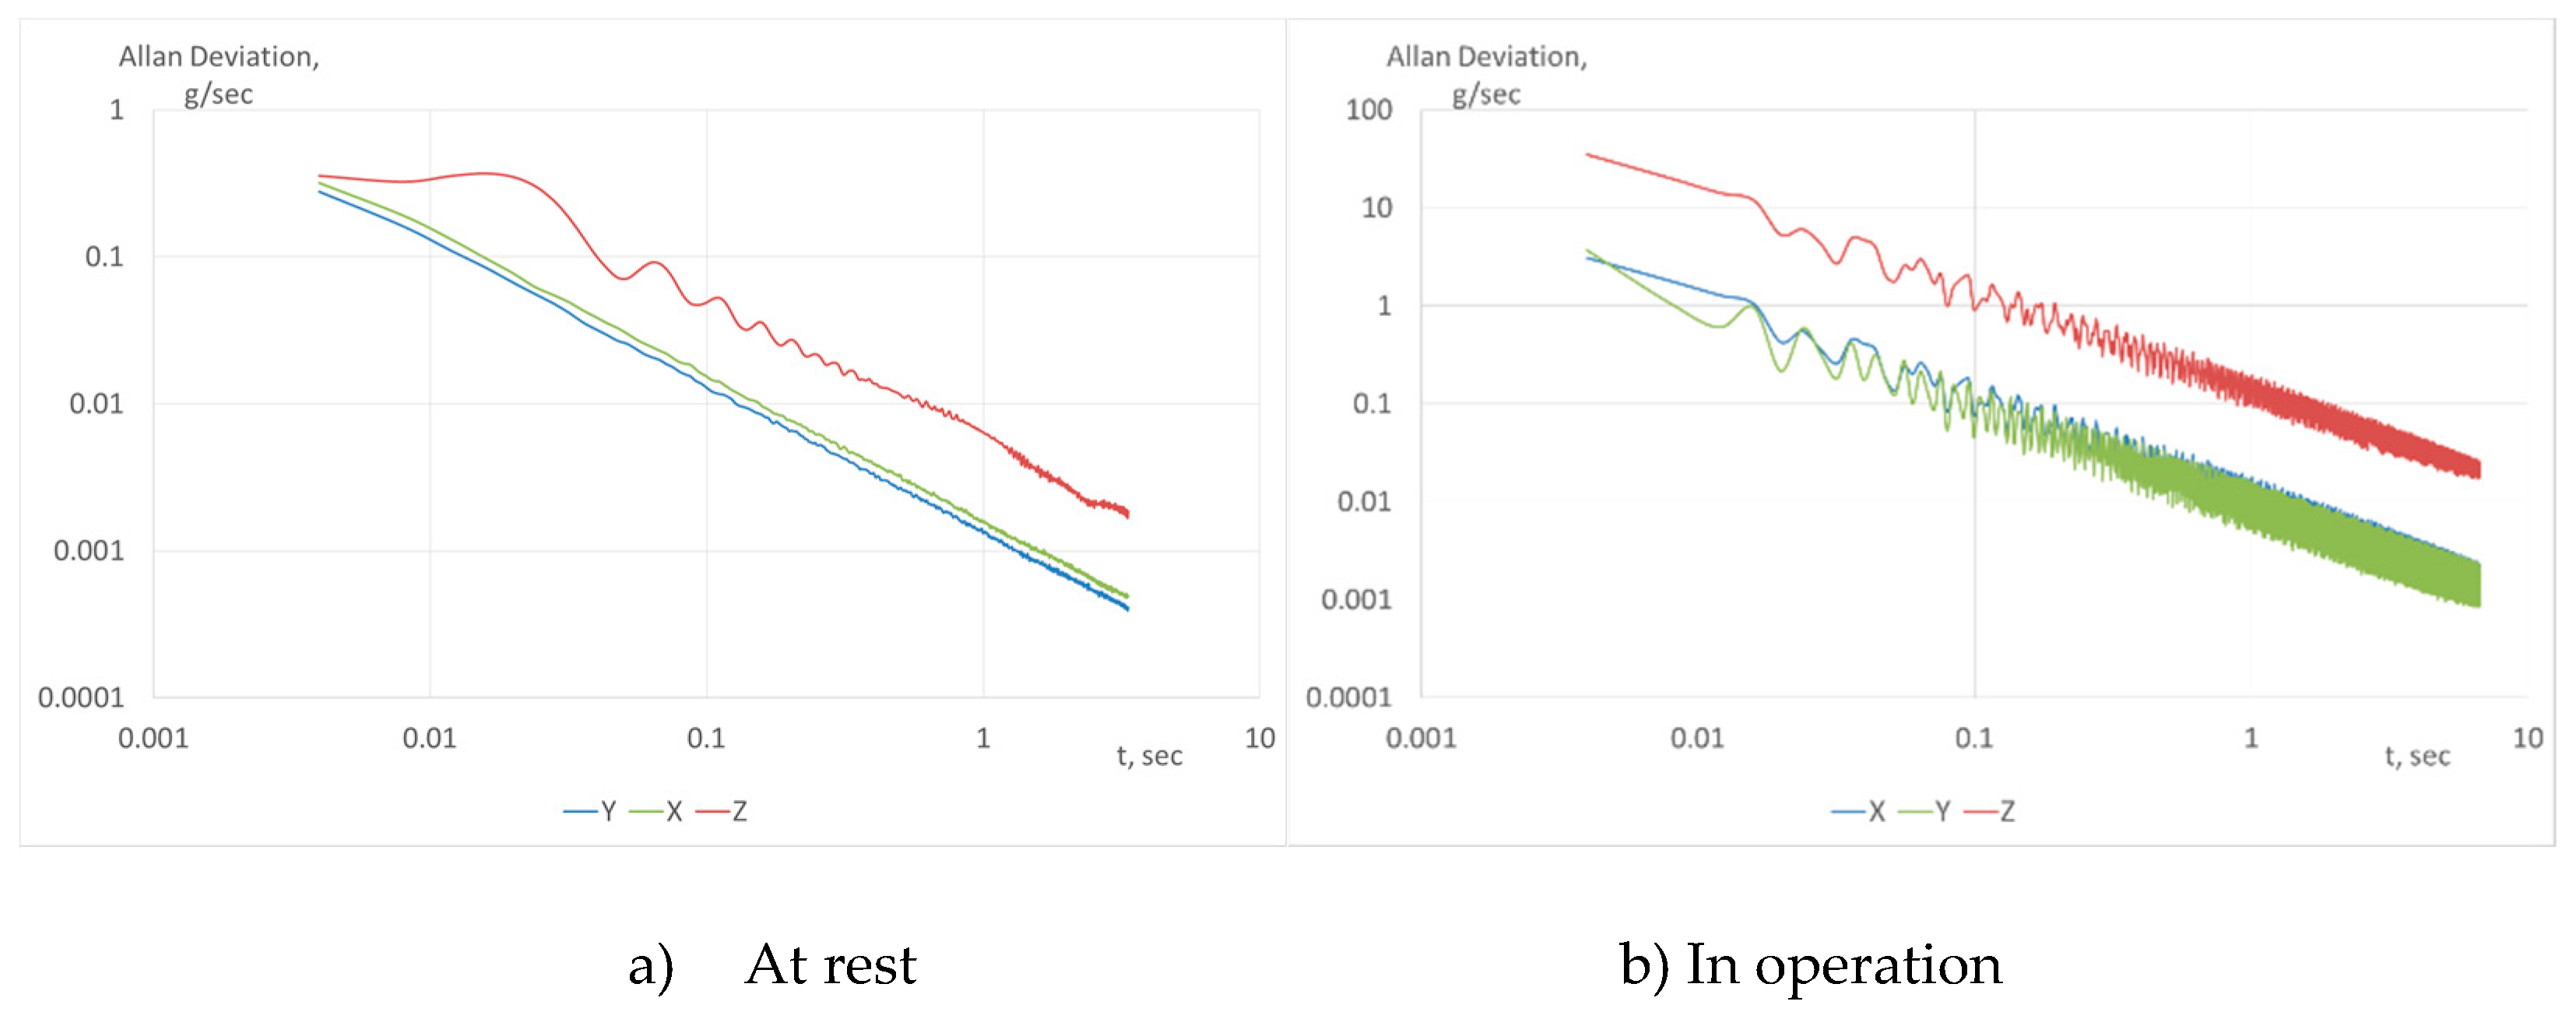
2. Using the Allan variation, it is easy to eliminate the systematic error in estimating the statistical characteristics of the original series, while for uncorrelated data, the variance estimate will be unbiased. The presence of any periodic function will be clearly displayed on the plot of the Allan variance versus time (
Figure 8).
Practically, the offset of the fitting straight line and the standard error of the deviation from the equation of the straight line are reliable indicators of the magnitude of the vibration (
Figure 9). As a result, we get visual evidence that the measurement noise is white noise since the slope of the characteristic on a log-log scale is -1. The problem with this solution is the lack of generally accepted standards linking the Allan deviation's measurement results and the industrial equipment's technical condition.
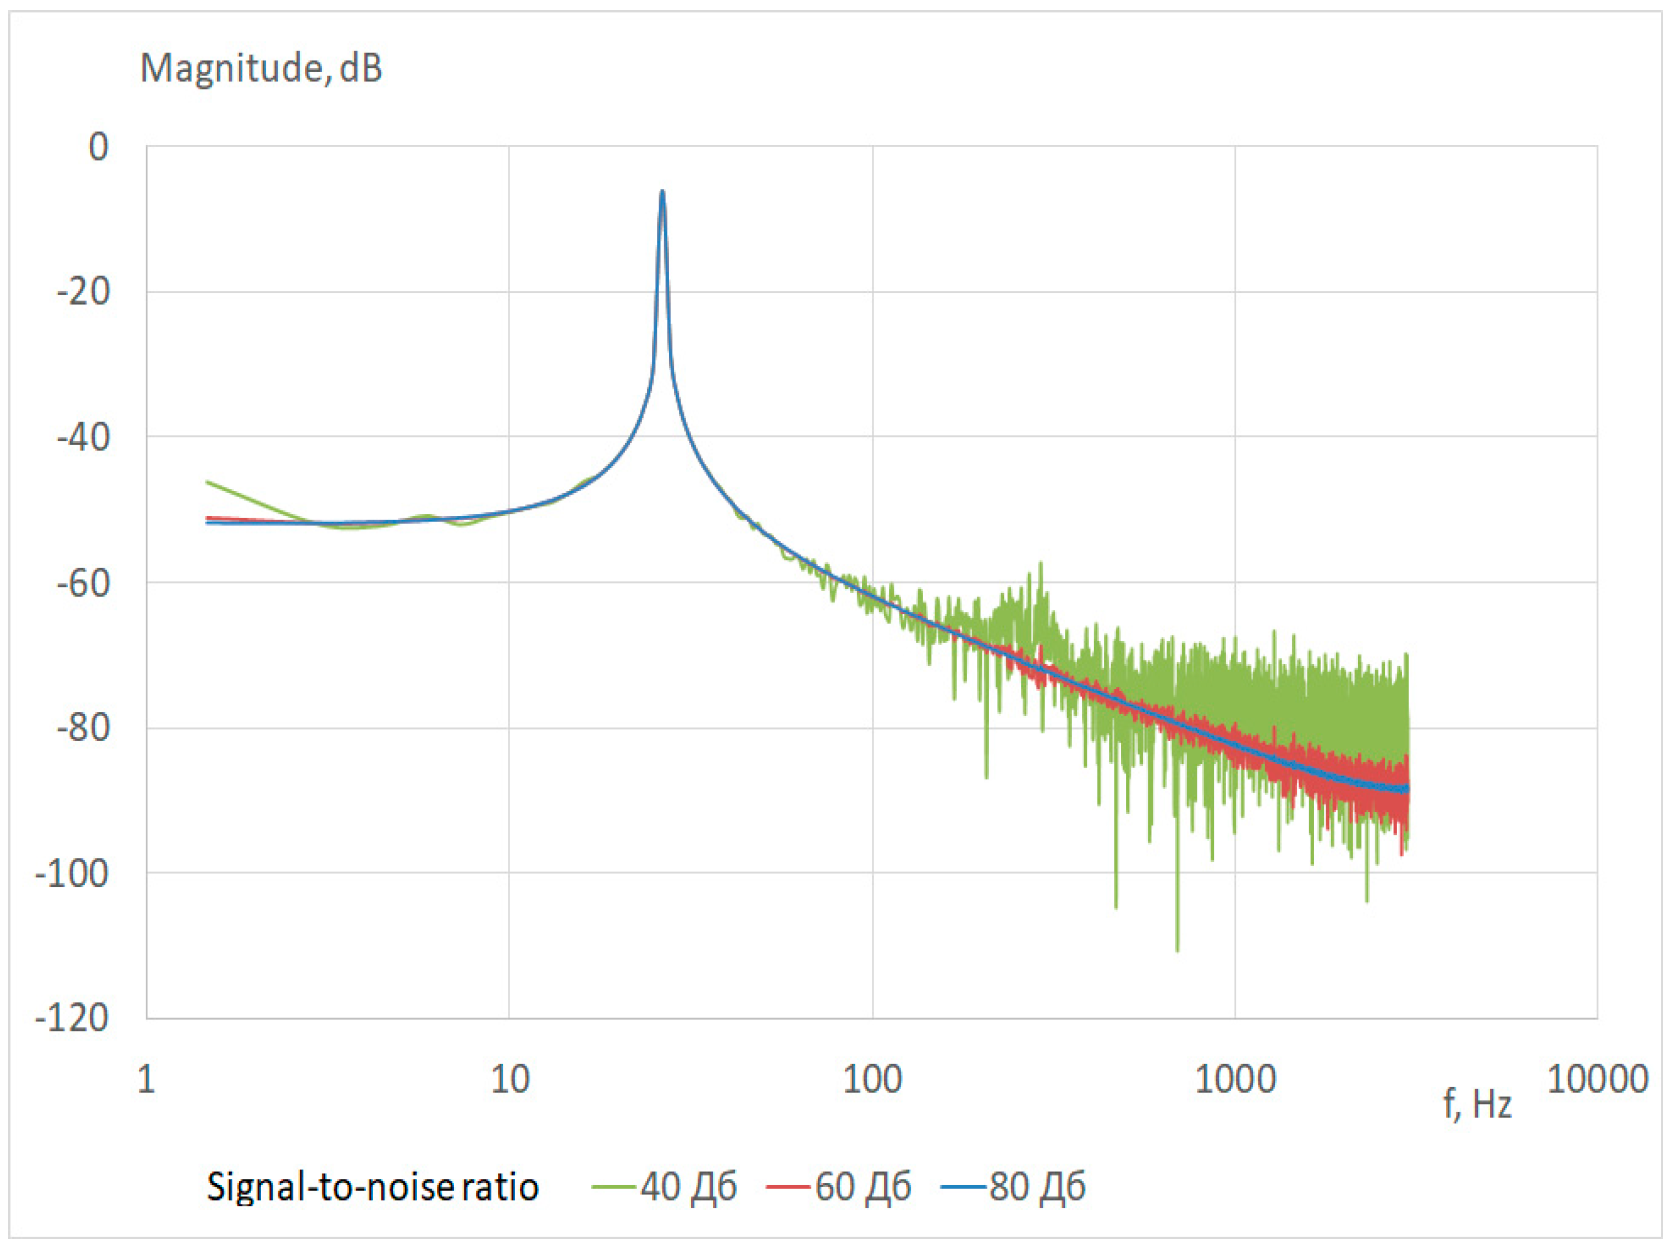
3. The noise spectral density analysis allows us to study the problem in the frequency domain. In the numerical simulation, the dependence of the results of the Fourier transform in the presence of an additive mixture of a single valid periodic signal (50 Hz) and noise of various intensities looks like
Figure 10.
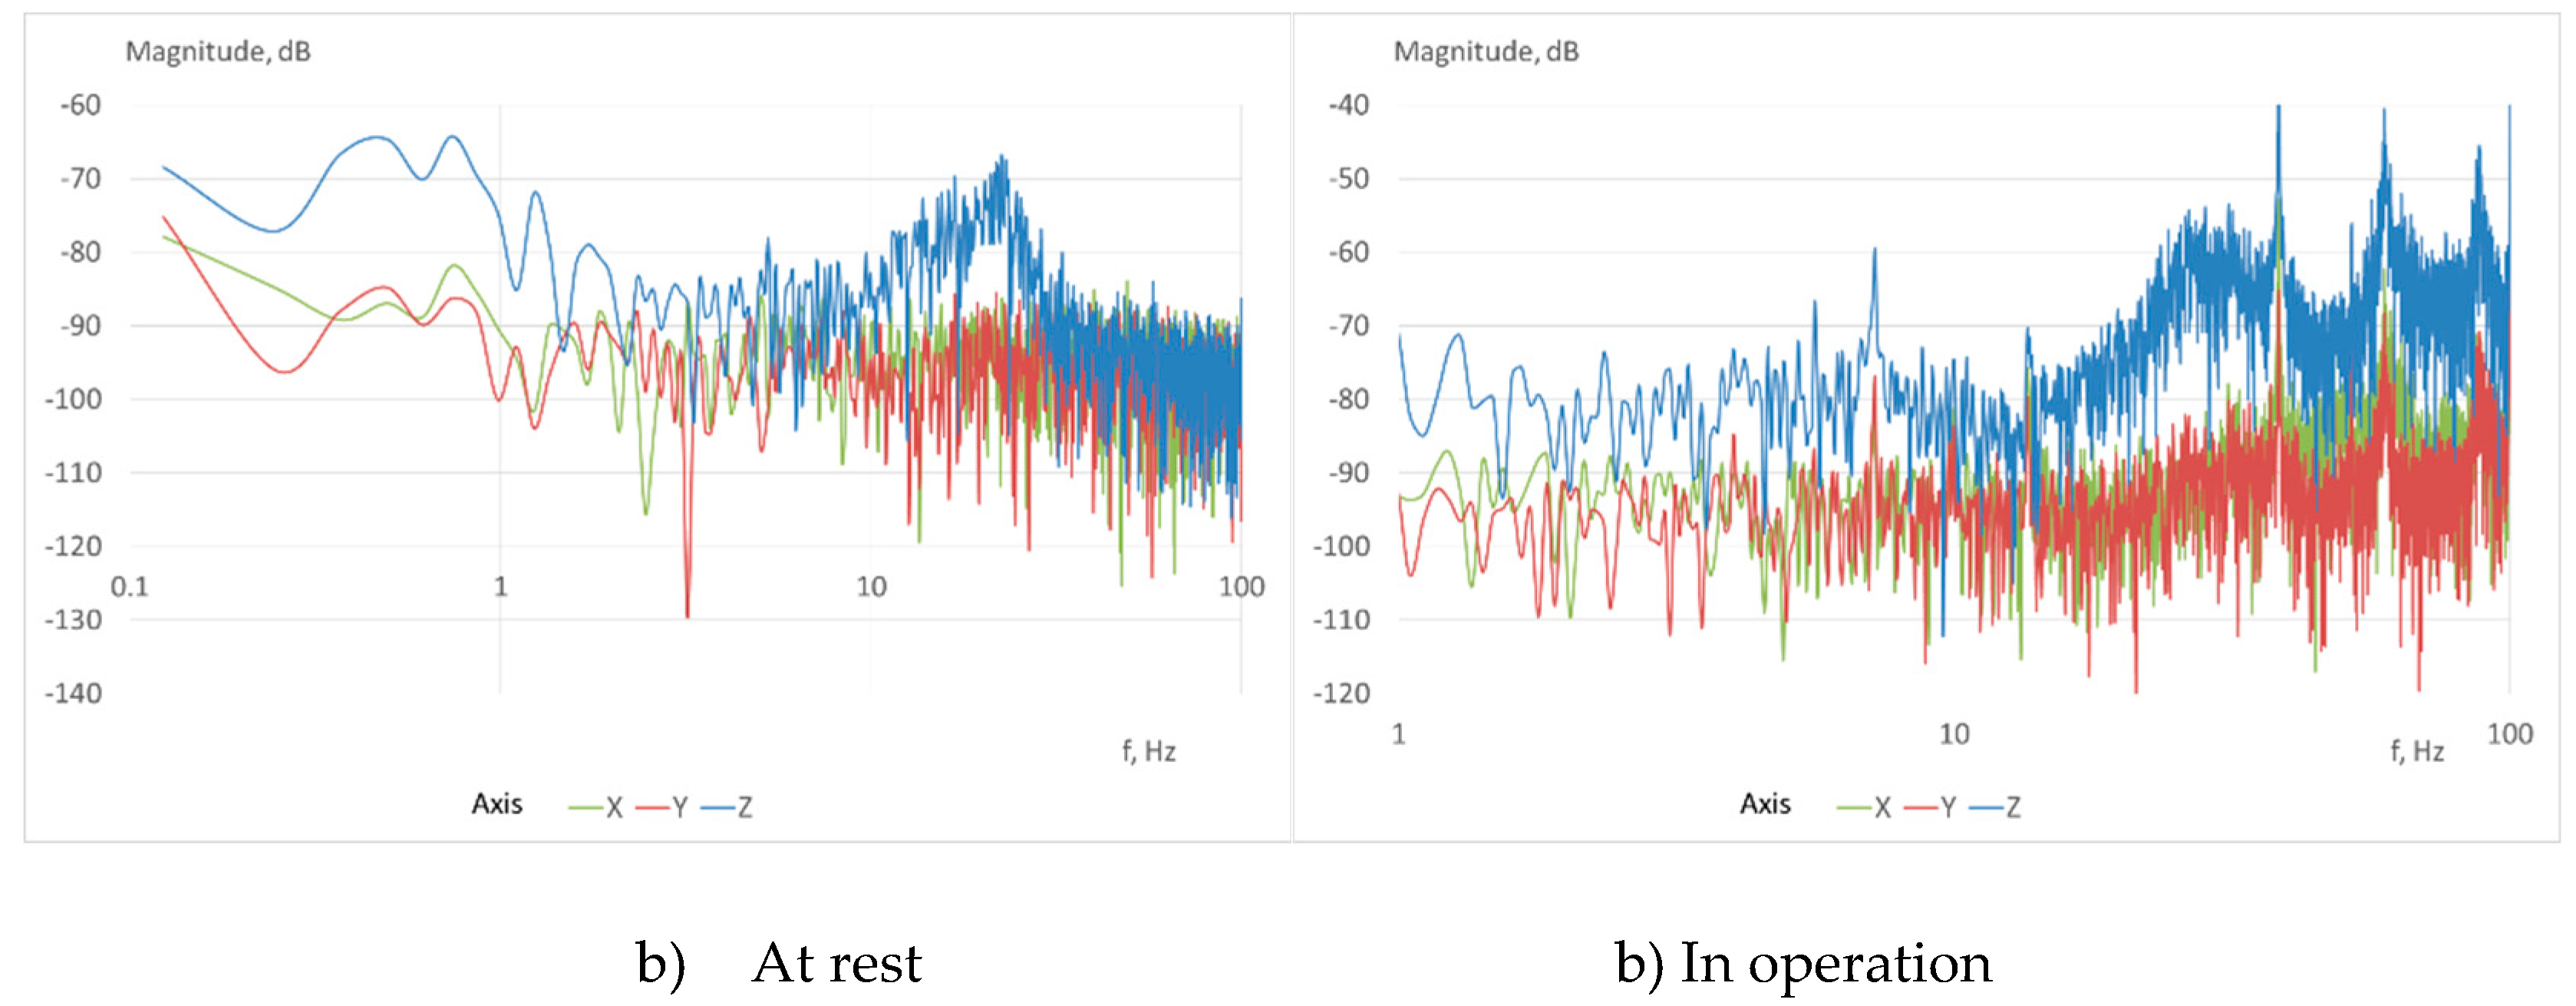
In contrast to theoretical model calculations, the results of practical measurements demonstrate the presence of many harmonics in the frequency range of 20-100 Hz
4. Using the algorithm given in section 2 confirms that the controlled industrial equipment is in good condition. The calculated RMS value of the vibration velocity corresponds to the recommendations for determining the boundaries of the vibration state zones according to the standard. As a result, we have the following: the standard sets the limit of regular operation for low-power systems as "no more than 0.45 mm/s", and at rest, the measuring system fixes 3.45*10-5 mm/s, during operation 4.9*10-4 mm/s.
4. Discussion
We compared our proposed system with those previously proposed. Three similar systems are considered, each allowing several accelerometers to connect.
A system of IoT-connected devices for measuring and analyzing vibration [
30].
A low-cost vibration measurement system for industrial applications, which, unlike all others, is the only one that uses wired data transmission and mains power [
31].
A low-cost vibration measurement system for determining the condition of construction structures [
32].
Technical and economic indicators of the developed system, in comparison with analogs have the following advantages.
The use of the specialized IIS3DWB accelerometer of the STM company, explicitly intended for vibration diagnostics, allowed it to increase the frequency range of measurements from 1000 Hz to 6000 Hz.
The use of the energy-efficient BLE 5.1 communication protocol and the STM32L476 microcontroller with the corresponding energy-saving algorithms allowed to increase the operating time without replacing the battery to 1 year, while the analog system requires replacement after only 8 hours. As a result, while maintaining approximately the exact cost of equipment and its installation as in wireless analogs, a significant reduction in the cost of operation is ensured.
MEMS gyroscope has been applied for condition-based maintenance. Although with the advantages such as low cost, easy integration, and convenient application, the application of MEMS accelerometer is limited for its relatively low precision.
The proposed method improves the filtering effect. Nevertheless, the precision is somewhat obtained at the cost of a computing resource. The calculation time of the methods is in the same order of magnitude, which is in the high-performance computing environment. The time cost will increase if the computing is in some terminal processors of a single CPU or small memory.
The balance of precision and time cost should be considered in the practices. Besides, some researchers found that the noise parameter adjustment may impact the operational stability of the filters. The filtering effect is tested with the experiment means. The theoretical demonstration can be conducted in future research.
5. Conclusions
The article proposes the noise analyses of accelerometers using Allan variance for industrial equipment vibration diagnostic methods in IoT-oriented technology for vibration diagnostics of industrial equipment. The Microsoft Azure IoT platform was chosen as the cloud computing platform for the industrial equipment vibration diagnosis system, which provides the infrastructure for creating and managing applications in the cloud. Microsoft Azure IoT includes the Azure Internet of Things Suite, which integrates and organizes the flow of data, manages it, analyzes it, and presents it in a format that helps people make relevant decisions.
The architecture of the platform-oriented IoT system of vibration diagnostics of industrial equipment is three-level. Data from the level of autonomous sensors that read indicators of vibration acceleration are sent to the Hub level, which is implemented based on a BeagleBone single-board microcomputer, which has enough computing power to work with artificial intelligence algorithms, through the BLE digital wireless data transmission channel. At the level of the server platform, the tasks of diagnosing and predicting the condition of the equipment are solved, for which the Dictionary Learning algorithm, implemented in the Python programming language, is applied. The implemented concept of microservice architecture allows for easy and convenient scaling by adding new instances of the service.
Calibration of the IoT system for vibration diagnostics of industrial equipment was performed using a special stand, which provides the ability to calibrate sensors and check the accuracy of the measuring system. Correct operation of the entire system is confirmed by the coincidence of expected and measured results.
Statistical method of noise analysis based on the Allan Variance in comparison to fast Fourier transform method has several significant advantages, it is convergent for many. IEEE standard 1554 [
33] recommends the AV approach together with the power spectral density approach as the preferred methods for the stochastic error identification of inertial sensors.
