Preprint
Brief Report

A First Study on Home Range Characteristics of Common Dolphin in Korean Waters: A Study Using Data Collected During the Past 20 Years

Altmetrics

Downloads

127

Views

60

Comments

0

Submitted:

30 June 2023

Posted:

30 June 2023

You are already at the latest version

Alerts
Abstract
The common dolphin is the second most bycaught species in Korean waters. To provide key information about their habitat boundaries and hotspots for spatial conservation and management, the spatial use of this species was examined using data obtained from sighting and bycatch surveys of cetacean during the past 20 years. The 95% minimum convex polygon and 95% density contour of fixed kernel suggested that the boundary of home range of common dolphins is limited to the coastal region (Busan-Sokcho) of the East Sea/Sea of Japan. From 50% density contours dawn by kernel density estimation, it was suggested that their hotspots are around the cost of Ulsan-Pohang, Doghae, and Sokcho within the home range. Common dolphins are not at all distributed in the Yellow Sea. Hence, shallow waters, such as the coastal region of the Yellow Sea, are not suitable habitats for common dolphins.
Keywords: 
Subject: Biology and Life Sciences  -   Aquatic Science

1. Introduction

Fisheries bycatch is currently the greatest source of human-caused deaths of marine mammals worldwide [1]. To reduce the global bycatch of marine mammals, international protection policies have been implement [1,2]. In Europe, all cetaceans were strictly protected under articles of the EU Habitats Directive [2]. The United states enacted regulations under the Marine Mammal Protection Act aimed at reducing marine mammal bycatch in international fisheries in 2016 [1]. These regulations require any country exporting fish and fish product to the United States to have or establish marine mammal protections equivalent to those in the United States [1].
In many countries, spatial conservation or protection initiatives, which focus on the protection of key areas and habitats, have attempted to reduce marine mammals bycatch [3,4,5]. According to Slooten (2013) [4], to stem declines of Hector’s dolphin population resulted from fisheries mortality in New Zealand waters, marine protected areas (MPAs) has been continually extended since 1970. As a result of the Slooten’s study, the declines of dolphin population slowed or halted by the extension of MPAs in 2008 [4]. Tomás and Sanabria (2022) [6] introduced histories and areas of MPAs in the Wadden Sea placed along the coasts of Denmark, Germany, and the Netherlands, Banks Peninsula located on the East coast of the South Island of New Zealand, Humpback Whale National Marine Sanctuary located in Hawaii, and Melville bay in Greenland, suggesting the effectiveness of spatial protection measures in marine mammals. Therefore, understanding the distribution or geographical range of a species is a key factor to prioritize spatial managements for species conservation [5].
Home range analyses is a common method used to determine the distribution of marine mammals [8]. According to Burt (1943) [9], the home range of an animal is defined as “that area traversed by an individual in its normal activities of food gathering, mating, and caring for young.” Typically, the home range reflects habitat use [10]. Marine mammal populations often have hotspots [9], which are often termed as small geographic areas with a high density of animals [4,11].
The common dolphin (Delphinus delphis) is a globally abundant species that is mainly distributed in the tropical and temperate waters of the Atlantic and Pacific oceans [12,13]. In Korean waters, the common dolphin is the second most bycaught species [14]. It was mostly observed and bycaught in the coastal regions of the East Sea [15,16,17]. Lee et al. (2018) [14] reported that over 250 common dolphins per year were bycaught by commercial fisheries in the East Sea from 2011 to 2017. The common dolphin bycatch in Korean waters was mainly found in set and gill nets [15]. In Korean waters, both set and gill nets are widely used. Set nets are stationary fishing nets, while gill nets are mostly classified into stationary and mobile fishing nets in Korean waters. Although set nets are fixed at a certain position legally permitted in the coastal region, gill nets are operated anywhere within the coastal and offshore regions in Korean waters. Therefore, it is necessary to develop appropriate spatial management initiatives to reduce common dolphin bycatch. However, there is little information on their spatial characteristics, focusing on key areas and habitats of common dolphin need to the spatial management decisions.
In Korean waters, cetacean research was started in the 1970s and continued until 1986 by an IWC’s moratorium on commercial whaling. Then, it was subsequently resumed with sighting surveys in 2000 and continually conducted until the present [17]. Since a legal system for collecting information on cetacean bycatch was established in 2011, the spatial and temporal information on cetacean bycatch has improved [15].
In this study, two simple questions were considered: where do hotspots of common dolphins exist? How much area does common dolphins use? The area used by common dolphins and the existence of their hotspot were examined based on sighting and bycatch surveys of cetacean during the past 20 years. The present study is the first to describe the spatial use of common dolphins in Korean waters. Our results may provide key information about their hotspots and habitat boundaries for the spatial conservation and management of this species in Korean waters.

2. Materials and methods

2.1. Sightings data

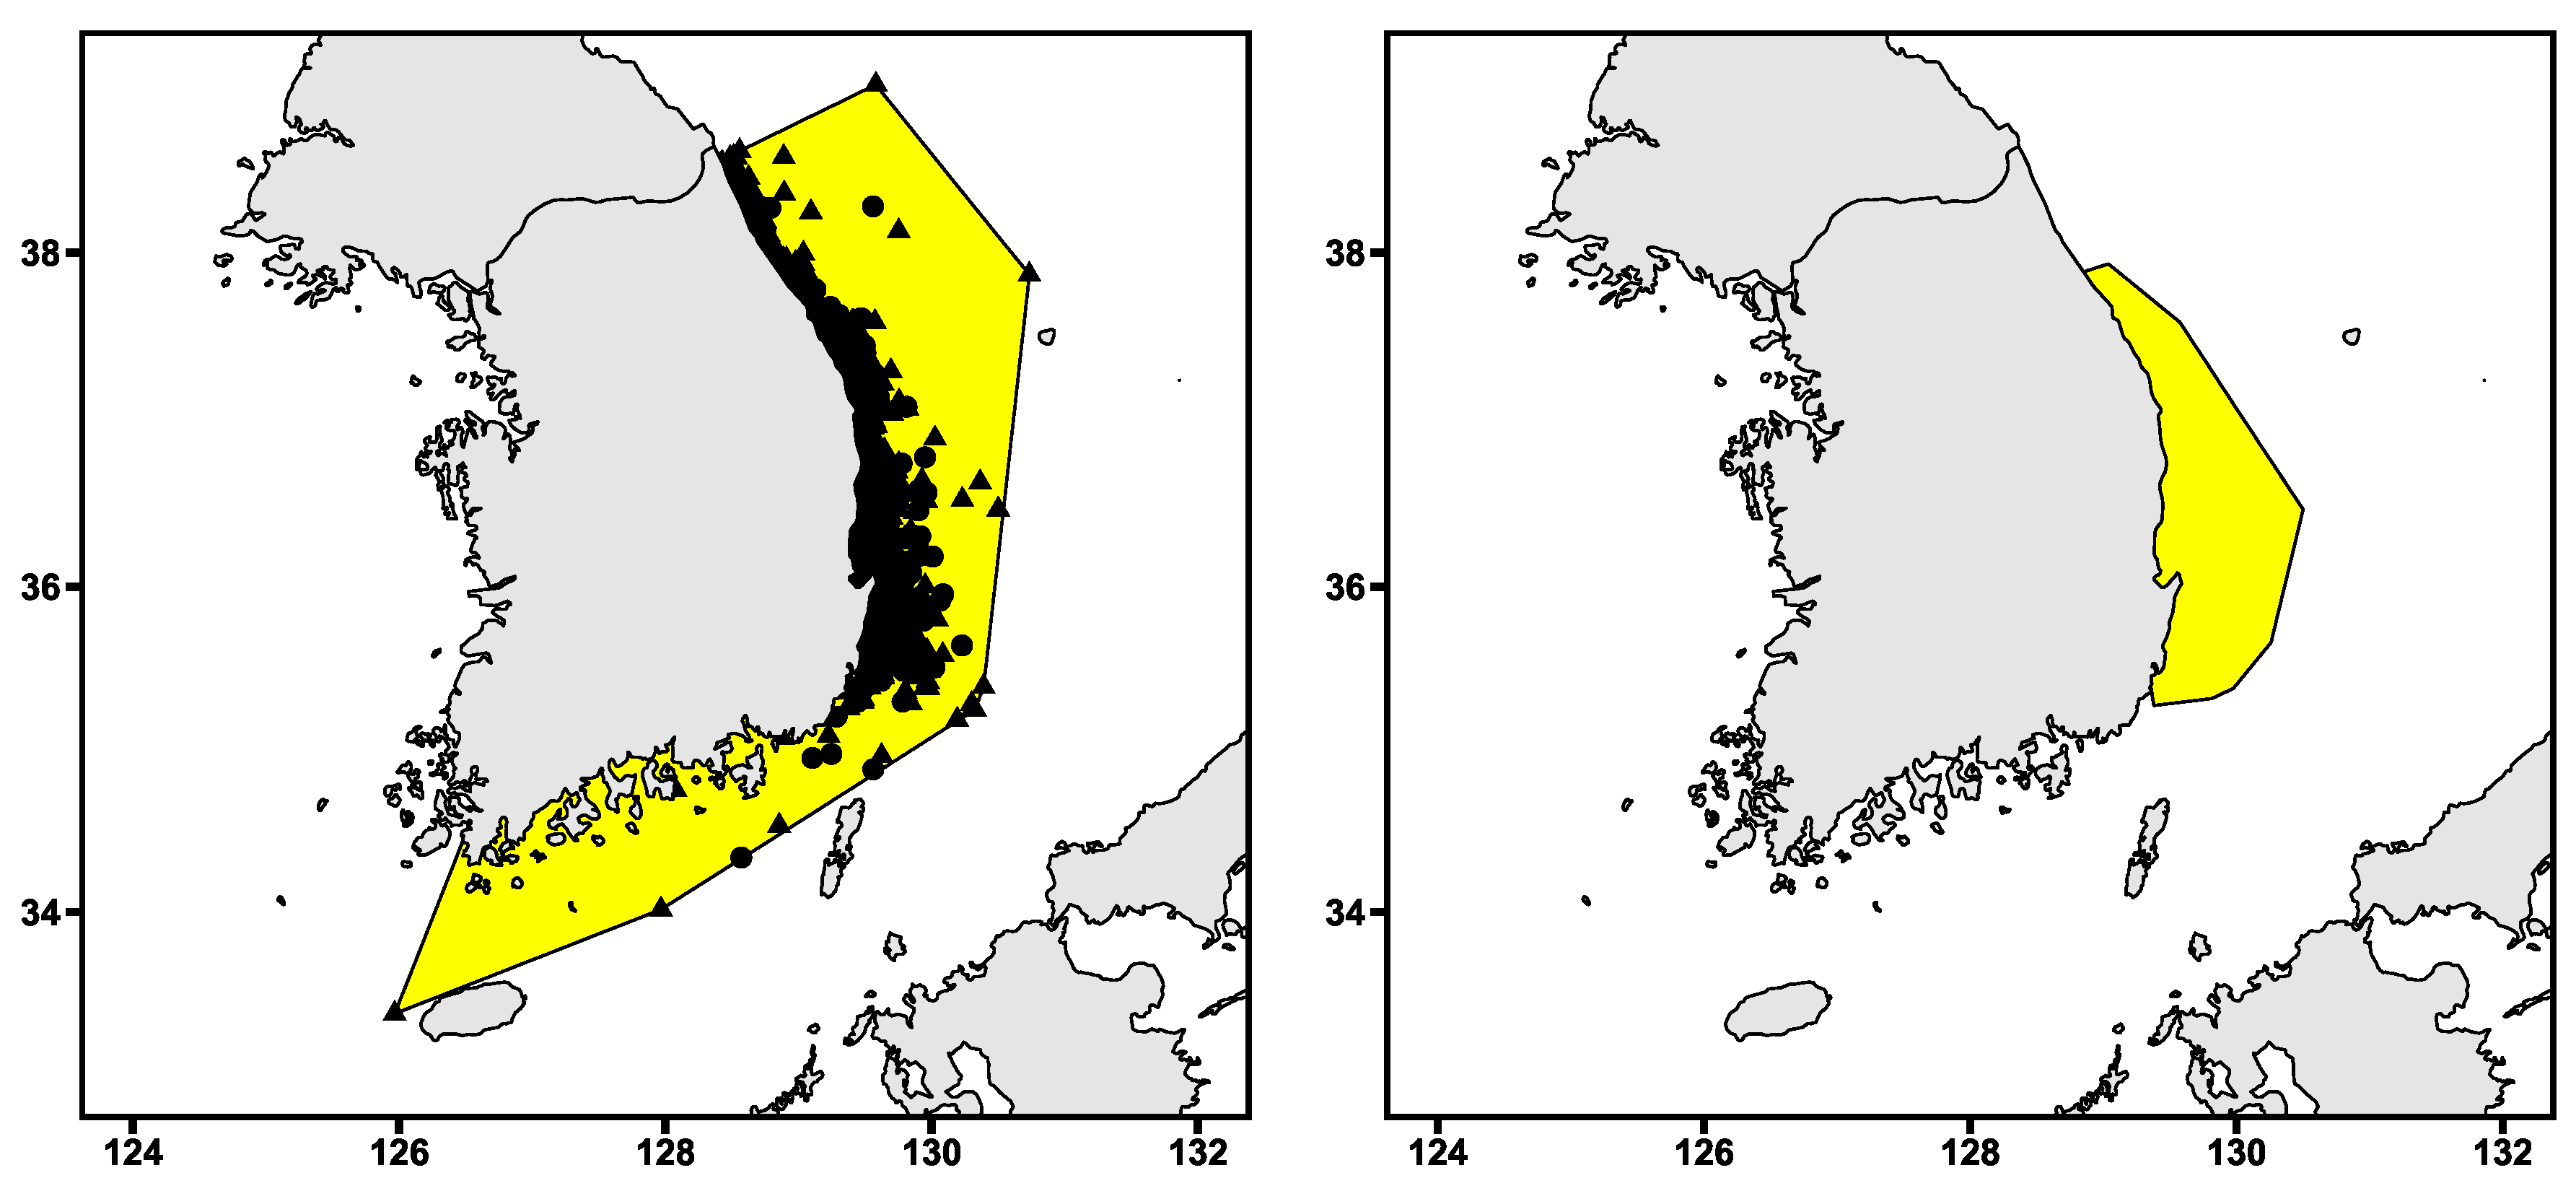
Sighting surveys were conducted to primarily estimate the abundance and determine the distribution of cetaceans living in Korean waters using several research vessels of the National Institute of Fisheries Science since 1999 (Figure 1). The sighting surveys from 2000 to 2020 are summarized in Table 1. During the study period, visual line-transect surveys covered 43,969 nautical miles, with a total of 92 sightings. The surveys were prioritized in the Yellow Sea (YS) and East Sea/Sea of Japan (ES) because of the absence of dedicated research vessels and inadequate budges (Table 1). Surveys in subtidal zones about 10 m depth were not conducted in YS. The surveys were also carried out in sea conditions of Beaufort ≤ 4 and in closing mode for species identification and group size estimation by a trained and experienced observer team onboard the research vessel. An observer who recognized cetaceans set the foremast to 0° to determine the angle and distance between the cetaceans. Zigzag transect lines with a random start were employed within the study area [18]. The speed of the research vessel was maintained at 10–12 knots.

2.2. Bycatch data

In South Korea, a certificate for each cetacean bycatch was issued by the Korean Coast Guard since 2011 [15]. The Korean Coast Guard conducted a detailed mandatory investigation on each cetacean bycatch (bycatch species and position, body injury of cetacean, etc.) to confirm the take as incidental and report a government-issued certificate in accordance to pertinent laws [15]. In this study, the spatial count data (individuals) of common dolphin bycatch in Korean waters from 2011 to 2020 were obtained from these certificates.

2.3. Data analyses

Common home range metrics represent the spatial extent and density of available locations [16]. Minimum convex polygon (MCP) and fixed kernel density estimation (KDE) were used to estimate the home ranges [19,20,21,22]. The MCP estimator is a straightforward approach that involves creating a convex polygon (i.e., a polygon with no internal angles greater than 180 degrees) encompassing all locational points gathered for an animal or group [21]. MCP estimation was generally based on all fixes collected from surveys (100% MCP). However, MCP has a high sensitivity to outlier locations and tends to overestimate the home range [19,23]. The weaknesses of MCP were reduced based on rules that exclude a certain proportion of the outermost locations (e.g., 95% MCP) [19,24,25]. In the present study, 95% and 100% MCPs were calculated to fine the home range boundaries of common dolphin in Korean waters using data collected from sighting and bycatch surveys during the past 20 years.
In this study, to determine whether common dolphins used random habitats, Kolmogorov–Smirnov goodness-of-fit test (K–S test) was applied [26]. KDE was used to produce animal density maps by fitting a density function to weighted animal sightings onto a user-defined grid [11]. The function allowed users to incorporate a barrier to the interpolation of sightings [11]. Therefore, KDE can account for multiple centers of behaviors [19]. Brough et al. (2018) [11] investigated the existence of hotspots of Hector’s dolphins in New Zealand with 50% density contours (DC) extracted from the overall kernel analysis. The 50% DC was extensively used to define core areas in wildlife distribution studies; it reflected the area in which 50% of the weighted sightings occur [27,28,29]. In this study, the 50% DC was used as an indicator of the existence of hotpots using data collected from sighting surveys during the past 20 years. The 95% DC for KDE drawn to compare the home range boundaries of common dolphins resulted from 95% MCP analysis. In K–S test and KDE analyses, the bycatch data of common dolphins were inappropriate to use without the standardization of bycatch by spatial locations and efforts of fishing gears. An ad hoc method was applied to calculate a smoothing parameter (bandwidth) for the kernel [30]. All home range analyses were completed using the adehabitatHR package [31] in R (R Development Core Team).

3. Results

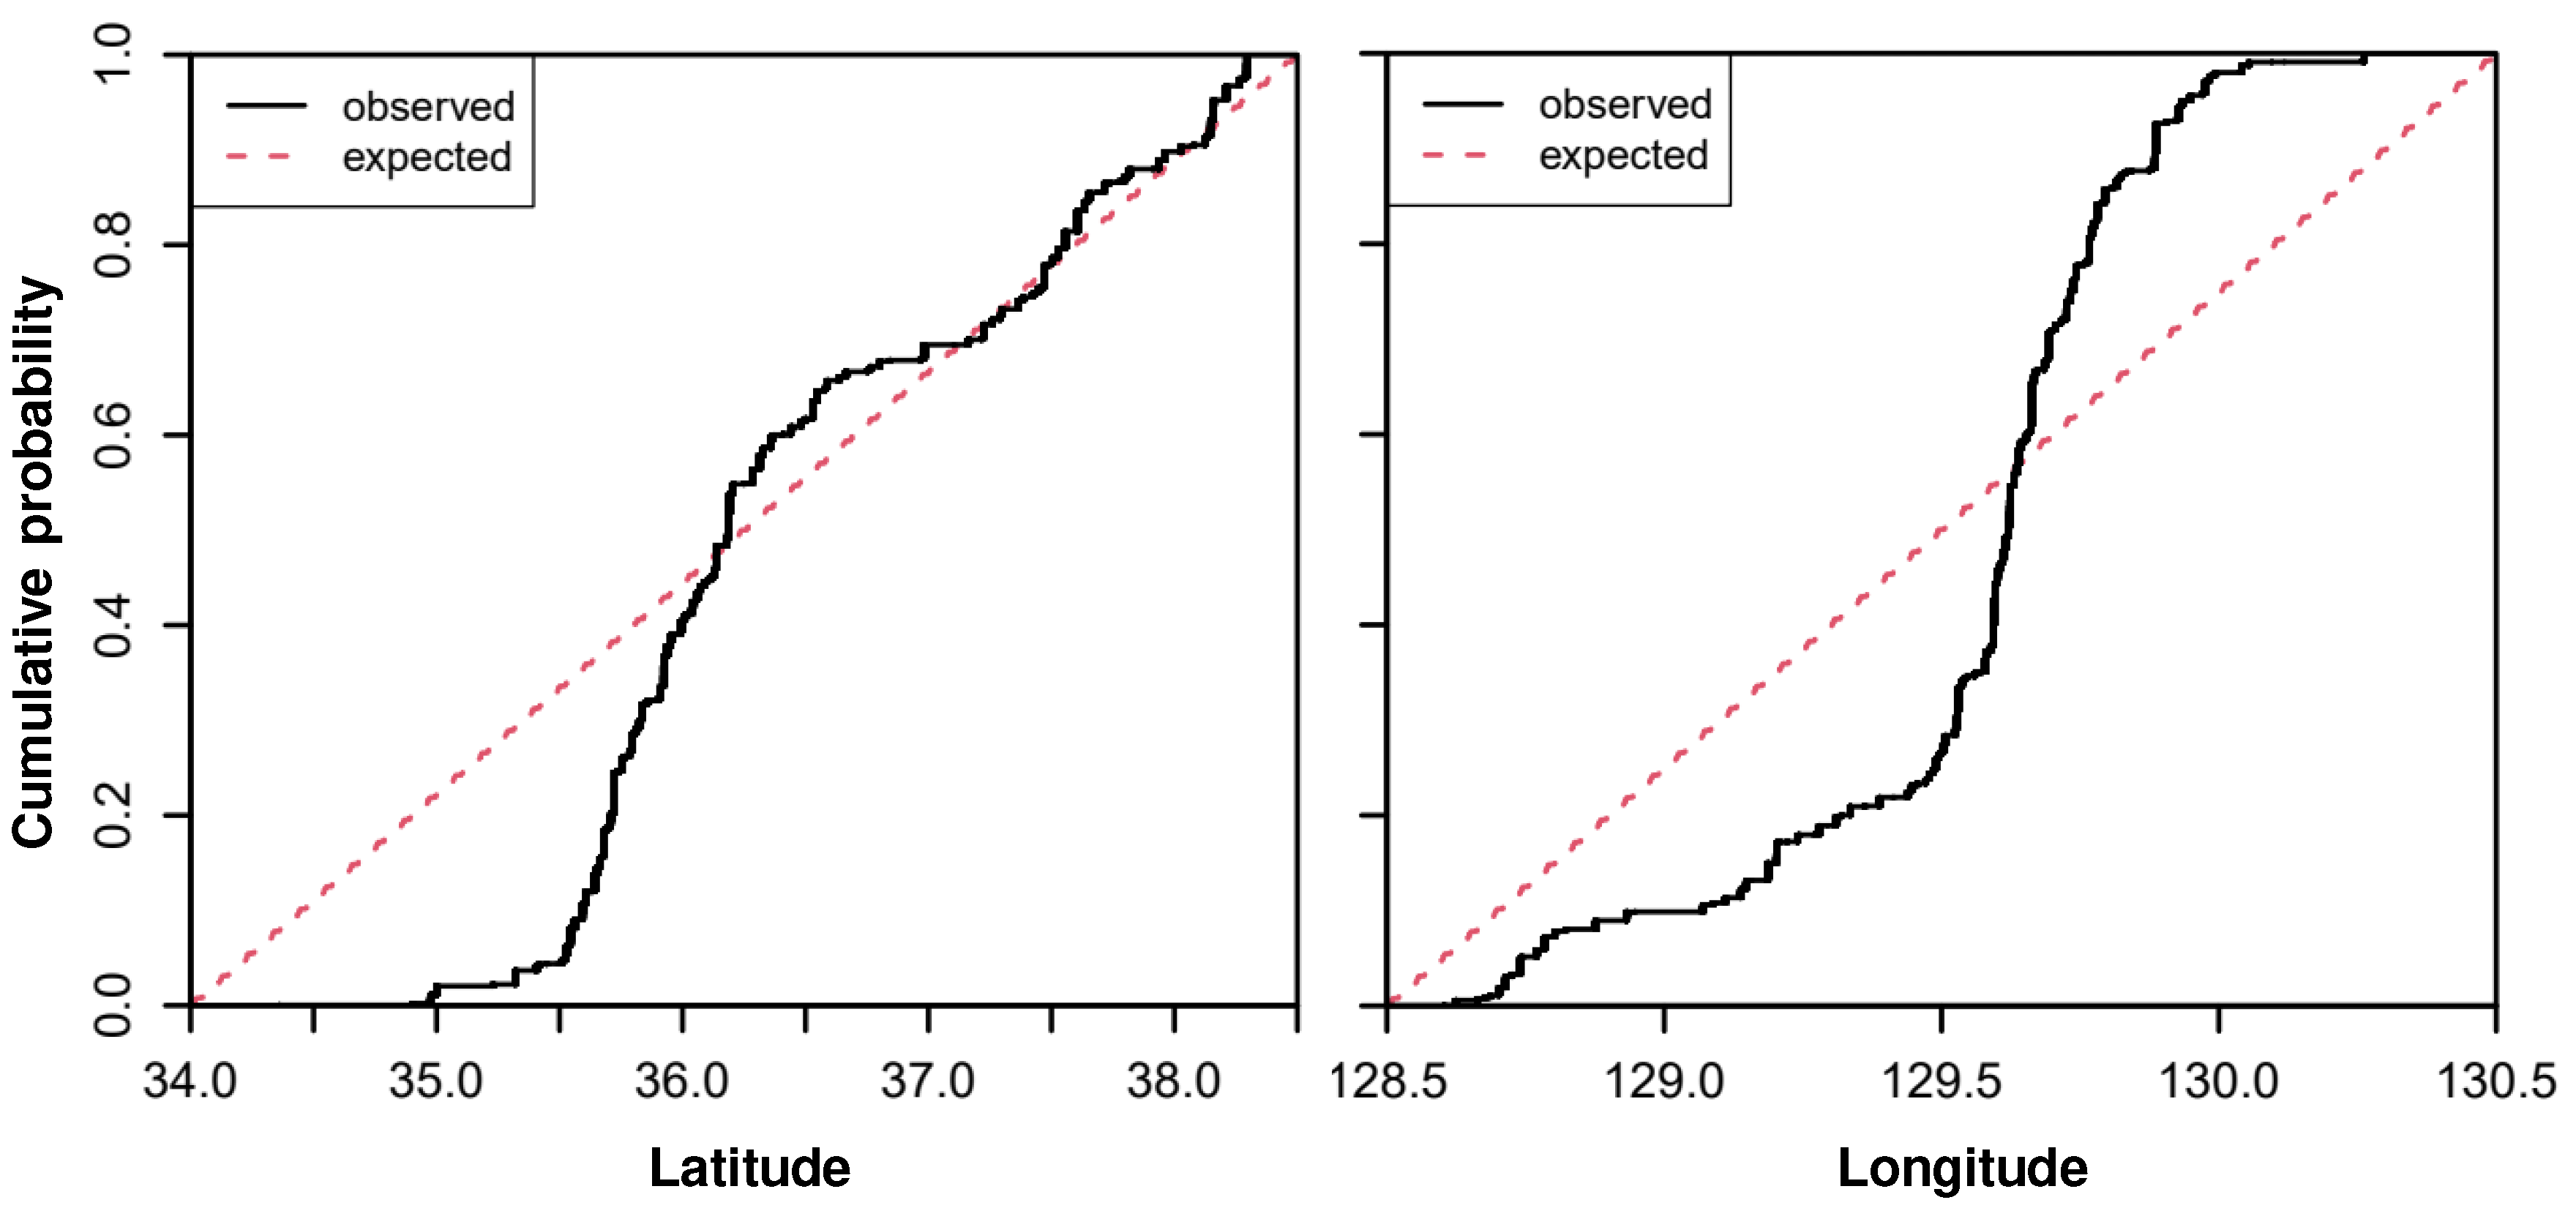
In Korean waters, the polygon area drawn by the 100% MCP was enclosed from the South Sea (SS) to ES, except YS, while that drawn by the 95% MCP ranged from Ulsan to Sokcho along the coastal region of ES (Figure 2). The outmost locations of the polygon area for the 100% MCP were almost the bycatch locations.
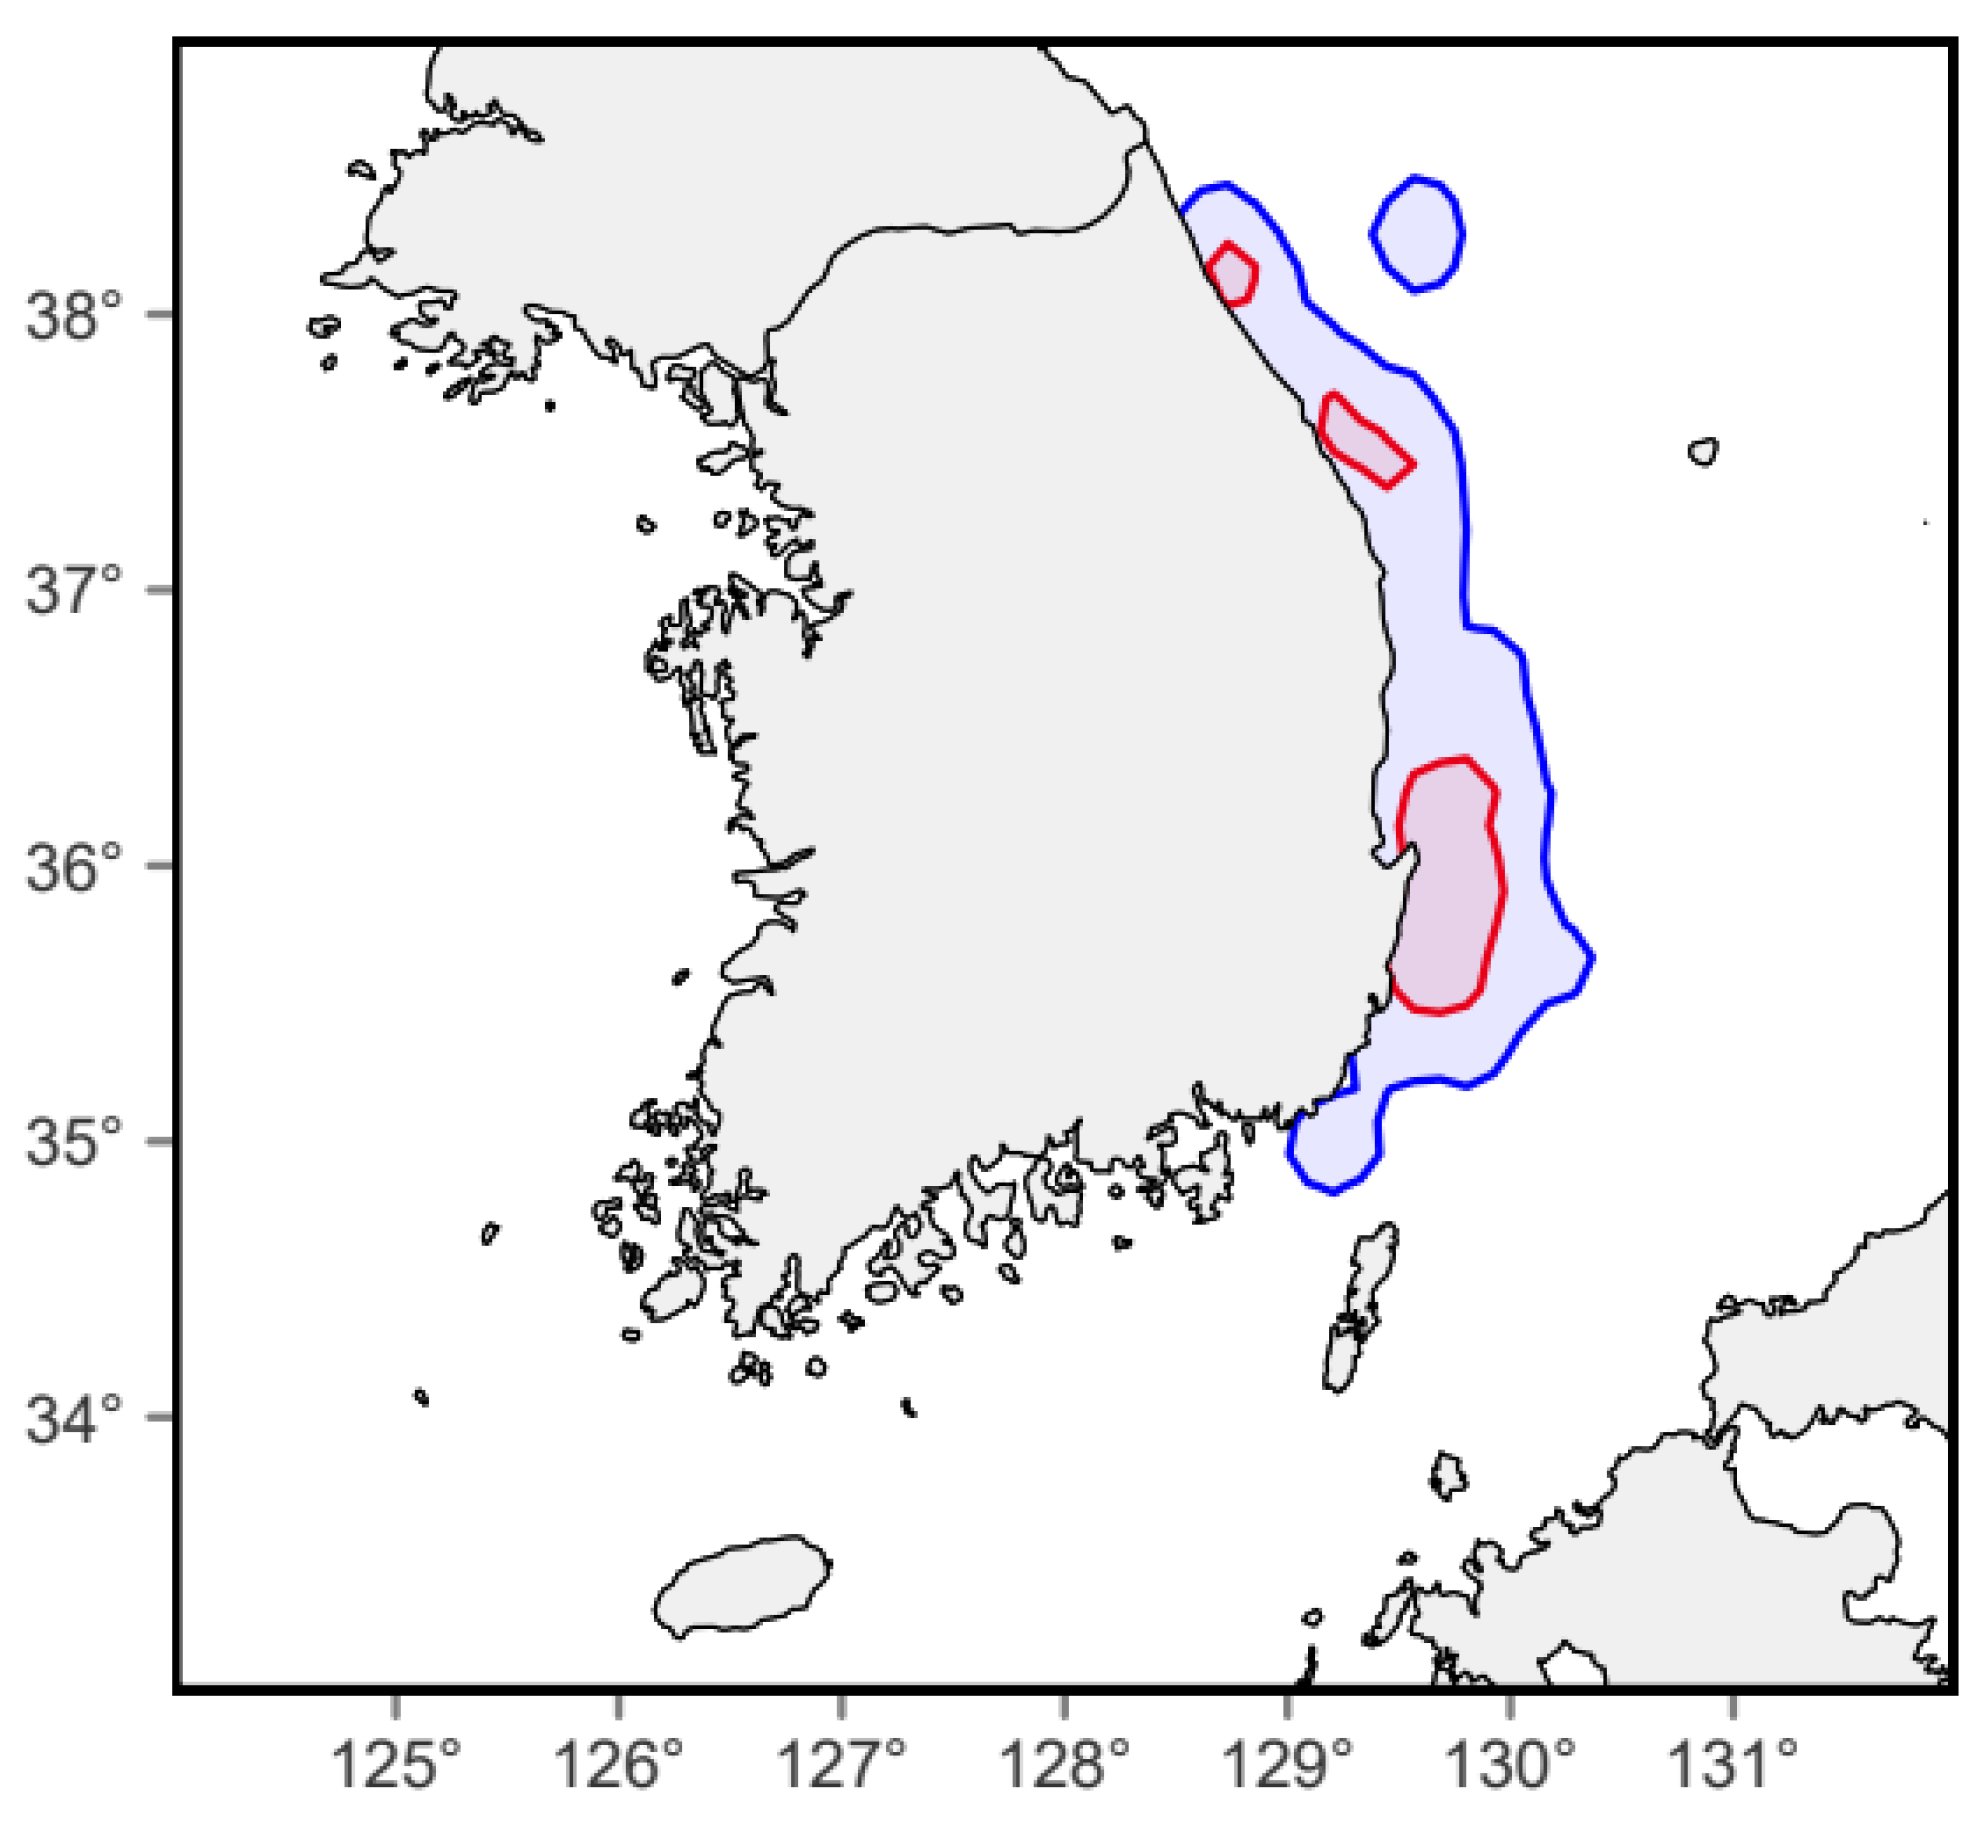
The K–S test results are shown in Figure 3. There were apparent differences in distances between the observed and expected distribution for sighting locations (both latitude and longitude) of common dolphins. The two distances were significantly different (p < 0.05). These results indicate that common dolphins unevenly used the coastal region of ES.
Figure 4 shows the 95% and 50% DCs drawn through KDE analysis. The 95% DC was slightly more extended toward the northern and southern directions than the range of 95% MCP. In 95% DC, a large school of common dolphins was observed in a location away from the coast of Sokcho, so a contour was drawn in that location. As a result of the 50% DC for KDE analysis, the hotspots of common dolphins in Korean waters were formed around the coast of Ulsan-Pohang, Donghae, and Sokcho (Figure 4). The coast of Ulsan-Pohang among these hotspots in ES was the widest (Figure 4).

4. Discussion

Home range studies are typically conducted to provide information on the extent and area of habitat use to make a spatial management decision for animal conservation [32]. The home range characteristics of common dolphins in Korean waters were described for the first time in the present study. The polygon area made by 100% MCP mostly covered the Korean waters, except WC, and seem to be overestimated due to several outmost bycatch locations. Börger et al. (2006) [19] reported that methods rejecting a certain proportion of outermost locations for MCP analysis lack any biological basis and do not eliminate biases. However, it was well-known that the 100% MCP is sensitive to nonnormal behaviors of animals, such as excursional and exploratory behaviors, leaving home range a cause of outliers [25,33]. As defined by Burt (1943) [9], home range covers the area used by an animal during its normal activities, such as mating and foraging.
Although the effort of our surveys was very less in SS than in YS and ES (Table 1), the common dolphins were rarely observed and bycaught around SS (including Jeju-do) and Ulleung-do. Photos of common dolphins taken by people near the coast of SS and around Ulleung-do were very occasionally reported in the media during the past 20 years. Bycatch events of common dolphin in the SS and offshore regions of ES occurred several times from 2011 to 2020 (Figure 2). Therefore, the home range boundary of common dolphins based on 95% MCP analysis is more reliable than that based on 100% MCP analysis. Further, when comparing the boundary drawn by 95% DC for KDE with that drawn by 95% MCP, there was a little difference between the two boundaries painted in the coastal region of ES. Therefore, we suggest that the home range of common dolphins is limited from Busan to Sokcho along the coastal region of ES in Korean waters. The SS and offshore region of ES may be utilized as maritime routes of migration or excursion of common dolphins. How and why common dolphins use these sea areas is a major research topic in the future.
On the other hand, because hotspots are important locations for life history processes or key behaviors, such as foraging, breeding, and resting [11], their existence is crucial for animal conservation. The effectiveness of spatial protection on the reduction of dolphin’s bycatch was already noted [4]. Tomás and Sanabria (2022) [2] showed recovery trends in populations of four marine mammal species, geographically placed in distant marine protected areas, providing empirical evidence that suggests the effectiveness of spatial management. Therefore, the protection of hotspots could be prioritized in spatial management decisions. According to several prior studies [15,16], common dolphins were mostly observed in the coastal regions of ES. It was further revealed where hotspots of common dolphins exist within the home range of the species by the 50% DC for KDE analysis. Based on the analysis, it was suggested that their hotspots are formed around the coast of Ulsan-Pohang, Donghae, and Sokcho within their home range. According to Yoo and Park (2009) [34], the waters around Ulsan-Pohang delineated as the widest hotspot in the present study was the most productive region coupled to frequent coastal upwelling in ES. Lee et al. (2017) [35] reported the waters around Ulsan-Pohang can be used as a biological hotspot of minke whales. Kemper et al. (2013) [36] claimed that an increase of records of pygmy right whales off Australia and New Zealand is related to the increase of coastal upwelling and productivity during climatic phenomena such as El Niño near their hotspots. Manna et al. (2016) [37] described that bottlenose dolphins in the southern Mediterranean Sea prefer shallower feeding grounds that often host rich food webs, implying that chlorophyll-a is a useful parameter in identifying hotspots. Thus, ecosystem productivity altered by nutrient enrichment may be considered as an important biological factor affecting the formation of hotspots of cetaceans. However, it is difficult to improve understanding formation of common dolphin’s hotspots because little is known about biological and physical factors influencing changes in their spatial density in ES. On the other hand, the hotspots for common dolphin are endangered or vulnerable habitats because fishing grounds of various fisheries, such as set and gill nets, are formed around those hotspots, resulting in the bycatch of large numbers of common dolphins. Further studies should be done seasonally and spatially on seasonal distributions of common dolphins in ES and appropriate fishing regulations (e.g., legal designations as protection areas, prohibited fishing periods, etc.) to reduce the common dolphin bycatch.
Measures for reducing the risk of cetacean bycatch in fishing gear have been reviewed [38,39]. Moreover, several studies on technical mitigation measures for marine mammal bycatch have been conducted [40,41]. It is also a necessary initiative for conservation of common dolphin to extensively apply such mitigation measures to commercial fishing gear and vessels operated within their home ranges. Furthermore, when combined applications of these mitigation measures to fishing gear with appropriate spatial conservation and management within the home ranges, policy effect on their conservation may be more effective.
Jefferson et al (2015) [12] illustrated that common dolphins are distributed from YS to ES. However, an interesting finding of the present study is that common dolphins are not at all distributed in YS (Figure 2). As a similar case in Korean waters, finless porpoises were only distributed in the southern coast of ES, YS, and SS [16]. According to Jefferson et al (2015) [12], common dolphins are widely distributed in tropical to cool temperature waters. MacLeod et al (2007) [42] reported that this species in the Alboran Sea preferentially occurred in waters warmer than 12.3°C. It was well known that sea surface temperatures in ES and YS were generally warmer than 10°C in all seasons except for winter [43,44]. Therefore, it seems that there is little relationship between sea temperature and the non-distribution seas of common dolphin in Korean waters. Alternatively, there is an apparent topographic difference in the coastal region of YS and ES. The coastal region of YS consists of ria coasts and broad tidelands, while that of ES has a topographic feature, where the depth after 200 m rapidly increases [45,46]. It seems that shallow waters, such as the coastal region of YS, are not suitable habitats for common dolphins. In addition, Ahn et al. (2014) [47] reported that prey items found from stomach contents of common dolphins were mostly Enoploteuthis chunii (a squid species), common squid, and Pacific herring. In Korea, both common squid and Pacific herring were mostly caught in ES [48,49]. Hayashi (1988) [50] reported that E. chunii was also observed around 400 m depth. The items estimated as main preys of common dolphins were mainly distributed in ES and in deeper depths. Therefore, the different distributions of common dolphins between YS and ES may be caused by the composition and distribution of its prey species as a nutritional variable.

Acknowledgments

This study was funded by a grant from the National Fisheries Research and Development Institute, Korea (R2023004).

References

  1. Moore, J.E.; Heinemann, D.; Francis, T.B.; Hammond, P.S.; Long, K.J.; Punt, A.E.; Reeves, R.R.; Sepúlveda, M.; Sigurðsson, G.M.; Siple, M.C.; Vikingsson, G.A.; Wade, P.R.
  2. Dolman, S.; Baulch, S.; Evans, P.G.H.; Read, F.; Ritter, F. Towards an EU action plan on cetacean bycatch. Mar. Pol. 2016, 72, 67–75. [Google Scholar] [CrossRef]
  3. Quintana-Rizzo, E.; Cabrera, A.A.; Ortiz-Wolford, J.; Dávila, V. Spatial distribution and abundance of small cetaceans in the Pacific waters of Guatemala. Front. Mar. Sci. 2021, 8, 674134. [Google Scholar] [CrossRef]
  4. Slooten, E. Effectiveness of area-based management in reducing bycatch of the New Zealand dolphin. Endang. Species Res. 2013, 20, 121–130. [Google Scholar] [CrossRef]
  5. Wilson, B.; Reid, R.J.; Grellier, K.; Thompson, P.M.; Hammond, P.S. Considering the temporal when managing the spatial: a population range expansion impacts protected areas-based management for bottlenose dolphins. Anim. Conserv. 2004, 7, 331–338. [Google Scholar] [CrossRef]
  6. Tomás, E.G.; Sanabria, J.G. Comparative analysis of marine protected area effectiveness in the protection of marine mammals: lessons learned and recommendations. Front. Mar. Sci. 2022, 9, 940803. [Google Scholar] [CrossRef]
  7. Dwyer, S.L.; Clement, D.M.; Pawley, M.D.M.; Stockin, K.A. Distribution and relative density of cetaceans in the Hauraki Gulf, New Zealand. N. Z. J. Mar. Freshwater Res. 2016, 50, 457–480. [Google Scholar] [CrossRef]
  8. Bouchillon, H.; Levine, N.S.; Fair, P.A. GIS Investigation of the relationship of sex and season on the population distribution of common bottlenose dolphins (Tursiops truncatus) in Charleston, South Carolina. Int. J. Geogr. Inf. Sci. 2020, 34, 1552–1566. [Google Scholar] [CrossRef]
  9. Burt, W.H. Territoriality and home range concepts as applied to mammals. J. Mammal. 1943, 24, 346–352. [Google Scholar] [CrossRef]
  10. Chen, B.Y.; Zheng, D.M.; Ju, J.F.; Xu, X.R.; Zhou, K.Y.; Yang, G. Range patterns of resident Indo-Pacific humpback dolphins (Sousa chinensis, Osbeck 1765) in Xiamen, China: implications for conservation and management. Zool. Stud. 2011, 50, 751–762. [Google Scholar]
  11. Brough, T.; Rayment, W.; Slooten, E.; Dawson, S. Fine scale distribution for a population of New Zealand’s only endemic dolphin (Cepbalorbyncbus bectori) shows long-term stability of coastal hotspots. Mar. Mamm. Sci. 2018, 35, 1–24. [Google Scholar] [CrossRef]
  12. Jefferson, T.A.; Webber, M.A.; Pitman, R.L. Marine mammals of the world: a comprehensive guide to their identification; J. Audit: San Diego, USA, 2015. [Google Scholar]
  13. Perrin, W.F. Common dolphins – Delphinus delphis and D. Capensis. In Encyclopedia of marine mammals; Perrin, W.F., Würsig, B., Thewissen, J.G.M., Eds.; Academic Press: San Diego, USA, 2009. [Google Scholar]
  14. Lee, S.; Choi, S.; Kim, J.H.; Kim, H.W.; Sohn, H. Characteristics of the cetacean bycatch in Korean coastal waters from 2011 to 2017. Korean J. Fish. Aquat. Sci. 2018, 51, 704–713. [Google Scholar] [CrossRef]
  15. Kim, D.N.; Sohn, H.; An, Y.R.; Park, K.J.; Kim, H.W.; Ahn, S.E.; An, D.H. Status of the cetacean bycatch near Korean waters. Kor. J. Fish. Aquat. Sci. 2013, 46, 892–900. [Google Scholar] [CrossRef]
  16. Lee, J.H.; Kim, E.H.; Lee, K.; Park, K.J.; An, Y.R.; Kim, H.W. Occurrence and spatial distribution of marine mammals by sighting surveys in Korean waters during 2011-2020. Korean J. Fish. Aquat. Sci. 2022, 55, 938–945. [Google Scholar] [CrossRef]
  17. Sohn, H.; Park, K.J.; An, Y.R.; Choi, S.G.; Kim, Z.G.; Kim, H.W.; An, D.H.; Lee, Y.R.; Park, T.G. Distribution of whales and dolphins in Korean waters based on a sighting survey from 2000 to 2010. Kor. J. Fish. Aquat. Sci. 2012, 45, 486–492. [Google Scholar] [CrossRef]
  18. Strindberg, S.; Buckland, S.T. Zigzag survey designs in line transect sampling. J. Agric. Bio. Env. Stat. 2004, 9, 443–461. [Google Scholar] [CrossRef]
  19. Börger, L.; Franconi, N.; De Michele, G.; Gantz, A.; Meschi, F.; Manica, A.; Lovari, S.; Coulson, T. Effect of sampling regime on the mean and variance of home range size estimates. J. Anim. Ecol. 2006, 75, 1393–1405. [Google Scholar] [CrossRef]
  20. Cobarrubia-Russo, S.E.; Barreto-Esnal, G.R.; Molero-Lizarraga, A.E.; Mariani-Di Lena, M.A. Individual home ranges of Tursiops truncatus and their overlap with ranges of Stenella frontalis and fishermen in Aragua, Venezuela, South Caribbean. J. Mar. Biolog. Assoc. U.K. 2020, 100, 857–866. [Google Scholar] [CrossRef]
  21. Gregory, T. Home range estimation. In The international encyclopedia of primatology; Fuentes, A., Ed.; Wiley, Hoboken, USA, 2017; pp 1-4.
  22. Liu, M.; Bejder, L.; Lin, M.; Zhang, P.; Dong, L.; Li, S. Determining spatial use of the world’s second largest humpback dolphin population: implications for place-based conservation and management. Aquatic Conserv: Mar Freshw Ecosyst 2020, 30, 364–374. [Google Scholar] [CrossRef]
  23. Pleslić, G.; Rako-Gospić, N.; Miočić-Stošić, J.; Blazinić Vučur, T.; Radulović, M.; Mackelworth, P.; Frleta-Valić, M.; Holcer, D. Social structure and spatial distribution of bottlenose dolphins (Tursiops truncatus) along the Croatian Adriatic coast. Aquatic Conserv: Mar Freshw Ecosyst 2019, 29, 2116–2132. [Google Scholar] [CrossRef]
  24. Milmann, L.C.; Danilewicz, D.; Baumgarten, J.; Ott, P.H. Temporal-spatial distribution of an island-based offshore population of common bottlenose dolphins (Tursiops truncatus) in the equatorial Atlantic. Mar. Mamm. Sci. 2016, 33, 496–519. [Google Scholar] [CrossRef]
  25. Ofstad, E.G.; Herfindal, I.; Solberg, E.J; Sæther, B.E. Home ranges, habitat and body mass: simple correlates of home range size in ungulates. Proc. R. Soc. B. 2016, 283, 20161234. [Google Scholar] [CrossRef]
  26. Viddi, F.A.; Lescrauwaet, A.K. Insights on habitat selection and behavioural patterns of peale’s dolphins (Lagenorhynchus australis) in the strait of Magellan, Southern Chile. Aqut. Mamm. 2005, 31, 176–183. [Google Scholar] [CrossRef]
  27. Bauer, R.K.; Fromentin, J.M.; Demarcq, H.; Brisset, B.; Bonhommeau, S. Co-occurrence and habitat use of fin whales, striped dolphins and Atlantic Bluefin tuna in the northwestern Mediterranean Sea. PLos ONE. 2015, 10, e0139218. [Google Scholar] [CrossRef]
  28. Carome, W.; Slooten, E.; Rayment, W.; Webster, T.; Wickman, L.; Brough, T.; Dawson, S.M. A long-term shift in the summer distribution of Hector’s dolphins is correlated with an increase in cruise ship tourism. Aquatic Conserv: Mar Freshw Ecosyst, 1660; 32. [Google Scholar] [CrossRef]
  29. Leung, E.; Chilvers, B.L.; Nakagawa, S.; Moore, A.B.; Robertson, B.C. Sexual segregation in juvenile New Zealand sea lion foraging ranges: implications for intraspecific competition, population dynamics and conservation. PLos ONE. 2012, 7, e45389. [Google Scholar] [CrossRef] [PubMed]
  30. Balmer, B.; Watwood, S.; Quigley, B.; Speakman, T.; Barry, K.; Mullin, K.; Rosel, P.; Sinclar, C.; Zolman, E.; Schwacke, L. Common bottlenose dolphin (Tursiops truncatus) abundance and distribution patterns in St Andrew Bay, Florida, USA. Aquatic Conserv: Mar Freshw Ecosyst 2019, 29, 486–498. [Google Scholar] [CrossRef]
  31. Calenge, C. The package “adehabitat” for the R software: a tool for the analysis of space and habitat use by animals. Ecol. Modell. 2006, 197, 516–519. [Google Scholar] [CrossRef]
  32. Nekolny, S.R.; Denny, M.; Biedenbach, G.; Howells, E.M.; Mazzoil, M.; Durden, W.N.; Moreland, L.; Lambert, J.D.; Gibson, Q.A. Effects of study area size on home range estimates of common bottlenose dolphins Tursiops truncatus. Curr. Zool. 2017, 63, 693–701. [Google Scholar] [CrossRef]
  33. Lee, S.J.; Lee, W.S. Animal home range estimators. Korean J. Environ. Ecol. 2022, 36, 202–216. [Google Scholar] [CrossRef]
  34. Yoo, S.; Park, J. Why is the southwest the most productive region of the East Sea/Sea of Japan? J. Mar. syst. 2009, 78, 301–315. [Google Scholar] [CrossRef]
  35. Lee, D.; An, Y.R.; Park, K.J.; Kim, H.W.; Lee, D.; Joo, H.T.; Oh, Y.G.; Kim, S.M.; Kang, C.K.; Lee, S.H. Spatial distribution of common minke whale (Balaenoptera acutorostrata) as an indication of a biological hotspot in the East Sea. Deep-Sea Research Part II 2017, 143, 91–99. [Google Scholar] [CrossRef]
  36. Kemper, C.M.; Middleton, J.F.; van Ruth, P.D. Association between pygmy right whales (Caperea marginata) and areas of high marine productivity off Australia and New Zeland. New Zealand J. Zoo, 40. [CrossRef]
  37. La Manna, G.; Ronchetti, R.; Sarà, G. Predicting common bottlenose dolphin habitat preference to dynamically adapt management measures from a marine spatial planning perspective. Ocean Coast. Manag. 2016, 130, 317–327. [Google Scholar] [CrossRef]
  38. Leaper, R.; Calderan S. Review of methods used to reduce risks of cetacean bycatch and, entanglement; Leslie, A. , Henry, L., Ed.; CMS Tech. Ser., 38, UNEP/CMS Secretariat, Bonn, Germany, 2018; pp 1-67.
  39. Hamilton, S.; Baker, G.B. 2019. Technical mitigation to reduce marine mammal bycatch and entanglement in commercial fishing gear: lessons learnt and future directions. Rev. Fish. Biol. Fish 2019, 29, 223–247. [Google Scholar] [CrossRef]
  40. Lee, G.H. , Song, D.H., Kim, H.Y. Characteristics of catch losses in stow nets with finless porpoise excluder devices and a strategy to reduce them. Reg. Stud. Mar. Sci. 2022, 50, 102147. [Google Scholar] [CrossRef]
  41. Mangel, J.; Alfaro-Shigueto, J.; Witt, M.J.; Hodgson, D.J.; Godley, B.J. Using pingers to reduce bycatch of small cetaceans in Peru’s small-scale driftnet fishery. Oryx 2013, 47, 595–606. [Google Scholar] [CrossRef]
  42. MacLeod, C.D.; Weir, C.R.; Pierpoint, C.; Harland, E.J. The habitat preferences of marine mammals west of Scotland (UK). J. Mar. Biol. Ass. U.K 2007, 87, 157–164. [Google Scholar] [CrossRef]
  43. Kang, J.H.; Pang, I.C.; Chang, K.I. Seasonal variations of SST in the Yellow Sea and the East China Sea. Bull. Mar. Res. Inst. Cheju Nat. Univ. 1999, 23, 1–8. [Google Scholar]
  44. Kim, S.W.; Im, J.W.; Yoon, B.S.; Jeong, H.D.; Jang, S.H. Long-Term Variations of the Sea Surface Temperature in the East Coast of Korea. J. Korean. Soc. Mar. Environ. Saf. 2014, 20, 601–608. [Google Scholar] [CrossRef]
  45. Hong, S.K. Tidal-flat islands in Korea: exploring biocultural diversity. J. Mar. Isl. Cult. 2012, 1, 11–20. [Google Scholar] [CrossRef]
  46. Seo, H.S.; Kim, D.S. Effect of El Niño and La Niña on the coastal upwelling in East Sea, South Korea. J. Korean Soc. Mar. Environ. Saf. 2020, 26, 075–083. [Google Scholar] [CrossRef]
  47. Ahn, S.; Kim, H.W.; Kim, S.; Lee, Y.R.; Park, K.J.; Kim, D.N.; An, D.H. Diet of long-beaked common dolphin (Delphinus capensis) in the East Sea, Korea. Anim. Cells. and Syst. 2014, 18, 340–350. [Google Scholar] [CrossRef]
  48. Jo, M.J.; Kim, J.J.; Yang, J.H.; Kim, C.S.; Kang, S.K. Changes in the ecological characteristics of Todarodes pacificus associated with long-term catch variations in jigging fishery. Korean J. Fish. Aquat. Sci. 2019, 52, 685–695. [Google Scholar] [CrossRef]
  49. Yoo, J.T.; Kim, J.J. Fishing characteristics of Pacific herring Clupea pallasii and relationship between its catch and sea temperature during the past 50 years in Korean waters. Korean J. Fish. Aquat. Sci. 2021, 54, 208–217. [Google Scholar] [CrossRef]
  50. Hayashi, S. Distribution of the firefly squid, Watasenia scintillans (BERRY), in the Toyama Bay, the Sea of Japan. Jamstectr deepsea res. 1988, 37–40. [Google Scholar]
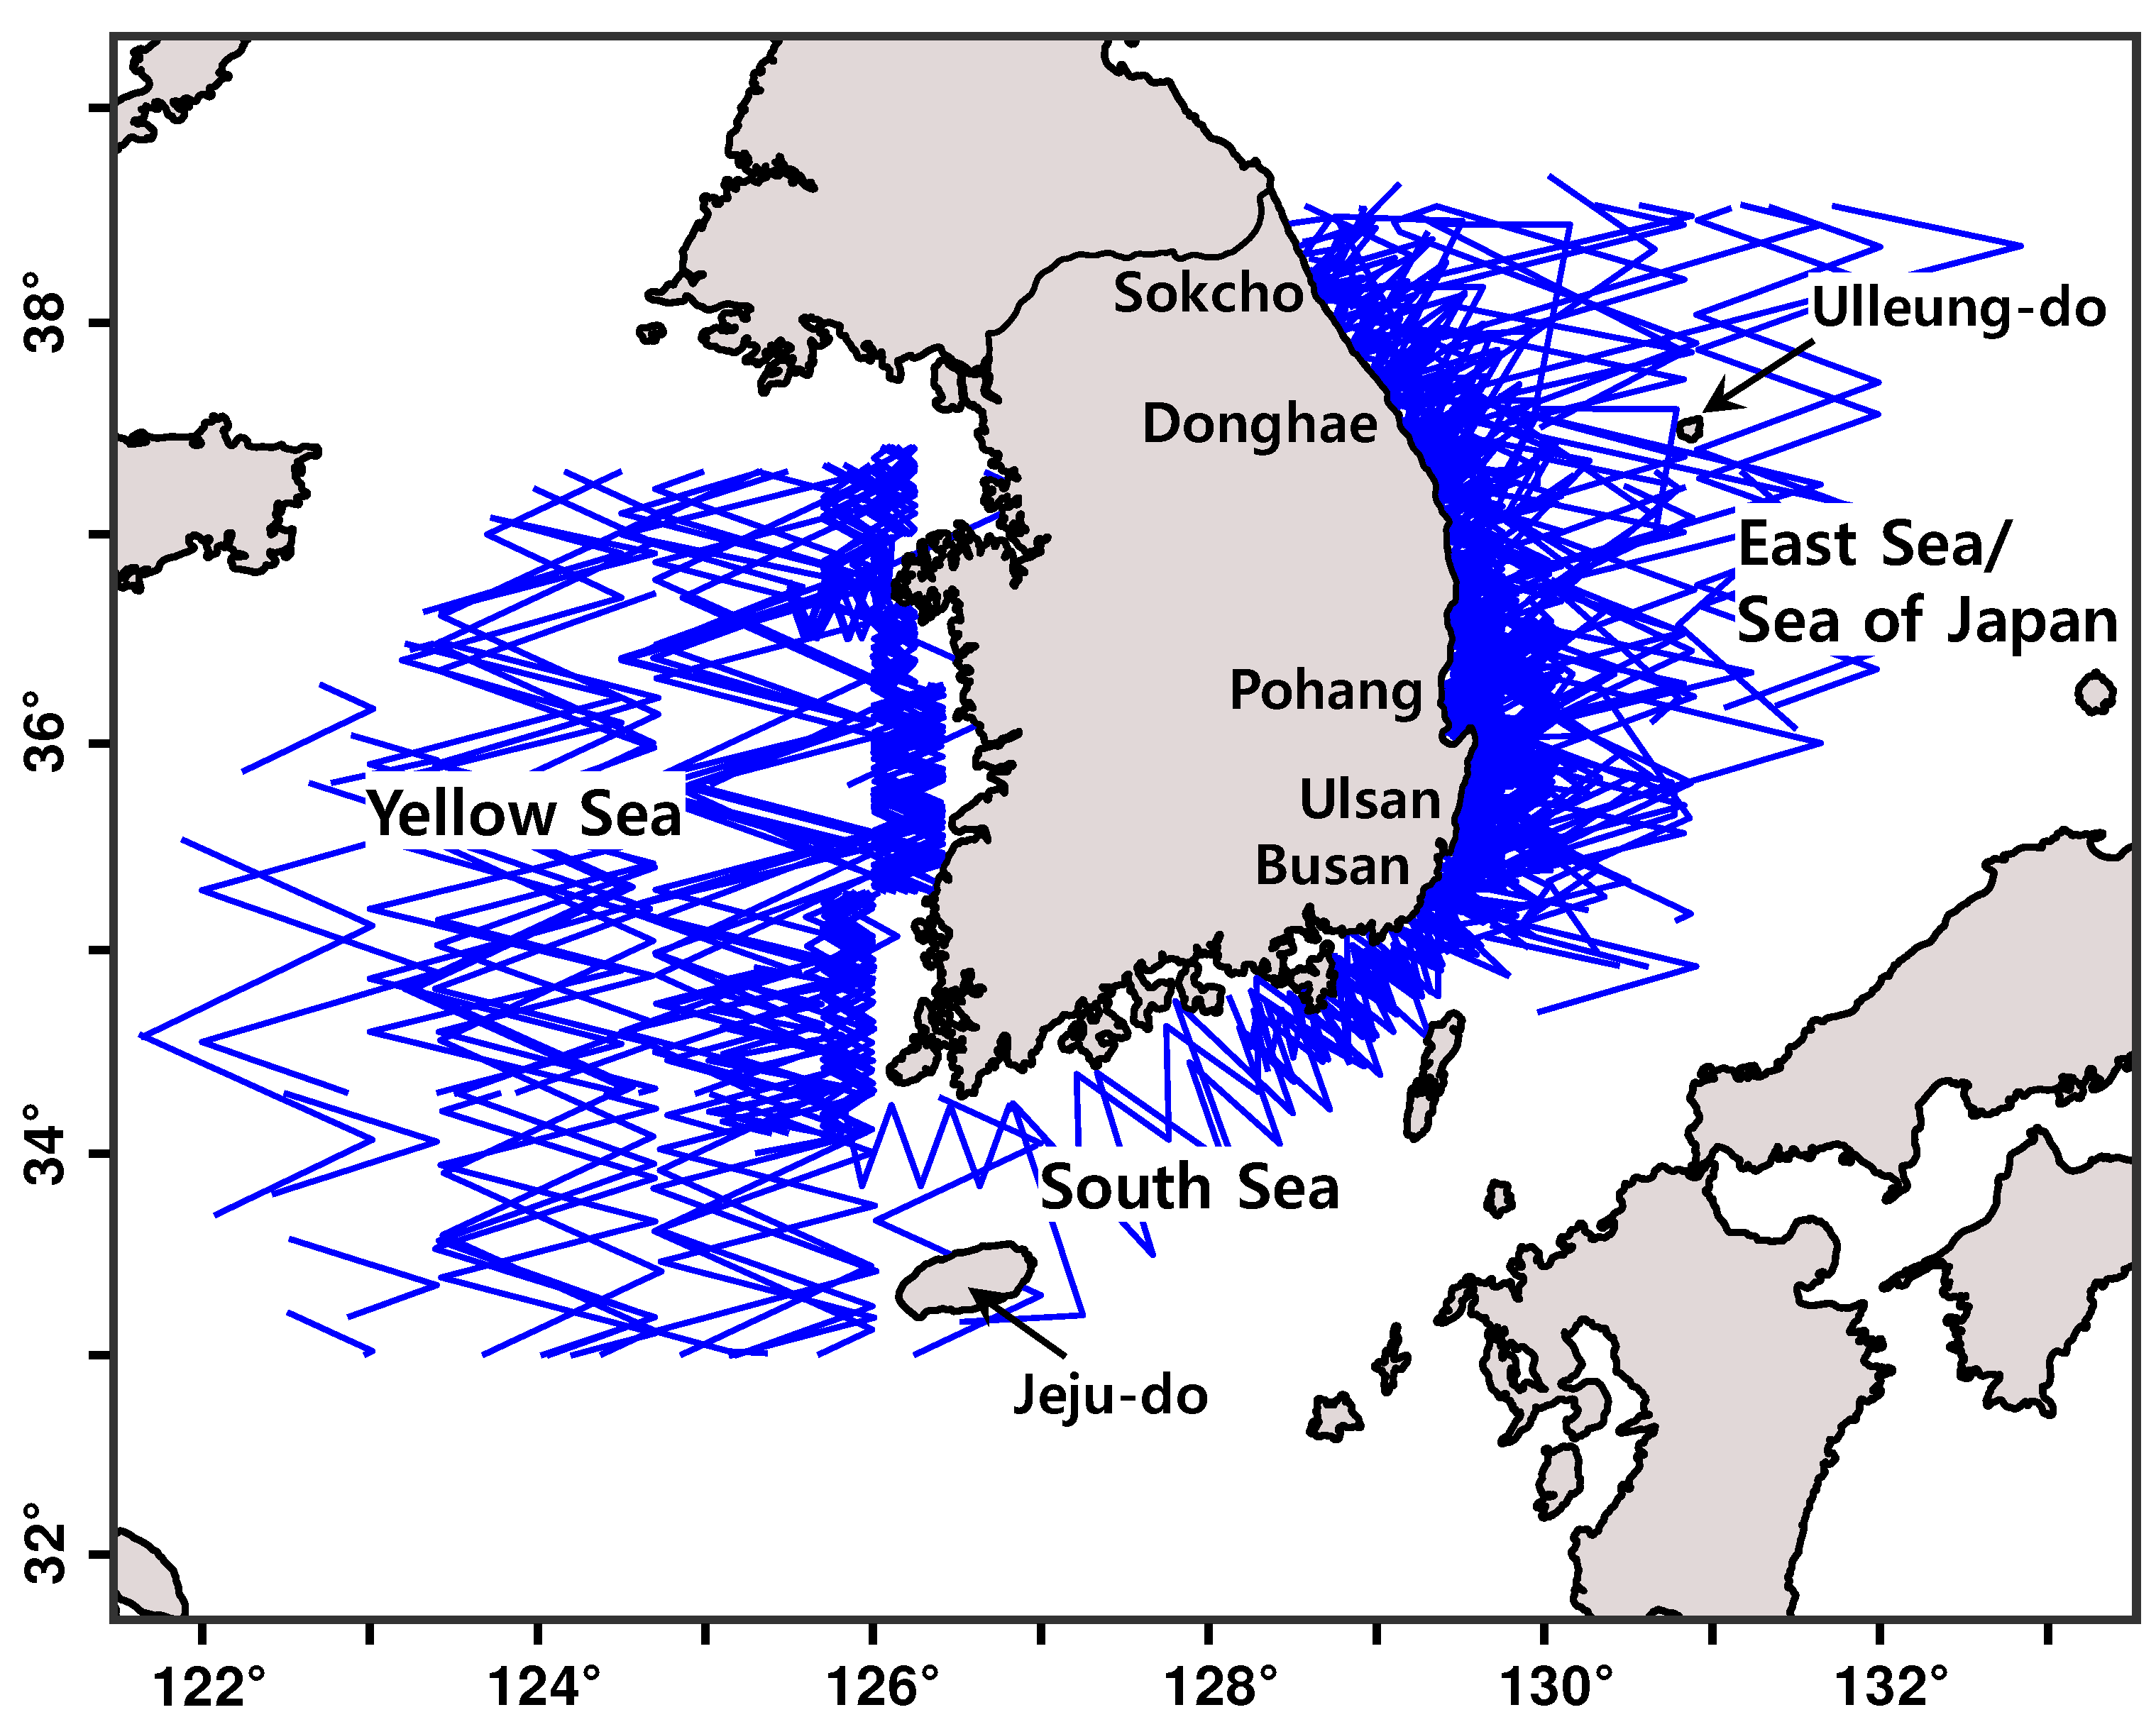
Figure 1. Zigzag transect lines in vessel-based line-transect surveys conducted in Korean waters from 2000 to 2020.
Preprints 78161 g001
Figure 2. Polygon areas (yellow) enclosed by outmost locations for 100% (left) and 95% (right) MCPs. Circles and triangles indicate the locations of common dolphins sighted and bycaught, respectively, in Korean waters.
Preprints 78161 g002
Figure 3. Comparisons of distances between observed (solid line) and expected (dotted line). distributions for K–S test using the location data (longitude and latitude) of common dolphins sighted in Korean waters.
Preprints 78161 g003
Figure 4. Density contours for 50% (red line) and 95% (blue line) kernel.
Preprints 78161 g004
Table 1. Summary of sighting surveys conducted in Korean waters (survey times/days/distances in nm) from 2000 to 2020.
Year Yellow Sea East Sea South Sea Total
2000 2/26/1494 2/26/1494
2001 2/19/1428 2/19/1428
2002 1/8/813 1/15/1169 2/23/1983
2003 2/22/1660 2/22/1660
2004 1/16/1787 3/7/262 4/23/2049
2005 5/26/1885 5/26/1885
2006 5/22/1587 5/22/1587
2007 1/4/258 4/33/1955 5/37/2213
2008 3/27/1912 4/17/565 7/44/2477
2009 3/28/1588 2/13/625 5/41/2213
2010 1/5/279 3/28/1481 1/10/383 5/43/2144
2011 2/19/1465 2/15/703 2/12/534 6/46/2703
2012 4/30/1909 4/30/1909
2013 1/11/1124 3/19/796 1/4/380 5/34/2300
2014 4/34/2740 4/34/2740
2015 4/26/1575 4/26/1575
2016 2/12/617 1/8/691 3/20/1308
2017 1/13/1052 3/18/1108 4/31/2160
2018 4/22/1486 4/22/1486
2019 3/21/1223 3/21/1223
2020 2/15/969 2/15/969
2021 4/26/1922 4/26/1922
2022 2/7/270 3/31/2270 5/38/2541
Total 32/252/18,741 56/392/23,927 4/26/1,297 92/669/43,969
Disclaimer/Publisher’s Note: The statements, opinions and data contained in all publications are solely those of the individual author(s) and contributor(s) and not of MDPI and/or the editor(s). MDPI and/or the editor(s) disclaim responsibility for any injury to people or property resulting from any ideas, methods, instructions or products referred to in the content.
Copyright: This open access article is published under a Creative Commons CC BY 4.0 license, which permit the free download, distribution, and reuse, provided that the author and preprint are cited in any reuse.
Prerpints.org logo

Preprints.org is a free preprint server supported by MDPI in Basel, Switzerland.

Subscribe

© 2024 MDPI (Basel, Switzerland) unless otherwise stated