Preprint
Article

A Longitudinal Analysis of Cyber Adversarial Tactics and Techniques

Altmetrics

Downloads

206

Views

182

Comments

0

A peer-reviewed article of this preprint also exists.

This version is not peer-reviewed

Submitted:

30 June 2023

Posted:

30 June 2023

You are already at the latest version

Alerts
Abstract
In the face of escalating cybercriminal sophistication, an innovative approach to network anomaly detection has been pursued in this longitudinal study, integrating computational data analytics in a geographic, organizational, and behavioral context. A data-driven scoring mechanism was employed to systematically analyze and correlate source countries of IP addresses and organization-associated Autonomous System (AS) Numbers (ASN) with network anomalies. Significant correlations between certain countries, specific organizations, and high behavior scores were identified through the data analytics. An increase in connection requests was also found to be linked with elevated behavior scores. Validated by cross-validation techniques, these findings emphasize the necessity for continuous model recalibration. The transformative role of integrative data analytics in cybersecurity is underscored, paving the way for the development of more sophisticated, context-aware anomaly detection systems. Specifically, the analysis underscores the need for organizations to adopt a proactive and adaptive approach to cybersecurity that can keep pace with the evolving threat landscape.
Keywords: 
Subject: Computer Science and Mathematics  -   Information Systems

1. Introduction

1.1. Introduction

The complexity of the cybersecurity landscape is intensified by the increasing digital interconnectivity, which underlines the relevance and urgency of delving into the study of cyber threats [1,2]. The evolution of technology, viewed as a double-edged sword, provides advancements and new venues for malign exploits [3,4,5]. This paper focuses on examining emerging trends in cyber-attacks over a specified duration, with particular attention on the growing sophistication and target specificity of such incursions. An emphasis is also placed on the categories of attacks that have experienced a substantial increase [6,7].
The typology of these cyber-attacks is extensive, encompassing intrusion attempts, Distributed Denial-of-Service (DDoS) attacks, Advanced Persistent Threats (APTs), and attacks exploiting routing information asymmetry [5,7]. Complications are further intensified by the advent of Internet of Things (IoT) networks, a progressively complex and expanding terrain that introduces new potentialities for breaches [8,9].
Numerous methods have been proposed to mitigate these threats, including real-time machine learning-based Intrusion Detection Systems (IDS) [8,10,11], host-based intrusion detection techniques [12], and honeypots [13]. The effectiveness of these measures is largely dependent on a detailed understanding of the evolution of cyber-attacks over time [11,12,14].
Analyzing cyber threat trends and patterns necessitates understanding deception networks, honeypots, and decoy systems, including their capabilities to gather intelligence and deter attacks [13,15]. Open-Source Intelligence (OSINT) is regarded as instrumental in recognizing and forecasting cyber threats [3]. The significance of OSINT in identifying patterns and trends in cyber-attacks is considerable, extending its value to cybersecurity strategy and threat intelligence [3,16].
A comprehensive approach to cybersecurity calls for an understanding from various stakeholder perspectives, including defenders, attackers, and bystanders [17]. This multifaceted approach promotes a holistic analysis of the cyber threat landscape, thereby aiding in developing sturdy defensive strategies [15,17].
Effectiveness in monitoring network traffic and identifying possible threats has been demonstrated by applying deception networks, honeypots, and decoy systems, marking them as pivotal instruments for intelligence gathering and cyber-attack prevention [13,15]. Their potential to gather intelligence against targeted systems and networks for defense underscores their vital role in cybersecurity [13,15].
The intricate nature of cyber threats necessitates pioneering methodologies, incorporating artificial intelligence (AI) and machine learning (ML) for threat identification [10,11,18]. Cyber deception methods have exhibited significant potential in addressing the imbalance between attackers and defenders [15].
To conclude, continuous research and understanding are demanded by the ever-evolving landscape of cyber threats. This study aspires to provide substantial insights into analytical understanding of cybersecurity data by closely examining changing cyber-attack patterns and trends. It is anticipated that this exploration will enrich the existing literature in the field [2,6,13], enhancing comprehension of dynamic cyber-attack strategies and providing valuable insights to aid in the development of adaptable cybersecurity measures.

1.2. Objective and Scope

The primary objective of this research article is to perform an analytical study of cybercriminal tactics and strategies, leveraging a data-driven scoring mechanism over a six-year deception network dataset [4,8,15]. This research underscores trends, patterns, and evolution in cyber-attack methods through an integrative approach of geographic, organizational, and behavioral aspects of network anomalies [1,2,3]. The findings, confirmed through cross-validation techniques, shed light on the continuous evolution of cybercriminal tactics and the necessity for constant recalibration of detection models [11,21].
Regarding the scope, the research scrutinizes cybercriminal activities within the dataset, ranging from intrusion attempts to Advanced Persistent Threats (APTs) [5,7]. It accentuates the significance of IP address source countries and organizations linked to Autonomous System Numbers (ASNs) in detecting network anomalies [3,4].
This research aims to offer insights that can shape the development of robust, context-aware cybersecurity strategies and enrich existing literature on analytical cybersecurity [6,16,17]. By enhancing the understanding of cybercriminal strategies, this study can provide critical insights into the formulation of resilient and adaptable cybersecurity measures [22,24].

1.3. Research Question and Hypothesis

In alignment with the objective and scope of this research, the central question posed for discovery is:
RQ1: What are the key trends and patterns in cyber-attacks over the analyzed period, and how have these tactics and techniques evolved in sophistication and target specificity over time?
This question aims to examine the evolving landscape of cyber threats, focusing on their progression in sophistication and targeting precision. This exploration is expected to explain the trajectories of these cyber-attacks, informing future cybersecurity strategies [6,15,17].
Derived from the research question, the following hypothesis is proposed for examination in this study:
H1. Cyber-attacks are becoming increasingly sophisticated and targeted over time, with certain types of attacks showing a marked increase.
This hypothesis is grounded in a body of studies that reveal the evolution of cyber threats [3,7,8], underscoring the continuous need for upgraded cybersecurity measures. The assumption is that the tactics and techniques of cybercriminals have become more advanced, particularly regarding their capacity to infiltrate targeted systems and networks [13,15]. To validate this hypothesis, the six-year dataset from a deception network will be analyzed, tracking the evolution of cyber-attacks, their increasing complexity, and the changing tactics of cybercriminals.
Should the findings confirm this hypothesis, they would underscore the importance of continuous advancements and adaptability in cybersecurity measures and, more specifically, the value of deception networks, decoy systems, and honeypots in gathering intelligence against targeted systems and networks for defense [13,15].

1.4. Significance of the Research

The significance of this research is threefold. First, by providing a comprehensive longitudinal and analytical analysis of cybercriminal tactics and techniques over six years, this study is expected to contribute valuable insights to the existing body of literature on cybersecurity and behavioral analysis [6,16,17]. With the continual evolution of cyber threats, ongoing research in this area is vital to keep pace with the changes and ensure that defense strategies remain current and effective. This study's focus on revealing key trends, patterns, and changes in cyber-attack design is intended to fill a recognized gap in the existing literature [3,8,14,15].
Second, this research has practical significance. The insights gained from analyzing a six-year dataset from a deception network are anticipated to guide the development of adaptive and proactive cybersecurity strategies. In an era where digital interconnectivity is rising, and innovative attack vectors are continuously introduced, particularly with the advent of Internet of Things (IoT) networks [8,9], the findings from this study could inform security protocols in a wide range of organizations, enhancing their capacity to identify, respond to, and prevent cyber threats preemptively.
Finally, the emphasis on the effectiveness of deception networks, decoy systems, and honeypots to gather intelligence for defense against targeted systems and networks [13,15] further highlights the importance of this research. Given the anticipated findings, this study could potentially stimulate more widespread and effective use of these tools, contributing to the collective cybersecurity defense strategies at an organizational, national, and international level.
Therefore, through its theoretical contributions and practical implications, this study carries significant value for academia and industry, promoting an understanding of cyber threats and advancing strategies to combat them effectively.

2. Materials and Methods

2.1. Methodology

The study's methodological approach was premised on addressing RQ1, which aimed to discover critical trends and patterns in cyber-attacks over six years and explore the evolving sophistication and target specificity of these techniques. This inquiry was pursued with a keen emphasis on longitudinal analysis, contributing to an in-depth examination of cybercriminal tactics and strategies [16].
The research was guided by H1, which postulated an increasing sophistication and specificity of cyber-attacks, with certain types of attacks demonstrating a noticeable escalation. The investigative approach drew on an analytical process, with steps encompassing data preprocessing, exploratory data analysis, clustering and anomaly detection, temporal analysis, cross-referencing with known threat intelligence, visualization and reporting, and interpretation and implications [14]. This approach is expected to provide critical insights to bolster cybersecurity strategies in an increasingly interconnected digital landscape [8,9].

2.2. Data Collection

The data was collected from a six-year honeypot log, an expansive timeframe that afforded a wealth of records for examination. The dataset's vastness presented an opportunity to glean insights into cybercriminal tactics and techniques, providing an invaluable resource for the study [8].
The honeypot system used in this study was configured to imitate a variety of services and systems frequently targeted by cyber attackers (Figure 1). This approach ensured a broad scope of recorded attacks, encapsulating a variety of tactics and techniques employed by cybercriminals. The honeypot was operational over six years, from October 2016 to September 2022, continuously collecting data on attempted and unsuccessful intrusions.
This dataset was a product of a deception network, underscoring its value in the study's primary objective: conducting a thorough examination of tactics and strategies used by cybercriminals. The richness of the data collected laid a solid foundation for a longitudinal analysis that would uncover key trends, patterns, and evolution in cyber-attack methods [21], supporting both RQ1 and H1.
Using honeypot-derived data provides a unique perspective into cybercriminals' real-world tactics and techniques, offering critical insights into the evolution of cyber threats. Therefore, the study's data collection method forms a robust foundation for the investigation into the trends and patterns in cyber-attacks [8,12,13].
Data preprocessing was initiated by cleaning and preparing the honeypot log data. The modifications involved eliminating irrelevant or duplicate entries, managing missing values, and structuring the data into a format amenable to analysis. Extraction of crucial fields, such as timestamp, source IP address, destination port, and destination service, were also undertaken during this phase.
Additionally, data normalization was performed to ensure the data maintained a consistent scale, thereby improving the effectiveness of subsequent analysis. Normalization is significant for a dataset of this nature, where multiple variables and measurements are involved [19].
A significant part of the preprocessing involved feature extraction, where meaningful attributes were identified and extracted from the dataset to support the intended analysis. For example, the timestamp information was broken down to provide additional details such as the date, day of the week, and month the attack was initiated.
Data transformation was also an integral part of the preprocessing phase. This step ensured the data were in an appropriate format for analysis, transforming categorical data into numerical data where necessary and encoding specific data points to simplify the analysis.
Once preprocessing was completed, the refined dataset was ready for in-depth analysis. The evaluation involved the investigation of various patterns, trends, correlations, and behavioral analysis within the data using multiple analytical tools and techniques [10,18].
Attention was given to the potential computational demands imposed by the large honeypot log, a critical consideration given the size of the dataset. Consequently, significant computational resources and expertise were employed in this research phase, underscoring the study's commitment to rigorous and meticulous data management [1].

2.4. Validation

The study employed several validation techniques to ensure the accuracy and reliability of the results. After the exploratory data analysis, clustering algorithms and anomaly detection techniques were used to identify distinct groups or abnormal patterns within the data. These techniques helped uncover potential attack campaigns, recurring strategies, or behavior patterns of cyber criminals [20].
A temporal analysis sought changes in attack patterns, periodicity in attack frequencies, and correlations with external events or threat reports. The results were then cross-referenced with known threat intelligence sources (OSINT) [3,16] to verify similarities or matches with available indicators of compromise (IOCs) or attack campaigns [7].
The results of the data analysis were validated through the comparison with existing literature. The trends, patterns, and changes observed in the study were compared with findings from previous research [6,16],17]. This form of validation provides an external benchmark, enabling the comparison of the research findings with established knowledge in the field of cybersecurity.
Finally, the findings were visualized and interpreted in the context of the broader cybersecurity landscape, providing a comprehensive understanding of the implications for threat mitigation, defense strategies, or the development of proactive measures to counter evolving cyber threats [6].
By implementing rigorous validation procedures, the study seeks to produce reliable, valid findings that can contribute to the ongoing dialogue in the field of cybersecurity and aid in developing more robust, effective cybersecurity strategies [13,15].

3. Results

3.1. Introduction to Results

In cybersecurity, predicting and preventing cyber-attacks hinges on an in-depth understanding of adversarial Tactics, Techniques, and Procedures (TTPs). Cybersecurity has become a critical concern in our increasingly interconnected digital world. The increasing threat landscape requires a thorough understanding of attack patterns to devise effective defense mechanisms. Honeypot logs present a valuable resource in this endeavor. This study leverages a honeypot log spanning six years, encompassing daily counts of cyber-attacks from October 2016 to September 2022.
This section presents the results derived from the structured methodology applied to this dataset. This methodology included data preprocessing, exploratory data analysis, anomaly detection, temporal analysis, cross-referencing with known threat intelligence using OSINT, and visualization and reporting. Leveraging advanced machine learning techniques and data analysis strategies extracted many insights from the extensive data set [3,8,11,12,14,16,21].
These steps have resulted in significant findings, contributing to a comprehensive understanding of cyber-attack patterns and strategies. The results corroborate H1 and illuminate the key trends and patterns in cyber-attacks (RQ1), indicating increased sophistication and target specificity over time. The findings identify recurring techniques and highlight emerging trends and tactics cybercriminals employ [22,24].
The validation process affirmed the reliability and robustness of the presented findings, thereby enhancing the accuracy and credibility of the insights [18,23]. Furthermore, by cross-referencing the results with existing threat intelligence (OSINT), the study has evaluated the progression and relevance of the recorded cyber-attacks [3,16].
The aim of sharing these results is to make a substantial contribution to the cybersecurity community. Through these evidence-based insights, the study endeavors to guide the development of more effective defense strategies and proactive measures to counter advanced and targeted cyber threats. The results contribute to the broader dialogue on cybersecurity, emphasizing the crucial role of empirical data in enhancing cyber defense capabilities [1,6].
The results provide a comprehensive overview of the patterns, trends, and techniques prevalent in cybercriminal activities over six years. This includes emphasizing the evolution in sophistication and target specificity, supporting H1, and providing detailed answers to RQ1.

3.2. Data Collection and Preprocessing Results

The analysis was conducted on an extensive honeypot log file containing more than 100 million entries, recorded over six years from October 2016 to September 2022. This large volume of data provided a thorough view of cyber-attacks, enabling the study to gain critical insights into these attacks' intensity, distribution, and patterns.

3.2.1. Summary and Descriptive Analysis

Throughout the six years, the average number of cyber-attacks per day was 45,741. However, the variation around this mean was considerable, as shown by the standard deviation of 58,788.5 (Table 1). This high standard deviation indicates a high level of dispersion in daily cyber-attacks, with some days experiencing relatively fewer attacks and others having significantly more. Throughout the tracking period of 2,191 days, a total of 100,218,535 entries were documented in the honeypot system.
The highest number of cyber-attacks recorded in a single day reached 888,203. This max value, coupled with a significant standard deviation, indicates the presence of days with extreme cyber-attack counts, potentially corresponding to coordinated global cyber-attacks or specific cyber events. A day with zero attacks is rare, signifying the persistent nature of the threat landscape. Over the six years of log data, only 17 such instances were noted.
The distribution of daily cyber-attack counts shows significant skewness. The median number of attacks per day, 28,447, is substantially lower than the mean, suggesting a positively skewed distribution. That is, while most days experience a relatively moderate number of attacks, there are days with exceptionally high counts that push the average up.
Quartile ranges provide further insight into the distribution. The lower 25% of the data (the first quartile, Q1) shows that on a quarter of the days, the number of attacks was 16,037 or fewer. The upper 25% of the data (the third quartile, Q3) indicates that on 25% of the days, there were 58,430.5 attacks or more. The interquartile range (Q3 - Q1) stands at 42,393.5, showing a considerable spread in the middle 50% of the data.

3.2.2. Temporal Analysis

Temporal analysis of the cyber threat landscape from October 2016 to September 2022 revealed that the volume of attacks was not evenly distributed over the studied period. Figure 2 displays the importance of occurrences by month. Significant peaks of activity were observed in July 2017 and October 2019. These periods signify instances of heightened threat activity. Starting in late 2019, an increasing trend in attack volumes was observed. By 2021, monthly attacks often exceeded 2 million, with February and August recording exceptionally high attack counts of 3,252,302 and 3,491,482, respectively. Despite a slight decline towards the end of the year, the attacks rebounded in 2022, with May and June recording over 3 million attacks each.

3.2.3. Correlation Analysis

The relationship between an array of cybersecurity-associated parameters was scrutinized via a correlation analysis, using Pearson correlation coefficients to characterize the magnitude and directionality of these associations. This study involved 2,211 correlation calculations, comparing known threat intelligence sources to identify potential parallels or congruencies with established indicators of compromise (IOCs) or recognized attack campaigns [3,7,16].
From the analysis, it was discerned that 56 correlations were statistically meaningful, while 2,155 were found not to hold any significant association. The spectrum of correlation values spanned from approximately 0.31 to a perfect 1. A pair of files, specifically malicious-subnet-misp-bro.txt and malicious-subnet-misp-ip-dst.txt (Table 2), revealed a perfect positive correlation of 1, signifying either identical or impeccably mirrored datasets. In addition, several pairs of files displayed high degrees of correlation, with coefficients of 0.987332677, 0.845672856, 0.822205602, 0.784329101, and 0.783025671. The corresponding p-values for all the meaningful pairs were 0, thus signifying the high statistical significance of these observed correlations.

3.2.4. Geographic Analysis

The geographical analysis indicated a global distribution of cyber-attacks, originating from six continents and a total of 188 countries. North America recorded the highest number of entries, followed closely by Europe and Asia.
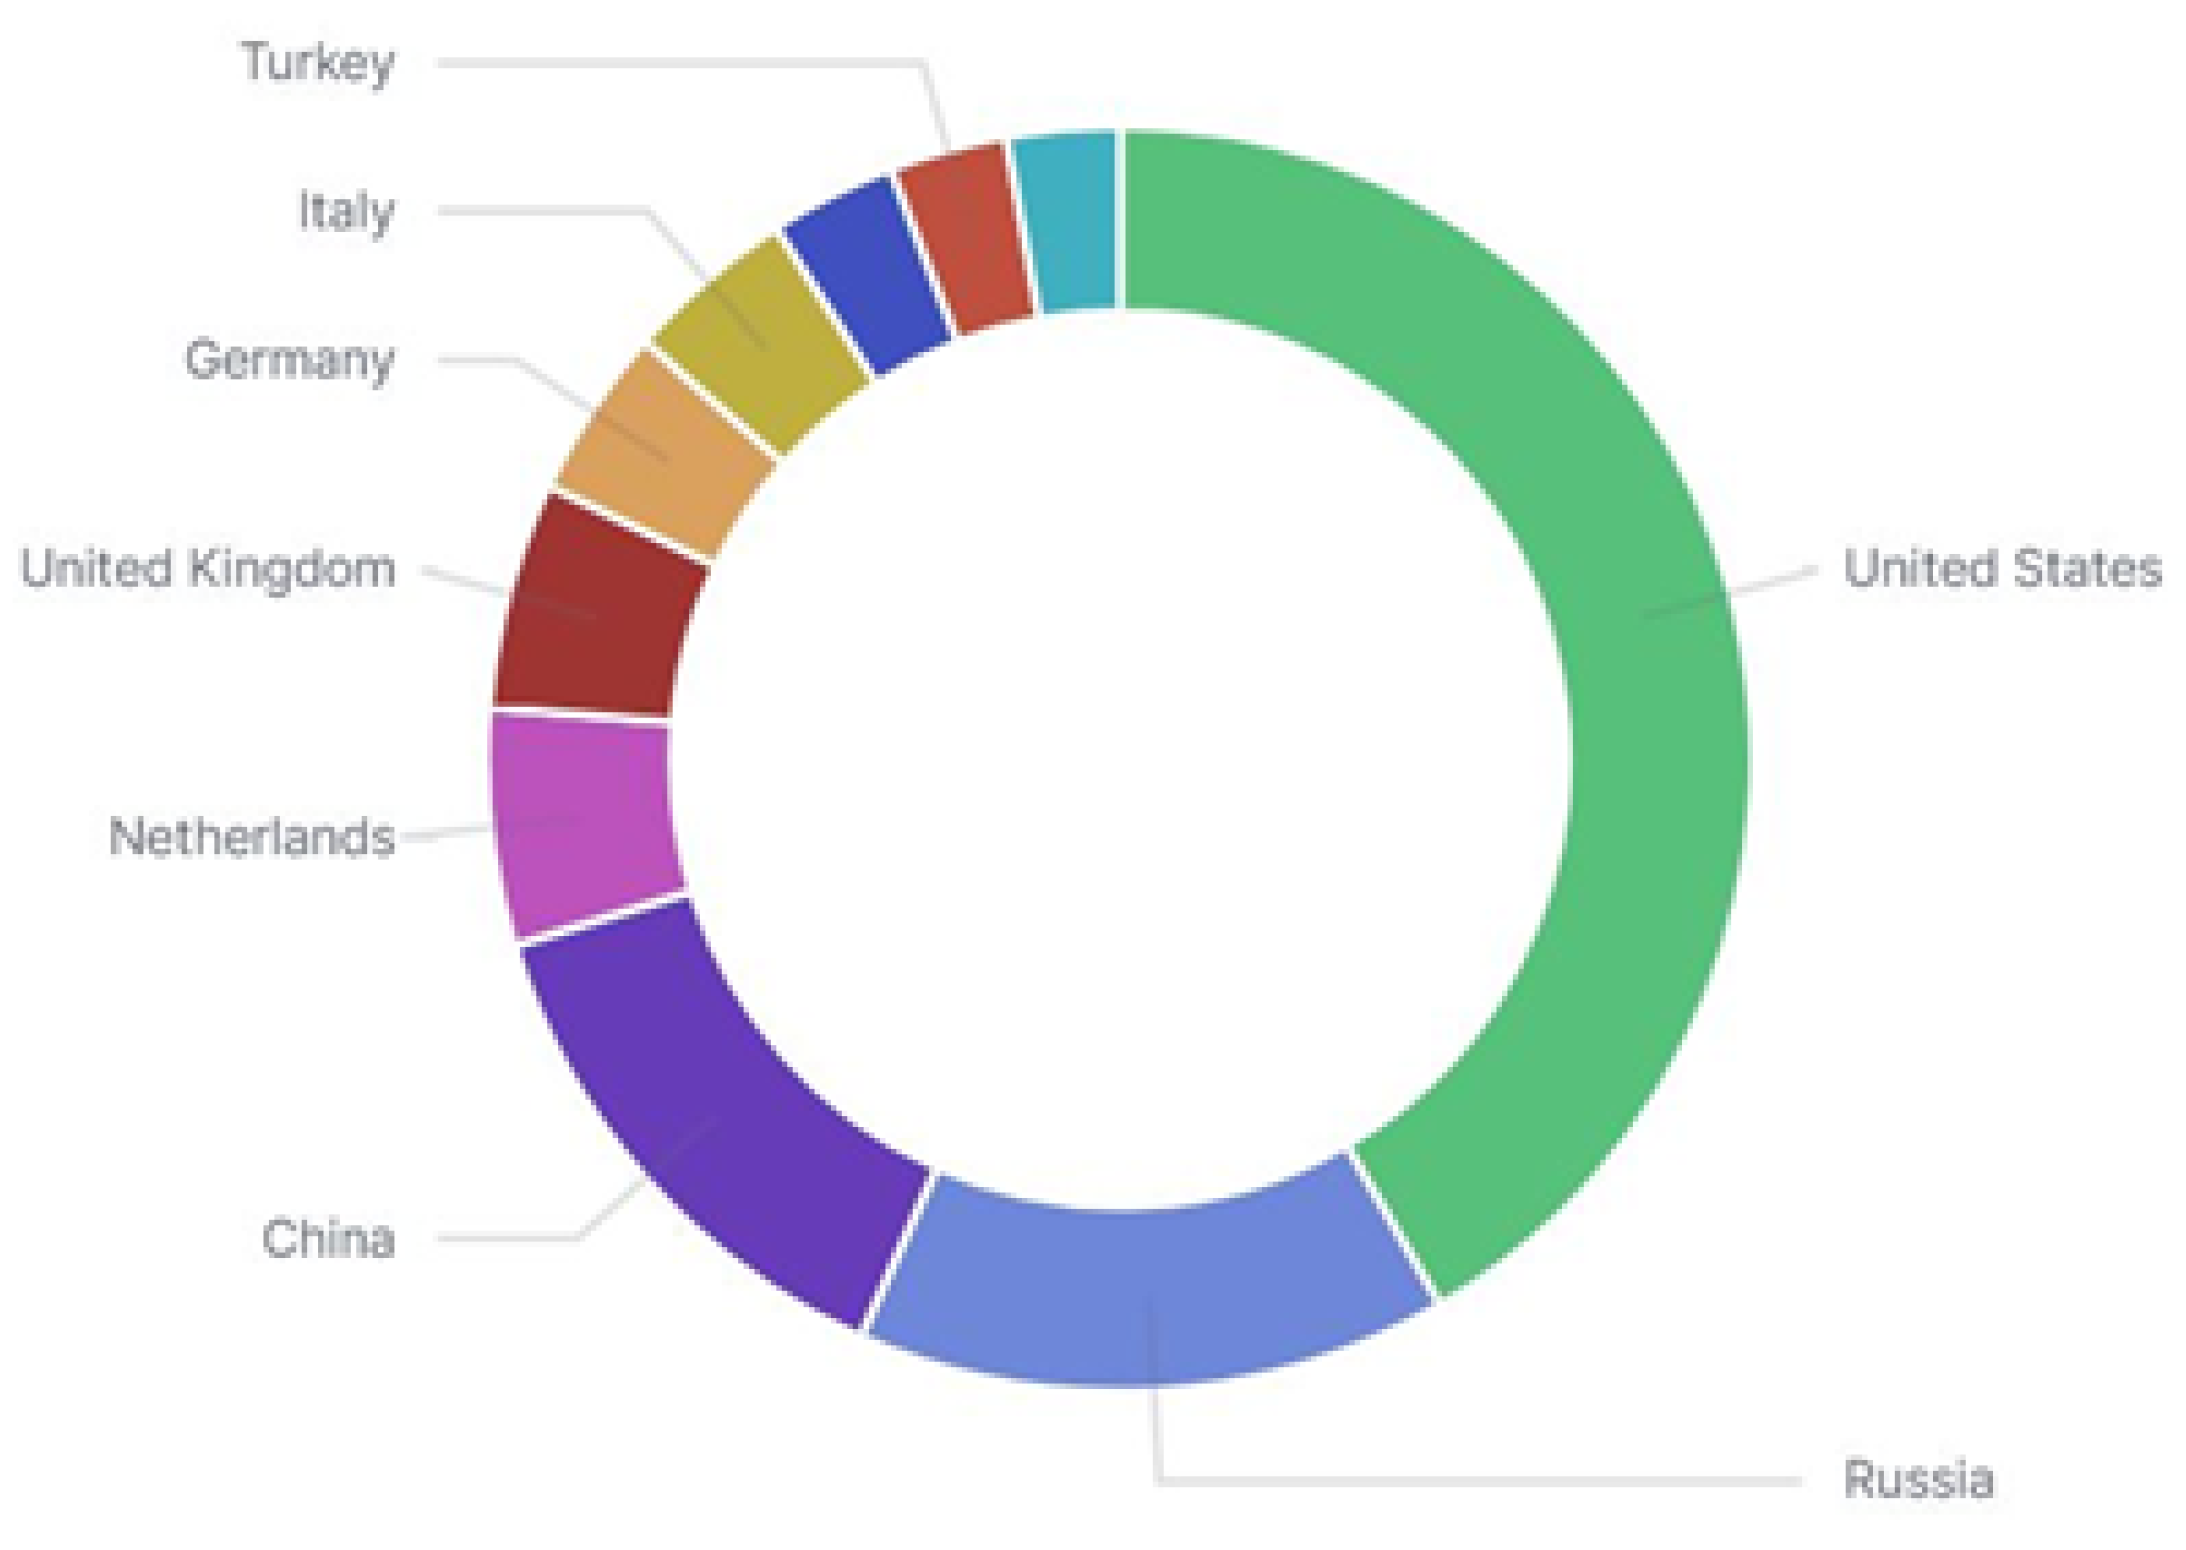
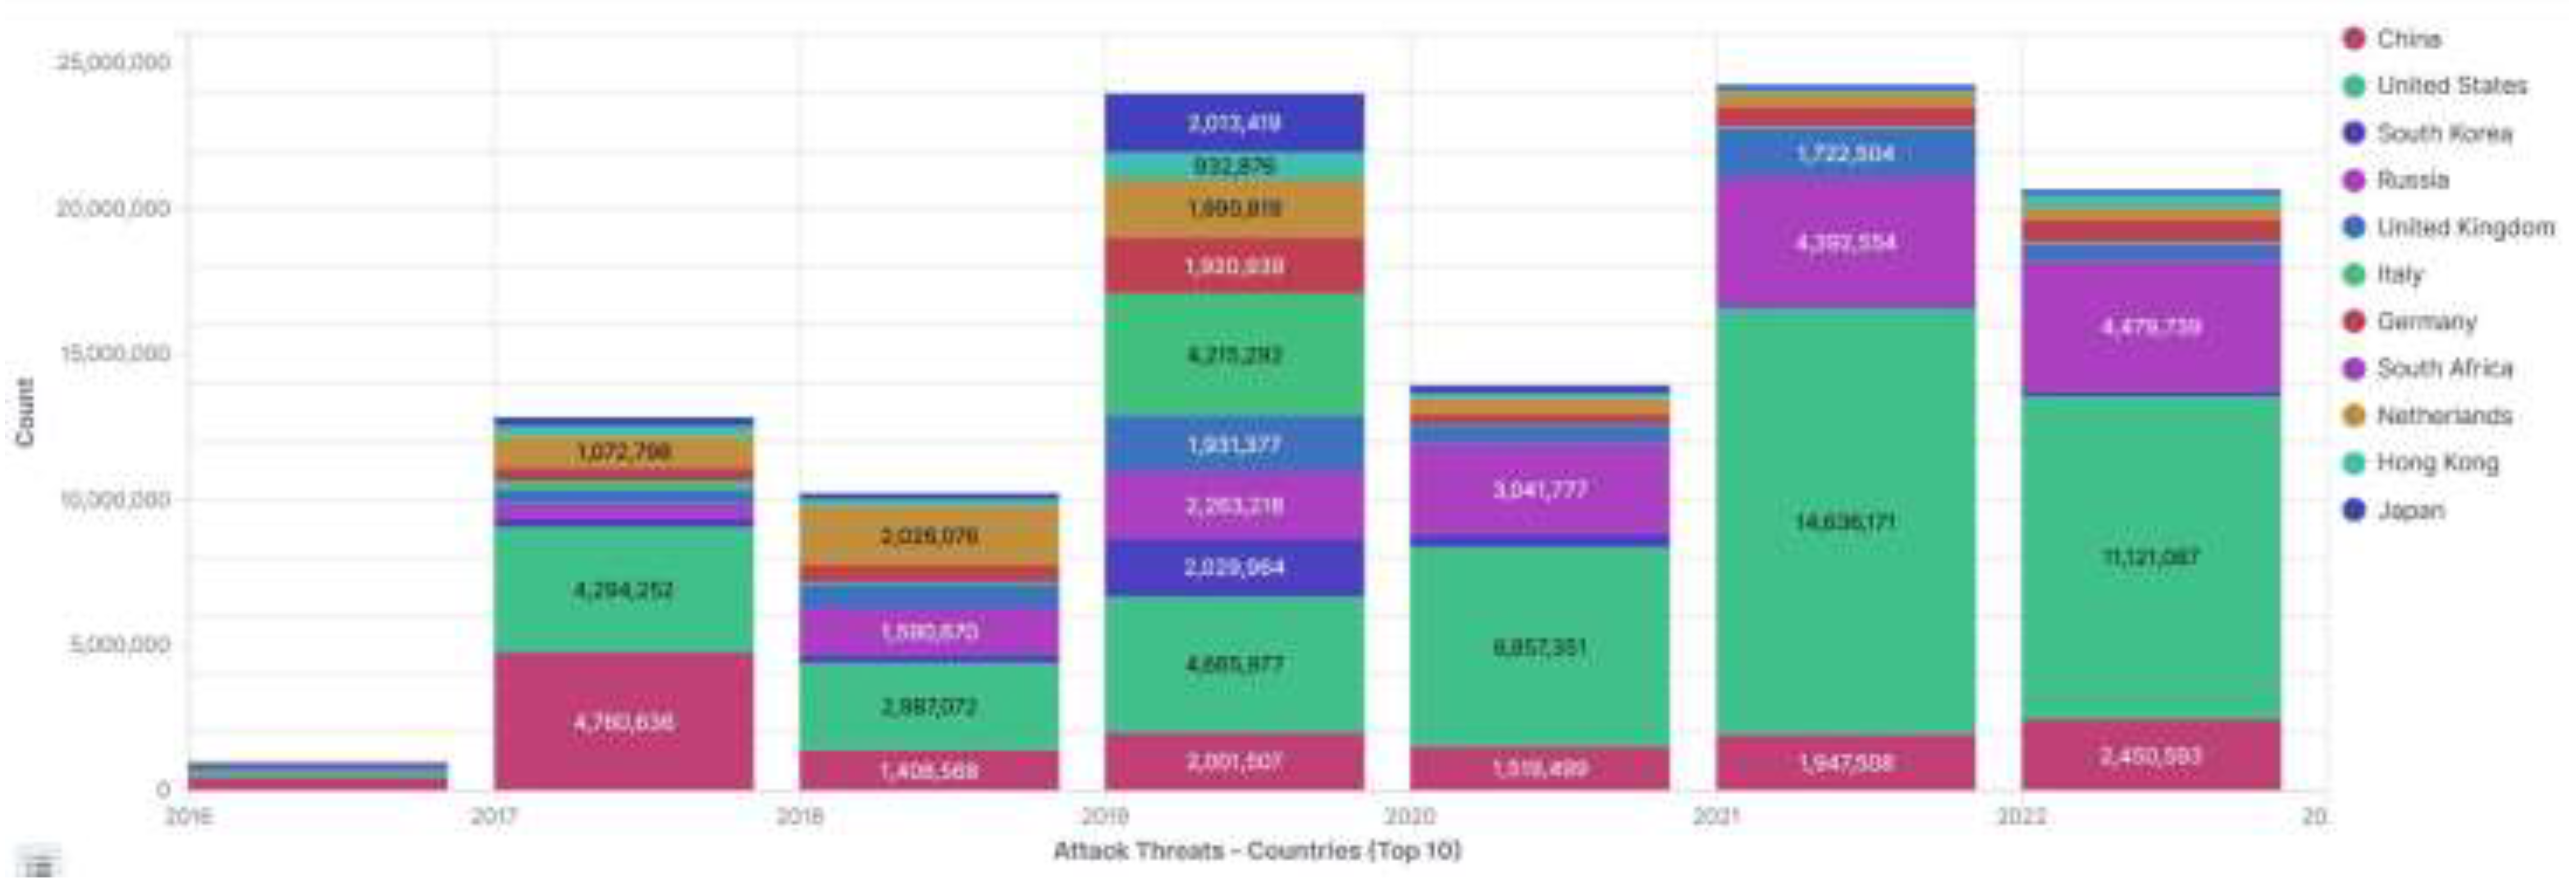
Examining specific countries, the United States emerged as the primary source, contributing approximately 47.6111% of the total entries. Russia, China, and the Netherlands were the next largest contributors, accounting for 12.525%, 8.188%, and 4.418% of the entries, respectively (Figure 3). Despite the broad distribution, none of the other countries exceeded 4% of the total entries individually (Figure 4).
A concentrated activity was noted within the top 20 countries, contributing to 98.7% of the total entries. Meanwhile, a continental analysis revealed that North America, Europe, and Asia contributed 45.017%, 35.370%, and 22.180% of entries, respectively, while South America, Africa, Oceania, and Antarctica collectively accounted for less than 3%.

3.2.5. Threat Intelligence Analysis

Threat analysis of a unique source IP address dataset comprising 1,316,585 malicious entries revealed an interesting distribution. Entries were categorized into zero (0) or non-zero (1). Whereas "0" represents a source IP address not listed in the threat intelligence databases or repositories, and "1" indicates the source IP address was identified within a repository. The repositories consisted of seventy-four different and separate threat intelligence feeds. Sixty-five repositories were found to have positive matching source IP addresses from the dataset ranging from 1 match in a repository to as many as 581,115.
The study found within the dataset that 699,543 (53.133%) unique source IP addresses aligned with the threat intelligence repositories, thus receiving a non-zero count or a "1". In contrast, 46.867% or 617,042 entries received a zero count or a "0". Despite the lack of identification in the threat intelligence data, these zero-count entries represent significant threats due to behavior consistent with recognized and identified malicious conduct within the dataset. The analysis classified the entries under various categories, signifying distinct types of malicious activity or sources. As an example (Table 3), the most prevalent variety was found in the repository malicious-subnet-uceprotect-dnsbl-3.txt, accounting for 44.138% or 581,115 entries. This was followed by unique malicious activity matching malicious-subnet-uceprotect-dnsbl-2.txt, representing 22.854% or 300,891 entries.

3.2.6. Source IP Address Analysis

The study analyzed the source IP addresses as a primary variable against threat intelligence data repositories. A total of 100,218,535 entries were collected over 2,191 days. The log data encompassed entries from 1,316,585 unique source IP addresses, with the IP address 23.139.224.114 associated with the highest number of entries at 2,217,585 (Table 4). Further, the analysis revealed that the entries related to the top 20 unique source IP addresses amounted to 10,835,108, constituting approximately 10.81% of the total entries. As previously discussed, the highest number of entries geographically originated from North America, closely followed by Europe and Asia, with the United States, Russia, and China identified as the primary contributing nations.

3.2.7. Destination Ports Analysis

The log file indicated a total of 65,535 unique destination IP ports targeted. The three most targeted ports were 5900 (VNC server), 8 (ICMP Echo Requests), and 22 (SSH), which contributed 15.883%, 10.223%, and 4.459% of total entries, respectively. These ports are associated with remote control services and diagnostic tools, suggesting attackers tend to target remote access points and network diagnostic tools.
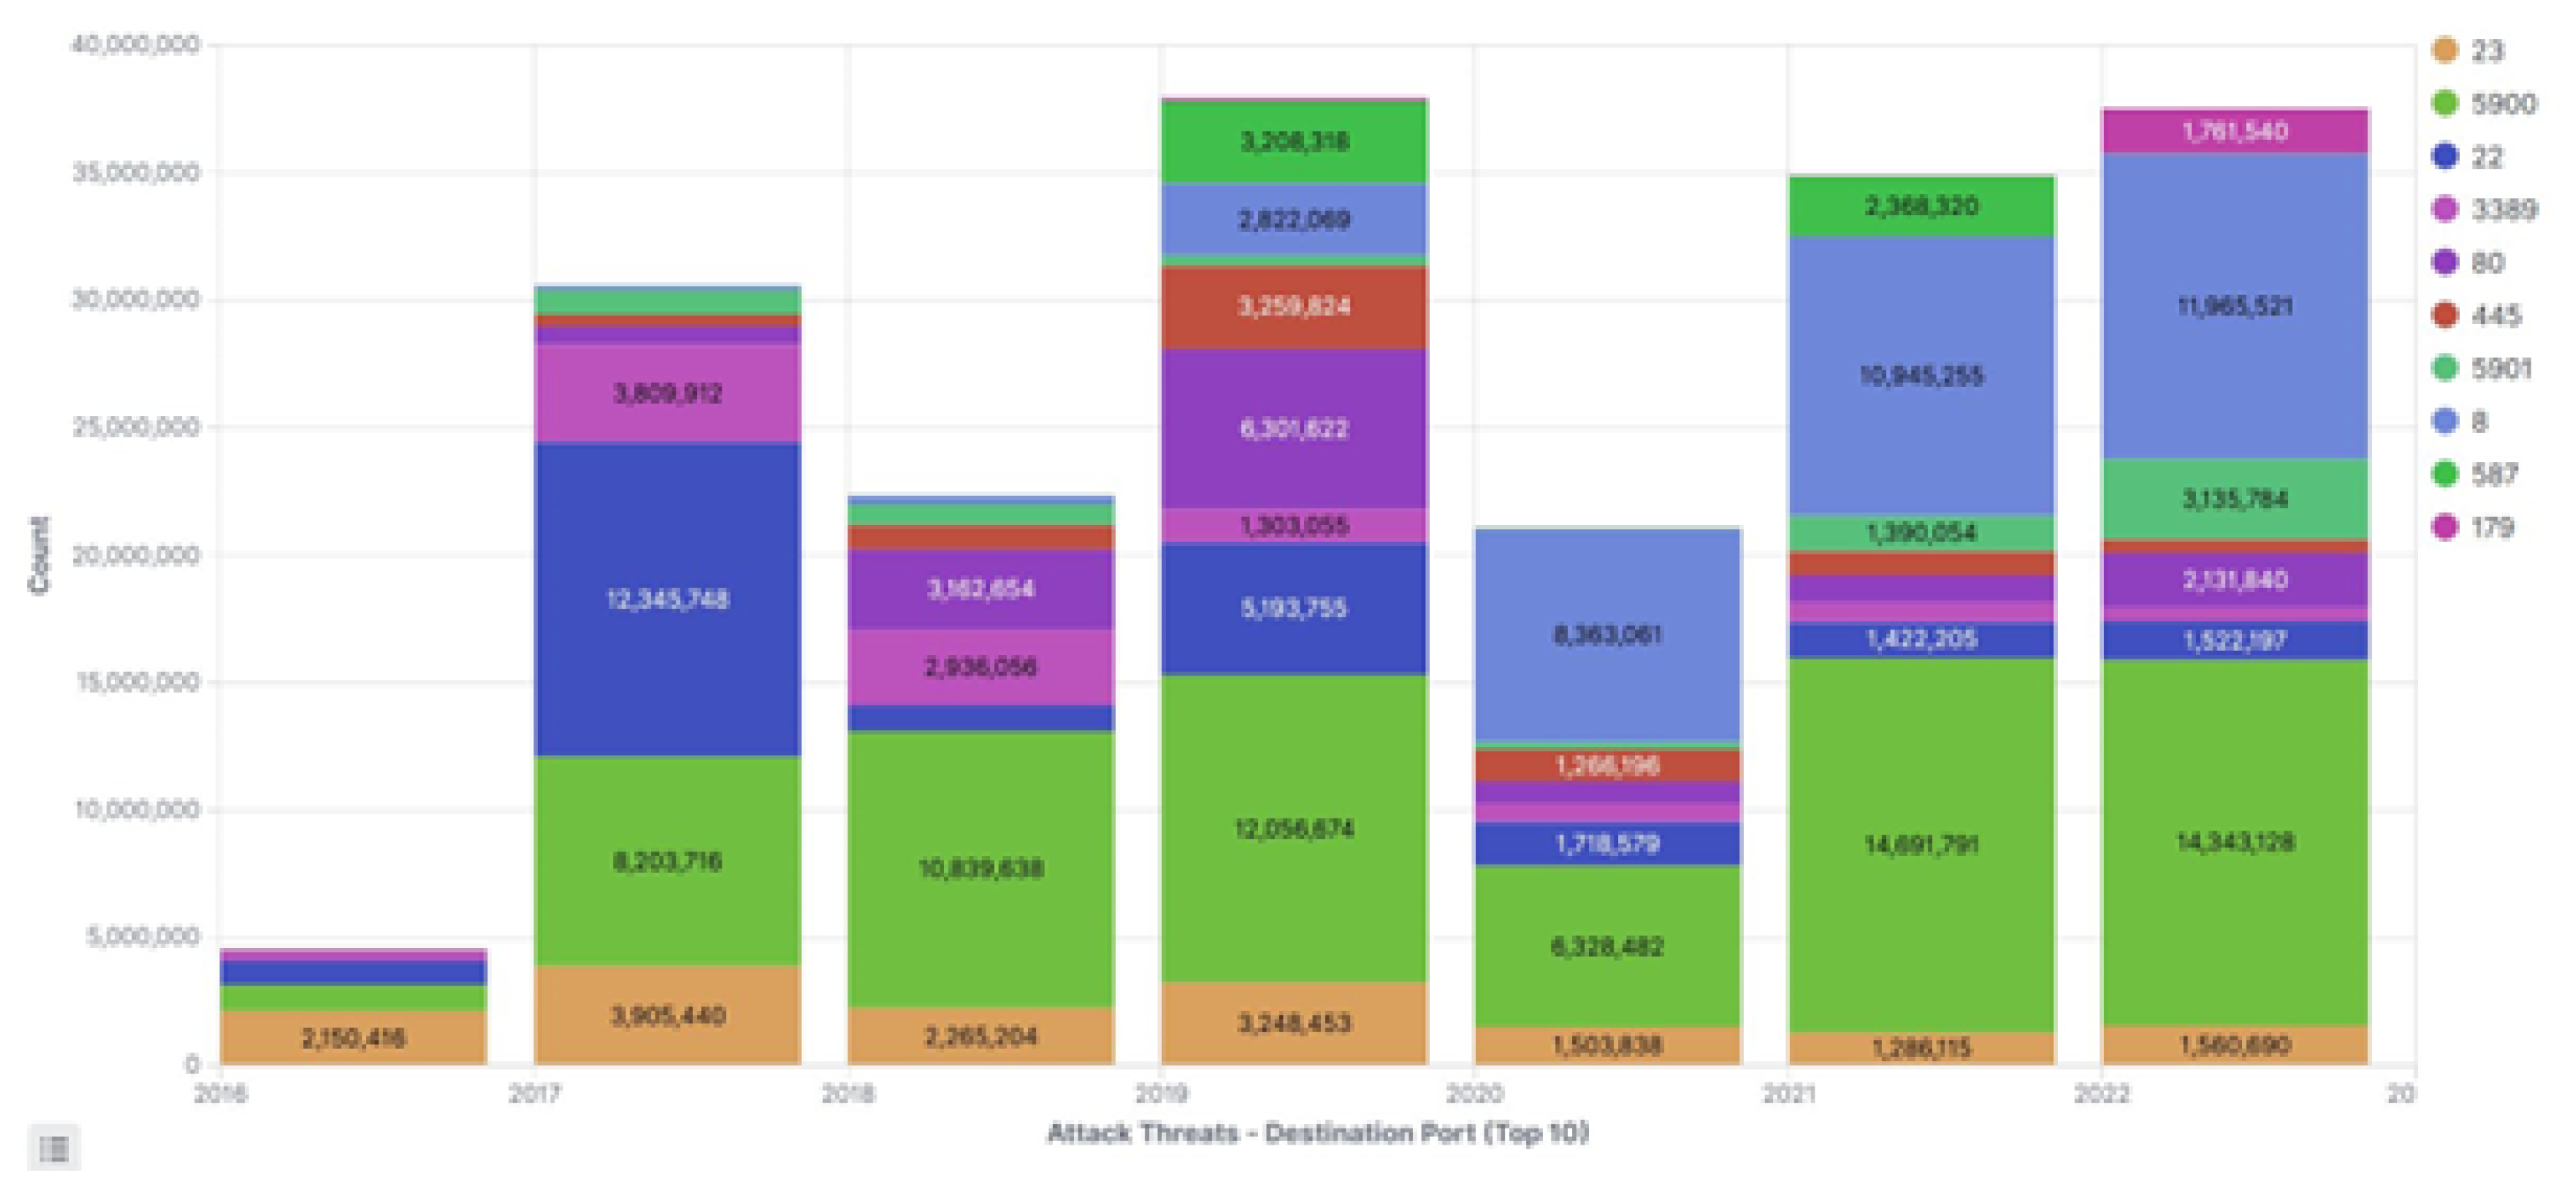
The total entries accounted for by the top 20 ports were 66,741,317, constituting approximately 66.52%. A temporal analysis of network traffic from 2016 to 2022 indicated an increase in traffic over the years for certain ports, a decline for others, and significant traffic for certain ports in specific years only (Figure 5).

3.2.8. Destination Services Analysis

The analysis of destination IP services disclosed chiefly the same results as the ports analysis. Two hundred eighty-three unique services were targeted, with most of the entries tagged as 'Unknown.' The leading services were 'Unknown,' 'VNC-Server,' 'ICMP–Echo-Request,' 'ssh,' and 'telnet,' contributing 47.576%, 16.207%, 10.442%, 4.544%, and 3.161% to the total entries, respectively.
These results not only highlight a preference for remote access and network information amongst attackers, but also underscore the considerable proportion of attacks associated with the 'Unknown' category. The 'Unknown' service, contributing to nearly half of the total entries, presents a growing concern in cybersecurity. This category could comprise multiple types of services, including unconventional, newly devised, or obscure methods used by attackers that are not easily classified or identifiable. The increased prevalence of 'Unknown' signifies that attackers are innovating and employing methods that circumvent typical detection strategies. This increasingly opaque nature of attacks further complicates the task of cybersecurity, necessitating the development of more advanced and adaptive threat detection and prevention systems.
A "count_diff" column was added to each year for each service. This column indicates the annual change in traffic volume and provides evidence of the increasing complexity and sophistication of cyber-attacks. A consistent yearly increase in the attack traffic was observed on the 'VNC-Server' port, with the most substantial surge documented in 2021. On the other hand, services such as 'ssh' and 'telnet' demonstrated more erratic patterns. The "ICMP–Echo-Request" service appeared in 2017 and has since been a consistent target, peaking in 2020. A new target, the "bgp" service, was observed in 2022.

3.2.9. Autonomous System Numbers and Names Analysis

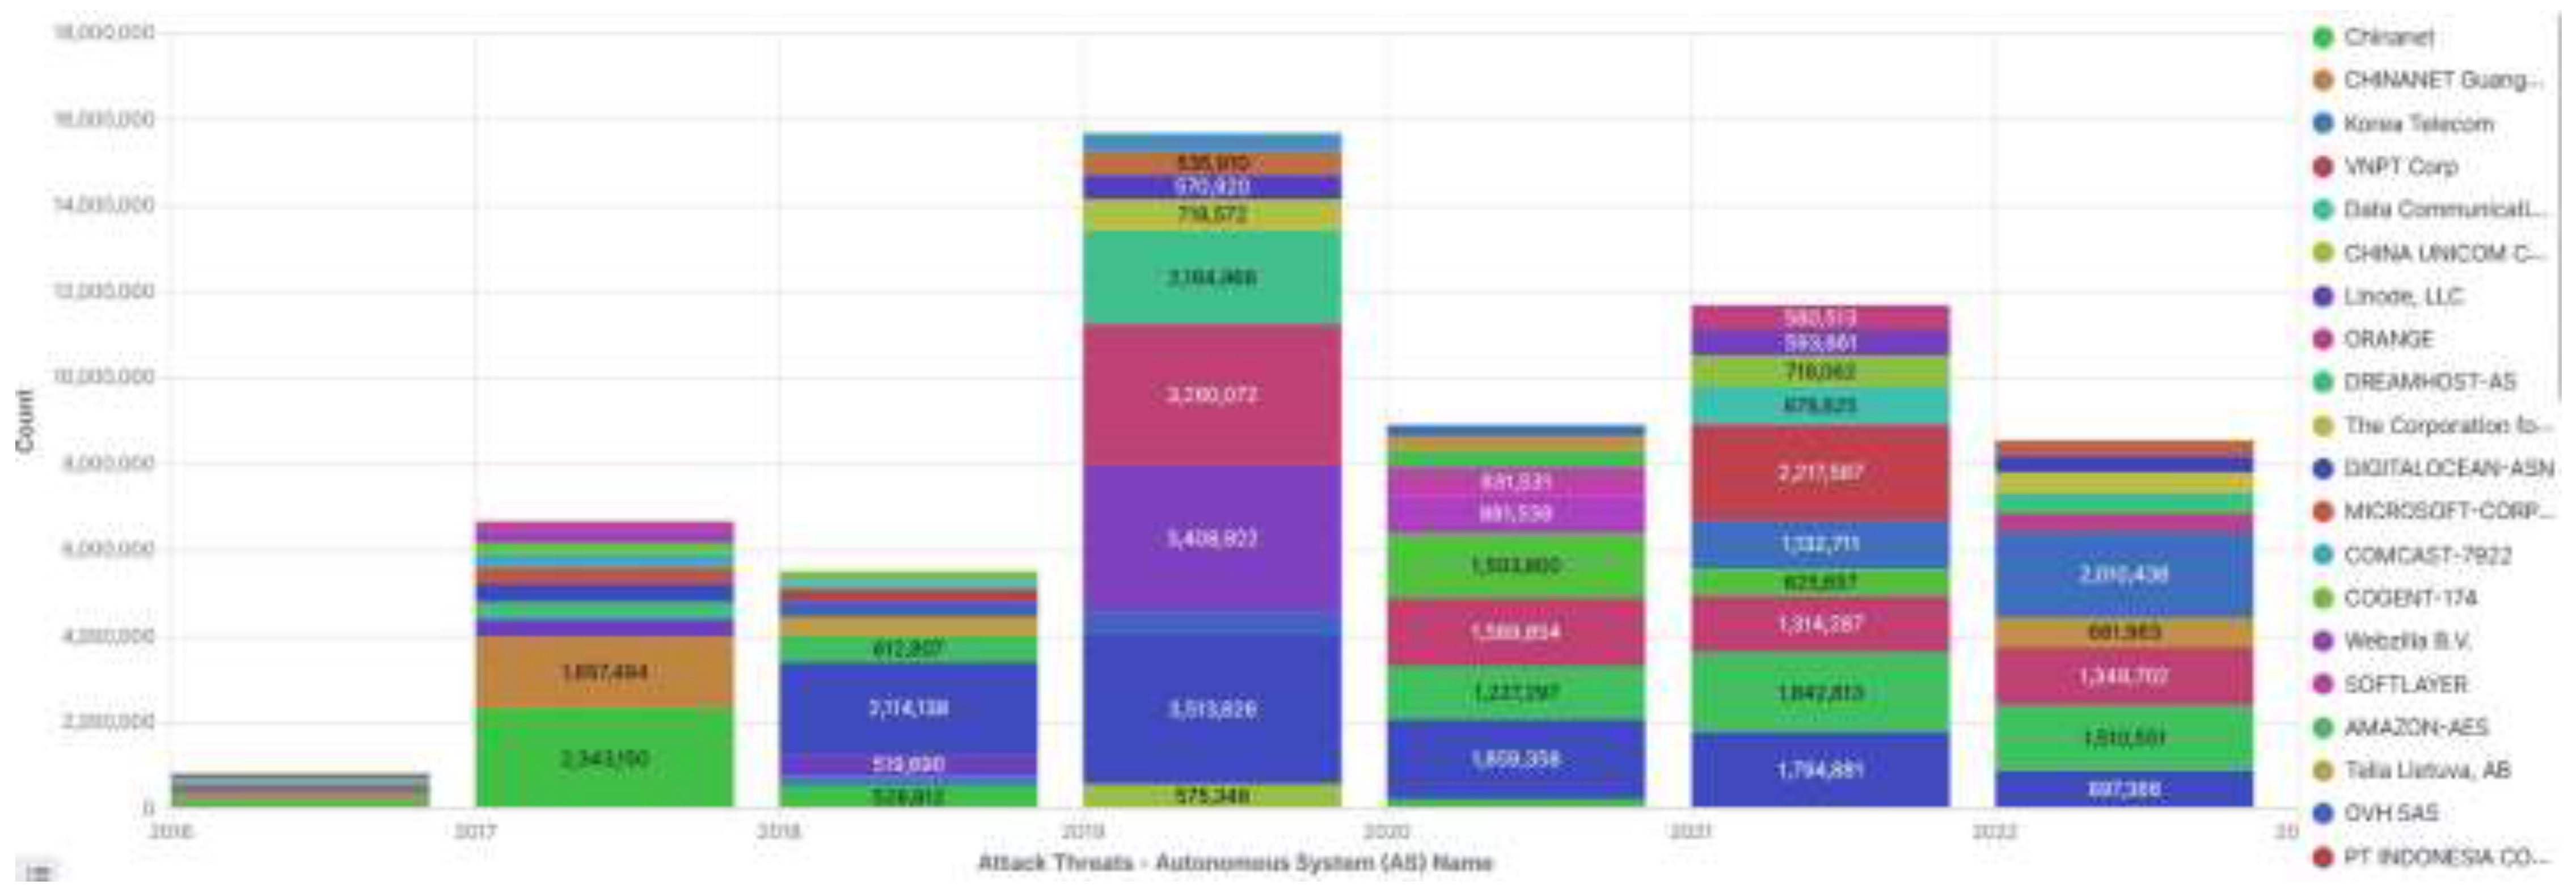
A comprehensive analysis of Autonomous System (AS) Numbers and Names (ASNs) was performed on data from 2016 to 2022, identifying 21,110 unique ASNs. The top 20 organizations or AS numbers constituted approximately two-thirds of total entries, demonstrating considerable network activity (Figure 7). The AS numbers with the highest entries were 14061 (DigitalOcean), 14618 (Amazon-AES), and 16509 (Amazon-02). Despite this, it was clarified that high entry numbers do not necessarily indicate the organizations' direct involvement in malicious activities but rather could reflect their large customer bases.
Among the source organizations identified in the study, 19,903 unique entities were found, including but not limited to DigitalOcean, Amazon-AES, Amazon-02, Censys, and Google Cloud. A significant proportion of entries originated from networks based in China ('Chinanet' and 'CHINA UNICOM China169 Backbone').
Temporal analysis revealed significant fluctuations in specific ASNs over time, including 4134, 14061, 14618, and 16509. Further, a detailed cluster analysis showcased distinct clusters of ASNs, like 134176 and 208091, that displayed significant growth in particular years.

3.2.10. Behavior Analysis

Behavior analysis was performed using an approach involving the calculation of a behavior score. The behavior score was defined based on the aggregated network traffic by source IP address, the respective AS number, and the organization to which the AS is registered. Table 5 showcases a subset of the dataset, demonstrating the relationship between source IP, country, AS organization name, and the corresponding behavior score. The behavior score seemed to be highest for DigitalOcean-ASN in the United States and F3 Netze e.V. in Germany, indicating potentially anomalous behavior.
The distribution of behavior scores was further analyzed. Many entities exhibited a behavior score of 0, accounting for 617,042 instances, which matched the source IP addresses that received a "0" for no matches within the threat intelligence repositories used in this study. However, behavior scores deviating from this baseline were scrutinized as potential anomalies. Notably, behavior scores of 1, 3, and 6 were registered for 368,742, 269,550, and 36,685 instances, respectively (Table 6). These observations suggest a gradient of potentially anomalous behavior with varying severity, as inferred from the behavior score.

3.2.11. Clustering Analysis

The clustering and anomaly detection analysis results were obtained from K-means for clustering and the Isolation Forest algorithm for anomaly detection. The K-means algorithm grouped similar data points based on the attack count and date into three clusters: 0, 1, and 2.
The attack count data shows several discernable patterns:
  • From October 2016 to June 2017, all instances were part of cluster 2 and were not identified as anomalies.
  • July 2017 exhibited a substantially higher attack count, forming cluster 0, yet was not designated as an anomaly.
  • Attack counts returned to lower levels similar to pre-July 2017, forming part of cluster 2 with no anomalies detected through to the end of 2018.
  • From 2019 to 2020, attack counts similar to those of July 2017 were noted, forming part of cluster 0. These instances were not marked as anomalies, indicating these levels of aggression were more common during this period.
  • An anomaly was detected in October 2019, with an attack count significantly higher than surrounding months.
  • From 2021 onwards, the attack counts remained high and were classified into cluster 1, with no anomalies detected during this period.

3.2.12. Anomaly Detection with Clustering

A clearer view of the cyber threat landscape was obtained by incorporating the time series data by month. The dataset has monthly attack counts organized into three clusters, 0, 1, and 2, and labeled with anomalies.
Key insights are drawn from the data:
  • The attack count was consistently high in Cluster 2 from October 2016 until September 2018, after which a significant anomaly occurred in July 2017 with a sudden surge to 3,001,792.
  • Cluster 0 dominated the attack landscape from October 2018 through to September 2019, except for a spike to 5,032,632 in October 2019, which was categorized as Cluster 1 and marked as an anomaly.
  • From October 2019 onwards, Cluster 0 and 1 have alternated, with exceptionally high attack counts associated with Cluster 1.
The destination port analysis combined with the monthly attack data provides a holistic view. Ports 8, 587, 22, and 5900 align with the high attack clusters identified in the monthly data, suggesting these ports may be critical areas of concern.

3.3. Validation of Results

In the context of the current study, validation of results was a pivotal aspect of the research methodology. It was instrumental in establishing the reliability and robustness of the cluster analysis and behavior scores deduced from the extensive network traffic data. In this section, the process and outcomes of the validation stage are detailed, with a specific focus on the evolution of cyber-attack tactics and techniques over time (RQ1) and the increasing sophistication and target specificity of these attacks (H1).
The validation started with a detailed scrutiny of the results from the cluster analysis. The research focused on various parameters, including source IP addresses, destination ports, and autonomous system numbers. These parameters were examined over different years, from 2016 to 2022, revealing clear trends and patterns that highlight an evolution in adversarial tactics and techniques, as suggested by RQ1.
The data were grouped into three distinct clusters, each representing a different category of network traffic behaviors. Significantly, these clusters demonstrated an increasing sophistication and target specificity of attacks, substantiating H1. The evolution of these clusters over time provided further evidence of the changing nature of cyber threats.
A vital component of the validation was evaluating the anomaly detection approach. This approach used a behavior score that ranged from 0 to 136. Instances with higher scores were flagged as potential anomalies, indicating potentially malicious network activities. Importantly, these scores showed an increasing trend over the years, hinting at the rising sophistication and specificity of cyber-attacks, again providing evidence for H1.
In terms of geographical and autonomous system analysis, certain countries and autonomous systems consistently recorded high behavior scores. For instance, network traffic from Germany and the United States, linked with autonomous systems such as DIGITALOCEAN-ASN, F3 Netze e.V., and Zwiebelfreunde e.V., scored highly on the behavior scale, indicating a shift towards targeted and sophisticated attacks.
To summarize, the validation process confirmed the reliability of the cluster analysis and behavior-scoring approach and provided supporting evidence for the study's research question and hypothesis. The analysis and scoring methodologies proved effective in identifying increasingly sophisticated and targeted anomalies in network traffic.
Yet, it's important to note that the behavior score doesn't provide specific details about the nature of the detected anomaly, necessitating further investigation. This leaves room for future research, particularly in identifying the exact nature and type of evolving cyber-attacks. The validation findings reinforce the claim that data analysis methods like clustering and behavior scoring can enhance anomaly detection in network traffic, contributing to bolstering network security.

3.4. Summary of Results

The study utilized a systematic approach to scrutinize the extensive volume of network traffic data. The data comprised diverse parameters such as source IP addresses, destination ports, and autonomous system numbers, among others, spanning six years from 2016 to 2022. The results were multifaceted, unveiling critical insights about network traffic behaviors, anomalies, and their sources, with a clear trend of increased sophistication and target specificity in line with H1.
The results from the cluster analysis revealed three distinct clusters within the network traffic data. Each group depicted a different type of network behavior, accentuating the complexity and variety inherent in network traffic patterns. Interestingly, these clusters showed a progressive trend towards more sophisticated and targeted anomalies, supporting H1. Anomalies were subsequently categorized based on these clusters, fostering a multifaceted and structured approach to anomaly detection.
Analysis of the time-series data unveiled temporal patterns in attack counts and highlighted periods of significant anomaly, as detected by the spikes in attack counts. Remarkably, there were several instances where the attack counts escalated dramatically, such as in July 2017, December 2018, and October 2019. These temporal patterns pointed to an evolution in adversarial tactics and techniques, further corroborating H1 and potentially providing guidance for proactive network security measures.
The behavior scoring methodology provided a quantitative means to identify potential anomalies. Each network traffic instance was assigned a score ranging from 0 to 136, with higher scores indicating possible anomalies. Validation of these scores confirmed their effectiveness as a reliable indicator of abnormal behavior. It highlighted the rising trend in scores over the years, indicating increasingly sophisticated attacks and providing further support for H1.
The geographical and autonomous system analysis offered additional insights into the sources of anomalies. Network traffic originating from specific countries, namely Germany and the United States, and associated with autonomous systems like DIGITALOCEAN-ASN, F3 Netze e.V., and Zwiebelfreunde e.V., displayed consistently higher behavior scores. This suggests a higher potential for anomalies, potentially hinting at the increased sophistication and specificity of the originating attacks, in line with H1.
In conclusion, the results of this study were both varied and enlightening, illustrating the merit of applying data analytical analysis methods to network traffic data. The methodologies employed — clustering, time-series analysis, and behavior scoring — effectively identified anomalies in network traffic, which is critically important for enhancing network security. Yet, it was also noted that further research is required to discern the exact nature of detected anomalies, a facet not entirely explained by the behavior score. This continued evolution and sophistication of cyber-attacks reinforces the study's findings and the need for ongoing investigation and proactive defense strategies.

4. Discussion Section

4.1. Introduction

The findings of this analysis substantially enhance the understanding of the evolving global cyber threat landscape, shedding light on RQ1 concerning key trends and patterns in cyber-attacks over the analyzed period. These findings also substantiate H1, demonstrating the growing sophistication and target specificity of cyber-attacks over time.
Although many entries from specific countries or IPs do not necessarily denote malicious intent, the data still provides insight into zones of high cyber activity. This information could assist in creating geographically tailored cybersecurity strategies, addressing the growing sophistication and target specificity identified in H1. However, the caveat that cybercriminals often disguise their actual location must be noted, which may result in the geographical data not accurately reflecting the attacker's original location.
Notably, the surge in daily attacks, especially those revealing increasingly sophisticated methods, suggests periods of intense, organized activity, possibly linked to specific events or campaigns. This underscores the patterns and evolving tactics outlined in RQ1 and H1. Moreover, the analysis exposes the exploitation of a broad range of increasingly complex tactics by perpetrators, targeting various services, including those used for remote access and network diagnostics. The progression in the diversity and complexity of these tactics aligns with the trends identified in the research question and hypothesis, providing clear evidence of the ever-evolving threat landscape.
The highlighted trends and patterns potentially inform cybersecurity strategies, policymaking, and resource distribution, suggesting the necessity of increasingly multifaceted and anticipatory measures to counteract the evolving sophistication and target specificity of cyber-attacks.

4.2. Interpretation of Results

The results derived from the data analysis reveal fascinating insights about the intricacies and diversity of network traffic behavior, affirming RQ1 by illustrating the key trends and patterns in cyber-attacks over the analyzed period. The results support H1, proving cyber-attacks have become increasingly sophisticated and targeted.
The grouping of network traffic data into distinct clusters demonstrates the variability in network behavior patterns, an indispensable component in understanding when crafting robust security measures to combat increasingly sophisticated threats. Each cluster signifies unique network characteristics, requiring specialized preventative and responsive measures to effectively safeguard network security in the face of growing attack specificity.
The time-series analysis, capturing the temporal patterns in attack counts, pinpoints periods of unusual activity or anomalies, which could be attributed to the increasing sophistication of cyber-attacks, as suggested in H1. Identifying periods with spiked attack counts, particularly in July 2017, December 2018, and October 2019, reinforces the need for a temporal approach to network security, especially as techniques evolve, as indicated by RQ1.
The behavior score, ranging from 0 to 136, is a quantifiable measure for potential anomalies and serves as a tool to gauge the increasing sophistication and target specificity of cyber-attacks. The validation of these scores underscored their effectiveness as reliable indicators of abnormal behavior.
Geographical and autonomous system data play a crucial role in understanding the sources of network anomalies. The higher frequency of abnormalities stemming from the United States and Germany and specific autonomous systems such as DIGITALOCEAN-ASN, F3 Netze e.V., and Zwiebelfreunde e.V. suggests these areas and systems warrant close attention given the evolving nature and increasing specificity of cyber-attacks outlined in RQ1 and H1.
While these findings cast light on the nature and sources of network anomalies, it's noteworthy that the behavior score indicates the potential for abnormalities but not the specific type or severity of the anomaly. This aligns with H1's assertion of increased sophistication, as newer attacks may deviate from known patterns. Future research should therefore explore ways to enhance the current methods with mechanisms to discern the specific nature and potential impact of detected anomalies, particularly as threats become more complex and targeted.
In conclusion, the interpretation of these results underscores the multifaceted nature of network traffic and the imperative for a comprehensive approach to ensuring network security. As RQ1 and H1 indicate, the dynamic nature of cyber threats calls for a multi-pronged approach to countering them, integrating temporal, geographical, and autonomous system data along with a quantitative measure of behavior. These aspects should all be considered to effectively identify and address network anomalies in an ever-evolving threat landscape.

4.3. Data Collection and Preprocessing

The comprehensive and rigorous data collection and preprocessing procedures undertaken in this study significantly enhanced the reliability and validity of the findings. Before the analysis, the data underwent meticulous cleaning, normalization, and transformation processes to ensure consistency and validity. Feature extraction and data transformation techniques were applied to the dataset, playing a pivotal role in extracting relevant information and ensuring the overall quality of the study's results. The careful data collection and preprocessing procedures enhanced the preparation of the dataset for subsequent analysis, contributing to the robustness of the study's outcomes.
The findings from this dataset reveal a complex and multifaceted cyber threat landscape. The striking disparities in the origin of attacks highlight the global nature of the cyber threat, pointing toward the need for enhanced international cooperation and coordination in addressing cyber threats. However, it is also important to note that these disparities may be influenced by a range of factors, including the digital infrastructure, policies, and practices in different regions, as well as the ability of attackers to disguise their actual location.
These insights underscore the need for continuous monitoring and analysis of cyber activities and for developing effective and adaptive strategies to mitigate cyber threats. This study demonstrates the advantage of such comprehensive data collection and preprocessing efforts in generating critical insights that can inform policy and practice in cybersecurity.

4.3.1. Descriptive Analysis

The observed daily frequency of approximately 45,741 entries and the peak of 888,203 attacks in a single day reveal the scale and intensity of cyber threats. The sporadic non-attack days, such as November 16, 2016, could suggest periods of relative calm or possibly a shift in attack strategies. These patterns underscore the dynamic nature of the cyber threat landscape, requiring constant vigilance and adaptive responses.
The analysis underscores the erratic and volatile nature of cyber-attacks, with daily counts varying wildly over the six years. The high degree of variation and the skewed distribution highlights the challenge of predicting and preparing for cyber threats. Days with no recorded attacks are rare (17 out of 2,191 days), reinforcing the constant nature of the cyber threat landscape.
The marked distribution disparity points towards the global nature of cyber threats, highlighting the necessity for international cooperation to mitigate these threats effectively. However, it is essential to remember that these distribution disparities might not fully represent the actual origin of the attacks, as cybercriminals often obscure their real locations.
The descriptive analysis of the honeypot log presents a quantitative understanding of the cyber threat landscape. The observed distribution disparities, peak activity, and periods of calm comprehensively depict cyber activities. This study lays the groundwork for further analysis and interpretation of cyber threats, emphasizing the importance of data-driven strategies to strengthen cybersecurity. The findings underscore the dynamic and complex nature of the cyber threat landscape, reiterating the need for robust and adaptive cybersecurity measures informed by meticulous data analysis.

4.3.2. Temporal Analysis

The temporal analysis yielded a critical understanding of the cyclical trends in cyber-attacks. The marked peaks in July 2017 and October 2019, followed by an overall increase in attack volumes from late 2019 onwards, point to an evolving and escalating cyber threat landscape. These patterns suggest that cyber threats are becoming more sophisticated and targeted, aligning with the initial hypothesis (H1) that cyber-attacks show a marked increase in sophistication and target specificity over time.
However, it is essential to consider the possibility of attack automation and an overall increase in Internet activity contributing to these high volumes. The variations in attack volumes could also indicate changing attacker tactics, advancements in detection methods, or the influence of global events. Consequently, these temporal trends necessitate ongoing evaluation to adapt and update cybersecurity measures in response to the evolving threat landscape.
The findings emphasize the importance of continual monitoring, evolution, and adaptation of cybersecurity strategies to detect and mitigate threats effectively. The study substantiates the growing significance of data-driven analytical approaches to understanding and addressing the complexities of cyber threats in the evolving digital era.

4.3.3. Correlation Analysis

The moderate to high correlations observed between the source AS numbers, corporate names, and numerous other indicators of malicious Internet activity suggest potential associations within the parameters studied. Such meaningful relationships may assist in predicting and identifying malicious activity based on known patterns. However, it must be emphasized that correlation does not imply causation, thereby necessitating further examination to ascertain causal relationships between these variables.
In interpreting these correlations, one could hypothesize that attackers may utilize specific AS numbers, as indicated by the high correlations. However, additional factors such as the nature of the organization and its Internet traffic, the network infrastructure, and other contextual factors could influence these correlations. Therefore, considering these variables in future investigations would be crucial to validate and comprehend the observed correlations better.
The study underscores the necessity for a cautious interpretation of these correlations and the importance of further research to establish causal links. These findings highlight the potential of data-driven, statistical approaches to augment understanding and predict cyber threats, contributing to more efficient and proactive cybersecurity strategies.

4.3.4. Geographic Analysis

The geographic distribution of cyber-attacks offers crucial insights into the patterns of malicious cyber activity. The significant fraction of cyber activities originating from the United States, Russia, and China could indicate several factors, including technological advancement, economic influence, and geopolitical relevance. However, it's worth considering that cybercriminals frequently mask their precise location, which could skew the geographic data. Furthermore, the high concentration of cyber activity within the top 20 countries might reflect their technological infrastructure and international standing. Such insights could be instrumental in shaping geographically precise cybersecurity policies and strategies. However, future studies should address the potential discrepancies resulting from attackers' masking of specific locations.
These findings emphasize the global nature of cyber threats and highlight the importance of international cooperation and strategy development in cybersecurity. However, it is crucial to note the potential for location obfuscation by attackers, indicating the need for additional corroborative strategies to accurately trace the origins of cyber threats. These threats' complex and international nature necessitate a multifaceted and global response.

4.3.5. Threat Analysis

The threat analysis presented in the study underscores the complexity and diversity of the cyber threat landscape. A substantial number of unidentified threats (zero-count entries) emphasize the continual evolution of cyber threats and the limitations of current threat intelligence repositories in capturing the complete range of malicious activity. The prominence of specific categories in the non-zero count entries signifies the prevalence of particular types of malicious activities or sources, providing valuable insights for devising targeted defense strategies. However, it's also critical to note the importance of minor categories, which, although constituting a smaller portion of the dataset, may represent emerging or less common threat vectors that warrant further exploration.
The significant number of unidentifiable threats reiterates the need to continuously enhance threat intelligence repositories and adopt adaptive, multifaceted cyber defense strategies. The study's findings highlight the importance of ongoing research to understand the rapidly changing nature of cyber threats and develop effective strategies to counter them.

4.3.6. Source IP Address Analysis

The study highlights the importance of scrutinizing the source IP address variable in understanding the origins and patterns of cyber-attacks. The findings suggest concentrated sources of attacks from specific IP addresses and ASNs, pointing towards the potential utilization of botnets or centralized attack mechanisms. Notably, a significant percentage of entries were linked to the top 20 IP addresses, suggesting a concentrated nature of cyber threats. The findings indicate a need for increased vigilance even in environments perceived to be trustworthy, particularly considering the predominant utilization of reputable cloud services as attack vectors. Understanding the dispersion and concentration of attacks from individual source IPs informs the development of targeted defense mechanisms and fosters international collaboration to counter cybercrime effectively.
When cross-referenced with threat intelligence data repositories, the comprehensive analysis of source IP addresses revealed critical insights into the distribution of cyber threats. The study reaffirms the necessity of an exhaustive analysis of source IP addresses to comprehend cyber-attack patterns and develop effective threat detection and prevention strategies. By fostering international collaboration and sharing these insights, this approach contributes to the broader cybersecurity field's capacity to navigate the myriad of cybersecurity challenges.

4.3.7. Destination Ports Analysis

The study's findings suggest an increasing sophistication and targeted approach to cyber-attacks over time. The high prevalence of attacks on services like the VNC-Server (port 5900) that require more sophisticated attack vectors compared to standard ports such as HTTP (443) or SSH (22) reinforces this observation. The data points to a high concentration of attacks from specific IP addresses and ASNs, implying the potential use of botnets or centralized attack mechanisms. Using reputable cloud services to initiate attacks emphasizes the need for advanced security measures.
The "count_diff" data provides a dynamic perspective on the changes in network traffic over the years. Cyber-attacks have become more targeted and sophisticated, with changing preferences for specific ports across different years. The fact that ports such as 5900 and 8 show a marked increase in traffic points to shifting attacker strategies. Conversely, a decrease in traffic for port 22 may suggest changes in the targeted systems' security measures or network configurations. This could benefit future cybersecurity studies and equip network administrators with vital information to enhance network security measures. The study thus provides a critical understanding of the cyber threat landscape, emphasizing the importance of constant vigilance and adaptability in the face of evolving cyber threats.

4.3.8. Destination Services Analysis

The study's results suggested an increased focus on less known or difficult-to-categorize services, indicative of a rise in the complexity and sophistication of cyber-attacks. This finding aligns with the initial hypothesis. A consistent pattern of annual increases in attacks was noted for certain services such as 'ICMP-Echo-Request,' 'Unknown,' and 'VNC-Server.' In contrast, other services, such as 'bgp' and 'Domain-s,' were only recorded in specific years.
The "Cluster" column, introduced through a KMeans clustering algorithm, provided additional depth to the analysis. It grouped destination services into clusters based on similarity, revealing distinct patterns for services like 'Unknown,' 'VNC-Server,' 'ICMP-Echo-Request,' and 'ssh.'
The analysis of "Destination Services" and the incorporation of the "count_diff" data and KMeans clustering painted a comprehensive picture of the evolving nature and complexity of cyber-attacks. The analysis of destination IP services revealed a diverse range of targeted services. It demonstrated a marked increase in attacks on less known or harder-to-categorize services, indicative of an increase in the complexity and sophistication of cyber-attacks. These results are of immense value to network administrators and security professionals, providing vital insights for developing and reinforcing robust cybersecurity measures in response to the evolving threat landscape.

4.3.9. Autonomous System Numbers and Names Analysis

Despite the significant network activity linked to entities such as DigitalOcean, Amazon-AES, and Amazon-02, it is crucial to understand that these organizations' high entry numbers do not necessarily signify direct involvement in malicious activities. These numbers might reflect the large customer bases of these organizations, which could potentially include users exploiting these services for nefarious activities.
Temporal trends demonstrate the ever-changing nature of the cyber threat landscape. The fluctuations observed in specific ASNs over the years highlight the need for continuous monitoring and updating of cybersecurity measures to match the evolving nature of threats. Furthermore, the cluster analysis of ASNs offered more profound insights into the patterns of malicious network activity, indicating the changing landscape of cyber threats.
The analysis of ASNs revealed distinct patterns of network activity linked to malicious intent, with significant variations across different ASNs and years. The findings emphasized the critical role of robust cybersecurity measures and continuous cyber threat analysis in understanding and combating these evolving threats. By shedding light on the temporal behavior and clustering characteristics of ASNs, this analysis provides insights for future research in this area, thereby contributing to a broader understanding of cyber threats and strengthening the defenses against them.

4.3.10. Behavior Analysis

As a metric, the behavior score demonstrated its potential in discerning anomalous from expected network behavior. This approach leverages the inherent structure of the Internet, employing AS numbers and organizations as critical factors in behavior analysis.
In the context of cyber threat intelligence, these results highlight behavioral patterns' significant role in network traffic analysis. Countries like the United States and Germany, through their AS numbers and organizations, exhibited higher behavior scores, signaling potential security threats. Notably, these countries are significant Internet nodes, reinforcing the necessity of vigilant cyber security measures in these regions.
However, it is essential to consider that a higher behavior score may not directly correspond to malicious intent. Network traffic can exhibit strange behavior for several reasons, such as configuration changes, software updates, or non-standard user behavior. Therefore, these results should be interpreted with caution and need to be corroborated with additional data or context.
This study shed light on the potential of using behavior scores as an effective tool for anomaly detection in network traffic. The high behavior scores associated with specific AS numbers and organizations emphasize the need for rigorous and continuous monitoring of these entities. These findings, coupled with the distribution of behavior scores, offer valuable insights for cyber security practitioners in their ongoing efforts to detect, mitigate and prevent cyber threats.
While the study offers promising results, future work should focus on refining the behavior score by incorporating more diverse factors. This will help in reducing false positives and enhancing the precision of the anomaly detection process. Also, further research is required to understand the reasons behind the elevated behavior scores observed for certain entities to facilitate more effective threat intelligence.

4.3.11. Clustering Analysis

The clustering analysis indicates shifts in the patterns of attacks over time, with periods of higher and lower attack counts. The clusters formed to understand how the attack counts evolved, with cluster 2 indicating lower attack counts, cluster 0 showing higher attack counts than cluster 2, and cluster 1 having the highest attack counts.
The anomaly detected in October 2019, despite the general high attack counts during the period, signifies an unusual increase that deviated from the established pattern. This anomaly, marked by an exceptionally high attack count, underscores the need to understand and prepare for such extreme instances.
The clustering and anomaly detection analysis offers a robust method for understanding the patterns and shifts in cyber-attack counts over some time. This understanding is vital in enhancing the preparedness and responsiveness of cybersecurity defenses to such threats. The distinction in attack counts represented by different clusters and the detection of anomalies offer valuable insights into the dynamic nature of the cyber threat landscape. The presence of outliers, such as the anomaly detected in October 2019, emphasizes the need for continuous monitoring and evaluation of the threat landscape to anticipate better and manage cybersecurity risks.

4.3.12. Anomaly Detection with Clustering

The integration of time series analysis and destination port clustering offers an in-depth perspective on the continually shifting cyber threat landscape. Persistent high-attack clusters, such as Cluster 2 in the early data and Cluster 1 in the latest data, denote sustained areas of vulnerability, indicating the need for bolstered cybersecurity measures.
Identifying anomalies, such as the spike in attack count in July 2017 and October 2019, underscores the need for dynamic and adaptable cybersecurity strategies capable of responding to abrupt shifts in attack patterns.
The correlation between the high attack clusters and specific destination ports (8, 587, 22, and 5900) implies that these ports may be targets or particularly vulnerable points in the network.
Identifying anomalies in the data is crucial for understanding sudden shifts or surges in cyber-attacks. These anomalies could be indicators of coordinated large-scale attacks, the discovery of a new vulnerability by attackers, or a change in attack techniques.
Moreover, these anomalies' correspondence with specific destination ports suggests a targeted approach by the attackers. For instance, ports 8, 587, 22, and 5900 are associated with high attack clusters during abnormal periods, implying that these ports might have been specifically targeted or were particularly vulnerable.
Incorporating clustering and anomaly detection with time series data is essential for understanding patterns, shifts, and abnormalities in cyber threats over time. Ports and times with high attack counts require priority in cybersecurity strategies. Identifying anomalies and evolving attack patterns underscores the need for continuous threat monitoring and adaptable response strategies in the face of a rapidly changing cyber threat landscape.
Anomaly detection plays a pivotal role in cyber threat analysis. Identifying and understanding anomalies allow early detection of significant threats to facilitate prompt and effective responses. The abnormalities identified in this analysis highlight the importance of continuous monitoring and adaptive security measures to handle sudden shifts in attack patterns. The association of certain anomalies with specific destination ports provides valuable insights into potential vulnerabilities or targeted attack points. Therefore, anomaly detection and port clustering serve as effective instruments for a thorough understanding of the cyber threat landscape.

4.4. Comparison to Previous Research

The results of the present study align with the existing literature on network anomaly detection while also providing unique insights. Consistent with previous research, the study confirms the significance of machine learning in detecting anomalies in network traffic [8,9,11,12,14,19,21]. However, it extends this premise by focusing on network behavior anomalies characterized by unusual network patterns potentially indicative of cyber threats.
The behavioral scoring system used in this study aligns with the approach of Alsarhan [8], Boateng [21], and Mengidis et al. [12], who utilized machine learning methodologies for anomaly detection. It diverges, however, by tying the scoring to a combination of Autonomous System Numbers and Names (ASNs), the country of origin, and the number of connections made. This multifaceted approach to scoring contributes to a more holistic view of network behavior.
The assertion made in the current study about the significance of IP address and ASN in identifying anomalous network activities finds support in the work of Alowaisheq [17] and Li [6]. Yet, the current research extends this understanding by providing quantifiable evidence through a behavior-scoring mechanism that connects these factors with the frequency and nature of abnormal behavior, a contribution not previously articulated in such detail.
In previous studies, Aboah Boateng [21] and Mengidis et al. [12] incorporated unsupervised machine learning methods to identify anomalies in process control systems and host-based intrusion, respectively. This study utilizes a similar unsupervised machine learning approach but applied to an entirely network-centric dataset.
Similar to the work of Fu et al. [20] that applied a reduction method to intrusion detection data, this study also emphasizes the need for data reduction and dimensionality reduction techniques. However, the research leverages both source IP addresses and ASNs to perform the reduction process, enhancing the efficiency of anomaly detection.
Research by Moriano Salazar [23] has pointed out the significance of analyzing real-world temporal networks. This study echoes this sentiment, emphasizing the necessity of continuous and real-time monitoring of network behavior due to the dynamic nature of cyber threats.
This study aligns with the work of Alowaisheq [17], who examined security traffic from different perspectives: defenders, attackers, and bystanders. Similarly, this research analyzed network behavior from multiple angles, considering the origin of traffic and the behavior associated with that origin.
Moreover, the current study's emphasis on continuous monitoring and updating of models as cyber threats evolve [11,23] adds to the narrative espoused by Moriano Salazar [23] and Ongun [11] concerning the temporally dynamic nature of network behavior. However, the research goes a step further by integrating this concept into a framework for practical implementation, thereby offering actionable insights for the cybersecurity community.
The present study, however, diverges from previous research in its emphasis on a behavior-based scoring system tied to ASNs and the country of origin. While Chatterjee [18] employed deep learning mechanisms for network intrusion detection, using a behavior-based scoring system provides a unique and potentially more accessible approach to identifying and assessing the severity of anomalies.
In summary, the current study expands the knowledge in network anomaly detection, building upon the foundation established by prior research while providing new insights through a unique behavior-based scoring system. As with all research, these findings should be viewed as a point of departure for future studies, continually refining and enhancing the understanding of network behavior anomalies.

4.5. Practical Implications and Recommendations

The findings of this study have substantial practical implications for cybersecurity practitioners, particularly those working in network security. Understanding the impact of these results can guide the formulation of effective anomaly detection and mitigation strategies and eventually help enhance overall network security.
  • Utilizing Cluster Analysis for Network Traffic: As revealed by cluster analysis, the diversity in network behavior patterns underscores the need for flexible and adaptive security measures. By identifying which cluster a particular network behavior falls into, practitioners can apply security measures tailored to that cluster's characteristics.
  • Temporal Monitoring of Network Traffic: The time-series analysis of attack counts emphasized the criticality of time-based network traffic monitoring. Recognizing periods of heightened anomaly occurrence can guide timely interventions, possibly preventing potential attacks.
  • Behavior Score as an Indicator: A behavior score is a powerful tool for quantifying potential anomalies. Organizations can incorporate this scoring system into their network monitoring routines to help identify abnormal behavior that may pose a security threat. Regular re-evaluation and adjustment of the scoring system, based on evolving network patterns, are recommended to maintain its effectiveness.
  • Geographical and Autonomous System Analysis: The high frequency of anomalies originating from specific geographical locations and autonomous systems suggests that these aspects cannot be ignored while assessing network security. Enhanced monitoring and possibly stricter security measures could be considered for traffic from identified high-risk areas and systems.
  • Proactive and Holistic Approach: The findings suggest a proactive and holistic approach to network security is necessary. This involves responding to threats as they occur and continuously monitoring, learning from the data, and anticipating potential vulnerabilities.
Considering the implications, it is recommended that organizations adapt their network security strategies to integrate the insights gained from this study. This would involve updating monitoring practices to include clustering and time-series analysis, employing the behavior scoring system, and paying particular attention to high-risk geographical locations and autonomous systems.
While this study has provided valuable insights, network security is constantly evolving. As new patterns of network behavior emerge and new types of threats are devised, continuous research and development in network security are essential to stay ahead of potential security risks. The methodologies employed in this study can serve as a foundation for future research in this critical area of cybersecurity.

4.6. Limitations and Future Research

While this study has generated substantial insights into network anomaly detection and associated implications, it is essential to recognize its limitations, which can also serve as potential directions for future research.
  • Limited Scope of Network Data: The data used in this study came from a specific network, which might have unique characteristics not universally applicable to all networks. Future research could broaden the scope by including data from multiple networks varying in size, nature, and location to increase the generalizability of the results.
  • Temporal Constraints: The analysis was performed on historical data. The dynamic nature of network behavior and evolving cyber threats may render some identified patterns less relevant over time. Continuous monitoring and time-series analysis are thus needed to keep the findings updated.
  • Binary Classification of Anomalies: The current study classifies network behavior as normal or abnormal without further categorizing the nature of the anomalies. Future research could focus on classifying different types of irregularities, which could provide more nuanced insights into the behavior patterns associated with different kinds of threats.
  • Solely Quantitative Approach: This study employed a predominantly quantitative approach. Future research could benefit from integrating qualitative methods, such as expert opinions or case studies, to provide a more comprehensive understanding of network anomalies and associated threats.
  • Overlooked Factors: This study did not incorporate factors such as the type of network protocol, the application associated with the network traffic, and specific details about the source and target systems. Including these factors could provide additional dimensions to the analysis, leading to richer and more detailed insights.
The limitations of the current study offer avenues for future research. The dynamic nature of network behavior and cyber threats necessitates ongoing research in this area. Future studies should continue to evolve and expand on the methodologies used in this study, incorporating more comprehensive data and refining the analysis techniques. By doing so, it will be possible to enhance our understanding of network anomalies and their threats, thereby improving our capacity to safeguard our networks against cyber threats.

5. Conclusions

5.1. Summary of Main Findings

The research presented in this study has primarily revolved around network anomaly detection, focusing on integrating geographic, organizational, and behavioral analysis. The main findings of the study can be summarized as follows:
  • Geographic Analysis: The study established that the source country of IP addresses significantly affects the behavior score, indicating potential network anomalies. A clear association between specific countries, notably the United States, Germany, and China, and higher behavior scores were identified.
  • Organizational Analysis: In the context of the Autonomous System Numbers (ASNs) and associated organization names, the research discovered specific organizations, such as 'DigitalOcean-ASN,' 'F3 Netze e.V.', and 'Zwiebelfreunde e.V.,' were frequently linked to IP addresses with high behavior scores. This finding points towards the relevance of considering ASNs and organizational information in network anomaly detection.
  • Behavioral Analysis: The data-driven behavior scoring mechanism developed in this study revealed that a higher frequency of connection requests was often associated with higher behavior scores. In addition, the analysis demonstrated that the proportion of abnormal behavior was higher in certain source countries and organizations.
  • Validation of Results: The results were validated using cross-validation techniques, confirming the findings' robustness. It also emphasized the importance of constant updates and recalibrations of the models as cyber threats evolve.
These findings collectively advance the understanding of network anomaly detection. They emphasize the importance of an integrative approach that accounts for geographic, organizational, and behavioral aspects in identifying and predicting network anomalies. As such, the research has practical implications for academia and industry, informing the development of more sophisticated and context-aware anomaly detection systems.

5.2. Contributions to the Field

The work undertaken in this study contributes to the field of network anomaly detection in multiple ways, enhancing both understanding and methodological approaches to this vital area of cybersecurity:
  • Integrative Anomaly Detection Approach: The study provides a novel integrative approach to network anomaly detection, combining geographic, organizational, and behavioral elements into a unified framework. This holistic model acknowledges network anomalies' complex, multifaceted nature, setting a new standard for future studies in this area.
  • Expanded Geographical and Organizational Context: By highlighting the role of the source country and the associated organization in network anomalies, the study underscores the importance of context in cybersecurity analysis. It demonstrates the value of considering these often-overlooked factors and adds a new dimension to our understanding of network behaviors.
  • Behavior Scoring Mechanism: The introduction and validation of a data-driven behavior scoring mechanism represents a significant methodological contribution. This mechanism quantifies anomalous behavior and provides a benchmark for comparing and predicting anomalies.
  • Robust Validation Process: The study's validation process provides a rigorous framework for evaluating the performance of anomaly detection systems, contributing to the methodological rigor of the field. Utilizing cross-validation techniques, this process is an essential model for future research.
  • Empirical Evidence: The study offers robust empirical evidence, demonstrating transparent relationships between geographic, organizational, and behavioral characteristics and network anomalies. This practical grounding enriches the theoretical basis of the field and provides real-world applicability to the findings.
These contributions position the study at the cutting edge of research on network anomaly detection and demonstrate its potential to influence academic and practical cybersecurity applications.

5.3. Practical Implications

This research has significant practical implications that can directly benefit organizations, cybersecurity professionals, and network administrators:
  • Enhanced Network Monitoring: Integrating geographic, organizational, and behavioral elements into a single anomaly detection framework provides a more multifaceted understanding of network behavior. This enhanced perspective can inform real-time network monitoring and improve the identification and response to potential threats.
  • Risk Assessment and Management: The behavior scoring mechanism developed in this study allows for quantitative assessment of network anomalies, providing an invaluable tool for risk management. With this approach, organizations can prioritize resources based on the severity and frequency of identified anomalies.
  • Tailored Cybersecurity Strategies: By acknowledging the role of geographic and organizational context in network anomalies, this study empowers organizations to develop tailored cybersecurity strategies. For instance, organizations could apply stricter controls or more rigorous monitoring for network traffic from countries or organizations associated with higher behavior scores.
  • Benchmarking and Predictive Analysis: This research validated the scoring mechanism and offers a standard measure for network anomalies. This benchmark can compare network behaviors across time and context, aiding predictive analysis and allowing organizations to proactively anticipate and respond to potential threats.
  • Cybersecurity Training and Education: The insights derived from this study can be integrated into cybersecurity training programs, enhancing awareness about the complex nature of network anomalies. The scoring mechanism can serve as a teaching tool, helping practitioners understand how multiple elements can contribute to abnormal behaviors.
By operationalizing these insights, stakeholders can enhance their cybersecurity posture, strengthening their defense against an evolving threat landscape.

5.4. Potential Areas for Future Research Include

The findings of this study open several avenues for future research:
  • Further Refinement of the Scoring Mechanism: While the behavior scoring mechanism employed in this study has proven useful, further refinement may lead to even more accurate anomaly detection. Machine learning algorithms could be incorporated to refine the scoring algorithm dynamically based on evolving network behaviors.
  • Longitudinal Study: This research is essentially a snapshot of network anomalies at a particular time. Future research should continue to examine network behavior over an extended period to identify any emerging temporal patterns or trends.
  • Individual vs. Organizational Behavior: This study has focused on anomalies at an aggregate level. Future research might delve into whether different types of organizations (e.g., based on industry, size, or geography) exhibit different patterns of network anomalies. Similarly, individual user behaviors within organizations could be studied to identify potential insider threats.
  • Comparison Across Different Network Types: This research has used a dataset from a specific type of network. A valuable direction for future research could be to replicate this study using data from different networks (e.g., corporate networks, IoT networks) to examine whether similar patterns emerge.
  • Integration of Additional Data Sources: Integrating other open-source intelligence data, such as cyber threat intelligence feeds, with the analyzed network data might provide richer context and enable more accurate anomaly detection.
  • Implications for Cybersecurity Policy and Regulation: Building on the findings of this study, future research could explore the impact on cybersecurity policy and regulation. For instance, how might insights on geographic and organizational factors inform policy decisions related to cross-border data flows or industry-specific cybersecurity regulations?
These research directions could extend the knowledge gained from this study and contribute to more effective anomaly detection and mitigation strategies.

5.5. Regarding Future Research Directions

Considering the critical need for enhanced cybersecurity measures and the increasing prevalence of advanced cyber threats, the following research directions are proposed based on the findings of this study:
  • Adaptation to Evolving Cyber Threat Landscape: The cyber threat landscape is evolving rapidly, and future research needs to adapt to these changes. Emerging threats, such as those targeting cloud environments, artificial intelligence, and Internet of Things (IoT) devices, require unique approaches to anomaly detection.
  • Leveraging AI and Machine Learning: The use of advanced artificial intelligence (AI) and machine learning techniques for anomaly detection offers a promising area for future exploration. This could include the application of deep learning, reinforcement learning, or other AI techniques to improve the effectiveness of anomaly detection.
  • Integration of Threat Intelligence: Integrating threat intelligence with anomaly detection could significantly improve identifying and responding to threats. Future research could explore how threat intelligence can be effectively incorporated into anomaly detection systems.
  • Focus on Privacy-Preserving Anomaly Detection: With the increasing importance of privacy, future research should focus on developing anomaly detection techniques that respect user privacy. Techniques such as differential privacy or federated learning could be investigated.
  • Investigating the Human Factor: The role of the human factor in cybersecurity is often overlooked. Future research could explore how human behavior impacts the effectiveness of anomaly detection and what steps can be taken to improve user awareness and behavior.
  • Advancing Regulatory Frameworks: As this study indicates, cybersecurity is a global concern. Therefore, increasing the understanding of regulatory and policy frameworks for anomaly detection on a global scale could be another promising future research direction.
The advancements in these areas could significantly enhance our ability to detect and mitigate cyber threats in an increasingly interconnected world.

5.6. Final Thoughts

In an era where cyber-attacks are ubiquitous, this research provides an in-depth statistical view of the daily fluctuations in attack counts, highlighting the severity and unpredictability of the threat landscape. The insights can inform more effective and adaptive cybersecurity strategies, contributing to a more secure digital world.
The potential of autonomous system (AS) based anomaly detection in mitigating the ever-evolving cyber threats cannot be underestimated. The findings of this study underscore the importance of the continuous evolution and improvement of anomaly detection systems to combat the sophisticated threats of the current digital age. The task is undoubtedly challenging, yet it is an endeavor that society must persistently pursue, given our increasing reliance on digital systems.
This research has highlighted the effectiveness of integrating various data points, such as source IP addresses, AS numbers, and AS organization names, in enhancing the accuracy and efficiency of anomaly detection. This approach leverages the power of data, a critical asset in today's digital world, to better equip us against potential cyber threats.
However, the fight against cyber threats is a complex process, demanding a multifaceted strategy. Cybersecurity measures must be constantly improved and updated, reflecting the rapidly evolving threat landscape. Collaboration across stakeholders at the technical and policy levels is vital to this effort. We must foster a culture of information sharing and cooperative action against common threats.
Lastly, while this study offers valuable insights, it also highlights the need for more research in this field. The future direction of this work lies in harnessing newer technologies, like artificial intelligence, machine learning, and quantum computing, to augment our cybersecurity capabilities. It is also essential to explore the implications of these technologies on privacy and regulatory norms.
As the Internet continues to weave itself into the very fabric of our society, the significance of robust cybersecurity measures, including efficient anomaly detection, will only rise. The journey towards a secure digital world is ongoing, and this research hopes to contribute positively to that collective effort.

Author Contributions

The sole author, Dr. Marshall S. Rich, was responsible for all aspects of the research, including conceptualization, methodology, data analysis, writing, and editing.

Funding

This research received no external funding. The author incurred all costs.

Institutional Review Board Statement

Not applicable.

Informed Consent Statement

Not applicable.

Conflicts of Interest

The author declares no conflict of interest related to the research.

References

  1. Farokhnia Hamedani, M. Essays on Cybersecurity and Information Privacy. ProQuest Dissertations Publishing, University of South Florida, 2023. 30421027. [Google Scholar]
  2. Rosa, F.R. Global Internet Interconnection Infrastructure: Materiality, Concealment, and Surveillance in Contemporary Communication. ProQuest Dissertations Publishing, American University, 2019. 13902857. [Google Scholar]
  3. Adewopo, V. Exploring Open Source Intelligence for Cyber Threat Prediction. ProQuest Dissertations Publishing, University of Cincinnati, 2021. 28890231. [Google Scholar]
  4. Cho, S. Tackling Network-Level Adversaries Using Models and Empirical Observations. ProQuest Dissertations Publishing, State University of New York at Stony Brook, 2021. 28718487. [Google Scholar]
  5. Muoi, T.D. Handling Network Attacks Exploiting Routing Information Asymmetries. ProQuest Dissertations Publishing, National University of Singapore (Singapore), 2022. 29352339. [Google Scholar]
  6. Li, G. An Empirical Analysis on Threat Intelligence: Data Characteristics and Real-World Uses, ProQuest Dissertations Publishing, University of California, San Diego, 2020. 27955013.
  7. Hillis, J.S. Enterprise Advanced Persistent Threat Group Identification and Technique Discovery, ProQuest Dissertations Publishing, Marymount University, 2023. 30484790.
  8. Alsarhan, H.F. Real-Time Machine Learning-based Intrusion Detection System (IDS) for Internet of Things (IoT) Networks. ProQuest Dissertations Publishing, The George Washington University, 2023. 30000678. [Google Scholar]
  9. Al-Haija, Q.A.; Krichen, M.; Elhaija, W.A. Machine-Learning-Based Darknet Traffic Detection System for IoT Applications. Electronics 11, 556. [CrossRef]
  10. Luitel, A. A Framework for Modeling Data Breach Risk Using Machine Learning Models for High-Dimensional Panel Data, ProQuest Dissertations Publishing, The George Washington University, 2022. 28865998.
  11. Ongun, T. Resilient Machine Learning Methods for Cyber-Attack Detection. ProQuest Dissertations Publishing, Northeastern University, 2023. 30418436. [Google Scholar]
  12. Mengidis, N.; Panagiotou, P.; Tsikrika, T.; Vrochidis, S.; Kompatsiaris, I. Host-based Intrusion Detection Using Signature-based and AI-driven Anomaly Detection Methods. Information & Security 50, 37–48. [CrossRef]
  13. Panagiotou, P.; Mengidis, N.; Tsikrika, T.; Vrochidis, S.; Kompatsiaris, I. An in Depth Analysis of Open Source Tools: Host Intrusion Detection System, Intrusion Detection System, and Honeypots, and How They Can Protect a SME’s Network. ProQuest Dissertations Publishing, Utica College, 2019. 22622076. [Google Scholar]
  14. Butt, S.M.; Reaiche, C. Cognitive Analysis of Intrusion Detection System. Journal of Siberian Federal University. Engineering & Technologies 15, 102–120. [CrossRef]
  15. Barron, T. Addressing the Imbalance between Attackers and Defenders Using Cyber Deception. ProQuest Dissertations Publishing, State University of New York at Stony Brook, 2020. 28091212. [Google Scholar]
  16. Bobish, M. Sharing Cyber Threat Information Between the United States’ Public and Private Sectors. ProQuest Dissertations Publishing, Utica University, 2023. 30488959. [Google Scholar]
  17. Alowaisheq, E. Security Traffic Analysis Through the Lenses Of: Defenders, Attackers, and Bystanders. ProQuest Dissertations Publishing, Indiana University, 2020. 28259642. [Google Scholar]
  18. Chatterjee, S. Network Intrusion Detection and Deep Learning Mechanisms. ProQuest Dissertations Publishing, Florida Atlantic University, 2023. 30417958. [Google Scholar]
  19. Shin, Y.; Kim, K. Comparison of Anomaly Detection Accuracy of Host-based Intrusion Detection Systems based on Different Machine Learning Algorithms. International Journal of Advanced Computer Science and Applications 11, 2020. [CrossRef]
  20. Fu, X.; Zhang, Y.; Li, H.; Hu, Y. Research on Attributes Reduction Method of Intrusion Detection Data Based on Rough Set Theory. Journal of Physics: Conference Series 1624. [Google Scholar] [CrossRef]
  21. Aboah Boateng, E. Unsupervised Machine Learning Methods for Detecting Process Control Anomalies in Industrial Control Systems, ProQuest Dissertations Publishing, Tennessee Technological University, 2023. 30313772.
  22. Moore, K.E. Analyzing Small Business Strategies to Prevent External Cybersecurity Threats. ProQuest Dissertations Publishing, Walden University, 2023. 30424695. [Google Scholar]
  23. Moriano Salazar, P. Anomaly Detection in Real-World Temporal Networks. ProQuest Dissertations Publishing, Indiana University, 2019. 13865635. [Google Scholar]
  24. Phillips, I.J., Jr. Maintaining Small Retail Business Profitability by Reducing Cyberattacks. ProQuest Dissertations Publishing, Walden University, 2020. 28024279. [Google Scholar]
  25. Singh, T. The Role of Stress among Cybersecurity Professionals. ProQuest Dissertations Publishing, The University of Alabama, 2021. [Google Scholar]
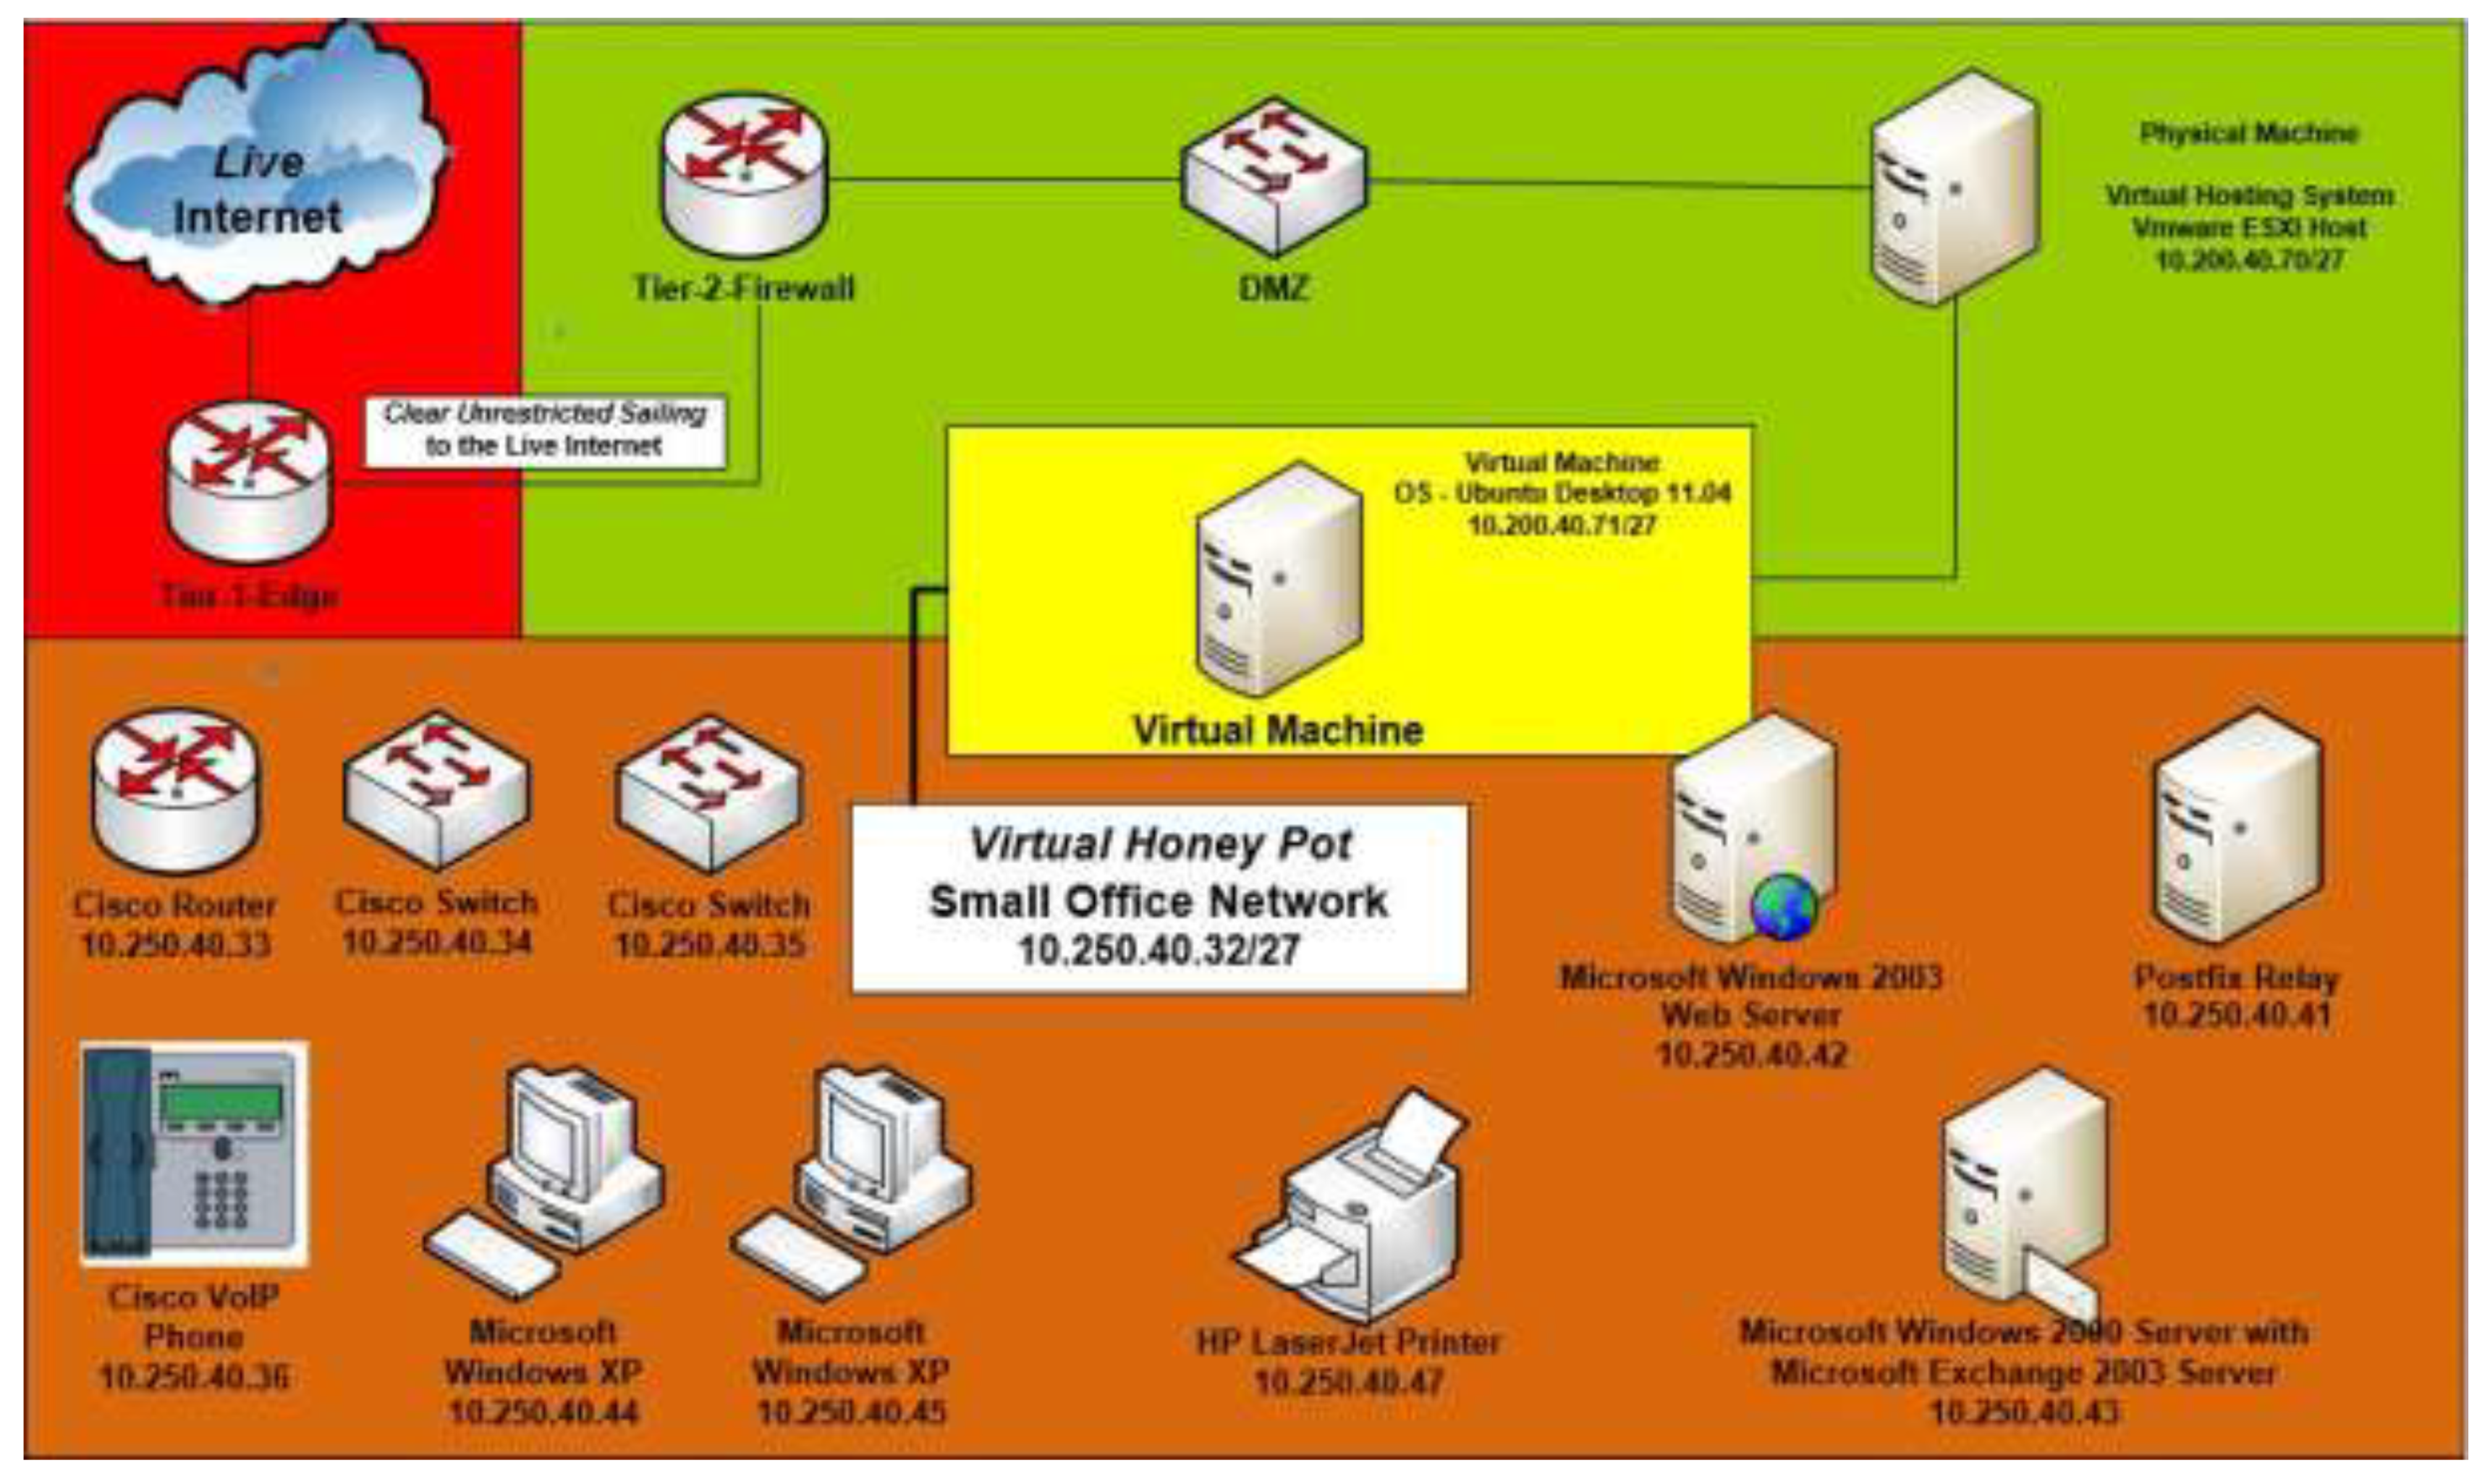
Figure 1. Internal Virtual Honeypot Network.
Preprints 78226 g001
Figure 2. Temporal Analysis.
Preprints 78226 g002
Figure 3. Country Distribution by Percentage.
Preprints 78226 g003
Figure 4. Country Distribution Over Time.
Preprints 78226 g004
Figure 5. Destination Ports Over Time.
Preprints 78226 g005
Figure 6. Destination Services Over Time.
Preprints 78226 g006
Figure 7. Autonomous System Names Over Time.
Preprints 78226 g007
Table 1. Descriptive Statistics of Unique Daily Count.
Descriptive Statistics
count 2191.000000
mean 45741.001826
std 58788.500082
min 0.000000
25% 16037.000000
50% 28447.000000
75% 58430.500000
max 888203.000000
Table 2. Correlation Calculations.
Column 1 Column 2 Correlation P-Value
malicious-subnet-misp-bro.txt malicious-subnet-misp-ip-dst.txt 1 0
malicious-ip-uceprotect-dnsbl-3.txt malicious-ip-uceprotect-dnsbl-2.txt 1 0
malicious-ip-firehol-anonymous.txt malicious-ip-firehol-proxies.txt 0.987332677 0
malicious-ip-dan-torlist-exit-ip.txt malicious-ip-dan-torlist.txt 0.933264363 0
malicious-ip-blocklist-ssh.txt malicious-ip-blocklist.txt 0.880540508 0
malicious-subnet-spamhaus-drop.txt malicious-subnet-snort-pulled-pork.txt 0.845672856 0
malicious-subnet-snort-pulled-pork.txt malicious-subnet-firehol-spamhaus_drop.txt 0.845672856 0
malicious-ip-firehol-webclient.txt malicious-ip-firehol-webserver.txt 0.822205602 0
malicious-ip-misp-bro-ipv4.txt malicious-ip-misp-ip-dst-ipv4.txt 0.784329101 0
malicious-subnet-firehol-anonymous.txt malicious-subnet-firehol-proxies.txt 0.783025671 0
Table 3. Threat Analysis.
Threat Intelligence Feed or Repository Matches Total Source IP
malicious-subnet-uceprotect-dnsbl-3.txt 581,115 44.138%
malicious-subnet-uceprotect-dnsbl-2.txt 300,891 22.854%
malicious-subnet-firehol-webserver.txt 91,983 6.986%
malicious-ip-misp-ip-dst-ipv4.txt 41,701 3.167%
malicious-ip-misp-bro-ipv4.txt 28,080 2.133%
Table 4. Top 10 Source IP Addresses.
Source IP Count Percentage
23.139.224.114 2,217,585 2.215%
162.142.125.128 1,045,622 1.044%
100.27.42.150 758,851 0.758%
100.27.42.187 754,386 0.754%
100.27.42.157 693,224 0.693%
64.227.110.98 687,625 0.688%
92.63.197.18 677,060 0.677%
143.110.156.7 580,346 0.580%
161.35.232.85 569,259 0.569%
93.115.29.34 531,990 0.532%
Table 5. Top 10 Source IP Addresses.
Source-IP Source-Country Source-AS-Org-Name Behavior Score
185.220.103.9 United States CALYX-AS 136
95.85.7.220 United States DIGITALOCEAN-ASN 136
60.191.87.89 China CT-HangZhou-IDC 136
23.129.64.216 United States EMERALD-ONION 120
171.25.193.80 Sweden Foreningen for digitala fri- och rattigheter 120
199.249.230.87 United States QUINTEX 120
92.255.85.9 Russia Chang Way Technologies Co. Limited 120
83.229.82.236 Netherlands Kamatera Inc 120
66.102.248.138 United States Chinanet 105
60.9.97.113 Mongolia CHINA UNICOM China169 Backbone 105
89.190.159.189 South Africa Alsycon B.V. 105
Table 6. Behavior Analysis All Score Counts.
Behavior Score Count
0 617042
1 368742
3 269550
6 36685
10 13606
15 4606
21 2571
36 1280
28 1222
45 628
55 306
66 151
78 77
91 49
105 34
120 25
136 11
Disclaimer/Publisher’s Note: The statements, opinions and data contained in all publications are solely those of the individual author(s) and contributor(s) and not of MDPI and/or the editor(s). MDPI and/or the editor(s) disclaim responsibility for any injury to people or property resulting from any ideas, methods, instructions or products referred to in the content.
Copyright: This open access article is published under a Creative Commons CC BY 4.0 license, which permit the free download, distribution, and reuse, provided that the author and preprint are cited in any reuse.
Prerpints.org logo

Preprints.org is a free preprint server supported by MDPI in Basel, Switzerland.

Subscribe

© 2024 MDPI (Basel, Switzerland) unless otherwise stated